
Variations in the Growth of Cotyledons and Initial True Leaves as Affected by Photosynthetic Photon Flux Density at Individual Seedlings and Nutrients

 , ,
, ,
Abstract
:1. Introduction
2. Materials and Methods
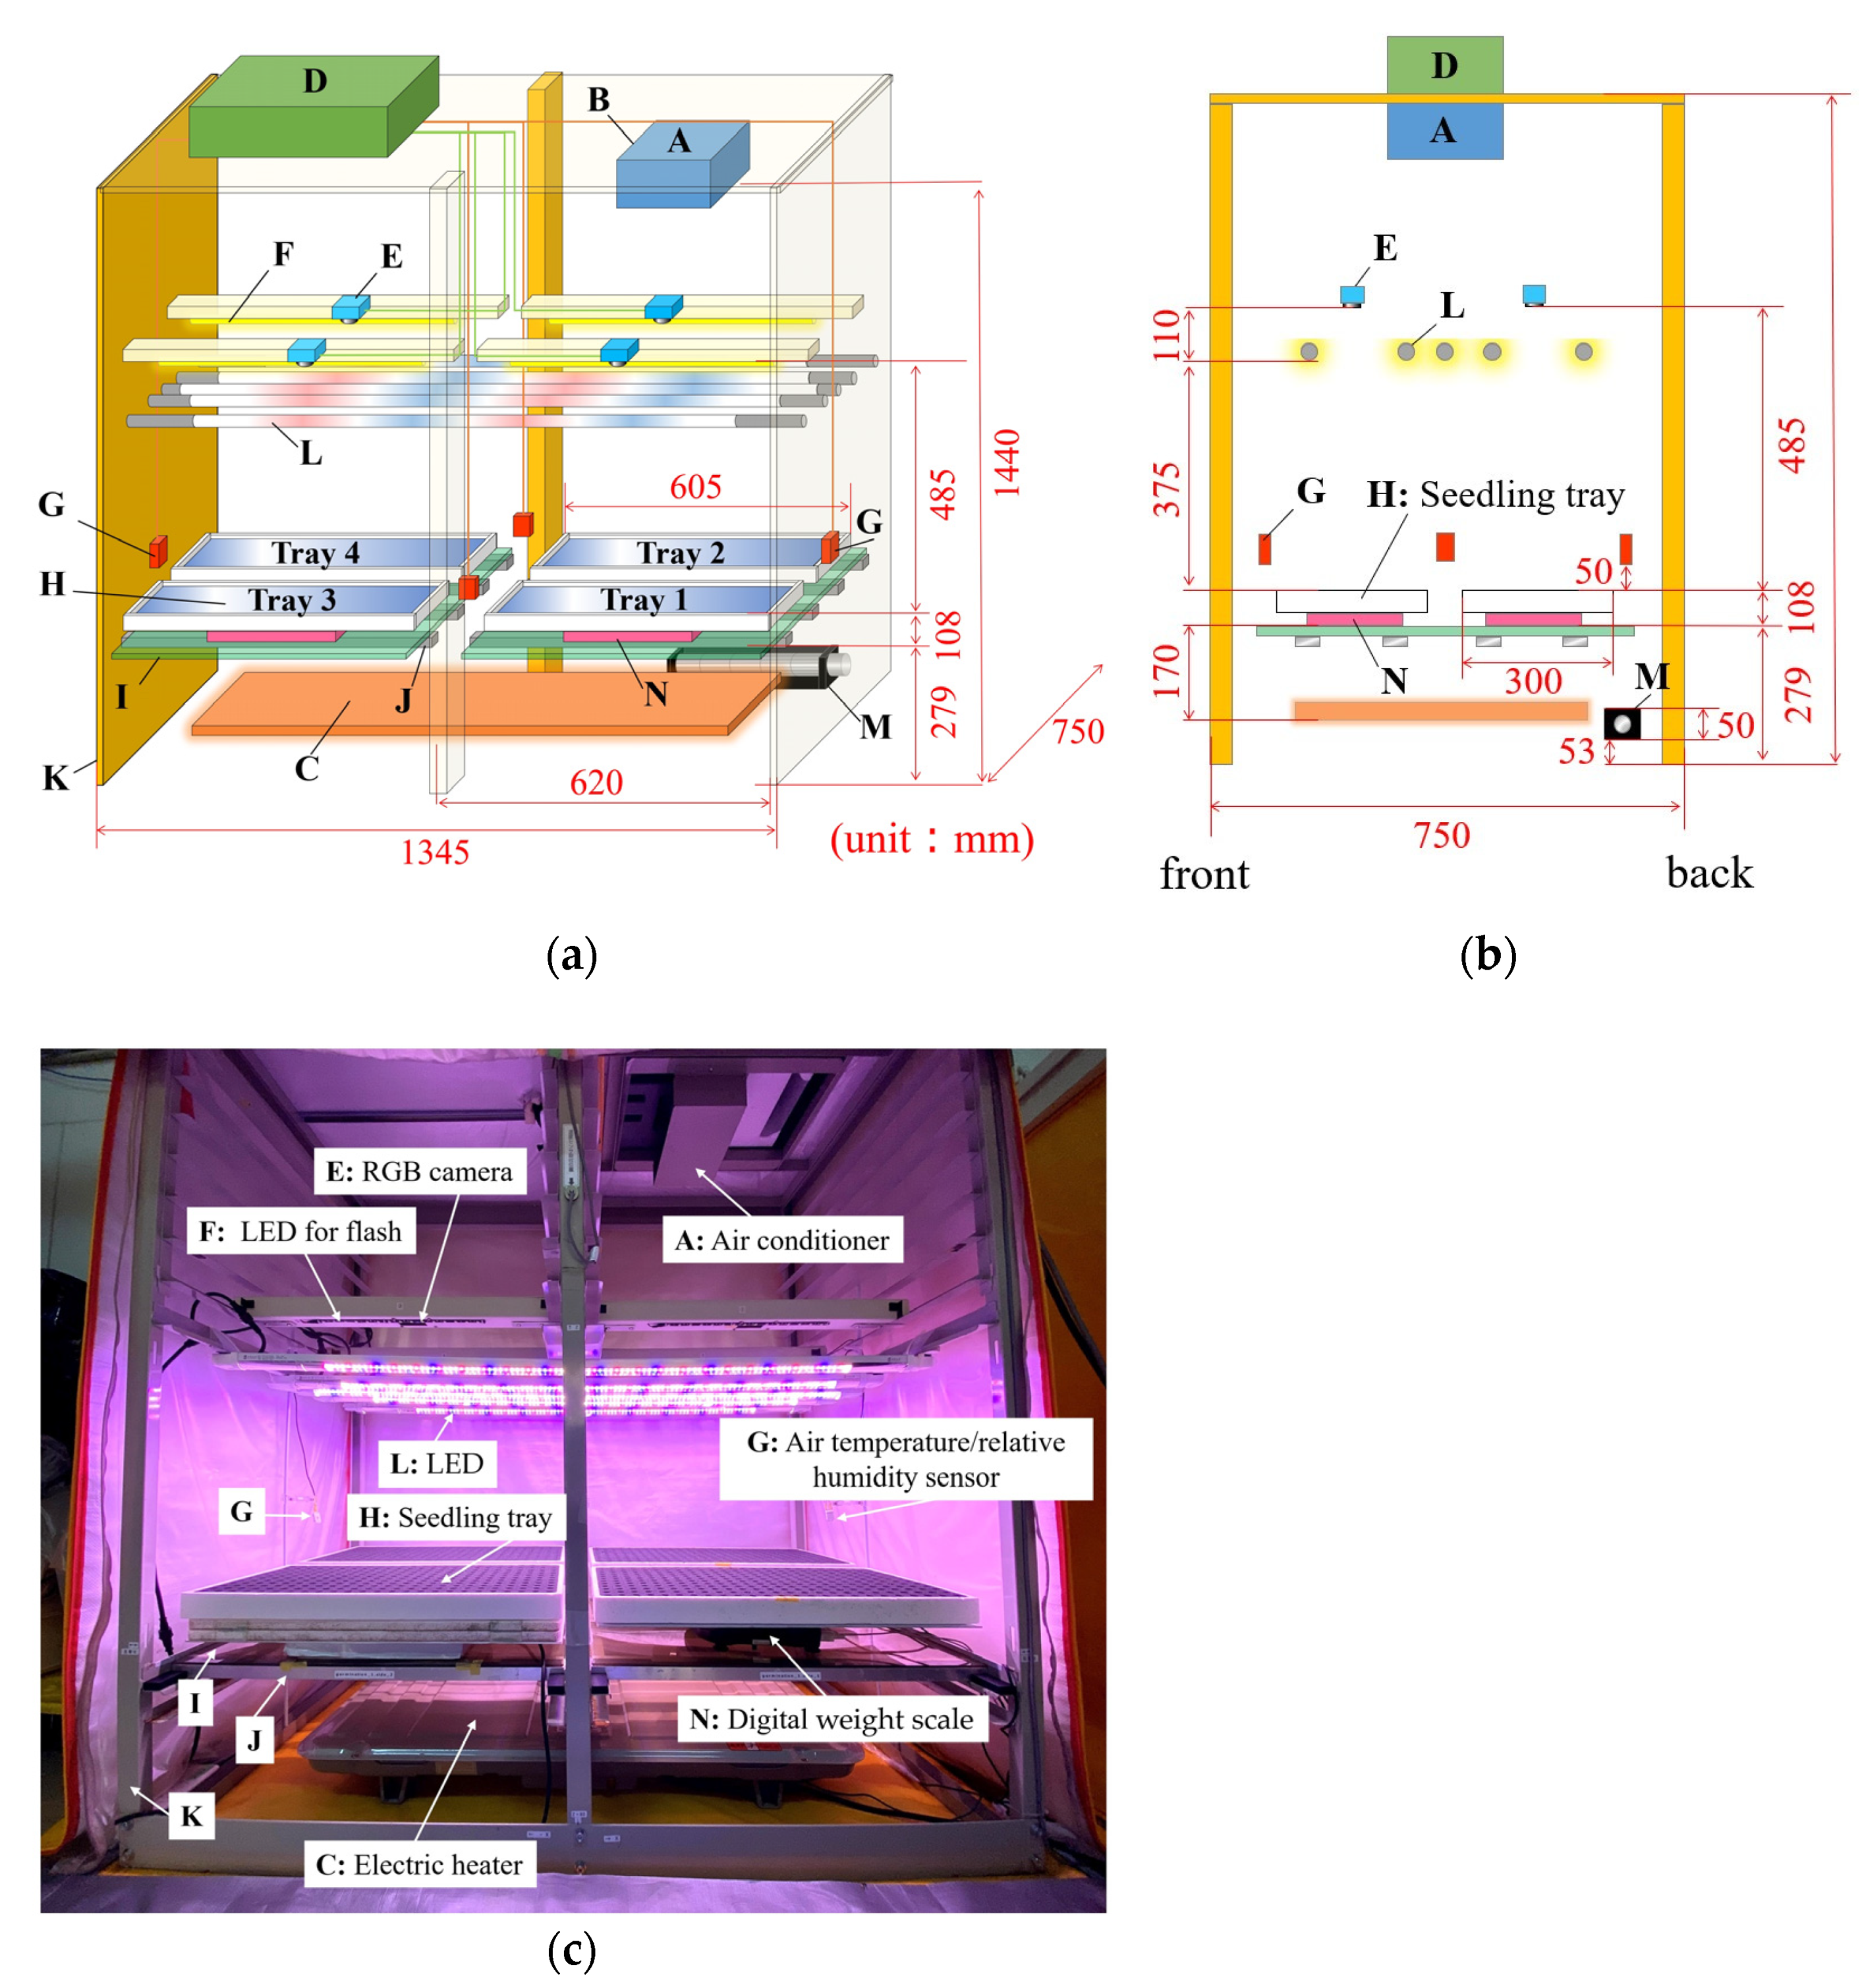
2.1. Description of the System
2.2. Light Environment for Individual Seedlings
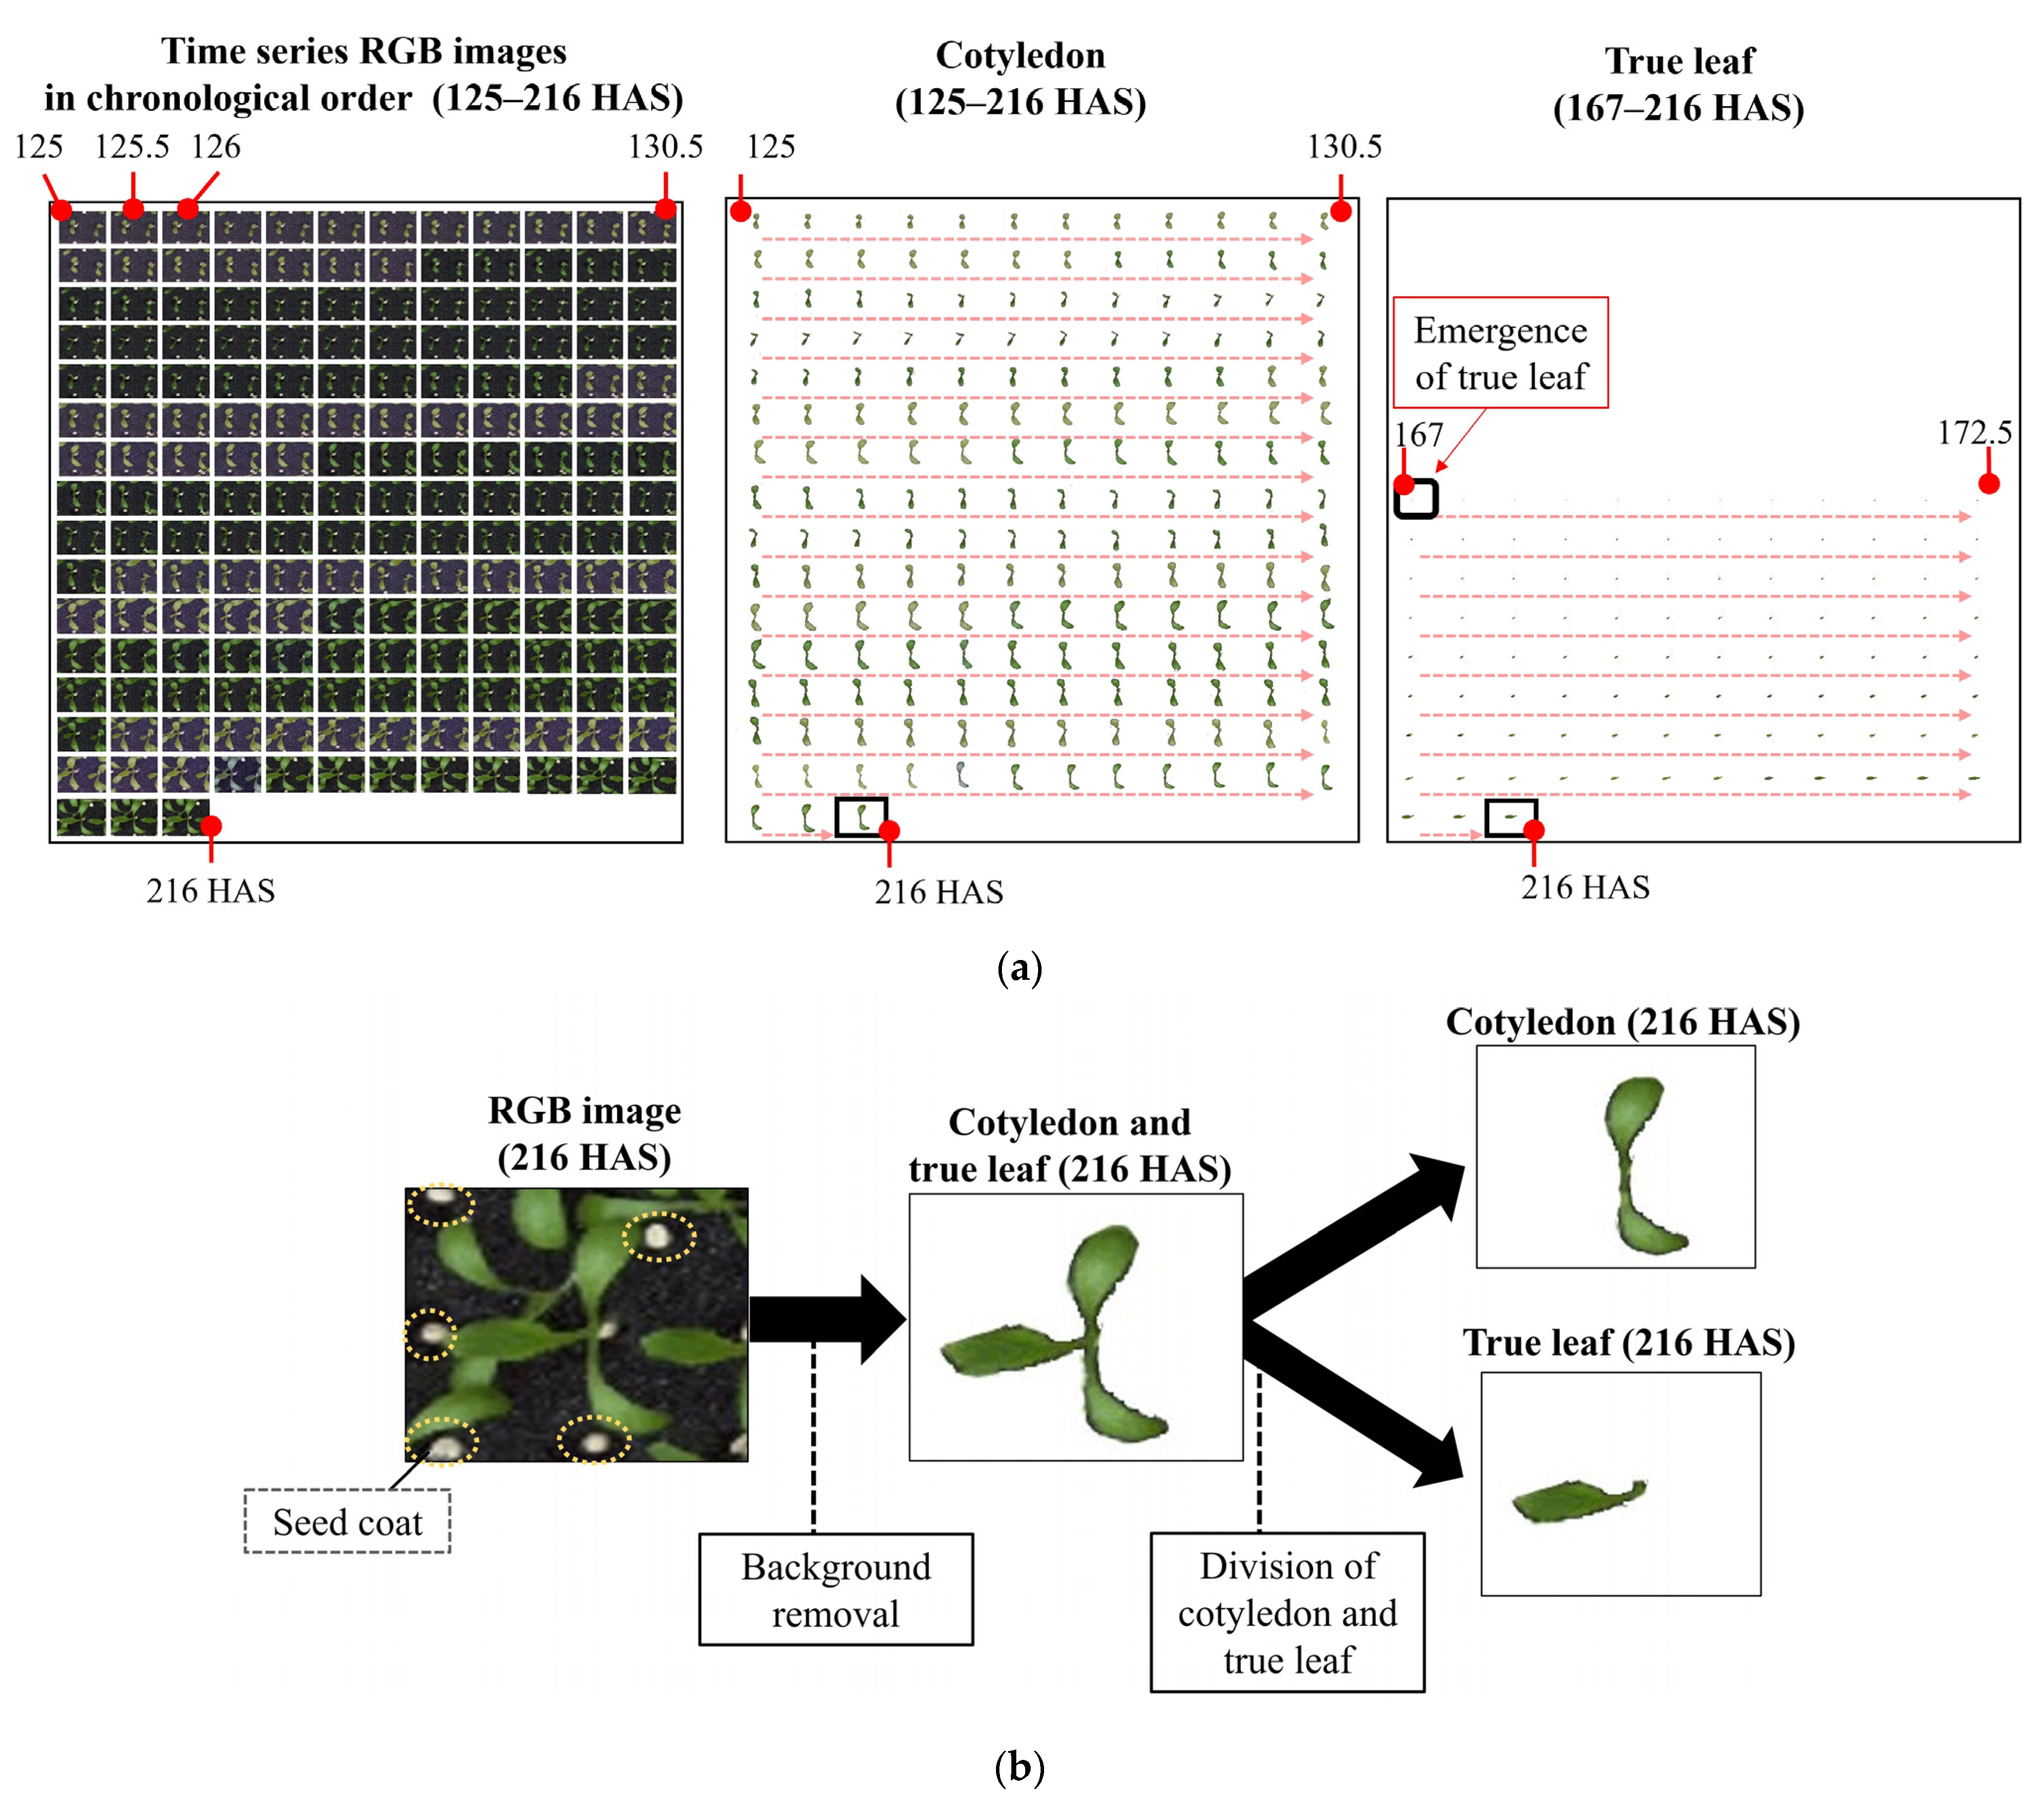
2.3. Hours to Cotyledon Unfolding and Projected Area of Cotyledon and True Leaves of Individual Plants Estimated with Time Series RGB Images
2.4. Experimental Design
2.4.1. Plant Material and Culture Conditions
2.4.2. Data Acquisition, Variables, and Symbols
3. Results
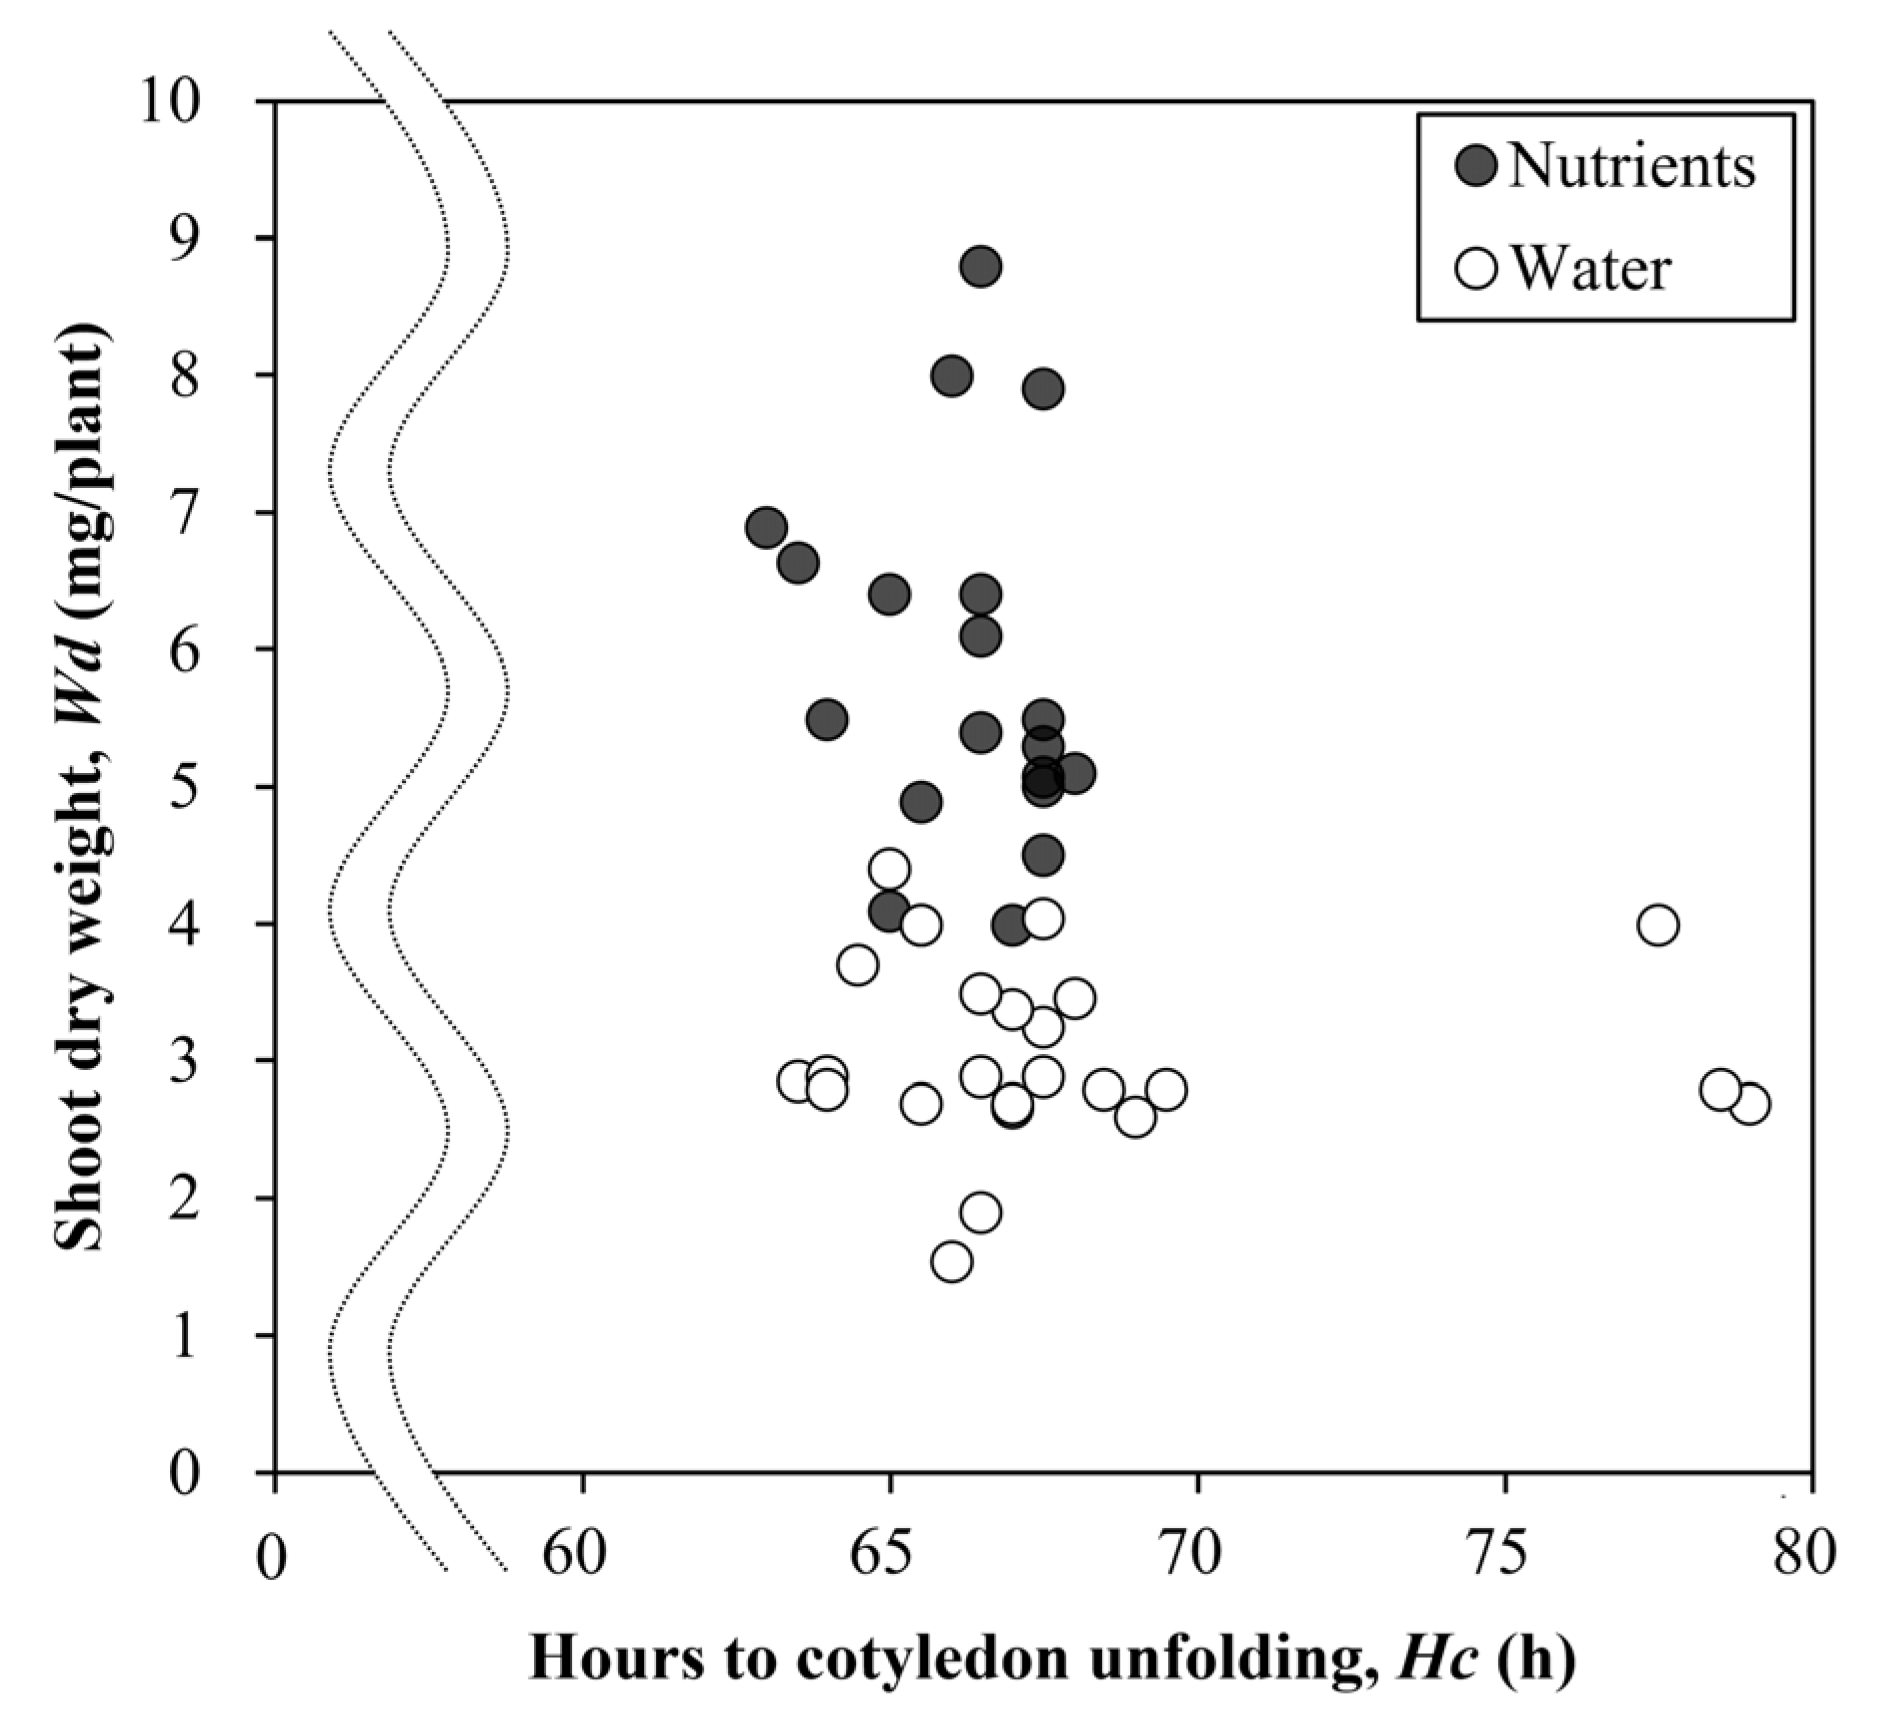
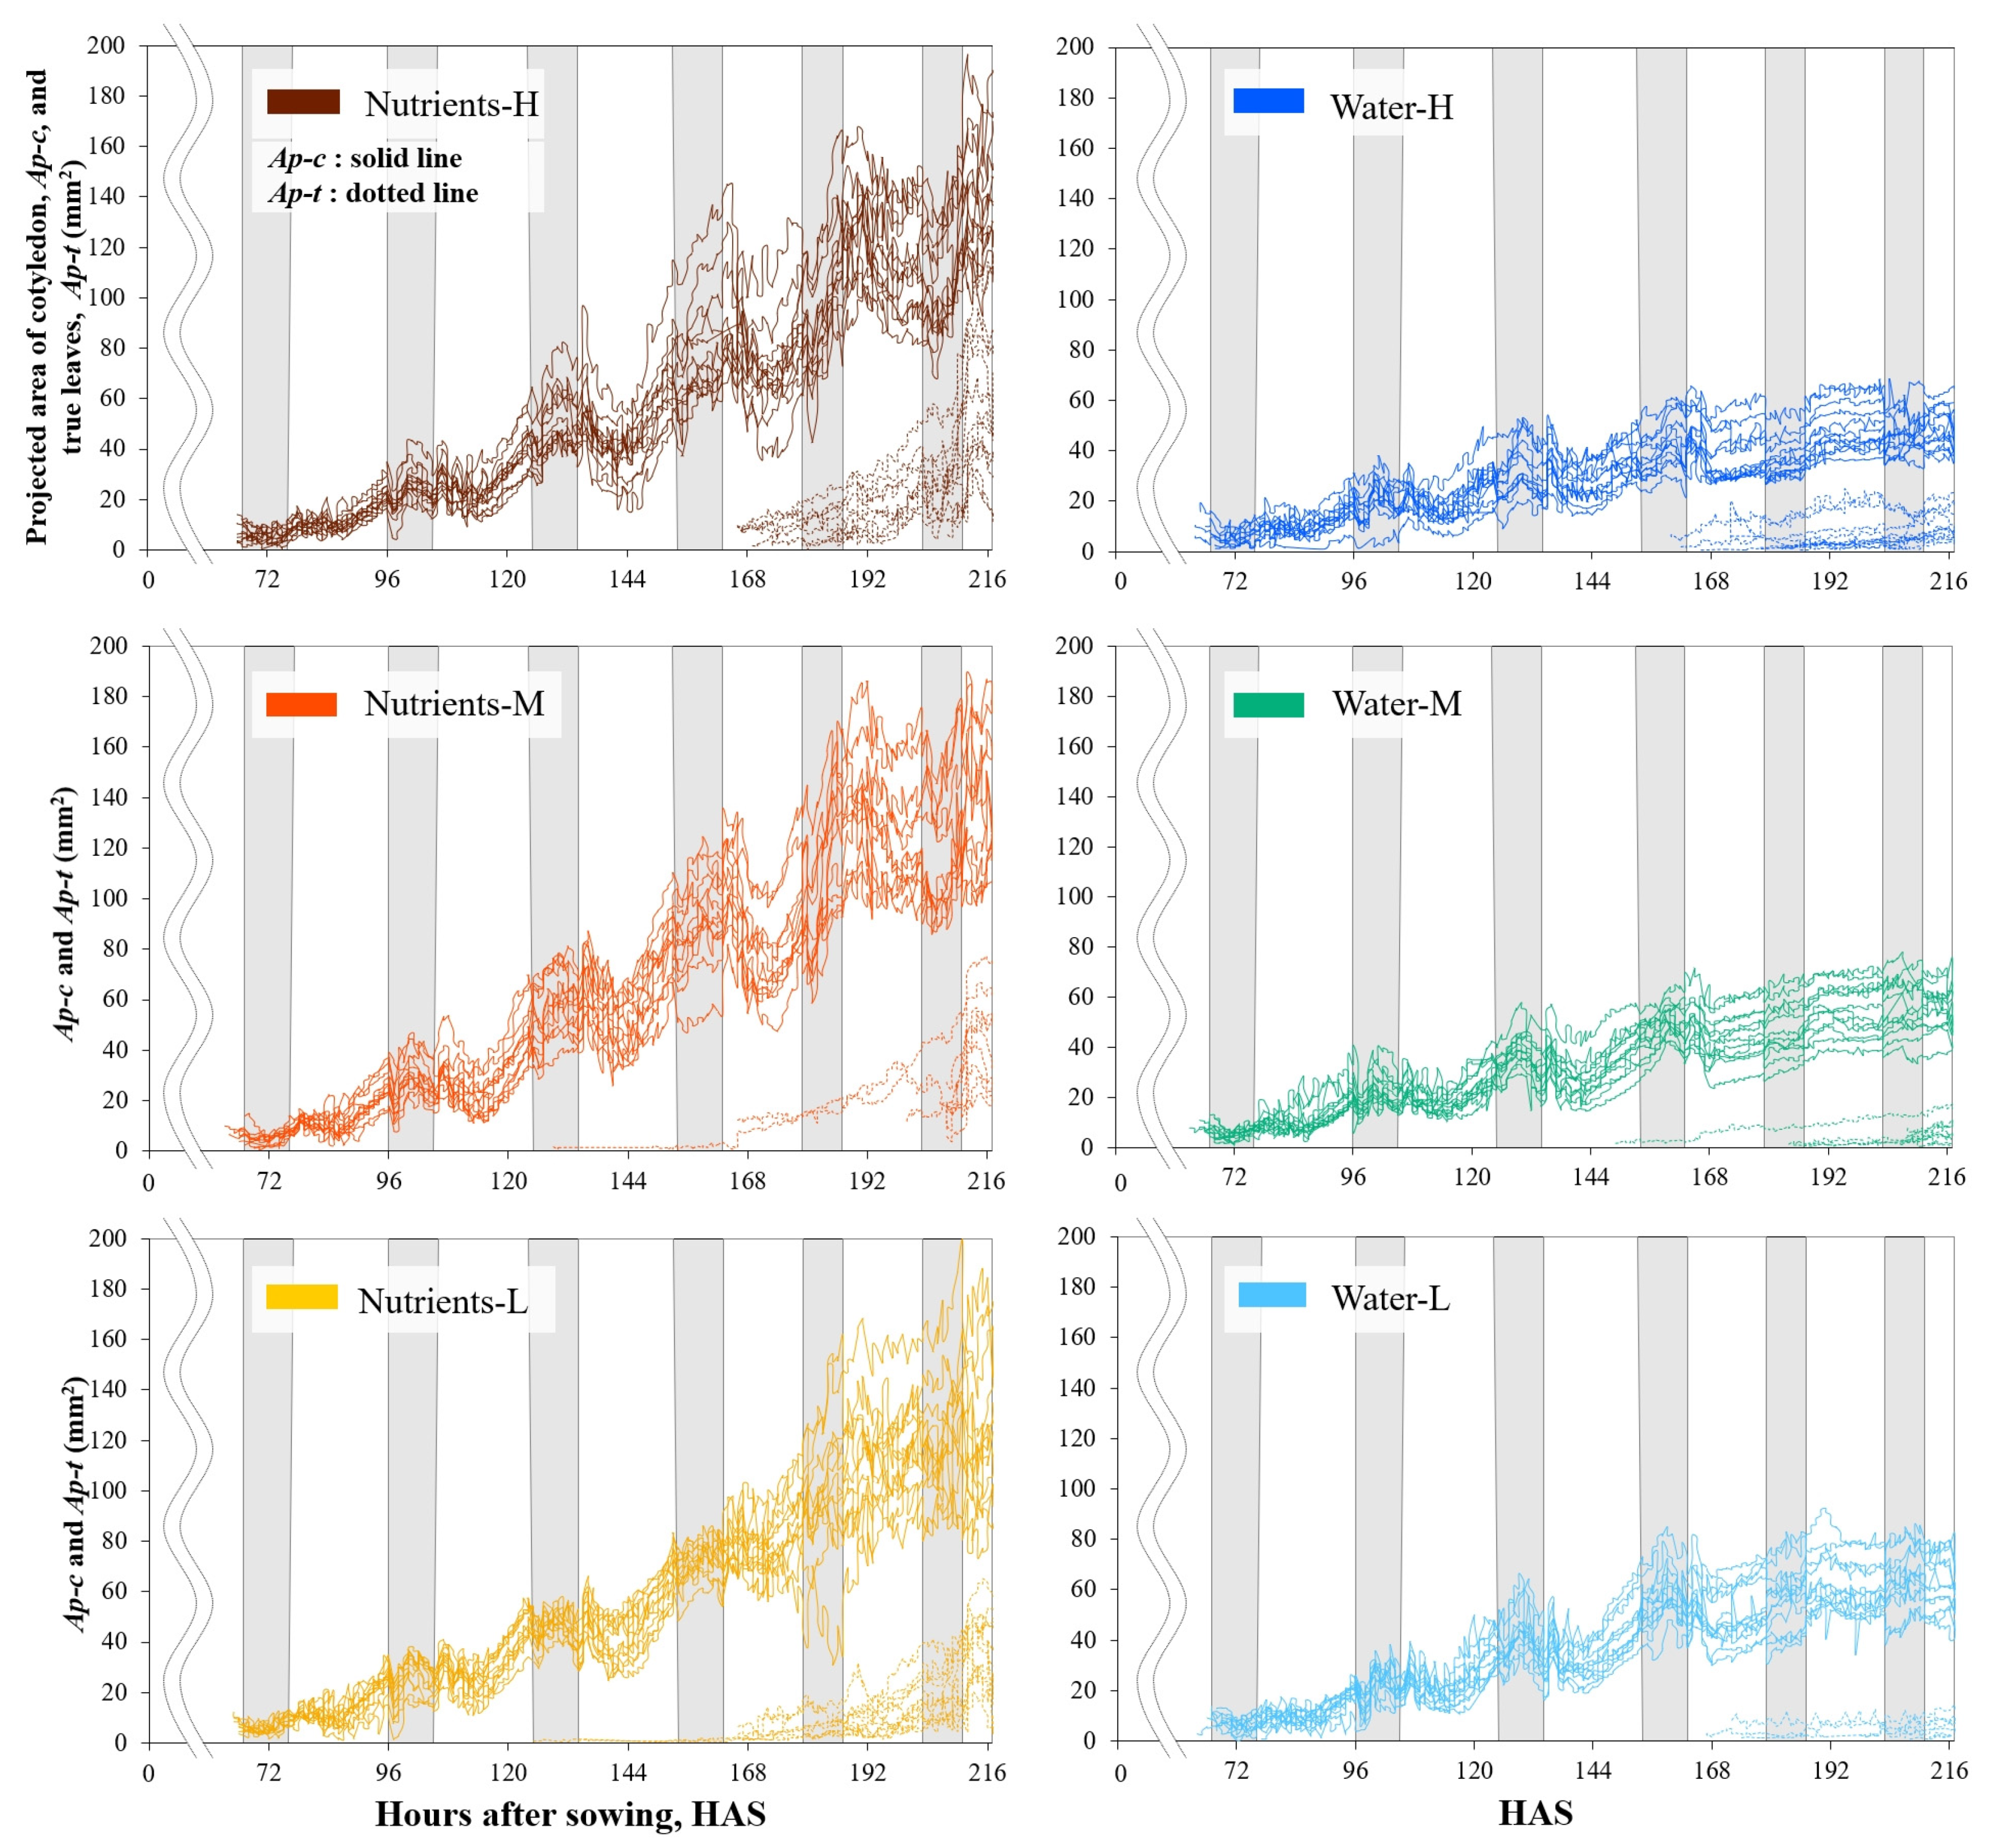
4. Discussion
5. Conclusions
Author Contributions
Funding
Data Availability Statement
Acknowledgments
Conflicts of Interest
References
- Goto, E. Plant production in a closed plant factory with artificial lighting. Acta Hortic. 2012, 956, 37–49. [Google Scholar] [CrossRef]
- Kozai, T. Resource use efficiency of closed plant production system with artificial light: Concept, estimation and application to plant factory. Jpn. Acad Ser. B Phys. Biol. Sci. 2013, 89, 447–461. [Google Scholar] [CrossRef] [Green Version]
- Leong, R.; Urano, D. Molecular Breeding for Plant Factory: Strategies and Technology. In Smart Plant Factory: The Next Generation Indoor Vertical Farms; Springer: Berlin, Germany, 2018; pp. 301–323. [Google Scholar] [CrossRef]
- Kozai, T.; Amagai, Y.; Hayashi, E. Towards sustainable plant factories with artificial lighting (PFALs): From greenhouses to vertical farms. In Achieving Sustainable Greenhouse Cultivation; Marcelis, L., Heuvelink, E., Eds.; Burleigh Dodds Science Publishing: Cambridge, UK, 2019; pp. 177–204. [Google Scholar]
- Hayashi, E.; Amagai, Y.; Maruo, T.; Kozai, T. Phenotypic Analysis of Germination Time of Individual Seeds Affected by Microenvironment and Management Factors for Cohort Research in Plant Factory. Agronomy 2020, 10, 1680. [Google Scholar] [CrossRef]
- Kozai, T.; Hayashi, E.; Amagai, Y. Plant factories with artificial lighting (PFALs) toward sustainable plant production. Acta Hortic. 2020, 1273, 251–260. [Google Scholar] [CrossRef]
- Ohyama, K.; Yamaguchi, J.; Enjoji, A. Resource Utilization Efficiencies in a Closed System with Artificial Lighting during Continuous Lettuce Production. Agronomy 2020, 10, 723. [Google Scholar] [CrossRef]
- Orsini, F.; Pennisi, G.; Zulfiqar, F.; Gianquinto, G. Sustainable use of resources in plant factories with artificial lighting (PFALs). Eur. J. Hortic. Sci. 2020, 85, 297–309. [Google Scholar] [CrossRef]
- SharathKumar, M.; Heuvelink, E.; Marcelis, L.F. Vertical farming: Moving from genetic to environmental modification. Trends Plant Sci. 2020, 25, 724–727. [Google Scholar] [CrossRef]
- van Delden, S.; SharathKumar, M.; Butturini, M.; Graamans, L.; Heuvelink, E.; Kacira, M.; Kaiser, E.; Klamer, R.; Klerkx, L.; Kootstra, G. Current status and future challenges in implementing and upscaling vertical farming systems. Nat. Food 2021, 2, 944–956. [Google Scholar] [CrossRef]
- Kozai, T. Benefits, problems and challenges of plant factories with artificial lighting (PFALs): A short review. Acta Hortic. 2018, 1227, 25–30. [Google Scholar] [CrossRef]
- Kozai, T.; Uraisami, K.; Kai, T.; Hayashi, E. Indexes, definition, equation and comments on productivity of plant factory with artificial lighting. Nogyo Oyobi Engei 2019, 94, 661–672. (In Japanese) [Google Scholar]
- Kozai, T.; Uraisami, K.; Kai, K.; Hayashi, E. Productivity: Definition and application. In Plant Factory Basics, Applications and Advances; Kozai, T., Niu, G., Masabni, J., Eds.; Elsevier: Amsterdam, The Netherlands, 2022; pp. 197–216. [Google Scholar] [CrossRef]
- Kozai, T.; Lu, N.; Hasegawa, R.; Nunomura, O.; Nozaki, T.; Amagai, Y.; Hayashi, E. Plant Cohort Research and Its Application. In Smart Plant Factory: The Next Generation Indoor Vertical Farms; Kozai, T., Ed.; Springer: Berlin, Germany, 2018; pp. 413–431. [Google Scholar] [CrossRef]
- Nagano, S.; Moriyuki, S.; Wakamori, K.; Mineno, H.; Fukuda, H. Leaf-movement-based growth prediction model using optical flow analysis and machine learning in plant factory. Front. Plant Sci. 2019, 10, 227. [Google Scholar] [CrossRef]
- Akiyama, T.; Kozai, T. Light Environment in the Cultivation Space of Plant Factory with LEDs. In LED Lighting for Urban Agriculture; Kozai, T., Fujiwara, K., Runkle, E., Eds.; Springer Nature: Singapore, 2016; pp. 91–109. [Google Scholar] [CrossRef]
- Kim, J.; Kang, W.H.; Son, J.E. Interpretation and evaluation of electrical lighting in plant factories with ray-tracing simulation and 3D plant modeling. Agronomy 2020, 10, 1545. [Google Scholar] [CrossRef]
- Saito, K.; Ishigami, Y.; Goto, E. Evaluation of the Light Environment of a Plant Factory with Artificial Light by Using an Optical Simulation. Agronomy 2020, 10, 1663. [Google Scholar] [CrossRef]
- Kumar, J.; Pratap, A.; Kumar, S. Phenomics in Crop Plants: Trends, Options and Limitations; Springer: New Delhi, India, 2015; p. 296. [Google Scholar]
- Fiorani, F.; Schurr, U. Future scenarios for plant phenotyping. Annu. Rev. Plant. Biol. 2013, 64, 267–291. [Google Scholar] [CrossRef] [Green Version]
- Golbach, F.; Kootstra, G.; Damjanovic, S.; Otten, G.; van de Zedde, R. Validation of plant part measurements using a 3D reconstruction method suitable for high-throughput seedling phenotyping. Mach. Vis. Appl. 2016, 27, 663–680. [Google Scholar] [CrossRef] [Green Version]
- Guo, W. Automated characterization of plant growth and flowering dynamics using RGB images. In Smart Plant Factory: The Next Generation Indoor Vertical Farms; Springer: Berlin, Germany, 2018; pp. 385–393. [Google Scholar] [CrossRef]
- Shibata, T.; Iwao, K.; Takano, T. Growth prediction of lettuce plants by image processing. Acta Hortic. 1992, 319, 689–694. [Google Scholar] [CrossRef]
- Giacomelli, G.A.; Ling, P.P.; Morden, R.E. An automated plant monitoring system using machine vision. Acta Hort. 1996, 440, 377–382. [Google Scholar] [CrossRef]
- Itoh, H.; Yamamoto, H. A Modeling of Lettuce Growth by System Identification (Part 1). J. Jpn. Soc. Agric. Mach. 2005, 67, 71–80. (In Japanese) [Google Scholar]
- Franchetti, B.; Ntouskos, V.; Giuliani, P.; Herman, T.; Barnes, L.; Pirri, F. Vision based modeling of plants phenotyping in vertical farming under artificial lighting. Sensors 2019, 19, 4378. [Google Scholar] [CrossRef] [PubMed] [Green Version]
- Jayalath, T.C.; van Iersel, M.W. Canopy Size and Light Use Efficiency Explain Growth Differences between Lettuce and Mizuna in Vertical Farms. Plants 2021, 10, 704. [Google Scholar] [CrossRef]
- Tian, Z.; Ma, W.; Yang, Q.; Duan, F. Application status and challenges of machine vision in plant factory—A review. Inf. Processing Agric. 2021. [Google Scholar] [CrossRef]
- Kitajima, K. Impact of cotyledon and leaf removal on seedling survival in three tree species with contrasting cotyledon functions1. Biotropica 2003, 35, 429–434. [Google Scholar] [CrossRef]
- Hanley, M.E.; May, O.C. Cotyledon damage at the seedling stage affects growth and flowering potential in mature plants. New Phytol. 2006, 169, 243–250. [Google Scholar] [CrossRef] [PubMed]
- Zhang, H.; Zhou, D.; Matthew, C.; Wang, P.; Zheng, W. Photosynthetic contribution of cotyledons to early seedling development in Cynoglossum divaricatum and Amaranthus retroflexus. N. Z. J. Bot. 2008, 46, 39–48. [Google Scholar] [CrossRef] [Green Version]
- Zheng, W.; Wang, P.; Zhang, H.; Zhou, D. Photosynthetic Characteristics of the Cotyledon and First True Leaf of Castor (Ricinus communis L.). Aust. J. Crop. Sci. 2011, 5, 702–708. [Google Scholar] [CrossRef]
- Kikuzawa, K. The basis for variation in leaf longevity of plants. Vegetatio 1995, 121, 89–100. [Google Scholar] [CrossRef]
- Santos, H.P.; Buckeridge, M.S. The role of the storage carbon of cotyledons in the establishment of seedlings of Hymenaea courbaril under different light conditions. Ann. Bot. 2004, 94, 819–830. [Google Scholar] [CrossRef] [Green Version]
- Walter, A.; Scharr, H.; Gilmer, F.; Zierer, R.; Nagel, K.A.; Ernst, M.; Wiese, A.; Virnich, O.; Christ, M.M.; Uhlig, B. Dynamics of seedling growth acclimation towards altered light conditions can be quantified via GROWSCREEN: A setup and procedure designed for rapid optical phenotyping of different plant species. New Phytol. 2007, 174, 447–455. [Google Scholar] [CrossRef] [PubMed]
- Darwin, C.; Darwin, F. The Power of Movement in Plants; John Murray: London, UK, 1880. [Google Scholar]
- Hoshi, T.; Takiguchi, T. Continuous Measurement of Movement in Spinach Leaves Using Video Cameras. J. Agric. Meteorol. 1995, 51, 123–130. (In Japanese) [Google Scholar] [CrossRef]
- Hayashi, E.; Kozai, T. Phenotyping-and AI-Based Environmental Control and Breeding for PFAL. In Smart Plant Factory: The Next Generation Indoor Vertical Farms; Kozai, T., Ed.; Springer: Berlin, Germany, 2018; pp. 405–411. [Google Scholar]
- Hasegawa, R. Data warehouse for plant phenotyping in plant factories. In Proceedings of the Japanese Society of Agricultural, Biological and Environmental Engineers and Scientists (JSABEES), Tokyo University of Ag. & Tech., Tokyo, Japan, 18–21 September 2018; pp. 224–225. [Google Scholar]
- Schneider, C.A.; Rasband, W.S.; Eliceiri, K.W. NIH Image to ImageJ: 25 years of image analysis. Nat. Methods 2012, 9, 671–675. [Google Scholar] [CrossRef]
- Maruo, T.; Ito, T.; Ishii, S. Studies on the feasible management of nutrient solution in hydroponically grown lettuce (Lactuca sativa L.). Tech. Bull. Fac. Hortic. Chiba Univ. 1992, 46, 235–240. [Google Scholar]


| Code | Nutrients/Water | PPFD Classifications | Distribution of Horizontal PPFD (μmol m−2 s−1) |
|---|---|---|---|
| Nutrients-H | Nutrients (Tray 2) | High | 175, 181, 187, 195, 202, 208 |
| Nutrients-M | Medium | 140, 145, 147, 148, 151, 165 | |
| Nutrients-L | Low | 84, 102, 102, 104, 118, 126 | |
| Water-H | Water (Tray 1) | High | 168, 175, 181, 190, 197, 205 |
| Water-M | Medium | 136, 142, 144, 148, 153, 161 | |
| Water-L | Low | 84, 100, 104, 112, 121, 123 |
| Symbol | Variable Name/Description | Unit |
|---|---|---|
| Cotyledon area of individual plant 216 h after sowing (HAS), and their average | mm2 | |
| Area of cotyledon and true leaves of individual plant 216 HAS, and their average | mm2 | |
| True leaf area of individual plant 216 HAS, and their average | mm2 | |
| Ap-c, | Projected cotyledon area of individual plant, and their average | mm2 |
| Ap-ct, | Projected area of cotyledon and true leaves of individual plant, and their average | mm2 |
| Ap-t, | Projected true leaf area of individual plant, and their average | mm2 |
| Hours to cotyledon unfolding (from sowing to the unfolding of the cotyledon) of individual plant, and their average | h | |
| LAR | The ratio of leaf area (Act) to shoot dry weight (Wd) (Act divided by Wd) | m2 g−1 |
| Hypocotyl length of individual plant 216 HAS, and their average | mm | |
| Integrated PPFD | Integrated PPFD during hours from cotyledon unfolding (Hc) to 216 HAS of individual plant | mol m−2 |
| PPFD | Horizontal photosynthetic photon flux density at individual plant 0.04 m above the surface of the tray | μmol m−2 s−1 |
| VPNS | Volumetric percentage of nutrient solution in the tray [5] | % |
| Shoot (ct, h, and petiole) dry weight of individual plant 216 HAS, and their average | mg/plant | |
| Shoot fresh weight of individual plant 216 HAS, and their average | mg/plant |
| Treatment Code | Hours to Cotyledon Unfolding 1 | Projected Cotyledon Area at Hc 2 | 216 HAS | Projected Area of True Leaves 216 HAS | Projected Area of Cotyledon and True Leaves 216 HAS |
|---|---|---|---|---|---|
| h | mm2 | mm2 | mm2 | mm2 | |
| Nutrients-H | 67 | 10 | 138 | 54 | 192 |
| Nutrients-M | 65 | 8 | 138 | 43 | 172 |
| Nutrients-L | 66 | 8 | 124 | 36 | 157 |
| Water-H | 69 | 9 | 49 | 11 | 58 |
| Water-M | 66 | 8 | 55 | 7 | 62 |
| Water-L | 69 | 11 | 64 | 6 | 67 |
| Treatment Code | Area of Cotyledon (Ac) | Area of True Leaves (At) | Area of Cotyledon and True Leaves (Act) | Hypocotyl Length (Lh) | Shoot Fresh Weight (Wf) | Shoot Dry Weight (Wd) | The Ratio of Act to Wd (Act/Wd) (LAR) | |
|---|---|---|---|---|---|---|---|---|
| mm2 | mm2 | mm2 | mm | mg | mg | m2 g−1 | ||
| Average | Nutrients-H | 206 | 110 | 316 | 12 | 83.6 | 6.2 | 51 |
| Nutrients-M | 205 | 102 | 307 | 13 | 84.0 | 6.0 | 52 | |
| Nutrients-L | 187 | 86 | 273 | 15 | 70.0 | 4.7 | 58 | |
| Coefficient of variation | Nutrients-H | 0.131 | 0.258 | 0.157 | 0.139 | 0.206 | 0.208 | 0.096 |
| Nutrients-M | 0.101 | 0.219 | 0.126 | 0.183 | 0.140 | 0.169 | 0.095 | |
| Nutrients-L | 0.101 | 0.123 | 0.090 | 0.137 | 0.058 | 0.095 | 0.081 | |
| Average | Water-H | 71 | 14 | 84 | 10 | 24.5 | 3.3 | 26 |
| Water-M | 72 | 15 | 88 | 10 | 25.2 | 2.9 | 30 | |
| Water-L | 82 | 13 | 96 | 12 | 26.9 | 2.7 | 36 | |
| Coefficient of variation | Water-H | 0.155 | 0.315 | 0.138 | 0.147 | 0.167 | 0.195 | 0.222 |
| Water-M | 0.260 | 0.675 | 0.210 | 0.148 | 0.164 | 0.205 | 0.156 | |
| Water-L | 0.159 | 0.385 | 0.187 | 0.112 | 0.209 | 0.208 | 0.150 |
Publisher’s Note: MDPI stays neutral with regard to jurisdictional claims in published maps and institutional affiliations. |
© 2022 by the authors. Licensee MDPI, Basel, Switzerland. This article is an open access article distributed under the terms and conditions of the Creative Commons Attribution (CC BY) license (https://creativecommons.org/licenses/by/4.0/).
Share and Cite
Hayashi, E.; Amagai, Y.; Kozai, T.; Maruo, T.; Tsukagoshi, S.; Nakano, A.; Johkan, M. Variations in the Growth of Cotyledons and Initial True Leaves as Affected by Photosynthetic Photon Flux Density at Individual Seedlings and Nutrients. Agronomy 2022, 12, 194. https://doi.org/10.3390/agronomy12010194
Hayashi E, Amagai Y, Kozai T, Maruo T, Tsukagoshi S, Nakano A, Johkan M. Variations in the Growth of Cotyledons and Initial True Leaves as Affected by Photosynthetic Photon Flux Density at Individual Seedlings and Nutrients. Agronomy. 2022; 12(1):194. https://doi.org/10.3390/agronomy12010194
Chicago/Turabian StyleHayashi, Eri, Yumiko Amagai, Toyoki Kozai, Toru Maruo, Satoru Tsukagoshi, Akimasa Nakano, and Masahumi Johkan. 2022. "Variations in the Growth of Cotyledons and Initial True Leaves as Affected by Photosynthetic Photon Flux Density at Individual Seedlings and Nutrients" Agronomy 12, no. 1: 194. https://doi.org/10.3390/agronomy12010194