
Applicability of Near Infrared Reflectance Spectroscopy to Predict Amylose Contents of Single-Grain Maize

1
National Engineering Laboratory of Crop Stress Resistance, Anhui Agricultural University, Hefei 230036, China
2
Maize Research Center, Anhui Academy of Agricultural Sciences, Hefei 230031, China
*
Author to whom correspondence should be addressed.
†
These authors contributed equally to this work.
Agronomy 2021, 11(12), 2463; https://doi.org/10.3390/agronomy11122463
Submission received: 18 November 2021
/
Revised: 30 November 2021
/
Accepted: 1 December 2021
/
Published: 3 December 2021
(This article belongs to the Special Issue Environmental Ecological Remediation and Farming Sustainability)
Abstract
:Near infrared reflectance spectroscopy (NIRS) and reference data were used to determine the amylose contents of single maize seeds to enable rapid, effective selection of individual seeds with desired traits. To predict the amylose contents of a single seed, a total of 1069 (865 as calibration set, 204 as validation set) single seeds representing 120 maize varieties were analyzed using chemical methods and performed calibration and external validation of the 150 single seeds set in parallel. Compared to various spectral pretreatments, the regression of partial least squares (PLS) with mathematical treatment of Harmonization showed the final optimization. The single-seed amylose contents showed the root mean square error of calibration (RMSEC) of 2.899, coefficient of determination for calibration (R2) of 0.902, and root mean square error of validation (RMSEV) of 2.948. In external validations, the coefficient of determination in cross-validation (r2), root mean square error of the prediction (RMSEP) and ratio of the standard deviation to SEP (RPD) were 0.892, 2.975 and 3.086 in the range of 20–30%, respectively. Therefore, NIRS will be helpful to breeders for determining the amylose contents of single-grain maize.
1. Introduction
Maize (Zea mays ssp. mays) is one of the most important food and feed crops, provides 25–50% energy consumption of total human and has high genetic variation, which will be significant for genetic and molecular research in the future [1]. Starch is a surprisingly complex molecule. The quality of maize depends on the structure, composition and accumulation of starch. The starch composition of the granules in the endosperm, which is related to the proportion of amylose to amylopectin, reflects the quality of maize to a large extent [2]. The polymers that constitute starch comprise glucose subunits linked together with either α (1,4) or α (1,6) glycoside bonds [3]. Amylose is an essentially linear molecule joined by α (1,4)-linked glucosidic and makes it an important industrial material used in production of environmentally safe and biodegradable plastics [4,5].
Near Infrared Reflectance Spectroscopy (NIRS) provides a rapid, non-destructive, inexpensive method for analyzing and screening the composition of single cereal grains, and this method does not have a negative impact on the environment. The near-infrared spectral region is the first non-visible spectral region (wavelengths from 780 to 2526 nm) that can reflect the overtone and combination vibration absorption of C–H, N–H and O–H groups in molecules, thus obtaining information on organic matter and some inorganic matter [6,7]. Spectroscopy technique has penetrated into all walks of life. In the field of agriculture, near-infrared spectroscopy technique is mainly used in food composition analysis, agricultural quality breeding, agricultural product quality evaluation, chemical composition analysis of various agricultural products and environmental monitoring [8,9,10,11]. Several studies of organic constituents that employed NIRS have demonstrated the effectiveness of this method. For instance, NIRS technology has been used to predict maize seed composition (protein, starch, palmitic, oleic, and linoleic acid, calorie) [12], crude protein content in cowpea (Vigna unguiculata) [13], bioethanol production in cereal grains [14], total starch and amylose contents in barley [15], starch waxiness in wheat (Triticum aestivum L.), the contents of native and resistant starches and their mixtures [16] and a food safety classification system [17]. Maize both genetically and phenotypically makes varieties in diversity [18]. Analyzing the mean composition of single-grain maize is an efficient method for predicting the composition of whole samples [19]. To date, there are many research studies on predicting maize kernel by using NIR spectroscopy [12,20,21] but there is no report on predicting the amylose content of single-grain maize.
Therefore, in the current study, we designed a method to predict the content of amylose in single-grain maize using NIRS. In this study, the corn kernels were pooled into samples of single kernels to obtain sufficient meal for the analysis of multiple constituents. The method developed in this study will enable breeders and geneticists to choose useful individual seeds for post-propagation and breeding.
2. Materials and Methods
2.1. Plant Materials
The 1219 seeds were selected from different places and types as a sample for calibration and validation samples. Of this, 865 seeds as a sample to obtain the values of RMSEC and R2 by building model; 204 seeds as validation set to gain RMSEV; 150 seeds as external validation set. A total of 1219 single seeds representing 120 maize varieties were used for NIRS analysis, including varieties from China (Sichuan, Guizhou, Anhui, etc.), the United States (Indiana, Illinois, Iowa and Michigan) and the germplasm bank of the International Maize and Wheat Improvement Center (CIMMYT). These varieties included different environmental adaptations (temperate and tropical/subtropical regions), different kernel colors (yellow, pale yellow, purple and white), different kernel types (semi-dent, dent and flint), different heterotic groups (A, B, AB, PA, PB, SPT, BSSS, Lancaster and Lvda red cob) and different variety types (inbred and hybrid). The 150 single seeds were randomly selected as external validation set to get RMSEP.
2.2. Analytical Methods
A mixed calibration curve was constructed using starch standards (amylose [Sigma, A0512]; amylopectin [Sigma, A8515]). The determination of amylose content referred to the international standard (ISO 6647:1987) and the National standard of the People’s Republic of China (GB/T 15683-1995). All the seeds were ground after the embryos and pericarps were removed from the seeds and the endosperms were dried at 50 °C in a vacuum oven until all samples had similar moisture contents. The seeds were milled into powders and filtered through a 0.177 mm sieve to produce uniform granules. Then, 100 mg of raw powder was placed in a 100 mL volumetric flask and mixed with 1 mL anhydrous ethanol and 9 mL 1 M NaOH. The extract was dissolved by boiling at 100 °C for 10 min and quickly cooled. H2O was added to the sample to 100 mL, and 20 mL of the liquid was transferred into a 50 mL centrifuge tube, washed three times with 8 mL of petroleum ether (HG3-1003-76). Then, 5 mL of supernatant was transferred to a 100 mL volumetric flask, and 50 mL H2O, 1 mL 1 M glacial acetic and 1 mL hypervalent iodine were added. After a 10 min incubation at room temperature, the absorbance was measured at 620 nm using a Hitech U2001 Series Spectrophotometer. All assays were performed with three technical replicates and biologically independent samples. A mixed calibration curve of amylose was constructed and used to determine the amylose contents of the maize extracts (y = 0.2558x + 0.068, R2 = 0.9996).
2.3. Spectrum Collection and Model Development
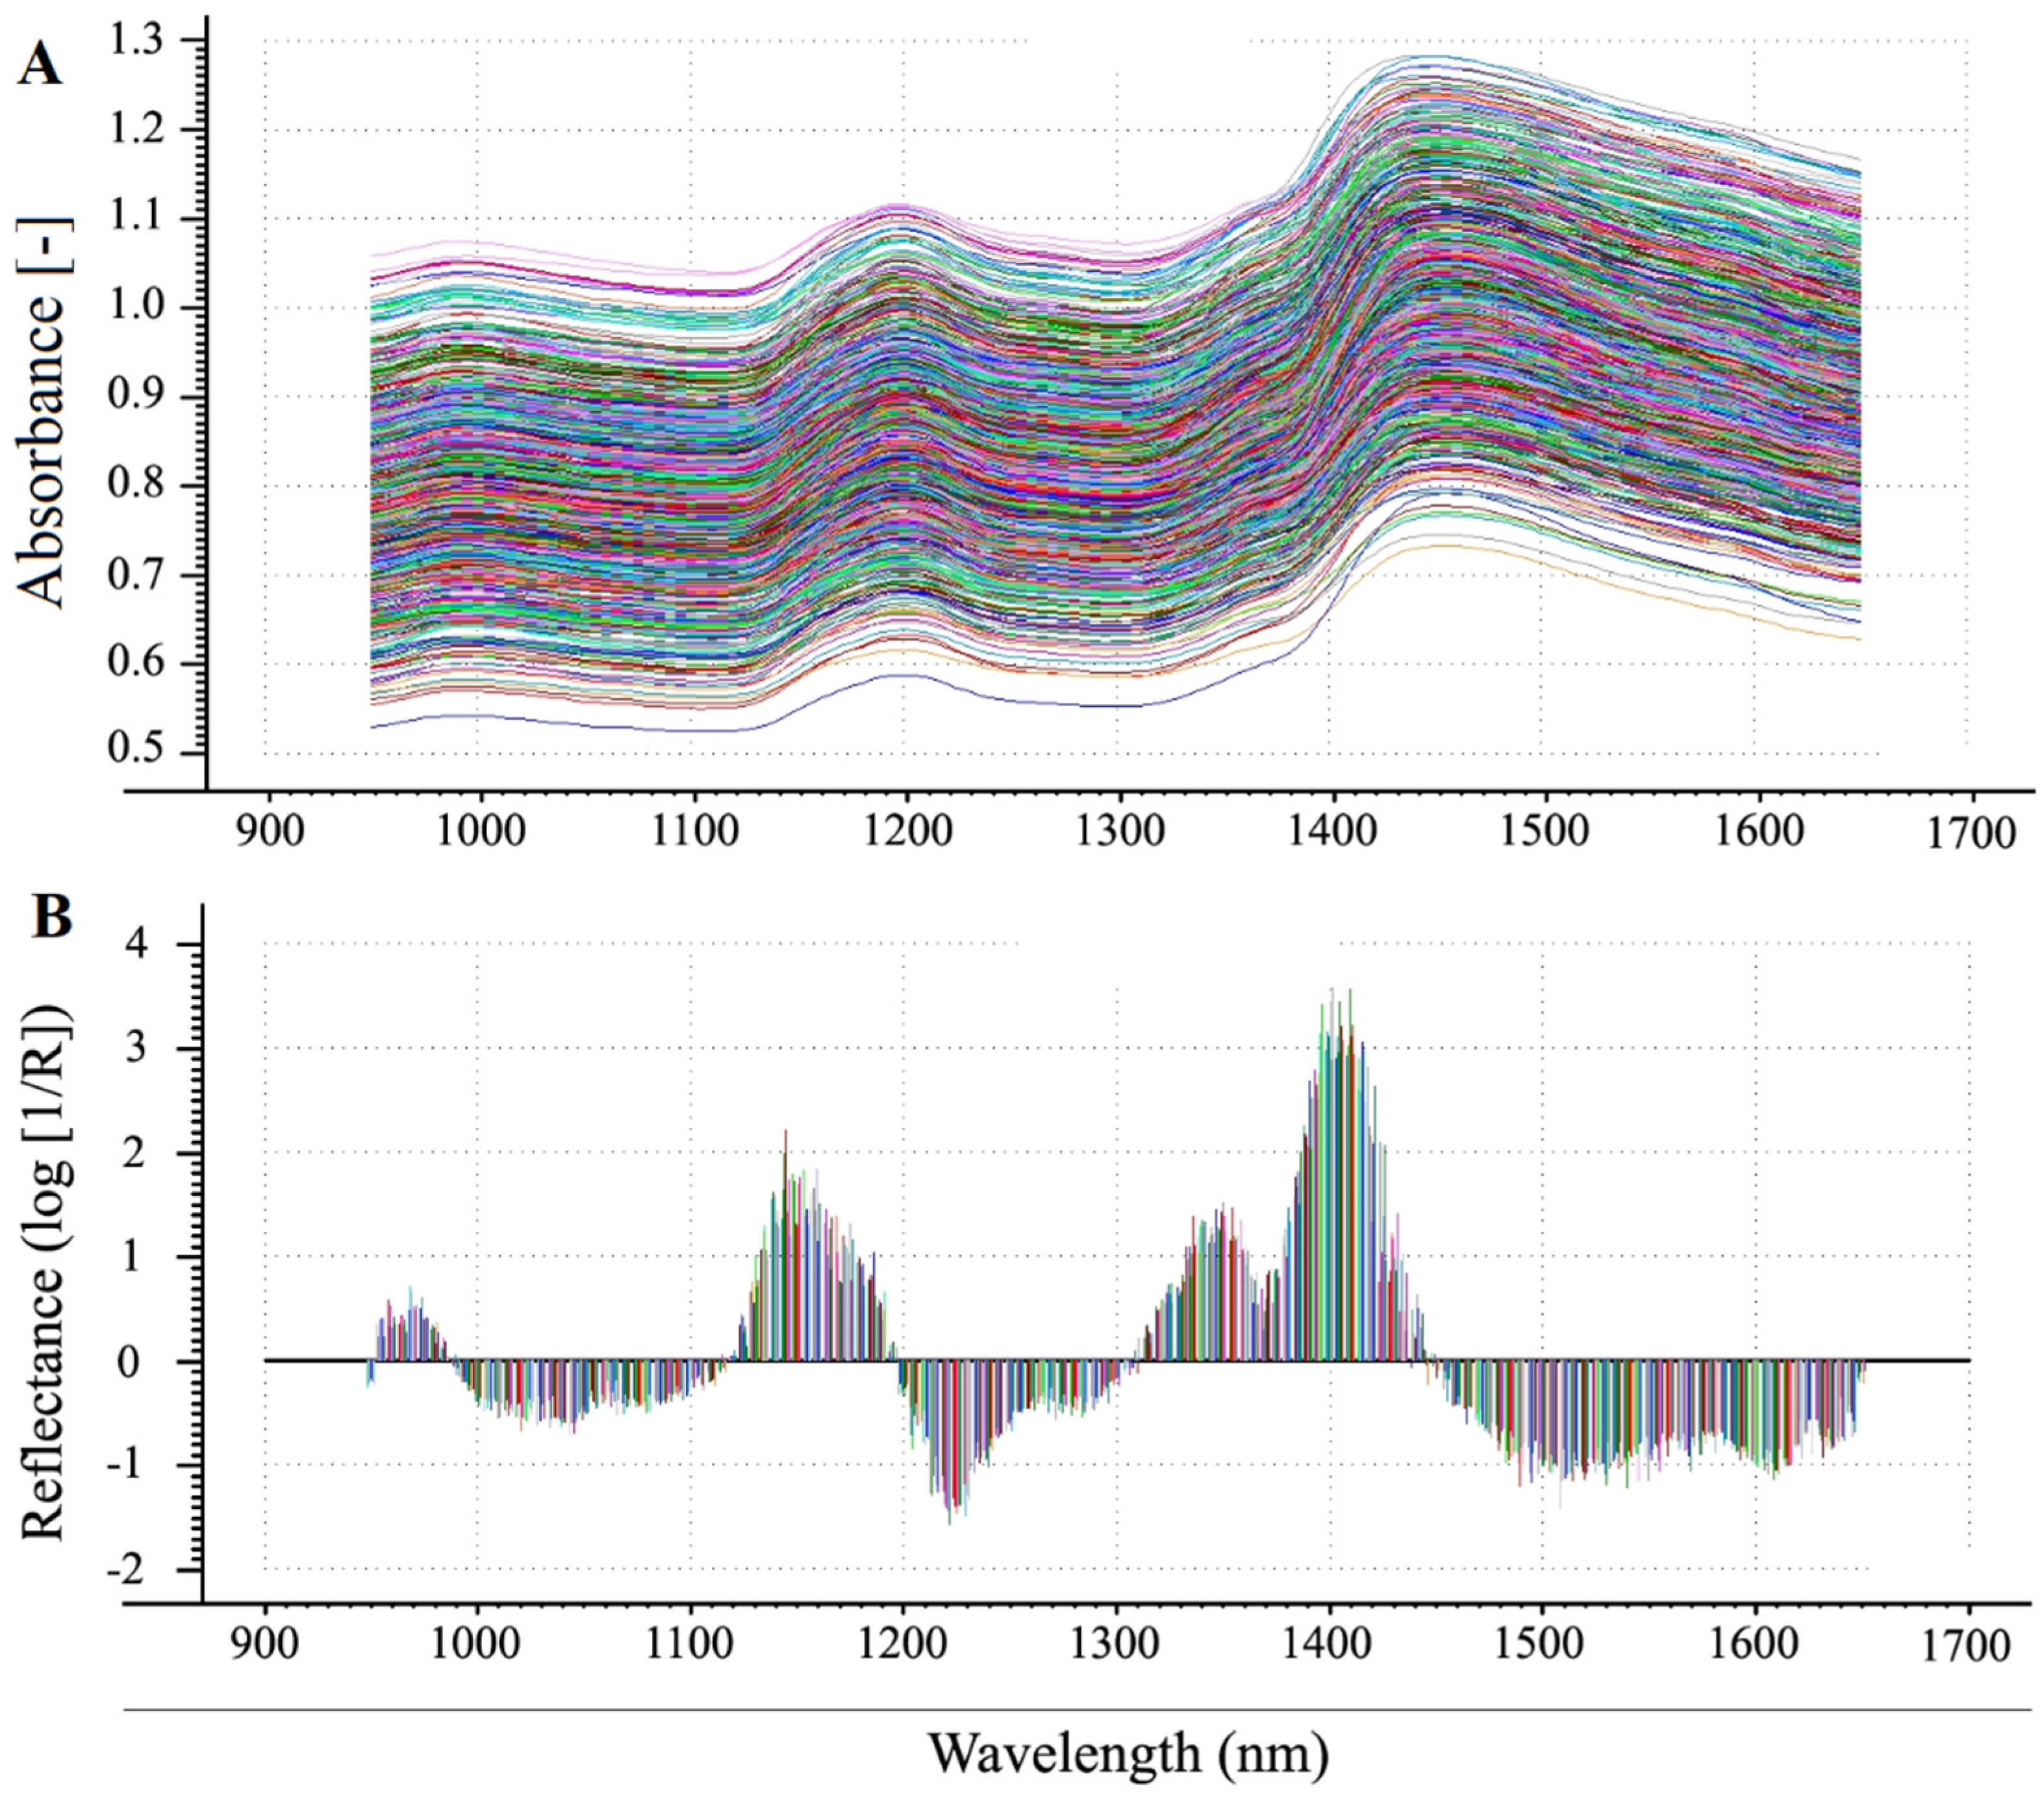
All the seeds were examined using an NIRS analysis system (DA7200, Perten Instruments, Springfield, Illinois) in the near infrared wavelength range of 950 to 1650 nm, registering the absorbance values log (1/R) in 2 nm intervals for each sample. For spectral collection, eight seeds from each variety were randomly selected and scanned to avoid bias. Each grain needed to be scanned at least three times at different angles so that the machine could fully absorb the spectral value of the sample. Samples were labeled after each scan. To minimize the effects of particle size, the mean individual kernel spectrum was computed after mean centering the predicted amylose content. The average spectrum of each sample was calculated for further chemometric analysis. The scatter of spectra was first corrected by standard normal variate and detrending [22], and the first derivative Savitzky–Golay [23] and second derivative Savitzky–Golay [24] algorithms were then employed.
2.4. Spectral Analysis
The purpose of pretreatment is to reduce undesirable systematic noise and enhance the contribution of the chemical composition. In our research, we chose several pretreatment methods to optimize the spectral model, including normalization, smoothing, multiplicative scattering correction (MSC), standard normal variate (SNV), Deratives, First Deratives and Savitzky−Golay smooth (first and S–G) and Harmonization. Harmonization Pretreatment was the algorithm that combines detrending and SNV, which was a new innovative calibration technique which combines standard PLS regression with spectral recognition.
PLS regression is a statistical method that bears some relation to principal components regression. It finds a linear regression model by projecting the predicted variables and the observable variables to a new space. The significant number of PLS factors in each component trait model is determined by cross-validation. Cross-validation is performed by removing one-seventh of the training set data and using the remaining samples to develop a calibration model. Calibration models between chemical data and NIR spectra were developed using PLS regression and were calculated to determine quantitative relation between the NIR spectra and the response variable [14] and calibration using Unscrambler software (CAMO, V9.8, Oslo, Norway). Principal Component Analysis (PCA) is widely used to evaluate principal components and the variance of different varieties and species in processed spectral data. The number of factors determined as optimal for each model was based on the minimum root mean square error (RMSE) value obtained from the PLS1 modeling after examining RMSE versus factor levels.
The relative performance of the established model was expressed by examining the required number of factors. Accuracy of the model was expressed by R2, RMSEC and RMSEP for the optimal number of PLS components. The r2 was used in external validations and the models were estimated by the RMSEC; the RPD statistic provided a basis for standardizing the standard error of prediction (SEP) [25]. RMSEP and RPD could well describe the NIRS analytical error [26] and RMSEV were calculated to estimate the coefficient of determination and validation error [27].
3. Results
3.1. Amylose Content of Single Maize Kernels Determined by Chemical Analyses
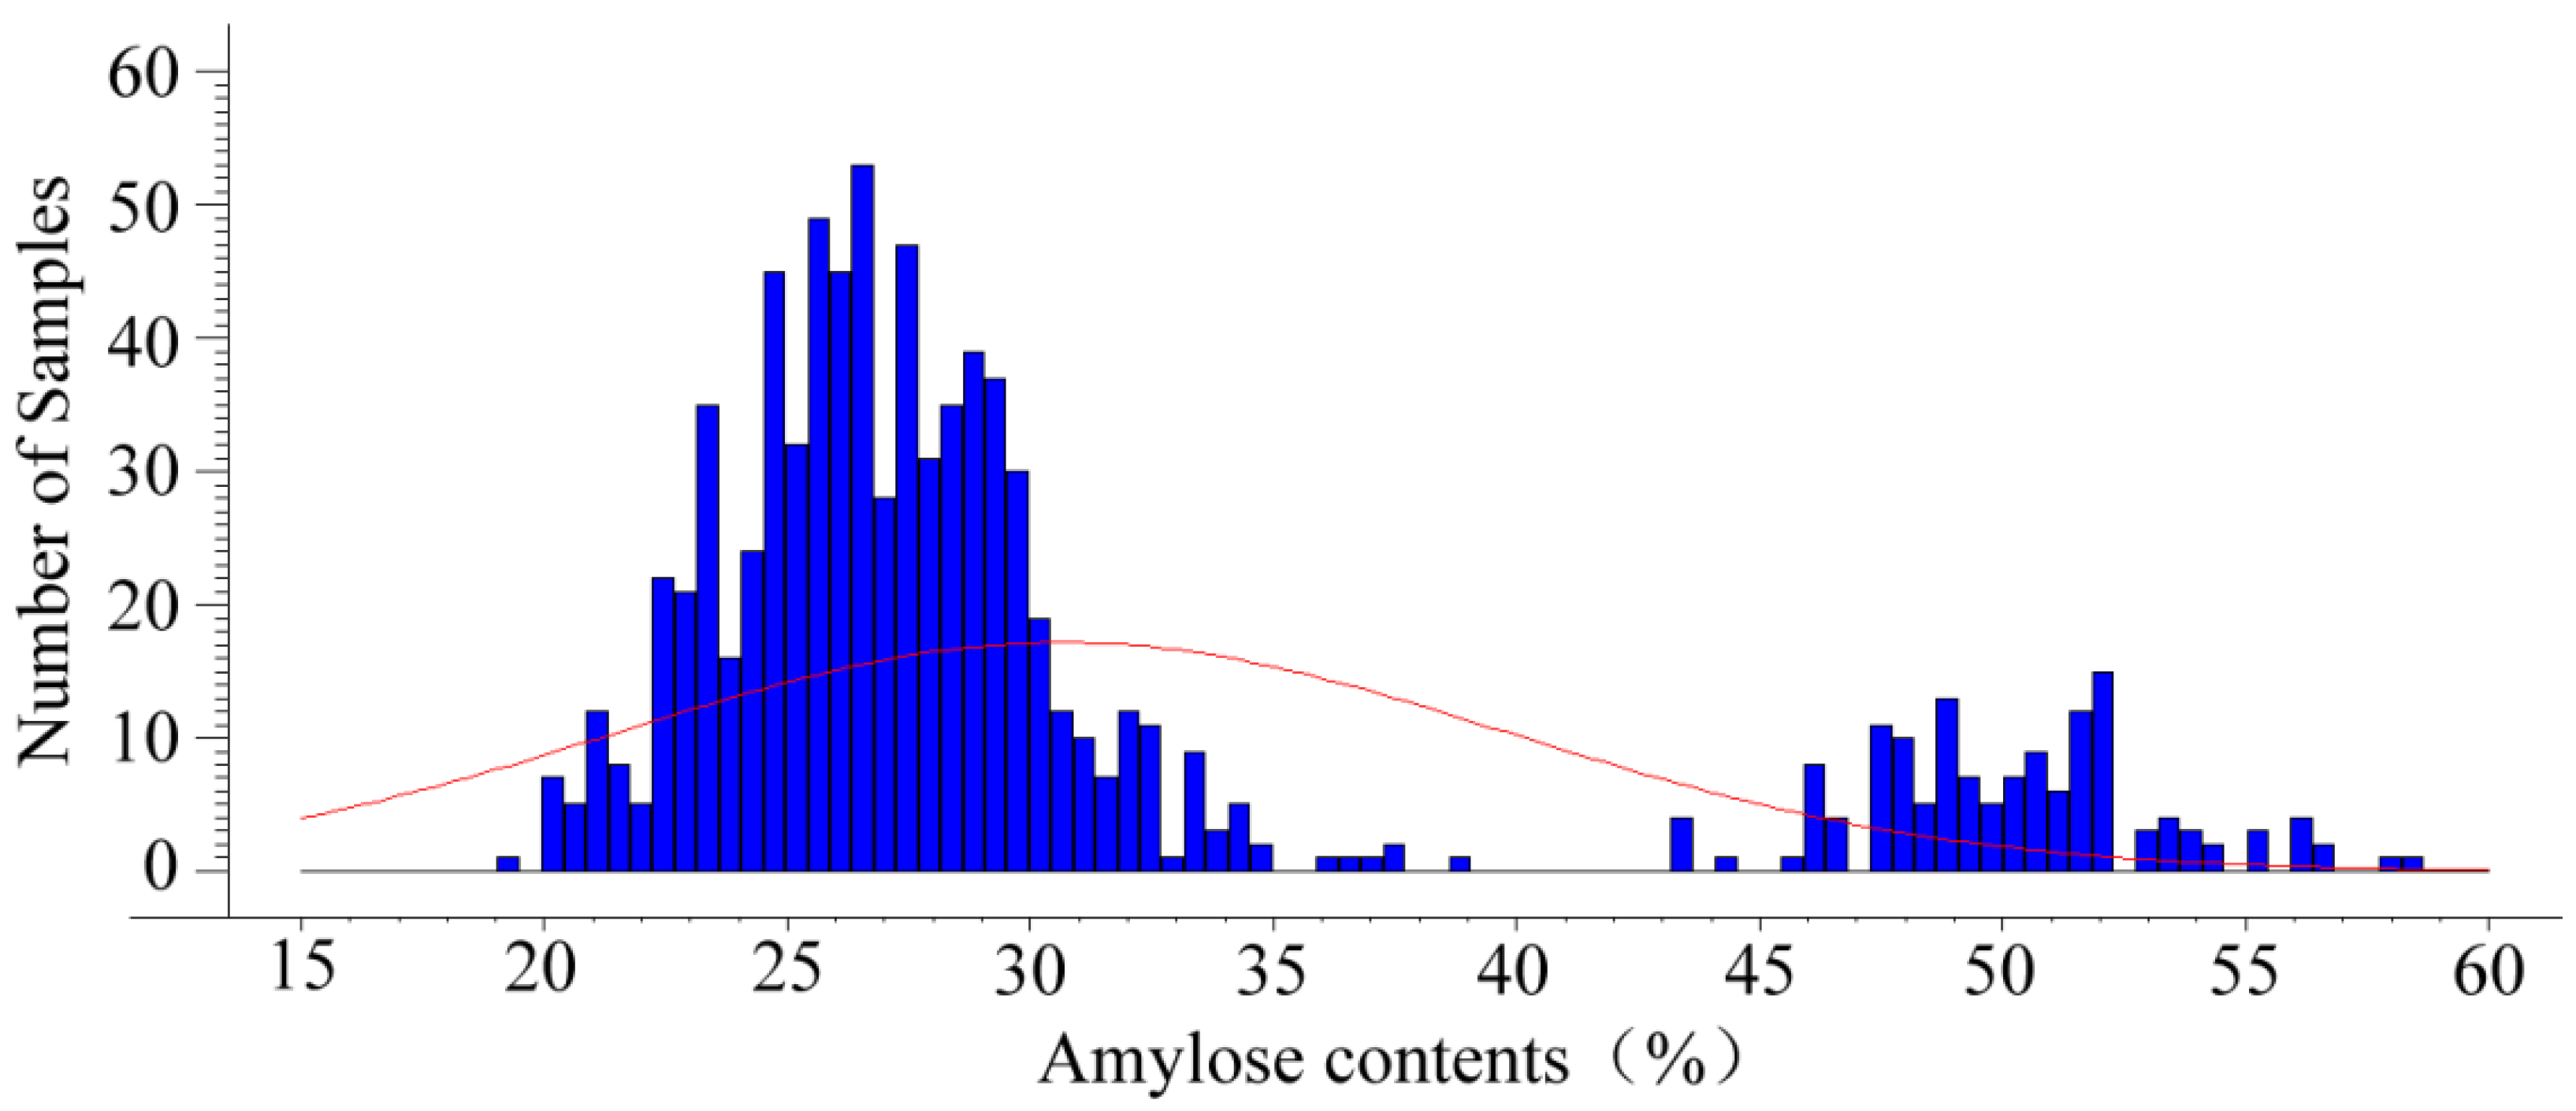
The parameter values of the calibration, validation and prediction are shown in Table 1. The set of 865 seeds was used as calibration set, the set of 204 seeds was used as validation set to verify the reliability of the models and the 150 seeds were assigned to the prediction set. The data were well suited for NIR spectral analysis as the difference between the calibration and validation set was very minor in terms of means and SDs. The distribution of amylose contents in the samples set of single kernels is shown in Figure 1. The wide range of amylose content from 19.05 to 58.68%. These findings suggest that the samples used in this study represent a high degree of diversity in maize samples. The contents of amylose were centralized distribution at range of 22–35% and 46–52% in the sample set, but there were obviously one or two blank distributions observed due to the limitation of nature sample number and varieties of maize. The three sets had similar ranges and variations in amylose content regardless of whether the component values were expressed as relative components in maize kernels, indicating that these data exhibit enough variation in rapid screening of high amylose ones from conventional maize varieties.
3.2. Selection of the Optimal Spectral Preprocessing Method
NIR spectra can clearly reveal the internal kernel composition of maize [12,18]. The use of suitable pretreatment to optimize the spectral data substantially improved the efficiency of this technique. All individual maize samples produced different spectra, with a sharp upward slope observed from 1400 to 1450 nm and a peak in the S–G first derivative at slightly longer wavelengths (Figure 2). These results indicated that these samples have high genetic variation and diverse chemical characteristics of the sample matrix.
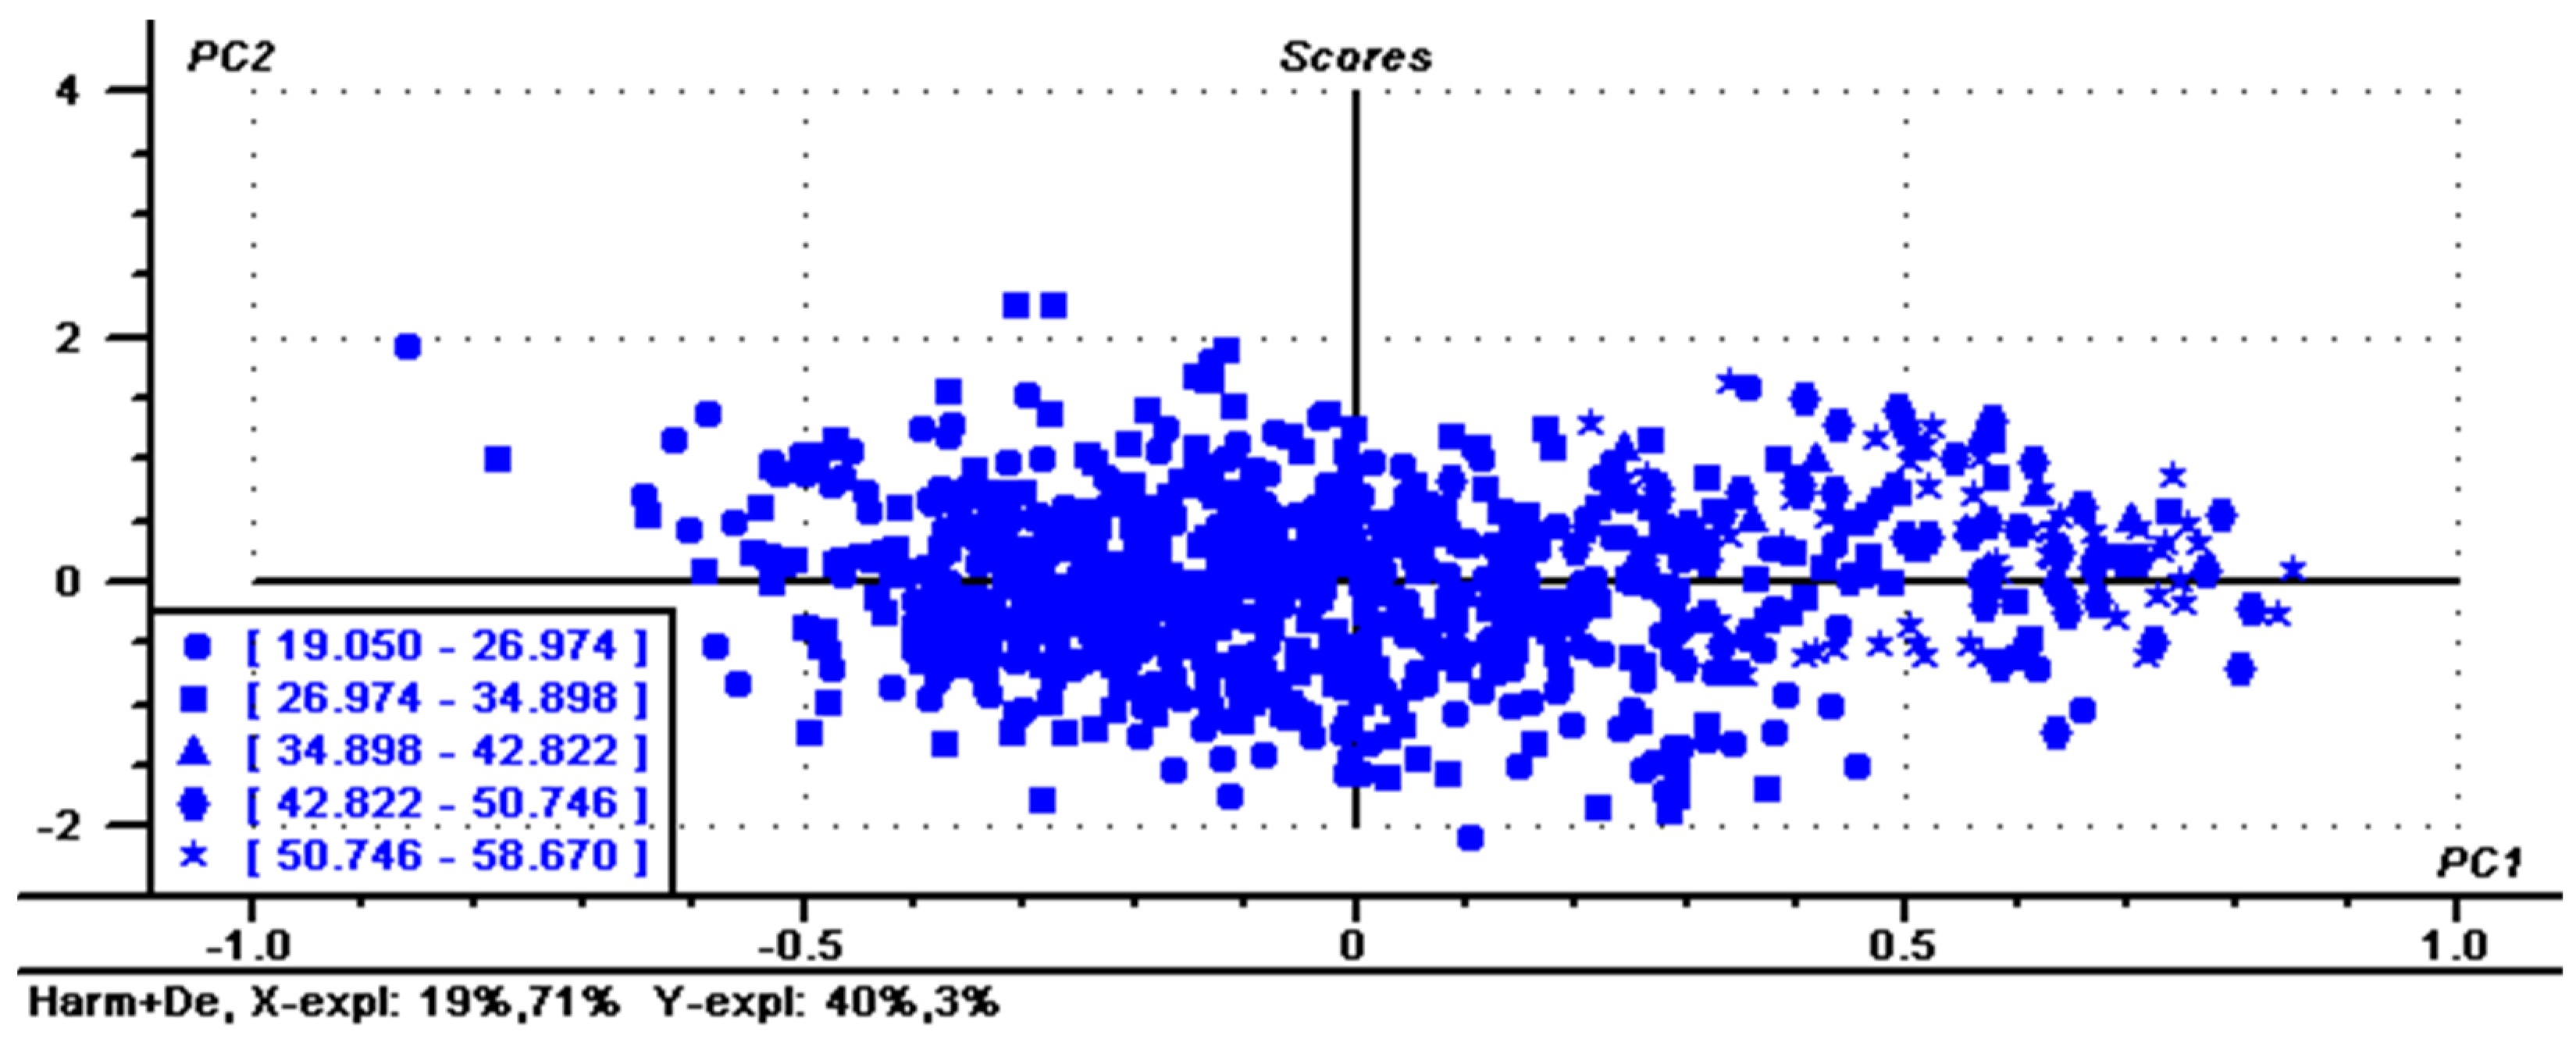
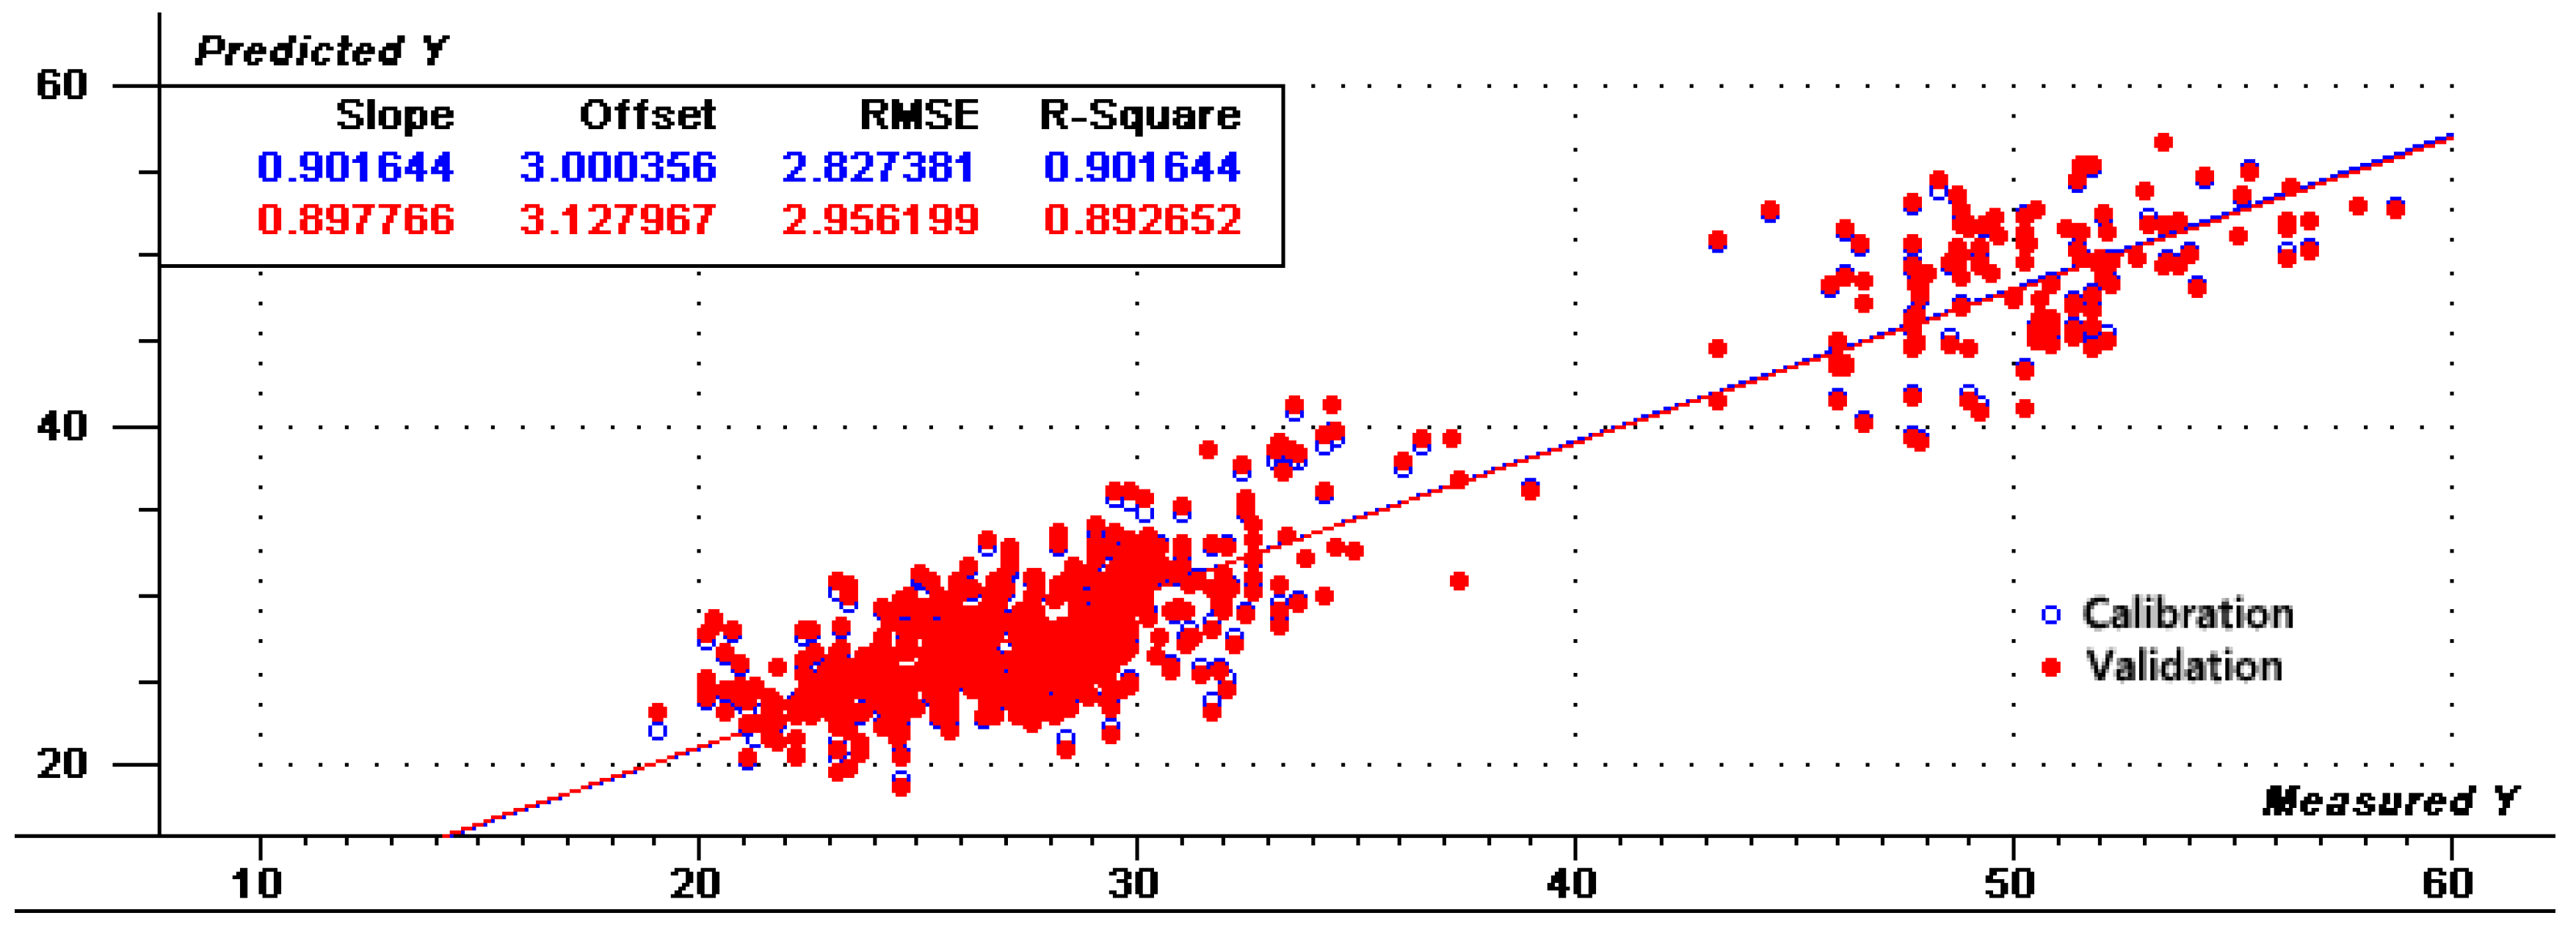
To reduce the parallel shift, several calibrations were used based on the PLS regression methods. Table 2 shows statistical values of the calibration based on various factors with different spectral pretreatments including normalization, smoothing, MSC, SNV, Deratives, first + S–G and Harmonization. After each treatment, some samples with large spectral differences were removed at a rate of no more than 10% during regression analysis. Mathematical pretreatment is typically used to eliminate scattering and particle size effects to eliminate independent chemical information and to extract meaningful information only from the collected spectrum [28]. For calibration, lower RMSEC and higher R2 are considered better and more accurate. Of the seven processing methods examined, Harmonization pretreatment produced the best calibration and cross-validation parameters produced the best results based on R2 values of 0.902, RMSEC and RMSEV values of 2.833 and 2.948, respectively. Figure 3 shows the PCA results of Harmonization determination, revealing that PC2 and PC1 provide a separation of the samples according to the amylose content. Figure 4 and Figure 5 show the regression for predicted versus measured values for amylose content and coefficients of regression for the optimal calibration, respectively. The R2 values of calibration and validation sets were 0.902 and 0.893, respectively. The RMSE values of calibration and validation sets were 2.827 and 2.956, respectively. R2 and RMSE values of calibration sets and validation sets were very close, indicating that the prediction data of this model were relatively accurate and stable after Harmonization processing. The results indicate that the pretreatment of Harmonization for amylose content is suitable to be used for research application and sample screening for breeding.
3.3. Calibration and Validation Models
To evaluate the stability of PLS using the Harmonization model, we randomly selected 150 single maize kernels for the external validation sets. The ranges of amylose content were divided into three parts by chemistry analyses, including 20–30, 31–45 and 46–60%. The results shown in Table 3 indicate that the external validation sets are nuanced and not all external validation results are determined accurately. The RMSEP values should be as low as possible, and the r2 and RPD values should be as high as possible [29]. RPD values above five are considered sufficient for quality control, and RPD values above 2.5 are considered sufficient for analysis [30]. The 20–30% range had higher values for r2 of 0.892 and had lower values for RMSEP of 2.975, but had lower values for RPD of 3.086. The 31–45% range had higher values for RPD of 3.821, but had lower values for r2 of 0.782 and higher values for RMSEP of 3.636. The 46–60% range of the three values were at the intermediate level. Taken together, these values are taken into perspective; the 31–45% and 46–60% ranges exhibited lower accuracy than the 20–30% range, but the values were sufficient for quality assurance and research applications and for screening samples for breeding efforts.
4. Discussion
Single-seed spectroscopy has accelerated the development of varieties by identifying seeds with specific qualities in isolated groups, and the method was used successfully for wheat, millet, corn and soybean by single-seed NIRS [19,21]. In this study, good calibration models of maize samples were successfully developed for amylose content of single-grain determination. The statistics of NIRS calibration and external validation for estimation of different amylose content of single grains were useful for screening in maize. The accuracy of the model depends largely on the accuracy of chemical determination and the representativeness of calibration samples. The accuracy of the model is determined by the results of chemical determination, and the suitability of the model is determined by the representativeness or distribution of samples. In our study, the varieties of maize samples selected are rich, numerous, sample sources were extensive. the determination of amylose content involved a wide range, ranging from 19.05 to 58.68%, almost covering the conventional maize grain amylose content category (Table 1). The samples have high genetic variation and diverse matrix chemical characteristics, and the spectral have a sharper upward slope in absorbance between 1400 to 1450 nm (Figure 1), of which a similar result has been reported in maize of single seeds [12].
High correlation coefficient and low standard error are necessary for a reliable calibration model. The regressions were evaluated by comparing R2, RMSEC and RMSEV. The preprocessing of spectral data was an important means to eliminate system errors caused by various factors in complete or in part [28]. Among these methods, the R2 values of SNV and Harmonization reached 0.9 or above, in particular, the R2 values, RMSEC and RMSEV values of Harmonization were optimal compared with other treatments (Table 2). Harmonization Pretreatment was invented by David Honigs, chief scientist at Perten Instruments. Honigs Regression indicated that when a new sample is analyzed, its spectrum is compared to a spectral library and the analysis result is calculated using the samples which look the most like the new sample. As can be seen from Figure 4, after Harmonization preprocess, the values of the calibration and validation sets are relatively close, indicating that the model has better stability.
NIRS, as an indirect measurement technique, is influenced by some factors, mainly sample representation and chemical analysis error. The chemical determination method of maize amylose is complicated, and the content of amylose is influenced by many factors. During the validation of the sample model, it was found that the external validation sets were nuanced and not all external validation results were determined accurately (Table 3). In addition, NIRS contains information about the chemical composition of all samples, but for complex mixtures, direct use of absorbance values to determine the results is relatively less accurate [31]. In our materials, the amylose contents tended to range from 20–30 and 46–60%. It can be seen from the experimental results that there is still a gap in the application of NIR transmission spectrum analysis method in the accurate determination of amylose content in maize, but the model developed in the current study will enable conventional maize and maize with higher amylose contents to be conveniently distinguished by NIR spectroscopy.
5. Conclusions
Our study demonstrated that amylose contents of single maize kernels can be predicted in intact maize using the Harmonization model. We showed that a calibration method developed from a mixed calibration set improved the prediction of amylose within a wide range. In conclusion, we verified that NIRS is a reliable, rapid method for predicting the amylose content in single maize kernels. This method is non-destructive and provides a convenient means for the breeders to choose appropriate offspring while decreasing the breeding scale and shortening the breeding period. However, we will enrich the model by adding maize varieties, especially the special samples in the future research.
Author Contributions
Writing—original draft preparation, Q.D.; methodology, Q.X.; data curation, J.W.; writing—editing, B.C.; conceptualization, H.J. All authors have read and agreed to the published version of the manuscript.
Funding
This research was funded by National Natural Science Foundation of China (31771805) and Disciplinary Construction Special Project of Anhui Academy of Agricultural Sciences (2021YL084).
Institutional Review Board Statement
Not applicable.
Informed Consent Statement
Not applicable.
Data Availability Statement
Not applicable.
Acknowledgments
The authors thank Chuanxiao Xie from the Institute of Crop Science, Chinese Academy of Agricultural Sciences, Qing Ma from the Key Lab of Crop Biotechnology of Anhui Province and the germplasm bank of the International Maize and Wheat Improvement Center (CIMMYT) for providing the maize samples for this work.
Conflicts of Interest
The authors declare no conflict of interest.
References
- Lai, J.S.; Li, R.Q.; Xu, X.; Jin, W.W.; Xu, M.L.; Zhao, H.N.; Xiang, Z.K.; Song, W.B.; Ying, K.; Zhang, M.; et al. Genome-wide patterns of genetic variation among elite maize inbred lines. Nat. Genet. 2010, 42, 1027–1030. [Google Scholar] [CrossRef] [PubMed]
- Gallant, D.J.; Bouchet, B.; Baldwin, P.M. Microscopy of starch: Evidence of a new level of granule organization. Carbohyd Polym. 1997, 32, 177–191. [Google Scholar] [CrossRef]
- Jiang, H.; Horner, H.T.; Pepper, T.M.; Blanco, M.; Campbell, M.; Jane, J. Formation of elongated starch granules in high-amylose maize. Carbohyd. Polym. 2010, 80, 533–538. [Google Scholar] [CrossRef] [Green Version]
- Chandra, R.; Rustgi, R. Biodegradable polymers. Prog. Polym. Sci. 1998, 23, 1273–1335. [Google Scholar] [CrossRef]
- Kasirajan, S.; Ngouajio, M. Polyethylene and biodegradable mulches for agricultural applications: A review. Agron. Sustain. Dev. 2012, 32, 501–529. [Google Scholar] [CrossRef]
- Gillon, D.; Houssard, C.; Joffre, R. Using near-infrared reflectance spectroscopy to predict carbon, nitrogen and phosphorus content in heterogeneous plant material. Oecologia 1999, 118, 173–182. [Google Scholar] [CrossRef]
- Fonseca, C.; Pessoa, M.; Braga, G.J.; Ramos, A.K.B.; Garcia, A.C.C. Near-infrared reflectance spectroscopy as a tool for breeding Andropogon gayanus Kunth for forage quality. Agric. Vet. Sci. 2020, 13, 57–66. [Google Scholar]
- Jimaré Benito, M.T.; Ojeda, C.B.; Rojas, F.S. Process analytical chemistry: Applications of near infrared spectrometry in environmental and food analysis: An overview. Appl. Spectrosc. Rev. 2008, 43, 452–484. [Google Scholar] [CrossRef]
- Dunmire, K.M.; Dhakal, J.; Stringfellow, K.; Stark, C.R.; Paulk, C.B. Evaluating soybean meal quality using near-infrared reflectance spectroscopy. Kans. Agric. Exp. Stn. Res. Rep. 2019, 5, 34. [Google Scholar] [CrossRef] [Green Version]
- Mazabel, J.; Worthington, M.; Castiblanco, V.; Peters, M.; Arango, J. Using near infrared reflectance spectroscopy for estimating nutritional quality of Brachiaria humidicola in breeding selections. Agrosyst. Geosci. Environ. 2020, 3, e20070. [Google Scholar] [CrossRef]
- Zaukuu, J.L.; Bodor, Z.; Vitalis, F.; Zsom-Muha, V.; Kovacs, Z. Near infrared spectroscopy as a rapid method for detecting paprika powder adulteration with corn flour. Acta Period. Technol. 2019, 50, 346–352. [Google Scholar] [CrossRef] [Green Version]
- Baye, T.M.; Pearson, T.C.; Settles, A.M. Development of a calibration to predict maize seed composition using single kernel near infrared spectroscopy. J. Cereal Sci. 2006, 43, 236–243. [Google Scholar] [CrossRef]
- Towett, E.K.; Alex, M.; Shepherd, K.D.; Polreich, S.; Aynekulu, E.; Maass, B.L. Applicability of near-infrared reflectance spectroscopy (NIRS) for determination of crude protein content in cowpea (Vigna unguiculata) leaves. Food Sci. Nutr. 2013, 1, 45–53. [Google Scholar] [CrossRef] [PubMed] [Green Version]
- Pohl, F.; Senn, T. A Rapid and sensitive method for the evaluation of cereal grains in bioethanol production using near infrared reflectance spectroscopy. Bioresour. Technol. 2011, 102, 2834–2841. [Google Scholar] [CrossRef]
- Lu, G.; Huang, H.; Zhang, D. Prediction of sweet potato starch physiochemical quality and pasting properties using near-infrared reflectance spectroscopy. Food Chem. 2006, 94, 632–639. [Google Scholar] [CrossRef]
- Delwiche, S.R.; Graybosch, R.A.; Amand, P.S.; Bai, G. Starch waxiness in hexaploid wheat (Triticum aestivum L.) by NIR reflectance spectroscopy. J. Cereal Sci. 2011, 59, 4002–4008. [Google Scholar] [CrossRef] [PubMed]
- Zheng, S.Y.; Wei, Z.S.; Li, S.J.; Liu, D.L. Near-infrared reflectance spectroscopy-based fast versicolor in a detection in maize for early aflatoxin warning and safety sorting. Food Chem. 2020, 332, 127419. [Google Scholar] [CrossRef] [PubMed]
- Whitt, S.R.; Wilson, L.M.; Tenaillon, M.I.; Gaut, B.S.; Buckler, E.S. Genetic diversity and selection in the maize starch pathway. Proc. Natl. Acad. Sci. USA 2002, 99, 12959–12962. [Google Scholar] [CrossRef] [Green Version]
- Dowell, F.E.; Pearson, T.C.; Maghirang, E.B.; Xie, F.; Wicklow, D.T. Reflectance and transmittance spectroscopy applied to detecting fumonisin in single corn kernels infected with Fusarium verticillioides. Cereal Chem. 2002, 79, 222–226. [Google Scholar] [CrossRef] [Green Version]
- Spielbauer, G.; Armstrong, P.; Baier, J.W.; Allen, W.B.; Richardson, K.; Shen, B.; Settles, A.M. High-throughput near-infrared reflectance spectroscopy for predicting quantitative and qualitative composition phenotypes of individual maize kernels. Cereal Chem. 2009, 86, 556–564. [Google Scholar] [CrossRef]
- Armstrong, P.R.; Tallada, J.G.; Hurburgh, C.R., Jr.; Hildebrand, D.F.; Specht, J.E. Development of single-seed near-infrared spectroscopic predictions of corn and soybean constituents using bulk reference values and mean spectra. Trans. ASABE 2011, 54, 1529. [Google Scholar] [CrossRef]
- Barnes, R.J.; Dhanoa, M.S.; Lister, S.J. Standard normal variate transformation and de-trending of near-infrared diffuse reflectance spectra. Appl. Spectrosc. 1989, 43, 772–777. [Google Scholar] [CrossRef]
- Savitzky, A.; Golay, M.J. Smoothing and differentiation of data by simplified least squares procedures. Anal. Chem. 1964, 36, 1627–1639. [Google Scholar] [CrossRef]
- Ghasemi, J.; Niazi, A. Simultaneous determination of cobalt and nickel. Comparison of prediction ability of PCR and PLS using original, first and second derivative spectra. Microchem. J. 2001, 68, 1–11. [Google Scholar] [CrossRef]
- Williams, P.C.; Sobering, D.C. Comparison of commercial near infrared transmittance and reflectance instruments for analysis of whole grains and seeds. J. Near Infrared Spectrosc. 1993, 1, 25–32. [Google Scholar] [CrossRef]
- Townsend, P.A.; Singh, A.; Foster, J.R.; Rehberg, N.J.; Kingdon, C.C.; Eshleman, K.N.; Seagle, S.W. A general Landsat model to predict canopy defoliation in broadleaf deciduous forests. Remote Sens. Environ. 2012, 119, 255–265. [Google Scholar] [CrossRef]
- Wu, J.G.; Shi, C.; Zhang, X. Estimating the amino acid composition in milled rice by near-infrared reflectance spectroscopy. Field Crops Res. 2002, 75, 1–7. [Google Scholar] [CrossRef]
- Tripathi, S.; Mishra, S.T. A rapid FT-NIR method for estimation of aflatoxin B1 in red chili powder. Food Control. 2009, 20, 840–846. [Google Scholar] [CrossRef]
- Galvez-Sola, L.; Moral, R.; Perez-Murcia, M.; Perez-Espinosa, A.; Bustarmante, M.A.; Martinez-Sabater, E.; Paredes, C. The potential of near infrared reflectance spectroscopy (NIRS) for the estimation of agroindustrial compost quality. Sci. Total Environ. 2010, 408, 1414–1421. [Google Scholar] [CrossRef]
- Sinnaeve, G.; Dardenne, P.; Agneessens, R.; Biston, R. The use of near infrared spectroscopy for the analysis of fresh grass silage. J. Near Infrared Spectrosc. 1994, 2, 79–84. [Google Scholar] [CrossRef]
- Williams, P.; Norris, K. Near-Infrared Technology in the Agricultural and Food Industries, 2nd ed.; American Association of Cereal Chemists Inc.: St. Paul, MN, USA, 2001. [Google Scholar]
Figure 1.
Distribution of amylose contents in single maize kernels (N = 865) determined through chemical analysis method.
Figure 1.
Distribution of amylose contents in single maize kernels (N = 865) determined through chemical analysis method.

Figure 2.
Analysis of single maize kernels by NIR spectral analysis. Example of the direct NIR spectra (A); raw NIR spectrum data treated by SNV and SG first derivative (B). The horizontal axis shows the wavelength and the vertical axis shows the reflectance (log [1/R]).
Figure 2.
Analysis of single maize kernels by NIR spectral analysis. Example of the direct NIR spectra (A); raw NIR spectrum data treated by SNV and SG first derivative (B). The horizontal axis shows the wavelength and the vertical axis shows the reflectance (log [1/R]).

Figure 3.
Principal Component Analysis score plot of single maize kernel data. Harm + De, Harmonization determination. The numerical values are the amylose content of the sample, and each shape represents a range of amylose content.
Figure 3.
Principal Component Analysis score plot of single maize kernel data. Harm + De, Harmonization determination. The numerical values are the amylose content of the sample, and each shape represents a range of amylose content.

Figure 4.
Scatter plots analytically determine and predict values for PLS1 models by Harmonization differential mathematical treatments.
Figure 4.
Scatter plots analytically determine and predict values for PLS1 models by Harmonization differential mathematical treatments.

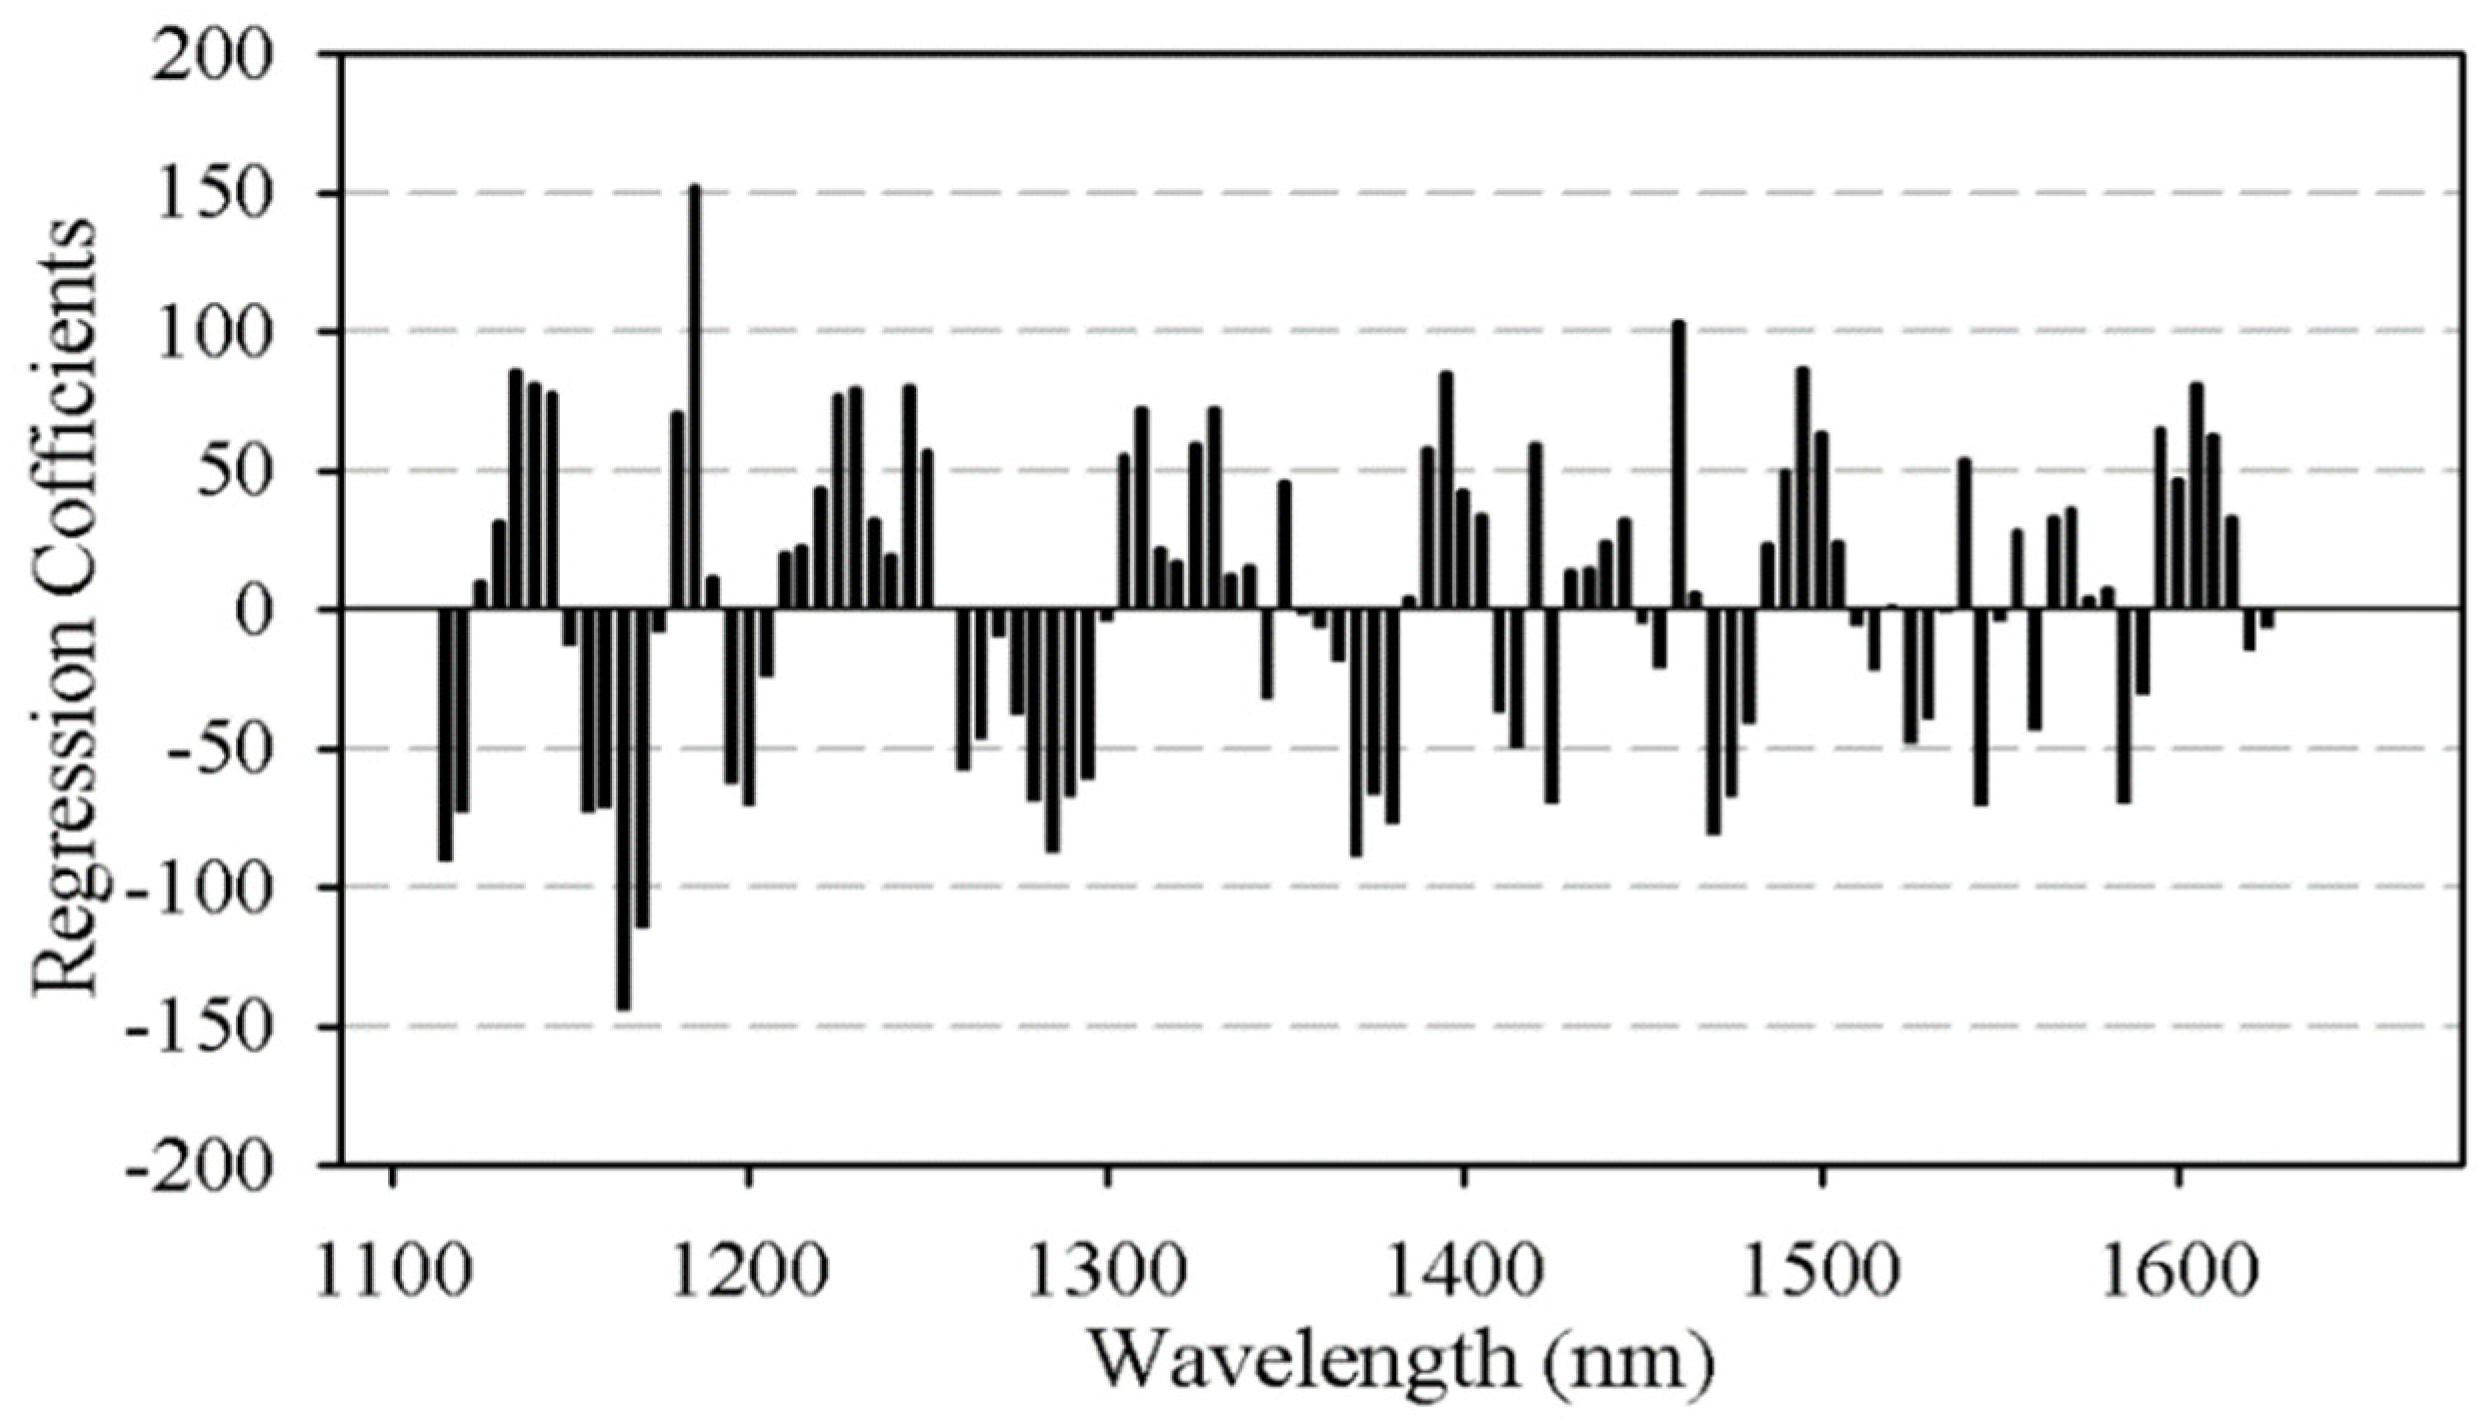
Figure 5.
Plotted the regression coefficient of the optimal calibration in single maize amylose content determination.
Figure 5.
Plotted the regression coefficient of the optimal calibration in single maize amylose content determination.


Table 1.
Sample parameter values of amylose content used in calibration, validation and external validation derived from chemical measurements.
Table 1.
Sample parameter values of amylose content used in calibration, validation and external validation derived from chemical measurements.
| N | Min% ± SE | Max% ± SE | Mean | SD | |
|---|---|---|---|---|---|
| Calibration | 865 | 19.05 ± 1.62 | 58.68 ± 2.11 | 30.65 | 9.15 |
| Validation | 204 | 21.36 ± 1.03 | 57.75 ± 1.43 | 32.46 | 8.87 |
| External validation | 150 | 20.95 ± 1.58 | 57.55 ± 1.93 | 32.33 | 8.64 |
SD, standard deviation; N, number of samples; SE, standard error.
Table 2.
Results of amylose content determination in single maize kernels based on various factors with different spectral pretreatments by PLS models calibration.
Table 2.
Results of amylose content determination in single maize kernels based on various factors with different spectral pretreatments by PLS models calibration.
| Treatment | Smoothing Point | N | R2 | RMSEC | RMSEV |
|---|---|---|---|---|---|
| None | - | 865 | 0.868 | 3.330 | 3.486 |
| Normalize | - | 856 | 0.874 | 3.225 | 3.352 |
| SNV | - | 855 | 0.900 | 2.901 | 3.108 |
| MSC | 852 | 0.890 | 3.020 | 3.205 | |
| Derivatives | 3 | 852 | 0.881 | 3.132 | 3.231 |
| 1st + S–G | 5 | 852 | 0.883 | 3.042 | 3.194 |
| Smooth | 7 | 848 | 0.871 | 3.224 | 3.406 |
| Harmonization | - | 853 | 0.902 | 2.833 | 2.948 |
R2, coefficient of determination for calibration; N, number of samples; SNV, standard normal variate; MSC, multiplicative scattering correction; 1st + S–G, first derivatives + Savitzky–Golay smooth; RMSEC, root mean square error of calibration; RMSEV, root mean square error of validation.
Table 3.
External validation statistics in NIRS equations for determining amylose content in single maize seed.
Table 3.
External validation statistics in NIRS equations for determining amylose content in single maize seed.
| Range (%) | External Validation | |||||||
|---|---|---|---|---|---|---|---|---|
| N | Mean | SD | r2 | Slope | RMSEP | Bias | RPD | |
| 20~30 | 50 | 24.56 | 6.53 | 0.892 | 0.900 | 2.975 | 0.008 | 3.086 |
| 31~45 | 50 | 36.64 | 4.34 | 0.782 | 0.786 | 3.636 | −0.056 | 3.821 |
| 46~60 | 50 | 53.24 | 4.59 | 0.855 | 0.883 | 3.115 | 0.026 | 3.284 |
SD, standard deviation; r2, coefficient of determination for validation; RMSEP, root mean square error of the prediction; RPD, ratio of the standard deviation to SEP; Bias, mean difference between the predicted and measured value of validation samples; N, number of samples.
Publisher’s Note: MDPI stays neutral with regard to jurisdictional claims in published maps and institutional affiliations. |
© 2021 by the authors. Licensee MDPI, Basel, Switzerland. This article is an open access article distributed under the terms and conditions of the Creative Commons Attribution (CC BY) license (https://creativecommons.org/licenses/by/4.0/).
Share and Cite
MDPI and ACS Style
Dong, Q.; Xu, Q.; Wu, J.; Cheng, B.; Jiang, H. Applicability of Near Infrared Reflectance Spectroscopy to Predict Amylose Contents of Single-Grain Maize. Agronomy 2021, 11, 2463. https://doi.org/10.3390/agronomy11122463
AMA Style
Dong Q, Xu Q, Wu J, Cheng B, Jiang H. Applicability of Near Infrared Reflectance Spectroscopy to Predict Amylose Contents of Single-Grain Maize. Agronomy. 2021; 11(12):2463. https://doi.org/10.3390/agronomy11122463
Chicago/Turabian StyleDong, Qing, Qianqian Xu, Jiandong Wu, Beijiu Cheng, and Haiyang Jiang. 2021. "Applicability of Near Infrared Reflectance Spectroscopy to Predict Amylose Contents of Single-Grain Maize" Agronomy 11, no. 12: 2463. https://doi.org/10.3390/agronomy11122463
Note that from the first issue of 2016, this journal uses article numbers instead of page numbers. See further details here.