
Phosphorus Flows, Surpluses, and N/P Agronomic Balancing When Using Manure from Pig and Poultry Farms


Stockholm Environment Institute (SEI), Linnégatan 87D, P.O. Box 24218, 104 51 Stockholm, Sweden
*
Author to whom correspondence should be addressed.
Agronomy 2021, 11(11), 2228; https://doi.org/10.3390/agronomy11112228
Submission received: 25 August 2021
/
Revised: 14 October 2021
/
Accepted: 26 October 2021
/
Published: 3 November 2021
(This article belongs to the Special Issue Managing Nutrient Balances in Agriculture - Agronomy, Animal Manure and the Circularity of Nitrogen and Phosphorus)
Abstract
:The pig and poultry industries continue to grow across the world and together they provide the majority of meat consumed. The European Union (EU) in particular has the highest global relative meat production by monogastrics (i.e., pig and poultry). The fate of phosphorus (P) in pig and poultry farming was studied, accounting for P content in feed, animals, manure, soil, and runoff. P input from manure, and P offtake in crops receiving manure, were plotted against each other to arrive at “safe” P loading rates, in order to minimize soil P surpluses along the lines of the EU Nitrogen Expert Panel in their work with nitrogen (N). However, it was observed that it is the N/P ratio and the background soil P levels that determine whether a certain manure will end up producing surplus levels of soil P. Critical N/P weight ratios were derived over different crop P offtake rates when applying stored manure to croplands. At spreading rates of 170 and 250 kgN/ha/year and a crop P offtake of 15 or 30 kgP/ha/year, stored pig and chicken manure result in soil P surpluses. An important factor in determining effective N/P ratios is the plant availability of N in stored manure, which runs at around 47%, estimated from previously published results. The minimization of N losses to the atmosphere and to groundwater in housing, storage, and spreading of manure has a major impact on the N/P weight ratio of the manure that ends up on fields. In most cases, half of the ex-animal N content has been lost in stored or degraded manure, with N/P weight ratios running at two and less. Following only the EU Nitrates Directive, which allows for a maximum of 170 kgN/ha/year in NVZs (Nitrate Vulnerable Zones), will often result in soil P surpluses leading to runoff losses to adjacent water bodies. Therefore, for the pig and poultry industries to continue thriving, measures are required to better manage manure, including improved storage and spreading techniques, acidification, separation, struvite extraction and ammonia stripping of pig slurry, and drying and pelleting of poultry litter. This way, excess manure and derived biofertilizers from animal farms can find their way back into the commercial market, instead of ending up as legacy P in watersheds and coastal zones.
1. Introduction
1.1. Pig and Poultry Farming in the European Union
Pig and poultry (mainly chicken) have become the mainstay source of meat protein within the world and the European Union (EU) over the past 60 years (Meat production by livestock type—EU, 1961–2018 (https://ourworldindata.org/grapher/global-meat-production-by-livestock-type (accessed on 24 October 2021)). Of the almost 50 million annual tons of consumed meat in the EU (2018), 15 million tons were from poultry (https://ec.europa.eu/eurostat/web/products-eurostat-news/-/DDN-20190325-1 (accessed on 24 October 2021)), (82% broiler chickens) (https://ec.europa.eu/info/sites/default/files/food-farming-fisheries/farming/documents/poultry-meat-dashboard_en.pdf (accessed on 24 October 2021)), and 24 million tons were from pigs (https://ec.europa.eu/eurostat/statistics-explained/index.php?title=Agricultural_production_-_livestock_and_meat&oldid=427096#Pig_meat (accessed on 24 October 2021)), which is the largest source of meat protein in the EU. Within EU-27 in 2019 (EUROSTAT, 2019 (http://appsso.eurostat.ec.europa.eu/nui/show.do?dataset=apro_mt_pann (accessed on 24 October 2021)) there were 247.5 million slaughtered pigs, 7 billion slaughtered poultry, and 366 million egg-laying chickens (https://ec.europa.eu/info/sites/info/files/food-farming-fisheries/farming/documents/eggs-dashboard_en.pdf (accessed on 24 October 2021)) producing 6.9 million tons of eggs/year.
The density of pig and broiler farms varies across the EU (Figure 1). The major pig production zone extends from Germany (Nordhein-Westfalen and Niedersachen) to Belgium (Vlaams Gewest) and accounts for 30% of EU sows; however, there are other important regions, such as Catalonia and Murcia (Spain), Lombardia (Italy), Bretagne (France), and some areas of central Poland and Northern Croatia [1]. The hotspots within the EU that are receiving attention for P overloading from poultry farming are Germany, Poland, UK, France, Spain, and Italy; for pigs, the hotspots are Spain, Germany, France, Netherlands, Poland, Denmark, and Italy [2,3].
Almost three-quarters of the EU pig production (www.europarl.europa.eu/RegData/etudes/BRIE/2020/652044/EPRS_BRI(2020)652044_EN.pdf (accessed on 24 October 2021)) was concentrated in six countries, namely: Spain (21%), Germany (18%), France (9%), Denmark (9%), the Netherlands (8%), and Poland (7%). For poultry (https://ec.europa.eu/eurostat/web/products-eurostat-news/-/DDN-20190325-1 (accessed on 24 October 2021)), three-quarters of the EU production was concentrated in seven countries, namely: Poland (17%), the UK (13%), France (11%), Spain (11%), Germany (10%), Italy (9%), and Hungary (4%). The overall environmental impacts of livestock [4] include biodiversity loss, land degradation, increased water use, and impacts emanating from manure (i.e., ammonia and greenhouse gas emissions and nutrient losses to groundwater and surface water leading to eutrophication). Indeed, the sector is growing in size and significance and urgently requires cross-cutting policy interventions in order to better meet environmental limitations, while providing the protein requirements of the world’s growing human population.
1.2. Objectives of the Paper and Central Research Questions
The objective of this work is to review and assess the fate of phosphorus in intensive pig and poultry farms within the EU, from feed to manure production and its reuse, to soil and runoff. The work is based on extracting data from literature sources and applying some simple mass balance, efficiency calculations, and associated calculations regarding optimal and environment-friendly uses of manure. The work draws attention to phosphorus (P) content in relation to nitrogen (N) content when manure is used as a fertilizer and soil amendment. It emphasizes the importance of balancing the N/P content of manure input against crop offtake potential in order to minimize soil nutrient surpluses and eventual losses to runoff. It also points out the central importance of manure N losses through housing, storage, and spreading in determining surplus P. Implications for EU policies such as the Nitrates Directive (https://eur-lex.europa.eu/legal-content/EN/TXT/PDF/?uri=CELEX:01991L0676-20081211&from=EN; https://ec.europa.eu/environment/water/water-nitrates/index_en.html (accessed on 24 October 2021)) and the Farm to Fork Strategy (https://ec.europa.eu/food/farm2fork_en (accessed on 24 October 2021)) are also assessed.
This article includes an overview of relevant literature on the following: limited P efficiency in pig and poultry (monogastric animals); P surpluses from the reuse of pig and poultry manure as fertilizer; P mass balance calculations from typical pig and poultry farms; calculation of manure N/P ratios and their influence on surplus P; an overall systems “mind-map” of P flows and efficiencies of the feed–animal–manure pig and poultry system; and finally, a discussion surrounding the limitations of current legislation when it comes to integrating N and P management with the example of the Baltic Sea, which is particularly sensitive to surplus P.
1.3. Monogastrics Are P-Inefficient in Digesting Feed
Pigs and poultry are monogastrics that lack the digestive enzymes to degrade phytate, the main plant storage form of phosphate. This means they are particularly inefficient in their use of P, so P feed supplements are required to achieve profitable growth rates. Compared with cattle, which are ruminants that digest phytate more efficiently, pigs and poultry produce higher relative levels of P in their manure. Typical manure P levels are: dairy 7 g P/kg, poultry 14 g P/kg, and pig 32 g P/kg dry manure [5]. Indeed, there is a need to increase the efficiency of P management in pig and poultry farms [6,7,8]. This can be accomplished by optimizing feed regimes, adding phytase to feed [9], reducing phytate levels in feed grain, optimizing P utilization through animal genetics and gut microbiota [10], optimizing farm P-management practices and reuse, manure management, and runoff control [7].
Poultry accounts for approximately 50% of animal feed phosphate consumption worldwide [11]. Cereal grains dominate the content of monogastric feed formulations, and these are characteristically low in Ca and high in P and most of this P is in the form of phytate with poor digestibility. Poultry feed formulations have improved by shifting to all plant material—including high available P feed or low phytate feed—and by adding phytase to increase P-phytate bioavailability [12]. Moreover, there is a better understanding of Ca and P metabolism through endocrine and vitamin D regulation [13]. With all these positive developments, inorganic P feed supplements have decreased but P levels in feed still remain excessive, resulting in unnecessarily high levels of P, especially in poultry manure and litter [14]. It should also be remembered that there are attempts to increase N use efficiency and reduce manure ammonia N losses through modification of feed—especially for poultry. Amino acids and crude protein digestion can reduce N excretion by up to 40%, with a 25% increase in N digestion using enzyme supplements [15]. The proportion of monogastrics among total livestock is higher in the EU than any other region of the world (ca 50% of the livestock units (LSUs) per continent). This has continued to increase by 10% over the past 50 years, making pig and poultry nutrient use efficiency a central question globally [16].
1.4. Manure Production, Storage, and Reuse—Impacts on N and P Content
Within EU-27 countries, it is estimated that 1.4 to 1.8 billion tons of manure are produced by livestock animals (https://www.biooekonomie-bw.de/en/articles/news/what-to-do-with-manure (accessed on 24 October 2021)) [17,18]. This is composed of 58% from cattle, 30% from poultry, and 14% from pigs. The share of manure P production within EU-28 countries for different livestock is 52% for cattle, 20% for pigs, and 14% for poultry (https://ec.europa.eu/eurostat/statistics-explained/index.php?title=Archive:Agriculture_and_environment_-_pollution_risks&direction=next&oldid=336933#Further_Eurostat_information (accessed on 24 October 2021)). The relatively high stocking densities of pigs and poultry in particular produce surplus nutrient hotspots [1,19].
Application of animal manure on cropland is commonly based on the manure N content and N utilization needs of crops [20,21,22]. The amount of N added to soil through fertilizers and animal manure often exceeds the amount removed through animal and crop products and this is the same for P [23]. Long-term application of inorganic fertilizer or animal manure has been shown to result in elevated levels of P and even potassium (K) in many cropland areas adjacent to livestock facilities [24,25,26].
The accumulation of P in the soil has been shown to increase with increasing application rates of cattle feedlot manure [27], anaerobically digested poultry manure [28], poultry litter [29], and swine and poultry manure [30]. Animal manure contains P fractions that are not susceptible to adsorption by a calcium carbonate layer in the soil and would, thus, be more likely to leach deeper into the soil than inorganic fertilizer P [31]. As a result, farmers are being advised not to apply animal manure on soils with high P content [32], also alternating with N-fixing legumes and no added fertilizer every third year [33].
Manure is often stored (e.g., in outdoor tanks, concrete or earthen pits, and composts) in such a way that there are significant N losses via ammonification (production of NH3 gas), denitrification (production of N2 gas), and nitrification (production of NO3 ions) [34]. In particular, the storage of pig manure creates anaerobic conditions resulting in N losses of up to ca. 50% [35]; therefore, stored animal manure often has available N/P ratios running from around 2:1 to as low as 0.5:1. Since farmers apply manure based on the N requirements of crops and the N content of the manure, excessive P applications to soils have resulted [20,36,37]. This means that, for maize and wheat with N/P weight ratios of around 5–6:1 [21], P is sometimes applied in excess by 5–10 times the levels necessary for sustainable crop production. Most soils will be able to accumulate much of this oversupply for several years, but eventually erosion and runoff will lead to increased eutrophication of freshwater and brackish water, as well as of water in coastal zones [38]. Additionally, even more importantly, this represents a mammoth waste of the world’s finite commercial phosphate resources. P-enriched soil has therefore become a significant source of P loading to water bodies and has been labelled “legacy P” [39]. It can take decades for these high soil P levels to decrease to “normal” levels through soil P mining by crops [40,41].
What is required to achieve nutrient sustainability in agriculture is nutrient balancing at the farm level (https://lpelc.org/whole-farm-nutrient-balance/ (accessed on 24 October 2021)). By measuring the nutrient input (in imported feed, animals, and fertilizer) and output (in harvested crops, exported animals, and eggs), an overall nutrient balance for a farm can be calculated and expressed as the percentage of the nutrient fraction remaining per unit area or product. Any excess can lead to nutrient enrichment of the soil and eventually drainage/runoff losses. To reduce this overloading or surplus, manure needs to be spread over larger areas or transported to farms with nutrient deficits. Alternatively, animal densities need to be reduced and improvements in feed and manure management introduced [33]. Indeed, work in Denmark has estimated the varied added costs in transporting manure from P-sufficient to P-deficient areas to accommodate the excess P in dairy, pig, poultry, and mink manure [42].
1.5. Phosphorus Loading and Runoff
Intensification of livestock farming, concentration of animal production, and excessive application of manure in specific regions within the EU is a major part of the problem of P overloading. Indeed, the soil P levels indicate a preponderance for increased P levels in the central part of the EU (Figure 2). Within the EU, manure-based P additions to agricultural land are now (2018) larger than those from chemical fertilizer—1.6 compared to 1.1 megatons/year, respectively (https://ec.europa.eu/eurostat/statistics-explained/index.php/Agri-environmental_indicator_-_risk_of_pollution_by_phosphorus#Key_messages (accessed on 24 October 2021)). Several hotspots can be identified within the EU, where manure production is well beyond what can be used on local agricultural lands (e.g., UK, Netherlands, Belgium, Denmark, Germany, France (Brittany), and the Baltic Sea Region) [43,44]. Attention to improved management of the manure from farm animals will help lead the way to develop more sustainable practices; however, management of animal farms is only part of the story. The nutrient footprint from these farms extends to the feed farms, which can be on other continents. Some 30% of all arable land around the world is designated for growing feed crops [4].
Runoff contains water and particulate matter arising from soil erosion—this makes precipitation and soil quality important determining factors. Even though fertilizer use has dropped significantly within the EU over the past 30 years [46], legacy P in upper soil layers, originating from decades of manure application and fertilizer use, remains a major source. The Baltic Sea is particularly sensitive to P overloading and legacy P from the drainage basin and anoxic deep benthic zones [47]. Intensive seasonal blooms of cyanobacteria are triggered by the excess P. These “blue-green algae” are nitrogen fixers and import some 370,000 tons of N per year into the Baltic Sea, which is greater than the riverine input of 352,000 tons N [48]; thus, controlling P in runoff and drainage from animal farms will have significant impact on N input.
Although soil erosion is most often seen as the main source of runoff P, the other major factor that contributes to drainage losses to receiving waters is that croplands are drained (with so-called tile drainage) in order to improve root development and significantly increase yields of crops such as corn, soybeans, wheat, oats, and hay [49]. Tile drainage and ditching have major impacts on soluble N and P losses since the drainage water funnels directly into surface streams [50].
1.6. Managing Nitrogen in Manure Applications
Based on the EU Nitrates Directive priority to manage manure N additions to soil [51], an assessment was carried out by the EU Nitrogen Expert Panel in 2015 [52]. Using N use efficiency (NUE) to determine a desirable range for N crop output and soil surplus, the result provided a desirable minimum N output of 80 kgN/ha/year, and while keeping to between 50 and 90% NUE, the desirable maximum surplus was estimated to be 80 kgN/ha/year (Figure 3). The total of 160 kgN/ha/year is close to the Nitrates Directive stipulated loading rate maximum of 170 kgN/ha/year for NVZs (Nitrate Vulnerable Zones).
This work beckons the question as to whether a similar relationship can be erected for P. Indeed, methods of calculating agronomic P use efficiency (PUE) for crops have been put forward, based on balancing input against output (or crop offtake) [53,54]. In addition, this work questions whether one can calculate a “systems” PUE, also including animal digestion and retention of feed P (i.e., integrating both the agronomic and animal components). Here, factors such as metabolism, animal phase feeding, phytate content of feed grains, and phytase supplement additions to feed come into play [55]. Additional factors would even include fate of surplus soil P in terms of runoff erosion losses. Here, such factors as contour ploughing, buffer zones, sedimentation ponds, and constructed wetlands come into play; therefore, management of P spans the initial need for soil P measurements through to the use of P indices and farmgate balancing [56]. The EU still lacks clear regulations on agricultural P management which would complement the Nitrates Directive. National regulations have been drafted and implemented in several EU countries to deal with this gap [57,58]. Indeed, recent data from Northern Ireland, for example, indicate significant reductions in P surpluses over the past 15 years [59].
1.7. Critical Phosphorus Ranges for Safe Application of Manure
For any cropland, critical P levels can be derived from the amount of P in soil and the resulting crop yield. Adding more P to the soil than that required by the crop for optimal yield results in a surplus, which can eventually lead to losses from the cropland through runoff (Figure 4). This underlines the need to measure the available P levels in soil on a regular basis, in order to know whether the soil requires P additions from manure or fertilizer. The methods for determining the soluble reactive P (SRP) level in soil samples vary between countries and there are at least five different soil extraction methods used (Mehlich 3, ammonium lactate, double lactate, Olsen-P, and Morgan-P) [60]. This affects the estimates of the critical levels determining safe levels of surplus P and as a result, there is no agreement on a single fertilizer application or surplus level [61] similar to the Nitrates Directive. Guidelines for safe P balances also depend on soil type (adsorption capacity), the crop type and rotations (level of P in crop offtake), and the ability to reduce runoff. For soils already high in P (e.g., class IV > 8 mgP-AL/100 g soil) [62], additions of manure or fertilizer P are only advised if the crop can absorb the added P; for example, in the cases of sugar beet, potato, and maize, which have relatively high P requirements [63]. Because of these variables coming into play, farms should be carrying out soil P analyses and field balances (input minus offtake) to determine just what the surpluses are with the aim of keeping these as low as possible. Advisories on allowable rates of P fertilization exist for several countries (e.g., Germany, The Netherlands, N. Ireland (UK), Flanders, Sweden, Denmark, Slovenia, Estonia, Norway, and Finland). However, this is not the case in Austria, Czech Republic, Greece, Hungary, Italy, Lithuania, Latvia, Poland, Spain, and Switzerland, which all rely on an indirect regulation based on the Nitrates Directive.
2. Methods
2.1. Mass Balance of P for Typical Pig and Poultry Farms and Scenarios to Increase PUE and Reduce P Losses
Phosphorus mass balances for typical pig and poultry farms were constructed based on published data sources, which are provided in the results section. These intensive farms have feed as the source of nutrients and the main biproduct is manure, in the form of slurry or litter. A simple flow model was constructed based on the P levels in feed, the animals, manure, offtake in crops receiving manure, and excess remaining in soil eventually leading to runoff. The data were illustrated using Sankey diagrams (www.sankeyflowshow.com (accessed on 24 October 2021)).
Phosphorus use efficiencies (PUE) were calculated in two ways. An animal-based PUE was calculated as follows:
This PUE is relevant for farms that import all feed and export all manure (most commonly, intensive poultry farms). These farms produce animals for slaughter, eggs for marketing, and manure for onsite treatment, storage, and export. The surplus P in the manure is exported off the farm.
A farm-based PUE was calculated as follows:
which combines the animal P use efficiency and the crop P use efficiency following manure applications. This is relevant for farms that import all feed and reuse all the manure to grow non-feed crops, some of which can be exported off the farm. This is more common for pig farms. The surplus P in the manure is reused as a cropland soil amendment and fertilizer.
In both cases it is important to optimize the animal housing, manure storage and manure spreading methods in order to reduce N losses from ammonification, denitrification, and nitrification. Reducing N losses will result in higher N/P weight ratios in the manure, allowing for it to be spread over larger areas of cropland (assuming that manure is being spread on the basis of its N content and the N requirements of the crop). Assuming unchanged manure N application on the field level, lowered N/P ratios in degraded manure will result in P overloading and soil surpluses, potentially leading to runoff losses. So, in addition to assessing P use efficiencies, we have assessed loading. P surpluses and PUEs were calculated for scenarios where manure was spread on the basis of the Nitrates Directive (170 kgN/ha/year) and for comparison based on actual crop P offtake levels.
Increasing PUE also involves animal feed manipulations in order to optimize the digestion and retention of P, ultimately leading to the reduction in feed P and manure P. There is a host of literature dealing with feed manipulations (low phytate grains) and supplements (phytase) to increase PUE in poultry [64] and pigs [65]. These are described further below, when taking a systems view of pig and poultry farming.
2.2. Relating Manure P Input to Crop P Output to Determine Safe Levels of Manure Spreading without Excess P
Inspired by the work of the EU Nitrogen Expert Panel [52] (Figure 3), manure P input (kgP/ha/year) was plotted against crop P output (or offtake) (kgP/ha/year), and lines for 90% and 67% crop PUE were added. A safe zone for “optimal” yield and a maximum P surplus of 10 kgP/ha/year was then plotted. This so-called “safe” balance is based on the German Fertilizer Ordinance, where soil with low levels of P receive fertilizer [66].
2.3. The Role of N/P Ratios in Stored Manure to Determine Safe Loading Rates of P
A series of graphs were then drawn, plotting the N/P ratio of applied manure vs. surplus P over a range of different manure N loading rates (80, 170, and 250 kgN/ha/year) and, at the same time, at crop offtake rates of 15 and 30 kgP/ha/year. The plots revealed the critical N/P ratios that could ensure safe spreading of manure, resulting in low or no P surpluses. The plots also revealed N/P ratios resulting in net soil P mining. Central to these calculations was use of the finding from published EU-wide surveys [67] that not all applied manure N is plant-available due to atmospheric losses of N and the presence of organic N compounds. For the purposes of these computations, plant availability was determined to be, on average, 47% for pig and poultry slurry and solid manures. The N/P ratios of the applied manure were adjusted by multiplying them by 0.47, producing an “effective” N/P ratio. It was this adjusted ratio that was used in the above-described plots.
The results were then integrated by plotting the effective critical N/P ratios that would prevent surplus soil P against crop P offtake for the three levels of N loading (80, 170, and 250 kgN/ha/year). In addition, various types of manure (comparing pig and poultry manure, both ex-animal and ex-storage, or degraded manure with significant N losses) were masked onto this plot to illustrate the impact the manure N/P ratio has on P surplus.
2.4. Taking a Systems Overview on P Management in Pig and Poultry Farming
The systems-encompassing “Pegasus” project (https://era-susan.eu/content/pegasus (accessed on 24 October 2021)), was undertaken within the EU ERA-NET SusAn program (https://www.era-susan.eu/ (accessed on 24 October 2021)) on sustainable animal production systems. Between 2017 and 2021 partners from Germany, Northern Ireland (UK), Denmark, Italy, and Sweden (the authors of this paper) studied the dynamics of P utilization in pig and chicken farming within the EU. The project examined various aspects of the P value chain including feed, animal digestion and retention, manure, reuse, soil surplus, and potential runoff losses [7,10,68]. The project performed feed trials and animal physiological studies as well as bioeconomic assessments of various policy options attempting to restrict soil P surpluses from spreading manure on croplands.
A conceptual systems “mind-map” was constructed to pull together the possible impacts encountered when combining the various steering factors to manage P, these can include the impacts of:
- The available area for manure spreading.
- Feed P variables: phytase additions to feed, phase-feeding, and low phytate feed.
- Animal P physiology variables: retention of P, digestibility of P.
- Manure N variables: attempts through improved housing, storage, and spreading to reduce N losses from ammonia, nitrous oxide, nitrogen gas, and nitrate in order to increase the N/P ratio of the final manure in the soil.
- Manure P variables: varying the intensity of manure application to crops on the basis of their P or N requirements, resulting in different numbers of hectares fertilized.
- Soil and crop P variables: crop offtake, cover crop, and soil retention.
- Drainage and runoff P losses: precipitation levels, tiling of fields, controlled flows, green ditching, sedimentation ponds, buffer zones, and constructed wetlands.
3. Results
3.1. Phosphorus Mass Balance Flows in Typical Pig and Poultry Farms
What, then, can be observed from P budgets, as derived from pig and poultry farms? Based on data derived from Otten and Van den Weghe [69], the P flow in six intensive pig farms (NW Germany) that were studied over five years is visualized in Figure 5. Here, 14,000 kg of P in feed is consumed per year by 300 sow (breeder) units and 1000 finisher units, resulting in 4600 kg P in slaughtered animals, 2520 kg P retained in sow and piglet growth, and 6880 kg P in manure. This amounts to an animal PUE of 51%, based on Formula (1), which is close to the data from Poulsen for studies in France, Denmark, and the Netherlands [70].
Assuming that 425 kg P is returned from treated slaughter byproducts, a total of 7300 kg is available for spreading on land. In this baseline case, the manure was applied to 183 ha at a rate of 40 kgP/ha/year, 28 of which went to crop offtake (ca 4860 kg P) and 12 of which ended up as surplus in the soil (2440 kg P) (Table 1). This surplus follows the German Fertilizer Ordinance closely, with a surplus of 10 kgP/ha/year [66] and the system PUE amounts to 82.5% based on Formula (2). The same calculation was carried out for two additional scenarios, one based on the Nitrates Directive—applying manure at the rate of 170 kgN/ha/year, which would need to use 97 ha—and the other based on the P crop requirement of 28 kgP/ha/year, which would need to use 260 ha (Table 1). The resulting surplus for the former case is 47 kgP/ha/year, an increase of ca. 4-fold over the baseline scenario, with a resulting PUE of 67.3%. For the latter case, the surplus is zero and the resulting PUE is 100%.
Based on typical temperate zone brown earth soils (https://en.wikipedia.org/wiki/Brown_earth (accessed on 24 October 2021)) and levels of precipitation, and a topsoil that is not saturated with P, runoff for this system is estimated to be 3 kg P/ha/year [71]; subsequently, the net loss to receiving waters for this pig farm is estimated to be 550 kg P. Therefore, although the farm in the baseline case produces a surplus of 2440 kg P (Figure 5), the soil has the ability to retain most of it; however, runoff losses are site-specific, depending on soil type, soil P levels, topography, precipitation, and the presence of buffer strips, artificial wetlands, ditches, and ponds.
Poultry litter can contain 2- to 4-fold the specific levels of P, compared with pig and cattle manure [71]. This—plus the fact that poultry farms have much higher confined animal densities than pig or dairy farms—can lead to even greater soil P surpluses and potential runoff losses [41,71]. A typical broiler farm (Figure 6) shows rather low P retention, where 70% of the feed P ends up in the manure, compared with 50% for pig farms [30,41,65,66].
For comparison with the above pig farm calculation, a broiler farm with the same annual feed supply (14,000 kgP) was assessed. Based on data from Anzai [72] a P budget was calculated for a broiler farm producing 50,000 birds per year, which is typical within the EU [19]. The published feed, production, and manure data were scaled from kgP/head/year arriving at annual totals of 14,000 kg P in feed, 4500 kg P in production, and 9500 kg P in manure. The data for N were 69,000 kg N in feed, 27,500 kg N in production, 29,500 kg N in manure, and 12,500 kg N lost to ammonia volatilization. The resulting area used for applying chicken manure to meet the Nitrates Directive (170 kgN/ha/year) is 100 ha, while it would have to increase to 339 ha if the same applied manure was to meet a crop P offtake of 28 kgP/ha/year (Table 2), which is the same offtake used in the case of the above pig farm in Table 1.
Comparing the data for the pig farm with that of the broiler farm, one sees that the feed input was the same at 14,000 kg P per yr, and the required areas for manure spreading to meet the Nitrates Directive (170 kgN/ha/year) were also similar (97 and 100, respectively). However, since the broiler farm PUE (formula 2) was lower than that of the pig farm (52 vs. 67%, respectively), the resulting P surplus was higher (67 vs. 47 kgP/ha/year, respectively). The need for more land, when attempting to reach a PUE of 100% (i.e., a zero P surplus), is much higher for the broiler farm (i.e., 339 ha compared to 260 ha for the pig farm); therefore, conforming with the Nitrates Directive, without adhering to critical loading rates for P, leads to significant P surpluses. The need to manage both N and P together when applying manure to croplands is thus highly advisable in order to reduce excess nutrients.
Large intensive pig and poultry farms with high LSU densities, which import feed and produce manure that exceeds the amount that can be used in the same farm, cannot be managed using agronomic methods alone. Here, large poultry farms producing, for example, 100,000 broilers, and pig farms producing 5000 finishers per year stand out. BATs (best available techniques) have been drawn up under the EU Industrial Emissions Directive IPPC (Integrated Pollution Prevention and Control) [3] to manage emissions to prevent pollution from such large facilities. Here, intensive farms are defined as having more than 40,000 places for poultry, 2000 places for pigs (>30 kgs), and 750 places for sows. Although the document refers extensively to manure storage techniques, manure spreading techniques, and the Nitrates Directive maximum level of application of manure N to croplands, it offers no advice regarding parallel impacts of P from manure. Based on excretion data from the IPPC document which generated the maximum allowable number of heads per ha in order to conform to the Nitrates Directive application rate of 170 kgN/ha/year [3], minimum areas for manure spreading were computed (Table 3) for the farms defined above, with 300 sows, 1000 finishers, and 50,000 broilers. The sow farms would require 37–56 ha, the fattener farms would require 44–77 ha and the broiler farms would require 68–152 ha in order to conform with the Nitrates Directive.
Comparing these data with the computations from Table 1 and Table 2, one can see that the minimum farm sizes required to conform to the Nitrates Directive are similar (97 for the pig farm and 100 for the broiler farm); however, in all cases, the farm areas conforming to the Nitrates Directive would produce P surpluses. The calculated minimum areas from Table 1 and Table 2 to ensure zero P surpluses were 260 ha for the pig farm and 339 ha for the broiler farm (i.e., 2–3 times higher).
3.2. Determining Safe Levels of P Loading from Manure
Inspired by the findings of the EU Nitrogen Expert Panel (Figure 3) [52], we propose a somewhat modified graph (Figure 7), depicting the critical range for the input of P fertilizer/manure required to achieve optimal yields that minimize soil P surpluses. A surplus level of 10 kgP/ha/year (averaged over 6 years) is indicated, following the German Fertilizer Ordinance [66]. Data above 100% PUE represent net soil P mining by the crop. Data below 100% PUE represent net soil P surpluses. This graph can be used as a sliding tool to determine safe limits, depending on the minimum offtake for specific cases, all depending on crop and soil types, and local conditions. It is important to remember that, with the same amount of applied P, apparent PUE will be lower with low soil P status because of stronger binding of applied P to soil constituents (e.g., Fe, Al, and Ca) [73] compared with a situation with higher soil P status [74]. Moreover, an addition of manure to fields is usually only relevant for the lower levels of soil P that can benefit from fertilizer additions. Higher soil P levels should not be receiving P fertilizer, unless the crops require it [32].
In deciding whether croplands should be fertilized with P, soil P levels need to be determined; therefore, it is necessary to assess what a surplus application of P means in terms of changes to soil P levels. The following calculation was carried out to determine this. First, the amount of affected topsoil per ha was calculated based on the LUCAS (https://esdac.jrc.ec.europa.eu/projects/lucas (accessed on 24 October 2021)) soil bulk density data from Ballabio [75] and Makovinikova [76]. Bulk density of soil in EU agricultural areas varies from 1.2 to 1.4 tons/m3; subsequently, a value of 1.3 was used here. The tilled depth of topsoil that is relevant to P erosion is 20 cm, according to the LUCAS data [75], and 15–20 cm according to the SERA-17 Task Force (https://sera17dotorg.wordpress.com/ (accessed on 24 October 2021)) [77]. A value of 0.2 m was therefore used in the calculation. This resulted in an estimate of 2700 tons of topsoil under 1 ha of cropland. The surplus of 10 kgP/ha was divided by this estimated amount resulting in a concentration of 0.37 mgP/100 g soil. Since the manure P is understood in terms of total P, and 80–100% of this is plant-available [78], we are working off the assumption that this remains the same after addition to the soil.
Based on the data from Bai [79], an Olsen-P level of 40 mg/kg soil represents the lowest critical boundary that risks P loss, due to erosion and leaching from different soil types. Similar critical boundary levels data have been published by Wang [80] and the range 29–36 mg/kg was published by Hu [81]. The 40 mg/kg level is equivalent to 3.6 mgP/100 g using the P-AL method [82]. This means that both class I and II P-AL soils represent safe levels (class I contains up to 2 and class II between 2 and 4 mgP/100 g soil, respectively). Therefore, a surplus of 10 kgP/ha can be seen as safe, if the background (start) level is at a maximum of 3.23 mgP-AL/100 g. A surplus of 20 kgP/ha would be safe if the background soil P is at a maximum of 2.86 mgP-AL/100 g.
Taking a conservative approach, topsoils containing more than 3.6 mgP/100 g should, in principle, not be receiving any P fertilizer or manure until the levels have been mined downwards by successive crop rotations. For certain conditions, this process can take decades [40,71,83]. Moreover, crops are very efficient, with the P they use showing high efficiencies; thus, reinforcing the fact that they do not respond to increases in added P beyond their inherent critical requirements [84]. This paper, along with the recent work of Piccoli [85] are, thus far, the only known attempts to devise (in graphic form) the critical P input–output levels in order to minimize P surpluses in croplands that receive fertilizer or manure.
3.3. Calculation of Critical N/P Ratios in using Manure as a Soil Amendment
Phosphorus, however, cannot be managed alone. The even more important objective of this work was to investigate P input–output–surplus data, integrating the impact of both N and P. The hypothesized mechanism to manage P balances is through knowledge about the manure N/P weight ratio. By reducing N losses in the housing, storage, and spreading of manure, N/P ratios can be kept higher. Since farmers most often gauge manure application on the basis of N content and crop requirements for N, a higher N/P ratio will result in lower P loading rates and, thus, lower soil P surpluses. The goal is to assess the combined impact of N and P in manure, in order to best meet crop requirements, since the critical values of N or P alone are inadequate as agronomic management tools. It is the N/P weight ratio of the applied manure that needs to be used to better meet a crop’s N/P requirements. That there is no EU directive that integrates both N and P fertilization has created a gap in sustainable manure management, including the associated objectives regarding nutrient recovery and reuse.
Crops have differing N/P requirements—i.e., the N/P offtake weight ratios are 5.3 for barley, 5.7 for oats, 7.9 for rye, 4.6 for sorghum, 4.6 for oilseed rape, 3.5 for sunflower, 7.5 for potato, 4.6 for wheat, 5.9 for maize, 4.2 for rice, 13.4 for soybean, and 14.9 for chick pea [86]. The interaction with N is crucial in order to determine the level of P offtake and surplus P. Based on a broad selection of crops, P offtake tends to range between 13 and 30 kgP/ha/year at optimal soil N and P levels [32,87]. Higher P offtake levels (reaching 40) occur in soils with higher P, and the highest offtake levels (reaching almost 50) are found in perennial grasslands [61].
The other very important factor is that not all N in manure ends up being plant-available. Based on general farm practices, types of manure, soil, and target crops, the plant availability of N in ex-storage manure (averaging pig and chicken slurry and solid forms) is estimated to be 45–50% due to ammonia volatilization losses and the low availability of organic complexes of N [67,88,89]. It is for this reason that an application of 170 kgN/ha/year (following the Nitrates Directive in NVZs—Nitrate Vulnerable Zones) can be seen, effectively, to be closer to 80 kgN/ha/year (i.e., 47%). About 45–70% of P in animal manure is inorganic, i.e., plant-available [90]. The rest, which is organic, can be degraded and mineralized by soil micro-organisms and made plant-available. If the soil P is low (e.g., class I), adsorption to soil particles will reduce plant availability to about 50% [88]; however, for normal fertilized soils from mid to higher soil P levels, 80–100% of the P in manure is considered available [78,88].
According to the above reasoning, a manure application rate of 80 kgN/ha/year is, in effect, 38 kgN/ha/year of plant-available N (Figure 8) and the effective N/P ratios are reduced to the same extent. At an offtake level of 15 kgP/ha/year, the safe N/P ratio needs to come up to 2.5 to avoid a surplus. Higher P offtake levels are just not possible at such a low application rate of N.
In comparison, if one increases the level of manure application to 170 kgN/ha/year, which is the EU regulation for NVZs, the plant-available N becomes 80. At a crop offtake level of 15 kgP/ha/year, surplus soil P can only be avoided if the N/P ratio comes up to 5.2 (Figure 9). At a higher crop offtake level of 30 kgP/ha/year, the safe N/P ratio goes down to 2.7, which is getting closer to the levels of stored manures [35].
For manure applied at a rate of 250 kgN/ha/year (Figure 10), which is quite common in derogation non-NVZs, the plant-available N is 118 kg/ha/year, according to the above reasoning. At an offtake level of 15 kgP/ha/year, soil P surpluses occur at N/P ratios less than 8, which is much higher than levels in stored manure. At an offtake level of 30 kgP/ha/year, soil P surpluses occur at N/P ratios less than 4, which is still greater than the expected levels in stored manure.
To summarize the findings in Figure 8, Figure 9 and Figure 10, a plot was composed, comparing the manure N/P ratios with the level of crop P offtake necessary to avoid soil P surpluses for the three levels of applied N (80, 170, and 250 kgN/ha/year) (Figure 11). This figure also contains documented ranges in N/P ratios for ex-animal and ex-storage pig and chicken manure. Ex-housing, ex-storage, and ex-spreading N/P ratios are always lower than ex-animal ratios. This is due to the loss of N as ammonia, nitrous oxide, N2 gas, and nitrate leaching [91].
The higher application rates of 170 and 250 require manure N/P ratios ranging from 2.7 and upwards, which is above the ex-storage manure levels; therefore, both of these application rates will result in excess soil P.
For the lowest manure application rate of 80 kgN/ha/year, and at crop P offtake levels of 15 kgP/ha/year, the minimum N/P ratio to avoid soil P surplus is 2.5. Neither pig nor chicken ex-storage manure come up to this level. So, in all practicality, this level of crop offtake is insufficient to avoid excess soil P. The figure also includes a data point for a crop offtake level of 30 kgP/ha/year at a manure application rate of 80 kgN/ha/year. This is a hypothetical case that is not achievable for agricultural crops due to N limitation; therefore, although the minimum N/P ratio to avoid soil P surplus would be 1.3, which is met by both types of manure (ex-storage), there would be no crop yield in this case.
The diagram shows that, in practice most common applications of degraded manure will result in P surpluses. The lower N/P ratios result in surplus levels of soil P if the manure is being applied on the basis of its N content. In practice, to use ex-storage manures that are running at N/P ratios of 2 and less, this would mean having to spread less manure per ha to avoid P balances while adding synthetic N fertilizer (e.g., urea or ammonium nitrate) to meet crop requirements.
3.4. Taking a Systems View on Nutrient Management in Pig and Poultry Farms
A “mind map” was put together with an overview of the optimal conditions to improve P efficiency in pig and chicken farms. This should be seen as a potential projection when implementing currently available practices backed up by policies, some of which have yet to be fully implemented. Along the P value chain, several steps can be taken to increase efficiency, as depicted in Figure 12. By using low phytate grains, P content in feed can be decreased by 50–60% while increasing P availability by 70–90% [64]. In addition, efficiency can be increased by 25–50% by supplementing feed with phytase, and by a further 25–50% by supplementing with vitamin D [13]. Additionally, pelleting and growth phase-based feeding in chickens will increase efficiencies by 5–10% [94]. These improvements, when combined, can lead to an overall increase in P digestion and retention by 20–30% leading to an overall decrease in manure P by 15–20% [65]. With improved handling, storage, and spreading of manure, losses of ammonia, nitrogen gas, and nitrate can be reduced [35,95]—resulting in manure with higher N/P content. This can lead to lowered manure application rates of 20–25 kgP/ha/year.
4. Discussion
4.1. Feed Modification to Avoid P Balances and Increase PUEs
Pigs and chickens are monogastric animals and, therefore, do not digest P efficiently. Data from this work show that, based on P levels in feed conversion to manure, pigs are about 50% efficient, while broilers are 30% efficient. This is in direct contrast with ruminants, where upwards of 90% of the P in feed is digestible, due to rumen microbial phytase (https://lpelc.org/phosphorus-mass-balance-on-livestock-and-poultry-operations/ (accessed on 24 October 2021)). Well-managed pig farms using feed supplemented with phytase, low phytate grains, and other feed manipulations—plus spreading of manure to avoid excessive P—were found to be relatively efficient in their use of P. In Germany, when keeping to the national fertilizer regulations for P surpluses (10 kgP/ha/year averaged over a 6 yr period), pig farm PUEs were computed to be around 80%. However, if the same farms were to follow the Nitrates Directive and spread manure at 170 kgN/ha/year, the PUE drops to 65%. For broiler farms, PUEs are lower, running at 50%.
Much can be done in pig and poultry farms to reduce P content in feed and increase N and P animal digestion and their retention of P. If feed is modified using phytase additions, PUE can be increased by 25–35% (Ibid.) and even up to 50% in some cases [64]. Pelleting and reduction in the size of feed particles for poultry can increase efficiency by an additional 5–10% (Ibid.).
P-based BMPs (best management practices) include feed modification (enzymes and crop hybrids), manure modification (chemical and physical treatments and composting), transportation to farms with P deficits, land aspects (conservation tillage, critical area fertilizer targeting, buffer zones, and soil testing), and grazing management (duration and intensity, and stream bank fencing) [71].
4.2. Importance of Housing, Manure Treatment and Storage Factors Preventing N Losses to Optimize N/P Ratios and Minimize Excess P
When it comes to housing, manure treatment and storage systems, as well as the spreading of manure on fields, measures can be taken to decrease N losses via ammonia, nitrous oxide, N2 gas, and nitrate leaching. All this is meant to increase N and P use efficiencies, retain as high as possible N/P ratios in manure, and reduce losses of N and P to the environment. The global consequences of N losses are significant, in that nitrous oxide is a strong greenhouse gas [97,98]. Locally, the losses affect air quality (ammonia) and groundwater (nitrate pollution). Fertilizer that is wasted is the third consequence. Few countries have taken initiatives to restrict N losses from manure in a systematic fashion. One exception is Denmark, which has been working on the “Harmony Rule” since the mid-1980s [99]. Since then, restricted N fertilizer quotas have resulted in reductions in nitrate leaching by 45% and ammonia losses in livestock operations by 50%. Recently, requirements for N use efficiencies have been set at 75% for cattle slurry and at 80% for pig slurry.
In order to prevent significant surplus levels of P in soil, with crop offtake at 30 kgP/ha/year, the N/P weight content of manure needs to be kept above 1.3 if the stored pig and chicken manure is being spread at 80 kgN/ha/year (Figure 11). At spreading rates of 170 and 250 kgN/ha/year, at the same level of crop P offtake, stored pig and chicken manure will result in soil P surpluses. At crop offtake levels of 15 kgP/ha/year, all three spreading rates will result in soil P surpluses. It is only at very high crop offtake levels (such as 45 to 60 kgP/ha/year, that are found, for example, in cut perennial grasslands [61]) that high soil P surpluses can be avoided.
Overall, the most important factor that can help prevent excess soil P in spreading manure is to prevent N losses to the atmosphere. As long as N is lost at levels of 50% of the ex-animal N through housing, storage, and spreading processes, manure will continue to have relatively low N/P ratios. Reductions in P levels in manure from pigs and poultry, through alterations in feed (low phytate, phytase supplements, pelleting, and growth-phase feeding), will reduce P levels in manure; however, these efforts will have less impact if the manure is left untreated, unmanaged, or stored in ways that result in significant atmospheric losses of N2, NH3, and N2O.
Sharpley et al. [71] showed that soluble P and total P in runoff can be reduced by over 90% by applying poultry manure, based on soil test P requirements, to produce optimal crop yields, as compared with basing it on the crop N requirements. The mechanism behind this is the N/P weight ratio of the manure litter. Basing manure applications solely on N crop requirements and N content of manure will lead to large overloading of P, surplus soil P, and ultimately, P losses in drainage and runoff. Practices such as buffer strips, constructed wetlands, modified ditches with vegetative growth, sedimentation ponds, and contour ploughing all reduce runoff losses [71].
4.3. Policy Aspects Relating to P Surpluses
Although phosphorus rock and extracted phosphate were placed on the EU Critical Raw Materials List [100], phosphate in agriculture still remains a somewhat neglected environmental issue within the EU. Indeed, in the official EU Agricultural Outlook for 2017–2030 [101], P is hardly mentioned. Manure N has been regulated through the Nitrates Directive since 1991, but P has not received a similar focus. The one-sided emphasis on N has created a gap in manure P management within the agriculture sector. This has contributed to elevated levels of nutrients in areas near livestock facilities [25,26]. The need for increased P management becomes obvious when P-limited freshwater and coastal water bodies show signs of eutrophication, such as neuro-toxic blue-green algal blooms and anoxic benthic zones, due to excessive nutrients in runoff [47]. Indeed, the P agriculture management problem has received increased attention in recent years by several experts [8,102,103]. Attempts to standardize P indices (requiring data inputs of soil P, crop P requirements, and soil erosion risk) have been found challenging, due to the complexities involved with bridging research science with farm practices and site specificity [56,104]. Impacts on widespread governance and policy implementation remain limited [105].
In the absence of a harmonized system regulating P losses from agricultural activities, some EU member states address P surpluses and losses through national and regional legislation or directives. Phosphorus is most commonly “managed” indirectly by default in implementing the Nitrates Directive within National Action Plans, the Water Framework Directive (https://ec.europa.eu/environment/water/water-framework/index_en.html (accessed on 24 October 2021)) (WFD)(2000/60/IEC), in terms of River Basin Management Plans and the Common Agricultural Policy of the EU (CAP) [57]. As of 2007, six EU countries had developed national regulations for P application to farm fields [106]. This increased to ten countries by 2014 [57]. Germany is the only EU country with a P fertilizer application norm based on a defined surplus. In 2010, this norm was reduced from 20 to 10 kg P/ha/year (averaged over six years) [66].
Since 2017, the EU has issued BAT (best available techniques) under the IPPC (Integrated Pollution Prevention and Control) Directive [3], which is aimed at larger pig and poultry farms. This puts limits to the amounts of P and N that can be discharged from farms and it dictates methods to manage wastewater. However, these BATs do not protect arable lands from surplus applications of P. Today, manure is spread mainly based on its N content, as dictated by the Nitrates Directive; however, what is needed is a modified directive that manages both N and P. Indeed, water bodies that are particularly sensitive to P loading, such as the Baltic Sea and most freshwater lakes and rivers, need to be protected.
Reducing the impact of excessive P from farming practices needs also to be dealt with through the CAP (https://ec.europa.eu/info/food-farming-fisheries/key-policies/common-agricultural-policy/cap-glance_en (accessed on 24 October 2021)) (EU Common Agriculture Policy) by encouraging the use of artificial wetlands, ditches, sedimentation ponds, riparian buffer zones, contour ploughing, and other methods to reduce runoff.
Separation of pig slurry into liquid and solid fractions, as well as the drying of poultry litter, allow for more economic transportation from intensive animal farms to crop farms that have P deficits. This sort of activity should be encouraged within the CAP and be part of the enormous subsidies that amounted to ca. 1 billion Euros per week in 2019 (https://ec.europa.eu/info/food-farming-fisheries/key-policies/common-agricultural-policy/cap-glance_en (accessed on 24 October 2021)). Production of biofertilizers from manure—such as ammonium sulphate, struvite, and compost—need to also be encouraged within the EU in order to make better use of excess manure resources.
If manure is to be added to soils, it needs to be regulated around the N and P requirements of growing crops and soil P levels. If realized, this could have considerable impacts on forcing agriculture to become more sustainable, as follows: optimizing the size of intensive livestock farms; optimizing N/P levels in feed; encouraging the processing of manure (e.g., acidification (http://balticslurry.eu/reports-2/ (accessed on 24 October 2021)) to retain nitrogen, and slurry water separation to reduce transport costs); using cover crop legumes (green manure) to fix atmospheric nitrogen; basing crop rotations on soil P levels; encouraging soil and manure P testing to refine application rates. Manure should, therefore, not be added to soils with high P content. For low-P soils (e.g., class I and II P-AL), manure application is acceptable based on a maximum P surplus—of, for example, 10 kgP/ha/year—which may require additional N chemical fertilizer to meet the crop requirement. For high-P soils and P-vulnerable zones (depending on catchment characteristics) a zero surplus is called for.
4.4. Relevance to Baltic Sea Region Nutrient Management
Of all the EU marine areas, the Baltic Sea is the most sensitive to excess P. This is due to annual large-scale blooms of cyanobacteria that carry out N fixation, which are driven by the available excess P and legacy P from both the drainage basin and anoxic benthic zones [107].
Nitrogen fertilization with livestock manures is regulated on the basis of the EU Nitrates Directive, limiting this to 170 kgN/ha/year in NVZs (Nitrate Vulnerable Zones). Direct regulation of P fertilization of farmland is to be based on the EU Water Framework Directive (WFD) but is not implemented in several Baltic Sea Region (BSR) countries. The WFD does not impose P fertilizer limits, nor does it apportion P reduction goals between agriculture and the wastewater treatment sector. The lack of P management from animal farms represents a major gap in environmental protection governance; moreover, the Baltic Sea and other vulnerable areas are, consequently, still suffering from excessive P loads. There is a need to close the “P fertilization policy gap” by recommending measures to retain the highest possible N/P ratio in livestock manure, through reducing N losses in animal housing and manure storage and field spreading. The EU Farm to Fork Strategy (https://eur-lex.europa.eu/resource.html?uri=cellar:ea0f9f73-9ab2-11ea-9d2d-01aa75ed71a1.0001.02/DOC_1&format=PDF (accessed on 24 October 2021)) aims, from 2020 to 2030, to reduce nutrient losses by at least 50% and use of fertilizers by at least 20%. P is not specifically named but it is clearly implied. Technical solutions, whereby both N and P are managed together, to support the development of Integrated Nutrient Management Action Plans (INMAPs) and the Farm Sustainability Tool (FaST) (https://fastplatform.eu/ (accessed on 24 October 2021)) are called for. In this way, manure can be better used to both meet crop requirements and to avoid unnecessary nutrient surpluses in soil and associated catchment areas.
HELCOM (Baltic Marine Environment Protection Commission) has recommended a maximum application rate of 25 kgP/ha/year for Baltic states as a goal in manure-based applications to agricultural land (https://helcom.fi/about-us/convention/annexes-to-the-convention-2/annex-iii/ (accessed on 24 October 2021)). This is with the background enforcement of the Nitrates Directive which dictates a maximum of 170 kgN/ha/year in NVZs; therefore, the N/P ratio of such a maximal application is 6.8, which is close to the requirements of grain crops (wheat, maize, rye, oats, sorghum, and barley) [86]. However, most stored and degraded manures are much lower than 6.8—often less than 4 for ex-animal levels, and less than 2 for ex-storage levels (Figure 11). Consequently, while striving to meet the 170 kgN/ha/year limit, farmers will be applying levels of 60–80 kgP/ha/year. With a crop offtake of 20–40 kgP/ha/year, this would leave a surplus of 20–60 kgP/ha/year. In order to meet the German Fertilizer Ordinance requirement for environmental safety, a surplus of 10 kgP/ha/year [66] would require maximal loading rates of 30–40 kgP/ha/year. This means reducing the N loading to half, i.e., ca. 85 kgN/ha/year. The impact of this restriction would be the requirement to spread the manure over a larger surface area and possibly supplement with N fertilizer. An official critique of HELCOM, made by the Government of Poland (https://portal.helcom.fi/meetings/AGRI%209-2020-726/MeetingDocuments/4-2%20Polish%20comments%20on%20the%20revision%20of%20Annex%20III%20part%202%20of%20the%20Helsinki%20Convention.pdf (accessed on 24 October 2021)), claims that if a maximum spreading rate of 25 kgP/ha/year is to be followed, this would result in an insufficient amount of N applied to fields. That is, on average, N application would be around half of the allowable 170 kgN/ha/year. This implies an N/P ratio closer to 3.4 which is close to the values given in Figure 11; however, taking into account the fact that only about half of the applied manure N is plant-available, this ratio is rendered to be, effectively, only 1.6. The statement from Poland corroborates the findings of this paper. The EU Strategy for the Baltic Sea Region (https://www.balticsea-region-strategy.eu/ (accessed on 24 October 2021)) has yet to address this problem.
Average sizes of animal farms around the Baltic Sea area range from 155 ha in Germany, to 67 ha in Denmark, to 10 ha in Poland [108]. The UAAs (utilized agricultural areas) for cattle, pig, and poultry farms together in ha were 3.6, 14.4, and 2.6 million, respectively for the three countries. The total numbers of pigs (heads) were 3.2, 12.1, and 11.3 million, respectively. The critical parameter determining production of nutrient surpluses is the density of animals (LSU/ha) which was 0.75, 1.58, and 0.64, respectively [108]; consequently, of these three countries, Denmark has the highest tendency for nutrient surpluses.
4.5. Practical Impacts of Using P-, along with N-Based Manure Applications
What, then, would the impacts be if animal manure were to be spread on the basis of its P content and not just its N content? For P-vulnerable areas and soils with already high levels of P, several changes can be hypothesized as follows:
- Larger areas of cropland would need to be used to meet the P requirements of the target crops. In some cases, this could mean doubling the area. In worst cases, no manure would be spread on fields until the soil P levels were mined down (e.g., 5 years depending on the local situation).
- Alternatively, if cropland areas cannot be increased, animal farms would need to produce less manure by reducing animal density and downsizing their operations.
- Cutting back on manure applications to reduce excessive farmgate P balances could require additional N fertilizer to meet the needs of the crops. This would create added costs, e.g., in the purchase of N fertilizer or crop rotating with green manure.
- Manure could be transported to farms that have P deficits. For this to be economical, the manure would need to be separated (for slurry) or dried and pelleted (for litter). These would be added costs, but presumably the products would increase in value.
- Farmers especially, running large intensive animal farms, would value manure more as a fertilizer instead of as a waste product from animal production.
- By focusing more on the importance of N/P ratios, N would end up being managed better with incentives to reduce N losses in manure handling, storage, and spreading.
- P wastage would be reduced significantly by upwards of 50% in many cases.
- The new EU CAP (Common Agriculture Policy) could take on some of these costs by building in provisions for improved P management of soils.
5. Conclusions
This paper presents an alternative pathway for managing N and P in pig and poultry farming, by examining the limits to N/P weight ratio content of manure that are applied to cropland. Using basic mass balance calculations, the paper shows how the PUE (P use efficiency) can be deduced, in order to assess the status of a specific farm. The change in management paradigm that is recommended in this paper requires the reformation of existing regulations and an increased harmonization in policy across the EU.
The paper introduces novel work, relating critical input and offtake levels for P from manure as a compliment to the work of the EU Nitrogen Expert Panel and echoing a “safe” surplus of ca. 10 kgP/ha/year for low soil P levels. The paper provides estimates of critical N/P ratios that determine the level of surplus depending on the P input and offtake at various levels of N input (80, 70 and 250 kgN/ha/year). The conclusion is that manure needs to be managed with much more care in housing, storage, and spreading, in order to reduce N losses. By doing so, higher N/P ratios can be achieved, and less P would be spread on fields, resulting in less P surplus, losses, and waste.
The paper identifies a clear conflict between the regulation of manure spreading based on N compared to basing it on P. N levels in manure are reduced due to losses in ammonia, nitrous oxide, and nitrogen gas to the atmosphere—as well as nitrate to groundwater, in the process of manure housing, storage, and spreading. This process of degrading the nutrient quality of pig and poultry manure results in N/P ratios that are reduced by at least half, compared with ex-animal levels. This is the main reason that following only the Nitrates Directive ends up causing excess P. The map of P levels in Northern European topsoil (Figure 2) clearly shows the impact of long-term overloading with P. Moreover, it also confirms the ability of soil to retain this excess P. Regulating only N in the application of manure to cropland is clearly a short-sighted practice, especially for P-sensitive catchment areas, such as freshwater rivers, lakes, and coastal zones. The Baltic Sea is the EU’s most sensitive and largest body of water that is suffering from excessive loading with P. The EU Strategy for the Baltic Sea Region has yet to centrally address this problem. The new Farm to Fork Strategy, which sets a goal of reducing losses of fertilizer by at least 50% and use of fertilizer by at least 20% during the period 2020–2030, is the first sign of possible action; however, the importance of the co-management of N and P has yet to be mentioned.
Author Contributions
A.R. of Stockholm Environment Institute (SEI) was responsible for the original conceptualization and drafting of the paper including literature research and data sourcing. N.E. and K.A. of SEI provided critical input towards the conceptualization and writing. All authors have read and agreed to the published version of the manuscript.
Funding
This research was funded by Formas—Swedish Research Council for Sustainable Development (https://formas.se/ (accessed on 24 October 2021)), grant number 2017-00150, as part of the ERA-NET SusAn (www.era-susan.eu/ (accessed on 24 October 2021)) within the Pegasus project (http://www.pegasus.fbn-dummerstorf.de/ (accessed on 24 October 2021)).
Institutional Review Board Statement
Not applicable.
Informed Consent Statement
Not applicable.
Data Availability Statement
Not applicable.
Acknowledgments
Daniel Ddiba of SEI was a team member within the Pegasus project (https://www.sei.org/projects-and-tools/projects/pegasus-phosphorus-management-eu/ (accessed on 24 October 2021)) and provided comments on the manuscript. Work by two SEI interns, Johanna Alexson and Axel Wurtz, in 2017 and 2018 is acknowledged. The authors acknowledge, with thanks, the comments made by one of the reviewers.
Conflicts of Interest
The authors declare no conflict of interest.
References
- Marquer, P.; Rabade, T.; Forti, R. Pig farming in the European Union, considerable variations from one Member State to another. Eurostat Stat. Focus 2014, 15, 1–12. [Google Scholar]
- Schoumans, O.F.; Bouraoui, F.; Kabbe, C.; Oenema, O.; van Dijk, K.C. Phosphorus management in Europe in a changing world. Ambio 2015, 44, 180–192. [Google Scholar] [CrossRef] [Green Version]
- Santonja, G.G.; Georgitzikis, K.; Scalet, B.M.; Montobbio, P.; Roudier, S.; Sancho, L.D. Best Available Techniques (BAT) Reference Document for the Intensive Rearing of Poultry or Pigs; EUR 28674 EN; JRC: Seville, Spain, 2017. [Google Scholar] [CrossRef]
- Steinfeld, H.; Gerber, P.; Wassenaar, T.; Castel, V.; Rosales, M.; de Haan, C. Livestock’s Long Shadow—Environmental Issues and Options; Food and Agriculture Organization of the United Nations: Rome, Italy, 2006. [Google Scholar]
- van Krimpen, M.; Sebek, L.; Bikker, P.; van Vuuren, A.M. Default Phosphorus excretion factors of farm animals. Trends Plant Sci. 2002, 7, 118–125. [Google Scholar]
- Sharpley, A.N.; Bergström, L.; Aronsson, H.; Bechmann, M.; Bolster, C.H.; Börling, K.; Djodjic, F.; Jarvie, H.P.; Schoumans, O.F.; Stamm, C.; et al. Future agriculture with minimized phosphorus losses to waters: Research needs and direction. Ambio 2015, 44, 163–179. [Google Scholar] [CrossRef] [Green Version]
- Oster, M.; Reyer, H.; Ball, E.; Fornara, D.; McKillen, J.; Sørensen, K.U.; Poulsen, H.D.; Andersson, K.; Ddiba, D.; Rosemarin, A.; et al. Bridging gaps in the agricultural phosphorus cycle from an animal husbandry perspective-The case of pigs and poultry. Sustainability 2018, 10, 1825. [Google Scholar] [CrossRef] [Green Version]
- Leinweber, P.; Bathmann, U.; Buczko, U.; Douhaire, C.; Eichler-Löbermann, B.; Frossard, E.; Ekardt, F.; Jarvie, H.; Krämer, I.; Kabbe, C.; et al. Handling the phosphorus paradox in agriculture and natural ecosystems: Scarcity, necessity, and burden of P. Ambio 2018, 47, 3–19. [Google Scholar] [CrossRef] [Green Version]
- Sheppard, S.C. Elemental Composition of Swine Manure from 1997 to 2017: Changes Relevant to Environmental Consequences. J. Environ. Qual. 2018, 48, 164. [Google Scholar] [CrossRef] [PubMed]
- Reyer, H.; Oster, M.; Wittenburg, D.; Murani, E.; Ponsuksili, S.; Wimmers, K. Genetic contribution to variation in blood calcium, phosphorus, and alkaline phosphatase activity in pigs. Front. Genet. 2019, 10. [Google Scholar] [CrossRef] [PubMed]
- Li, X.; Zhang, D.; Yang, T.; Bryden, W. Phosphorus Bioavailability: A Key Aspect for Conserving this Critical Animal Feed Resource with Reference to Broiler Nutrition. Agriculture 2016, 6, 25. [Google Scholar] [CrossRef] [Green Version]
- Humer, E.; Schwarz, C.; Schedle, K. Phytate in pig and poultry nutrition. J. Anim. Physiol. Anim. Nutr. (Berl.) 2015, 99, 605–625. [Google Scholar] [CrossRef]
- Oster, M.; Just, F.; Büsing, K.; Wolf, P.; Polley, C.; Vollmar, B.; MurÁni, E.; Ponsuksili, S.; Wimmers, K. Toward improved phosphorus efficiency in monogastrics—interplay of serum, minerals, bone, and immune system after divergent dietary phosphorus supply in swine. Am. J. Physiol.-Regul. Integr. Comp. Physiol. 2016, 310, R917–R925. [Google Scholar] [CrossRef] [PubMed] [Green Version]
- Li, X.; Zhang, D.; Bryden, W.L. Calcium and phosphorus metabolism and nutrition of poultry: Are current diets formulated in excess? Anim. Prod. Sci. 2017, 57, 2304–2310. [Google Scholar] [CrossRef]
- Nahm, K.H. Feed formulations to reduce N excretion and ammonia emission from poultry manure. Bioresour. Technol. 2007, 98, 2282–2300. [Google Scholar] [CrossRef]
- Liu, Q.; Wang, J.; Bai, Z.; Ma, L.; Oenema, O. Global animal production and nitrogen and phosphorus flows. Soil Res. 2017, 55, 451–462. [Google Scholar] [CrossRef] [Green Version]
- AMEC Environment & Infrastructure UK limited. Collection and Analysis of Data for the Control of Emissions from the Spreading of Manure; AMEC Environment & Infrastructure UK Ltd.: Shropshire, UK, 2014. [Google Scholar]
- Foged, H.L.; Flotats, X.; Blasi, A.B.; Palatsi, J.; Magri, A.; Schelde, K.M. Inventory of Manure Processing Activities in Europe. European Commission, DG Env: Brussels, Belgium, 2011; 34p. [Google Scholar]
- Augère-Granier, M.-L. The EU Poultry Meat and Egg Sector—Main Features, Challenges and Prospects; European Parliament: Brussels, Belgium, 2019. [Google Scholar]
- Sharpley, A.; Beegle, D. Managing Phosphorus for Agriculture and the Environment; College of Agricultural Sciences, The Pennsylvania State University: University Park, PA, USA, 2001; pp. 1–16. [Google Scholar]
- Toth, J.D.; Dou, Z.; Ferguson, J.D.; Galligan, D.T.; Ramberg, C.F. Nitrogen- vs. phosphorus-based dairy manure applications to field crops: Nitrate and phosphorus leaching and soil phosphorus accumulation. J. Environ. Qual. 2006, 35, 2302. [Google Scholar] [CrossRef]
- Komiyama, T.; Ito, T.; Saigusa, M. Effects of phosphorus-based application of animal manure compost on the yield of silage corn and on soil phosphorus accumulation in an upland Andosol in Japan. Soil Sci. Plant Nutr. 2014, 60, 863–873. [Google Scholar] [CrossRef] [Green Version]
- Velthof, G.L.; Oudendag, D.; Witzke, H.P.; Asman, W.A.H.; Klimont, Z.; Oenema, O. Integrated Assessment of Nitrogen Losses from Agriculture in EU-27 using MITERRA-EUROPE. J. Environ. Qual. 2009, 38, 402–417. [Google Scholar] [CrossRef] [PubMed]
- Couto, R.D.; Ferreira, P.A.; Ceretta, C.A.; Lourenzi, C.R.; Facco, D.B.; Tassinari, A.; Piccin, R.; de Conti, L.; Gatiboni, L.C.; Schapanski, D.; et al. Phosphorus fractions in soil with a long history of organic waste and mineral fertilizer addition. Bragantia 2017, 76, 155–166. [Google Scholar] [CrossRef] [Green Version]
- Keplinger, K.O.; Hauck, L.M. The economics of manure utilization: Model and application. J. Agric. Resour. Econ. 2006, 31, 414–440. [Google Scholar]
- Haneklaus, S.; Schick, J.; Kratz, S.; Schnug, E.; Rückamp, D. Variable rate application of manure-Gain or pain? Landbauforsch. Volkenrode 2016, 66, 11–19. [Google Scholar] [CrossRef]
- Eghball, B.; Gilley, J.E.; Baltensperger, D.D.; Blumenthal, J.M. Long–term manure and fertilizer application effects on phosphorus and nitrogen in runoff. Am. Soc. Agric. Eng. 2002, 45, 687–694. [Google Scholar] [CrossRef]
- Field, J.A.; Reneau, R.B.; Kroontje, W.; Caldwell, J.S. Nutrient recoveries from plug-flow anaerobic digestion of poultry manure. Agric. Wastes 1985, 13, 207–216. [Google Scholar] [CrossRef]
- Kingery, W.; Wood, C.; Delaney, D.; Williams, J.; Mullins, G. Impact of Long-term Land Application of Broiler Litter on Environmentally Related Soil Properties. J. Environ. Qual. 1994, 23, 139–147. [Google Scholar] [CrossRef]
- Sharpley, A.N.; Smith, S.J.; Bain, W.R. Nitrogen and phosphorus fate from long-term poultry litter applications to Oklahoma soils. Soil Sci. Soc. Am. J. 1993, 57, 1131–1137. [Google Scholar] [CrossRef]
- Adeli, A.; Bolster, C.H.; Rowe, D.E.; McLaughlin, M.R.; Brink, G.E. Effect of long-term swine effluent application on selected soil properties. Soil Sci. 2008, 173, 223–235. [Google Scholar] [CrossRef] [Green Version]
- Hassby, O. Restriction of Manure Application on High Phosphorus Soils—Is Current Research Supporting a Restriction and What Measures Are in Effect in Different European Countries? Master’s Thesis, Lund University, Lund, Sweden, 2016. [Google Scholar]
- Maguire, R. Importance of Farm Phosphorus Mass Balance and Management Options. In Viriginia Cooperative Extension CSES-98P; Virginia State University: Petersburg, VA, USA, 2020; p. 5. [Google Scholar]
- Chastain, J.P.; Camberato, J.J.; Skewes, P. Poultry Manure Production and Nutrient Content. Production 2010, 1–17. Available online: www.clemson.edu/extension/camm/manuals/poultry/pch3b_00.pdf (accessed on 24 October 2021).
- Petersen, J.; Sørensen, P. Loss of nitrogen and carbon during storage of the fibrous fraction of separated pig slurry and influence on nitrogen availability. J. Agric. Sci. 2008, 146, 403–413. [Google Scholar] [CrossRef]
- Sharma, L.K.; Bali, S.K.; Zaeen, A.A. A case study of potential reasons of increased soil phosphorus levels in the Northeast United States. Agronomy 2017, 7, 85. [Google Scholar] [CrossRef] [Green Version]
- Beegle, D.; Durst, P. Managing Phosphorus for Crop Production—Agronony Facts 13. Agron. Facts. PennState Extension. 2002, 6. Available online: https://extension.psu.edu/managing-phosphorus-for-crop-production (accessed on 24 October 2021).
- Ju, X.T.; Kou, C.L.; Christie, P.; Dou, Z.X.; Zhang, F.S. Changes in the soil environment from excessive application of fertilizers and manures to two contrasting intensive cropping systems on the North China Plain. Environ. Pollut. 2007, 145, 497–506. [Google Scholar] [CrossRef] [Green Version]
- Boitt, G. Phosphorus Legacy: Role of Long-Term Soil Phosphorus Accumulation in the Sustainable Management of Intensive Agroecosystems. Ph.D. Thesis, Lincoln University, Lincoln, New Zealand, 2017. [Google Scholar]
- Rutkowska, A.; Skowron, P. Productive and Environmental Consequences of Sixteen Years of Unbalanced Fertilization with Nitrogen and Phosphorus—Trials in Poland with. Agronomy 2020, 10, 1747. [Google Scholar] [CrossRef]
- Maguire, R.O.; Mullins, G.L.; Brosius, M. Evaluating Long-Term Nitrogen- versus Phosphorus-Based Nutrient Management of Poultry Litter. J. Environ. Qual. 2008, 37, 1810–1816. [Google Scholar] [CrossRef]
- Poulsen, H.D.; Moller, H.B.; Klingmair, M.; Thomsen, M. Fosfor i Dansk Landbrug—Ressource og Miljöudfordring; Aarhus University: Aarhus, Denmark, 2019; 39p. [Google Scholar]
- Marquer, P. Pig farming in the EU, a changing sector. Agric. Fish. Stat. Focus Eurostat. 2010, 8, 1–12. [Google Scholar]
- Tóth, G.; Guicharnaud, R.A.; Tóth, B.; Hermann, T. Phosphorus levels in croplands of the European Union with implications for P fertilizer use. Eur. J. Agron. 2014, 55, 42–52. [Google Scholar] [CrossRef]
- Ballabio, C.; Lugato, E.; Fernández-Ugalde, O.; Orgiazzi, A.; Jones, A.; Borrelli, P.; Montanarella, L.; Panagos, P. Mapping LUCAS topsoil chemical properties at European scale using Gaussian process regression. Geoderma 2019, 355, 113912. [Google Scholar] [CrossRef]
- Fertilizer Europe. Forecast of Food, Farming and Fertilizer Use in the European Union 2020–2030; Fertilizer Europe: Brussels, Belgium, 2021; 20p. [Google Scholar]
- Funkey, C.P.; Conley, D.J.; Reuss, N.S.; Humborg, C.; Jilbert, T.; Slomp, C.P. Hypoxia sustains cyanobacteria blooms in the Baltic Sea. Environ. Sci. Technol. 2014, 48, 2598–2602. [Google Scholar] [CrossRef]
- Wasmund, N.; Nausch, G.; Schneider, B.; Nagel, K.; Voss, M. Comparison of nitrogen fixation rates determined with different methods: A study in the Baltic Proper. Mar. Ecol. Prog. Ser. 2005, 297, 23–31. [Google Scholar] [CrossRef]
- Fraser, H.; Fleming, R. Environmental Benefits of Tile Drainage—Literature Review; University of Guelph: Guelph, ON, Canada, 2001; Volume 23, Available online: https://citeseerx.ist.psu.edu/viewdoc/download?doi=10.1.1.202.7086&rep=rep1&type=pdf#:~:text=Because%20tile%20drainage%20removes%20excess,Van%20Vlack%20and%20Norton%201944 (accessed on 24 October 2021).
- Moore, J. Tile Drainage and Phosphorus Losses from Agricultural Land; Tech Report no. 8; Lake Champlain Basin Program; The Lake Champlain Basin Program: Grand Isle, VT, USA, 2016; 77p, Available online: http://www.lcbp.org/wp-content/uploads/2017/01/83_TileDrainage_LitReview.pdf (accessed on 24 October 2021).
- Monteny, G.J. The EU Nitrates Directive: A European Approach to Combat Water Pollution from Agriculture. Sci. World J. 2005, 1, 927–935. [Google Scholar] [CrossRef] [PubMed] [Green Version]
- EU Nitrogen Expert Panel. Nitrogen Use Efficiency (NUE—An Indicator for the Utilization of Nitrogen in Agriculture and Food Systems; Wageningen University: Wageningen, The Netherlands, 2015; 47p, Available online: www.researchgate.net/publication/312554339_Nitrogen_Use_Efficiency_NUE_-_an_indicator_for_the_utilization_of_nitrogen_in_agriculture_and_food_systems_Prepared_by_the_EU_Nitrogen_Expert_Panel (accessed on 24 October 2021).
- Roberts, T.L.; Johnston, A.E. Phosphorus use efficiency and management in agriculture. Resour. Conserv. Recycl. 2015, 105, 275–281. [Google Scholar] [CrossRef]
- Dhillon, J.; Torres, G.; Driver, E.; Figueiredo, B.; Raun, W.R. World phosphorus use efficiency in cereal crops. Agron. J. 2017, 109, 1670–1677. [Google Scholar] [CrossRef] [Green Version]
- Oster, M.; Gerlinger, C.; Heide, K.; Just, F.; Borgelt, L.; Wolf, P.; Polley, C.; Vollmar, B.; Muráni, E.; Ponsuksili, S.; et al. Lower dietary phosphorus supply in pigs match both animal welfare aspects and resource efficiency. Ambio 2018, 47, 20–29. [Google Scholar] [CrossRef] [PubMed] [Green Version]
- Foged, H. Phosphorus Indices—Status, Relevance and Requirements for a Wider Use as Efficient Phosphorus Management Measures in the Baltic Sea Region. BalticSea2020 2011. 27p. Available online: http://www.balticsea2020.org/english/images/Bilagor/pindex_report.pdf (accessed on 24 October 2021).
- Amery, F.; Schoumans, O.F. Agricultural Phosphorus Legislation in Europe; ILVO: Merelbeke, Belgium, 2014; 45p, Available online: https://ilvo.vlaanderen.be/uploads/migration/public/Mediatheek/Phosphorus_legislation_Europe.pdf (accessed on 24 October 2021).
- Amery, F.; Rger, M.B.E.; Arrufat, B.; Fertinagro, J.M.; Meers, E.; Assaker, A.; Ent, U.G.; Leitat, A.L. Fertimanure’s Report on BBF Regulatory Framework in the EU and CELAC Countries; UVIC: Victoria, BC, Canada, 2021. [Google Scholar]
- Rothwell, S.A.; Doody, D.G.; Johnston, C.; Forber, K.J.; Cencic, O.; Rechberger, H.; Withers, P.J.A. Phosphorus stocks and flows in an intensive livestock dominated food system. Resour. Conserv. Recycl. 2020, 163, 105065. [Google Scholar] [CrossRef] [PubMed]
- Eriksson, A.K. Phosphorus in agricultural soils around the Baltic Sea—Comparisons of different laboratory methods as indices for phosphorus leaching to waters. Swedish University of Agricultural Sciences: Uppsala, Switzerland, 2009. [Google Scholar]
- D’Haene, K.; Hofman, G. Phosphorus offtake and optimal phosphorus fertilisation rate of some fodder crops and potatoes in temperate regions. Agrokem. es Talajt. 2015, 64, 403–420. [Google Scholar] [CrossRef] [Green Version]
- Weimers, K. Growth and Phosphorus Uptake of Potato (Solanum tuberosum L.) in an Alkaline Soil as Affected by Mineral Nitrogen Forms and Inoculation with Phosphate-Solubilizing Bacteria and Mycorrhizal fungi; SLU, Swedish University of Agricultural Sciences: Alnarp, Sweden, 2017; 37p. [Google Scholar]
- Swedish Board of Agriculture. Rekommendationer för Gödsling och Kalkning 2020; Swedish Board of Agriculture: Stockholm, Sweden, 2019; 113p, Available online: https://www2.jordbruksverket.se/download/18.6fd5d28c16f8ba7a70b48310/1578649240143/jo19_12v2.pdf (accessed on 24 October 2021).
- Nahm, K.H. Efficient phosphorus utilization in poultry feeding to lessen the environmental impact of excreta. Worlds. Poult. Sci. J. 2007, 63, 625–654. [Google Scholar] [CrossRef]
- Kebreab, E.; Strathe, A.B.; Yitbarek, A.; Nyachoti, C.M.; Dijkstra, J.; Lopez, S.; France, J. Modeling the efficiency of phosphorus utilization in growing pigs. J. Anim. Sci. 2011, 89, 2774–2781. [Google Scholar] [CrossRef]
- Kuhn, T. The revision of the German Fertiliser Ordinance in 2017. Food Resour. Econ. Discuss. Pap. 2017, 2, 1–25. [Google Scholar] [CrossRef]
- Klages, S.; Heidecke, C.; Osterburg, B.; Bailey, J.; Calciu, I.; Casey, C.; Dalgaard, T.; Frick, H.; Glavan, M.; D’Haene, K.; et al. Nitrogen surplus-a unified indicator for water pollution in Europe? Water 2020, 12, 1197. [Google Scholar] [CrossRef] [Green Version]
- Oster, M.; Reyer, H.; Keiler, J.; Ball, E.; Mulvenna, C.; Muráni, E.; Ponsuksili, S.; Wimmers, K. Comfrey (Symphytum spp.) as an alternative field crop contributing to closed agricultural cycles in chicken feeding. Sci. Total Environ. 2020, 742, 140490. [Google Scholar] [CrossRef]
- Otten, D.; Van den Weghe, H.F.A. Nitrogen and phosphorus management on pig farms in Northwest Germany nutrient balances and challenges for better sustainability. Int. J. Livest. Prod. 2014, 4, 60–69. [Google Scholar] [CrossRef] [Green Version]
- Poulsen, H.D.; Jongbloed, A.W.; Latimier, P.; Fernández, J.A. Nitrogen and phosphorus consumption, utilisation and losses in pig production: The Netherlands. Livest. Prod. Sci. 1999, 58, 213–224. [Google Scholar] [CrossRef]
- Sharpley, A.N.; Herron, S.; Daniel, T. Overcoming the challenges of phosphorus-based management in poultry farming. J. Soil Water Conserv. 2007, 62, 375–389. [Google Scholar]
- Anzai, H.; Wang, L.; Oishi, K.; Irbis, C.; Li, K.; Kumagai, H.; Inamura, T.; Hirooka, H. Estimation of nitrogen and phosphorus flows in livestock production in Dianchi Lake basin, China. Anim. Sci. J. 2016, 87, 37–45. [Google Scholar] [CrossRef] [PubMed]
- Berg, M.; Meehan, M.; Franzen, D.; Scherer, T. Phosphorus Behavior In the Environment. North Dak. State Univ. 2018, 1298, 1–4. [Google Scholar]
- Fink, J.R.J.R.; Inda, A.V.; Tiecher, T.; Barrón, V.; Vasconcellos Inda, A.; Barrón, V. Iron oxides and organic matter on soil phosphorus availability. Ciência E Agrotecnologia 2016, 40, 369–379. [Google Scholar] [CrossRef] [Green Version]
- Ballabio, C.; Panagos, P.; Monatanarella, L. Mapping topsoil physical properties at European scale using the LUCAS database. Geoderma 2016, 261, 110–123. [Google Scholar] [CrossRef]
- Makovníková, J.; Širáň, M.; Houšková, B.; Pálka, B.; Jones, A. Comparison of different models for predicting soil bulk density. Case study—Slovakian agricultural soils. Int. Agrophys. 2017, 31, 491–498. [Google Scholar] [CrossRef] [Green Version]
- Vadas, P.A.; Mallarino, A.P.; McFarland, A.N.N.E. The Importance of Sampling Depth When Testing Soils for Their Potential to Supply Phosphorus to Surface Runoff; USDA: Washington, DC, USA, 2003. [Google Scholar]
- Lory, J. Managing Manure Phosphorus to Protect Water Quality; University of Missouri Columbia: Columbia, MI, USA, 2018; 6p, Available online: https://extension.missouri.edu/media/wysiwyg/Extensiondata/Pub/pdf/agguides/soils/g09182.pdf (accessed on 24 October 2021).
- Bai, Z.; Li, H.; Yang, X.; Zhou, B.; Shi, X.; Wang, B.; Li, D.; Shen, J.; Chen, Q.; Qin, W.; et al. The critical soil P levels for crop yield, soil fertility and environmental safety in different soil types. Plant Soil 2013, 372, 27–37. [Google Scholar] [CrossRef]
- Wang, Y.T.; Zhang, T.Q.; O’Halloran, I.P.; Tan, C.S.; Hu, Q.C.; Reid, D.K. Soil Tests as Risk Indicators for Leaching of Dissolved Phosphorus from Agricultural Soils in Ontario. Soil Sci. Soc. Am. J. 2012, 76, 220–229. [Google Scholar] [CrossRef]
- Hu, Z.; Ding, Z.; Al-yasi, H.M.; Ali, E.F.; Eissa, M.A.; Abou-elwafa, S.F.; Sayed, M.A.; Said, M.T.; Said, A.A. Modeling of Phosphorus Nutrition to Obtain Maximum Yield, High P Use Efficiency and Low P-Loss Risk for Wheat Grown in Sandy Calcareous Soils. Agronomy 2021, 11, 1950. [Google Scholar] [CrossRef]
- do Carmo Horta, M.; Roboredo, M.; Coutinho, J.; Torrent, J. Relationship between Olsen P and ammonium lactate-extractable P in Portuguese acid soils. Commun. Soil Sci. Plant Anal. 2010, 41, 2358–2370. [Google Scholar] [CrossRef]
- Rowe, H.; Withers, P.J.A.; Baas, P.; Chan, N.I.; Doody, D.; Holiman, J.; Jacobs, B.; Li, H.; MacDonald, G.K.; McDowell, R.; et al. Integrating legacy soil phosphorus into sustainable nutrient management strategies for future food, bioenergy and water security. Nutr. Cycl. Agroecosyst. 2016, 104, 393–412. [Google Scholar] [CrossRef]
- Johnston, A.E.; Syers, J.K. A New Approach to Assessing Phosphorus Use Efficiency in Agriculture. Better Crop. 2009, 93, 14–16. [Google Scholar]
- Piccoli, I.; Sartori, F.; Polese, R.; Borin, M.; Berti, A. Can Long-Term Experiments Predict Real Field N and P Balance and System Sustainability? Results from Maize, Winter Wheat, and Soybean Trials Using Mineral and Organic Fertilisers. Agronomy 2021, 11, 1472. [Google Scholar] [CrossRef]
- Roy, R.N.; Finck, A.; Blair, G.J.; Tandon, H.L.S. Plant nutrition for food security. In FAO Fertilizer and Plant Nutrition Bulletin; FAO: Rome, Italy, 2006; Volume 16, 368p, Available online: https://www.fao.org/fileadmin/templates/soilbiodiversity/Downloadable_files/fpnb16.pdf (accessed on 24 October 2021).
- Crooks, W.; Sinclair, A.; Edwards, A.; Coull, M. Phosphate and potash recommendations for crops grown in Highlands and Islands. Scotl. Rural Dev. Program. Farm Advis. Serv. 2020, 10. Available online: https://www.sruc.ac.uk/media/8d8ef82fd2ead51/tn715-phosphate-and-potash-recommendations-for-crops-grown-in-highland-and-islands-16-3-2020.pdf (accessed on 24 October 2021).
- Leikam, D.F.; Lamond, R.E. Estimating Manure Nutrient Availability; Kansas State University: Manhattan, KS, USA, 2003; Volume MF-2562. [Google Scholar]
- Sullivan, D.M. Estimating Plant—Available Nitrogen from Manure; Oregon State University Extension Service: Corvallis, OR, USA, 2008. [Google Scholar]
- Zhang, H.; Johnson, G. Managing Phosphorus from Animal Manure. Oklahoma Coop. Ext. Serv. 2010, PSS-2249, 1–4. [Google Scholar]
- Petersen, S.O.; Lind, A.M.; Sommer, S.G. Nitrogen and organic matter losses during storage of cattle and pig manure. J. Agric. Sci. 1998, 130, 69–79. [Google Scholar] [CrossRef]
- Sörensen, P.; Poulsen, H.D.; Holton Rubaek, G.; Pilgaard Vinther, F.; Pedersen, B.F.; Kristensen, I.B.S. Udredning om Anvendelse af Gødning i Dansk Landbrug i Relation til Indførslen af Fosforlofter; DCA-Nationalt Center for Fødevarer og Jordbrug, Aarhus University: Aarhus, Denmark, 2019. [Google Scholar]
- Luostarinen, S.; Grönroos, J.; Hellstedt, M.; Nousiainen, J.; Munther, J. Modeling Manure Quantity and Quality in Finland. Front. Sustain. Food Syst. 2018, 2, 60. [Google Scholar] [CrossRef]
- Abdollahi, M.R.; Ravindran, V.; Svihus, B. Pelleting of broiler diets: An overview with emphasis on pellet quality and nutritional value. Anim. Feed Sci. Technol. 2013, 179, 1–23. [Google Scholar] [CrossRef]
- Luostarinen, S.; Grönroos, J.; Hellstedt, M.; Nousiainen, J.; Munther, J. Finnish Normative Manure System: System Documentation and First Results. Natural Resources Bioeconomy Studies 48/2017; Natural Resources Inst.: Helsinki, Finland, 2017; 74p. [Google Scholar]
- Kebreab, E.; Hansen, A.V.; Strathe, A.B. Animal production for efficient phosphate utilization: From optimized feed to high efficiency livestock. Curr. Opin. Biotechnol. 2012, 23, 872–877. [Google Scholar] [CrossRef] [Green Version]
- Houlton, B.Z.; Almaraz, M.; Aneja, V.; Austin, A.T.; Bai, E.; Cassman, K.G.; Compton, J.E.; Davidson, E.A.; Erisman, J.W.; Galloway, J.N.; et al. A World of Cobenefits: Solving the Global Nitrogen Challenge. Earth’s Future 2019, 7, 865–872. [Google Scholar] [CrossRef] [PubMed] [Green Version]
- Mahmud, K.; Panday, D.; Mergoum, A.; Missaoui, A. Nitrogen losses and potential mitigation strategies for a sustainable agroecosystem. Sustainability 2021, 13, 2400. [Google Scholar] [CrossRef]
- Sommer, S.G.; Knudsen, L. Impact of Danish Livestock and Manure Management Regulations on Nitrogen Pollution, Crop Production, and Economy. Front. Sustain. 2021, 2, 1–15. [Google Scholar] [CrossRef]
- Deloitte Sustainability, British Geological Survey, Bureau de Recherches Géologiques et Minieres, N.O.A.S.R. Study on the Review of the List of Critical Raw Materials; European Commission: Brussels, Belgium, 2017; 92p. [Google Scholar] [CrossRef]
- European Commission. EU Agricultural Outlook for the Agricultural Markets and Income 2017–2030; European Commission: Brussels, Belgium, 2017. [Google Scholar]
- Bomans, E.; Fransen, K.; Gobin, A.; Mertens, J.; Michiels, P.; Vandendriessche, H.; Vogels, N. Addressing Phosphorus Related Problems in Farm Practice: Final Report to the European Comission; European Commission: Brussels, Belgium, 2005; Volume 32. [Google Scholar]
- Withers, P.J.A.; van Dijk, K.C.; Neset, T.S.S.; Nesme, T.; Oenema, O.; Rubæk, G.H.; Schoumans, O.F.; Smit, B.; Pellerin, S. Stewardship to tackle global phosphorus inefficiency: The case of Europe. Ambio 2015, 44, 193–206. [Google Scholar] [CrossRef] [Green Version]
- Buczko, U.; Kuchenbuch, R.O. Review Article: Phosphorus indices as risk-assessment tools in the U.S.A. and Europe—A review. J. Plant Nutr. Soil Sci. 2007, 170, 445–460. [Google Scholar] [CrossRef]
- Rosemarin, A.; Ekane, N. The governance gap surrounding phosphorus. Nutr. Cycl. Agroecosyst. 2016, 104, 265–279. [Google Scholar] [CrossRef]
- Schoumans, O.F.; Rulkens, W.H.; Oenema, O.; Ehlert, P.A.I. Phosphorus recovery from animal manure; Technical opportunities and agro-economical perspectives. Alterra Rep. 2010, 2158, 110, ISSN 1566-7197. [Google Scholar]
- McCrackin, M.L.; Muller-Karulis, B.; Gustafsson, B.G.; Howarth, R.W.; Humborg, C.; Svanbäck, A.; Swaney, D.P. A Century of Legacy Phosphorus Dynamics in a Large Drainage Basin. Global Biogeochem. Cycles 2018, 32, 1107–1122. [Google Scholar] [CrossRef]
- Svanbäck, A.; McCrackin, M.L.; Swaney, D.P.; Linefur, H.; Gustafsson, B.G.; Howarth, R.W.; Humborg, C. Reducing agricultural nutrient surpluses in a large catchment—Links to livestock density. Sci. Total Environ. 2019, 648, 1549–1559. [Google Scholar] [CrossRef] [PubMed]
Figure 1.
Annual number of heads of live swine (a) and 1000s of heads of broiler chicken (b) in each of the NUTS2 Regions in 2016 for all farm size categories from 2 to over 100 ha (generated in 2021 by the authors from https://ec.europa.eu/eurostat/data/database (accessed on 24 October 2021)).
Figure 1.
Annual number of heads of live swine (a) and 1000s of heads of broiler chicken (b) in each of the NUTS2 Regions in 2016 for all farm size categories from 2 to over 100 ha (generated in 2021 by the authors from https://ec.europa.eu/eurostat/data/database (accessed on 24 October 2021)).

Figure 2.
Topsoil phosphorus levels (Olsen P mg P/kg [44]) within the EU [45]. With permission from the author Cristiano Ballabio.

Figure 3.
Concept of the NUE indicator: a two-dimensional N input–N output diagram. Shows three ranges of possible NUE values for cropping systems (0–50%, 50–90%, and >90%) with a minimum desired N output (80 kgN/ha/year) and a maximum desired surplus of 80 kgN/ha/year [52]. With permission from the EU Nitrogen Expert Panel (Oene Oenema).

Figure 4.
Theory behind the critical values of extractable soil P, determining optimal yield, beyond which, surplus and potential loss via surface runoff occur. Source: https://water.unl.edu/phosphorus-dynamics (accessed on 24 October 2021).
Figure 4.
Theory behind the critical values of extractable soil P, determining optimal yield, beyond which, surplus and potential loss via surface runoff occur. Source: https://water.unl.edu/phosphorus-dynamics (accessed on 24 October 2021).

Figure 5.
Annual mass balance of P (kgs) in a typical pig farm with 300 sow (breeder) units and 1000 finisher units. Feed input represents 14,000 kg P. The cropland area receiving manure was 183 ha. Based on data derived from [69].
Figure 5.
Annual mass balance of P (kgs) in a typical pig farm with 300 sow (breeder) units and 1000 finisher units. Feed input represents 14,000 kg P. The cropland area receiving manure was 183 ha. Based on data derived from [69].

Figure 6.
Relative annual P flow dynamics for broilers with feed set to 100% (based in part on data from Sharpley [71]). Soil deposition level and runoff losses will vary from case to case, depending on local soil type, soil P levels, cover crops, precipitation, and topographic conditions.
Figure 6.
Relative annual P flow dynamics for broilers with feed set to 100% (based in part on data from Sharpley [71]). Soil deposition level and runoff losses will vary from case to case, depending on local soil type, soil P levels, cover crops, precipitation, and topographic conditions.

Figure 7.
Graph depicting the total P input from manure and crop P offtake along with lines indicating 90% and 67% PUE and the 10 kgP/ha/year surplus line from the German Fertilizer Ordinance [66]. The “desirable” minimum offtake is only indicative as is the “desirable zone” of PUE and surplus. These would need to be estimated from case to case, depending on crop, soil, and local conditions.

Figure 8.
Graphic showing the relationship between the effective N/P ratio of manure applied at 80 kgN/ha/year and the resulting soil P surplus for crops at an offtake of 15 kgP/ha/year. A minus surplus represents “mining” of the P reserves in the soil.
Figure 8.
Graphic showing the relationship between the effective N/P ratio of manure applied at 80 kgN/ha/year and the resulting soil P surplus for crops at an offtake of 15 kgP/ha/year. A minus surplus represents “mining” of the P reserves in the soil.

Figure 9.
Graphic showing the relationship between the effective N/P ratio of manure applied at 170 kgN/ha/year (maximum standard for Nitrate Vulnerable Zones, EU Nitrates Directive) and the resulting soil P surplus for crops at offtake levels of 15 and 30 kgP/ha/year. A minus surplus represents “mining” of the P reserves in the soil.

Figure 10.
Graphic showing the relationship between the effective N/P ratio of manure applied at 250 kgN/ha/year and the resulting soil P surplus for crops at offtake levels of 15 and 30 kgP/ha/year. A minus surplus represents “mining” of the P reserves in the soil.
Figure 10.
Graphic showing the relationship between the effective N/P ratio of manure applied at 250 kgN/ha/year and the resulting soil P surplus for crops at offtake levels of 15 and 30 kgP/ha/year. A minus surplus represents “mining” of the P reserves in the soil.

Figure 11.
Graphic showing the minimum effective N/P ratios of applied manure and crop P offtake levels (kgP/ha/year) that are required to avoid surplus soil P at stored manure application rates of 80, 170, and 250 kgN/ha/year. The area under each line represents a situation with potential surplus P. Band 1 represents the range of N/P values in ex-animal manure from sows, piglets, and fattening pigs (Danish norms) [92]; band 2 is the N/P range for pig manure ex-storage [91]; bands 3 and 4 are the N/P ranges for ex-animal and ex-storage manure from broiler and egg-laying chickens (Finnish and Danish norms [92,93] and [34].

Figure 12.
A system “mind map” for pig and poultry farms: optimizing feed P, improving animal digestion and retention of P, reducing manure P and soil surplus P, and finally decreasing runoff P. The percentages given in the yellow rectangles reflect results from single factor experiments. The percentages given in the black squares are the overall combined estimates of the various manipulations. The diagram is intended to be indicative of that which is possible to achieve. Sources [64,94,96].


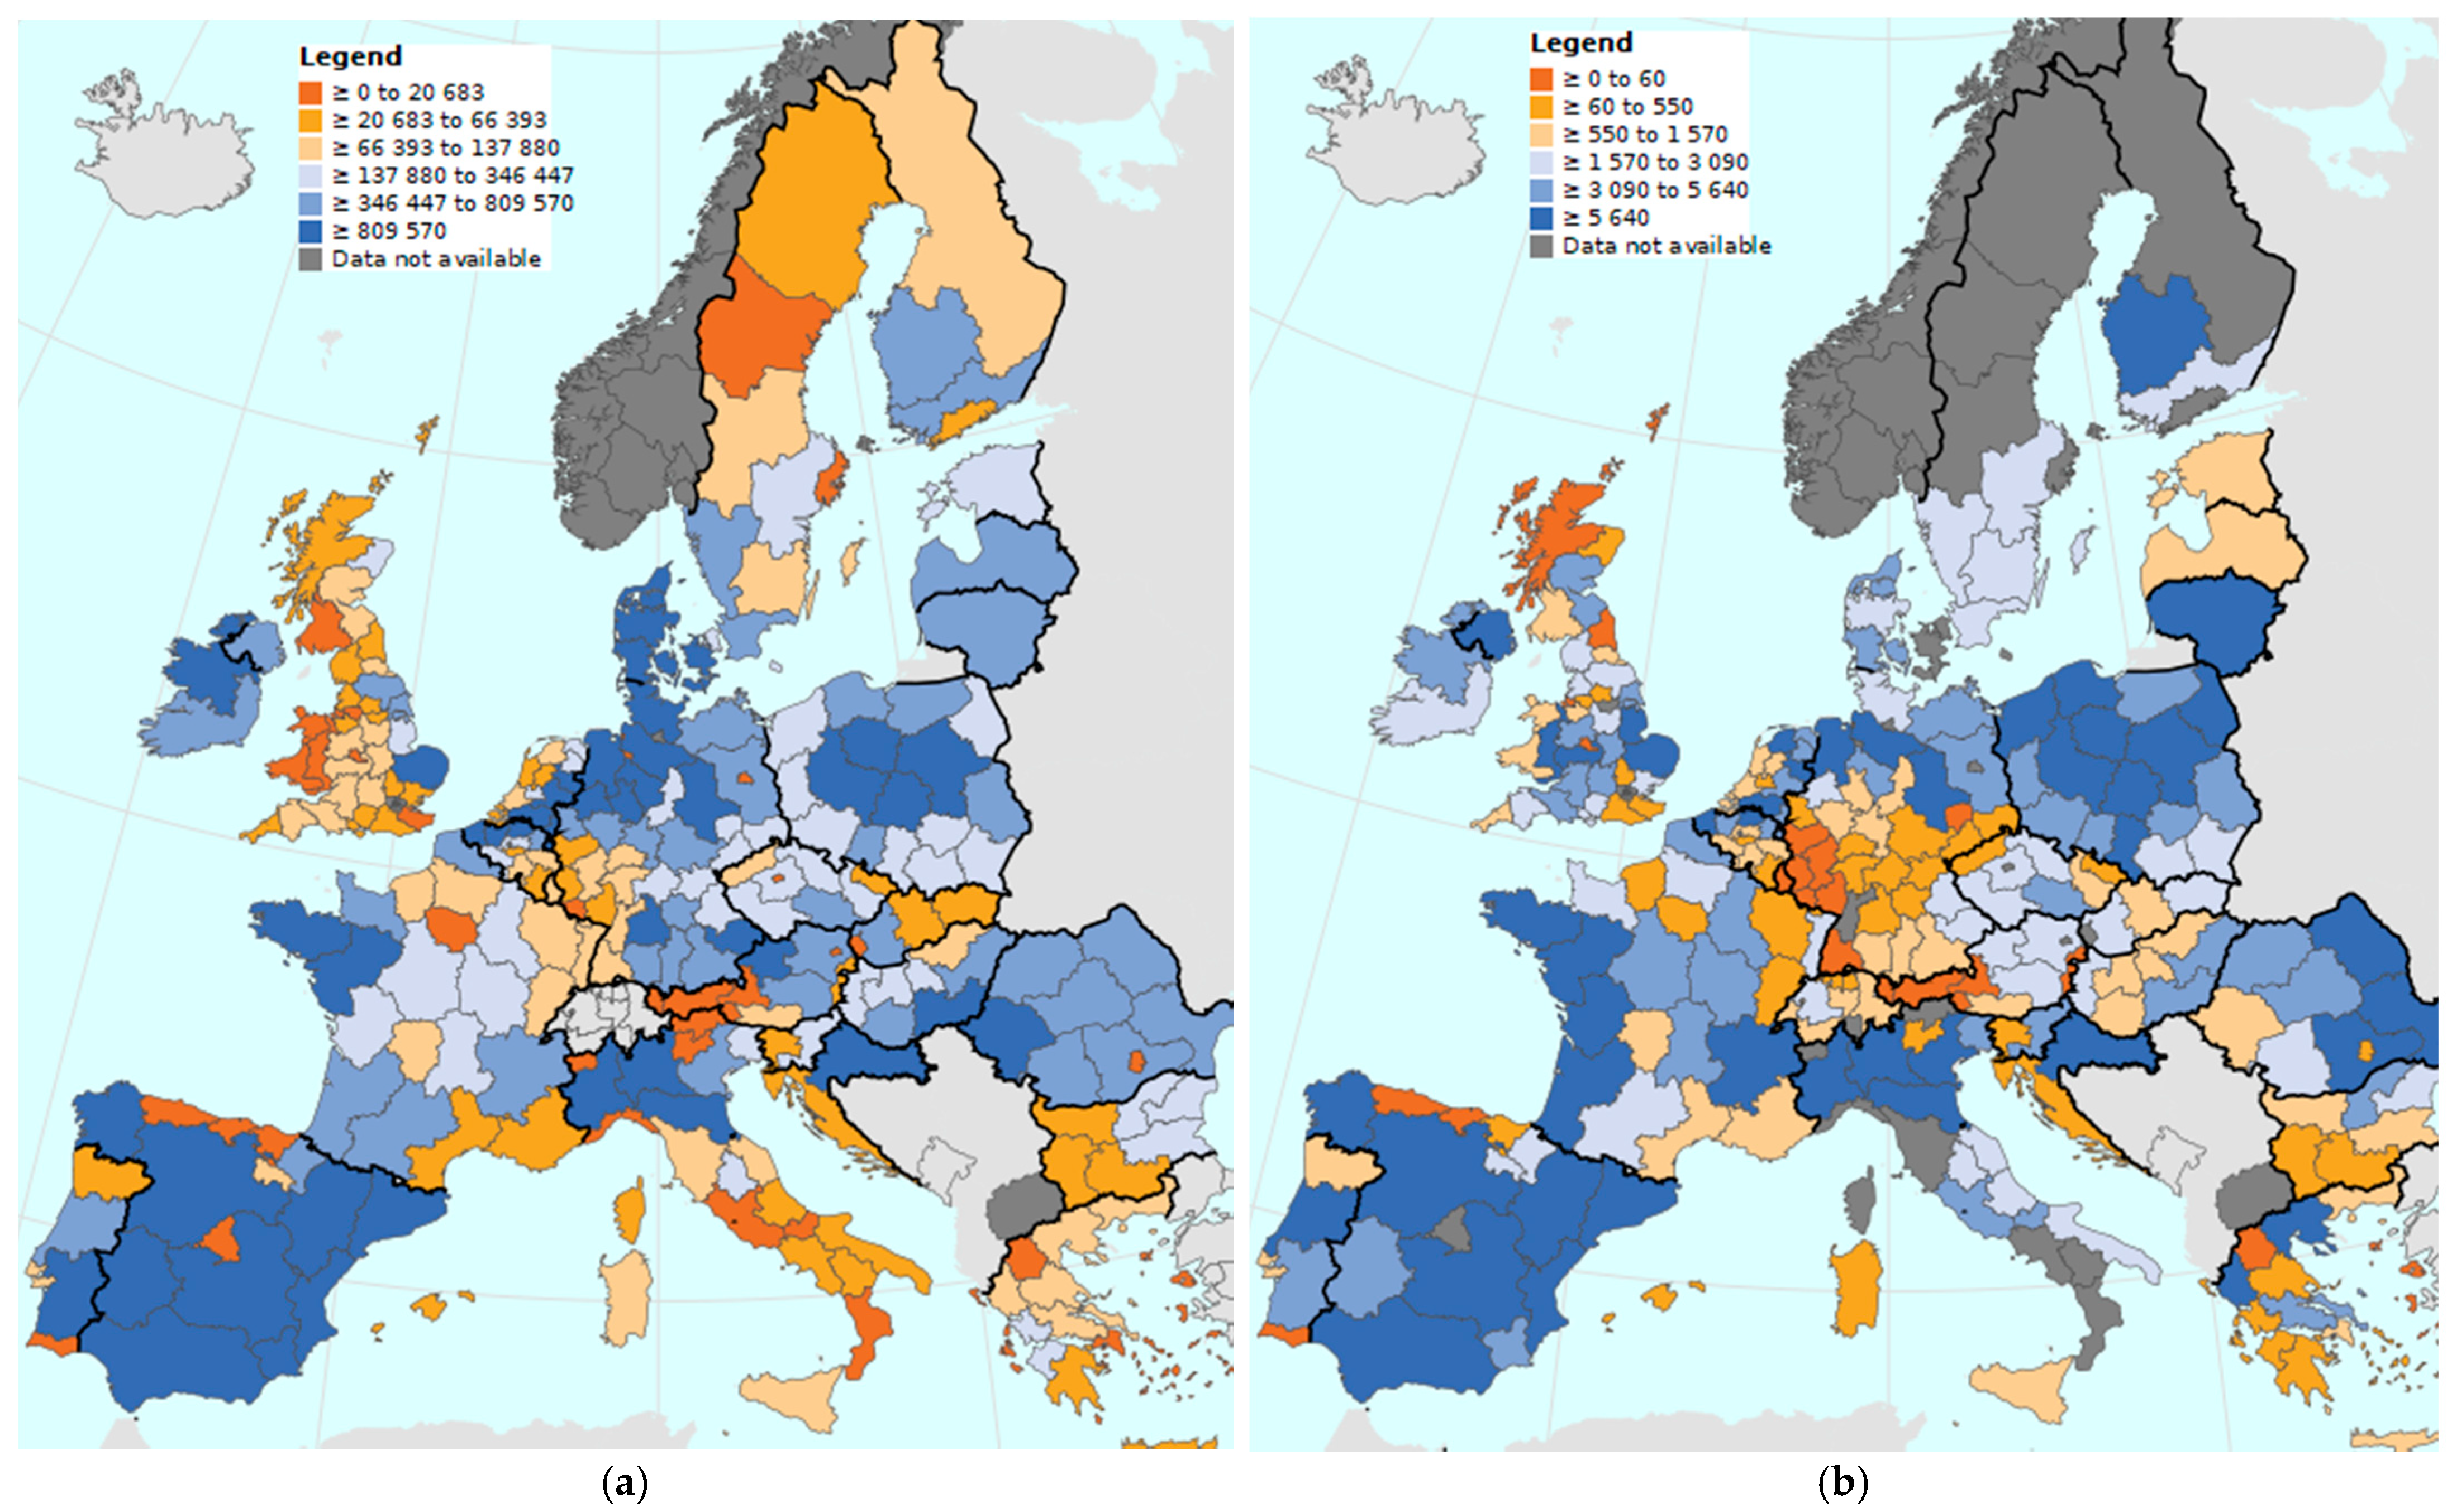
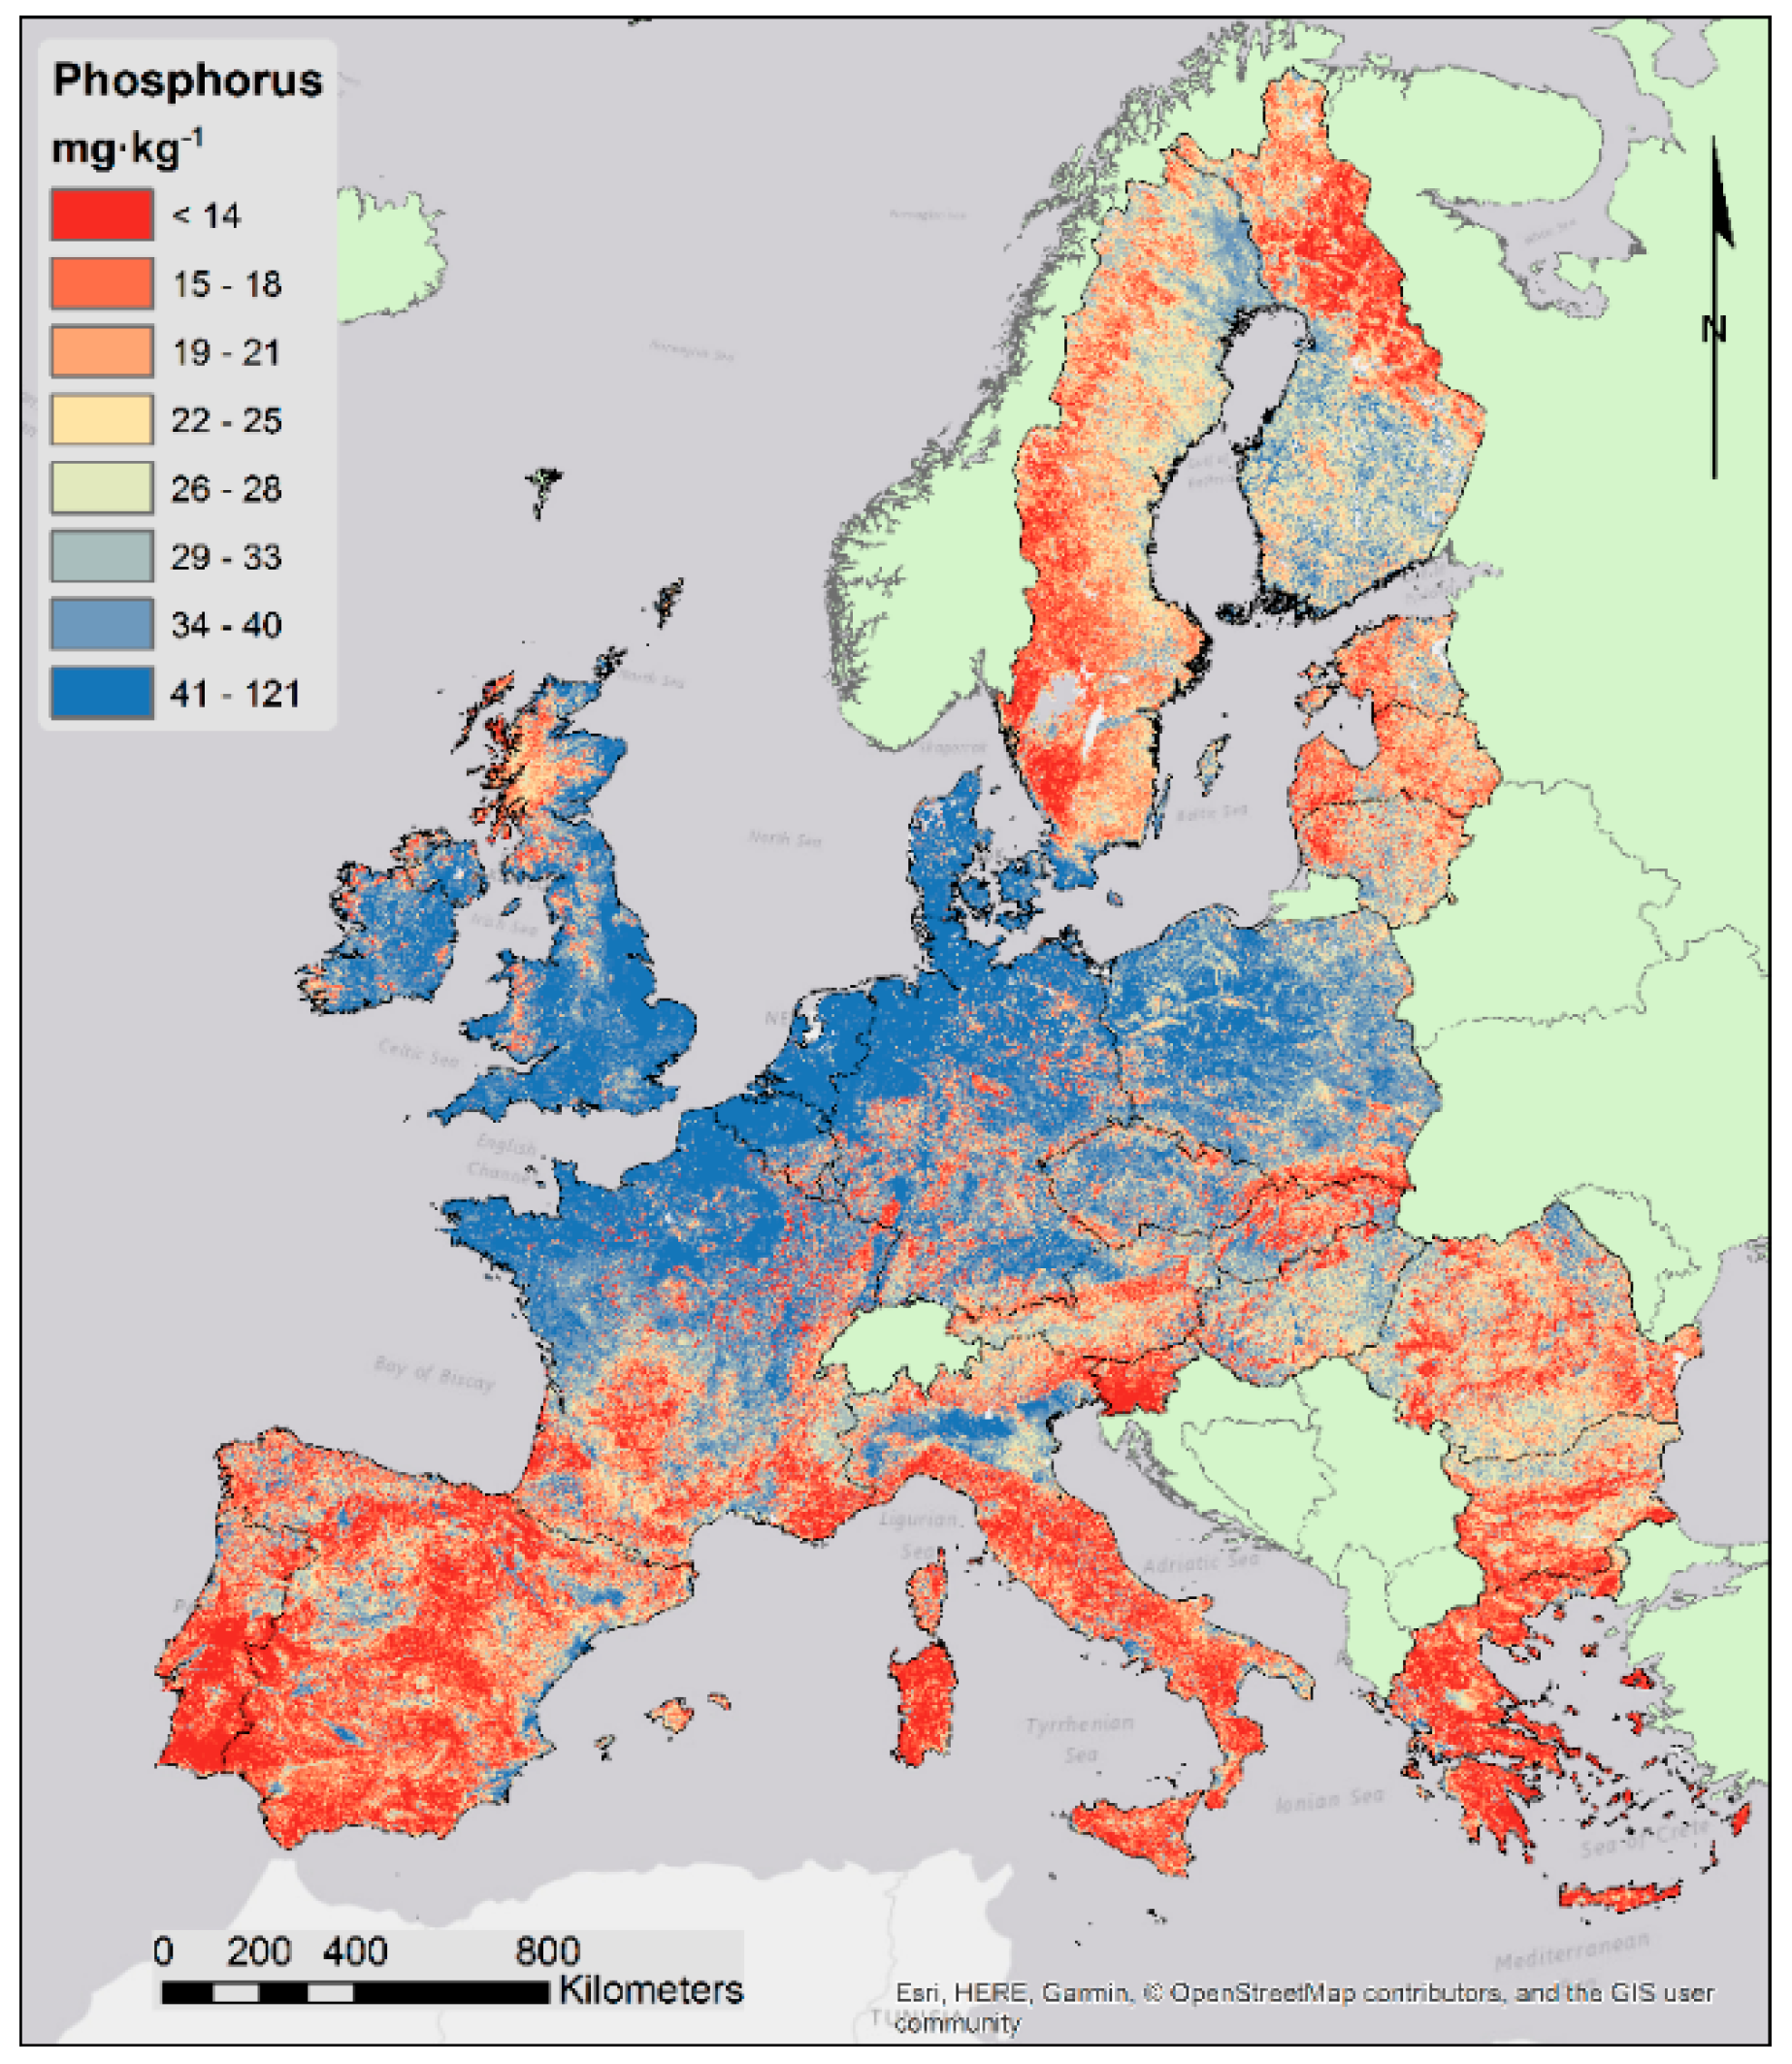
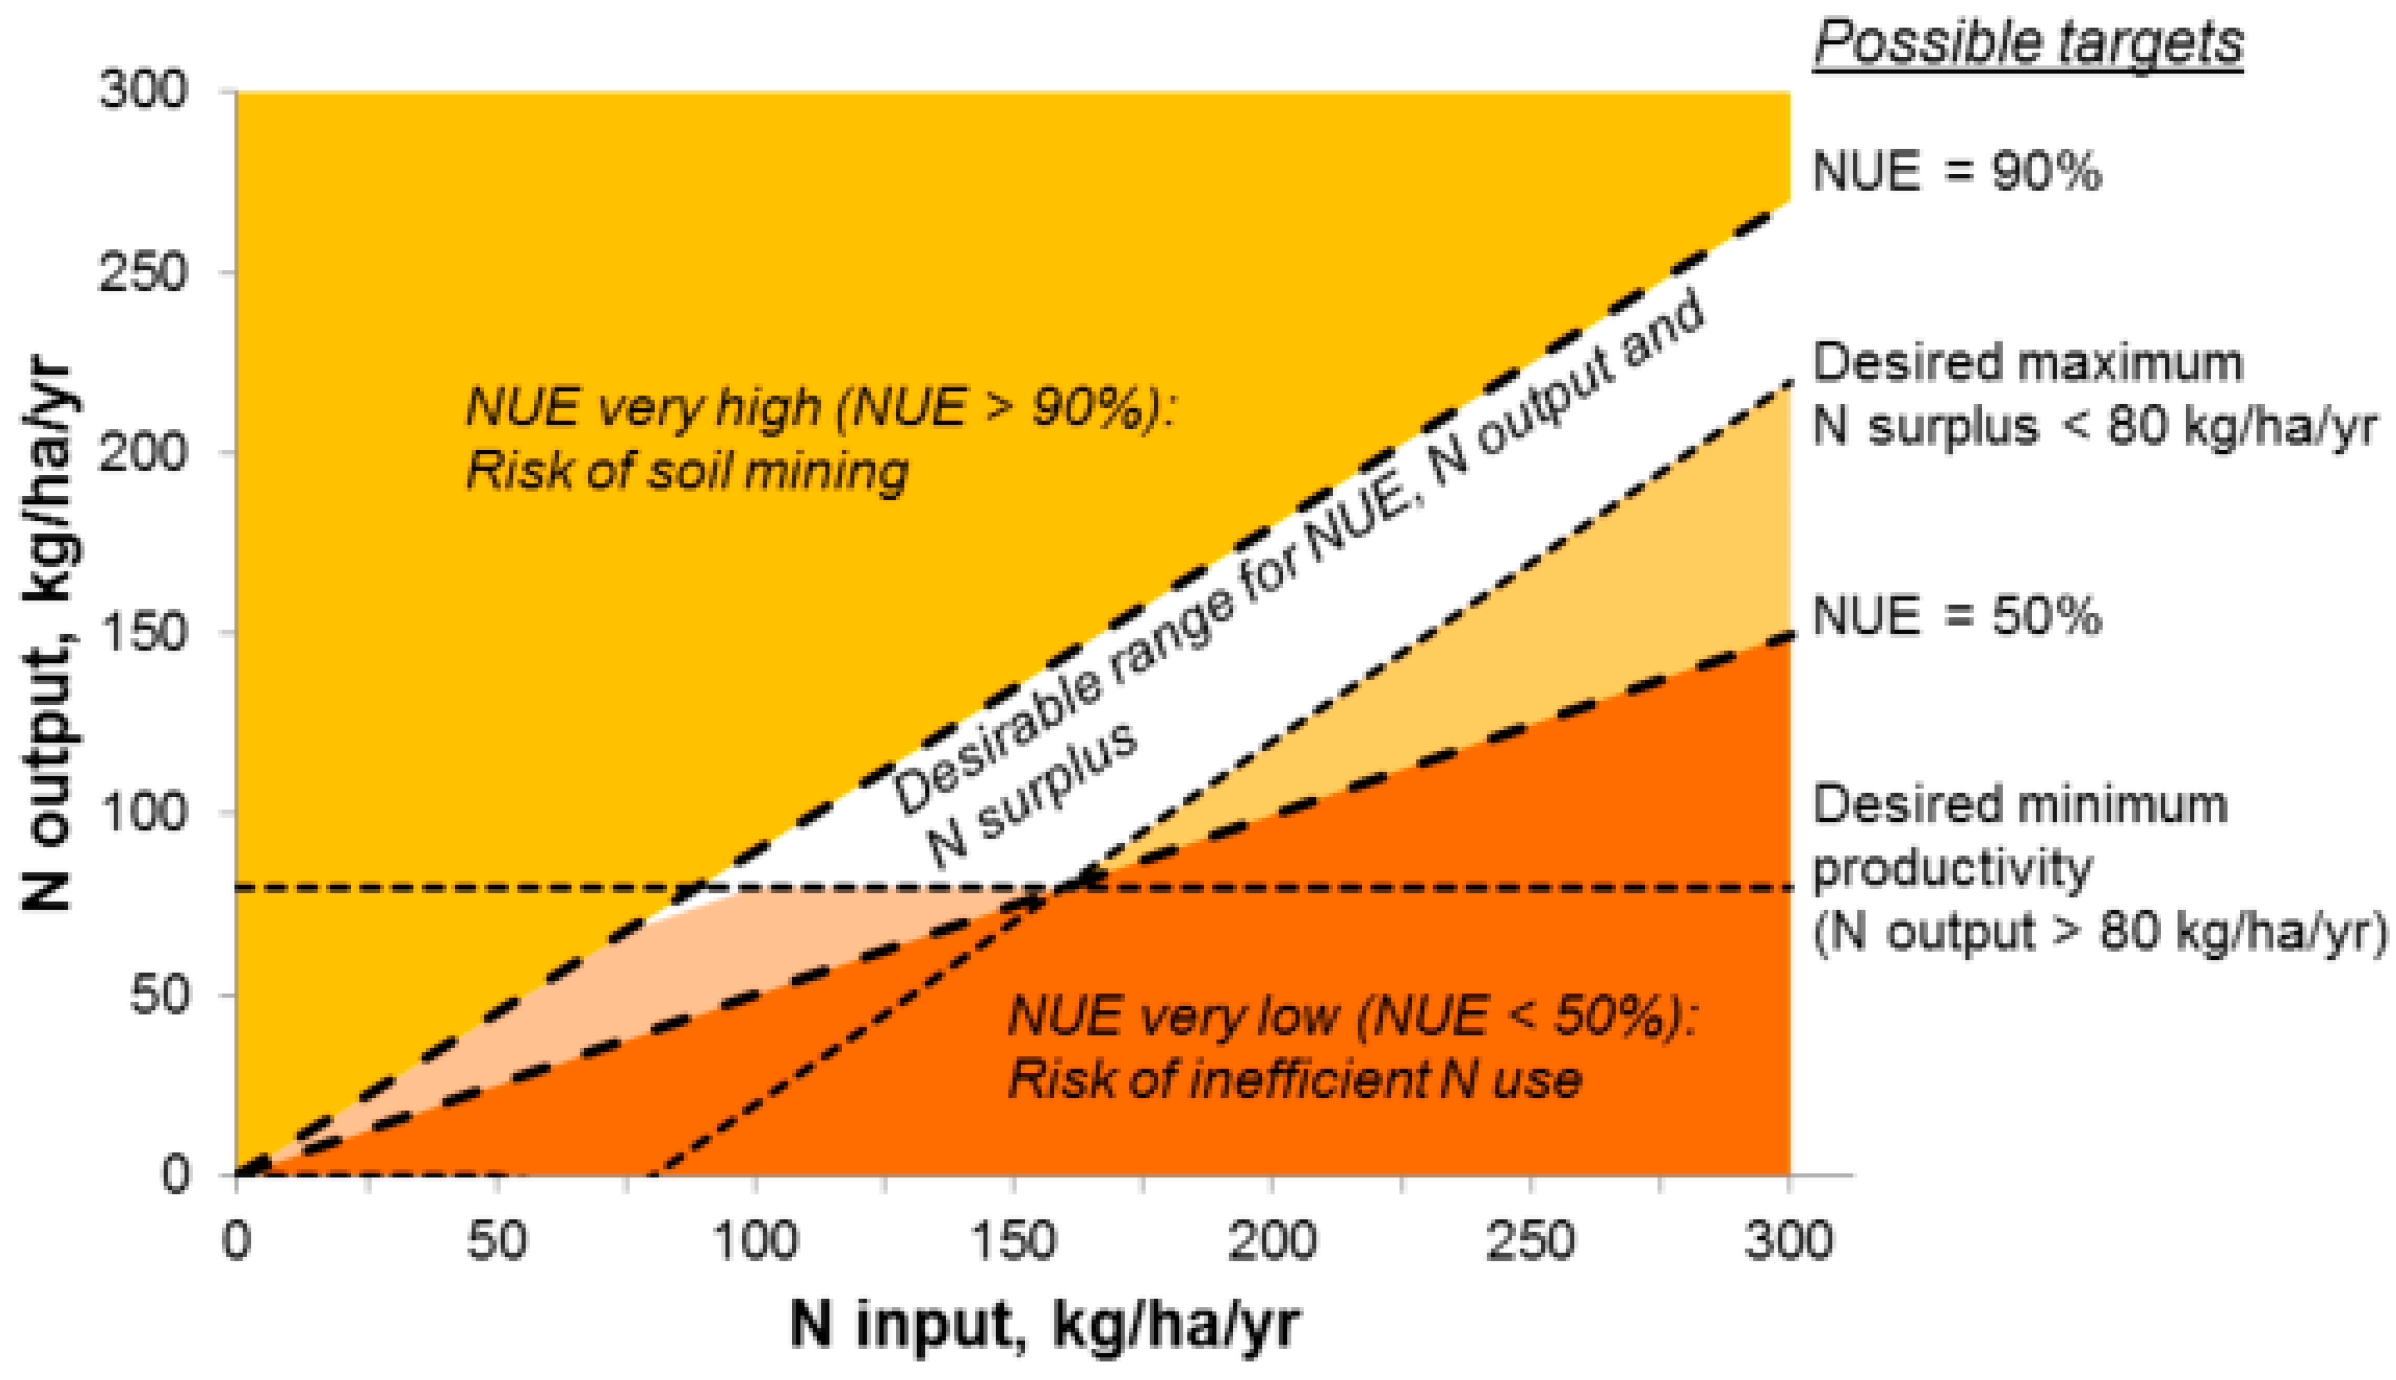
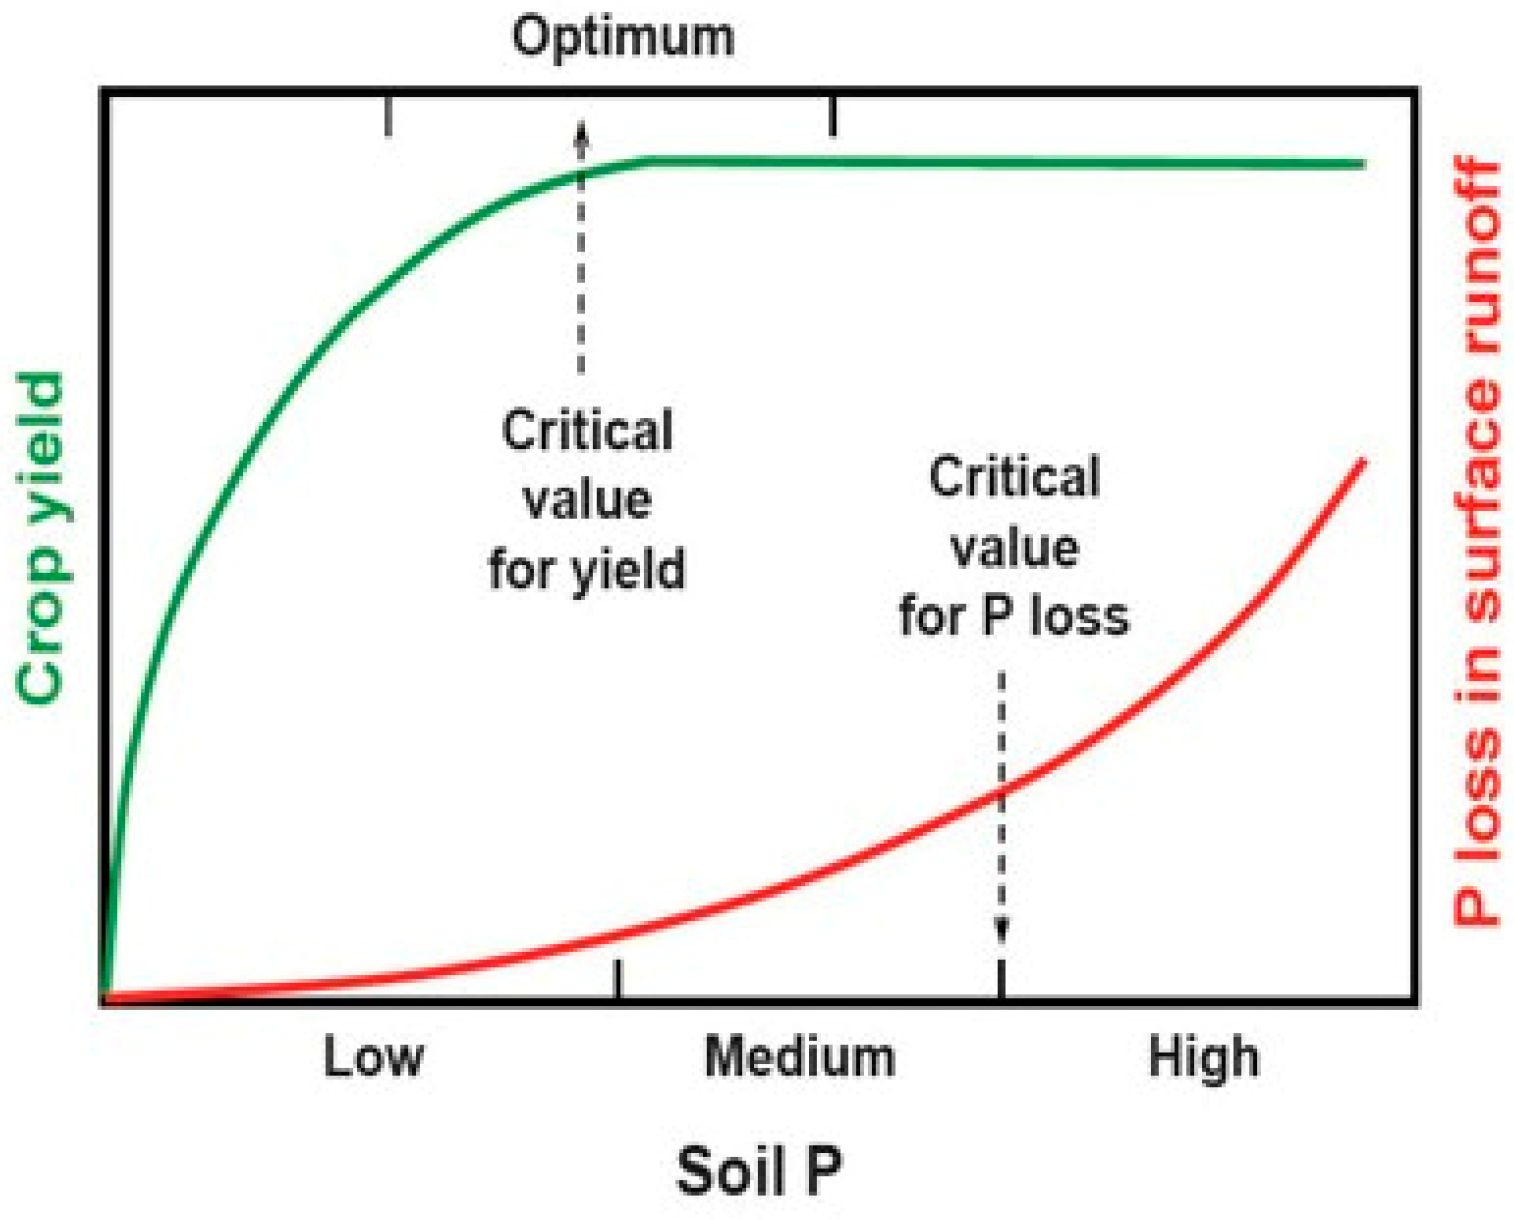
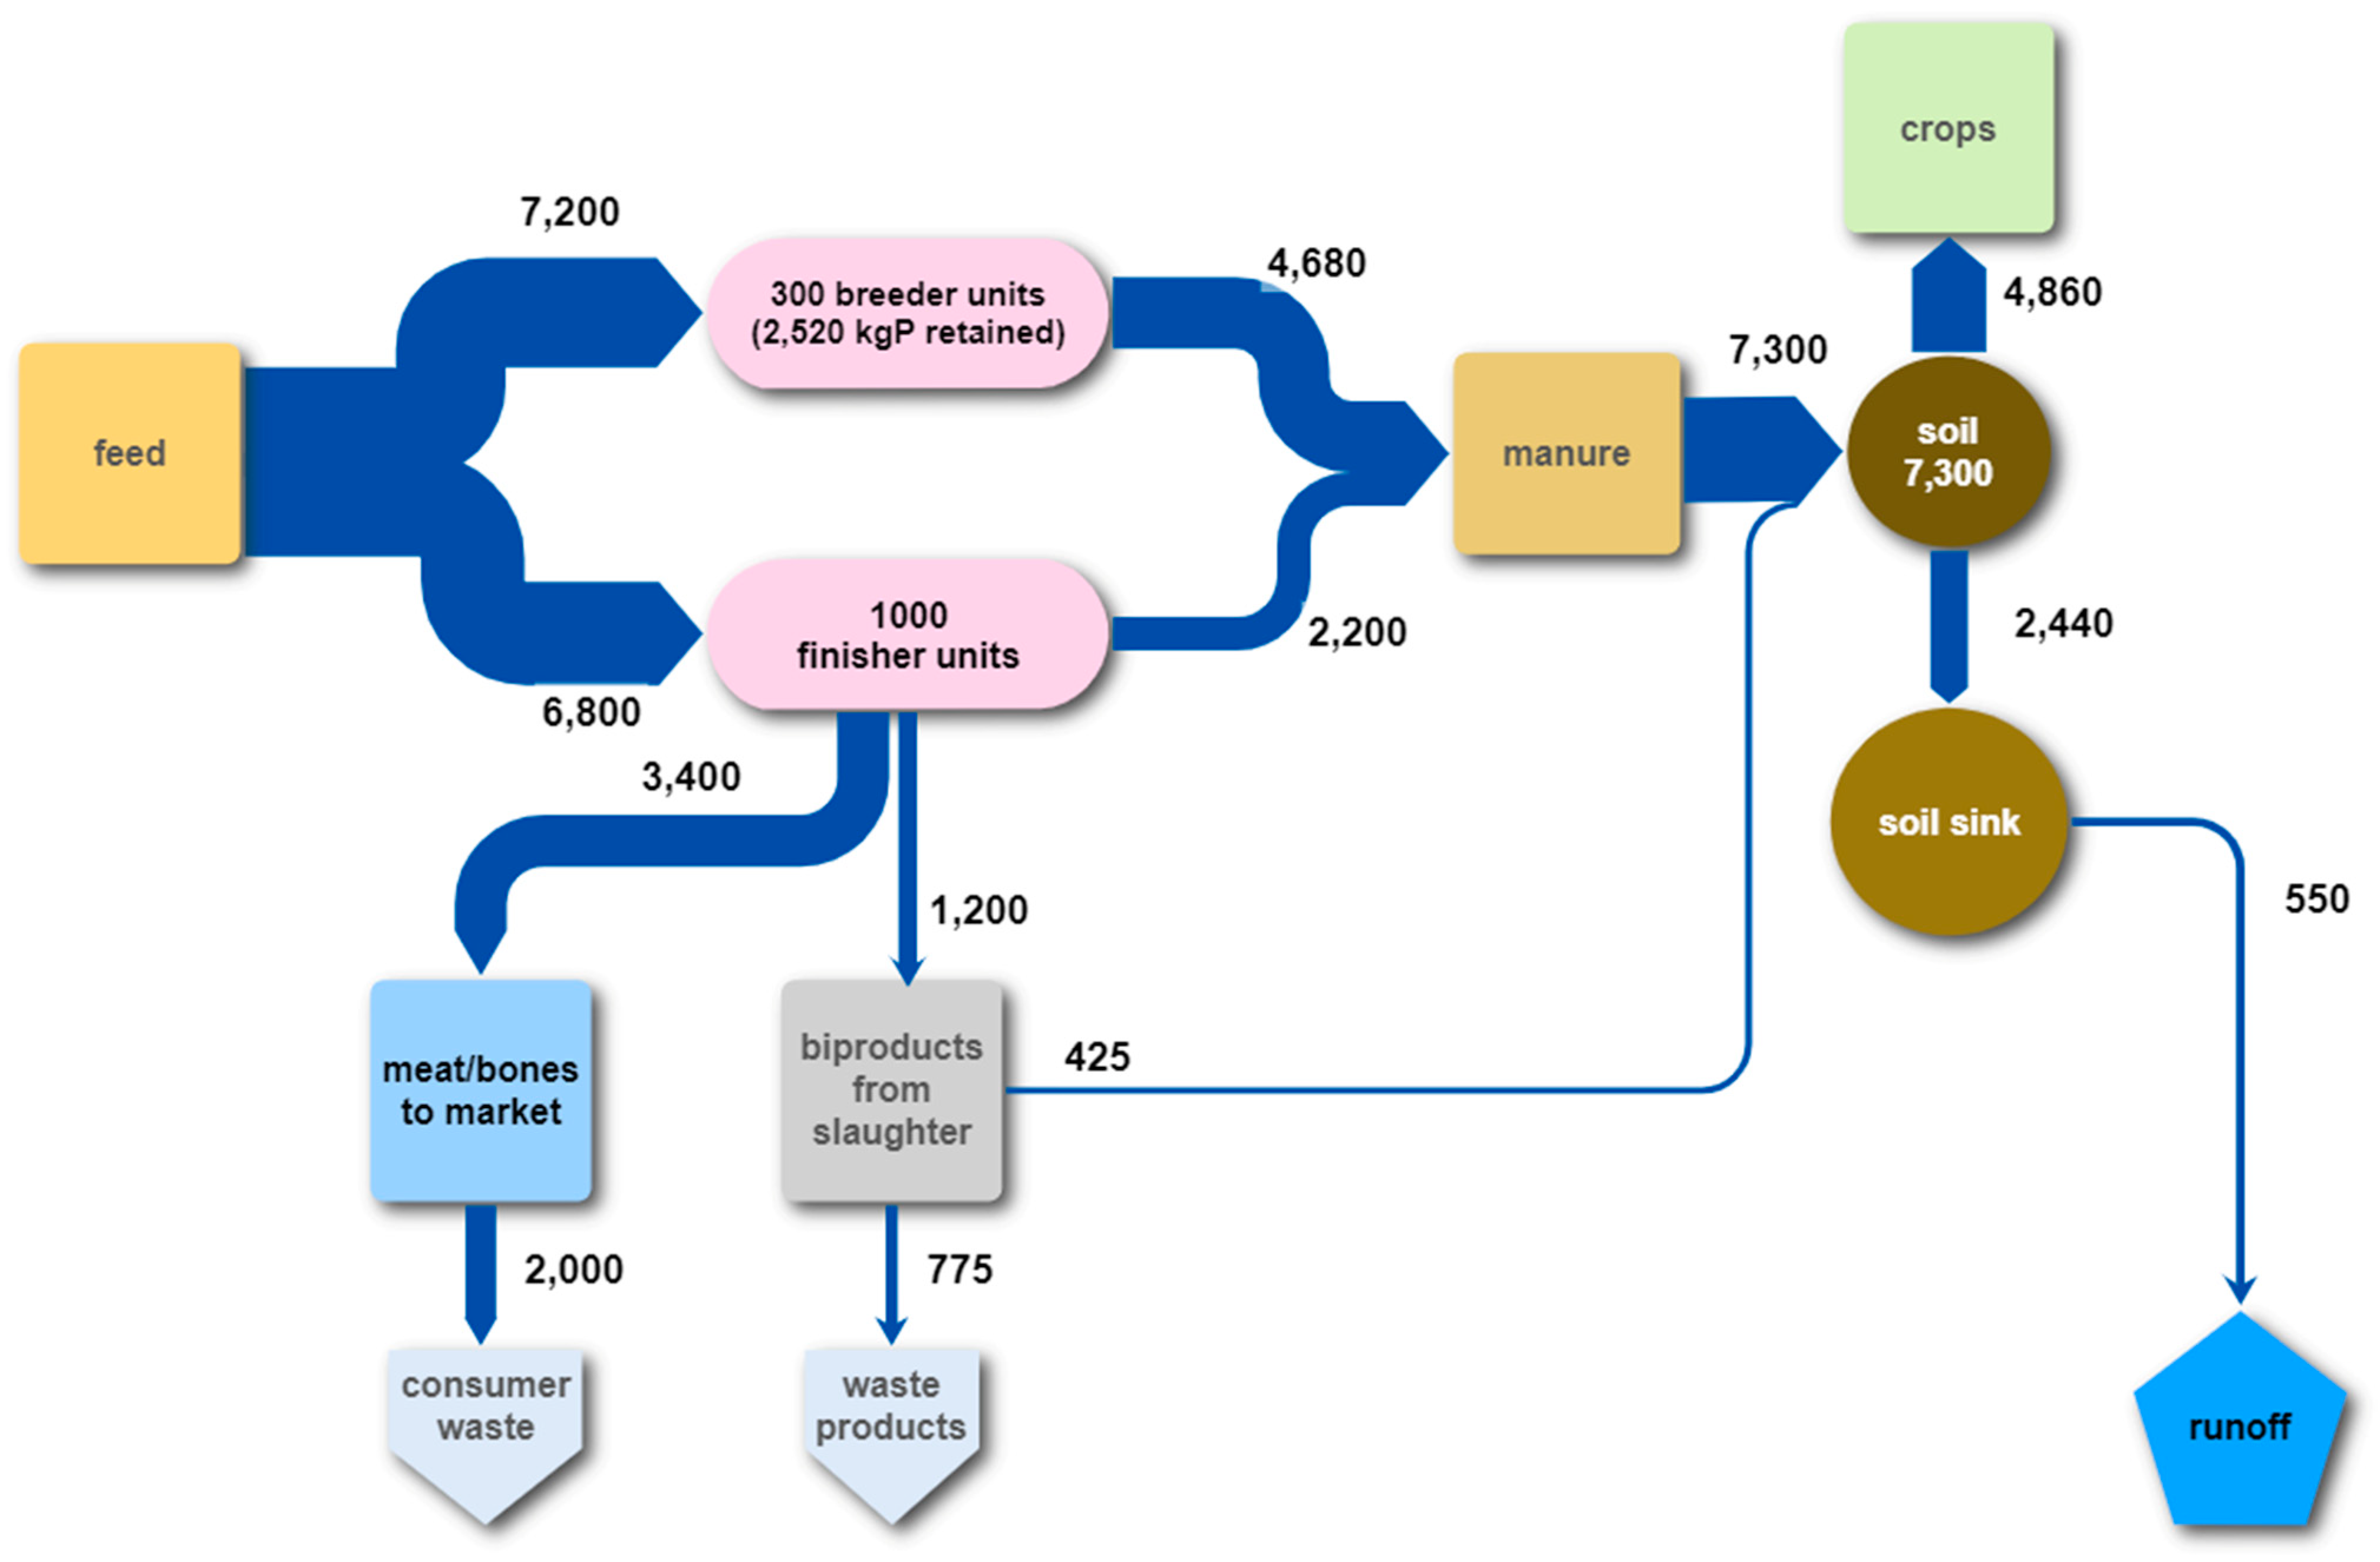
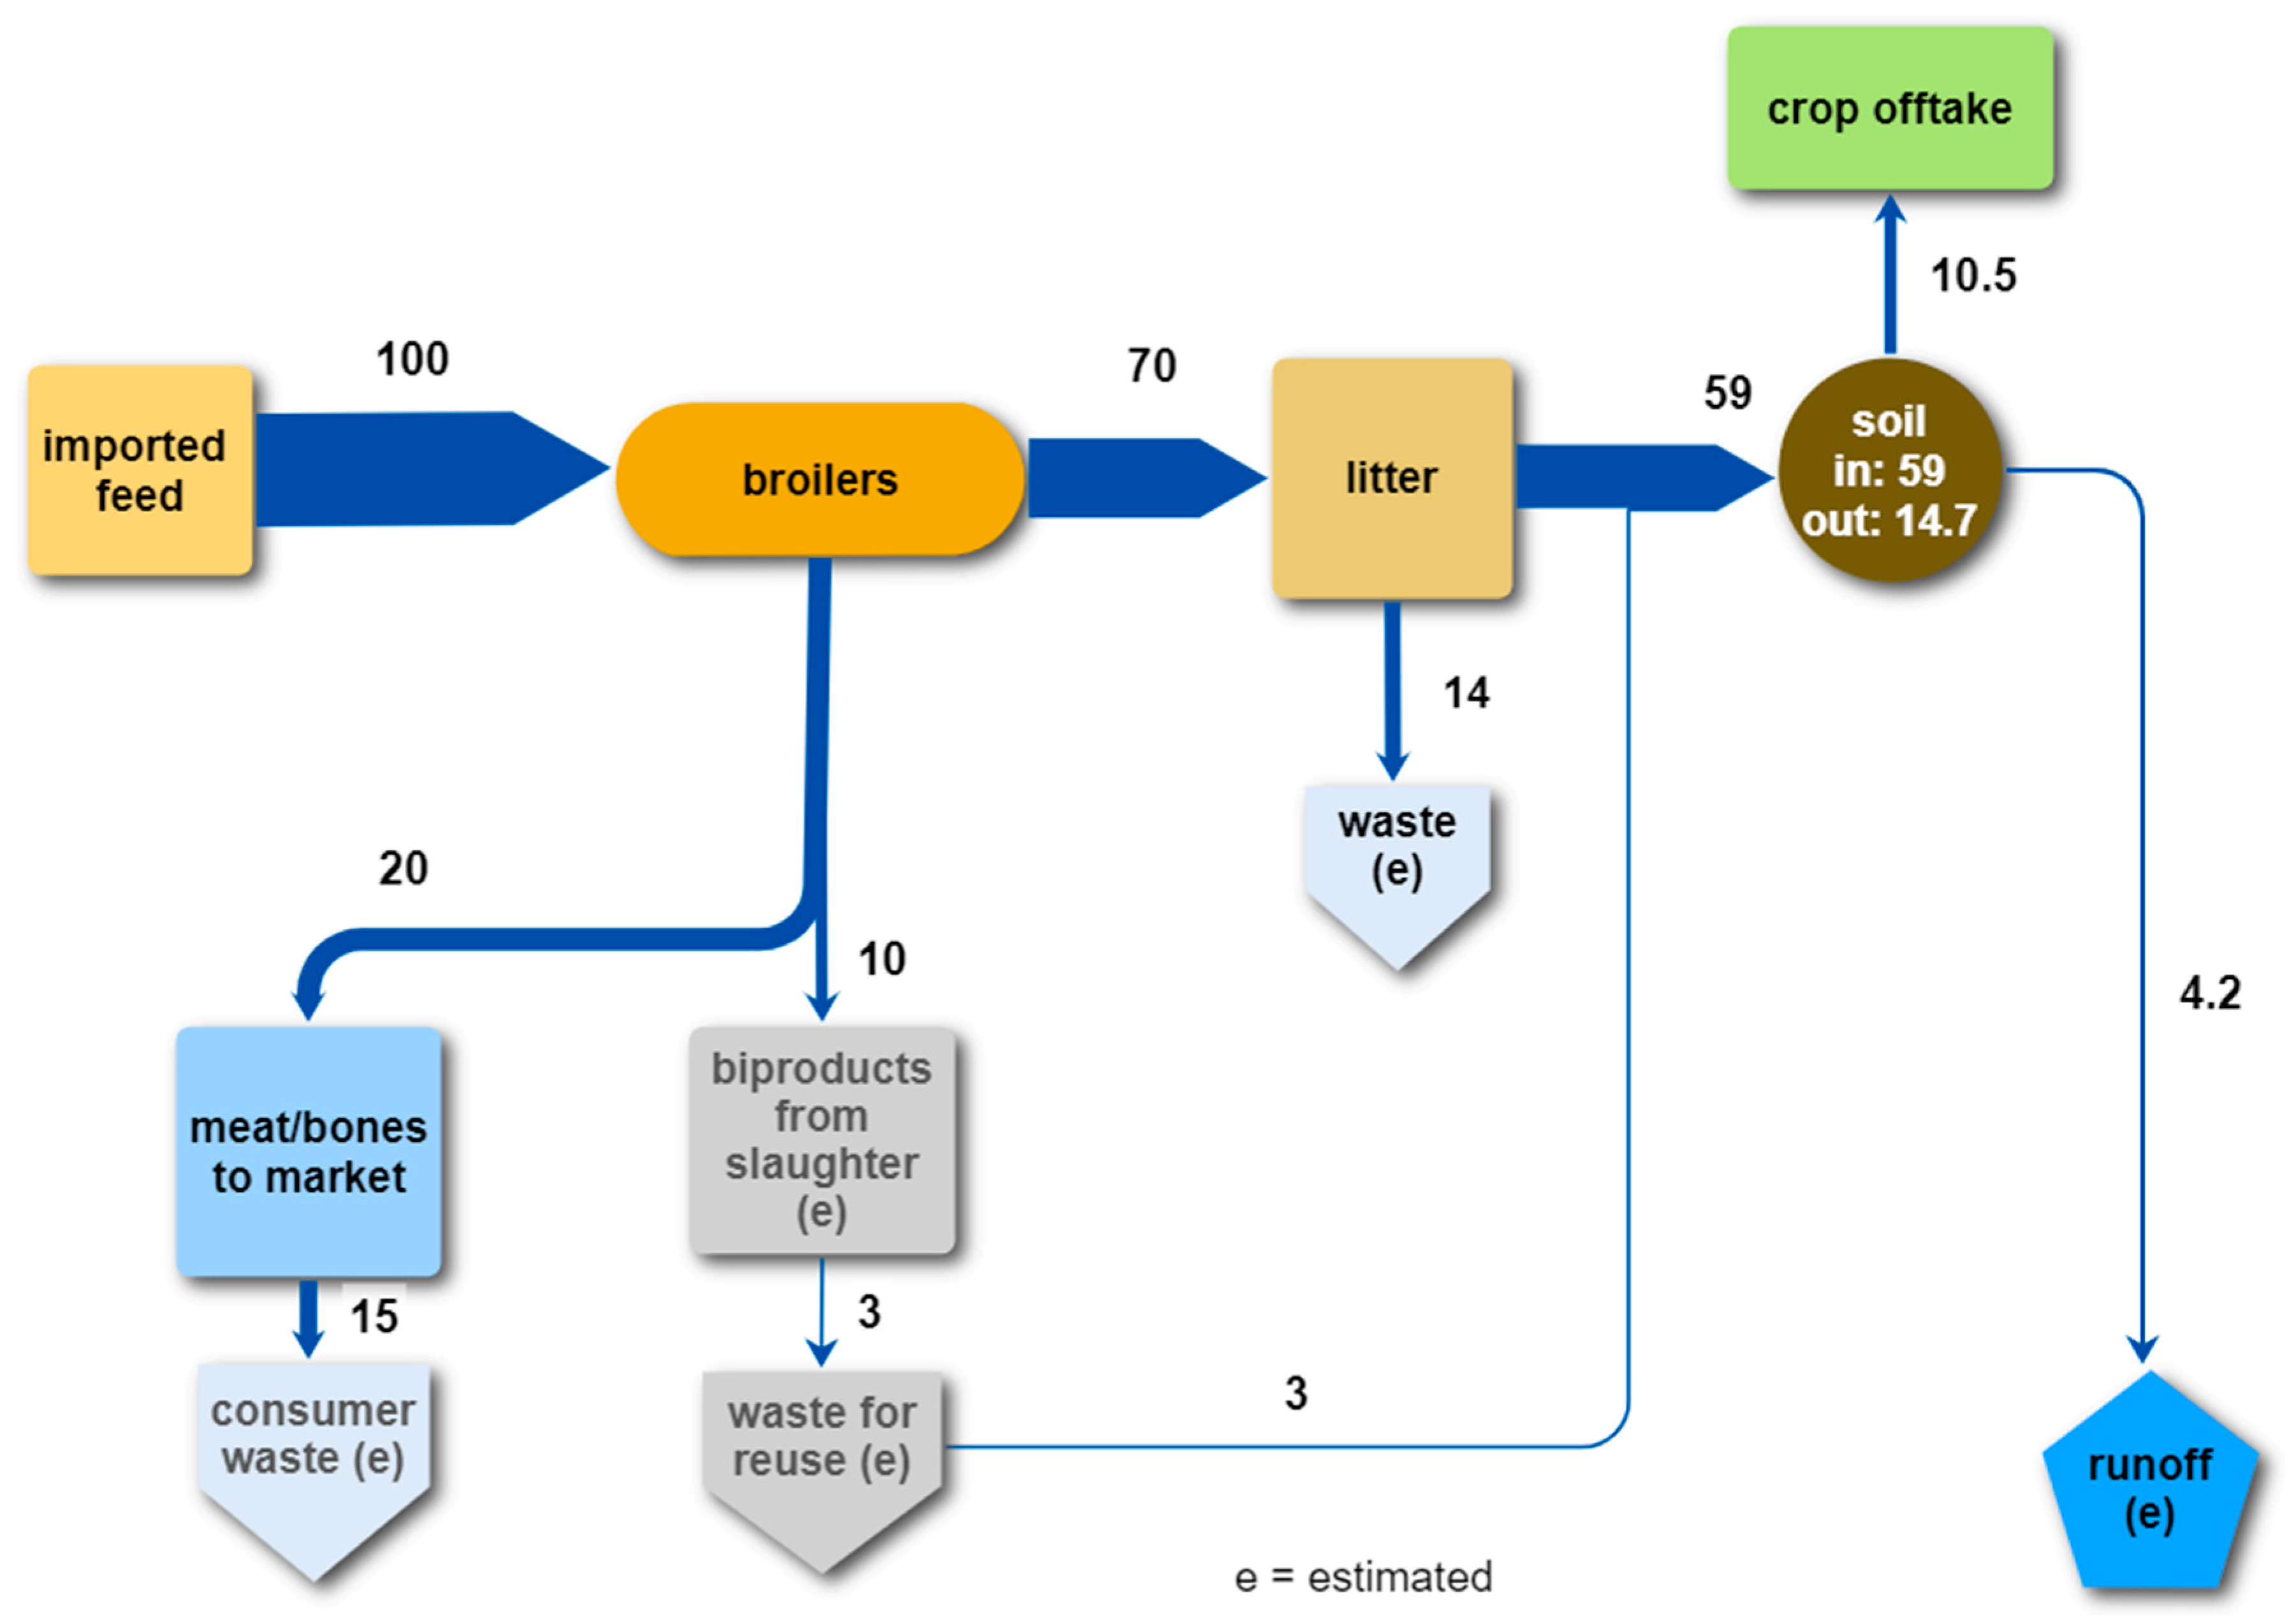
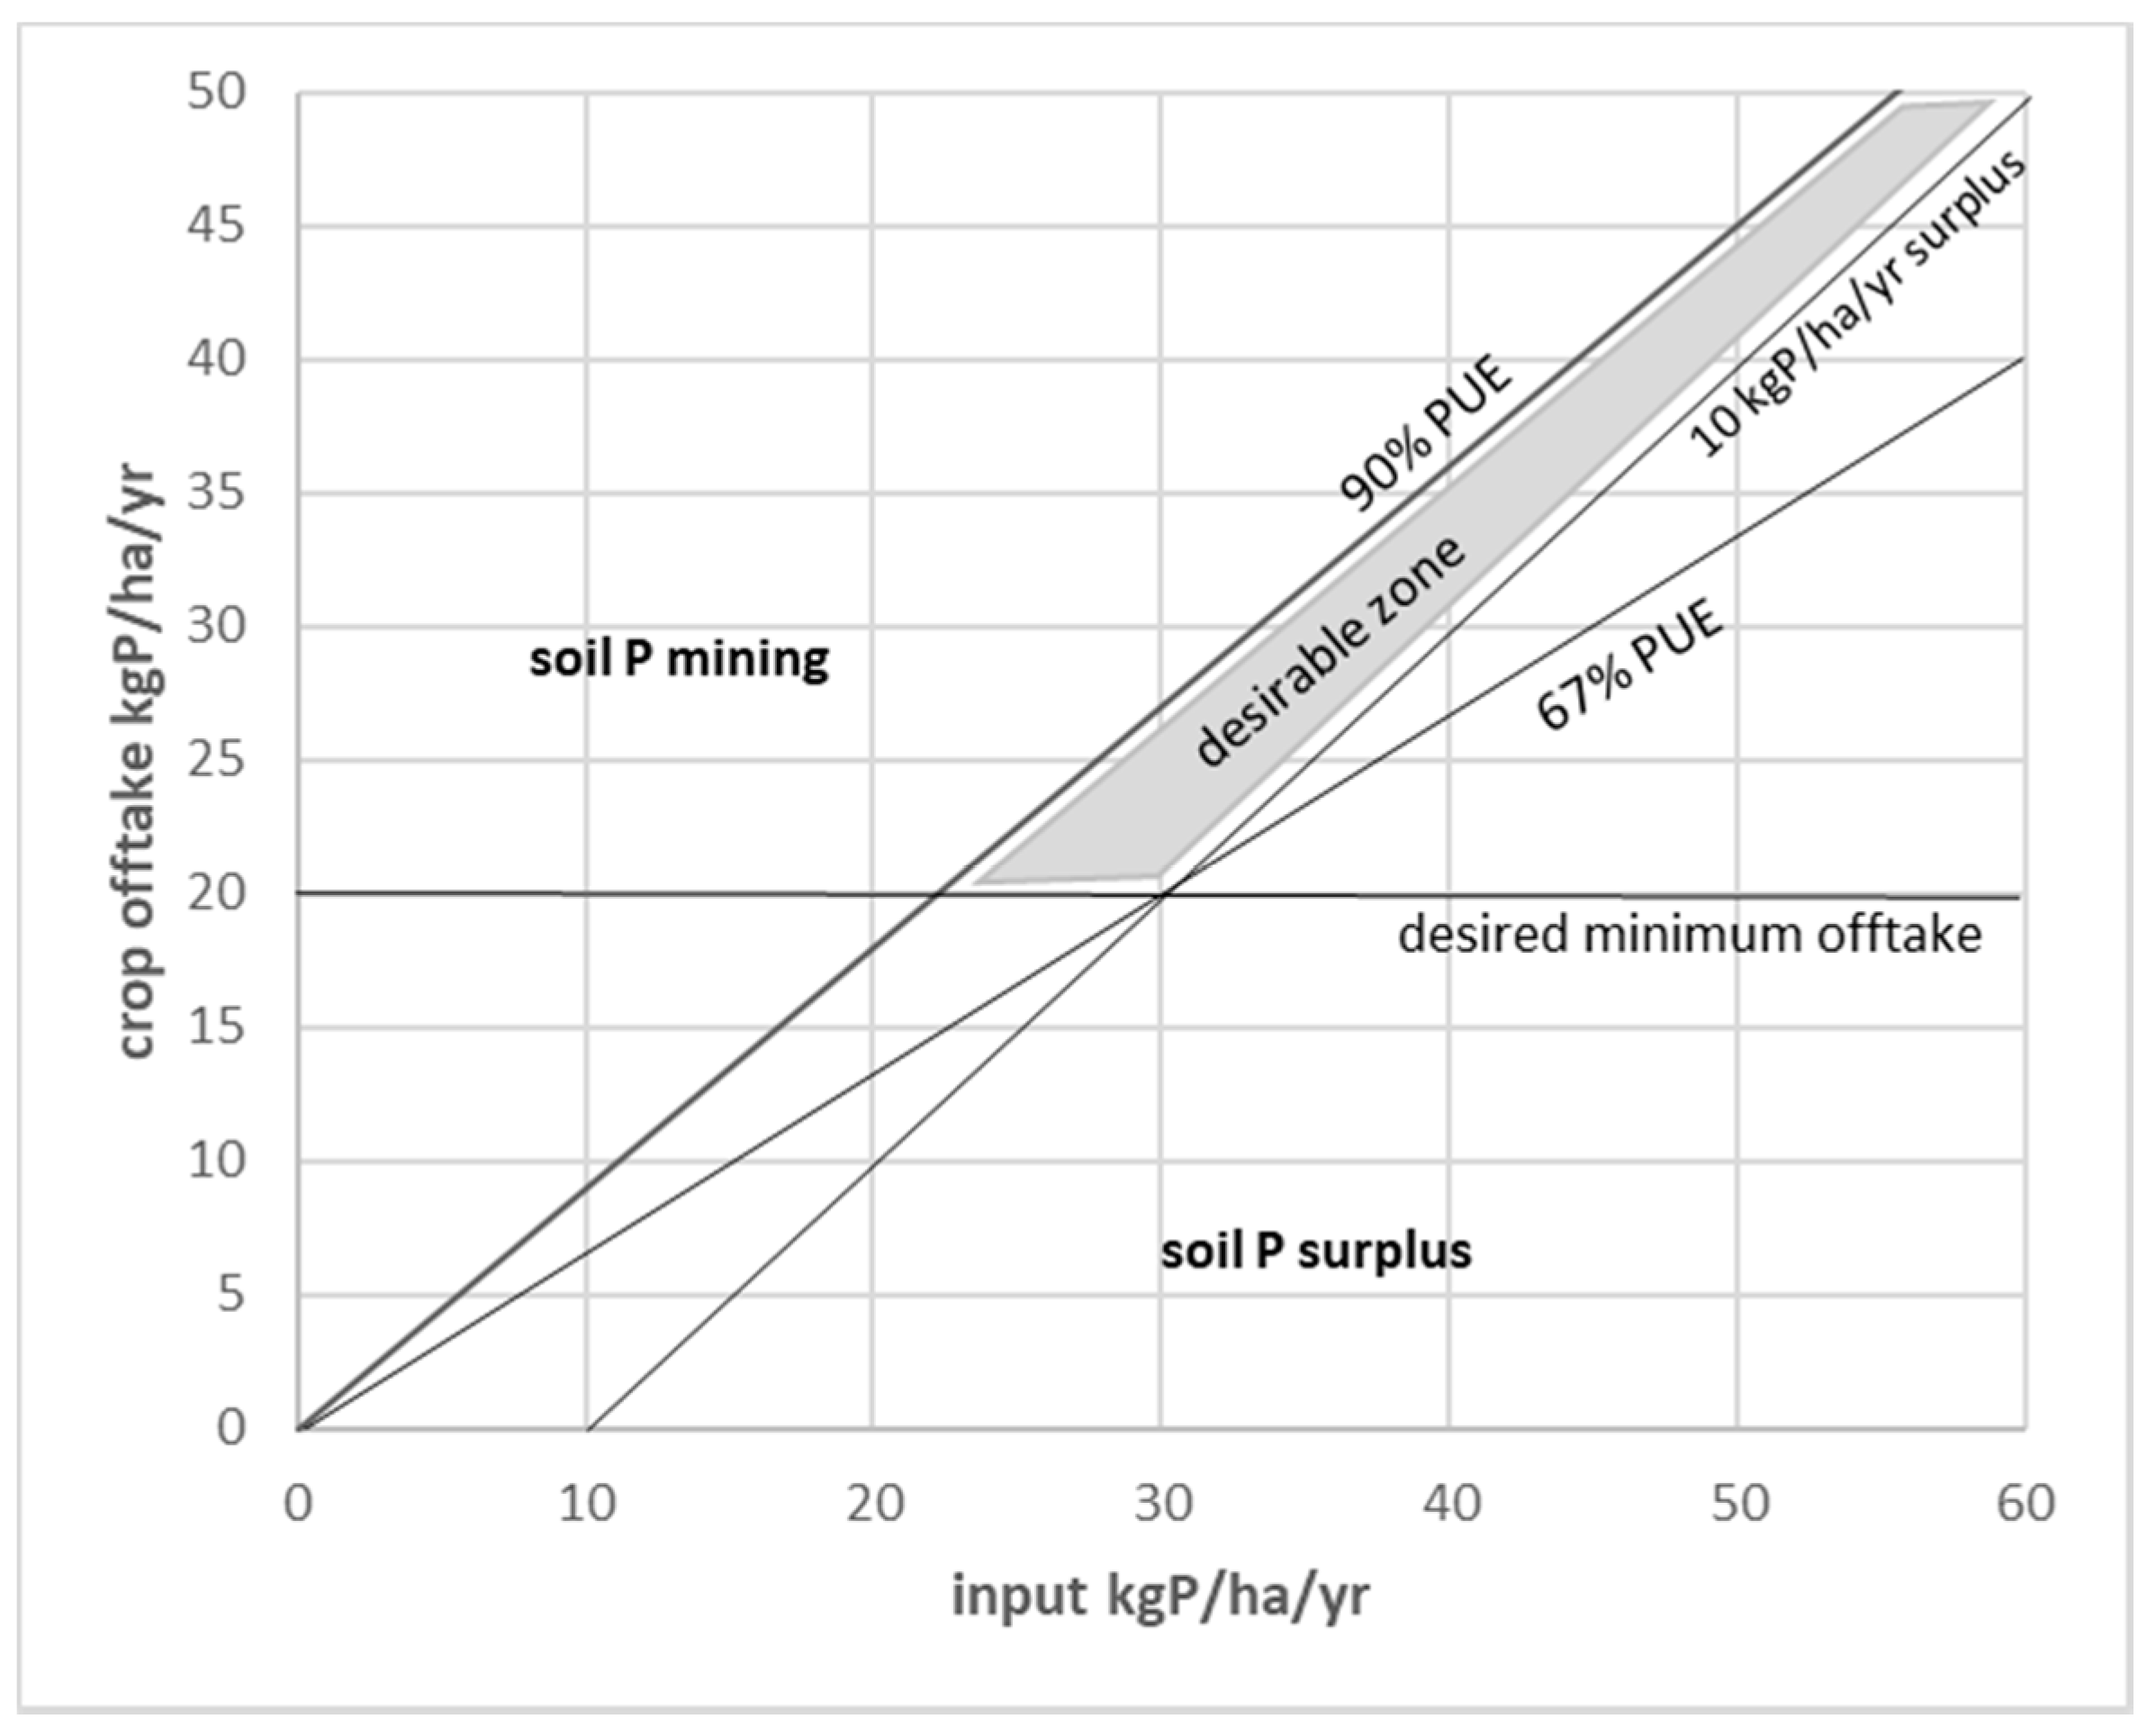
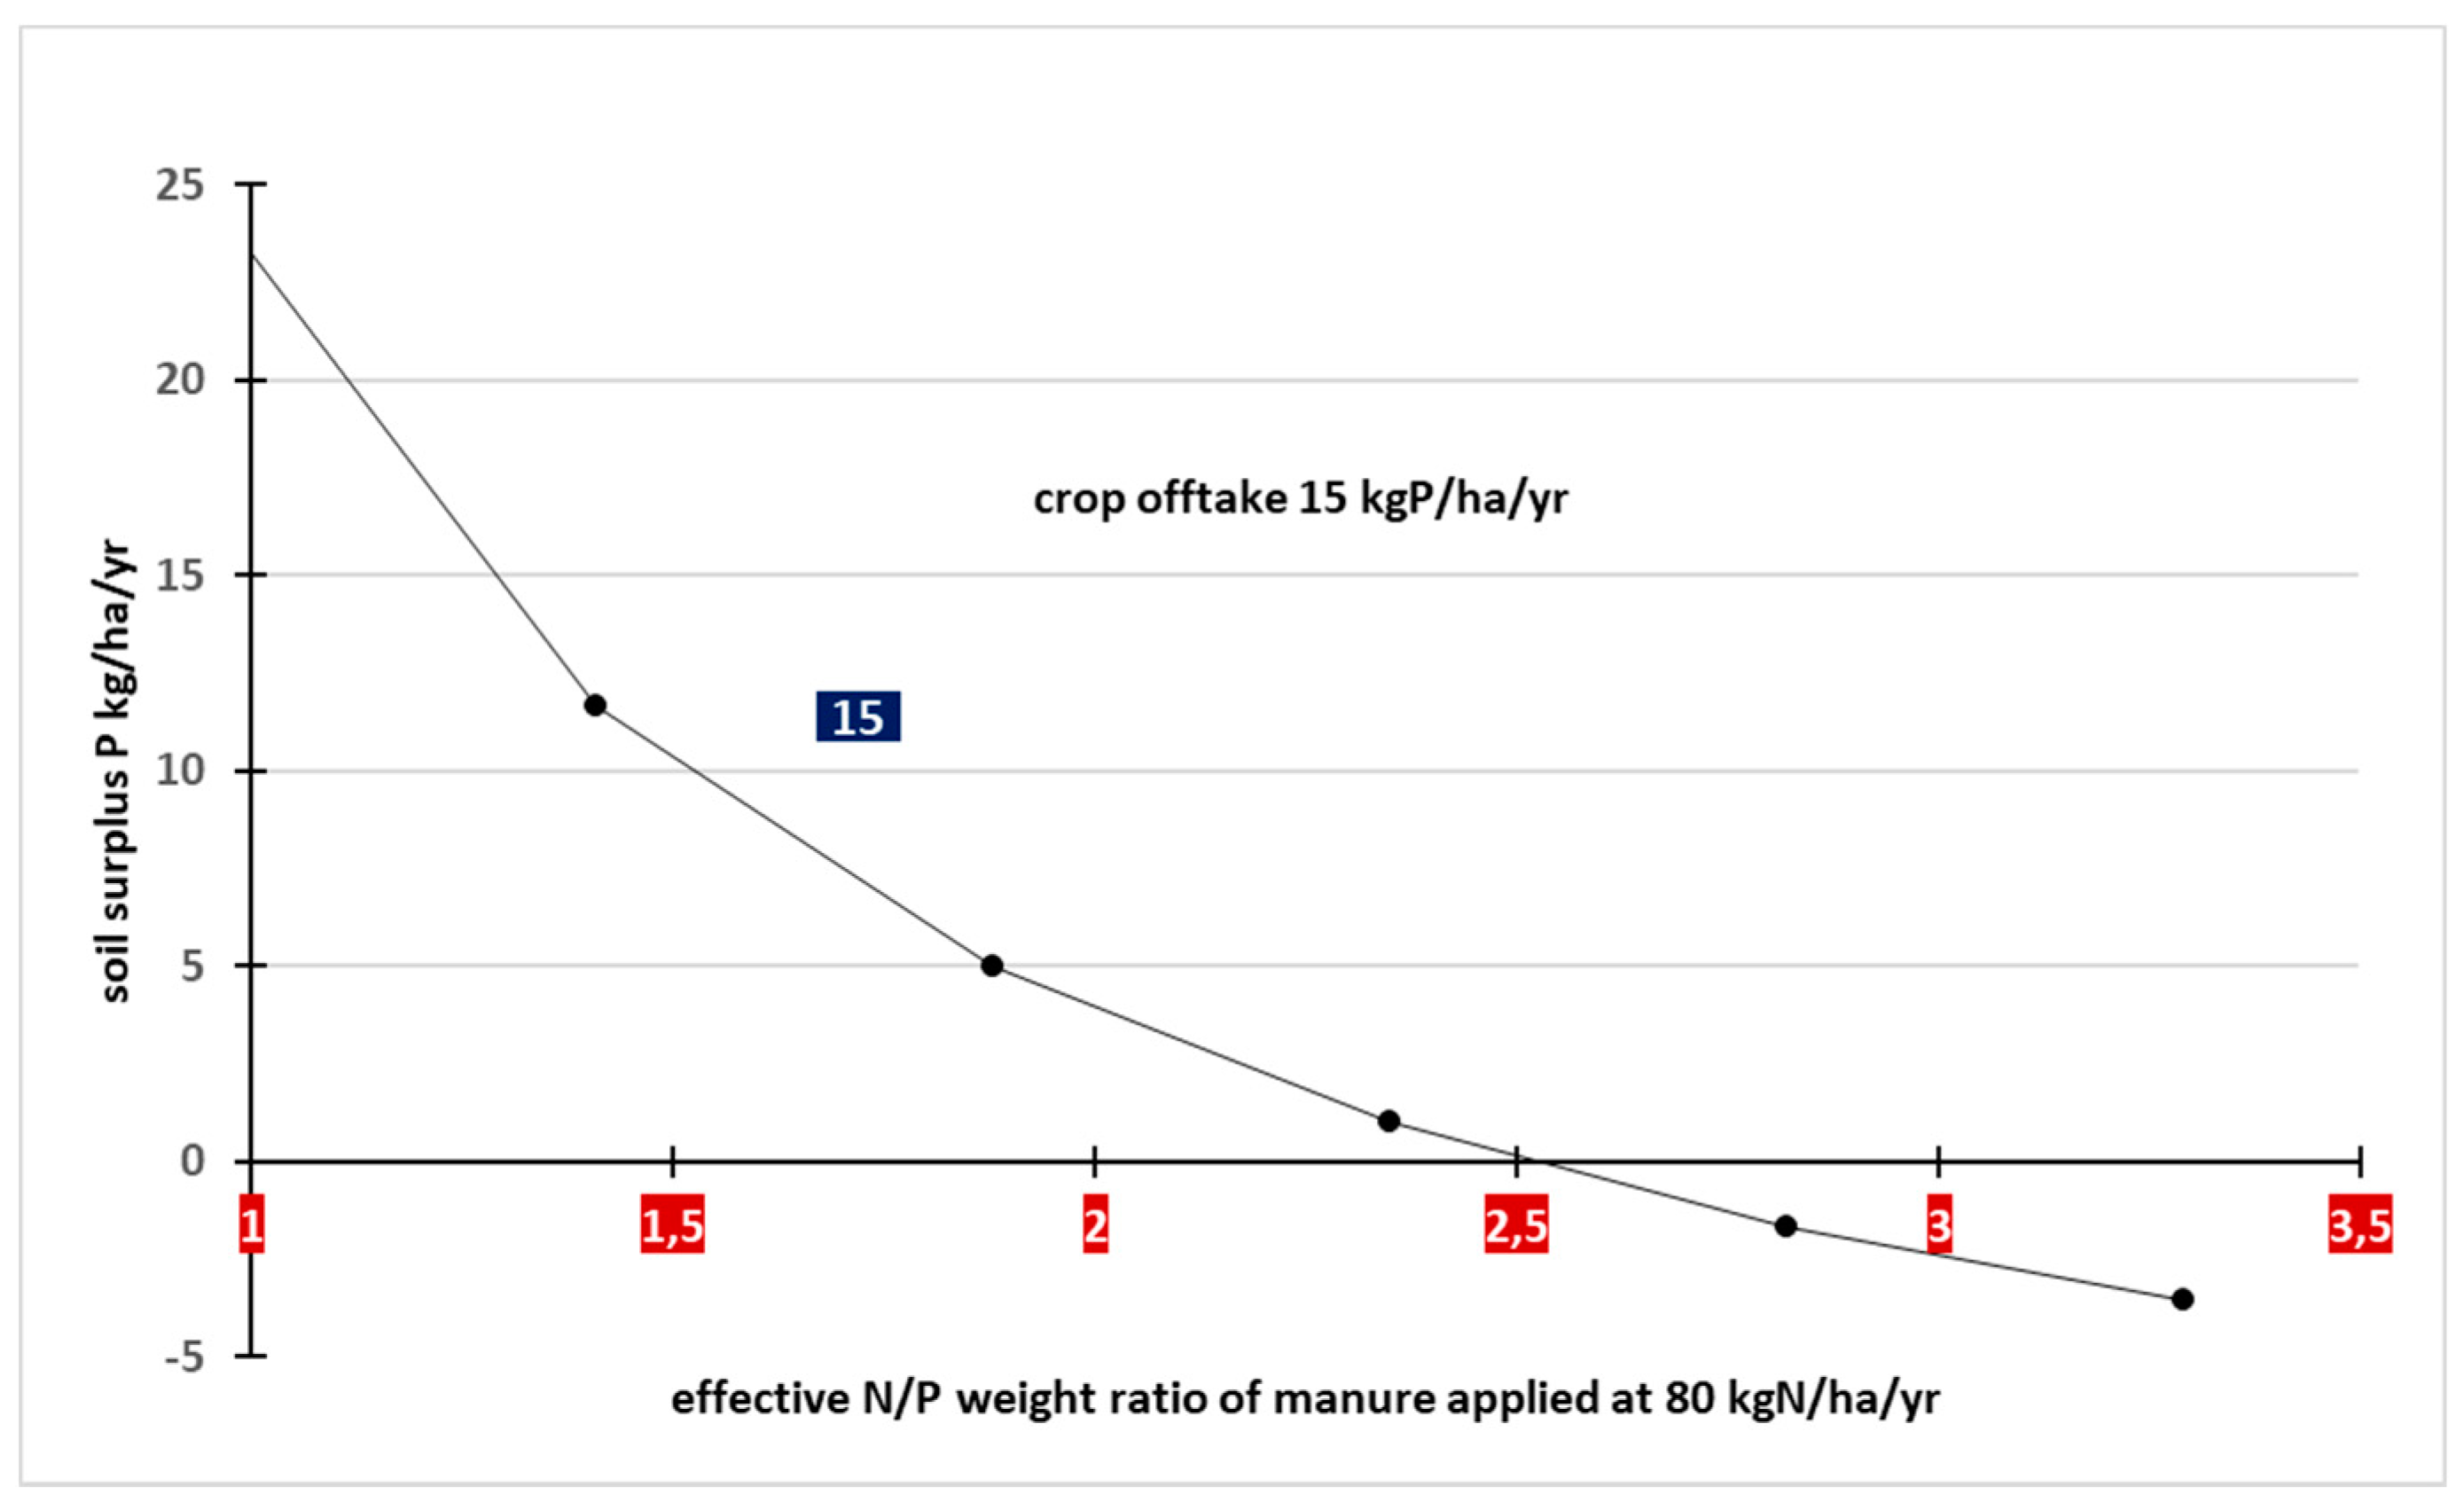
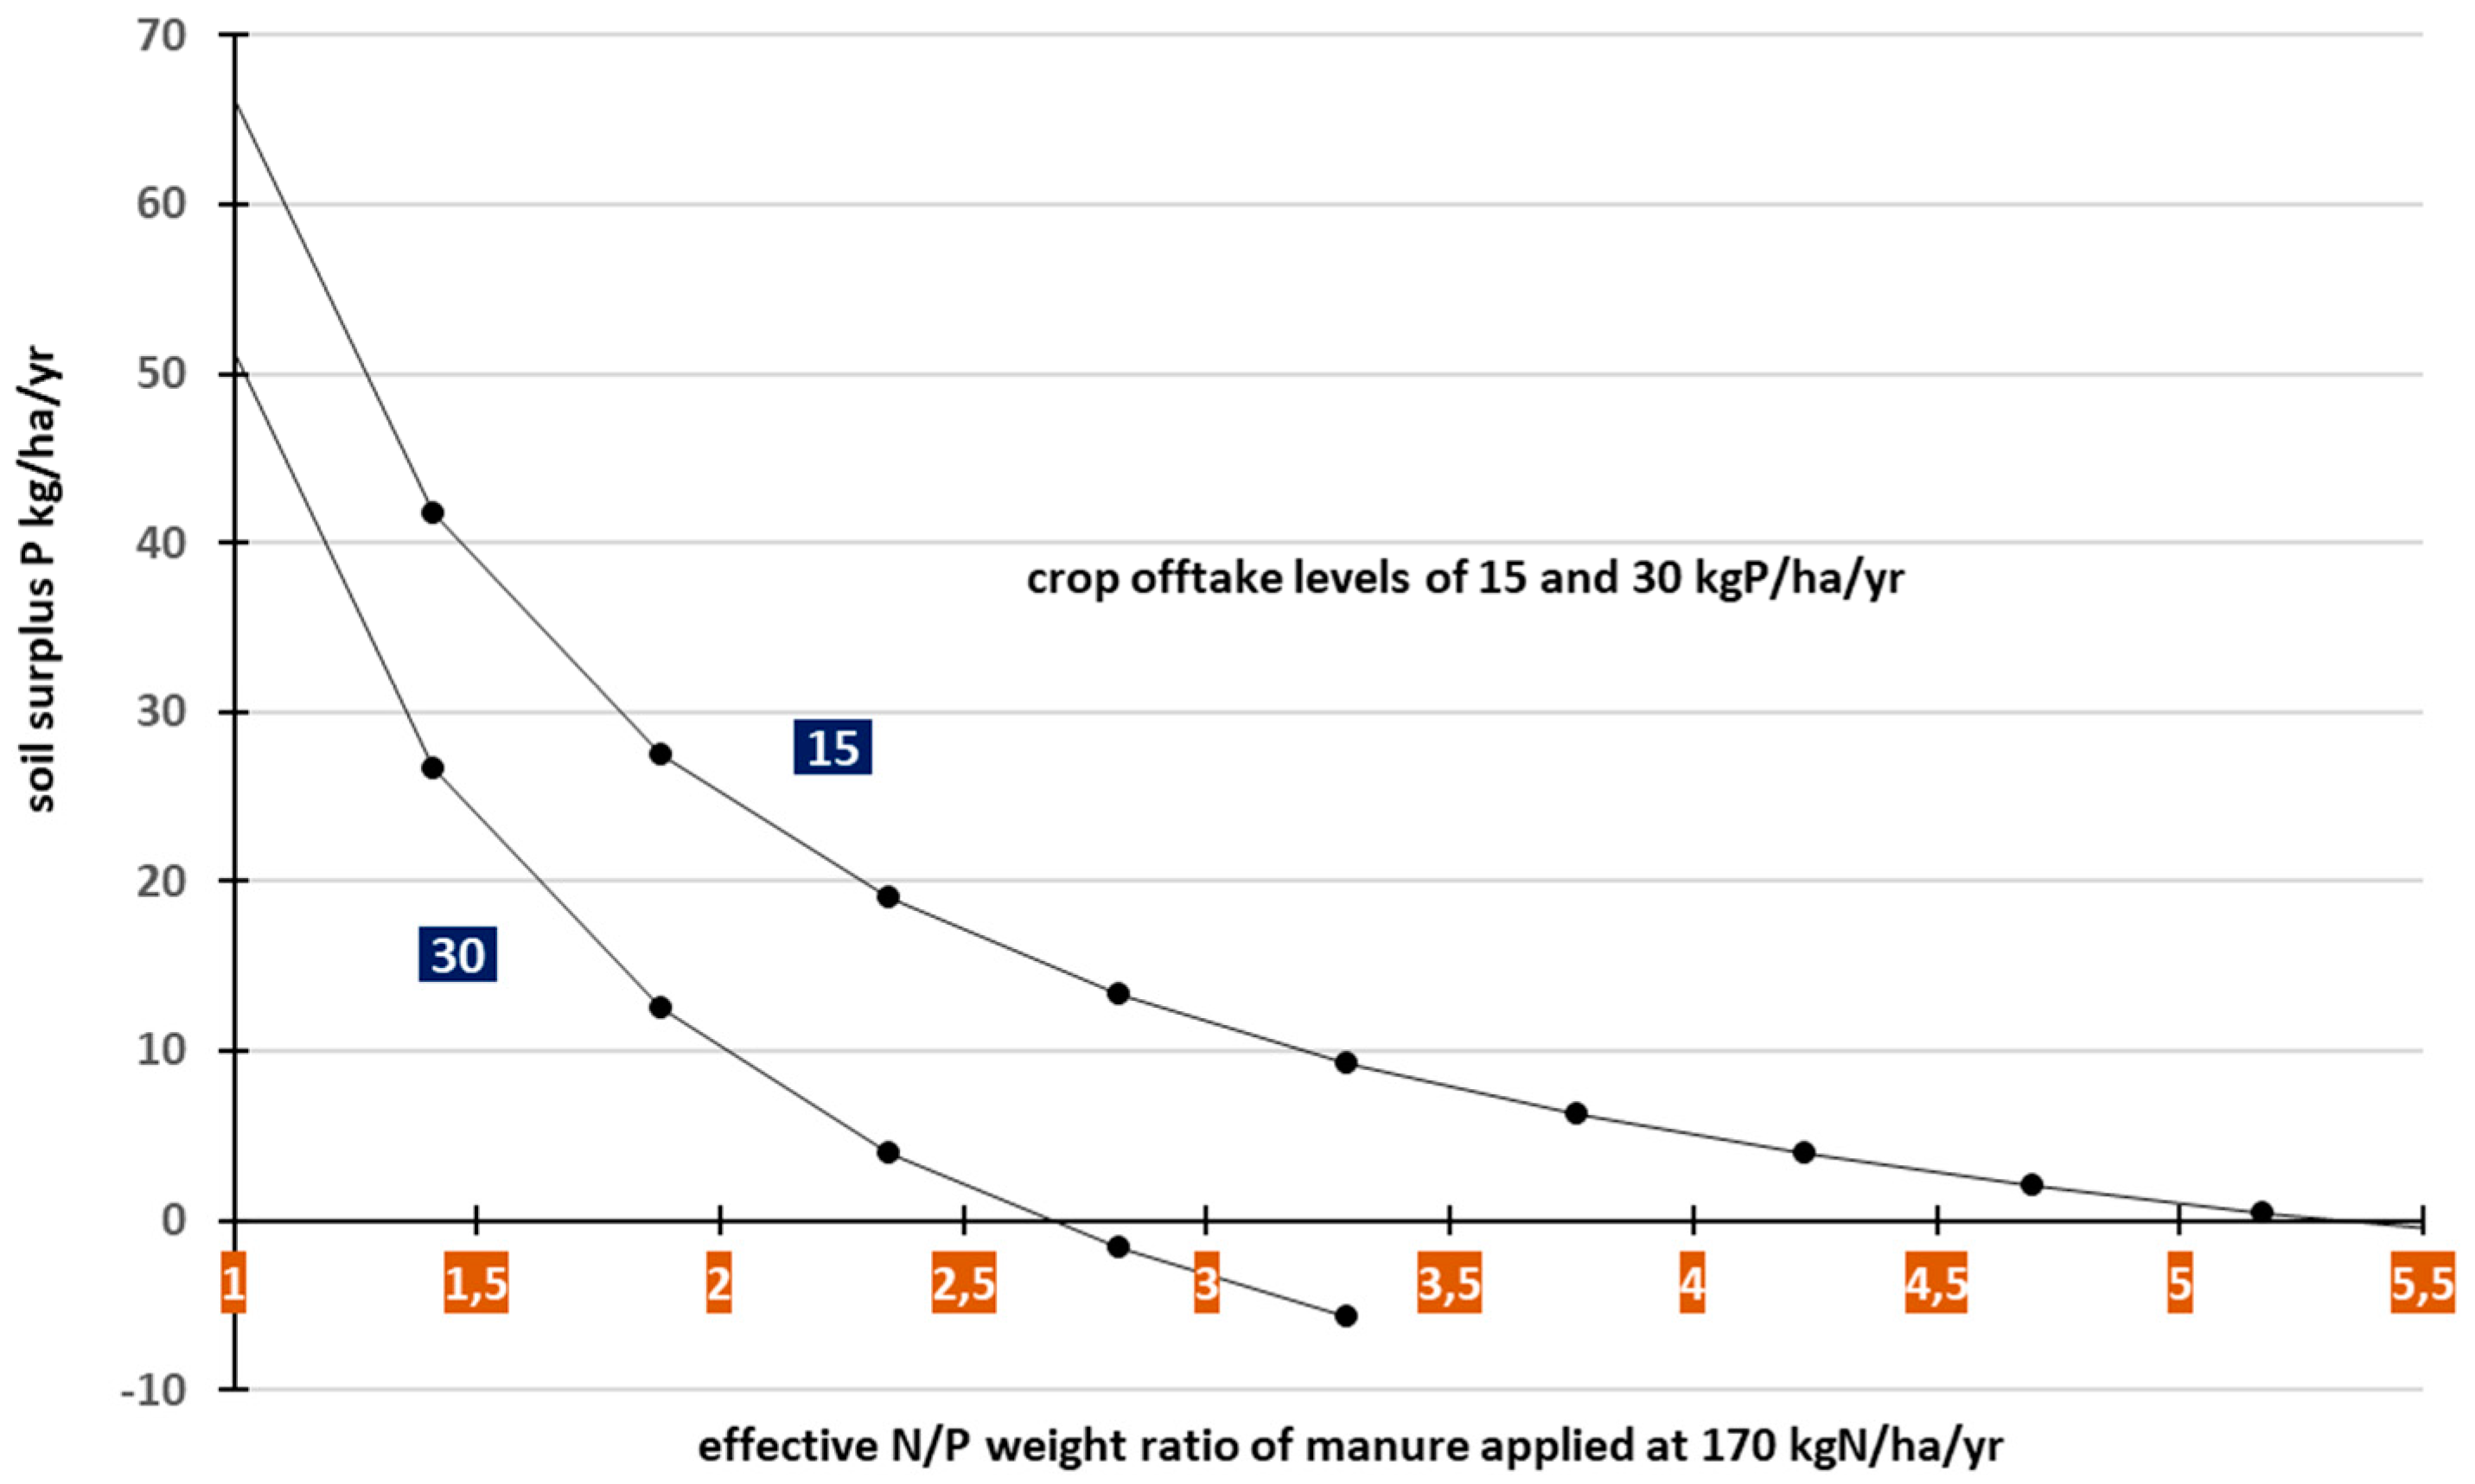
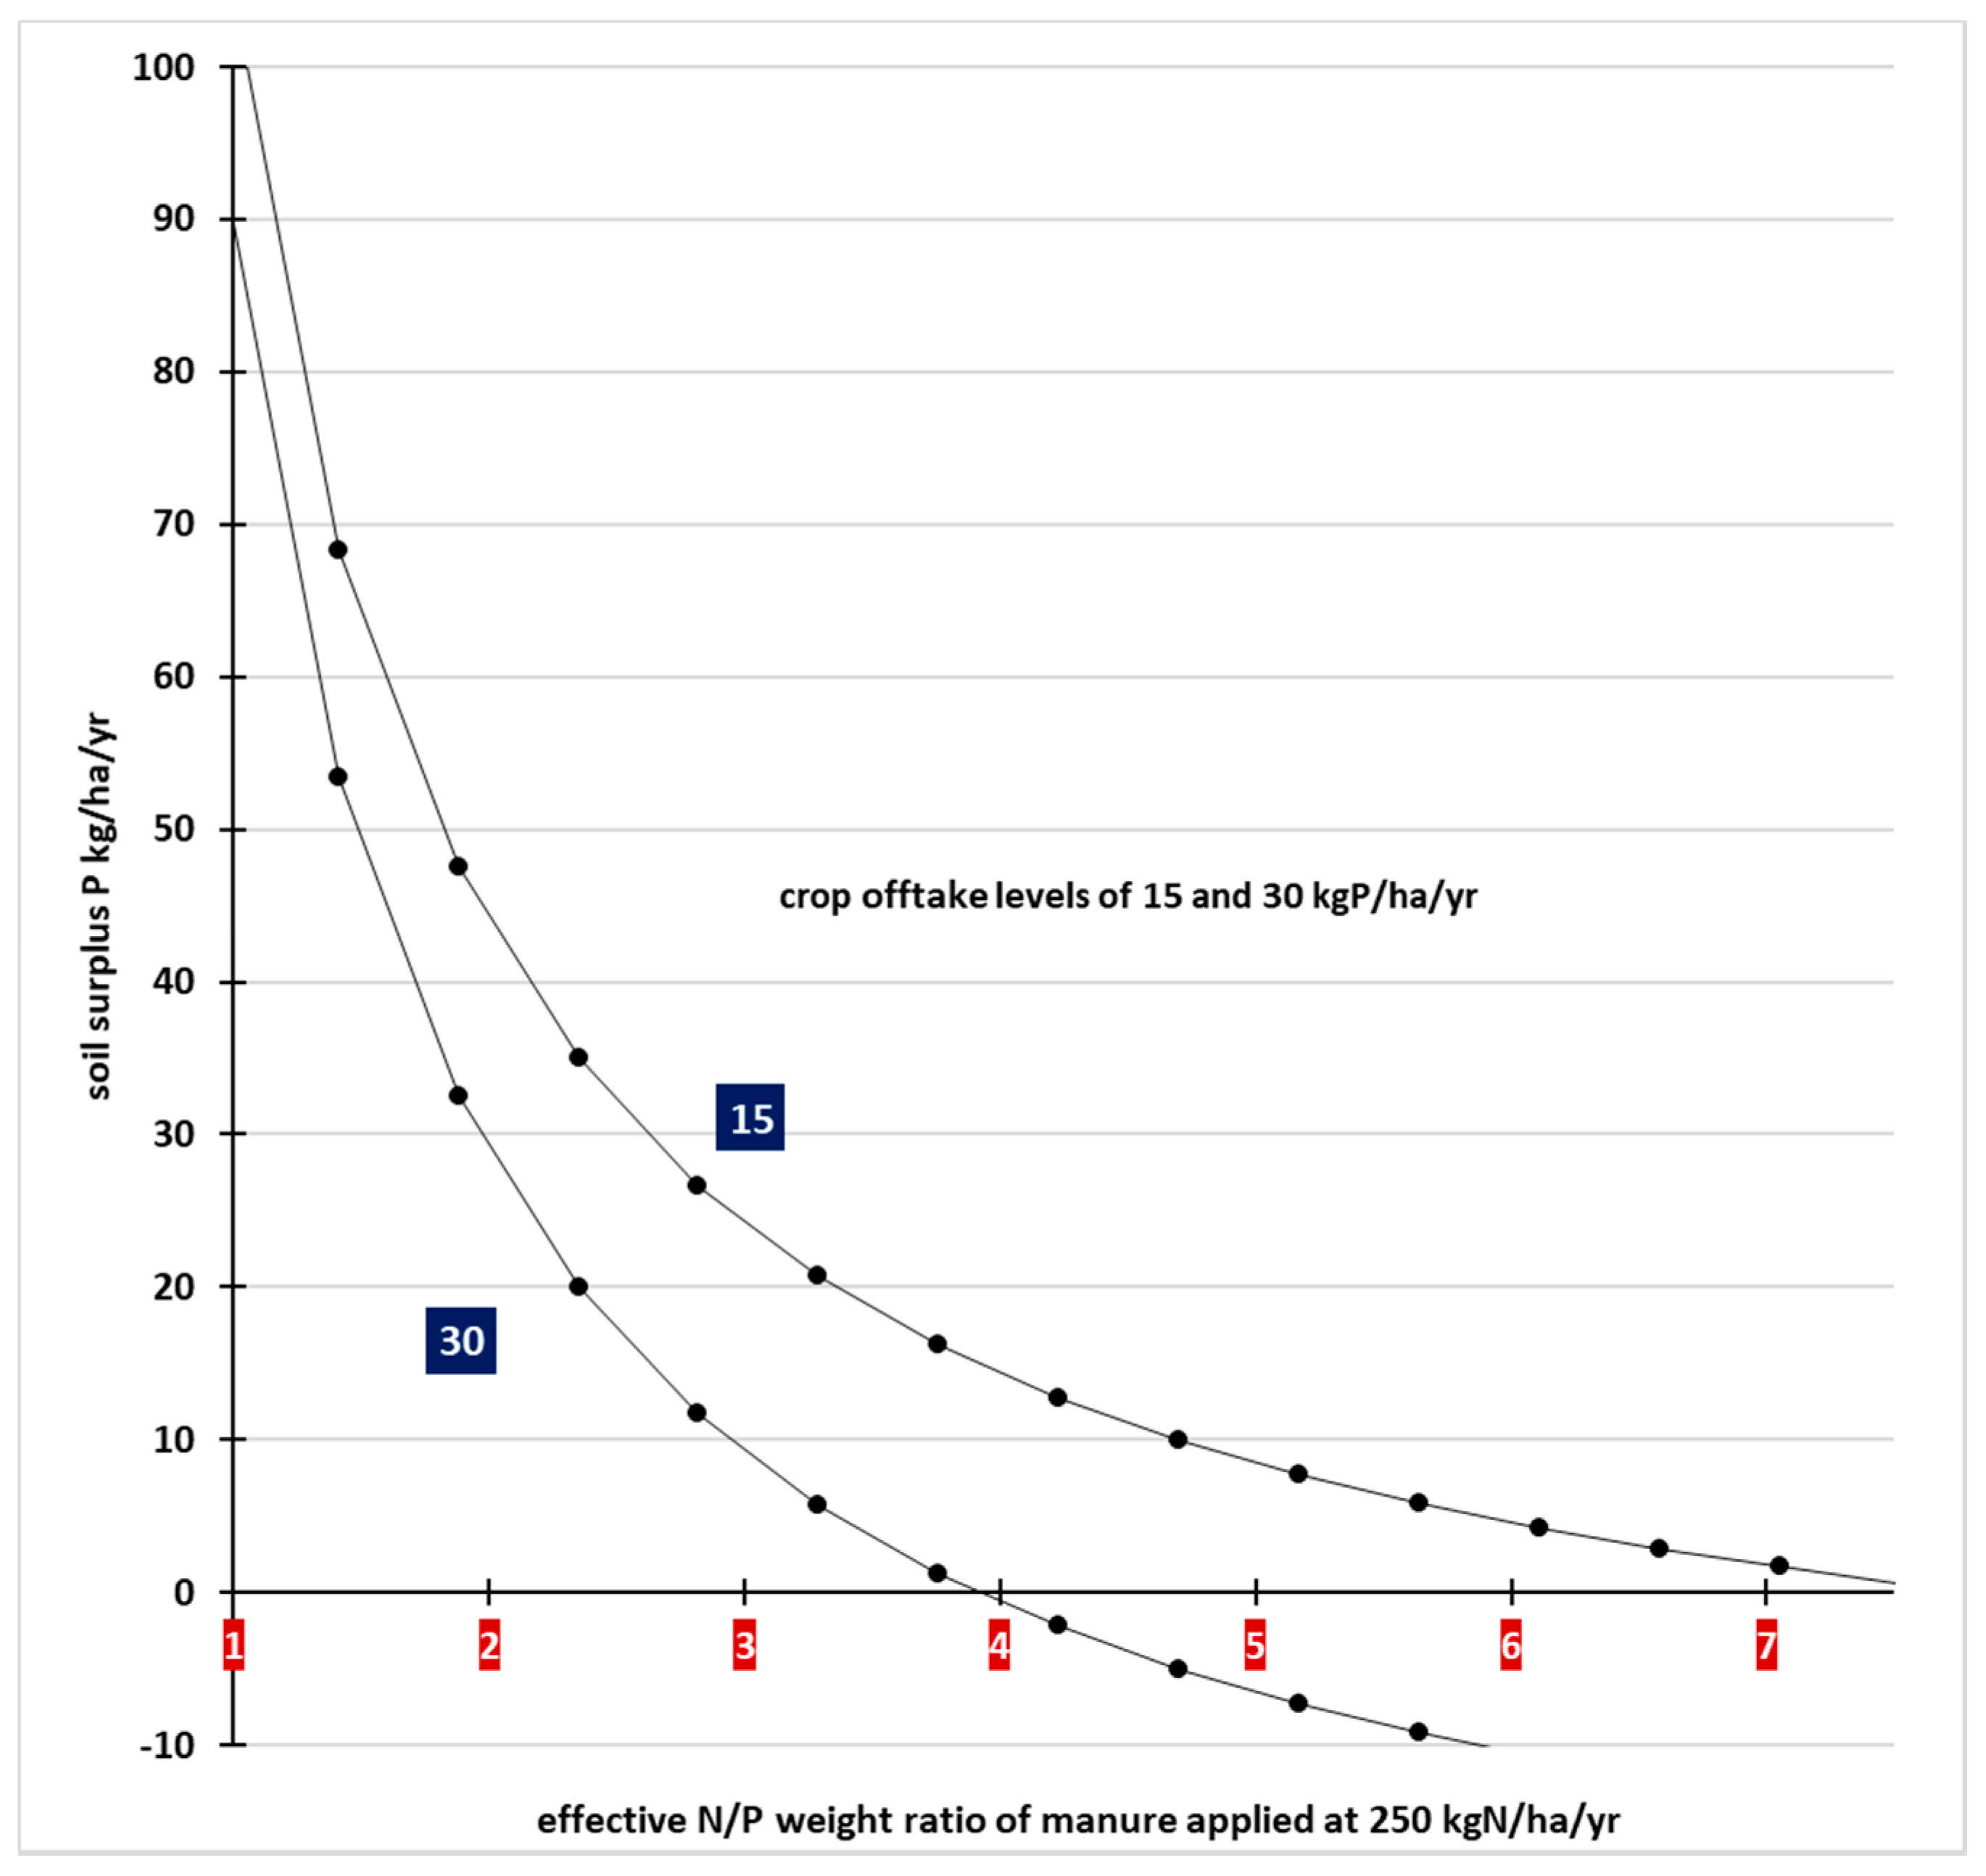
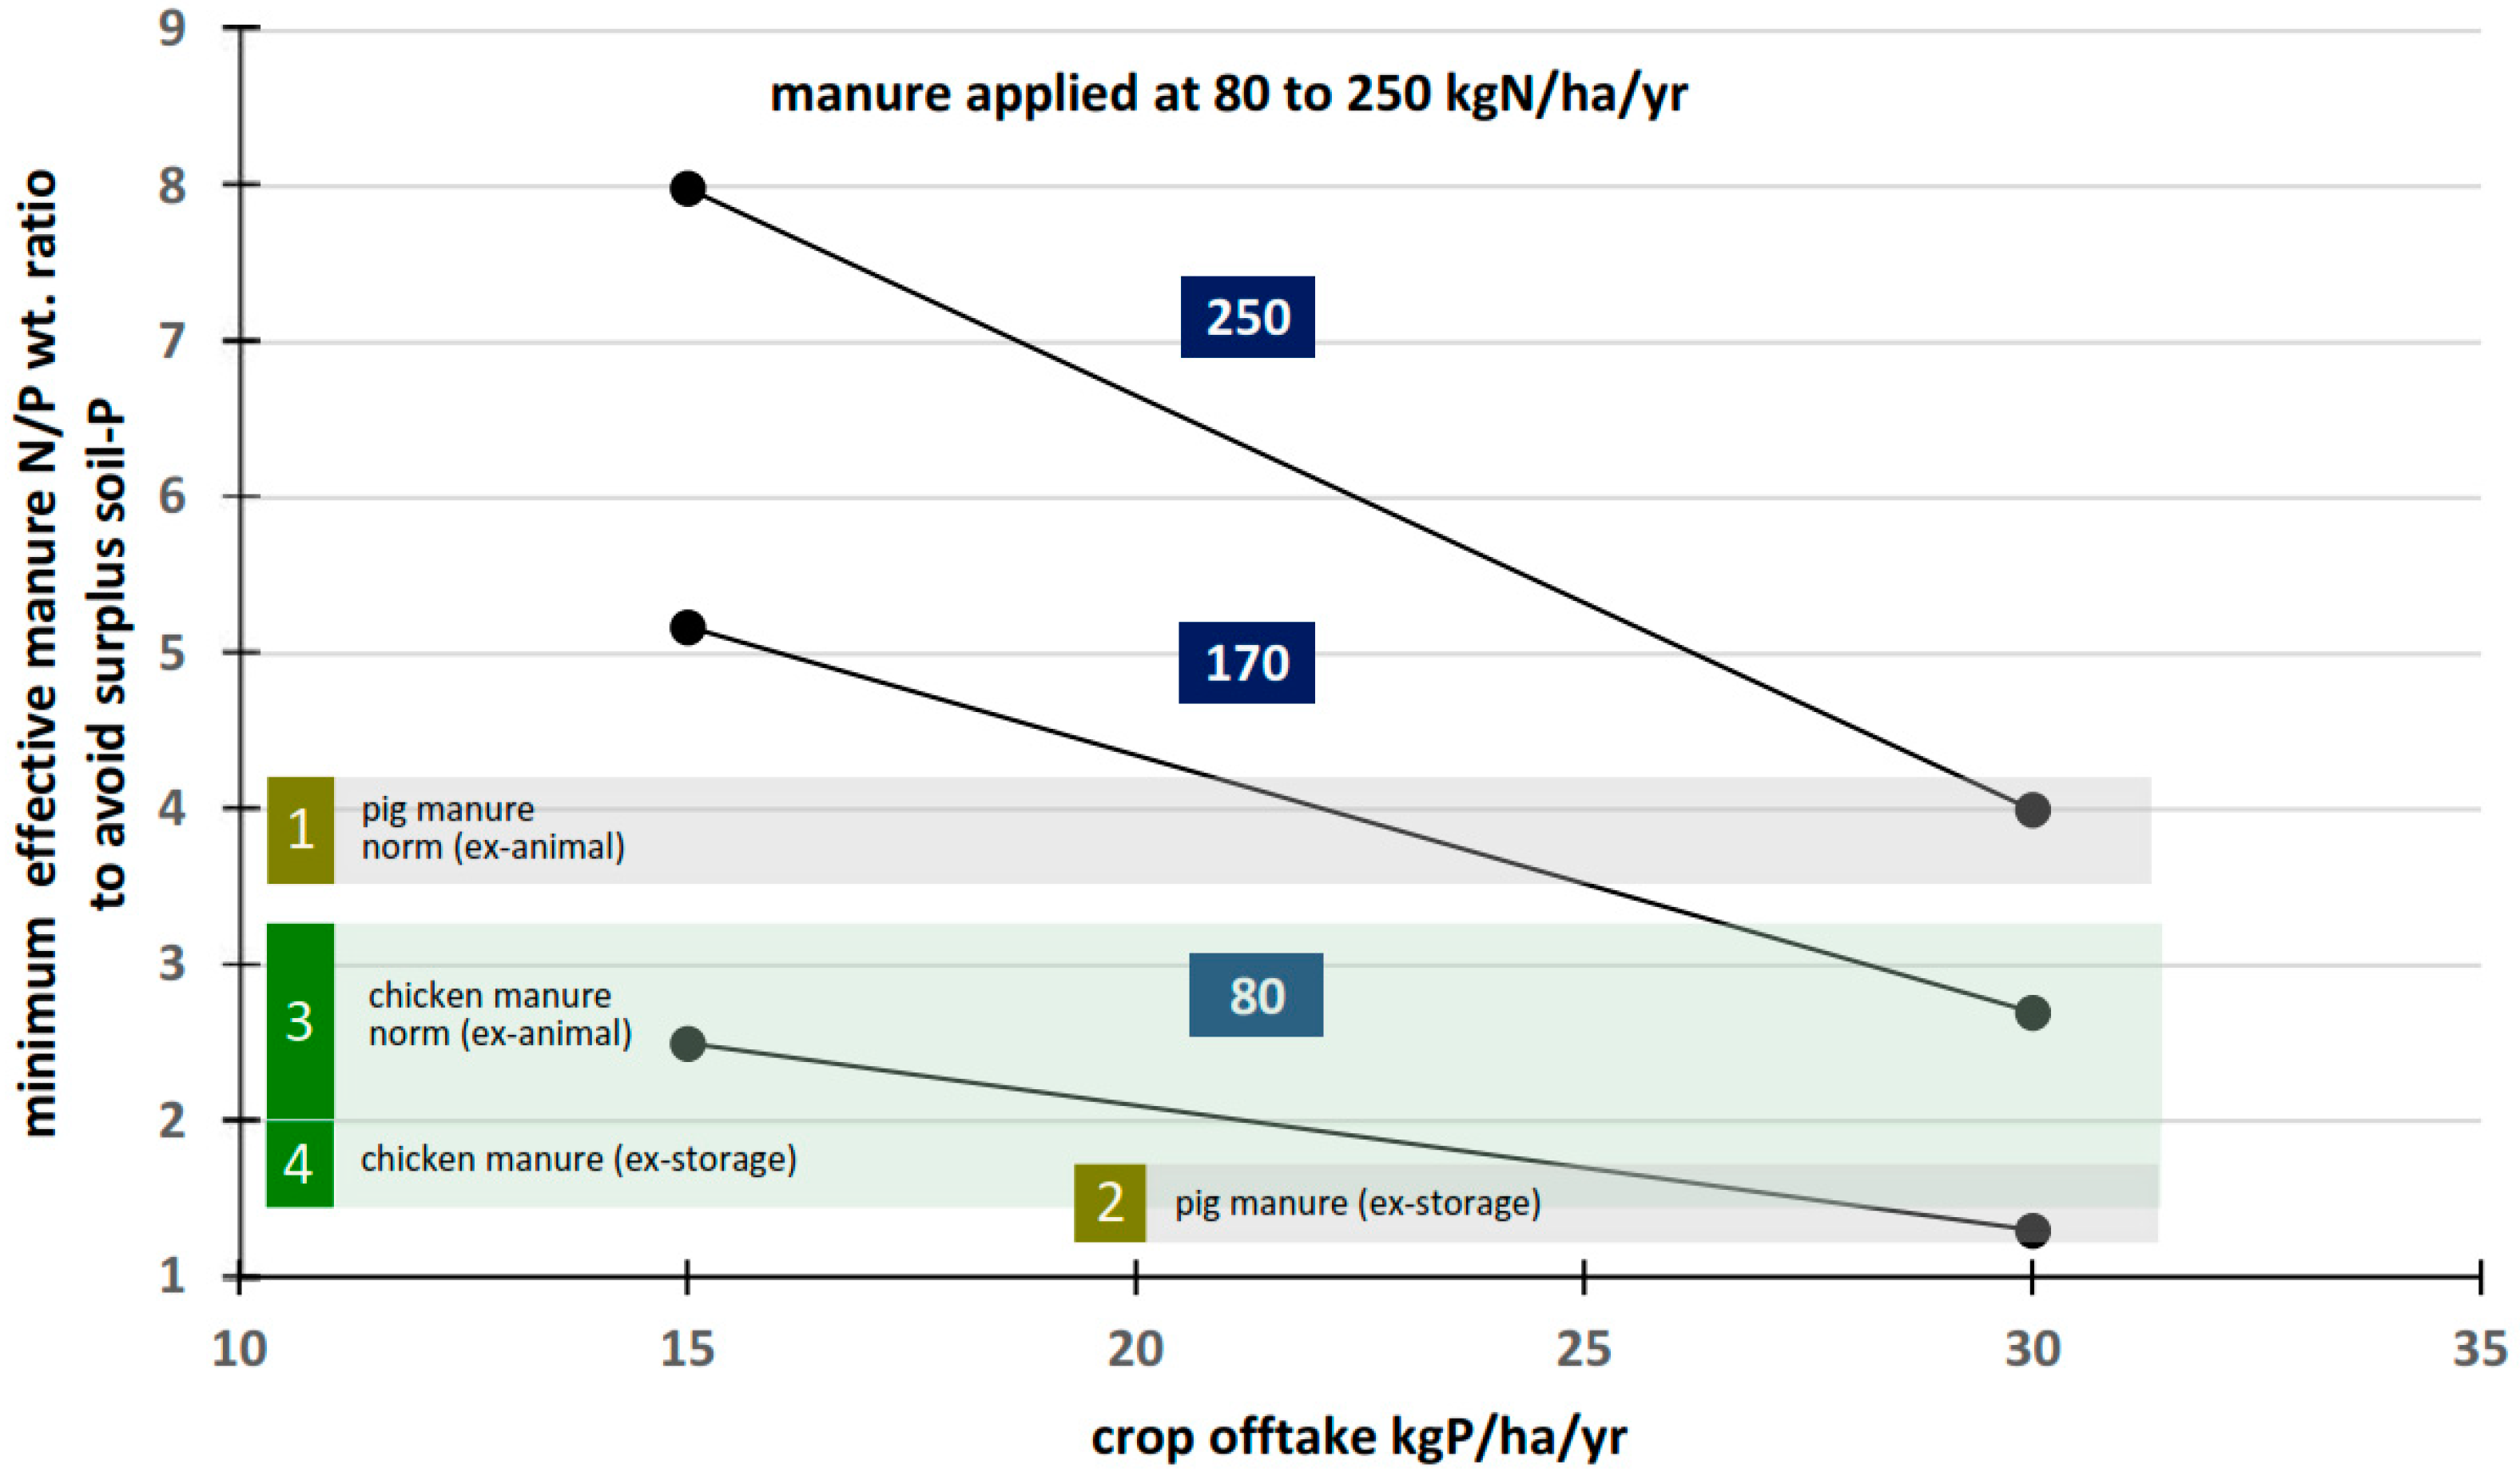
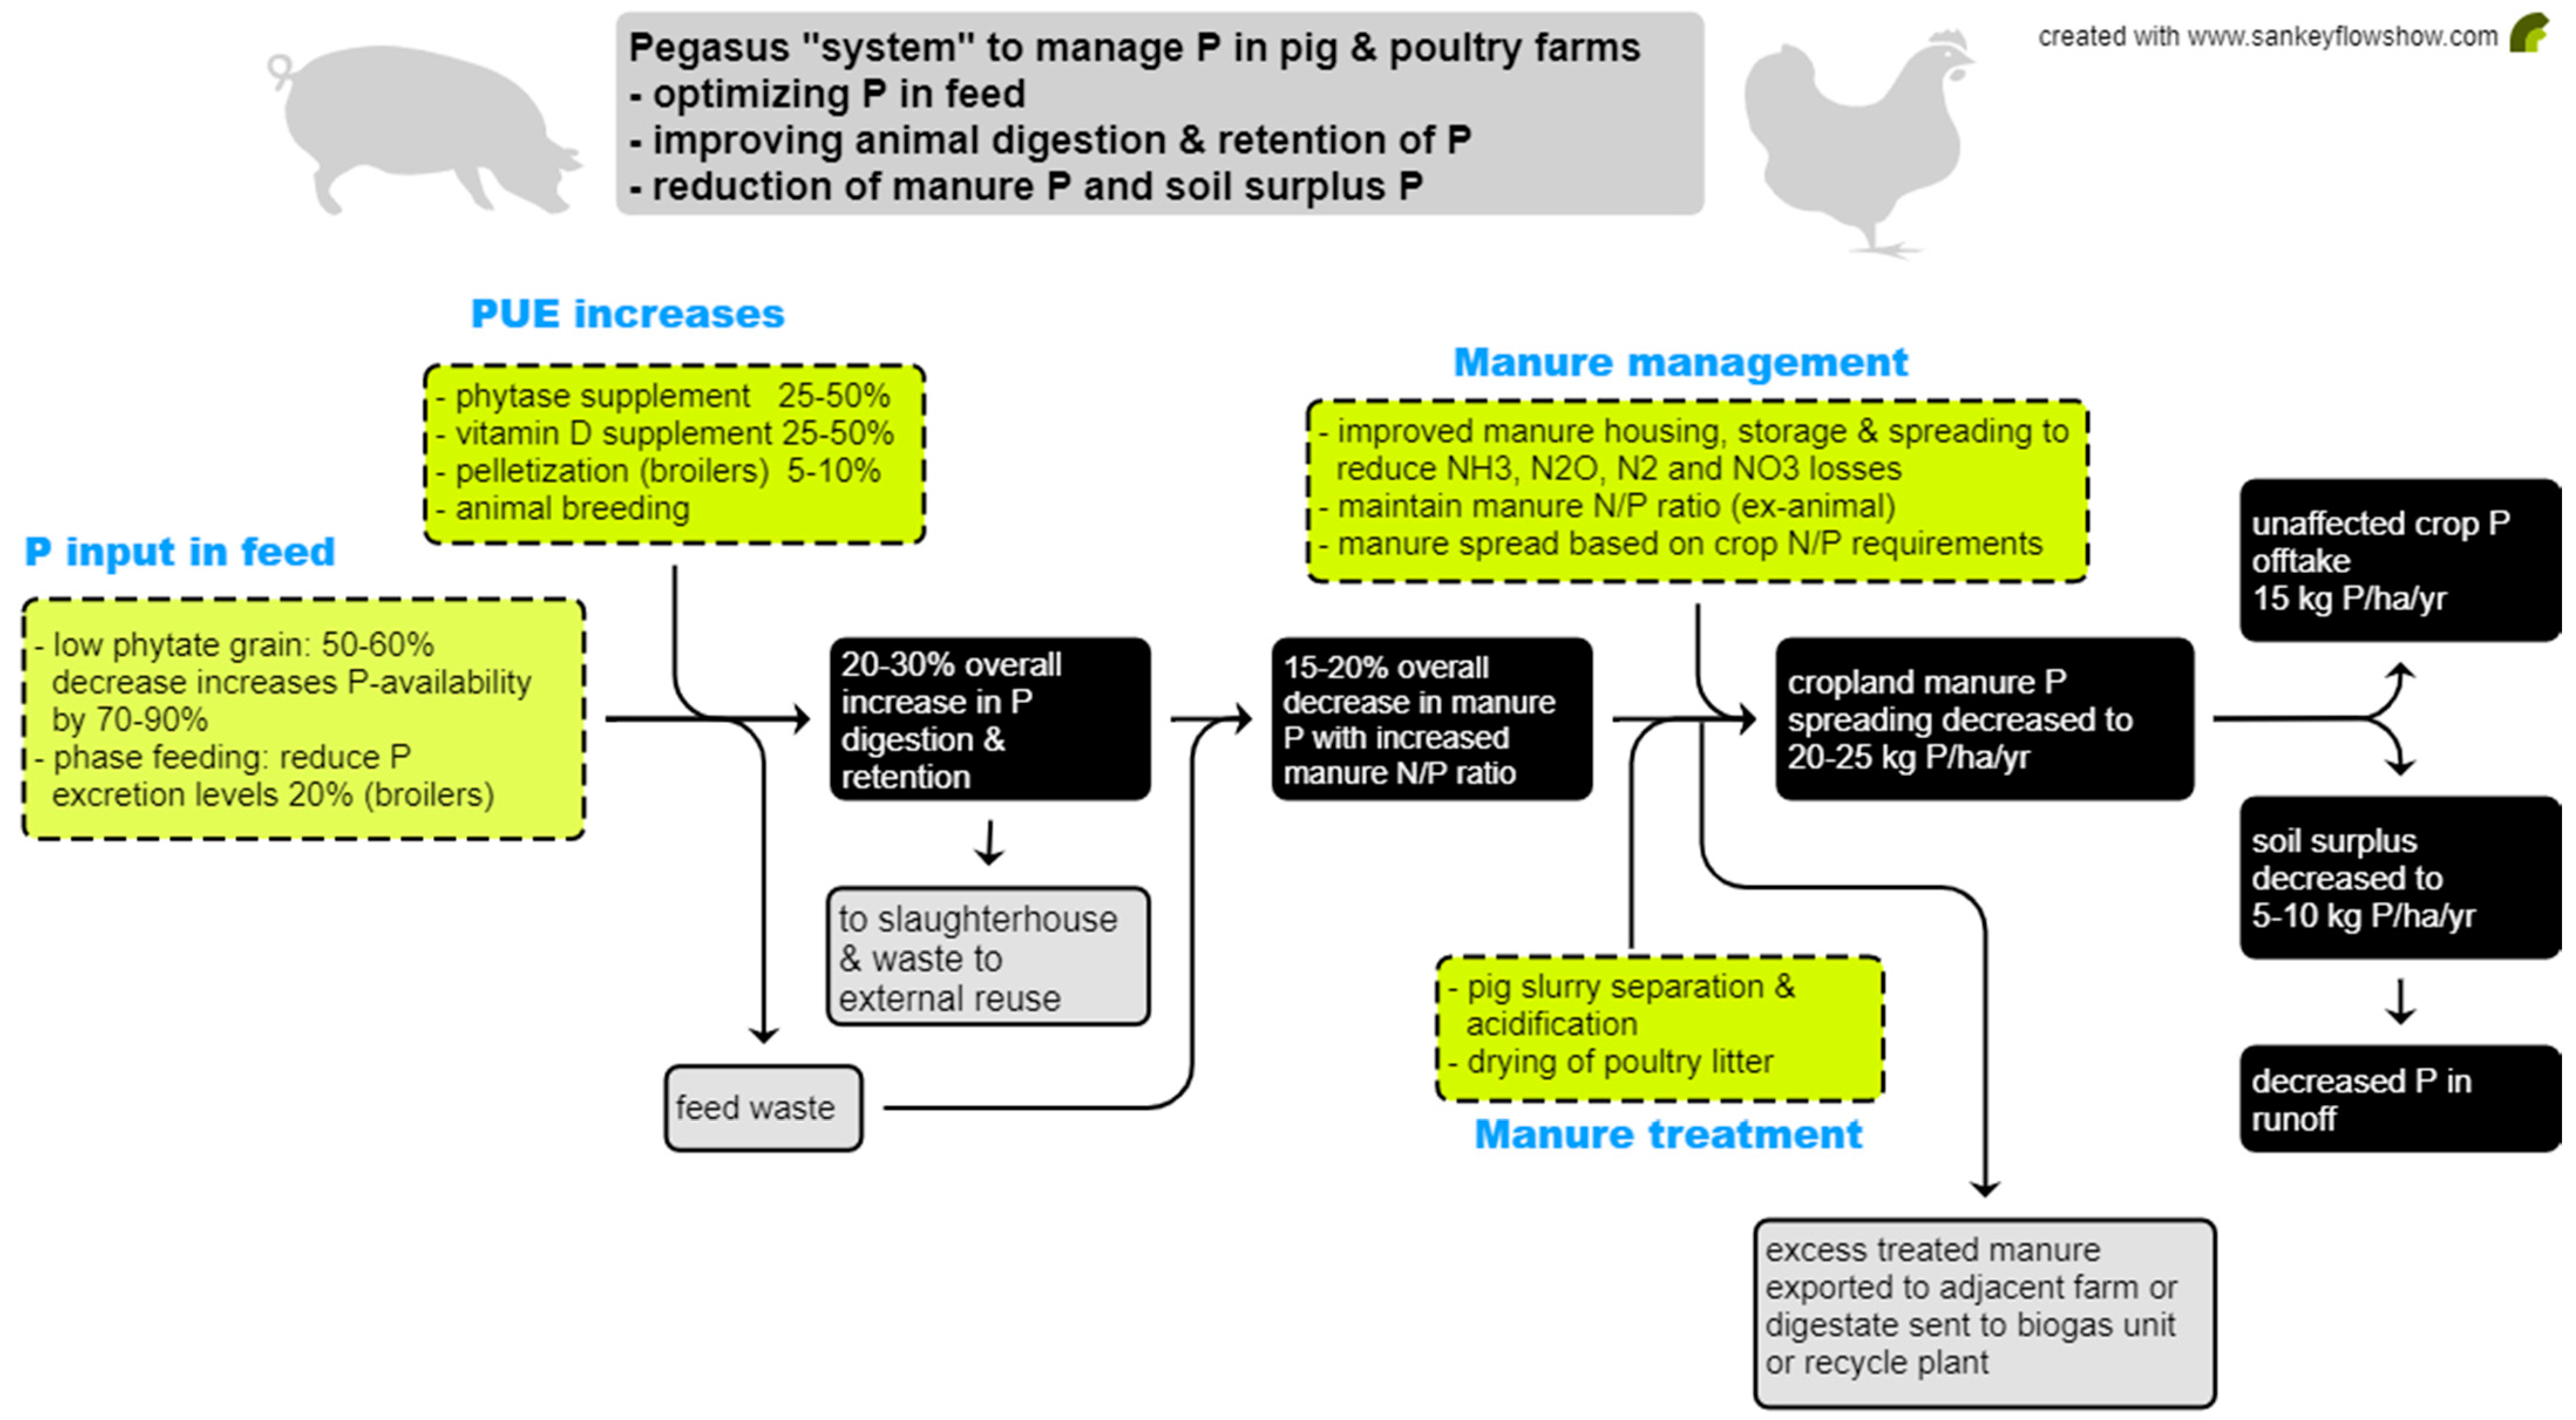
Table 1.
P-loading scenarios for the application of pig manure (7300 kg P/year from Figure 5) to different areas of cropland based on the actual baseline case and P crop requirements. PUE calculated using Formula (2).
Table 1.
P-loading scenarios for the application of pig manure (7300 kg P/year from Figure 5) to different areas of cropland based on the actual baseline case and P crop requirements. PUE calculated using Formula (2).
| Scenario | ha | kg P/ha/Year | PUE (%) | ||
|---|---|---|---|---|---|
| P Load | Crop Offtake | Surplus | |||
| Actual baseline * | 183 | 40 | 28 | 12 | 82.5 |
| Max legal 170 kgN/ha/year | 97 | 75 | 28 | 47 | 67.3 |
| Based on P crop requirement | 260 | 28 | 28 | 0 | 100 |
Table 2.
P-loading scenarios for the application of broiler manure (9500 kg P/year) to different areas of cropland, based on N and P crop requirements for a farm producing 50,000 birds per year. PUE was calculated using Formula (2). Base unit data for feed, production, and manure derived from [72].
Table 2.
P-loading scenarios for the application of broiler manure (9500 kg P/year) to different areas of cropland, based on N and P crop requirements for a farm producing 50,000 birds per year. PUE was calculated using Formula (2). Base unit data for feed, production, and manure derived from [72].
| Scenario | ha | kg P/ha/Year | PUE (%) | ||
|---|---|---|---|---|---|
| P Load | Crop Offtake | Surplus | |||
| Based on max legal 170 kgN/ha/year | 100 | 95 | 28 | 67 | 52.1 |
| Based on P crop requirement | 339 | 28 | 28 | 0 | 100 |
Table 3.
Maximum allowable numbers of animals per ha to comply to the Nitrates Directive manure application of 170 kgN/ha/year with their corresponding farm sizes and minimum numbers of ha for manure spreading for large intensive pig and poultry farms. Based, in part, on data in the EU IPPC BATs Reference Document [3].
| Animal Type | Farm Size Heads/Year | Max Heads/ha to Conform with the Nitrates Directive | Computed Minimum ha at a Spreading Rate of 170 kgN/ha/Year |
|---|---|---|---|
| Sows with piglets | 300 | 5.3–8.1 | 37–56 |
| Fattening pigs | 1000 | 13–23 | 44–77 |
| Broilers | 50,000 | 327–739 | 68–152 |
Publisher’s Note: MDPI stays neutral with regard to jurisdictional claims in published maps and institutional affiliations. |
© 2021 by the authors. Licensee MDPI, Basel, Switzerland. This article is an open access article distributed under the terms and conditions of the Creative Commons Attribution (CC BY) license (https://creativecommons.org/licenses/by/4.0/).
Share and Cite
MDPI and ACS Style
Rosemarin, A.; Ekane, N.; Andersson, K. Phosphorus Flows, Surpluses, and N/P Agronomic Balancing When Using Manure from Pig and Poultry Farms. Agronomy 2021, 11, 2228. https://doi.org/10.3390/agronomy11112228
AMA Style
Rosemarin A, Ekane N, Andersson K. Phosphorus Flows, Surpluses, and N/P Agronomic Balancing When Using Manure from Pig and Poultry Farms. Agronomy. 2021; 11(11):2228. https://doi.org/10.3390/agronomy11112228
Chicago/Turabian StyleRosemarin, Arno, Nelson Ekane, and Kim Andersson. 2021. "Phosphorus Flows, Surpluses, and N/P Agronomic Balancing When Using Manure from Pig and Poultry Farms" Agronomy 11, no. 11: 2228. https://doi.org/10.3390/agronomy11112228
Note that from the first issue of 2016, this journal uses article numbers instead of page numbers. See further details here.