
Development of Monitoring Robot System for Tomato Fruits in Hydroponic Greenhouses


Department of Agricultural Engineering, National Institute of Agricultural Sciences, Jeonju 54875, Korea
*
Authors to whom correspondence should be addressed.
Agronomy 2021, 11(11), 2211; https://doi.org/10.3390/agronomy11112211
Submission received: 7 October 2021
/
Revised: 26 October 2021
/
Accepted: 27 October 2021
/
Published: 31 October 2021
(This article belongs to the Special Issue Application of Computer Vision on Quality Monitoring of Agricultural Products)
Abstract
:Crop monitoring is highly important in terms of the efficient and stable performance of tasks such as planting, spraying, and harvesting, and for this reason, several studies are being conducted to develop and improve crop monitoring robots. In addition, the applications of deep learning algorithms are increasing in the development of agricultural robots since deep learning algorithms that use convolutional neural networks have been proven to show outstanding performance in image classification, segmentation, and object detection. However, most of these applications are focused on the development of harvesting robots, and thus, there are only a few studies that improve and develop monitoring robots through the use of deep learning. For this reason, we aimed to develop a real-time robot monitoring system for the generative growth of tomatoes. The presented method detects tomato fruits grown in hydroponic greenhouses using the Faster R-CNN (region-based convolutional neural network). In addition, we sought to select a color model that was robust to external light, and we used hue values to develop an image-based maturity standard for tomato fruits; furthermore, the developed maturity standard was verified through comparison with expert classification. Finally, the number of tomatoes was counted using a centroid-based tracking algorithm. We trained the detection model using an open dataset and tested the whole system in real-time in a hydroponic greenhouse. A total of 53 tomato fruits were used to verify the developed system, and the developed system achieved 88.6% detection accuracy when completely obscured fruits not captured by the camera were included. When excluding obscured fruits, the system’s accuracy was 90.2%. For the maturity classification, we conducted qualitative evaluations with the assistance of experts.
1. Introduction
The field of robotics is broad and covers many diverse technological areas, and over the last decades, the use of robotic systems has increased in many fields as a result of the technological advancements that have occurred in the areas of visual identification and 3D reconstruction, positioning and fault tolerance, and so on [1,2]. In particular, robotic and automated systems are widely used in the industrial, medical, and military fields, and recently, a number of studies were conducted on the application of robotic and automated systems in agriculture [2]. In the past, the main area of application of robots in agriculture was at the harvesting stage [3], but emerging areas of application of robots in agriculture at present include planting [4,5], spraying [6,7,8,9], harvesting [10,11,12,13,14,15], and monitoring [16,17,18,19]. In particular, crop monitoring is highly important in terms of the efficient and stable performance of tasks such as planting, spraying, and harvesting, and for this reason, several studies are being conducted to develop and improve crop monitoring robots. In addition, there are some studies that utilize monitoring robots in the context of hydroponic greenhouses.
The concept of smart farming relates to the use of information and communications technologies (ICT) in farms to enable the remote and automatic monitoring of crop conditions and the control of growth environments in greenhouses, orchards, livestock barns, and so on [20]. Smart farming aims to increase productivity and improve the quality of products while reducing production costs, and is growing in importance due to the increasing demand for higher crop yields, the aging of farmers, the reduction in agricultural workers as a proportion of the population, the increasing use of ICT, and so on [20,21,22]. For this reason, several studies were conducted to apply agricultural robots for harvesting [11,12,23] in hydroponic greenhouses. However, most of these studies focused on the development of harvesting robots, and thus, there are only a few studies that improve and develop the application of monitoring robots in hydroponic greenhouses through the use of deep learning algorithms.
Meanwhile, the development of artificial intelligence (AI) techniques has led to more studies being conducted on the application of machine learning algorithms in computer vision tasks in agriculture [24]. The application of deep learning algorithms in the development of agricultural robots is increasing since deep learning algorithms that use convolutional neural networks (CNNs) have been proven to show outstanding performance in image classification, segmentation, and object detection tasks [24,25]. For example, several deep learning algorithms that use CNNs, such as YOLOv3 [24], modified YOLOv3, Mask R-CNN [26], Faster R-CNN [27], and so on, were applied to detect fruits. In particular, Faster R-CNN was confirmed to be suitable for the recognition of fruits of different sizes, and its strong performance in the detection of tomato fruits was confirmed [28].
Tomato (Solanum lycopersicum L.) was produced at a quantity of approximately 180.8 million tons worldwide in 2019, and it is one of the most economically important crops in the world [29]. Tomato undergoes both vegetative and generative growth. Vegetative growth includes the growth of the roots, stems and leaves, and generative growth includes growth of the flowers and fruits. During generative growth, tomato fruits undergo several changes such as increases in their size, color changes, and so on. In particular, tomato fruits undergo changes in their skin color from green to red, and these changes are closely related to the maturity and production quality of tomatoes [30]. For this reason, several studies attempted to quantitatively classify the maturity of tomatoes using image processing [31,32,33]. However, it was found to be very difficult to consistently determine the maturity of tomatoes because of their abundance at the time of harvest, which then leads to problems during their distribution and export to faraway places [31]. Furthermore, farmers harvest tomatoes based on practical experience and/or maturity classification charts, and these methods are easily influenced by the environment and mistakes commonly occur [31].
Therefore, we studied the development of a robot that can monitor a large number of tomatoes in real-time following objective criteria. First, we developed the tomato detection model using Faster R-CNN, and the counting model was developed using a centroid-based tracking algorithm. Second, we investigated the use of a color model that is robust to external light changes, and developed an image-based maturity standard for tomato fruits. Subsequently, tomato fruits were classified into six maturity levels using the aforementioned newly developed maturity standard. Third, the number of tomatoes was counted for each maturity stage by tracking the centroid measurements of the detected bounding boxes.
2. System Configuration
Figure 1 shows an image of the general hydroponic greenhouse in Korea. In the sections in which crops are planted, there are rails that are used as hot water pipes, and the other sections are concrete surfaces. For this reason, the drive-wheels of the robot are produced as a double structure. For automatic driving of the robot in the section where crops are planted, two proximity sensors are installed at the bottom of the robot to recognize the start and the end positions of the crop section. On the concrete surface, the robot recognizes the magnetic line on the floor using a magnetic sensor and drives along this line. Figure 2 shows the schematic and actual images of the robot used in this study.
For image-based detection, we set up a system that consisted of a high-performance computer and a camera. The industrial computer, Nuvo-8108 (Neousys tech.), was used with NVIDIA GTX 2080 ti GPU and a ELP 4K USB webcam was installed.
3. Detection and Classification System
In this part, we present the method used for the monitoring of the generative growth of tomato fruits, which involved deep learning-based object detection, object tracking using a centroid tracker, and maturity classification using image processing. The architecture of our approach is shown in Figure 3. When the object detector outputs bounding boxes, the tomato fruit region for each bounding box is clustered using the k-means clustering algorithm. The fruit region is converted from the RGB (Red, Green, and Blue) to the HSV (hue, saturation, and value) color model and the hue channel image is extracted. The maturity of tomato fruits is classified into six levels using the hue values. The boxes are tracked and obtain an ID using centroid-based object tracking to prohibit duplicate counting.
3.1. Tomato Detection
3.1.1. Dataset and Training
There are several state-of-the-art object detection models that use CNNs, such as R-CNN [34], YOLO (Real-time object detection) [35], Faster R-CNN [36], SSD (Single-shot detector) [37] and so on. R-CNN and Faster R-CNN are two-stage networks that propose bounding box regions and then classify the object; YOLO and SSD are one-stage networks that classify and localize the object simultaneously. In object detection, there is a trade-off between processing time and performance. One-stage methods are fast, but their accuracy is lower than two-stage methods; two-stage methods have better performance, but they take a much longer time to process.
In this study, we apply Faster R-CNN for the real-time detection of tomato fruits from frames taken in the greenhouse by a robot. Faster R-CNN with a ResNet backbone shows better mAP (mean average precision) than other networks [38]. Thus, ResNet-101 [38] was used as the backbone CNN.
To train and validate the detection model, we used the Tomato open dataset [39]. It contains 895 images with single class bounding box annotations provided in PASCAL VOC format. The dataset was randomly divided into two sets: the training set (90%, 805 images) and the validation set (10%, 90 images).
We trained the Faster R-CNN with ResNet-101 on an RTX Titan GPU and an Intel Core i9-9940X CPU. The TensorFlow deep learning framework was used; the learning rate was 0.04 and the number of epochs was 10,000. A momentum optimizer was used with a momentum value of 0.9 and a cosine learning-rate decay. It achieved a 0.0149 loss for classification and a 0.005 loss for detection. The total loss was 0.0299. Figure 4a shows the validation total loss graph provided by TensorBoard. The x-axis tracks the epoch and the y-axis measures the total loss. The graph shows that training was terminated well without overfitting and that it achieved a low error rate. Figure 4b shows how the learning rate was scheduled.
3.1.2. Postprocess
Since the outputs of the detection model, Faster R-CNN, are in a rectangular shape, including the background area, only the tomato fruit area should be separated to classify its maturity. The k-means clustering algorithm was used to separate tomato areas from the background area, and the k value was set as 2 in this study. There are several object segmentation methods such as Mask R-CNN [40], but the object cannot be processed in real-time because it takes about 200 milliseconds to process one frame [40]. However, Faster R-CNN takes 55 milliseconds when using the ResNet-101 backbone. Since the processing time can also be increased with more objects, we detected bounding boxes using Faster R-CNN and then separated the fruit using k-means clustering.
To track and count detected objects without duplication in the real-time video, centroid-based object tracking was used. The center point of the bounding box, the centroid, was computed and assigned a unique ID (Identification). When the video frame was updated and new points were given, the point that minimized the Euclidean distance between the original point was chosen as an associate centroid. If the point was not associated with any other points, it was given a new ID.
3.2. Maturity Classification
In this section, the tomato maturity level and the image space analysis for maturity classification are described. The correlations between maturity and harvesting time are detailed in Section 3.2.1. To investigate the color changes on the surfaces of tomatoes, we considered several image pre-processing methods, the details of which are described in Section 3.2.2.
3.2.1. Maturity
In this study, tomato maturity was divided into six levels (Green, Breakers, Turing, Pink, Light Red, and Red) according to the USDA (United States Department of Agriculture) standard [32]. Table 1 shows the maturity levels of the tomatoes referenced in this study; the maturity levels are classified by the ratio of the red region. Thus, we considered the quantitative classification of tomato maturity through the use of both the USDA standard for tomato maturity and image processing; this process is detailed in Section 3.2.
In general, the color changes in tomato fruits are closely related to the accumulated temperature, and the accumulated temperature is the integrated excess or deficiency of temperature for fixed data. In particular, the accumulated temperature could be used in crop growth models, and it may prove increasingly important for assessing the impact of climate change [41]. The maturity levels for tomato fruits may be estimated using the accumulated temperature, and it is known that the accumulated temperatures in the light red and red stages are approximately 1000 and 1100 °C·day, respectively [42].
3.2.2. Image Acquisition and RGB Channels
As mentioned in Section 3.1, the USDA provides the maturity level but specific information regarding the image is not included, such as which color channel is used. A quantitative standard that uses image characteristics is required for image-based maturity classification. We first tried to investigate the correlation between the maturity level and the RGB image.
A temperature sensor was used to measure the atmospheric temperature in a greenhouse, and temperature data were measured every five minutes. Temperature data acquired over a day were averaged to calculate the accumulated temperature. The accumulated temperature was calculated from the time of flowering, and when the green stage was reached, the accumulated temperature was 366.84 °C. We started to acquire the images and count the accumulated temperature from the green stages of the tomatoes.
The images for two tomato groups (including nine tomato objects) were obtained for forty days, not including weekends, to investigate the changes in skin color of the tomato fruits using a digital camera (D5, Canon, Tokyo, Japan). The shutter speed and ISO were fixed at 1/20 s and 200, respectively. The camera was fixed at 550 mm in front of the tomatoes (the distance between the lens and the tomatoes was 500 mm). The images were captured with a color checker (SpyderCheckr 24, Datacolor, Lucerne, Switzerland) to compare brightness information. Finally, we selected 21 and 22 images without noise for group 1 and 2, respectively. Examples of the images are shown in Figure 5. There were five tomatoes in each group, but after the tomatoes grew, only four tomatoes ultimately remained in group 2.
The region of interest (ROI) for each tomato was segmented, and the pixel values for the red, green, and blue (RGB) channels were extracted from each tomato. For each channel of the RGB image, the pixel values within the area were averaged. Then, the averaged values for nine images were averaged again to represent each RGB color characteristic in relation to the accumulated temperature of the day: . Equation (1) describes this process. Note that the value of n was 9 in our case, because n refers to the number of target fruits. Correlations between the accumulated temperature and c values of each channel are shown in Figure 6. As shown in Figure 6, there was no significant difference between RGB values and the accumulated temperature. The RGB color model is considered to be an additive color model, in which the temperature of “light” produces corresponding colors [43]. It produces colors by mixing the primary colors of light, red, green, and blue, and then it is affected by lightness.
The light in the greenhouse was unstable due to the sunlight and the shading system. In this case, the image brightness needed to be changed according to several environmental factors such as the weather, the circumstances of the greenhouse, and so on. Thus, RGB values were not suitable for the analysis of skin color changes in tomatoes growing in the greenhouse, because RGB values are significantly affected by these factors. For this reason, to figure out the relationship between the maturity level (the accumulated temperature) and the image characteristics, it was necessary that some image pre-processing, such as gamma correction, be conducted, in addition to finding robust features that are resistant to changes in brightness.
3.2.3. Color Space Analysis
As mentioned above, the brightness can differ for each image due to the greenhouse environment. Thus, we considered checking the brightness distribution of the entire dataset. The pixel value, when the image is converted into grayscale, simply denotes the brightness at each location. For the above reasons, the mean of the pixel values in grayscale images can represent the average brightness of the image. A color checker is an appropriate reference since it is an invariable feature in acquired images. The grayscale areas of the color checker are segmented for consistent brightness comparison as shown in Figure 7. We measured the mean brightness of the grayscale blocks, and Figure 8 shows their distribution. The mean was 82.86 and the standard deviation of the overall distribution was 32.78. This indicates that the image was significantly affected by light conditions, resulting in variations in the brightness of the image. The images were divided into three groups using the average brightness distribution of our target tomatoes, which also had a large standard deviation. Figure 8 also describes the group classification. Since the standard range was from 50.07 to 115.64, the groups included images in following ranges: under 50.07, from 50.07 to 115.64, and over 115.64.
Table 2 indicates the changes in the color model of tomatoes according to brightness. Although all tomatoes were at a similar maturity stage, the brightness differed up to 93.68. The fact that each pixel could contain values from 0 to 255 ensured that the light conditions were not too unstable in the greenhouse. The red and green values also did not show any tendency. This difference could have affected RGB values that contained color and lightness information simultaneously, in which case the quantification of maturity through the image would have become difficult. In Table 2, red and green values also differed significantly, and their standard deviations were as high as 26.24 and 39.35.
To find color features that could overcome the influence of external light, we converted the RGB color model to an HSV and L * a * b * model and the obtained average values of each channel are shown in Table 2. When the standard deviations between three images were configured, the hue value showed the least difference as being 1.23. Figure 9 shows the correlation between hue values and the accumulated temperature; the linear regression model was fitted, and the R-squared value was 0.96. It can be seen that the hue channel value was robust to external light changes and had a linear relationship with the accumulated temperature. For these reasons, the HSV color model was applied to classify the maturity level.
Using our temperature–hue data, we divided the maturity into six levels. The point at which the hue value became lower was set as the “green” standard. The “red” standard was set at the point at which the hue stopped changing and the accumulated temperature reached about 1100 °C per day. Then, the range was divided into four sections. Figure 10 shows the relationship between the hue color model and the maturity levels for tomato fruits, and image-based maturity standard for tomato fruits was defined by this relationship. In addition, we confirmed the relationship between the color model and the maturity levels with the assistance of three experts who run tomato farms. Twenty tomato fruits were classified into six levels of maturity by the three experts, and the a * value of each tomato fruit was measured using a portable colorimeter (CR20, Konica Minolta, Tokyo, Japan). The a * values obtained from the images were calculated as average values. As a result, it was confirmed that the calculated a * values from the images were within the range of each maturity level, as classified by the three experts (Figure 11).
Figure 11 shows the relationship between the measured and calculated a * values. The hue values obtained from the images were used for monitoring.
4. Field Test and Results
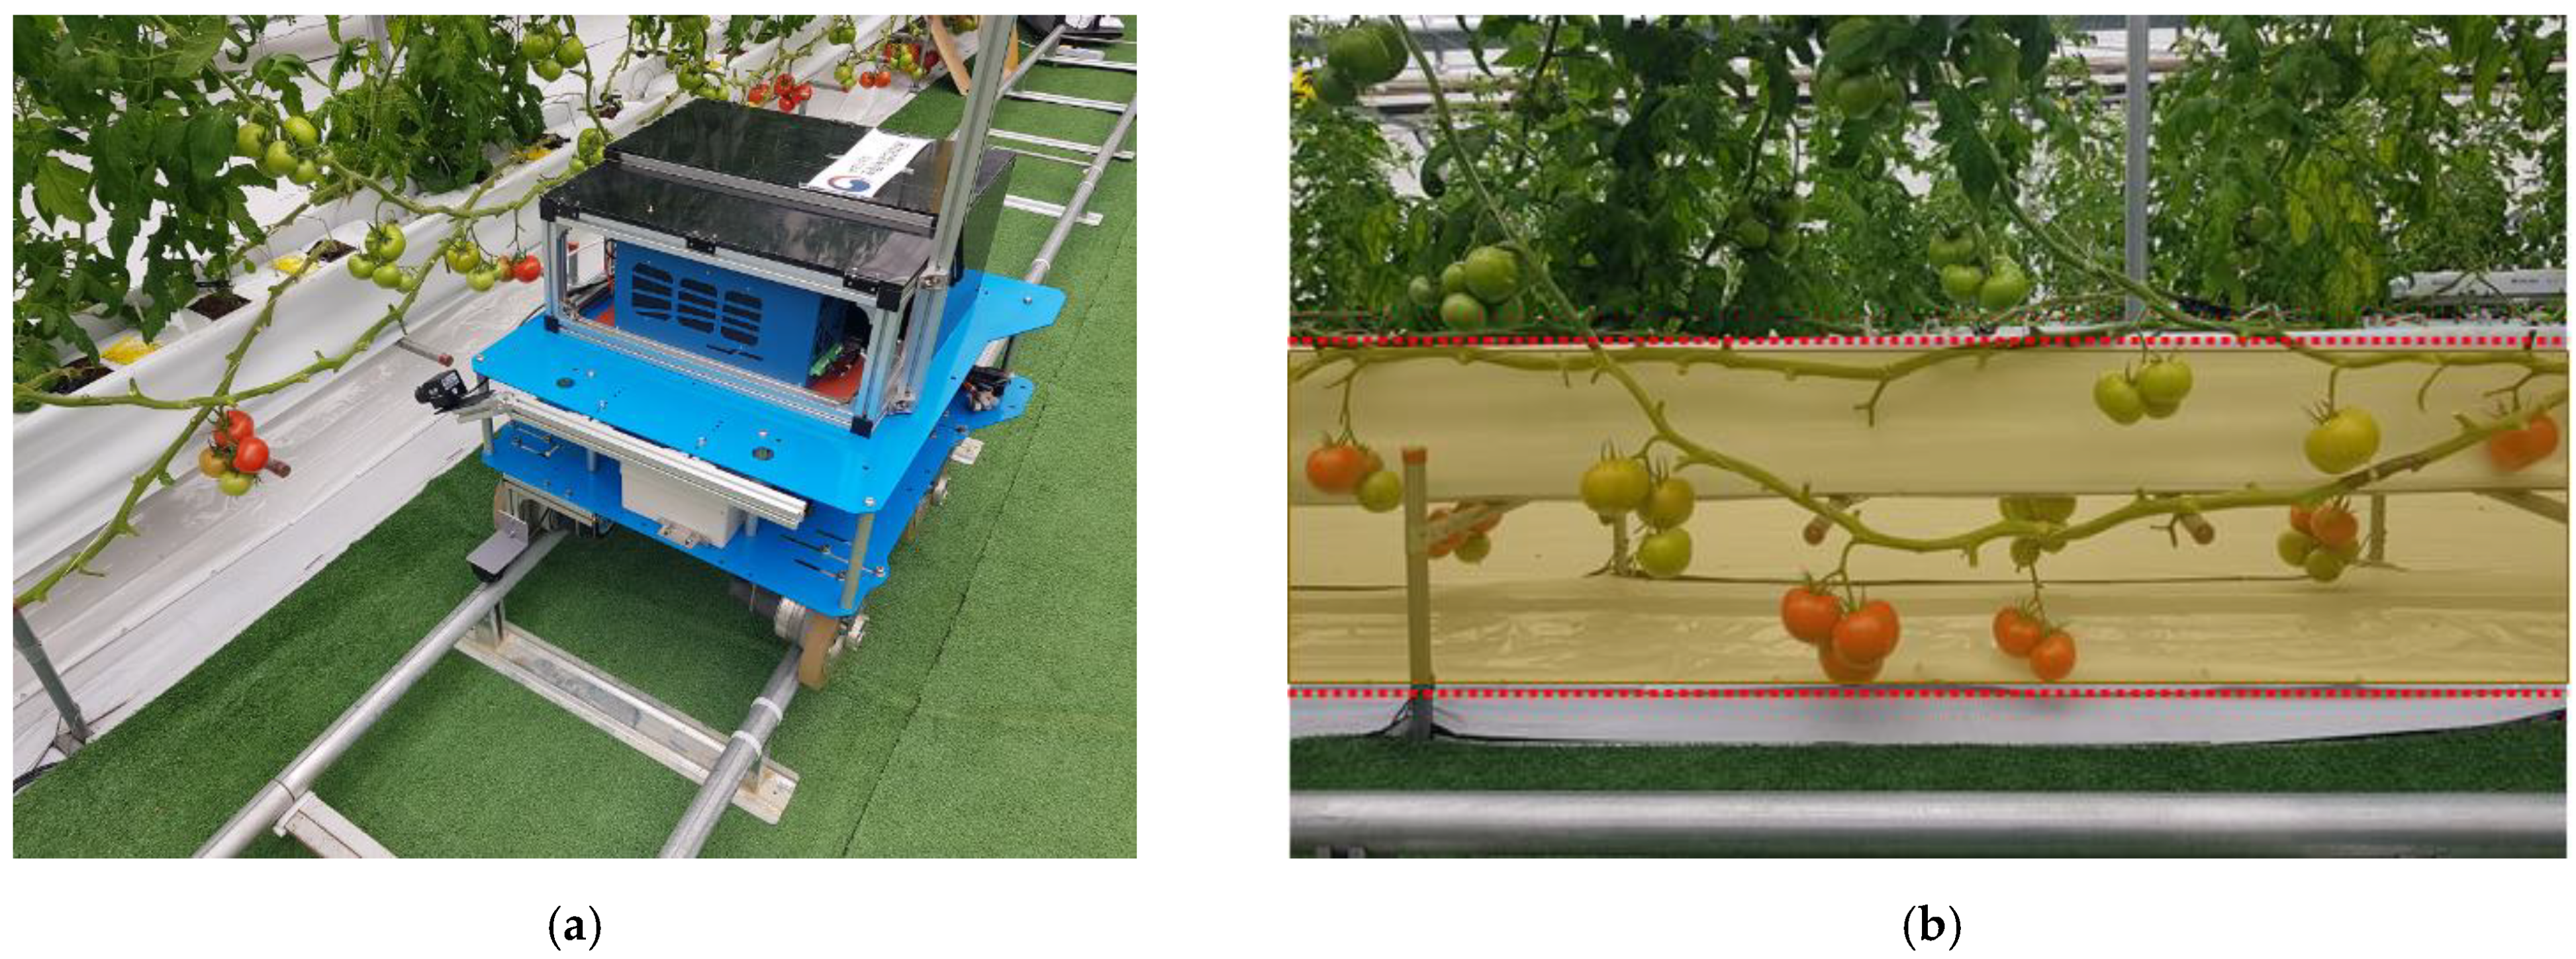
The proposed method was tested in the test bed greenhouse. The robot and the system mentioned in Section 2 were used as shown in Figure 12a. The camera took a real-time video of the tomatoes that had reached the fully vegetative stage of growth; the shooting area is shown in Figure 12b. To prevent the inclusion of fruit on the other side, the camera was tilted 30° at 600 mm from the target. Figure 13 shows the example output frame. Each bounding box was given a class name (the maturity stage) and a unique ID, and was labelled with the mean hue value of the fruit region.
The test was repeated 10 times in the same area to evaluate the detection and counting performance. We scored the system with a degree of accuracy that represents the ratio of true predictions to the total number of objects. The developed system achieved 88.6% detection accuracy when including fruits that were not captured by the camera because they were completely obscured. The actual value of the number of tomatoes was 53 and the average of 10 predictions was 54.4. As a result of the test, fewer than 53 objects were measured two times, 53 objects were measured four times, and 54 objects were measured more than four times. Meanwhile, when excluding the completely obscured fruits, the system accuracy was 90.2%. Duplicate detections sometimes occurred for 4 to 6 objects, and one case occurred in which the same value was counted twice, leading to a duplicate error. As mentioned in the above section, we verified the image-based maturity standard through comparison with expert classification, and we confirmed that the maturity standard could be used to monitor the maturity level of tomato fruits in hydroponic greenhouses. However, the maturity standard in the field may differ depending on the expert, farm, and so on. Thus, it will be necessary to collect more classification data from experts in order to achieve more comprehensive classification in the future. This method has the potential to predict the harvest times of tomato fruits according to their maturity levels.
As mentioned in Section 2, a GPU was included in our hardware system, which meant that the processing time was sufficiently low to process deep learning-based programs in real-time. Table 3 describes the processing time during the field test. For a given frame, the inference of object detection using Faster R-CNN took 0.16 s and the total processing time was 0.18 s in average. The robot in Figure 12a moved at 0.16 m/s; therefore, the processing time was appropriate for the monitoring of tomato fruits in real-time. In fact, the processing time could be longer with the presence of too many objects, as shown in Figure 13, since, in general, inference takes a significantly longer time and each output bounding box should perform the process from the k-means clustering to the centroid-tracking stage. However, with these shortcuts, a speed of at least 2 FPS was achieved with the measurement of 10 objects.
5. Conclusions
This article presents a real-time robotic system for monitoring the generative growth of tomato fruits. The system photographed tomato fruits in real-time with a RGB camera, detected their presence, and classified their maturity into six levels. It also counted the number of tomato fruits at each maturity level. Tomatoes grown under the hydroponic conditions were detected by deep learning-based object detection and Faster R-CNN, and the tomato fruit regions were separated from the background region using the k-means clustering algorithm. We converted the frame image from an RGB to an HSV color model and the maturity was classified into six levels using the mean hue values of the fruit regions. In general, the one-step method of deep learning algorithms is used to detect and classify the maturity levels of fruits. However, this method might not be suitable for the uniform classification of maturity levels, because there is no quantitative standard for classifying these maturity levels. Thus, we considered the use of a two-step method that separates the detection and classification, and we found that the developed system has the potential to monitor the maturity levels of tomato fruits in hydroponic greenhouses. Each object was identified for counting purposes using the centroid-based object tracking algorithm.
The presented system was able to monitor the numbers and maturity levels of tomato fruits with appropriate accuracy. Thus, we conclude that the presented system could be useful in the prediction of the harvest times and production levels of tomatoes, and that it could also be applied to develop a tomato harvesting robot. However, to ensure greater accuracy in the detection and counting of tomato fruits in hydroponic greenhouses, the detection performance of the model must be improved, and the occlusion and duplicate problems need to be solved.
Author Contributions
D.S. as first author planned the experiments and wrote the manuscript. B.-H.C. and K.-C.K. led the overall research as a corresponding author and helped revised the manuscript. All authors have read and agreed to the published version of the manuscript.
Funding
This work was supported by Korea Institute of Planning and Evaluation for Technology in Food, Agriculture and Forestry (IPET) and Korea Smart Farm R&D Foundation through Smart Farm Innovation Technology Development Program, funded by MAFRA, MSICT and RDA (421031-04).
Data Availability Statement
The data presented in this study are available on request from the corresponding author. The data are not publicly available due to privacy reasons.
Conflicts of Interest
The authors declare no conflict of interest.
References
- Yang, D.; Li, H.; Zhang, L. Study on the fruit recognition system based on machine vision. Adv. J. Food Sci. Technol. 2016, 10, 18–21. [Google Scholar] [CrossRef]
- Tang, Y.; Chen, M.; Wang, C.; Luo, L.; Li, J.; Lian, G.; Zou, X. Recognition and localization methods for vision-based fruit picking robots: A review. Front. Plant Sci. 2020, 11, 1–17. [Google Scholar] [CrossRef] [PubMed]
- Zhang, Q.; Karkee, M.; Tabb, A. The use of agricultural robots in orchard management. In Robotics and Automation for Improving Agriculture; Billingsley, J., Ed.; Burleigh Dodds Science Publishing: Cambridge, UK, 2019; pp. 187–214, https://arxiv.org/abs/1907.13114. [Google Scholar]
- Srinivasan, N.; Prabhu, P.; Smruthi, S.S.; Sivaraman, N.V.; Gladwin, S.J.; Rajavel, R.; Natarajan, A.R. Design of an autonomous seed plating robot. In Proceedings of the 2016 IEEE Region 10 Humanitarian Technology Conference (R10-HTC), Agra, India, 21–23 December 2016; pp. 1–4. [Google Scholar] [CrossRef]
- Santhi, P.V.; Kapileswar, N.; Chenchela, V.K.R.; Prasad, C.H.V.S. Sensor and vision based autonomous AGRIBOT for sowing seeds. In Proceedings of the 2017 International Conference on Energy, Communication, Data Analysis and Soft Computing (ICECDS), Chennai, India, 1–2 August 2017; pp. 242–245. [Google Scholar] [CrossRef]
- Khuantham, C.; Sonthitham, A. Spraying robot controlled by application smartphone for pepper farm. In Proceedings of the 2020 International Conference on Power, Energy and Innovations (ICPEI), Chiangmai, Thailand, 14–16 October 2020; pp. 225–228. [Google Scholar] [CrossRef]
- Cantelli, L.; Bonaccorse, F.; Longo, D.; Melita, C.D.; Schillaci, G.; Muscato, G. A small versatile electrical robot for autonomous spraying in agriculture. Agric. Eng. 2019, 1, 391–402. [Google Scholar] [CrossRef] [Green Version]
- Danton, A.; Roux, J.C.; Dance, B.; Cariou, C.; Lenain, R. Development of a spraying robot for precision agriculture: An edge following approach. In Proceedings of the 2020 IEEE Conference on Control Technology and Applications (CCTA), Montreal, QC, Canada, 24–26 August 2020; pp. 267–272. [Google Scholar] [CrossRef]
- Murugan, K.; Shankar, B.J.; Sumanth, A.; Sudharshan, C.V.; Reddy, G.V. Smart automated pesticide spraying bot. In Proceedings of the 2020 3rd International Conference on Intelligent Sustainable Systems (ICISS), Thoothukudi, India, 3–5 December 2020; pp. 864–868. [Google Scholar] [CrossRef]
- Mu, L.; Cui, G.; Liu, Y.; Cui, Y.; Fu, L.; Gejima, Y. Design and simulation of an integrated end-effector for picking kiwifruit by robot. Inf. Process. Agric. 2020, 7, 58–71. [Google Scholar] [CrossRef]
- Arad, B.; Balendonck, J.; Barth, R.; Ben-Shahar, O.; Edan, Y.; Hellström, T.; Hemming, J.; Kurtser, P.; Ringdahl, O.; Tielen, T.; et al. Development of a sweet pepper harvesting robot. J. Field Robot. 2020, 37, 1027–1039. [Google Scholar] [CrossRef]
- Xiong, Y.; Ge, Y.; Grimstad, L.; From, P.J. An autonomous strawberry-harvesting robot: Design, development, integration, and field evaluation. J. Field Robot. 2020, 37, 202–224. [Google Scholar] [CrossRef] [Green Version]
- Kuznetsova, A.; Maleva, T.; Soloviev, V. Using YOLOv3 algorithm with pre- and post-processing for apple detection in fruit-harvesting robot. Agronomy 2020, 10, 1016. [Google Scholar] [CrossRef]
- Taqi, F.; Al-Langawi, F.; Abdulraheem, H.; El-Abd, M. A cherry-tomato harvesting robot. In Proceedings of the 2017 18th International Conference on Advanced Robotics (ICAR), Hong Kong, China, 10–12 July 2017; pp. 463–468. [Google Scholar] [CrossRef]
- Badeka, E.; Vrochidou, E.; Papakostas, G.A.; Pachidis, T.; Kaburlasos, V.G. Harvest crate detection for grapes harvesting robot based on YOLOv3 model. In Proceedings of the 2020 Fourth International Conference On Intelligent Computing in Data Sciences (ICDS), Fez, Morocco, 21–23 October 2020; pp. 1–5. [Google Scholar] [CrossRef]
- Chou, W.C.; Tsai, W.R.; Chang, H.H.; Lu, S.Y.; Lin, K.F.; Lin, P.L. Prioritization of pesticides in crops with a semi-quantitative risk ranking method for Taiwan postmarket monitoring program. J. Food Drug Anal. 2019, 27, 347–354. [Google Scholar] [CrossRef] [Green Version]
- Ravankar, A.; Ravankar, A.A.; Watanabe, M.; Hoshino, Y.; Rawankar, A. Development of a low-cost semantic monitoring system for vineyards using autonomous robots. Agriculture 2020, 10, 182. [Google Scholar] [CrossRef]
- Kim, W.S.; Lee, D.H.; Kim, Y.J.; Kim, T.; Lee, W.S.; Choi, C.H. Stereo-vision-based crop height estimation for agricultural robots. Comput. Electron. Agric. 2021, 181, 105937. [Google Scholar] [CrossRef]
- Fernando, S.; Nethmi, R.; Silva, A.; Perera, A.; De Silva, R.; Abeygunawardhana, P.K.W. Intelligent disease detection system for greenhouse with a robotic monitoring system. In Proceedings of the 2020 2nd International Conference on Advancements in Computing (ICAC), Malabe, Sri Lanka, 10–11 December 2020; pp. 204–209. [Google Scholar] [CrossRef]
- Yoon, C.; Lim, D.; Park, C. Factors affecting adoption of smart farms: The case of Korea. Comput. Hum. Behav. 2020, 108, 106309. [Google Scholar] [CrossRef]
- Santos, L.C.; Aguiar, A.S.; Santos, F.N.; Valente, A.; Petry, M. Occupancy grid and topological maps extraction from satellite images for path planning in agricultural robots. Robotics 2020, 9, 77. [Google Scholar] [CrossRef]
- Moysiadis, V.; Sarigiannidis, P.; Vitsas, V.; Khelifi, A. Smart farming in Europe. Comput. Sci. Rev. 2021, 39, 100345. [Google Scholar] [CrossRef]
- Rong, J.; Wang, P.; Yang, Q.; Huang, F. A field-tested harvesting robot for oyster mushroom in greenhouse. Agronomy 2021, 11, 1210. [Google Scholar] [CrossRef]
- Liu, G.; Nouaze, J.C.; Mbouembe, P.L.T.; Kim, J.H. YOLO-tomato: A robust algorithm for tomato detection based on YOLOv3. Sensors 2020, 20, 2145. [Google Scholar] [CrossRef] [PubMed] [Green Version]
- Lawal, M.O. Tomato detection based on modified YOLOv3 framework. Sci. Rep. 2021, 11, 1447. [Google Scholar] [CrossRef]
- Afonso, M.; Fonteijn, H.; Fiorentin, F.S.; Lensink, D.; Mooij, M.; Faber, N.; Polder, G.; Wehrens, R. Tomato fruit detection and counting in greenhouses using deep learning. Front. Plant Sci. 2020, 11, 571299. [Google Scholar] [CrossRef]
- Hu, C.; Liu, X.; Pan, Z.; Li, P. Automatic detection of single ripe tomato on plant combining Faster R-CNN and intuitionistic Fuzzy set. IEEE Access 2019, 7, 154683–154696. [Google Scholar] [CrossRef]
- Iwasaki, Y.; Yamane, A.; Itoh, M.; Goto, C.; Matsumuto, H.; Takaichi, M. Demonstration of year-round production of tomato fruits with high soluble-solids content by low node-order pinching and high-density planting. Bull. NARO Crop. Sci. 2019, 3, 41–51. [Google Scholar] [CrossRef]
- FAOSTAT. Available online: http://www.fao.org/faostat/en/#home (accessed on 15 August 2021).
- Alexander, L.; Grierson, D. Ethylene biosynthesis and action in tomato: A model for climacteric fruit ripening. J. Exp. Bot. 2002, 53, 2039–2055. [Google Scholar] [CrossRef] [PubMed]
- Garcia, M.B.; Ambat, S.; Adao, R.T. Tomayto, tomahto: A machine learning approach for tomato ripening stage identification using pixel-based color image classification. In Proceedings of the 2019 IEEE 11th International Conference on Humanoid, Nanotechnology, Information Technology, Communication and Control, Environment, and Management (HNICEM), Laoag, Philippines, 29 November–1 December 2019; pp. 1–6. [Google Scholar] [CrossRef]
- Rupanagudi, S.R.; Ranjani, B.S.; Nagaraj, P.; Bhat, V.G. A cost effective tomato maturity grading system using image processing for farmers. In Proceedings of the 2014 International Conference on Contemporary Computing and Informatics (IC3I), Mysore, India, 27–29 November 2014; pp. 7–12. [Google Scholar] [CrossRef]
- Pacheco, W.D.N.; Lopez, F.R.J. Tomato classification according to organoleptic maturity (coloration) using machine learning algorithms K-NN, MLP, and K-Means Clustering. In Proceedings of the 2019 XXII Symposium on Image, Signal Processing and Artificial Vision (STSIVA), Bucaramanga, Colombia, 24–26 April 2019; pp. 1–5. [Google Scholar] [CrossRef]
- Girshick, R.; Donahue, J.; Darrell, T.; Malik, J. Rich feature hierarchies for accurate object detection and semantic segmentation. In Proceedings of the 2014 IEEE Conference on Computer Vision and Pattern Recognition, Columbus, OH, USA, 23–28 June 2014; pp. 580–587. [Google Scholar] [CrossRef] [Green Version]
- Redmon, J.; Divvala, S.; Girshick, R.; Farhadi, A. You Only Look Once: Unified, Real-Time Object Detection. In Proceedings of the 2016 IEEE Conference of Computer Vision and Pattern Recogniton, Las Vegas, NV, USA, 27–30 June 2016; pp. 779–788. [Google Scholar] [CrossRef] [Green Version]
- Ren, S.; He, R.; Girshick, R.; Sun, J. Faster R-CNN: Towards Real-Time Object Detectin with Region Proposal Networks. IEEE Trans. Pattern Anal. Mach. Intell. 2017, 39, 1137–1149. [Google Scholar] [CrossRef] [PubMed] [Green Version]
- Liu, W.; Anguelov, D.; Erhan, D.; Szegedy, C.; Reed, S.; Fu, C.Y.; Berg, A.C. SSD: Single shot multibox detector. In Proceedings of the European Conference on Computer Vision, Amsterdam, The Netherlands, 11–14 October 2016; pp. 21–37. [Google Scholar] [CrossRef] [Green Version]
- He, K.; Zhang, X.; Ren, S.; Sun, J. Deep Residual Learning for Image Recogniton. In Proceedings of the 2016 IEEE Conference of Computer Vision and Pattern Recogniton, Las Vegas, NV, USA, 27–30 June 2016; pp. 770–778. [Google Scholar] [CrossRef] [Green Version]
- Make ML, Tomato Dataset, Make ML. Available online: https://makeml.app/datasets/tomato (accessed on 25 August 2021).
- He, K.; Gkioxari, G.; Dollár, P.; Girshick, R. Mask R-CNN. In Proceedings of the 2017 IEEE International Conference on Computer Vision, Venice, Italy, 22–29 October 2017; pp. 2980–2988. [Google Scholar] [CrossRef]
- Hallett, S.H.; Jones, R.J.A. Compilation of an accumulated temperature databased for use in an environmental information system. Agric. For. Meteorol. 1993, 63, 21–34. [Google Scholar] [CrossRef]
- Harvest Timer. Available online: https://harvest-timer.com (accessed on 23 August 2021).
- Hirsch, R. Exploring Colour Photography: A Complete Guide; Laurance King Publishing: London, UK, 2004; ISBN 1-85669-420-8. [Google Scholar]
Figure 1.
The general hydroponic greenhouse in Korea.

Figure 2.
The schematic and the actual image of the monitoring robot.

Figure 3.
The architecture of the proposed system.

Figure 4.
(a) Validation total loss graph and (b) the learning rate schedule.

Figure 5.
Examples of the acquired images.

Figure 6.
Correlation between the accumulated temperature and each RGB channel: (a) the red channel; (b) the green channel; (c) the blue channel.
Figure 6.
Correlation between the accumulated temperature and each RGB channel: (a) the red channel; (b) the green channel; (c) the blue channel.

Figure 7.
The grayscale area of the color checker obtained from the image.

Figure 8.
The brightness distribution in the greenhouse.

Figure 9.
The change in hue color model at different accumulated temperatures.

Figure 10.
The relationship between hue color model and maturity level for the tomato fruits.

Figure 11.
Comparison of the measured a * value through expert classification, and the a * values calculated from images.
Figure 11.
Comparison of the measured a * value through expert classification, and the a * values calculated from images.

Figure 12.
The test environments: (a) the robot on the rail in the greenhouse; (b) the detection area.
Figure 12.
The test environments: (a) the robot on the rail in the greenhouse; (b) the detection area.

Figure 13.
Example of the output images.


Table 1.
Maturity levels of tomato fruits.
| Maturity | Description | |
|---|---|---|
| Green | Entirely green |  |
| Breakers | First appearance of external pink or red color; not more than 10% |  |
| Turning | Over 10% but not more than 30% red or pink |  |
| Pink | Over 30% but not more than 60% pinkish or red |  |
| Light Red | Over 60% but not more than 90% red |  |
| Red | Over 90% red |  |
Table 2.
Comparisons of the color models.
| Brightness (Accumulated Temperature) |  37.82 (982.0 °C·Day) |  68.92 (1115.1 °C·Day) |  131.50 (1066.6 °C·Day) | Standard Deviation |
|---|---|---|---|---|
| Red | 8.45 | 26.75 | 70.95 | 26.24 |
| Green | 27.53 | 49.80 | 119.88 | 39.35 |
| Blue | 78.02 | 144.80 | 233.1 | 63.51 |
| Hue | 11.18 | 8.28 | 10.475 | 1.23 |
| Saturation | 223.90 | 205.13 | 175.23 | 20.04 |
| Value | 78.45 | 145.23 | 233.33 | 63.43 |
| L * | 46.08 | 90.43 | 162.00 | 47.76 |
| a * | 149.53 | 165.13 | 167.38 | 7.94 |
| b * | 150.68 | 163.40 | 174.80 | 9.85 |
Table 3.
Processing speed of monitoring with the NVIDIA GTX 2080 ti GPU.
| Inference Time | 0.16 s |
| Maturity classification time | 0.003 s |
| Total processing time | 0.18 s (FPS up to 5.5) |
Publisher’s Note: MDPI stays neutral with regard to jurisdictional claims in published maps and institutional affiliations. |
© 2021 by the authors. Licensee MDPI, Basel, Switzerland. This article is an open access article distributed under the terms and conditions of the Creative Commons Attribution (CC BY) license (https://creativecommons.org/licenses/by/4.0/).
Share and Cite
MDPI and ACS Style
Seo, D.; Cho, B.-H.; Kim, K.-C. Development of Monitoring Robot System for Tomato Fruits in Hydroponic Greenhouses. Agronomy 2021, 11, 2211. https://doi.org/10.3390/agronomy11112211
AMA Style
Seo D, Cho B-H, Kim K-C. Development of Monitoring Robot System for Tomato Fruits in Hydroponic Greenhouses. Agronomy. 2021; 11(11):2211. https://doi.org/10.3390/agronomy11112211
Chicago/Turabian StyleSeo, Dasom, Byeong-Hyo Cho, and Kyoung-Chul Kim. 2021. "Development of Monitoring Robot System for Tomato Fruits in Hydroponic Greenhouses" Agronomy 11, no. 11: 2211. https://doi.org/10.3390/agronomy11112211
Note that from the first issue of 2016, this journal uses article numbers instead of page numbers. See further details here.