Article

Agro-Morphological and Molecular Variability among Algerian Faba Bean (Vicia faba L.) Accessions

1
Laboratoire de Maîtrise d’eau en Agriculture, École Nationale Supérieure Agronomique (ENSA: ES1603), Avenue Pasteur, Hassan Badi, El Harrach 16200, Algiers, Algeria
2
Dipartimento Agraria, Università degli Studi Mediterranea di Reggio Calabria, Località Feo di Vito snc, 89122 Reggio Calabria, Italy
3
Field Crop Laboratory (LR16INRAT02), Institut National de la Recherche Agronomique de Tunisie (INRAT), University of Carthage, Rue Hédi Karray, PO Box 1004 Menzah 1, Tunis, Tunisia
4
Agricultural Applied Biotechnology Laboratory (LR16INRAT06), Institut National de la Recherche Agronomique de Tunisie (INRAT), University of Carthage Rue Hédi Karray, PO Box 1004 Menzah 1, Tunis, Tunisia
*
Authors to whom correspondence should be addressed.
Agronomy 2021, 11(8), 1456; https://doi.org/10.3390/agronomy11081456
Submission received: 29 June 2021 / Revised: 14 July 2021 / Accepted: 20 July 2021 / Published: 22 July 2021
(This article belongs to the Section Crop Breeding and Genetics)

Abstract

:
Faba bean (Vicia faba L.) Algerian accessions represent an essential source of traits of interest for crop improvement, especially for tackling climate change, because their genetic background and potential have not been well studied. The purpose of this research was to assess the genetic variability of 14 Algerian faba bean accessions by means of 10 agro-morphological traits and 7 simple sequence repeat markers (SSRs). ANOVA analysis showed a large significant phenotypic variation in fruit setting (FS), seed length (SL), seed width (SW), and 100-seeds weight (HSW), which arose as the main discriminant characters as revealed by principal component analysis (PCA). In addition, SSR analysis identified a total of twenty different alleles within our collection with a mean of 2.85 alleles per locus. The polymorphism information content (PIC) ranged from 0.32 to 0.58, with a mean of 0.44. Observed heterozygosity (Ho) ranged from 0.57 to 1.00 with a mean of 0.72, while the expected one (He) varied from 0.42 to 0.67, reaching a mean of 0.57. Based on agro-morphological as well as molecular data, the 14 accessions were not clustered according to the geographical pattern, as also confirmed by principal coordinate analysis (PCoA). Moreover, AMOVA highlighted that most of the overall genetic variation within our collection was the result of strong differentiation among accessions (84%). Finally, the Mantel test revealed that there was no substantial correlation between the molecular and agro-morphological traits (r = −0.025, p > 0.05). These findings represent a first step toward faba been breeding programs establishment in Algeria, indicating that our collection exhibited optimal agro- and molecular diversity to identify specific traits useful in Mediterranean environment.

1. Introduction

Faba bean (Vicia faba L.) is an essential winter cultivated crop. This legume originated from the Mediterranean-West Asia region [1] and attracts considerable interest due to its abundance of biomass, high yield potential, contribution to soil improvement through its ability to fix nitrogen and its seeds high protein content [2]. Faba bean is ranked among the cool season grain legumes, following peas, chickpeas, cowpeas, and lentils [3].
Faba bean production in the world reached 5.43 million tons annually from a total cultivated area of 2.57 million hectares, with China being the leading producer, with approximately 1,740,945 tons [3]. In Algeria, faba bean is the most widely grown food legume [4], the annual production of which has reached 55,272 tons from total cultivated area of 41,451 hectares [3]. Its seeds are used dry or fresh in traditional Algerian cuisine and are mainly consumed as homemade consumption and subsistence.
Faba bean (2n = 2x = 12) is a diploid grain legume and possesses the largest genome size (~13,000 Mb) among legume crops, and, partly allogamous, this species has a rate of cross-pollination ranging from 4% to 84% [5]. According to Duc et al. [6], thirty-seven germplasm collections of faba bean exist throughout the world. They contain more than 38,000 accessions and represent an essential source for multi-purpose breeding strategies.
So far, morphological characteristics have been used as classic tools, but they are compulsory for the assessment of genetic variations on local collections of faba bean in the Mediterranean region [7,8,9,10]. However, these agro-morphological traits exhibit some limitations related to their dependence on plant phenological stage and their tendency to be strongly affected by environmental factors [11]. Furthermore, the evolution of molecular markers offers more precision in the assessment of the genetic variability of faba bean germplasm, including AFLPs (Amplified Fragment Length Polymorphisms) [12], RFLPs (Restriction Fragment Length Polymorphisms) [13], RAPDs (Randomly Amplified Polymorphic DNAs) [14,15], SNPs (Single Nucleotide Polymorphisms) [16,17], ISSRs (Inter Simple Sequence Repeats) [18,19], SSRs (Simple Sequence Repeats) [20,21,22,23] and SRAPs (Sequence-Related Amplified Polymorphisms) [24]. Moreover, although microsatellite markers (SSRs) have been broadly applied in plant genetic diversity studies and breeding programs (being easy to record and highly polymorphic), few studies have focused on the evaluation of the genetic diversity of the faba bean in Algeria.
In this respect, the aim of this study was to use agro-morphological traits as well as microsatellite markers (SSRs) to assess the genetic diversity and relatedness among fourteen Vicia faba L. var. major accessions collected from different eco-geographical areas in Algeria. Finally, possessing a good knowledge of the available genetic diversity will permit not only a good management of the Algerian faba bean germplasm, but also facilitate its valorization. These results represent the starting point from which the genetic diversity of our collection was assessed, thereby making it possible to optimize new breeding strategies for planning future breeding programs to individuate specific traits useful in the Mediterranean environment.

2. Materials and Methods
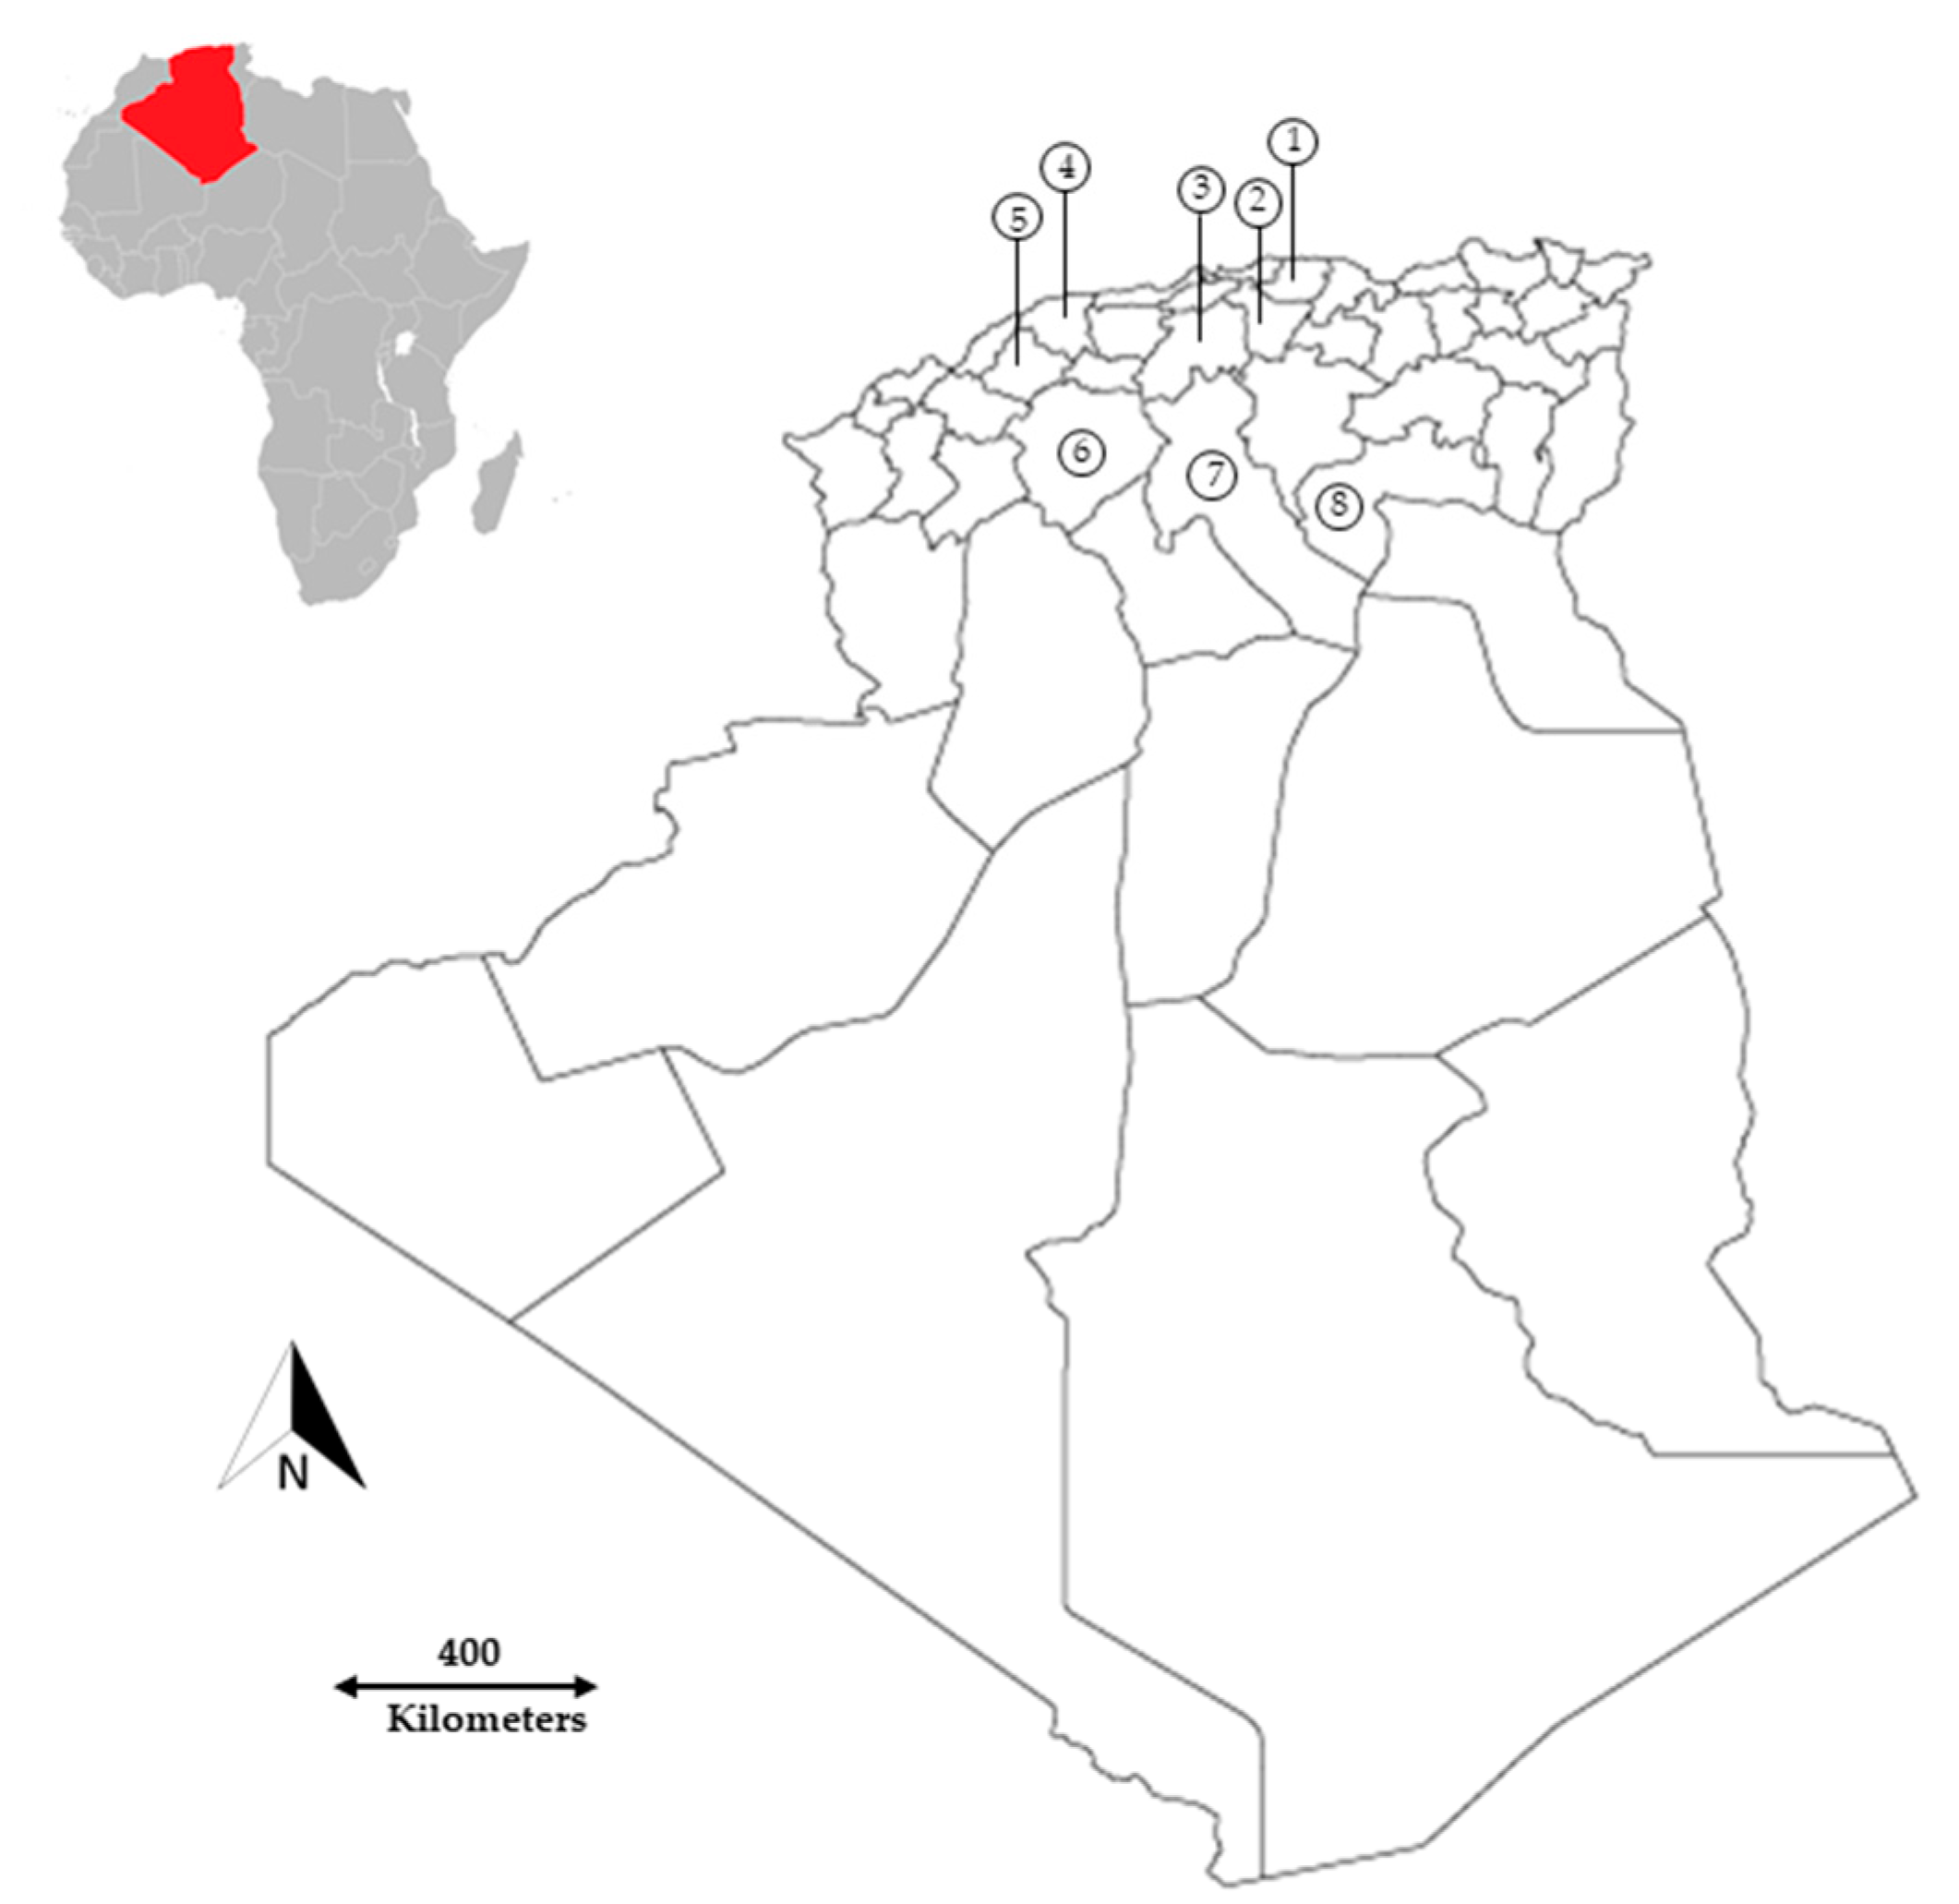
2.1. Plant Material

Fourteen (14) accessions of cultivated faba bean were collected from different eco-geographical areas across Algeria during 2013, 2014, and 2015 (Table S1). The accessions were collected in eight Algerian provinces namely: Biskra, Bouira, Chlef, Djelfa, Medea, Rhelizane, Tiaret, and Tizi ouzou (Figure 1).

2.2. Agro-Morphological Analysis

Experimental Design and Agro-Morphological Traits

A randomized complete block with three repetitions (blocks) was adopted in the present study. The trial was carried out from December 2015 to May 2016 under field conditions at the Experimental station of the National High School of Agronomy (El Harrach, Algiers) in North Algeria (36°43′09′′ N 3°09′02′′ E; 38 m of altitude). The locality is characterized by a Mediterranean climate, with rainy, damp winters and hot, dry summers. Annual rainfall ranged from 570 to 700 mm, with a maximum occurring during winter in December. The soil type is sandy loam.
Each main plot contained the 14 accessions. Each landrace was represented by a sample collected from three replicates of 10 plants per accession. Observations were recorded on 10 agro-morphological characteristics including days to 50% flowering (DF), duration from sowing to fruit setting (FS), number of flower per raceme (NF), plant height (PLH), number of pods per plant (NPPL), pod length (PL), number of seeds per pod (NSP), seed length (SL), seed width (SW) and 100-seeds weight (HSW), mainly defined by faba bean descriptors in Biodiversity international [25] and the International Union for the protection of new varieties of plants [26].

2.3. Molecular Analysis

2.3.1. DNA Extraction, Quantification, and Quality Analysis

For the DNA extraction, seeds of each accession were sown individually in pots. After two weeks, 100 mg of fresh green and healthy leaves of each accession were harvested and ground into fine powder in liquid nitrogen. The extraction of genomic DNA was performed according to Fulton et al. [27], and all DNA samples were stored at −20 °C until SSR analysis. DNA quality and quantify was estimated by electrophoresis on 1% agarose gel stained with Ethidium bromide (ETB).

2.3.2. PCR Amplification and SSR Analysis

Seven out of eleven nuclear microsatellite markers (SSR) were polymorphic and employed for genotyping the fourteen faba beans accessions as reported by Zeid et al. [28] and Pozarkova et al. [29]. Details of faba bean SSRs are reported in Table S2. Briefly, polymerase chain reaction (PCR) was performed with 20 ng of faba bean template DNA., 1× PCR buffer (25 mM Tris–HCl (pH 8.0), 100 mM KCl, 0.1 mM EDTA, 1mM DTT), 2.0 mM MgCl2, 0.2 mM of each dNTP, 0.2 μM of each primer, and 1U of Taq polymerase (Promega Corporation, Madison, WI, USA) in 25 µL final volume.
PCR reactions were conducted in a Simplyamo thermal cycler (Applied Biosytem, USA) and programmed as follows for amplification: an initial denaturation step (5 min at 94 °C), followed by 30 amplification cycles (30 s at 94 °C, 30 s at 55–58 °C depending on the primers pair and 1 min at 72 °C) and finally a step of extension (10 min at 72 °C).
PCR products were separated on a 3% agarose gel electrophoresis and visualized under UV light. In addition, 100 bp DNA step Ladder (Promega Inc., Madison, WI, USA) was employed as a molecular weight marker.

2.4. Statistical Analysis

2.4.1. Agro-Morphological Data

ANOVA analysis was performed for all measured traits to analyze variability among accessions. Means were compared using the Student–Newman–Keuls test at p < 0.05 to determine homogeneous groups using SPSS 25.0 software (IBM Corp., Armonk, NY, USA). Cluster analysis was performed using Euclidean distance and Ward’s methods using the hclust function, whereas Principal Component Analysis (PCA) was performed by using the factoextra package based on the ggplot2 package [30], both in R software v.3.4.3 [31]. Different dissimilarity matrixes in both genetic and molecular data were used to estimate the cophenetic correlation coefficient (CCC) by using MultiDendrogram software [32]. Finally, the correlation between agronomic and genetic matrices was estimated using the Mantel test with 1000 permutations, according to Aci et al. [33] using the package ade4 with the mantel.rtest function in R software v.3.4.3 [31].

2.4.2. Molecular Data

For molecular analysis by SSR markers, the allele number (Na), effective allele number (Ne), Nei’s gene diversity index (He), Shannon diversity index (I) and inbreeding coefficient (F) were determined using GenAlex software version 6.5 [34]. GDA software (http://hydrodictyon.eeb.uconn.edu/people/plewis/downloads/gda1.1.win32.zip, accessed on 12 April 2021) was used to determine the private alleles, and Cervus v. 3.0.7 software was used to estimate the polymorphic information content (PIC) for each SSR locus (Copyright Tristan Marshal, Field Genetic, Ltd., London, UK). Arlequin software (http://cmpg.unibe.ch/sofware/arlequin3, accessed on 12 April 2021) was also used to measure Fst by 9999 random permutations to assess genetic variability among and within individuals [35]. A dendrogram was created using MEGA version X [36] using the pair-wise distances matrix of Nei and Li [37] and the unweighted pair group method of the arithmetic clustering algorithm (UPGMA) [38] to identify differences among populations. Finally, Principal Coordinates Analysis (PCoA) was conducted based on Fst genetic distances by using GenAlEx6 software version 6.5 [34].

3. Results

3.1. Agro-Morphological Traits

Agro-morphological characterization was performed to compare fourteen faba bean accessions, and Table 1 summarizes the basic statistical parameters (mean, standard deviation, and coefficient of variation) associated with accession agro-morphological traits.
ANOVA revealed a non-significant block effect for all traits except for NF, while significant differences among accessions were observed for all the studied traits (p < 0.05).
The coefficient of variation values (CV%) ranged from 44.57% (NPPL) to 2.20% (FS). These values highlighted the wide phenotypic variation in the Algerian faba bean germplasm for NPPL, NF, PL, and NSP, whereas the lowest variations were observed for SW, FS, and DF.
The earliest accessions were VF A1 and VF A11, both with 79.67 days after sowing to 50% flowering, and VF A1 with 98.67 days after sowing to pod formation. By contrast, the latest were VF A9 and VF A12 (91 and 108 days after sowing to 50% flowering and fruit setting, respectively). The plant height (PLH) ranged from 68.12 (VF A15) to 90.12 cm (VF A3) with a mean of 81.36 cm (Table 1). The longest pod was observed in VF A9 (16.60 cm) and the shortest in VF A5 (10.69 cm). In addition, the mean values of seed length and width was 2.49 cm and 1.72 cm, respectively; VF A15 showed the highest value (2.95 cm and 2.04 cm, respectively) and VF A5 the lowest one (2.04 cm and 1.39 cm). The average number of pods per plant and number of seeds per pod was 11.23 and 3.66, respectively. Concerning 100 seed weight, the values ranged from 108.33 (VF A1) to 239.33 g (VF A12) (Table 1).
Principal component analysis (PCA) was applied to understand sources of variance and to group the 14 accessions according to similarity on the basis of the datasets of 10 agro-morphological traits. Total phenotypic variability among the faba bean accessions explained by the first three components was 72.76% (Table S3). In addition, the first principal component (PC1) explained 34.53% of the overall variation; they were associated positively with SF, LS, WS, and SW, and negatively with NSP; the second principal component (PC2) accounted for 22.96% of total variation, and related positively with PL, NSP, and SW, and negatively with NPPL. Furthermore, DF and PLH contributed to the PC3, which accounted for 15.27% of the overall phenotypic variation. Thus, the plot defined by the first two PCs (57.49%) was able to differentiate the faba bean accessions according to their major contributing traits (Figure 2 and Table S3).
For cluster analysis a dendrogram was generated using Euclidean distance and Ward’s method, as also confirmed by CCC (Table S4). Results indicated that the fourteen faba bean accessions clustered into 3 main groups (Figure S1). The first one included the accessions with highest PLH, lowest SW, and small seeds. The second cluster was mainly composed of highly SW and large seeds accessions with the latest setting fruit and lowest NSP. The third and last cluster enclosed the nine great stature accessions with the lowest PLH.

3.2. Molecular Characterization

In this investigation, seven out of eleven SSR markers applied to evaluate the genetic variability among the fourteen Algerian faba bean accessions exhibited amplified fragments. The lack of amplification of GATA2, SM11, P27, P28, and P139 was due to some variation in the amplification protocol (annealing temperature). The data for genetic and statistical analysis among the fourteen accessions are presented in Table 2.
The seven loci generated a total of 20 alleles with a mean of 2.85 alleles per locus. For each locus, allele numbers varied from 2 (JF1AAC2, JF1AG2) to 4 (GAII67). The polymorphism information content (PIC) for the seven SSR primers extended from 0.32 (JF1AAC2) to 0.58 (GAII67) with a mean of 0.44. Observed heterozygosity (Ho) was between 0.57 (JF1AAC2) and 1.00 (GAII67) with an average of 0.72, while the expected heterozygosity (He) average recorded a value of 0.54. The fixation index (F), which estimates the degree of allelic fixation, was 0.30 and ranged from 0.23 in GA6 to 0.56 in VFG34. Shannon’s information index ranged from 0.14 to 0.64 with a mean of 0.41 (Table 2).

3.3. Genetic Structure

Based on SSR marker data, cluster analysis was carried out using Nei and Li genetic distances and UPGMA dendrogram, as confirmed by CCC (Table S4). The fourteen accessions were classified into two large clusters with three accessions as out-groups (Figure 3). Cluster I grouped the highest number of accessions (nine) and was divided into four sub-clusters (Sb1, Sb2, Sb3, and Sb4). The sub-cluster Sb1 contained three accessions (VFA10, VFA14 and VFA9), while the sub-clusters Sb2 (VFA4, VFA5), Sb3 (VFA3, VFA15), and Sb4 (VFA11, VFA12) all included two accessions. Cluster II encompassed two accessions (VFA1 and VFA8), while the accessions VFA2, VFA13, and VFA6 were found to be out-groups (Figure 3). Moreover, the accessions were clustered based on their genetic similarity using a Principal Coordinates Analysis (PCoA). The first and second components were responsible for 44.36% of the overall variation, of which each component explained 25.76% and 18.60%, respectively. The PCoA was unable to distinguish accessions according to their geographical origin, and confirmed in this way the results observed in the cluster analysis (Figure 4).
Finally, analysis of molecular variance (AMOVA) revealed that much of the overall genetic variation was attributed to variability among landraces (84%) (Table S5), while the Mantel test showed that the agro-morphological and genetic matrices had no significant correlation (r = −0.025. p > 0.05) (Figure S2).

4. Discussion

Compared to other legume crops, faba bean production has markedly decreased due to different biotic and abiotic stresses [39], and the generation of appropriate varieties based on genetic diversity studies in order to overcome these stresses represents the main target, among a variety of strategies [40].
Knowledge about genetic diversity can be estimated by means of different methodologies using genetic markers in order to provide useful information for the development of breeding programs, such as marker-assisted selection (MAS), and the management of genetic resources [41]. It is noteworthy that for faba bean, as for all other crops, any breeding program is essentially based on local populations that include an important genetic background for specific traits.
In Algeria, the diversification of agro-ecosystems has led to the development of specific genotypes adapted to local climatic and edaphic conditions, while maintaining a high genetic diversity [42]. As expected, adopting morphological and agronomic traits for the development of gene pools is not sufficient due to either environmental effects and the stage of plant growth, or to a restricted variation [43]. Therefore, molecular markers are used as new tools for assessing the genetic diversity and evaluating germplasm in faba bean population [13] in order to overcome the above-cited limitations. Thus, in the present study, both morphological and molecular characterization were employed to highlight faba bean germplasm diversity and to determine the genetic relationships between fourteen faba bean accessions obtained from different Algerian regions.

4.1. Agromorphological Characterization

At the agro-morphological level, several studies have been carried out and published in different countries (e.g., Tunisia, Morocco, Turkey, Italy, Spain) assessing the genetic diversity of faba bean populations [7,8,9,10,44,45]. In the present study, the main goal was to define the agro-morphological potential of Algerian faba bean accessions based on quantitative characteristics. Terzopoulos et al. [7] reported that the quantitative agronomic traits are very essential in the characterization and evaluation of faba bean landraces.
The analysis of variance displayed significant differences among landraces for most agro-morphological traits, thereby suggesting a high phenotypic variation among the Algerian faba bean landraces used in the present study. This finding is consistent with the results of previous research identifying agro-morphological traits in Ethiopian, Greek, and Tunisian faba bean germplasm [9,43,46]. Our collection exhibited great variation in NPPL, NF, PL and NSP, as reported in Table 1. The morphological traits considered represent pivotal markers for improving breeding programs in faba bean. Indeed, the high variation in number of pods per plant is dependent on the genetic traits of faba bean populations, cultivation methods, and principally on pollination by insects as well as environmental conditions [47]. As reported by Singh and Jauhar [48], the number of flowers per raceme is dependent on the varietal type and geographical origin of the landraces. In particular, VFA12 was the latest accession, with the highest 100 seeds weight values. According to Yahia et al. [10], this last characteristic appears to be a pivotal marker, and it is considered to be the main trait in the classification of Vicia faba L. Furthermore, Labuda [49] states that the phenological characteristics in faba bean (flowering and pod set time) were owing to the time periods of the highest water requirement. In addition, Marcellos and Perryman [50] reported that pod set in Vicia faba L. is affected by the time at which insects first visit the open flowers. Our results provide useful information and present the first stage for faba bean breeding programs by selecting the most appropriate discrimination traits for the Algerian faba bean accessions studied.
On the basis of 10 agro-morphological characteristics of 14 Algerian faba bean populations, principal component analysis (PCA) was performed to identify clusters based on discriminate traits. Karakoy et al. [51] suggested that the use of multivariate analysis allows the estimation of the contribution of variations in different traits to the total variability in a germplasm collection. Our findings are consistent with Ammar et al. [11], who suggested that the traits included in the three first components showed a significant amount of genetic variability among the genotypes tested, and assumed their usefulness in breeding programs; among them, the number of seeds per plant, number of pods per plant, plant height and days to flowering and maturity. In addition, according to Velcheva and Petrova [52], the results from PCA could facilitate the selection of the parents to create an optimal segregating population to individuate specific QTLs.
Cluster analysis and PCA were not able to discriminate faba bean accessions on the basis of their geographic origin. Yahia et al. [10] and Rebaa et al. [53] observed similar results, reporting no relationship between the geographical origin and genetic diversity of faba bean accessions.

4.2. Molecular Characterization

As already mentioned, the agronomic and morphological traits are influenced by the environment. Accordingly, using only these traits to discriminate faba bean populations is insufficient. Indeed, several molecular markers, particularly SSR markers, are increasingly widely being used and successfully employed to characterize crop resources and assess genetic diversity. To our knowledge, there have not been any accessible studies concerning the use of molecular markers for the evaluation of the genetic variability in faba bean in Algeria, and this study could represent a starting point for future studies of the genetic diversity and breeding in Algerian faba bean germplasm.
Moreover, as reported by Qahthn et al. [40], African germplasm was characterized by the highest genetic diversity among a number of compared geographical locations. Considering that genetic diversity diminishes continuously [54], the new polymorphisms detected in our collection could provide a new genetic resource for improving faba beans [55]. Thus, in the present research, the genetic variability of 14 faba bean accessions from Algeria was assessed using SSR analysis. According to our results, and compared to previous studies, we found that the number of alleles per locus (2.85) was higher (1.45 and 1.68 respectively) compared to AFLP [56] and SSAP markers [57]. According to Abid et al. [58], our results confirmed that SSR markers are a well-adapted tool for assessing the genetic diversity of faba bean. On the other hand, our result was similar when compared to the average number of alleles (2.76) detected for 32 faba bean accessions from China and some Europen faba bean genotypes [59]. However, the average number of alleles was higher when compared to the mean number of alleles (2.30) for 29 cultivars of faba bean from Europe and China [60] and lower than that achieved by Rebaa et al. [53], who obtained a mean of 6.62 alleles per locus on 21 faba bean populations by using eight SSR markers. The variation between our results and other research in the number of alleles per locus can be attributed to differences in the diversity of the population/landraces examined, the number of landraces tested, and the primers used.
The polymorphic information content (PIC) value supplies an estimate of the discriminating power of a marker by measuring the number of alleles at a locus in consideration of the relative frequencies of these alleles [61]. The values of the PIC for all seven SSR loci varied from 0.32 (JF1AAC2) to 0.58 (GAII67), with an average of 0.44. According to the PIC value classification described by Botstein et al. [62], the primer JF1AAC2 (PIC > 0.5) was highly informative due to its high ability to detect divergence among faba bean accessions. The mean PIC values obtained (0.44) were similar to those detected by Zeid et al. [28] in a study of 6 SSRs in 11 accessions, but higher (0.29) than those revealed by Gong et al. [60] using 11 SSRs in 29 accessions from China and Europe.
For the SSR markers tested, the mean value of observed heterozygosity (Ho) was high (0.725), which could reflect the partially allogamous nature of faba bean [53,63]. The expected heterozygosity (He), or gene diversity, is generally used to indicate the genetic variation and to assess genetic divergence and population relationship [61]. The expected heterozygosity (He) values of the seven polymorphic SSR loci ranged from 0.42 (JF1AAC2) to 0.67 (GAII67), with a mean value of 0.54. In this work, the score of genetic diversity was similar to that reported by Suresh et al. [64] and Tahir et al. [15] (0.58 and 0.56, respectively), and was superior (0.33) to that revealed by Rebaa et al. [53], who studied genetic diversity in 21 faba bean landraces from Tunisia. The fixation index (F) allows estimation of the degree of allelic fixation, while comparing Ho with He, and ranged from 0.56 (VFG34) to 0.23 (GA6), with a mean value of 0.30. Lastly, Shannon’s information index (I) varied from 0.29 to 0.64, with an average of 0.41. The results show the existence of abundant genetic variability among the 14 accessions. The most polymorphic loci (VFG34 and GAII67) revealed a high level of genetic variation. Following these results, we assume that the high level of genetic variability between the tested accessions is probably due to the faba bean’s partly allogamous reproductive system, with rates of outcrossing from 10 to 70% [65]. Marzinziga et al. [66] reported that the pollinating insect species could determine the level of allogamy. Therefore, populations are highly heterogeneous, and plants are heterozygous [63].
A dendrogram was constructed to understand the genetic relationship of faba bean populations according to their geographical origin. The unweighted pair group method with arithmetic mean (UPMGA) divided the 14 faba bean accessions into five clusters; regardless of the number of clusters, the results of the Principal Coordinates Analysis of the accessions studied was in accordance with the UPMGA clustering. The dendrogram showed that the accessions originated from the same region of Algeria were not grouped in the same cluster, which indicates genetic diversity of these populations. A similar result was described in previous studies [20,53], revealing a relationship between faba bean germplasm and reporting significant genetic variability among genotypes at phenotypic as well as genetic levels, but not succeeding in grouping the accessions as per their geographical origin.
The Mantel test showed a lack of meaningful correlation between the genetic and morphological matrices (r = −0.025). This result may be due to the number and the choice of measured traits and to selection pressure, which created similar forms but with a different genetic structure [67].

5. Conclusions

Genetic diversity is essential for the creation of new varieties with interesting characteristics. In effect, the current study is a starting point toward the development of breeding and research on the genetic diversity of Algerian faba bean accessions considering the results obtained from the molecular markers and the main important agro-morphological traits. At both molecular and agro-morphological levels, high and remarkable genetic diversity was detected among the 14 accession assessed. This considerable variation will be helpful for germplasm management, classification, and preservation.
Our results showed that NPPL, NSP and PL were the traits that exhibited higher variation and should be given due consideration when performing selection in segregating generations of faba bean.
Furthermore, this study confirmed the efficiency of SSR markers as a valuable tool for faba bean diversity assessment. To our knowledge, this is the first research published on the available diversity of Algerian faba bean accessions using agro-morphological traits and SSR markers. Our results open perspectives to the selection of parental lines for faba bean improvement projects to develop new abiotic- and biotic-tolerant faba bean varieties, thereby developing farmer-preferred cultivars with desirable traits. In this respect, there is a need to plan future studies to affirm the differentiation of gene pool between our collection and other faba bean accession from different part of world.
Finally, the existence of genetic diversity in this crop could be useful to evolve and cope with current environmental change, thereby ensuring sustainability in the agricultural production system.

Supplementary Materials

The following are available online at https://www.mdpi.com/article/10.3390/agronomy11081456/s1, Table S1. List of geographic locations with bioclimatic conditions of Algerian faba bean (Vicia faba L.) accessions. Table S2. Summary of primers used for SSR studies among 14 Algerian faba bean accessions Table S3. Eigenvalues, variances and coefficients associated with the principal components. Table S4. Results of the cophenetic correlation coefficients (CCC) for comparing diversity matrices and clustering methods for agro-morphological and molecular data in Algerian faba bean. Table S5. Analysis of molecular variation (AMOVA) among and within fourteen Algerian faba bean accessions. Figure S1. Dendrogram based on Euclidean distance and Ward’s method for morphological traits of the 14 Algerian faba bean accessions. Figure S2. Mantel’s test of the morphological (A) and molecular (B) matrices obtained from 1000 permutation. (r(AB) = −0.0256, p-value = 0.83).

Author Contributions

Conceptualization, N.M. and L.H.-M.; writing—original draft, N.M.; investigation, N.M., L.H.-M., K.K. and M.R.; data curation, N.M.; N.M., L.H.-M., K.K., M.R.; Methodology, N.M.; N.M., L.H.-M., K.K., M.R.; formal analysis, M.M.A. and A.L.; writing–review and editing, M.M.A. and A.L. All authors have read and agreed to the published version of the manuscript.

Funding

This research received no external funding.

Conflicts of Interest

The authors declare no conflict of interest.

References

  1. Tanno, K.; Willcox, G. The origins of Cicer arietinum L. and Vicia faba L.: Early finds from Tell el Kerkh. north-west Syria. late 10th millennium B.P. Veg. Hist. Archaeobot. 2006, 15, 197–204. [Google Scholar] [CrossRef]
  2. O’Sullivan, D.M.; Angra, D. Advances in faba bean genetics and genomics. Front. Genet. 2016, 7, 150. [Google Scholar] [CrossRef] [Green Version]
  3. Food and Agriculture Organization Corporate Statistical Database. Available online: http://www.fao.org/food-agriculture-statistics/en/ (accessed on 2 June 2021).
  4. FAOSTAT. Production Statistics of the Food Agriculture Organization of The United States. Available online: http://www.fao.org/faostat/en/#data/QA (accessed on 3 June 2021).
  5. Hamadache, A. Grandes cultures: Principaux itinéraires techniques des principales espèces de grandes cultures pluviales cultivées en Algérie et en Afrique du Nord (agriculture conventionnelle) Légumineuses alimentaires (Pois chiche-Féves-Lentille); Tome II; Ecole Nationale Supérieure Agronomique: Alger, Algerie, 2014; pp. 1–187. [Google Scholar]
  6. Duc, G.; Bao, S.; Baum, M.; Redden, B.; Sadiki, M.; Suso, M.J.; Vishniakova, M.; Zong, X. Diversity maintenance and use of Vicia faba L. genetic resources. Field Crop. Res. 2010, 115, 270–278. [Google Scholar] [CrossRef] [Green Version]
  7. Terzopoulos, P.; Kaltsikes, P.; Bebeli, P. Collection, evaluation and classification of Greek populations of faba bean (Vicia faba L.). Genet. Resour. Crop. Evol. 2003, 50, 373–381. [Google Scholar] [CrossRef]
  8. Vörösváry, G.; Holly, L.; Strajeru, S.; Tamás, J.; Constantinovici, D.; Málnási Csizmadia, G.; Horváth, I. Studies on the varia-tion of agronomic traits in some faba bean (Vicia faba L.) landraces from Romania. Bulletin of University of Agricultural Sciences and Veterinary Medicine. Horticulture 2011, 68, 279–283. [Google Scholar]
  9. Ouji, A.; Rouaissi, M.; Abdellaoui, R.; El Gazzah, M. The use of reproductive vigor descriptors in studying genetic variability in nine Tunisian faba bean (Vicia faba L.) populations. Afr. J. Biotechnol. 2011, 10, 896–904. [Google Scholar]
  10. Yahia, Y.; Guetat, A.; Elfalleh, W.; Ferchichi, A.; Yahia, H.; Loumerm, M. Analysis of agromorphological diversity of southern Tunisia faba bean (Vicia faba L.) germplasm. Afr. J. Biotechnol. 2012, 11, 11913–11924. [Google Scholar]
  11. Ammar, M.H.; Anwar, F.; El-Harty, E.H.; Migdadi, H.M.; Abdel-Khalik, S.M.; A Alfaifi, S.; Farooq, M.; Alghamdi, S.S. Physiological and Yield Responses of Faba bean (Vicia faba L.) to Drought Stress in Managed and Open Field Environments. J. Agron. Crop. Sci. 2014, 201, 280–287. [Google Scholar] [CrossRef]
  12. Zong, X.; Liu, X.; Guan, J.; Wang, S.; Liu, Q.; Paull, J.G.; Redden, R. Molecular variation among Chinese and global winter faba bean germplasm. Theor. Appl. Genet. 2009, 118, 971–978. [Google Scholar] [CrossRef]
  13. Torres, A.M.; Weeden, N.F.; Martín, A. Linkage among isozyme, RFLP and RAPD markers in Vicia faba. Theor. Appl. Genet. 1993, 85, 937–945. [Google Scholar] [CrossRef]
  14. Link, W.; Dixkens, C.; Singh, M.; Schwall, M. Genetic diversity in European and Mediterranean faba bean germplasm revealed by RAPD markers. Theor. Appl. Genet. 1995, 90, 27–32. [Google Scholar] [CrossRef]
  15. Tahir, N.A. Identification of Genetic Variation in Some Faba Bean (Vicia faba L.) Genotypes Grown in Iraq Estimated with RAPD and SDS-PAGE of Seed Proteins. Indian J. Biotechnol. 2015, 14, 351–356. [Google Scholar]
  16. Kaur, S.; Kimber, R.B.; Cogan, N.O.; Materne, M.; Forster, J.W.; Paull, J.G. SNP discovery and high-density genetic mapping in faba bean (Vicia faba L.) permits identification of QTLs for ascochyta blight resistance. Plant Sci. 2014, 217-218, 47–55. [Google Scholar] [CrossRef] [PubMed]
  17. Mulugeta, B.; Tesfaye, K.; Keneni, G.; Ahmed, S. Genetic diversity in spring faba bean (Vicia faba L.) genotypes as revealed by high-throughput KASP SNP markers. Genet. Resour. Crop. Evol. 2021, 68, 1971–1986. [Google Scholar] [CrossRef]
  18. Alghamdi, S.S.; Al-Faifi, S.A.; Migdadi, H.M.; Ammar, M.H.; Siddique, K. Inter-simple sequence repeat (ISSR)-based diversity assessment among faba bean genotypes. Crop. Pasture Sci. 2011, 62, 755–760. [Google Scholar] [CrossRef]
  19. Wang, H.-F.; Zong, X.-X.; Guan, J.-P.; Yang, T.; Sun, X.-L.; Ma, Y.; Redden, R. Genetic diversity and relationship of global faba bean (Vicia faba L.) germplasm revealed by ISSR markers. Theor. Appl. Genet. 2011, 124, 789–797. [Google Scholar] [CrossRef] [PubMed]
  20. Yang, T.; Bao, S.-Y.; Ford, R.; Jia, T.-J.; Guan, J.-P.; He, Y.-H.; Sun, X.-L.; Jiang, J.-Y.; Hao, J.-J.; Zhang, X.-Y.; et al. High-throughput novel microsatellite marker of faba bean via next generation sequencing. BMC Genom. 2012, 13, 602. [Google Scholar] [CrossRef] [Green Version]
  21. Yahia, Y.; Hannachi, H.; Monforte, A.J.; Cockram, J.; Loumerem, M.; Zarouri, B.; Ferchichi, A. Genetic diversity in Vicia faba L. populations cultivated in Tunisia revealed by simple sequence repeat analysis. Plant Genet. Resour. 2014, 12, 278–285. [Google Scholar] [CrossRef]
  22. El-Esawi, M.A. SSR analysis of genetic diversity and structure of the germplasm of faba bean (Vicia faba L.). Comptes Rendus Biol. 2017, 340, 474–480. [Google Scholar] [CrossRef]
  23. Babay, E.; Khamassi, K.H.; Sabetta, W.; Miazzi, M.M.; Montemurro, C.; Pignone, D.; Danzi, D.; Finetti-Sialer, M.M.; Mangini, G. Serendipitous in Situ Conservation of Faba Bean Landraces in Tunisia: A Case Study. Genes 2020, 11, 236. [Google Scholar] [CrossRef] [Green Version]
  24. Alghamdi, S.S.; Al-Faifi, S.A.; Migdadi, H.M.; Khan, M.A.; El-Harty, E.H.; Ammar, M.H. Molecular Diversity Assessment Using Sequence Related Amplified Polymorphism (SRAP) Markers in Vicia faba L. Int. J. Mol. Sci. 2012, 13, 16457–16471. [Google Scholar] [CrossRef]
  25. International Board for Plant Genetic Resources. Faba Bean Descriptors; IBPGR: Rome, Italy, 1985; p. 31. [Google Scholar]
  26. Union for The Protection of New Varieties of Plants. Broad Bean (Vicia Faba var Major Harz); UPOV: Bern, Switzerland, 2003; p. 29. [Google Scholar]
  27. Fulton, T.M.; Chunwongse, J.; Tanksley, S.D. Microprep protocol for extraction of DNA from tomato and other herbaceous plants. Plant Mol. Biol. Rep. 1995, 13, 207–209. [Google Scholar] [CrossRef]
  28. Zeid, M.; Mitchell, S.; Link, W.; Carter, M.; Nawar, A.; Fulton, T.; Kresovich, S. Simple sequence repeats (SSRs) in faba bean: New loci fromOrobanche-resistant cultivar ‘Giza 402’. Plant Breed. 2009, 128, 149–155. [Google Scholar] [CrossRef]
  29. Požárková, D.; Koblížková, A.; Román, B.; Torres, A.; Lucretti, S.; Lysák, M.; Dolezel, J.; Macas, J. Development and Characterization of Microsatellite Markers from Chromosome 1-Specific DNA Libraries of Vicia Faba. Biol. Plant. 2002, 45, 337–345. [Google Scholar] [CrossRef]
  30. Wickham, H. Ggplot2: Elegant Graphics for Data Analysis, 2nd ed.; Springer: Berlin/Heidelberg, Germany, 2009. [Google Scholar]
  31. R Core Team. R: A Language and Environment for Statistical Computing; R Foundation for Statistical Computing: Vienna, Austria, 2020; Available online: https://www.R-project.org/ (accessed on 5 March 2021).
  32. Fernández, A.; Gómez, S. Solving Non-Uniqueness in Agglomerative Hierarchical Clustering Using Multidendrograms. J. Classif. 2008, 25, 43–65. [Google Scholar] [CrossRef] [Green Version]
  33. Aci, M.M.; Lupini, A.; Badagliacca, G.; Mauceri, A.; Lo Presti, E.; Preiti, G. Genetic diversity among Lathyrus spp. based on agronomic and molecular markers. Agronomy 2020, 10, 1182. [Google Scholar] [CrossRef]
  34. Peakall, R.; Smouse, P.E. genalex 6: Genetic analysis in Excel. Population genetic software for teaching and research. Mol. Ecol. Notes 2006, 6, 288–295. [Google Scholar] [CrossRef]
  35. Excoffier, L.L.; Smouse, P.E.; Quattro, J.M. Analysis of molecular variance inferred from metric distances among DNA haplo-types: Application to human mitochondrial DNA restriction data. Genetics 1992, 131, 479–491. [Google Scholar] [CrossRef] [PubMed]
  36. Kumar, S.; Stecher, G.; Li, M.; Knyaz, C.; Tamura, K.; Battistuzzi, F.U. MEGA X: Molecular Evolutionary Genetics Analysis across Computing Platforms. Mol. Biol. Evol. 2018, 35, 1547–1549. [Google Scholar] [CrossRef] [PubMed]
  37. Nei, M.; Li., W. Mathematical model for studying genetic variation in terms of restriction endonucleases. Proc. Natl. Acad. Sci. USA 1979, 76, 5269–5273. [Google Scholar] [CrossRef] [PubMed] [Green Version]
  38. Sneath, P.H.A.; Sokal, R.R. Numerical Taxonomy—The Principles and Practice of Numerical Classification; W.H. Freeman: San Francisco, CA, USA, 1973. [Google Scholar]
  39. Maalouf, F.; Hu, J.; O’Sullivan, D.M.; Zong, X.; Hamwieh, A.; Kumar, S.; Baum, M. Breeding and genomics status in faba bean (Vicia faba). Plant Breed. 2018, 138, 465–473. [Google Scholar] [CrossRef] [Green Version]
  40. Qahtan, A.A.; Al-Atar, A.; Abdel-Salam, E.M.; El-Sheikh, M.A.; Gaafar, A.-R.Z.; Faisal, M. Genetic diversity and structure analysis of a worldwide collection of faba bean (Vicia faba) genotypes using ISSR markers. Int. J. Agric. Biol. 2021, 25, 683–691. [Google Scholar]
  41. Ouji, A.; El-Bok, S.; Rouaissi, M.; Syed, N.H.; Suso, M.J.; Flavell., A.J.; El Gazzah., M.; Ben Younes., M.; Kharrat, M. Genetic diversity of faba bean (Vicia faba L.) Populations estimated by isozymic and molecular markers: Relationship between the two methods. Eur. Sci. J. 2015, 11, 392–401. [Google Scholar]
  42. Sadiki, M.; Amri, A.; Birouk, A.; Bounejmate, M. Les ressources phytogénétiques des plantes cultivées au Maroc. In Etude de Faisabilité du Projet FEM/PNUD/FAO sur la Conservation et la Valorisation des Ressources Génétiques des Plantes au Maghreb; Ministère de l’Environnement: Rabat, Maroc, 1995. [Google Scholar]
  43. Terzopoulos, P.; Bebeli, P. Genetic diversity analysis of Mediterranean faba bean (Vicia faba L.) with ISSR markers. Field Crop. Res. 2008, 108, 39–44. [Google Scholar] [CrossRef]
  44. Perrino, P.; Robertson, L.D.; Silh, M.B. Maintenance. evaluation and use of faba bean germplasm collections: Problems and prospects. CIHEAM Options Méditerranéenne 1991, 110, 21–31. [Google Scholar]
  45. Polignano, G.B.; Alba, E.; Uggenti, P.; Scippa, G. Geographical Patterns of Variation in Bari Faba Bean Germplasm Collection. Genet. Resour. Crop. Evol. 1999, 46, 183–192. [Google Scholar] [CrossRef]
  46. Keneni, G.; Jarso, M.; Wolabu, T.; Dino, G. Extent and Pattern of Genetic Diversity for Morpho-agronomic Traits in Ethiopian Highland Pulse Landraces II. Faba Bean (Vicia faba L.). Genet. Resour. Crop. Evol. 2005, 52, 551–561. [Google Scholar] [CrossRef]
  47. Labuda, H. Flowering and pod setting of faba bean (Vicia faba L. var. major Harz) depending on nitrogen fertilization. Ann. UMCS Sect. EEE 2002, 10, 235–240. [Google Scholar]
  48. Singh, R.J.; Jauhar, P.P. Genetic Resources, Chromosome Engineering and Crop Improvement, 1st ed.; CRC Press: Boca Raton, FL, USA, 2005; pp. 204–228. [Google Scholar]
  49. Łabuda, H. Flowering and characteristics of useful traits of some faba bean (Vicia faba L. var. major Harz) cultivars and breeding lines. Acta Agrobot. 2012, 65, 139–148. [Google Scholar] [CrossRef]
  50. Marcellos, H.; Perryman, T. Pollination and fertilization in crops of Vicia faba. Aust. J. Agric. Res. 1988, 39, 579–587. [Google Scholar] [CrossRef]
  51. Karaköy, T.; Baloch, F.S.; Toklu, F.; Özkan, H. Variation for selected morphological and quality-related traits among 178 faba bean landraces collected from Turkey. Plant Genet. Resour. 2013, 12, 5–13. [Google Scholar] [CrossRef]
  52. Velcheva, N.; Petrova, S. Statistical analysis of genetic diversity using faba bean landraces database. Agric. Sci. Technol. 2020, 12, 211–215. [Google Scholar] [CrossRef]
  53. Rebaa, F.; Abid, G.; Aouida, M.; Abdelkarim, S.; Aroua, I.; Muhovski, Y.; Baudoin, J.-P.; M’Hamdi, M.; Sassi, K.; Jebara, M. Genetic variability in Tunisian populations of faba bean (Vicia faba L. var. major) assessed by morphological and SSR markers. Physiol. Mol. Biol. Plants 2017, 23, 397–409. [Google Scholar] [CrossRef] [PubMed] [Green Version]
  54. Louwaars, N.P. Plant breeding and diversity: A troubled relationship? Euphytica 2018, 214, 114. [Google Scholar] [CrossRef] [PubMed] [Green Version]
  55. Nurmansyah; Alghamdi, S.S.; Migdadi, H.M.; Khan, M.A.; Afzal, M. AFLP-based analysis of variation and population structure in mutagenesis induced faba bean. Diversity 2020, 12, 303. [Google Scholar] [CrossRef]
  56. Liu, Y.; Hou, W. Genetic Diversity of Faba Bean Germplasms in Qinghai and Core Germplasm Identified based on AFLP Analysis. Legum. Genom. Genet. 2010, 1. [Google Scholar] [CrossRef]
  57. Ouji, A.; El Bok, S.; Syed, N.H.; Abdellaoui, R.; Rouaissi, M.; Flavell, A.J.; El Gazzah, M. Genetic diversity of faba bean (Vicia faba L.) populations revealed by sequence specific amplified polymorphism (SSAP) markers. Afr. J. Biotechnol. 2012, 11, 2162–2168. [Google Scholar]
  58. Abid, G.; Mingeot, D.; Udupa, S.M.; Muhovski, Y.; Watillon, B.; Sassi, K.; M’hamdi, M.; Souissi, F.; Mannai, K.; Barhoumi, F.; et al. Genetic relationship and diversity analysis of Faba Bean (Vicia Faba L. var. minor) genetic resources using morpho-logical and microsatellite molecular markers. Plant Mol. Biol. 2015, 33, 1755–1767. [Google Scholar] [CrossRef]
  59. Ma, Y.; Yang, T.; Guan, J.; Wang, S.; Wang, H.; Sun, X.; Zong, X. Development and characterization of 21 EST-derived mi-crosatellite markers in Vicia faba (faba bean). Am. J. Bot. 2011, 98, 22–24. [Google Scholar] [CrossRef]
  60. Gong, Y.-M.; Xu, S.-C.; Mao, W.-H.; Li, Z.-Y.; Hu, Q.-Z.; Zhang, G.-W.; Ding, J. Genetic Diversity Analysis of Faba Bean (Vicia faba L.) Based on EST-SSR Markers. Agric. Sci. China 2011, 10, 838–844. [Google Scholar] [CrossRef]
  61. Tekalign, A.; Derera, J.; Sibiya, J.; Mumm, R.H. Molecular analysis for genetic diversity and population structure of Ethiopian faba bean (Vicia faba L) accessions. Plant Biol. Crop Res. 2019, 1, 1–10. [Google Scholar]
  62. Botstein, D.; White, R.L.; Skolnick, M.; Davis, R.W. Construction of a genetic linkage map in man using restriction fragment length polymorphisms. Am. J. Hum. Genet. 1980, 32, 314–331. [Google Scholar]
  63. Gnanasambandam, A.; Paull, J.; Torres, A.; Kaur, S.; Leonforte, T.; Li, H.; Zong, X.; Yang, T.; Materne, M. Impact of Molecular Technologies on Faba Bean (Vicia faba L.) Breeding Strategies. Agronomy 2012, 2, 132–166. [Google Scholar] [CrossRef] [Green Version]
  64. Suresh, S.; Park, J.H.; Cho, G.T.; Lee, H.S.; Baek, H.J.; Lee, S.Y.; Chung, J.W. Development and molecular characterization of 55 novel polymorphic cDNA-SSR markers in faba bean (Vicia faba L.) using 454 pyrosequencing. Molecules 2013, 18, 1844–1856. [Google Scholar] [CrossRef] [PubMed] [Green Version]
  65. Alemayehu, N.; Keneni, G. Genetic consequences of failure to control outcrossing in breeding often cross-pollinated pulse and oil crops in Ethiopia. Ethiop. J. Crop Sci. 2020, 7, 1–29. [Google Scholar]
  66. Marzinziga, B.; Brünjesb, L.; Biagionic, S.; Behlingc, H.; Linkb, W.; Westphal, C. Bee pollinators of faba bean (Vicia faba L.) differ in their foraging behaviour and pollination efficiency. Agr. Ecosyst. Environ. 2018, 264, 24–33. [Google Scholar] [CrossRef]
  67. Corrado, G.; La Mura, M.; Ambrosino, O.; Pugliano, G.; Varricchio, P.; Rao, R. Relationships of Campanian olive cultivars: Comparative analysis of molecular and phenotypic data. Genome 2009, 52, 692–700. [Google Scholar] [CrossRef] [PubMed] [Green Version]
Figure 1. Map of Algeria emphasizing, in red color, the geographical positions of faba bean collection sites; 1, Tizi ouzou; 2, Bouira; 3, Medea; 4, Chlef; 5, Rhelizane; 6, Tiaret; 7, Djelfa; 8, Biskra.
Agronomy 11 01456 g001
Figure 2. Principal component analysis (PCA) of fourteen Algerian faba bean accessions based on agro-morphological traits; DF, days to 50% flowering; FS, duration from sowing to fruit setting; NF, number of flowers per raceme; PLH, plant height; NPPL, number of pods per plant; PL, length of the pod; NSP, number of seeds per pod; SL, seed length; SW, seed width; HSW, 100-seeds weight.
Agronomy 11 01456 g002
Figure 3. Unweighted pair-group method of arithmetic averages (UPGMA) dendrogram of the 14 Algerian Faba bean accessions based on SSR data (●, Cluster I-Sb1; , Cluster I-Sb2; , Cluster I-Sb3; , Cluster I-Sb4; ■, Cluster II; ▲, outgroups).
Agronomy 11 01456 g003
Figure 4. Principal coordinate analysis (PCoA) based on seven SSR data points of the 14 Algerian faba bean accessions.
Agronomy 11 01456 g004
Table 1. Summary statistics of 10 agro-morphologic traits measured in 14 Algerian faba bean accessions.
AccessionsDFFSNFPLHNPPLPLNSPSLSWHSW
VF A179.67±1.15 a98.67±1.15 a4.33±0.90 bcd72.85±8.51 ab 6.87±1.94 a15.93±2.07 de4.83±0.99 g2.14±0.12 ab1.46±0.12 b108.33±1.53 a
VF A282.33±2.31 abc102.67±2.31 ab4.60±0.63 cde82.79±8.06 cdef8.14±2.95 ab16.14±2.81 de5.00±0.83 g2.21±0.20 b1.59±0.20 cd171.67±7.64 d
VF A385.33±1.15 c107.67±1.15 c4.47±0.83 bcd90.12±7.20 g16.84±4.55 de13.30±1.83 c3.13±0.43 bc2.86±0.17 f1.95±0.17 i236.33±3.21 h
VF A480.33±1.15 a99.33±1.15 a4.20±0.77 abc86.58±13.76 efg6.50±2.52 a16.75±3.17 e4.23±1.14 f2.63±0.24 e1.94±0.24 i185.67±9.02 e
VF A581.67±1.53 abc101.67±1.53 ab5.07±0.96 ef82.27±11.43 cde17.79±4.12 e10.69±1.31 a2.93±0.69 ab2.04±0.16 a1.39±0.16 a128.00±4.00 b
VF A683.67±2.52 abc102.00±2.52 ab4.40±0.83 bcd88.53±14.18 fg15.69±9.56 cde10.91±0.84 a3.33±0.84 bc2.14±0.11 ab1.54±0.11 c152.33±8.74 c
VF A880.33±1.15 a100.00±1.15 a4.80±0.68 def83.93±9.14 def6.97±2.34 a15.58±2.03 d4.23±0.97 f2.44±0.20 cd1.74±0.20 gh193.33±6.66 ef
VF A991.00±2.65 d107.33±2.65 c3.73±0.80 a80.60±9.54 cde14.45±13.77 bcde16.60±3.51 de4.17±0.83 ef2.43±0.15 cd1.67±0.15 efg186.67±3.51 e
VF A1081.33±2.52 abc101.67±2.52 ab4.20±0.77 abc77.63±11.89 bc6.63±1.37 a15.75±2.41 de3.77±1.04 de2.50±0.21 d1.65±0.21 def202.67±5.86 f
VF A1179.67±1.15 a101.33±1.15 ab3.93±0.80 ab85.35±11.85 efg12.64±6.61 abcd11.49±1.66 ab3.00±0.69 ab2.64±0.29 e1.70±0.29 fg215.00±5.00 g
VF A1282.67±1.53 abc108.00±1.53 c4.60±0.74 cde78.65±7.81 bcd7.77±4.41 ab12.50±1.14 bc3.53±0.68 cd2.88±0.27 f1.90±0.27 i239.33±14.47 h
VF A1381.00±2.00 ab107.67± 2.00 c 4.73±0.70 cdef78.36±8.93 bcd10.44±5.58 abcd11.32±1.87 a3.27±0.83 bc2.38±0.21 c1.61±0.21 cde138.00±3.00 b
VF A1485.00±6.00 bc102.33±6.00 ab5.20±1.32 f83.37±9.01 cdef8.92±3.28 abc12.90±2.37 c3.27±1.11 bc2.66±0.26 e1.79±0.26 h193.67±3.51 ef
VF A1581.33±2.52 abc105.00±2.52 bc4.20±0.77 abc68.12±12.28 a17.51±7.61 e10.84±0.56 a2.60±0.50 a2.95±0.21 f2.13±0.21 i185.33±1.53 e
Means82.52103.244.4681.3611.2313.623.662.491.72181.17
SD±2.10±2.27±0.82±11.49±5.04±3.12±1.09±0.35±0.25±5.55
CV%2.54%2.20%18.45%14.13%44.57%22.88%29.89%13.95%14.39%3.14%
Significance*****************************
DF, days to 50% flowering (days); FS, duration from sowing to fruit setting (days); NF, number of flowers per raceme (#); PLH, plant height (cm); NPPL, number of pods per plant (#); PL, pod length (cm); NSP, number of seeds per pod (#); SL, seed length (cm); SW, seed width (cm); HSW; 100-seeds weight (g). Different letters along column indicate significant differences at p < 0.05. ** = 0.001 < p < 0.01; *** = p < 0.001. The value in bold within each parameter indicate max and minimum.
Table 2. Data summary for 7 microsatellite markers across the 14 Algerian faba bean accessions.
NaNeHoHeIFstPIC
JF1AAC221.570.570.420.39−0.350.32
JF1AG331.420.810.600.44−0.360.48
JF1AG221.070.660.470.29−0.420.34
VFG3431.920.920.590.64−0.560.49
GA631.710.710.580.49−0.230.46
GAII6741.421.000.670.49−0.470.58
GATA1130.780.370.490.140.240.39
Total20
Mean2.851.410.720.540.41−0.300.442
Na, number of alleles; Ne, number of effective alleles; observed (Ho) and expected heterozygosity (He); I, Shannon’s information index; Fst, genetic differentiation; PIC, polymorphic information content.
Publisher’s Note: MDPI stays neutral with regard to jurisdictional claims in published maps and institutional affiliations.

