
Soil Properties Prediction for Precision Agriculture Using Visible and Near-Infrared Spectroscopy: A Systematic Review and Meta-Analysis


Abstract
:1. Introduction
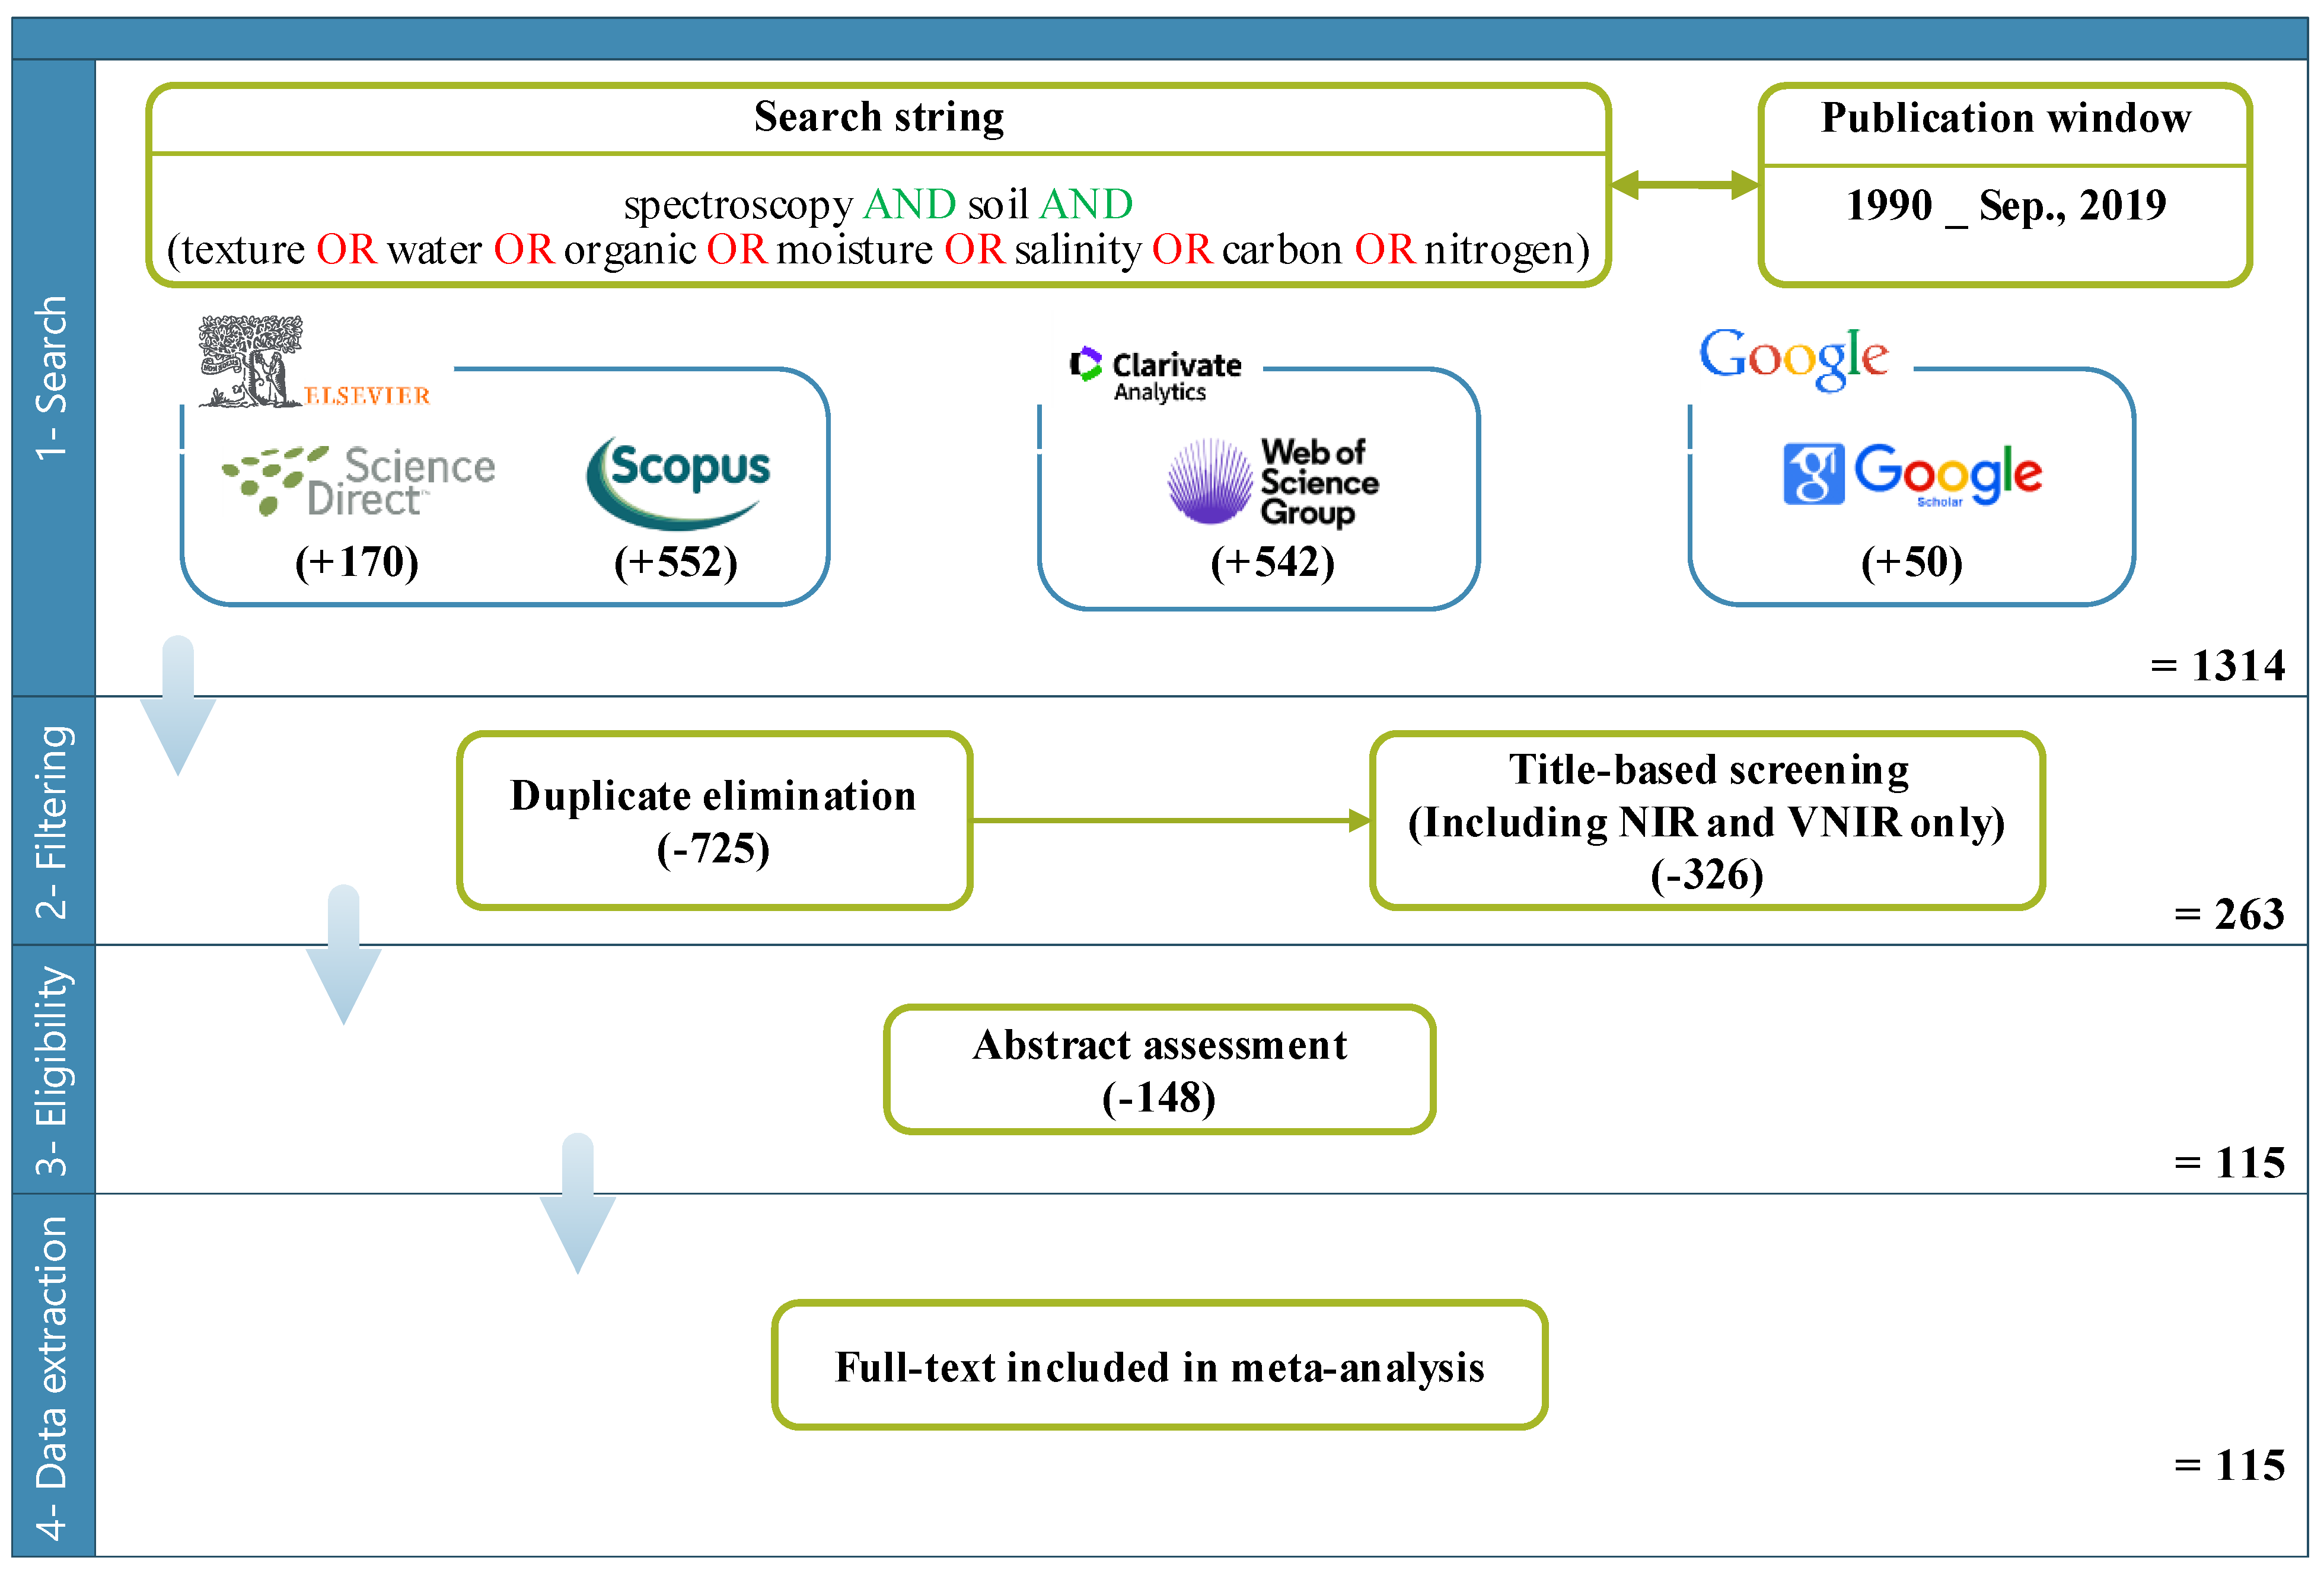
2. Methodology
3. Results and Discussion
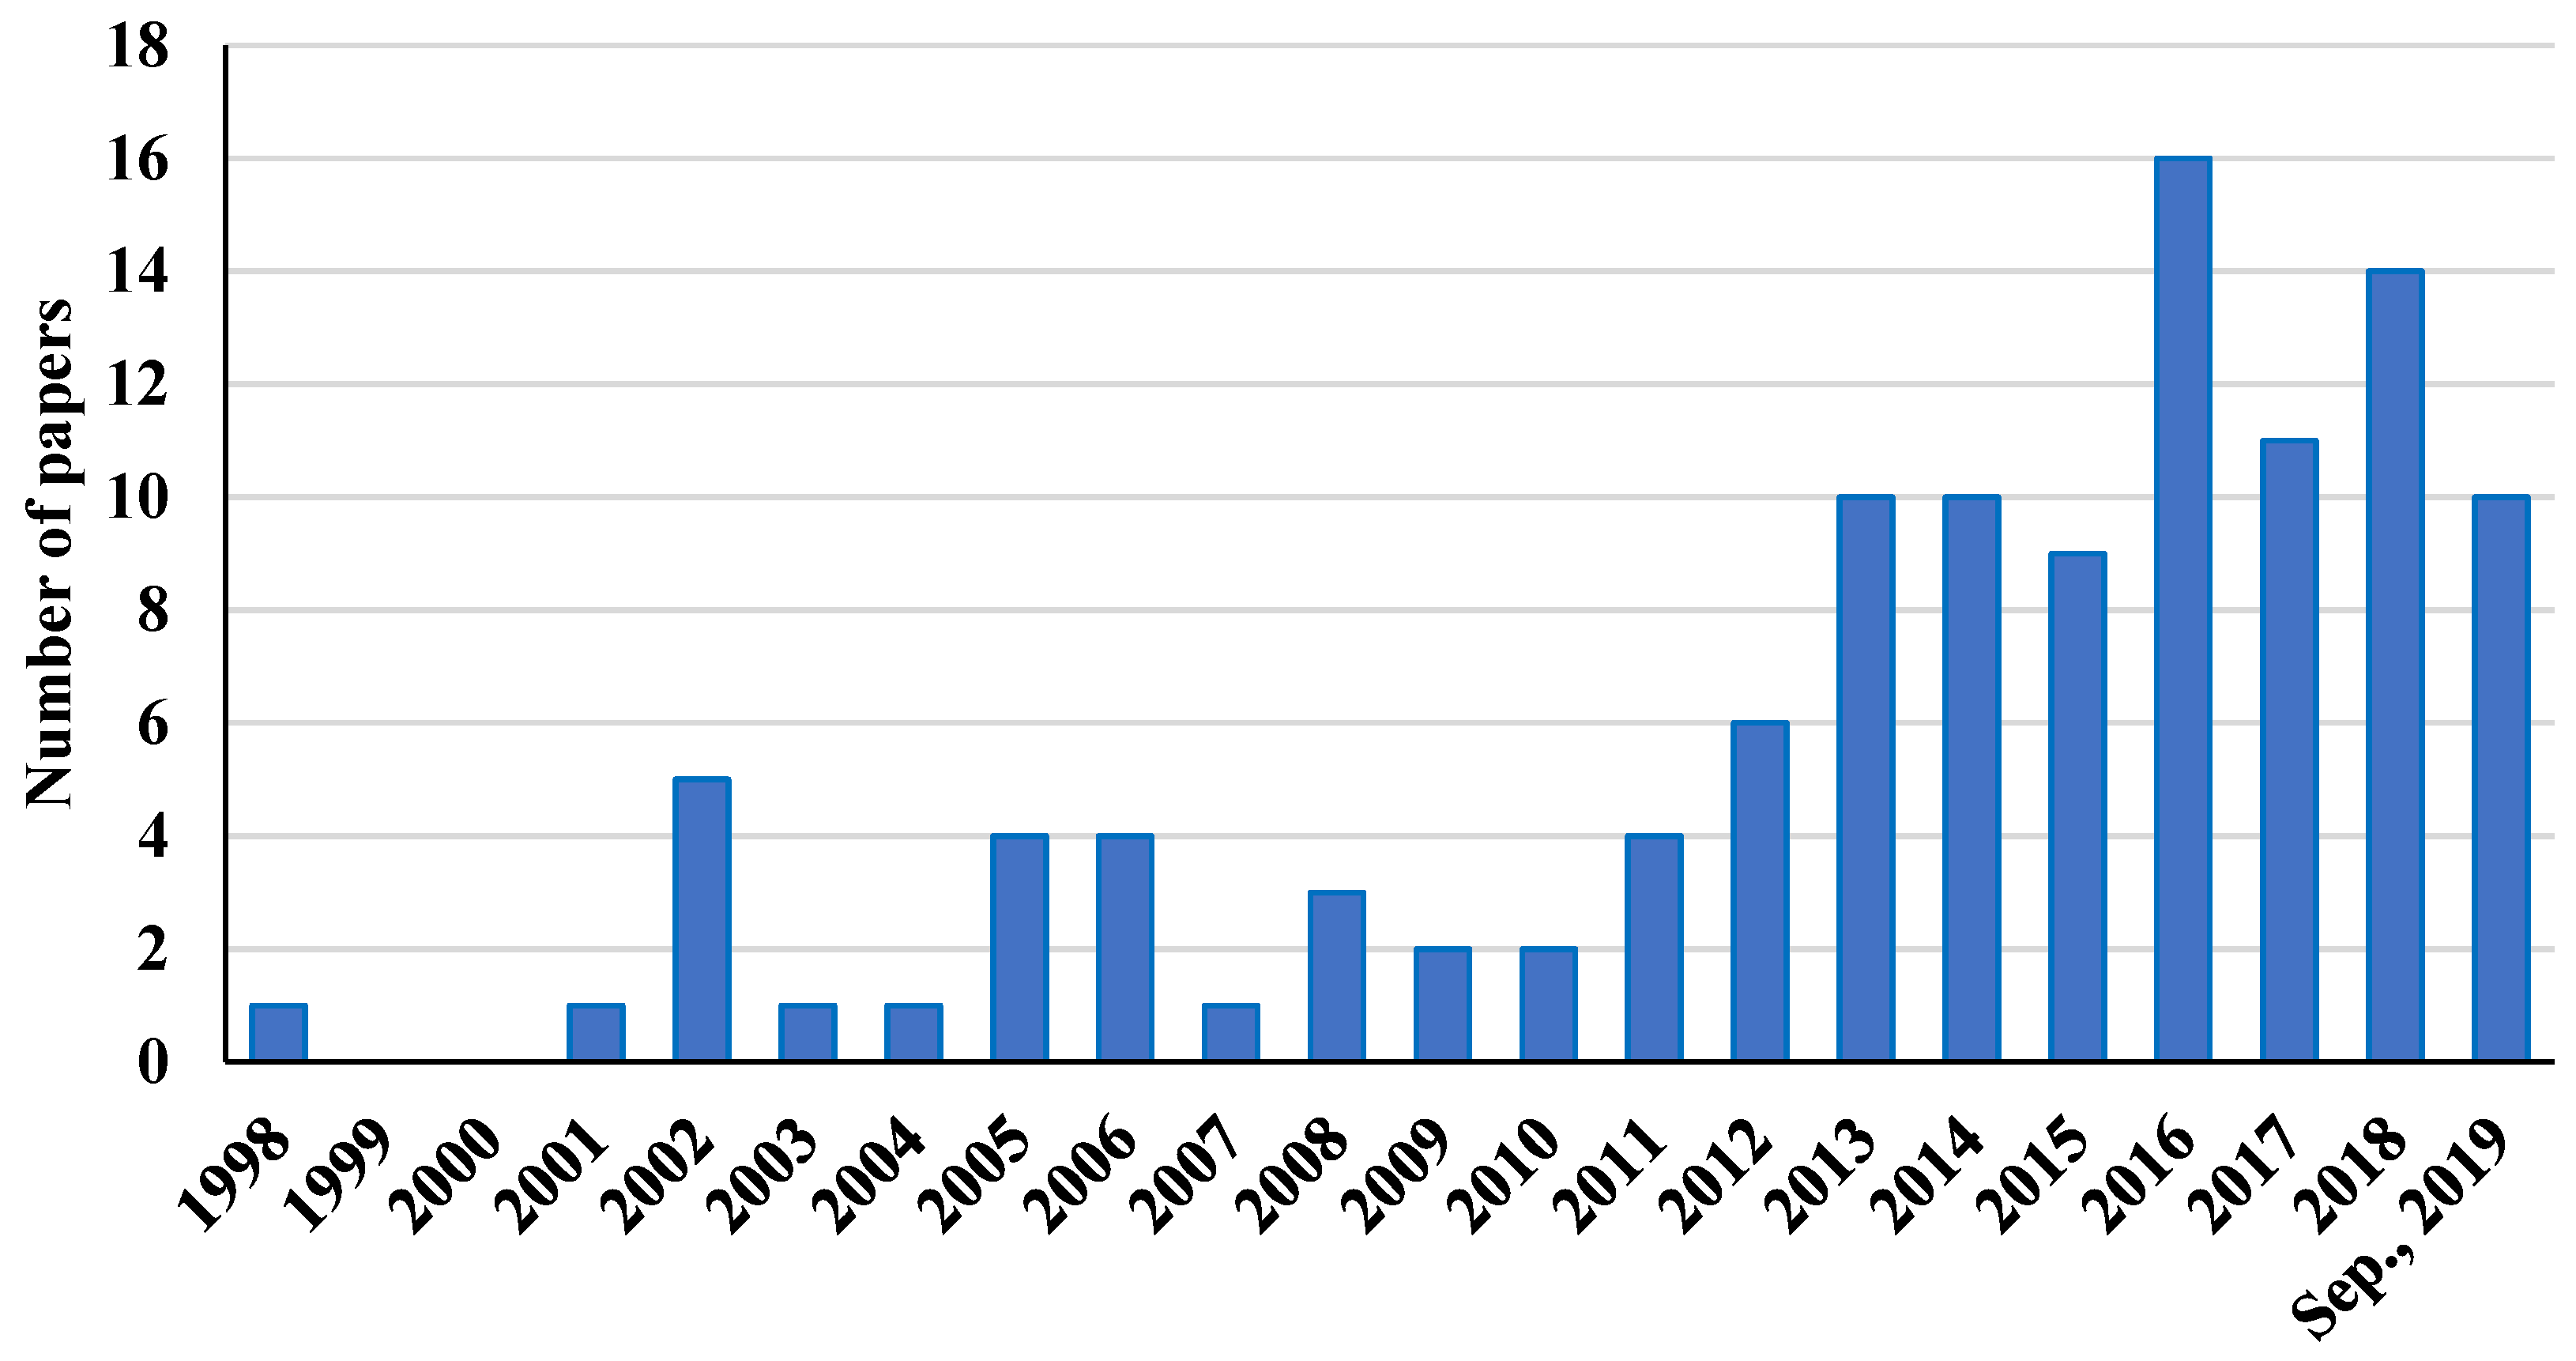
3.1. Number of Relevant Papers
3.2. Instrumentation
3.3. Soil Samples Preparation
3.4. Preprocessing Methods
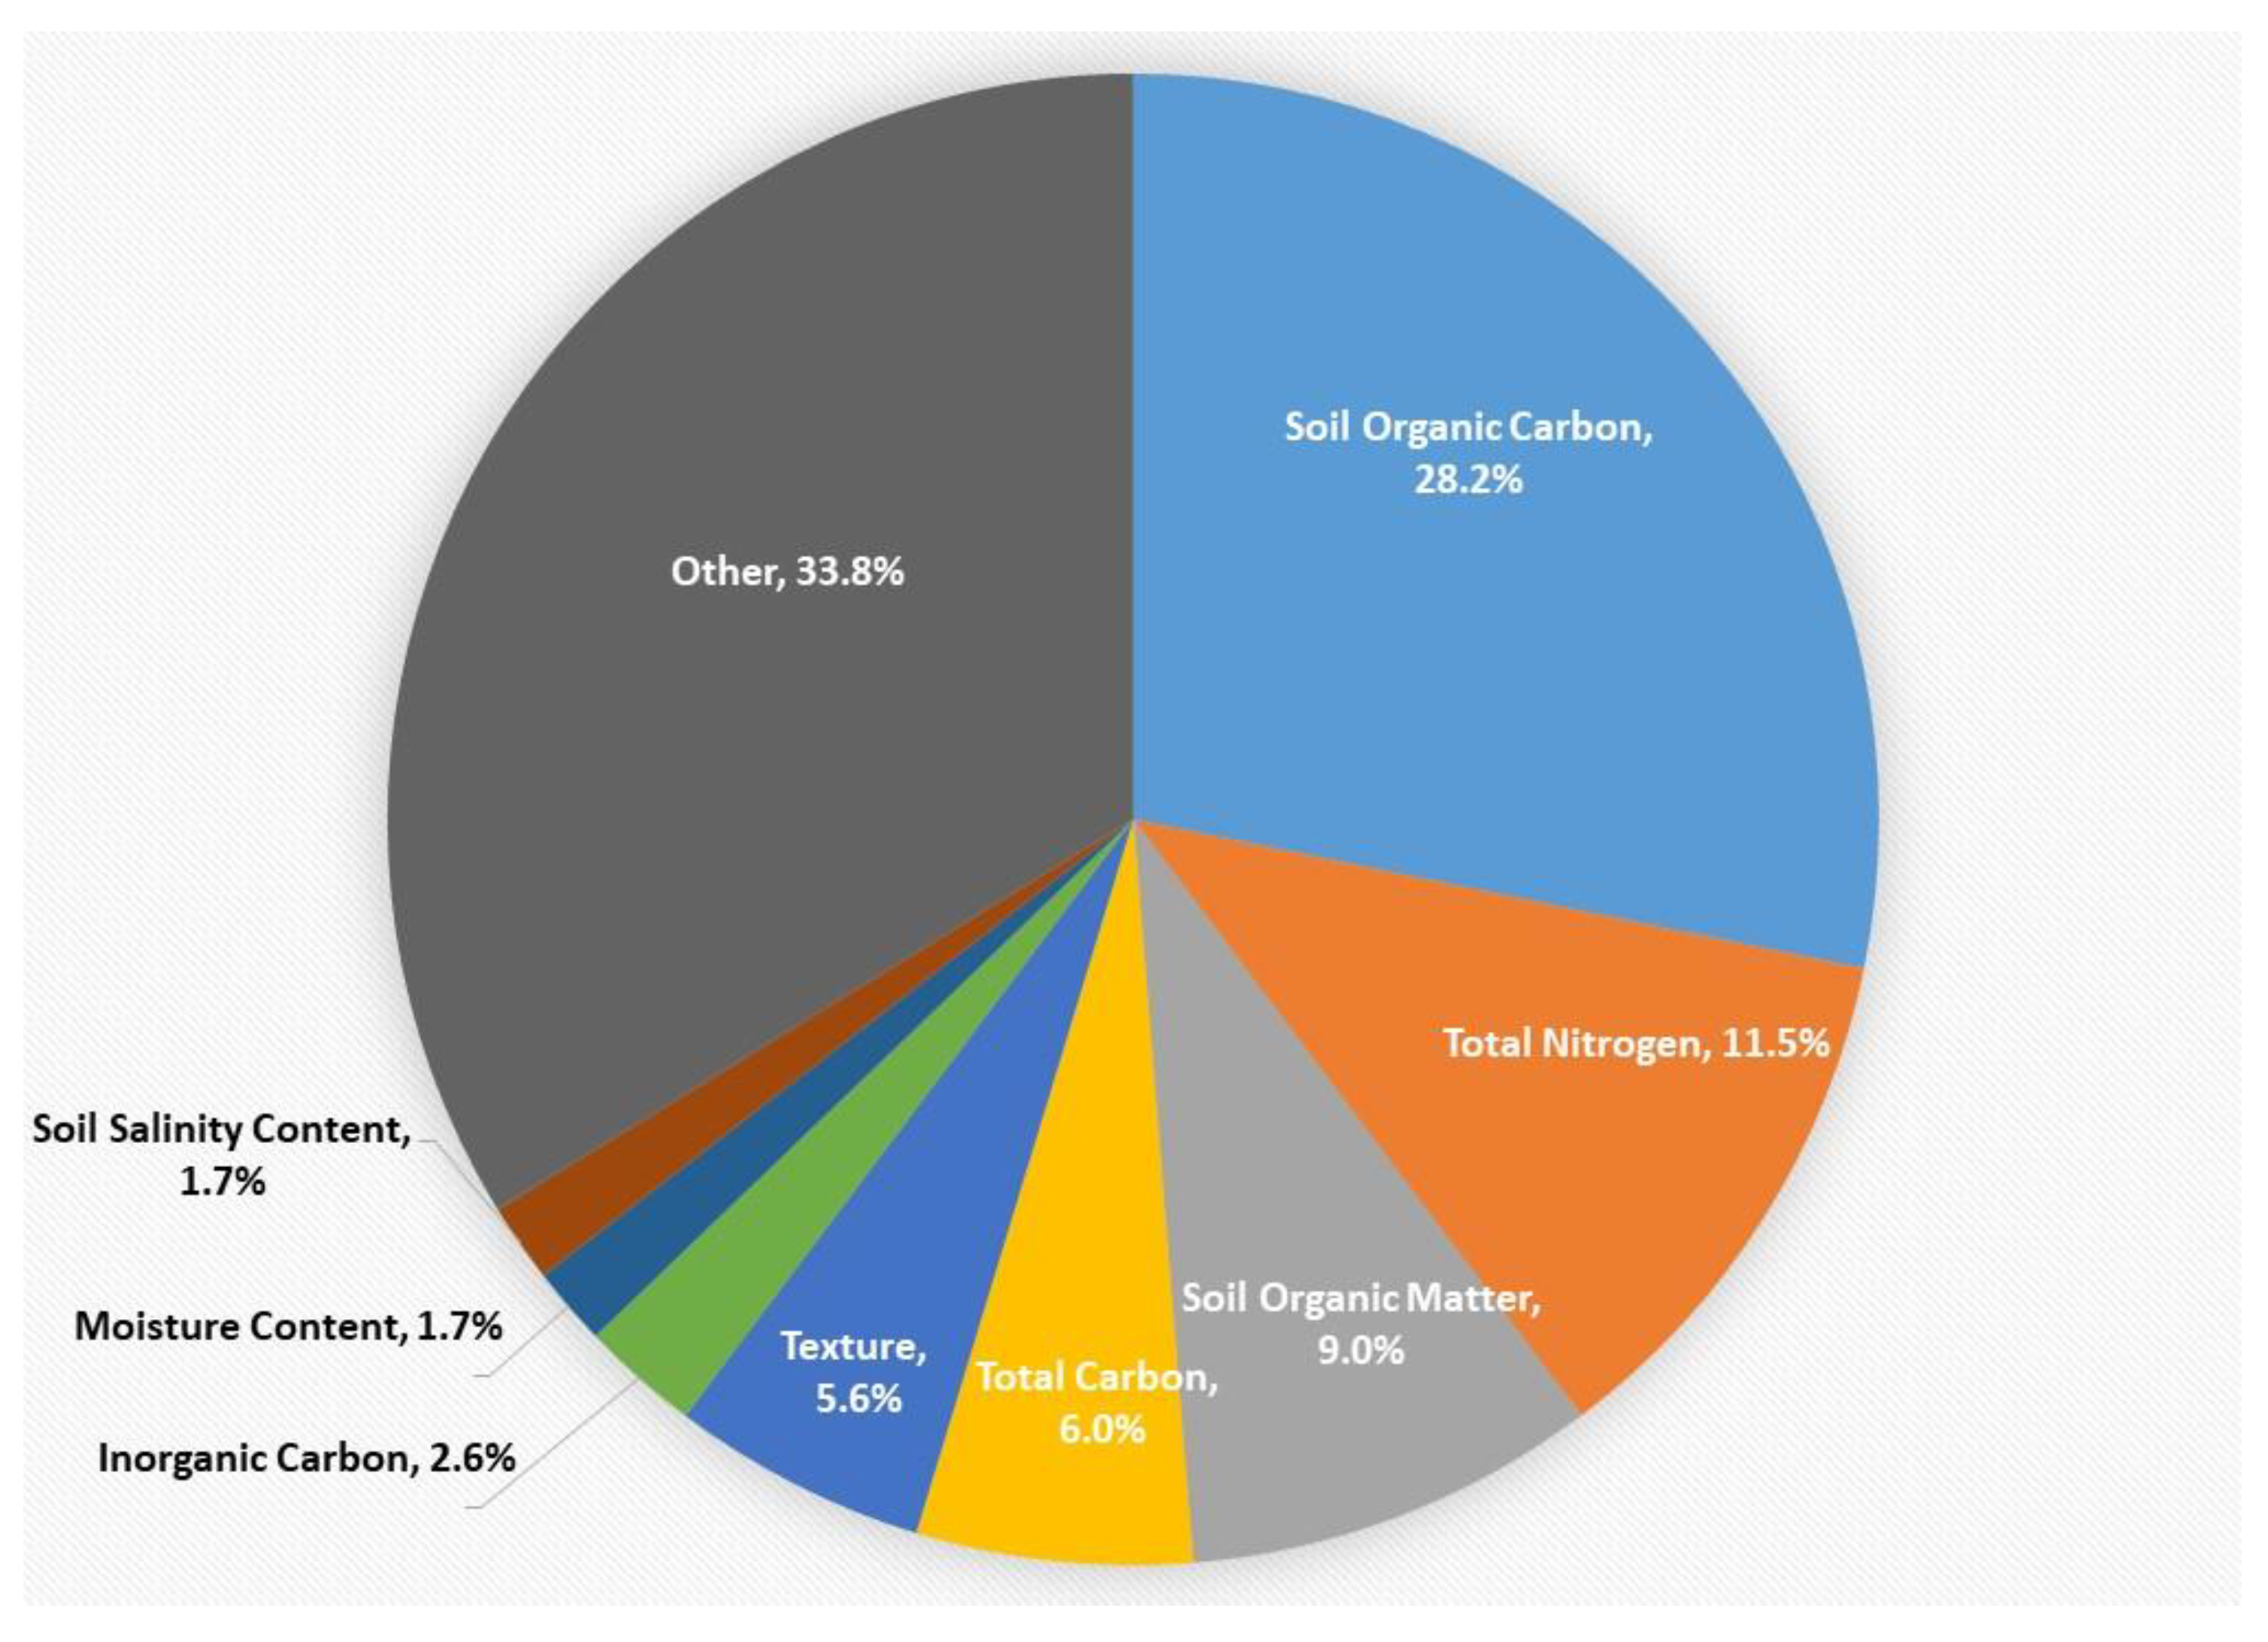
3.5. Analyzed Soil Properties
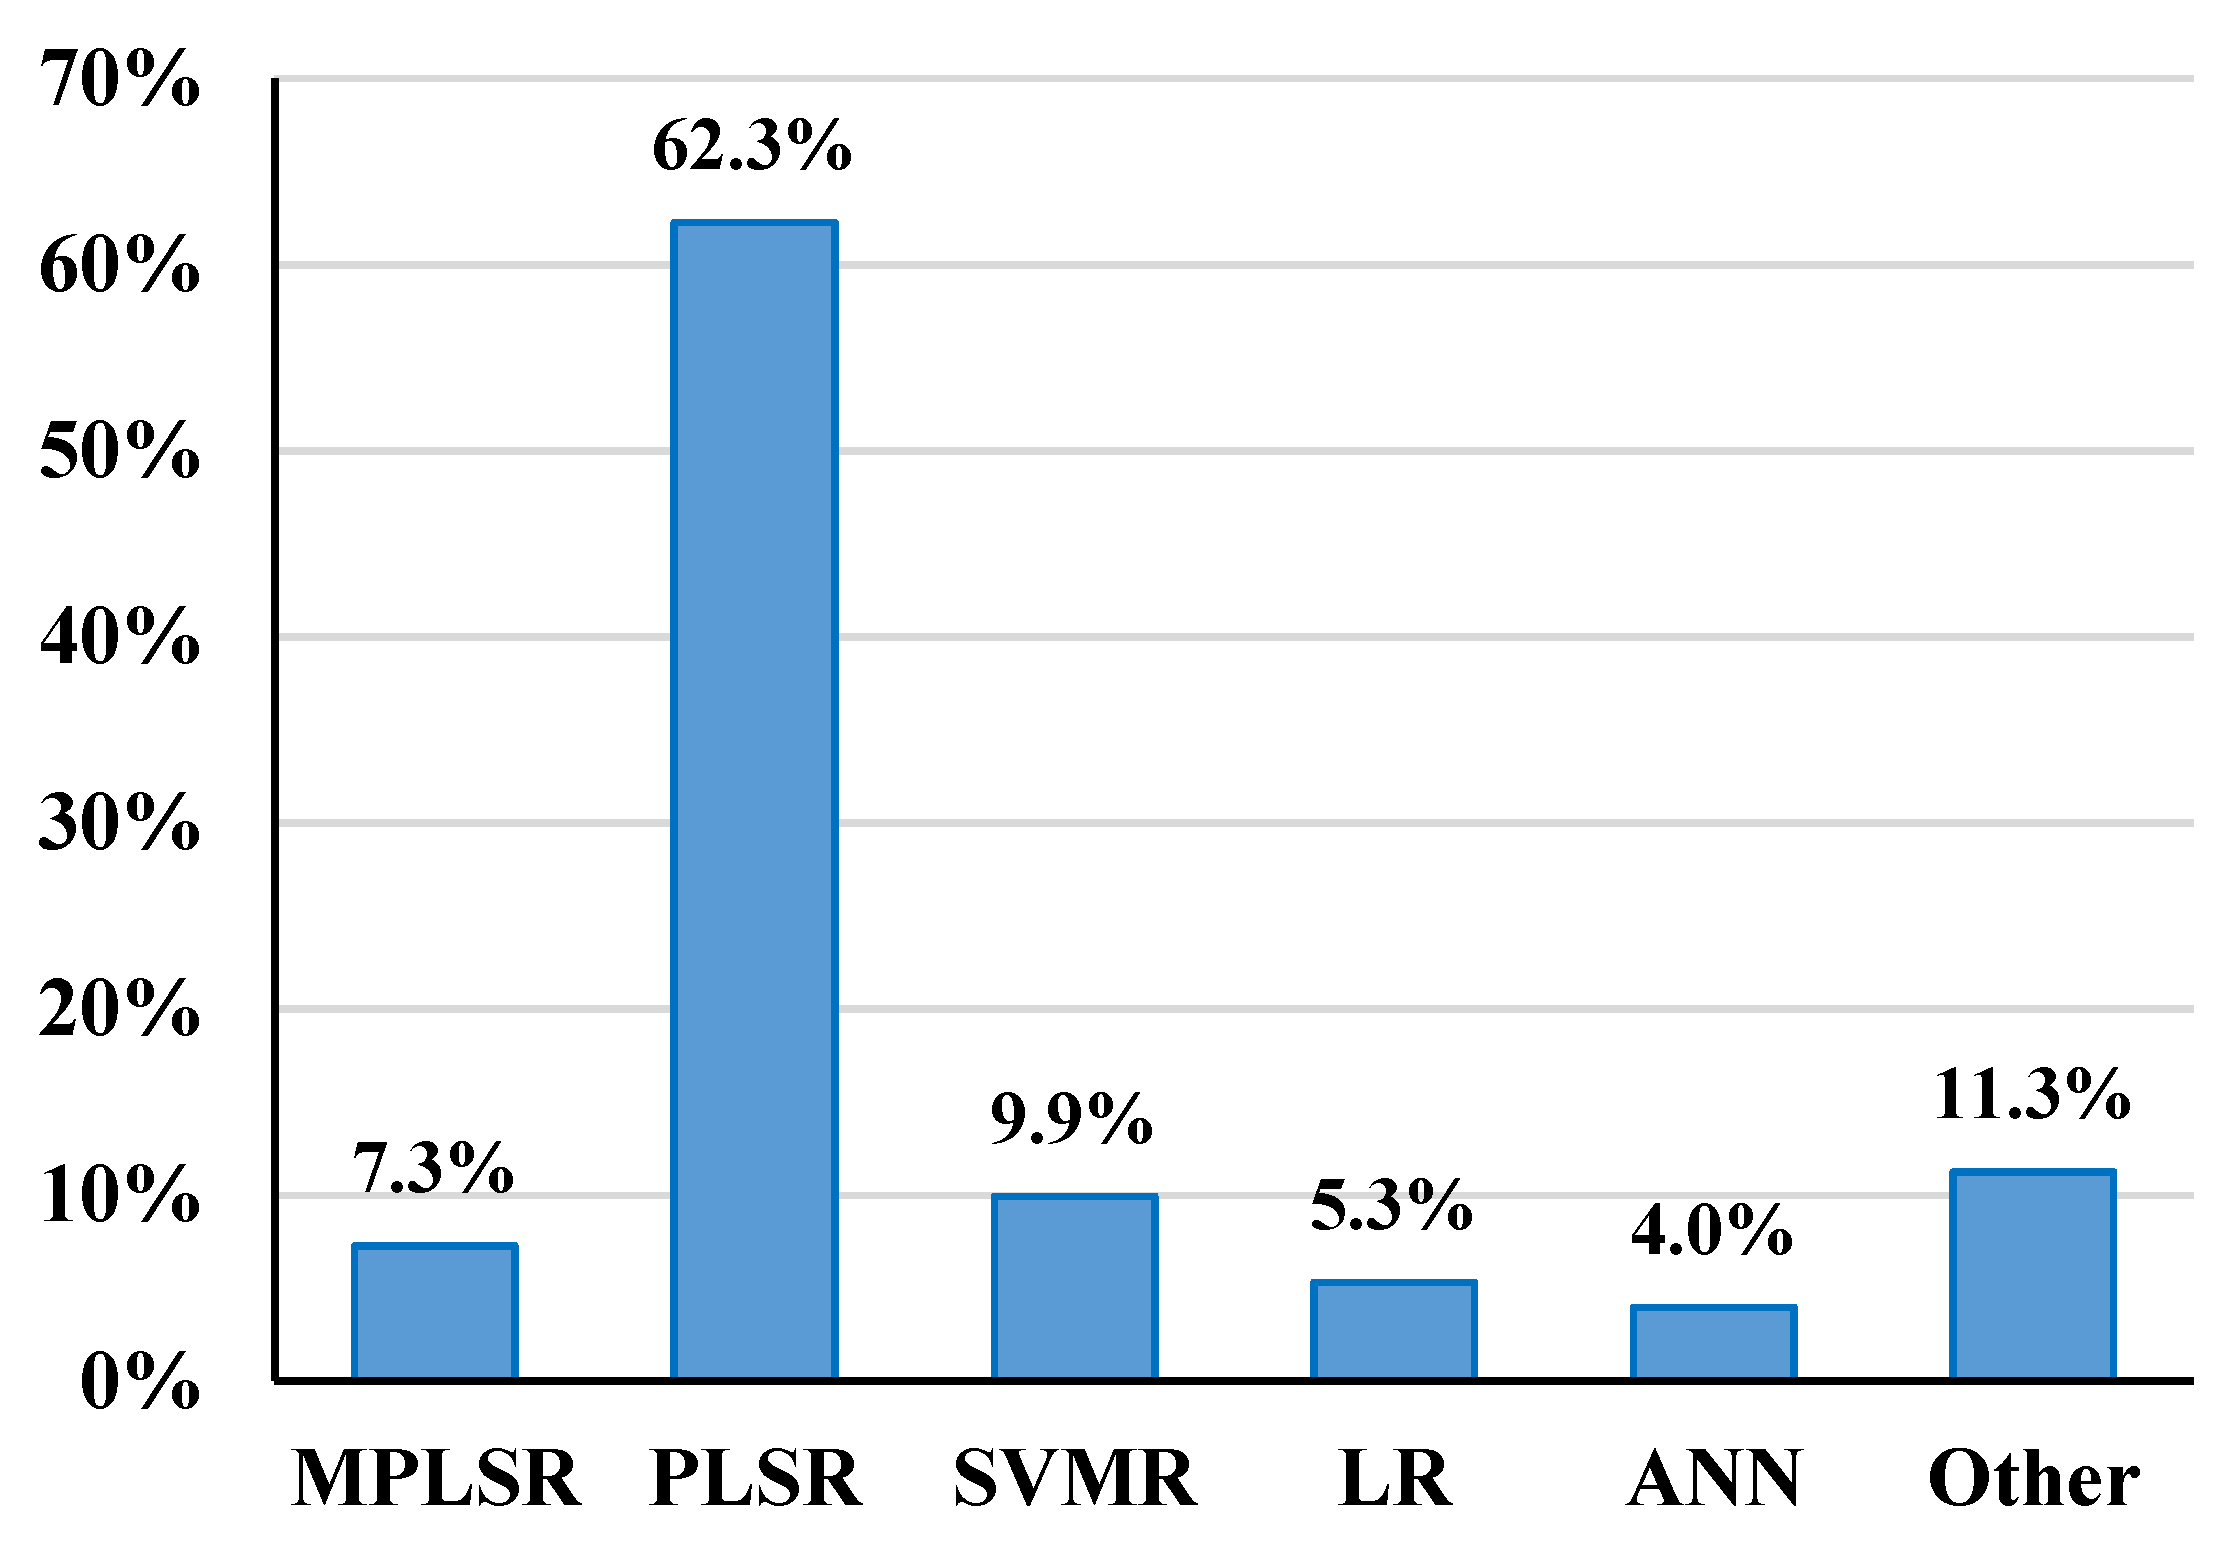
3.6. Machine Learning Methods
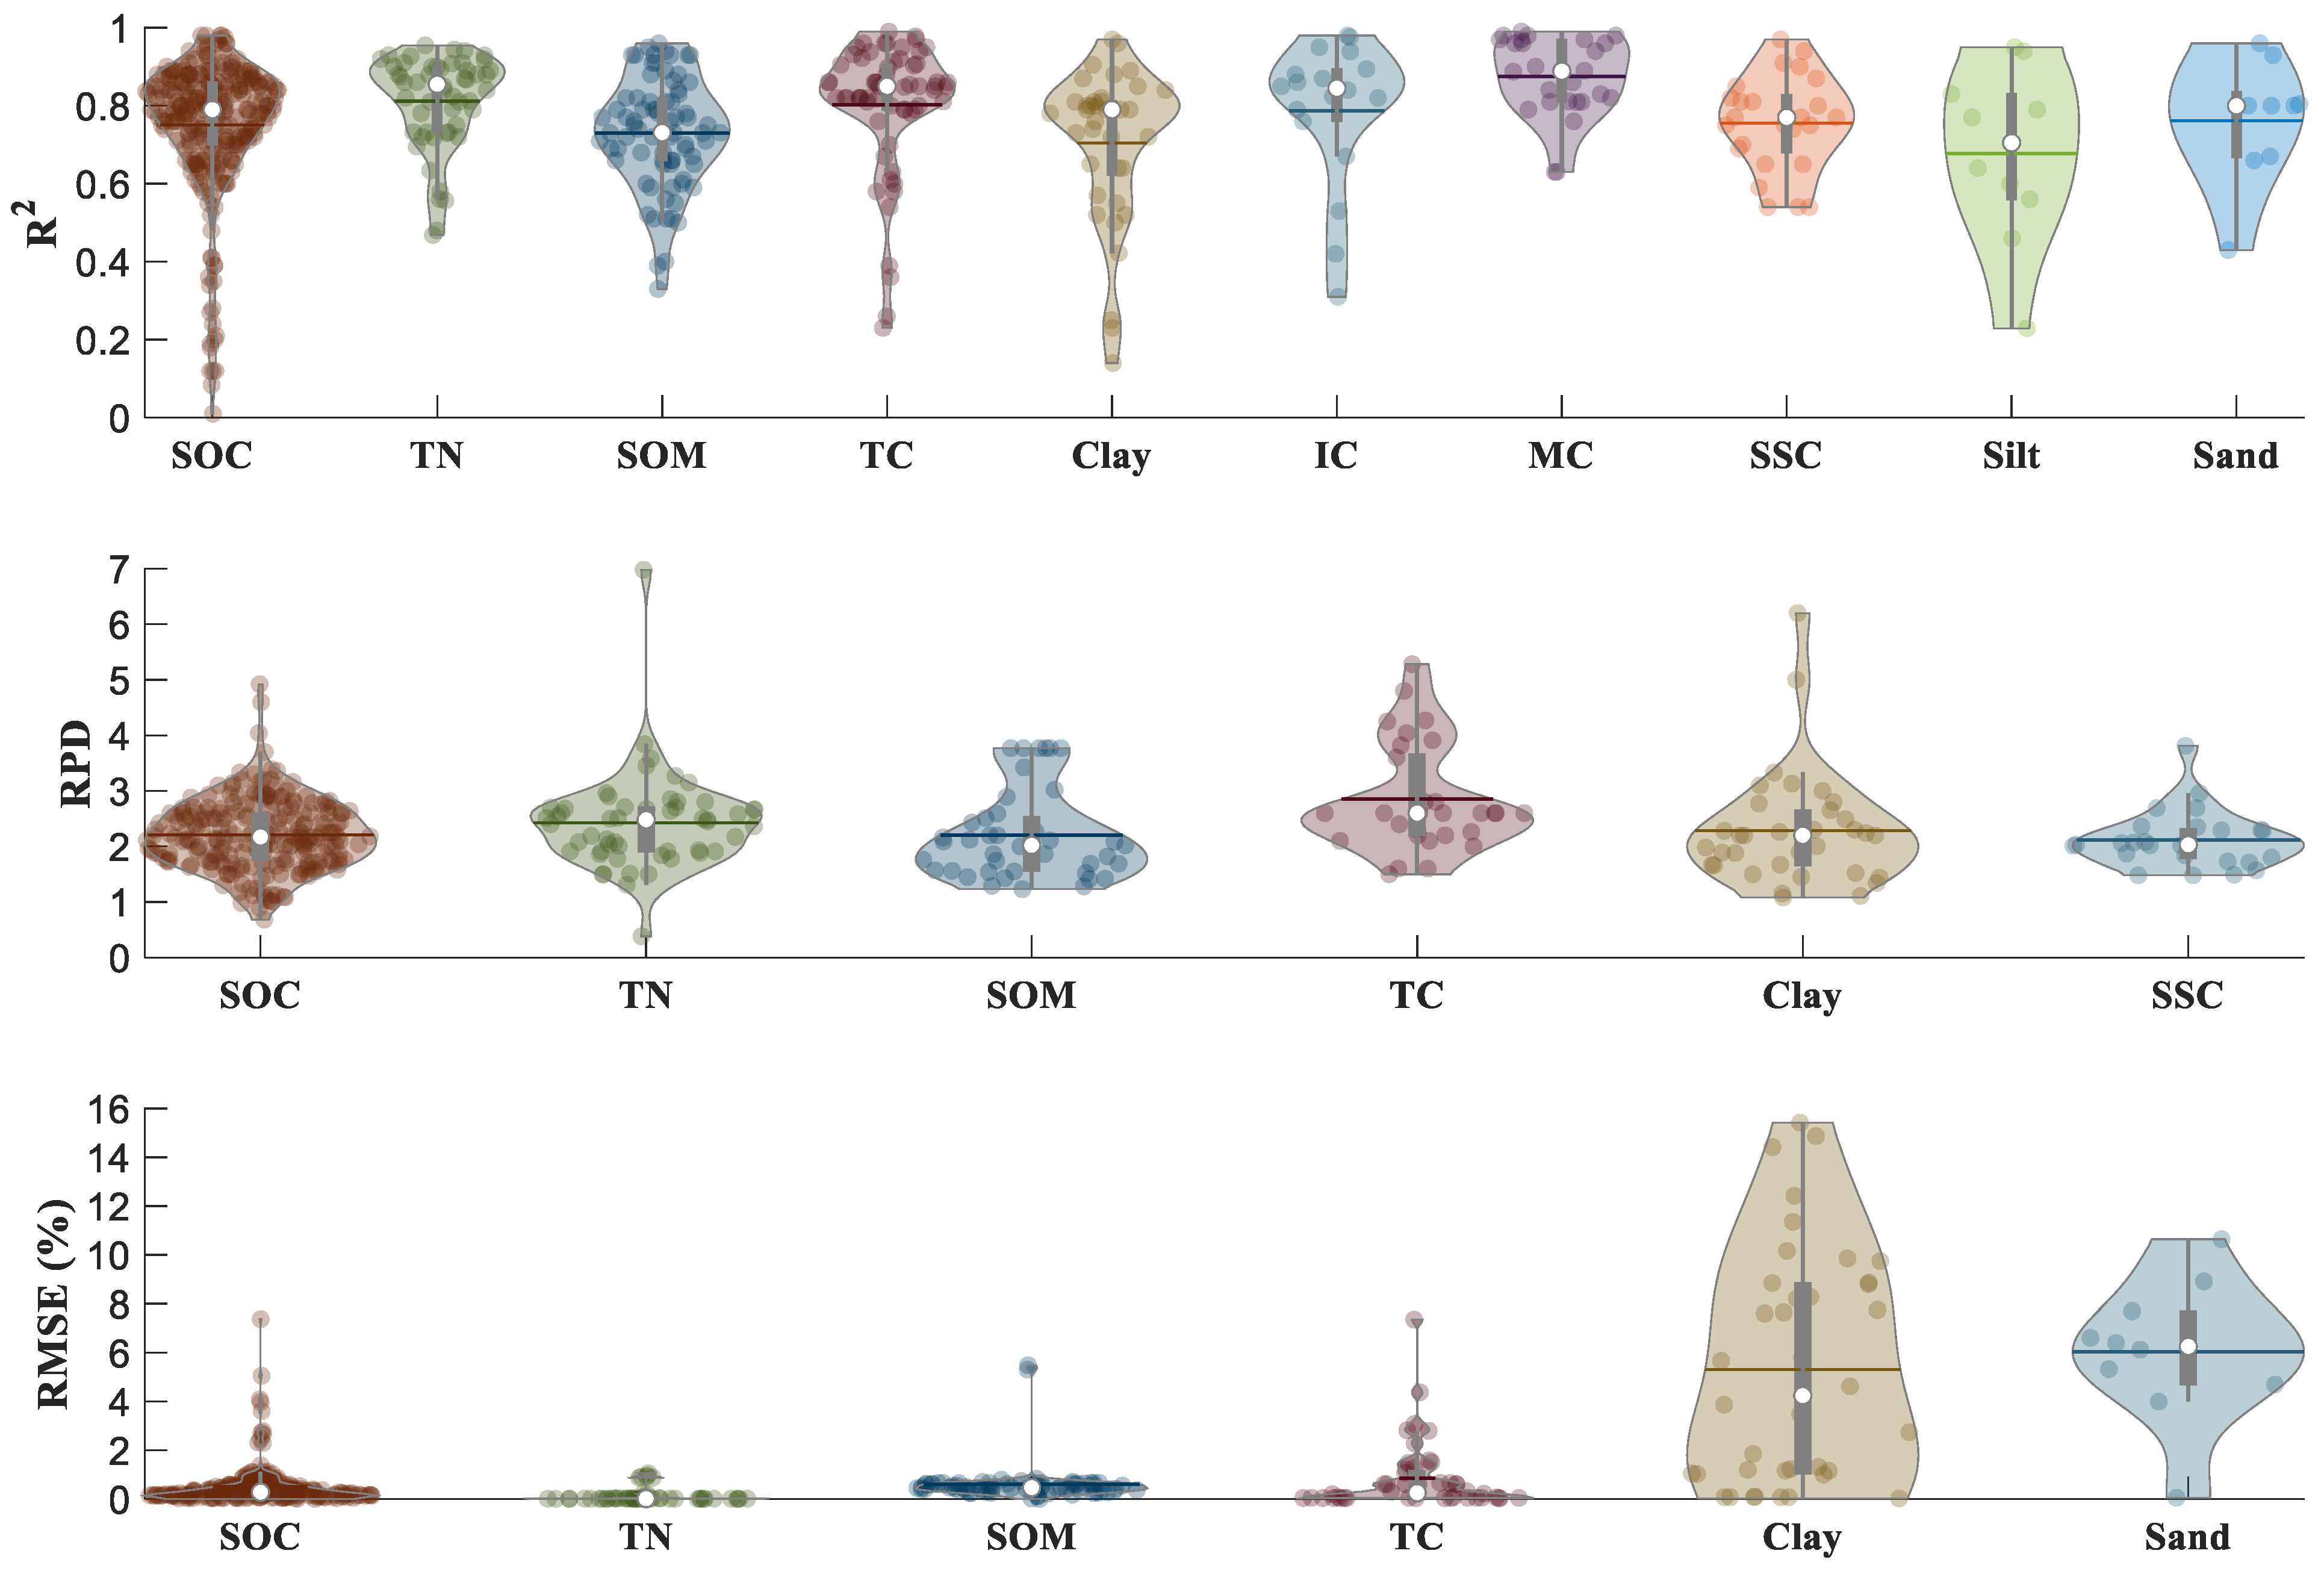
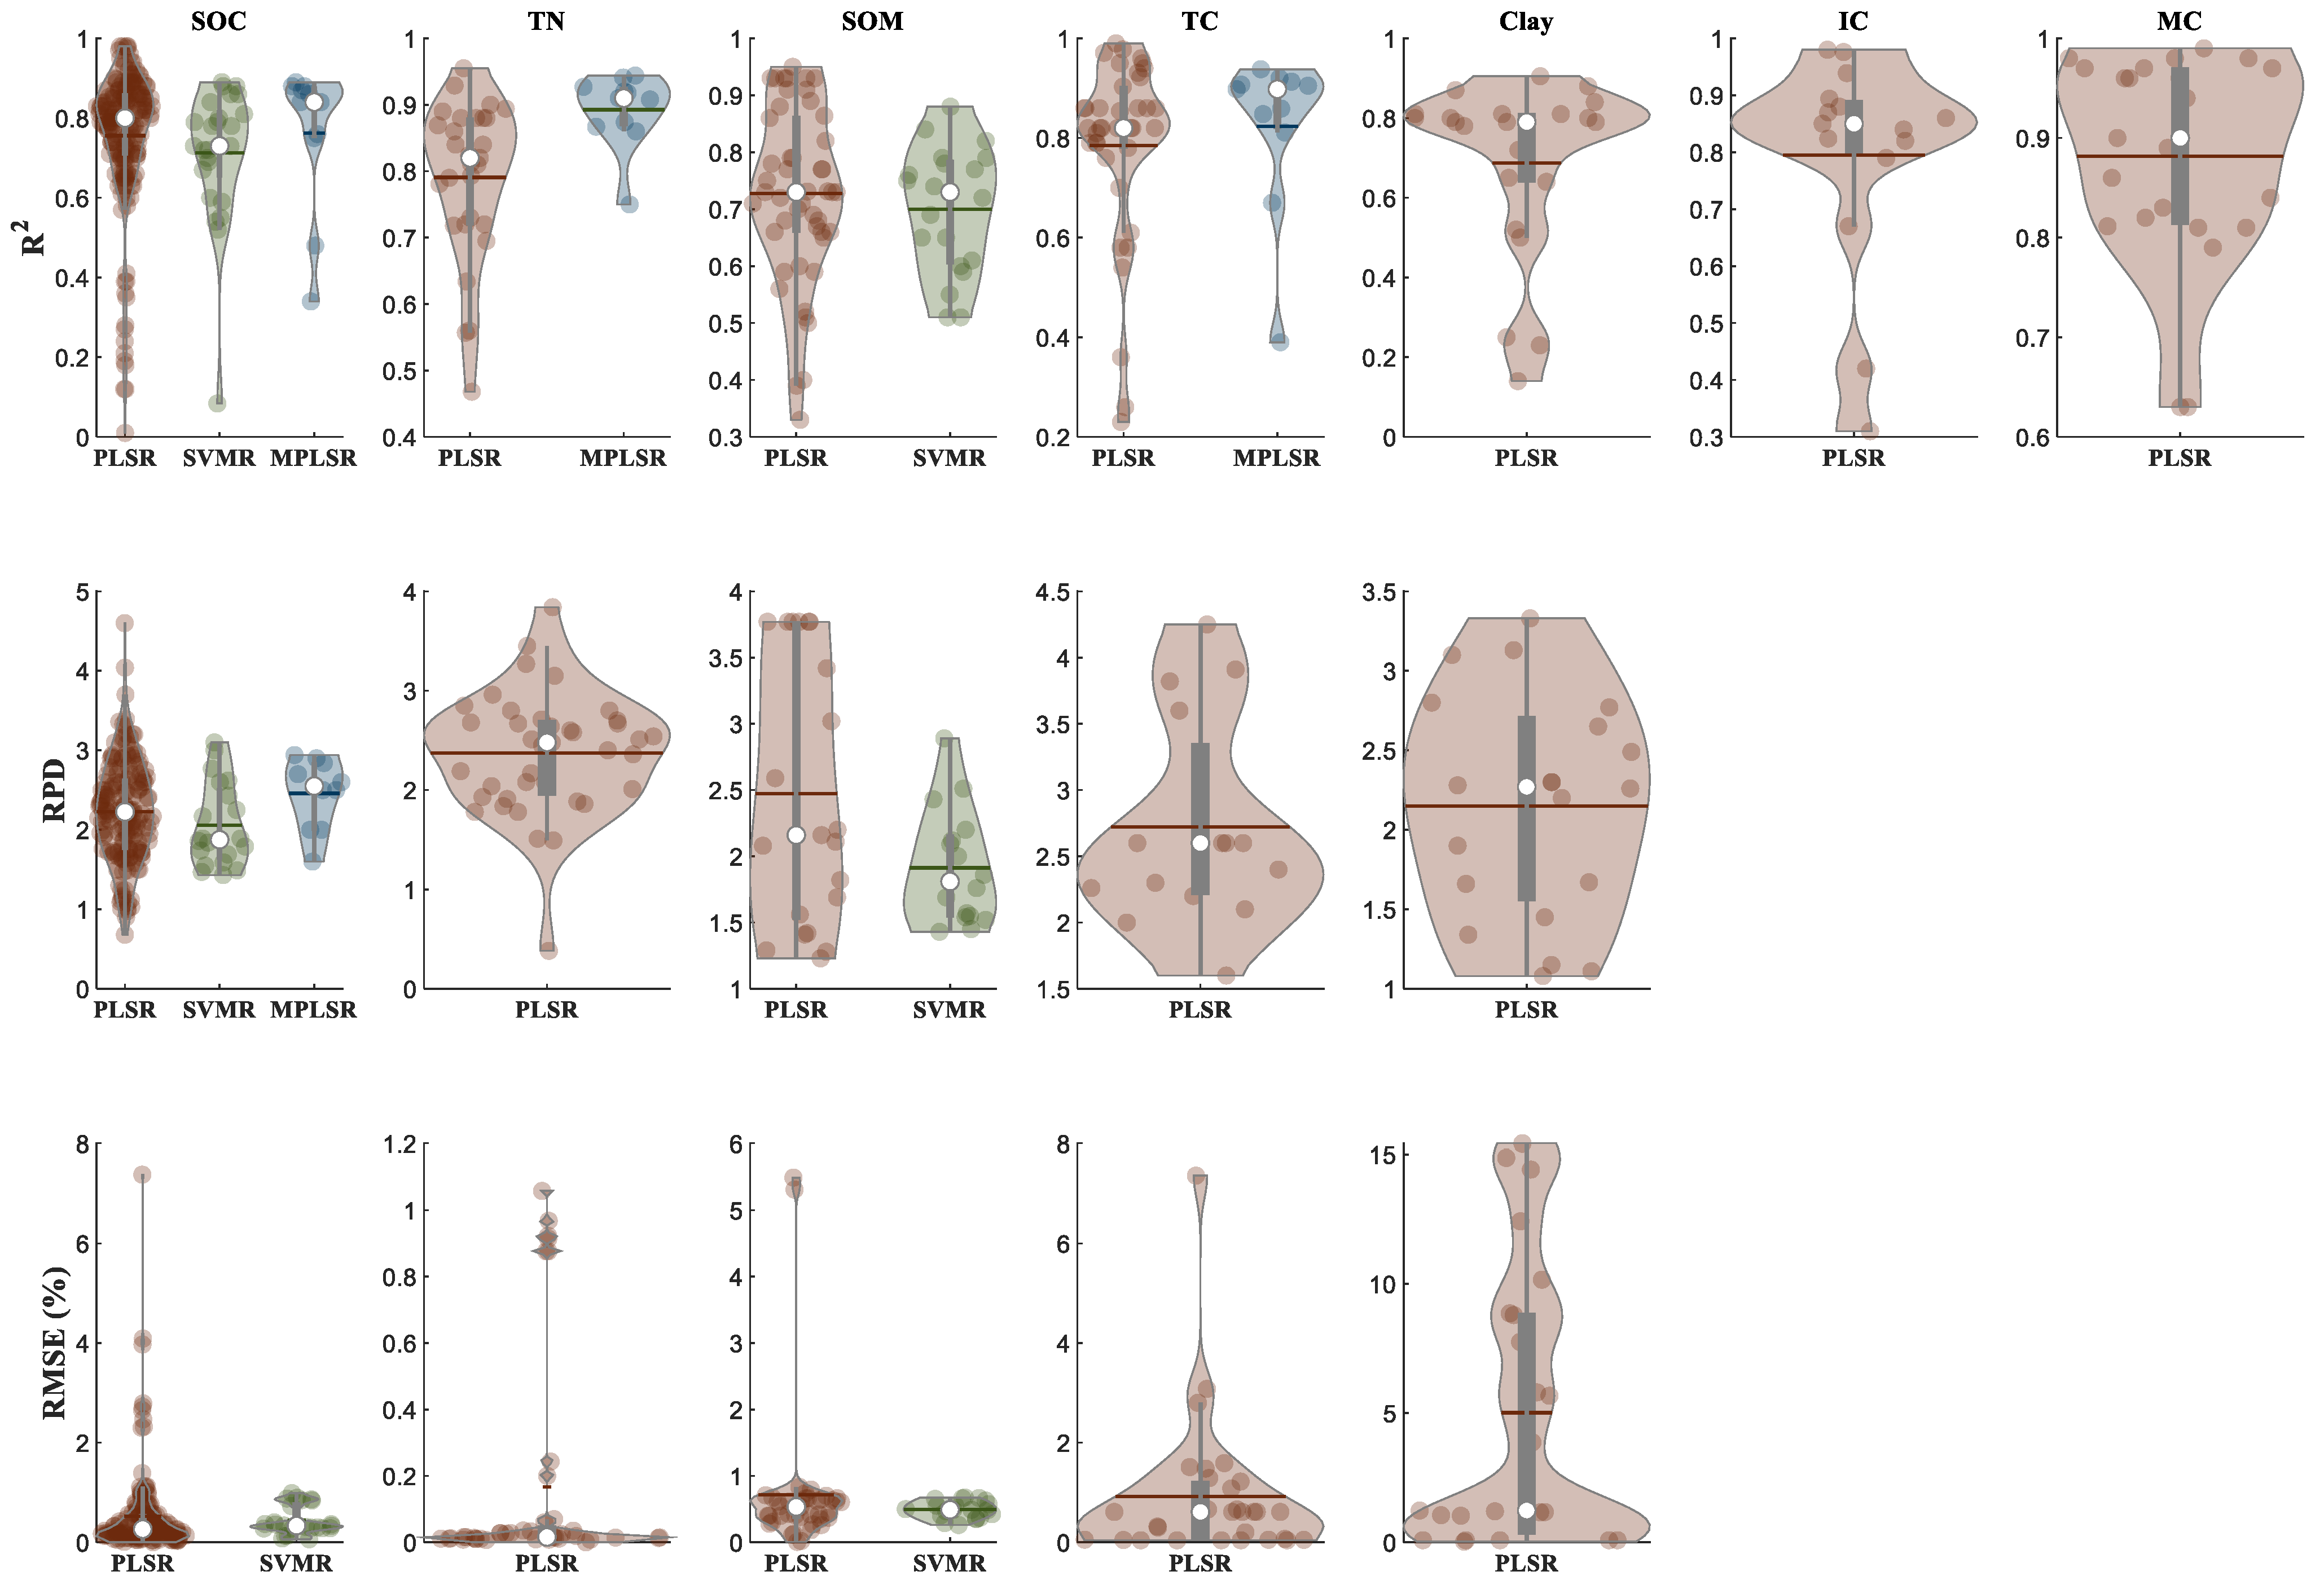
3.7. Meta-Analysis
4. Conclusions
Supplementary Materials
Author Contributions
Funding
Acknowledgments
Conflicts of Interest
References
- Khan, H.; Farooque, A.A.; Acharya, B.; Abbas, F.; Esau, T.J.; Zaman, Q.U. Delineation of Management Zones for Site-Specific Information about Soil Fertility Characteristics through Proximal Sensing of Potato Fields. Agronomy 2020, 10, 1854. [Google Scholar] [CrossRef]
- Roberton, S.D.; Bennett, J.M.; Lobsey, C.R.; Bishop, T.F. Assessing the Sensitivity of Site-Specific Lime and Gypsum Recommendations to Soil Sampling Techniques and Spatial Density of Data Collection in Australian Agriculture: A Pe-dometric Approach. Agronomy 2020, 10, 1676. [Google Scholar] [CrossRef]
- McCarty, G.W.; Reeves, J.B.; Reeves, V.B.; Follett, R.F.; Kimble, J.M. Mid-infrared and near-infrared diffuse reflec-tance spectroscopy for soil carbon measurement. Soil Sci. Soc. Am. J. 2002, 66, 640–646. [Google Scholar] [CrossRef]
- Cozzolino, D.; Morón, A. Potential of near-infrared reflectance spectroscopy and chemometrics to predict soil organic carbon fractions. Soil Tillage Res. 2006, 85, 78–85. [Google Scholar] [CrossRef]
- Viscarra Rossel, R.A.; Walvoort, D.J.J.; McBratney, A.B.; Janik, L.J.; Skjemstad, J.O. Visible, near infrared, mid in-frared or combined diffuse reflectance spectroscopy for simultaneous assessment of various soil properties. Geoderma 2006, 131, 59–75. [Google Scholar] [CrossRef]
- Soriano-Disla, J.M.; Janik, L.J.; Rossel, R.A.V.; Macdonald, L.M.; McLaughlin, M.J. The Performance of Visible, Near-, and Mid-Infrared Reflectance Spectroscopy for Prediction of Soil Physical, Chemical, and Biological Properties. Appl. Spectrosc. Rev. 2014, 49, 139–186. [Google Scholar] [CrossRef]
- Nocita, M.; Stevens, A.; van Wesemael, B.; Aitkenhead, M.; Bachmann, M.; Barthès, B.; Ben Dor, E.; Brown, D.J.; Clairotte, M.; Csorba, A.; et al. Soil Spectroscopy: An Alternative to Wet Chemistry for Soil Monitoring. In Advances in Agronomy; Academic Press: Cambridge, MA, USA, 2015; Volume 132, pp. 139–159. [Google Scholar]
- Morgan, C.L.; Waiser, T.H.; Brown, D.J.; Hallmark, C.T. Simulated in situ characterization of soil organic and inorganic carbon with visible near-infrared diffuse reflectance spectroscopy. Geoderma 2009, 151, 249–256. [Google Scholar] [CrossRef]
- Vohland, M.; Besold, J.; Hill, J.; Fründ, H.C. Comparing different multivariate calibration methods for the deter-mination of soil organic carbon pools with visible to near infrared spectroscopy. Geoderma 2011, 166, 198–205. [Google Scholar] [CrossRef]
- Peng, X.; Shi, T.; Song, A.; Chen, Y.; Gao, W. Estimating Soil Organic Carbon Using VIS/NIR Spectroscopy with SVMR and SPA Methods. Remote. Sens. 2014, 6, 2699–2717. [Google Scholar] [CrossRef] [Green Version]
- Nawar, S.; Mouazen, A. On-line vis-NIR spectroscopy prediction of soil organic carbon using machine learning. Soil Tillage Res. 2019, 190, 120–127. [Google Scholar] [CrossRef]
- Gomez, C.; Rossel, R.A.V.; McBratney, A.B. Soil organic carbon prediction by hyperspectral remote sensing and field vis-NIR spectroscopy: An Australian case study. Geoderma 2008, 146, 403–411. [Google Scholar] [CrossRef]
- Stevens, A.; Nocita, M.; Tóth, G.; Montanarella, L.; van Wesemael, B. Prediction of soil organic carbon at the Eu-ropean scale by visible and near infrared reflectance spectroscopy. PLoS ONE 2013, 8, e66409. [Google Scholar] [CrossRef] [PubMed]
- Shi, T.; Cui, L.; Wang, J.; Fei, T.; Chen, Y.; Wu, G. Comparison of multivariate methods for estimating soil total nitrogen with visible/near-infrared spectroscopy. Plant Soil 2013, 366, 363–375. [Google Scholar] [CrossRef]
- Zhang, Y.; Li, M.; Zheng, L.; Zhao, Y.; Pei, X. Soil nitrogen content forecasting based on real-time NIR spectroscopy. Comput. Electron. Agric. 2016, 124, 29–36. [Google Scholar] [CrossRef]
- Fidêncio, P.H.; Poppi, R.J.; de Andrade, J.C.; Cantarella, H. Determination of organic matter in soil using near-infrared spectros-copy and partial least squares regression. Commun. Soil Sci. Plant Anal. 2002, 33, 1607–1615. [Google Scholar] [CrossRef]
- Conforti, M.; Castrignanò, A.; Robustelli, G.; Scarciglia, F.; Stelluti, M.; Buttafuoco, G. Laboratory-based Vis–NIR spectroscopy and partial least square regression with spatially correlated errors for predicting spatial variation of soil or-ganic matter content. Catena 2015, 124, 60–67. [Google Scholar] [CrossRef]
- Slaughter, D.C.; Pelletier, M.G.; Upadhyaya, S.K. sensing soil moisture using nir spectroscopy. Appl. Eng. Agric. 2001, 17, 241. [Google Scholar] [CrossRef]
- Morellos, A.; Pantazi, X.-E.; Moshou, D.; Alexandridis, T.; Whetton, R.; Tziotzios, G.; Wiebensohn, J.; Bill, R.; Mouazen, A.M. Machine learning based prediction of soil total nitrogen, organic carbon and moisture content by using VIS-NIR spectroscopy. Biosyst. Eng. 2016, 152, 104–116. [Google Scholar] [CrossRef] [Green Version]
- Vendrame, P.R.S.; Marchão, R.L.; Brunet, D.; Becquer, T. The potential of NIR spectroscopy to predict soil texture and mineralogy in Cerrado Latosols. Eur. J. Soil Sci. 2012, 63, 743–753. [Google Scholar] [CrossRef]
- Curcio, D.; Ciraolo, G.; D’Asaro, F.; Minacapilli, M. Prediction of soil texture distributions using V-NIR-SWIR re-flectance spectroscopy. Procedia Environ. Sci. 2013, 19, e503. [Google Scholar] [CrossRef] [Green Version]
- Nawar, S.; Buddenbaum, H.; Hill, J. Estimation of soil salinity using three quantitative methods based on visible and near-infrared reflectance spectroscopy: A case study from Egypt. Arab. J. Geosci. 2015, 8, 5127–5140. [Google Scholar] [CrossRef]
- Chen, H.; Zhao, G.; Sun, L.; Wang, R.; Liu, Y. Prediction of soil salinity using near-infrared reflectance spectrosco-py with nonnegative matrix factorization. Appl. Spectrosc. 2016, 70, 1589–1597. [Google Scholar] [CrossRef]
- Ben-Dor, E.; Banin, A. Near-infrared analysis as a rapid method to simultaneously evaluate several soil proper-ties. Soil Sci. Soc. Am. J. 1995, 59, 364–372. [Google Scholar] [CrossRef]
- Stenberg, B.; Rossel, R.A.V.; Mouazen, A.M.; Wetterlind, J. Visible and Near Infrared Spectroscopy in Soil Science. In Advances in Agronomy; Academic Press: Cambridge, MA, USA, 2010; Volume 107, pp. 163–215. ISBN 0065-2113. [Google Scholar]
- Reeves, J.B. Near- versus mid-infrared diffuse reflectance spectroscopy for soil analysis emphasizing carbon and laboratory versus on-site analysis: Where are we and what needs to be done? Geoderma 2010, 158, 3–14. [Google Scholar] [CrossRef]
- Bellon-Maurel, V.; McBratney, A. Near-infrared (NIR) and mid-infrared (MIR) spectroscopic techniques for as-sessing the amount of carbon stock in soils–Critical review and research perspectives. Soil Biol. Biochem. 2011, 43, 1398–1410. [Google Scholar] [CrossRef]
- Gholizadeh, A.; Borůvka, L.; Saberioon, M.; Vašát, R. Visible, near-infrared, and mid-infrared spectroscopy appli-cations for soil assessment with emphasis on soil organic matter content and quality: State-of-the-art and key issues. Appl. Spectrosc. 2013, 67, 1349–1362. [Google Scholar] [CrossRef]
- Gobrecht, A.; Roger, J.M.; Bellon-Maurel, V. Major issues of diffuse reflectance NIR spectroscopy in the specific context of soil carbon content estimation: A review. In Advances in Agronomy; Academic Press: Cambridge, MA, USA, 2014; Volume 123, pp. 145–175. [Google Scholar]
- Zheng, G.; Ryu, D.; Jiao, C.; Xie, X.; Cui, X.; Shang, G. Visible and Near-Infrared Reflectance Spectroscopy Analysis of a Coastal Soil Chronosequence. Remote. Sens. 2019, 11, 2336. [Google Scholar] [CrossRef] [Green Version]
- Knox, J.; Hess, T.; Daccache, A.; Wheeler, T. Climate change impacts on crop productivity in Africa and South Asia. Env. Res. Lett. 2012, 7. [Google Scholar] [CrossRef]
- Collaboration for Environmental Evidence. Guidelines and Standards for Evidence Synthesis in Environmental Management; Pullin, A.S., Frampton, G.K., Livoreil, B., Petrokofsky, G., Eds.; Version 5.0; Collaboration for Environmental Evidence: Johannesburg, South Africa, 2018; Available online: https://environmentalevidence.org/ (accessed on 3 January 2021).
- An, X.; Li, M.; Zheng, L.; Liu, Y.; Zhang, Y. Real time detection of soil moisture in winter jujube orchard based on NIR spectroscopy. In International Conference on Computer and Computing Technologies in Agriculture; Springer: Berlin/Heidelberg, Germany, 2012; pp. 447–455. [Google Scholar]
- Isaac, W.; Na, A. On-the-go soil nitrogen sensor based on near infrared spectroscopy. In Proceedings of the 2016 International Conference on Information Technology (InCITe)-The Next Generation IT Summit on the Theme-Internet of Things: Connect your Worlds, Noida, India, 6–7 October 2016; IEEE: Noida, India, 2017; pp. 312–315. [Google Scholar]
- Dor, E.B.; Ong, C.; Lau, I.C. Reflectance measurements of soils in the laboratory: Standards and proto-cols. Geoderma 2015, 245, 112–124. [Google Scholar]
- Rosero-Vlasova, O.A.; Pérez-Cabello, F.; Llovería, R.M.; Vlassova, L. Assessment of laboratory VIS-NIR-SWIR setups with different spectroscopy accessories for characterisation of soils from wildfire burns. Biosyst. Eng. 2016, 152, 51–67. [Google Scholar] [CrossRef]
- Demattê, J.A.M.; Dotto, A.C.; Bedin, L.G.; Sayão, V.M.; E Souza, A.B. Soil analytical quality control by traditional and spectroscopy techniques: Constructing the future of a hybrid laboratory for low environmental impact. Geoderma 2019, 337, 111–121. [Google Scholar] [CrossRef]
- Allory, V.; Cambou, A.; Moulin, P.; Schwartz, C.; Cannavo, P.; Vidal-Beaudet, L.; Barthès, B.G. Quantification of soil organic carbon stock in urban soils using visible and near infrared reflectance spectroscopy (V-NIRS) in situ or in la-boratory conditions. Sci. Total Environ. 2019, 686, 764–773. [Google Scholar] [CrossRef] [PubMed] [Green Version]
- Leone, A.P.; AViscarra-Rossel, R.; Amenta, P.; Buondonno, A. Prediction of soil properties with PLSR and vis-NIR spectroscopy: Application to mediterranean soils from Southern Italy. Curr. Anal. Chem. 2012, 8, 283–299. [Google Scholar] [CrossRef]
- Leone, A.P.; Leone, G.; Leone, N.; Galeone, C.; Grilli, E.; Orefice, N.; Ancona, V. Capability of Diffuse Reflectance Spectroscopy to Predict Soil Water Retention and Related Soil Properties in an Irrigated Lowland District of Southern Italy. Water 2019, 11, 1712. [Google Scholar] [CrossRef] [Green Version]
- Fails, J.A.; Olsen, D.R., Jr. Interactive machine learning. In Proceedings of the 8th International Conference on Intelligent User Interfaces, Miami, FL, USA, 12–15 January 2003; pp. 39–45. [Google Scholar]
- Hintze, J.L.; Nelson, R.D. Violin plots: A box plot-density trace synergism. Am. Stat. 1998, 52, 181–184. [Google Scholar]
- Pawlowsky-Glahn, V.; Egozcue, J.J. Compositional data and their analysis: An introduction. In Geological Society; Special Publications: London, UK, 2006; Volume 264, pp. 1–10. [Google Scholar] [CrossRef] [Green Version]
- Jaconi, A.; Vos, C.; Don, A. Near infrared spectroscopy as an easy and precise method to estimate soil texture. Geoderma 2019, 337, 906–913. [Google Scholar] [CrossRef]
- Saeys, W.; Mouazen, A.; Ramon, H. Potential for Onsite and Online Analysis of Pig Manure using Visible and Near Infrared Reflectance Spectroscopy. Biosyst. Eng. 2005, 91, 393–402. [Google Scholar] [CrossRef]
- Pepper, I.L.; Gerba, C.P.; Newby, D.T.; Rice, C.W. Soil: A Public Health Threat or Savior? Crit. Rev. Env. Sci. Technol. 2009, 39, 416–432. [Google Scholar] [CrossRef]
- Shannon, D.K.; Clay, D.E.; Sudduth, K.A.; Kitchen, N. An Introduction to Precision Agriculture. In Guidelines for Analysis and Description of Soil and Regolith Thin Sections; Wiley: Hoboken, NJ, USA, 2018; pp. 1–12. [Google Scholar]
- Badewa, E.; Unc, A.; Cheema, M.; Kavanagh, V.; Galagedara, L. Soil Moisture Mapping Using Multi-Frequency and Multi-Coil Electromagnetic Induction Sensors on Managed Podzols. Agronomy 2018, 8, 224. [Google Scholar] [CrossRef] [Green Version]


Publisher’s Note: MDPI stays neutral with regard to jurisdictional claims in published maps and institutional affiliations. |
© 2021 by the authors. Licensee MDPI, Basel, Switzerland. This article is an open access article distributed under the terms and conditions of the Creative Commons Attribution (CC BY) license (http://creativecommons.org/licenses/by/4.0/).
Share and Cite
Ahmadi, A.; Emami, M.; Daccache, A.; He, L. Soil Properties Prediction for Precision Agriculture Using Visible and Near-Infrared Spectroscopy: A Systematic Review and Meta-Analysis. Agronomy 2021, 11, 433. https://doi.org/10.3390/agronomy11030433
Ahmadi A, Emami M, Daccache A, He L. Soil Properties Prediction for Precision Agriculture Using Visible and Near-Infrared Spectroscopy: A Systematic Review and Meta-Analysis. Agronomy. 2021; 11(3):433. https://doi.org/10.3390/agronomy11030433
Chicago/Turabian StyleAhmadi, Arman, Mohammad Emami, Andre Daccache, and Liuyue He. 2021. "Soil Properties Prediction for Precision Agriculture Using Visible and Near-Infrared Spectroscopy: A Systematic Review and Meta-Analysis" Agronomy 11, no. 3: 433. https://doi.org/10.3390/agronomy11030433