Growing Medium Type Affects Organic Fertilizer Mineralization and CNPS Microbial Enzyme Activities
by
 , , and
Louise Paillat
1,2,* ,
,
Patrice Cannavo
1,
Fabrice Barraud
2,
Lydie Huché-Thélier
3 and
René Guénon
1,* 1
EPHOR, Institut Agro, 49045 Angers, France
2
PREMIER TECH GHA SAS, Le Ciron, 49680 Vivy, France
3
Institut Agro, Univ d’Angers, INRAE, IRHS, SFR 4207 QuaSaV, 49000 Angers, France
*
Authors to whom correspondence should be addressed.
Agronomy 2020, 10(12), 1955; https://doi.org/10.3390/agronomy10121955
Submission received: 23 November 2020
/
Revised: 4 December 2020
/
Accepted: 9 December 2020
/
Published: 12 December 2020
(This article belongs to the Special Issue Advances in Soilless Substrate Science for Modern Plant Production Systems)
Abstract
:Managing plant fertilization is a major concern of greenhouse growers to achieve sustainable production with growing media (GM). Organic fertilization is popular but is more difficult to control, since organic compounds need first to be mineralized by microbes. After 7, 14, 28, and 56 days of incubation, we investigated the response of microbial activities and nutrient releases from three frequently used organic fertilizers (horn and two plant-based fertilizers) in three frequently employed GM types (peat, coir, and bark). We measured pH, electrical conductivity, nutrient contents (NH4+-N, NO3−-N, PO43−-P, SO42−-S), and enzyme activities (β-1.4-glucosidase, urease, acid phosphatase, arylsulfatase). After fertilization, microbes in coir expressed all the C, N, P, and S functions studied, making related nutrients available. In peat and bark, some C, N, P, and S-related pathways were locked. Peat presented high NH4+-N and PO43−-P releases linked to high acid phosphatase and β-glucosidase activities, while bark showed high nitrification rates but weak enzyme activities. Fertilizer types modulated these responses with lower activities and nutrient releases with horn. Our results contributed to better understanding mineralization processes in GM, showing different microbial responses to fertilization. This study pointed out the necessity to look deeper into microbial functions in GM optimizing biological and physicochemical properties.
Keywords:
peat; coir; composted bark; horn; nutrient availability; organic substrate; carbon; nitrogen; phosphorus; sulfur1. Introduction
Horticultural crops frequently use organic materials in growing media (GM) formulation to physically support plant growth while ensuring appropriate solid/air/water balance and nutrient supplies for healthy roots [1,2]. The range of growing media constituents and stand-alone substrates includes peat, coir pith, wood fibers, bark, composted materials (e.g., green waste, bark). Among these organic materials, peat has been widely used in growing media during the last decades due to its reliable properties such as low bulk density, high biochemical stability, high porosity, and high air and water-holding capacity, making this substrate particularly suitable for growing a large number of vegetables and ornamentals [1,3,4,5]. However, the availability of this natural resource is nowadays under pressure due to increasing demand for GM, increasing regulation policies about the preservation of peatland as carbon sinks, and transportation costs [2,5,6]. Researchers and the GM industry are working to use peat more wisely and sparingly [7] by partially or totally substituting it with other renewable or sustainable organic materials (e.g., coir, bark, wood fibers, green composts) [4,5,8,9]. Another step toward sustainable soilless systems involves the use of organic fertilizers as a substitute to synthetic fertilizers [9]. Dealing with nutrient excess or deficiency is extremely challenging and has been so far an obstacle to organic fertilization in horticulture [9,10].
Microbes are central to manage nutrient status [11] especially when organic fertilizers are added to GM [9]. To be available for plants, organic fertilizers need first to be mineralized by heterotrophic microbes into simple organic compounds (e.g., sugars, amino acid) and inorganic forms (e.g., NH4+-N, PO43−-P, SO42−-S) [12]. Nitrogen (N) is first released as ammonium (i.e., NH4+-N or ammonia NH3-N whether pH above 8); then, it is converted to nitrite (i.e., NO2−-N) by N-ammonium-oxidizing bacteria (AOB) or archaea (AOA) [13] and then converted in nitrate (i.e., NO3−-N) by nitrite-oxidizing bacteria (NOB) through nitrification [14,15]. Microbial functions of GM types received little attention in the past [2] and mainly concerned weed and pathogen controls [16,17], biological stability, nutrient immobilization [2,8], nitrification stimulated by urea or ammonium-based fertilization [11], and more recently, regarding nutrient availability [18] and the potential mitigation of greenhouse gas emission by adding biochars [19]. The instability of GM related to carbon (C) cycle was studied through the loss of organic matter [20], dioxygen and carbon dioxide evolution [21,22,23,24,25], or dehydrogenase activity [26] as indicators of global microbial activity. Concerning the nutrient availability of GM, attention was given to N immobilization [27,28] and to a lesser extent phosphorus (P) [29] due to microbial consumption.
To survive and reproduce in the environment, microbes degrade complex organic molecules as electron and energy sources for ATP production, which is needed for cellular reactions and new synthesis using carbon and nutrients from mineralization [30]. Microbes mediate their resource allocation toward targeted substrates through C-, N-, P-, or S-acquiring enzyme production in order to meet their stoichiometric needs [31,32] by adopting various strategies to detect and efficiently use these substrates [33]. The constrained and stable elemental composition of microbes makes fertilizer’s quality an important factor that is supposed to drive biochemical cycles and thus nutrient availability [32,34]. Usually, the organic fertilization of soil stimulates microbial growth and enhances enzyme activities [35]. Increasing N availability can promote C- or P-acquiring enzyme production, but higher P availability does not necessarily increase N-acquiring enzymes [32]. Recent works already showed differences in the ability of different growing media (e.g., green waste compost, coir, and peats) used alone to ensure microbial N mineralization (i.e., ammonification) and nitrification [36]. Moreover, adding organic fertilizer (vegetable and animal-based materials) to GM was found to increase the number of amoA copies, indicating an increase of nitrifier abundance [34,36], but subsequent nitrification rate was not determined.
Managing nutrient availability in GM constituents with organic fertilizers is a question of microbial ecology (i.e., plant–microbes–fertilizer interactions) and thus is difficult to predict compared to mineral fertilization. Past studies dealing with the biological properties of GM lack comprehensive insight on microbial ecology, and the relationships between microbes and organic fertilizer in soilless cropping systems received only recent attention [34,36]. In such organic fertilized systems, plant nutrition will depend on the resulted amount and form of available nutrients from fertilizer mineralization and nitrification mediated by microbes. As a matter of fact, available C is often the most limiting factor for microbial growth in soil, and in some cases, N and P can also be limiting [37]. The availability of C to microbes was also suggested as the main driver of microbial decomposition rates and thus N immobilization in GM [38]. Indeed, the addition of glucose to GM was found to increase microbial activity [39], but the immobilization of N or P can also rapidly occur in GM [27,28,29]. Thus, as microbes in GM seem to have multiple limitations, it is essential to assess microbial activities involved in mineralization processes driving nutrient availability in growing media depending on fertilizer type through an overview of C, N, P, and S cycles.
The aim of this paper was to assess microbial functions in three contrasted materials frequently used as stand-alone growing media (peat, coir, and bark) combined with three different organic fertilizers (horn meal and two different plant-based) that would lead to distinct nutrient availability dynamics. We suspected that GM type with strongly unbalanced stoichiometry ratios would affect the microbial functional response to fertilization. More specifically, we hypothesized that higher C:N, C:P, and C:S (i.e., low N, P, and S content) ratios of a GM type (Table 1) would increase microbial activities through enzyme production to get access to nutrients. In addition, we expected that high fertilizer elemental ratios and recalcitrance (Table 1 and Table S1) would slow down microbial activities and organic matter mineralization rates (N, P, and S releases), limiting thereby nitrification process.
2. Materials and Methods
2.1. Experimental Design and Treatments
A microcosm-scale experiment was designed in order to test interactions between 3 contrasted GM types among the most used in soilless horticulture (peat, coir, and composted bark, called “bark” thereafter) and 3 fertilizer types varying by its origin and chemistry (F1, F2, and Horn meal) (Table 1, Tables S1 and S2). Nutrient availability (ammonium (NH4+-N), nitrate (NO3−-N), phosphate (PO43−-P), and sulfate (SO42−-S)), pH, electrical conductivity (EC), and enzyme activities (β-1.4-glucosidase, urease, acid phosphatase, and arylsulfatase) were monitored over time (after 7, 14, 28, and 56 days).
Physicochemical properties of the GM and fertilizers are indicated in Table 1 and supplemented in Tables S1 and S2. Horn meal is an animal-based and high N fertilizer (13.6% N w:w). F1 and F2 (commercial names are confidential) are two plant-based (including mainly cacao shells, meal of oil-press cake from grape seeds and soy, vinasse) granular fertilizers that are well NPK-balanced (Table 1) but the latter being poorer in nutrient content (NPK 6-1.3-3.3 and 2-0.2-2.1, respectively following commercial values).
Synthetically, a GM sample was weighted to obtain 200 mL using bulk density, which was disposed in a container (12 × 8.5 × 6.5 cm) that was covered with plastic film. Holes in the plastic film allowed air circulation in and out of the container. Samples were pre-incubated during 7 days to allow equilibration at 25 °C and at a water suction of −5 kPa (pF 1.7, ≈60% water-holding capacity (WHC) and 45–50% water-filled pore space (WFPS)), corresponding to optimal conditions for microbial activity [25,40,41]. After this pre-incubation period, GM and fertilizers (applied at 300 mg N L−1 of GM, corresponding to 4.3, 4.8, and 1.6 mg N g−1 dry mass (DM) in peat, coir, and bark, respectively) were mixed together. Treatments consisted of 3 GM types × 4 fertilizer types (including no fertilizer application) × 4 times × 3 replicates for a total of 144 destructive samples. Then, the samples were incubated in the dark during a maximum of 56 days at 25 °C and maintained at 60% of WHC with deionized water. After 7, 14, 28, and 56 days of incubation, 36 samples were retrieved from incubation, homogenized, and sampled for chemical and enzymatic assays. Samples of each GM were also retrieved after pre-incubation (day 0) for initial chemical and enzymatic assays (n = 9).

Table 1.
Physicochemical properties of organic growing media and organic fertilizers (n = 3, mean ± sd). A property with no sd value was measured on a composite sample (i.e., with no replicate).
Table 1.
Physicochemical properties of organic growing media and organic fertilizers (n = 3, mean ± sd). A property with no sd value was measured on a composite sample (i.e., with no replicate).
| Growing Media | Fertilizers | |||||
|---|---|---|---|---|---|---|
| Peat | Coir | Composted Bark | F1 | F2 | Horn | |
| Feedstock nature and origin | Sphagnum dark peat, H5 [42], Ireland | Coconut mesocarp (pith), Sri Lanka | Pinus bark, France | Plant based | Plant based | Animal based |
| Form and size | Fine fractions below 5 mm | Dried granular (<2 mm) | Dried meal (<5 mm) | |||
| Physical properties | ||||||
| Total porosity 1 (%) | 96 ± 0.06 | 96 ± 0.07 | 92 ± 0.05 | - | - | - |
| WHC 2 (%) | 75 ± 1 | 84 ± 2 | 55 ± 1 | - | - | - |
| AFP 3 (%) | 21 ± 1 | 12 ± 2 | 37 ± 0.6 | - | - | - |
| EAW 4 (%) | 33 ± 1 | 45 ± 2 | 17 ± 0.3 | - | - | - |
| Bulk density 5 (g cm−3) | 0.07 ± 0.002 | 0.06 ± 0.0 | 0.18 ± 0.001 | - | - | - |
| Chemical properties | ||||||
| pH 6 (water) | 4 ± 0.06 | 6.5 ± 0.0 | 6.1 ± 0.02 | - | - | - |
| EC 7 (µS cm−1) | 35 ± 0.3 | 75 ± 1.7 | 113 ± 2 | - | - | - |
| CEC 8 (cmol+ kg−1) | 48 | 55 | 50 | - | - | - |
| OM 9 (%) | 98 ± 0.2 | 92 ± 0.3 | 88 ± 0.5 | 78 ± 0.2 | 75 ± 0.1 | 83 ± 0.4 |
| Elemental composition 10,11 (g kg−1 dry mass) | ||||||
| C | 516 ± 5 | 453 ± 13 | 450 ± 0.6 | 401 ± 0.2 | 404 ± 9 | 436 ± 20 |
| N | 9.9 ± 0.1 | 5.8 ± 0.1 | 5.8 ± 0.3 | 72 ± 1 | 32 ± 0.5 | 136.3 ± 5 |
| P | 0.19 | 0.3 | 0.74 | 16 | 5.6 | 26 |
| S | 2.52 | 0.94 | 0.78 | 20 | 20 | 18 |
| C:N ratio | 52 | 78 | 78 | 5.5 | 13 | 3.2 |
| C:P ratio | 2716 | 1512 | 608 | 25 | 72 | 17 |
| C:S ratio | 205 | 482 | 577 | 20 | 20 | 24 |
| N:P ratio | 52 | 19 | 7.8 | 4.4 | 5.6 | 5.3 |
| N:S ratio | 3.9 | 6.2 | 7.4 | 3.6 | 1.5 | 7.4 |
| P:S ratio | 0.08 | 0.32 | 0.95 | 0.82 | 0.27 | 1.4 |
Methods: 1 Total porosity (%, v:v) [43]; 2 WHC: water-holding capacity (%, v:v), 3 AFP: air-filled porosity (%, v:v), and 4 EAW: easy available water (%, v:v) were calculated from water retentions curves [44] determined using a tension table draining at pressure potentials from −1 to −10 kPa [45]; 5 Bulk density (g cm−3) by NF EN 13,040 standard method [46]; 6 pH following NF EN 13,037 standard method [47]; 7 EC: electrical conductivity (µS cm−1) following NF EN 13,038 standard method [48]; 8 CEC: cationic exchange capacity (cmol+ kg−1) using cobaltihexamine trichloride solution [49]; 9 OM: organic matter (% dry mass) by loss of ignition (550 °C, 7 h) [50]; 10 total C and N by dry ignition according to NF ISO 13,878 standard method [51]; and 11 total P and S by ICP-OES [52] in aqua regia.
2.2. Measurement during Incubation
2.2.1. Chemical Analyses
At each sampling date, a 20 mL subsample measured on a weight basis according to bulk density was retrieved from samples (200 mL). The subsample was immediately extracted with 30 mL of deionized water by shaking during 1 h on an orbital shaker (350 rpm); then, it was centrifuged at 4000 rpm during 2 min 30 s, filtered (LAB-ONLINE® ashless filter no.13), and stored at −20 °C before analyses. Extracts were analyzed for ammonium (NH4+-N) and nitrate (NO3−-N) contents by the nitroprusside-salicylate method and nitrosalicylic acid method, respectively [53,54]. Available phosphorus (PO43−-P) was measured with molybdenum blue method [55] and available sulfur (SO42−-S) was measured with turbidimetric analysis (i.e., precipitation of sulfate with barium ions under acid condition) [56,57]. Nutrient contents were expressed as µg of element released per gram dry mass for each treatment. Nutrient availabilities on a volume basis were also added in Supplementary Materials (Figure S1). The pH and EC were analyzed on deionized water extract (GM:water, 1:5 v:v) following AFNOR Standards, NF EN 13,037 [47] and NF EN 13,038 [48], respectively.
2.2.2. Enzyme Activity Assays
Four enzyme activities—β-1.4-glucosidase (β-Glu) hydrolyzing glycoside linkages of cellulose, acid phosphatase (acid-P) releasing phosphoryl groups from various molecules, arylsulfatase (aryl-S) hydrolyzing sulfate esters formed in various molecules, and urease releasing NH4+-N from urea hydrolysis—were performed by colorimetric assays as described by Eivazi and Tabatabai (1988) [58], Tabatabai and Bremner (1969) [59], Tabatabai and Bremner (1970) [60], and Tabatabai and Bremner (1972) [61], respectively.
β-1.4-glucosidase [58], acid phosphatase [59], and arylsulfatase [60] activities were measured by quantifying the amount of p-nytrophenol (pNP) released from enzyme substrates: p-nitrophenyl β–D-glucopyranoside (pNPG; 5 mM), p-nitrophenyl phosphate (pNPP; 5 mM) and p-nitrophenyl sulfate (pNPS; 5 mM) respectively. One mL of enzyme substrate solution (pNPG, pNPP, or pNPS respectively) was added to 0.5 g of sample (fresh mass) and incubated in a water bath at 37 °C in sodium acetate buffer (0.2 M, pH 5) during 60, 30, or 120 min, respectively, depending on the enzyme type. The reaction was stopped by adding 1 mL of 0.5 M CaCl2 and 4 mL of 0.5 M NaOH. The absorbance of the supernatant was measured at 412 nm after filtration (Rotilabo® filter no.601). β-1.4-glucosidase, acid phosphatase, and arylsulfatase activities were expressed as µmol of pNP released per minute and per gram of dry mass. Urease activity [61] was measured by adding urea (20 mM) in acetate sodium solution (pH 6) to a subsample (0.5 g sample fresh mass). The suspension was incubated for 2 h in a water bath at 37 °C and then filtered (Rotilabo® filter no.601). The amount of NH4+-N was quantified in the filtrate following the nitroprusside-salicylate method [54]. Initial amounts of NH4+-N were assayed following the same procedure without urea addition. Urease activity was calculated by subtracting initial amount of NH4+-N from samples incubated with urea and expressed as µmol of NH4+-N released per minute and per gram of dry mass. Enzyme activities on a volume basis were also added in Supplementary Materials (Figure S3).
2.2.3. Statistical Analyses
We analyzed the effects of growing media (GM), fertilizer type (Fert.) over time (Time) with a 3 way-ANOVA (p < 0.05) on pH, electrical conductivity, ammonium, nitrate, phosphate, and sulfate contents, and the four enzyme activities using Statistica 13.0 [62]. Among GM types, mean comparisons between fertilizer types at each time point were tested with Tukey’s HSD (honestly significant difference) test at p < 0.05. Illustrations (Figures 1–3) were drawn using the ggplot2 package [63] in R free software (version 3.5.1) [64].
Effects of GM, Fert., and Time and their interactions on nutrient content and enzyme activities were tested by main and pairwise tests in permutational multivariate analysis of variance (PERMANOVA) using Primer e software v6 (Primer-E Ltd., Plymouth, UK). PERMANOVA is a routine non-parametric analysis for testing the response of many variables to one or more factors, in an ANOVA-like experimental design, on the basis of any resemblance measure, using permutation methods [65]. PERMANOVA eliminates the requirement of normal distribution that must be satisfied for the analysis of variance, but this is not the case for many kinds of multivariate ecological data [66].
Correlation iconography analysis was performed using the software CORICO©. It calculates partial and total correlations between variables as followed [67,68,69,70]:
as a total correlation between the variable A and the variable B, and
as a partial correlation between A and B with regard to a variable C (i.e., after deduction of the contribution of C).
With this method, we selected “remarkable” Pearson correlations between dependent (GM, Fert., and Time) and independent variables (pH, EC, inorganic N, P, and S content and C, N, P, and S enzyme activities). Correlations are “remarkable” when the correlation lasts even if any of the other available variables are kept constant. A link between two variables (A and B) is remarkable if the correlation between them does not result in the dependency to a third variable C. In other words, to avoid redundancy, the link between A and B is “remarkable” if and only if the total correlation between them is higher than a given threshold and if the partial correlation between A and B in respect to any other variable C is also higher in absolute values than this threshold and with the same sign as the total correlation [68]. The threshold is fixed by the user between 0 and 1 as a compromise between clarity of the information needed and the number of links depicted depending on the dataset. Increasing the threshold decreases the number of links but can also decrease the information, especially if the variables of interest depend on the others. A significant correlation between two variables is not necessarily “remarkable” if it is caused by a third one. Considering a single coefficient of Pearson’s correlation does not take into account the context of the link between two variables depending on all other variables. Thus, selecting remarkable correlations is stricter and better represents correlations in the dataset. This method is more stable and robust than factorial analysis (Principal component analysis, Partial least squares regression, etc.), which is weakly affected by the introduction of a new variable in the dataset [68] and does not require a choice of projection [60,61,62,63]. The risk of promoting wrong similarities between observations is very low considering “remarkable” correlation [69]. We conducted this analysis twice. The first one included the independent variables (GM, Fert., and Time) in the correlation calculations to draw links with dependent (pH, EC, nutrients, and enzyme activities) variables at two different thresholds. A threshold of 0.3 was used to underline the most conservative links (i.e., less sensitive to the variation of other variables), and 0.1 was used to depict supplementary links to complete the information given by the first one. Straight lines depict positive links and dotted lines depict the negative ones. We used a second analysis to test if the repartition of individuals was related to our factors (independent variables) by using all dependent variables as representative of individuals. In this analysis, a cluster indicates a greater number of remarkable correlations.
3. Results
3.1. Growing Media and Fertilizer Effects on pH and Electrical Conductivity
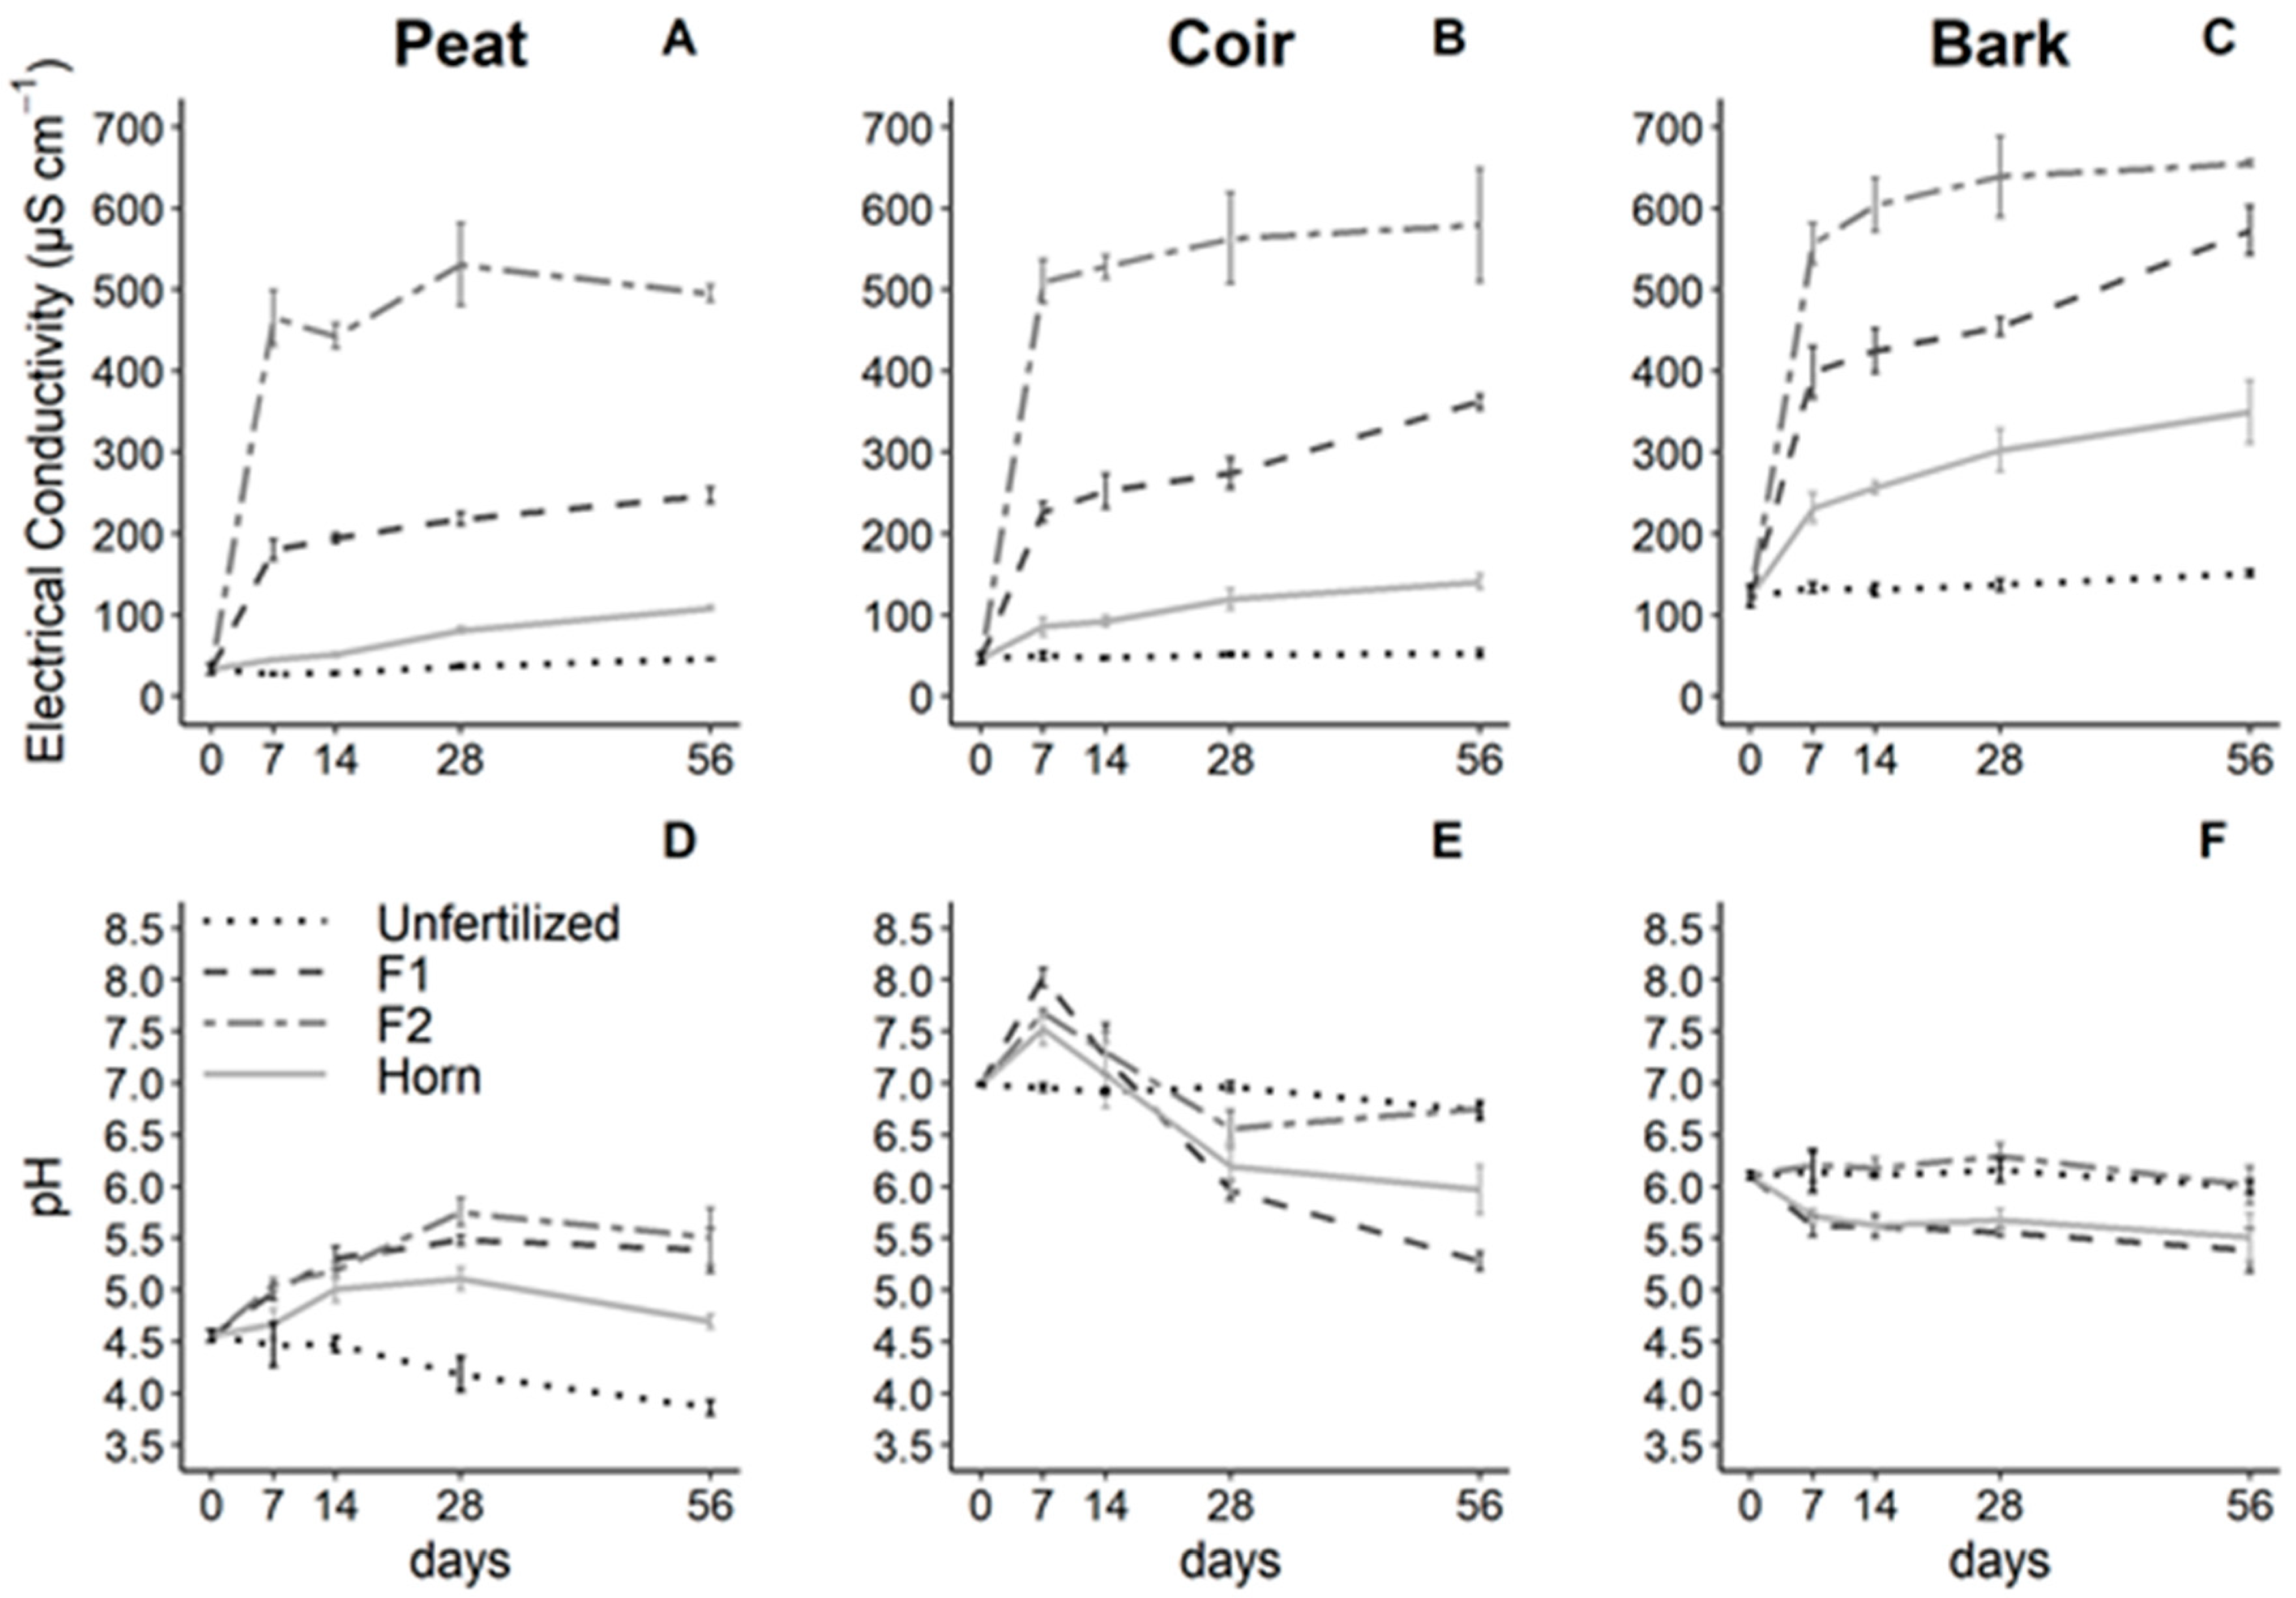
Fertilizer type significantly affected the electrical conductivity (EC) depending on the GM types and whatever the time (GM × Fert. interaction F = 35.1, p < 0.001; Table 2). Indeed, the EC was the highest with F2 (500–600 µS cm−1), intermediate with F1 (200–550 µS cm−1), and the lowest with the horn (100–300 µS cm−1) addition. Moreover, both horn and F1 additions greater increased EC in bark samples compared to coir and peat samples, and F2 similarly increased EC in the three GM types (Figure 1A–C).
Water pH was significantly influenced by the GM, fertilizer types, and time (F = 17.9, p < 0.001, GM × Fert. × Time interaction; Table 2). More specifically, each GM type showed specific dynamics. In peat samples, fertilization increased the pH until 5.5 with F1 and F2, and horn had a weaker effect, whereas the unfertilized sampled lost 0.5 units of pH in 56 days (Figure 1D). In coir samples, the pH increased after fertilization (from 7.0 until 8.0) after 7 days, but then, the pH strongly and continuously decreased below the unfertilized treatment, reaching a pH of 5.3 with F1, 6.0 with horn (25 and 15% lower than control, respectively). F2 was not different from unfertilized samples after 56 days (Figure 1E). In bark samples (Figure 1F), pH did not vary with time and was significantly lower in F1 and horn compared to the unfertilized and F2 treatments.
3.2. Effect of Growing Media and Fertilizer Types on Nutrient Dynamics
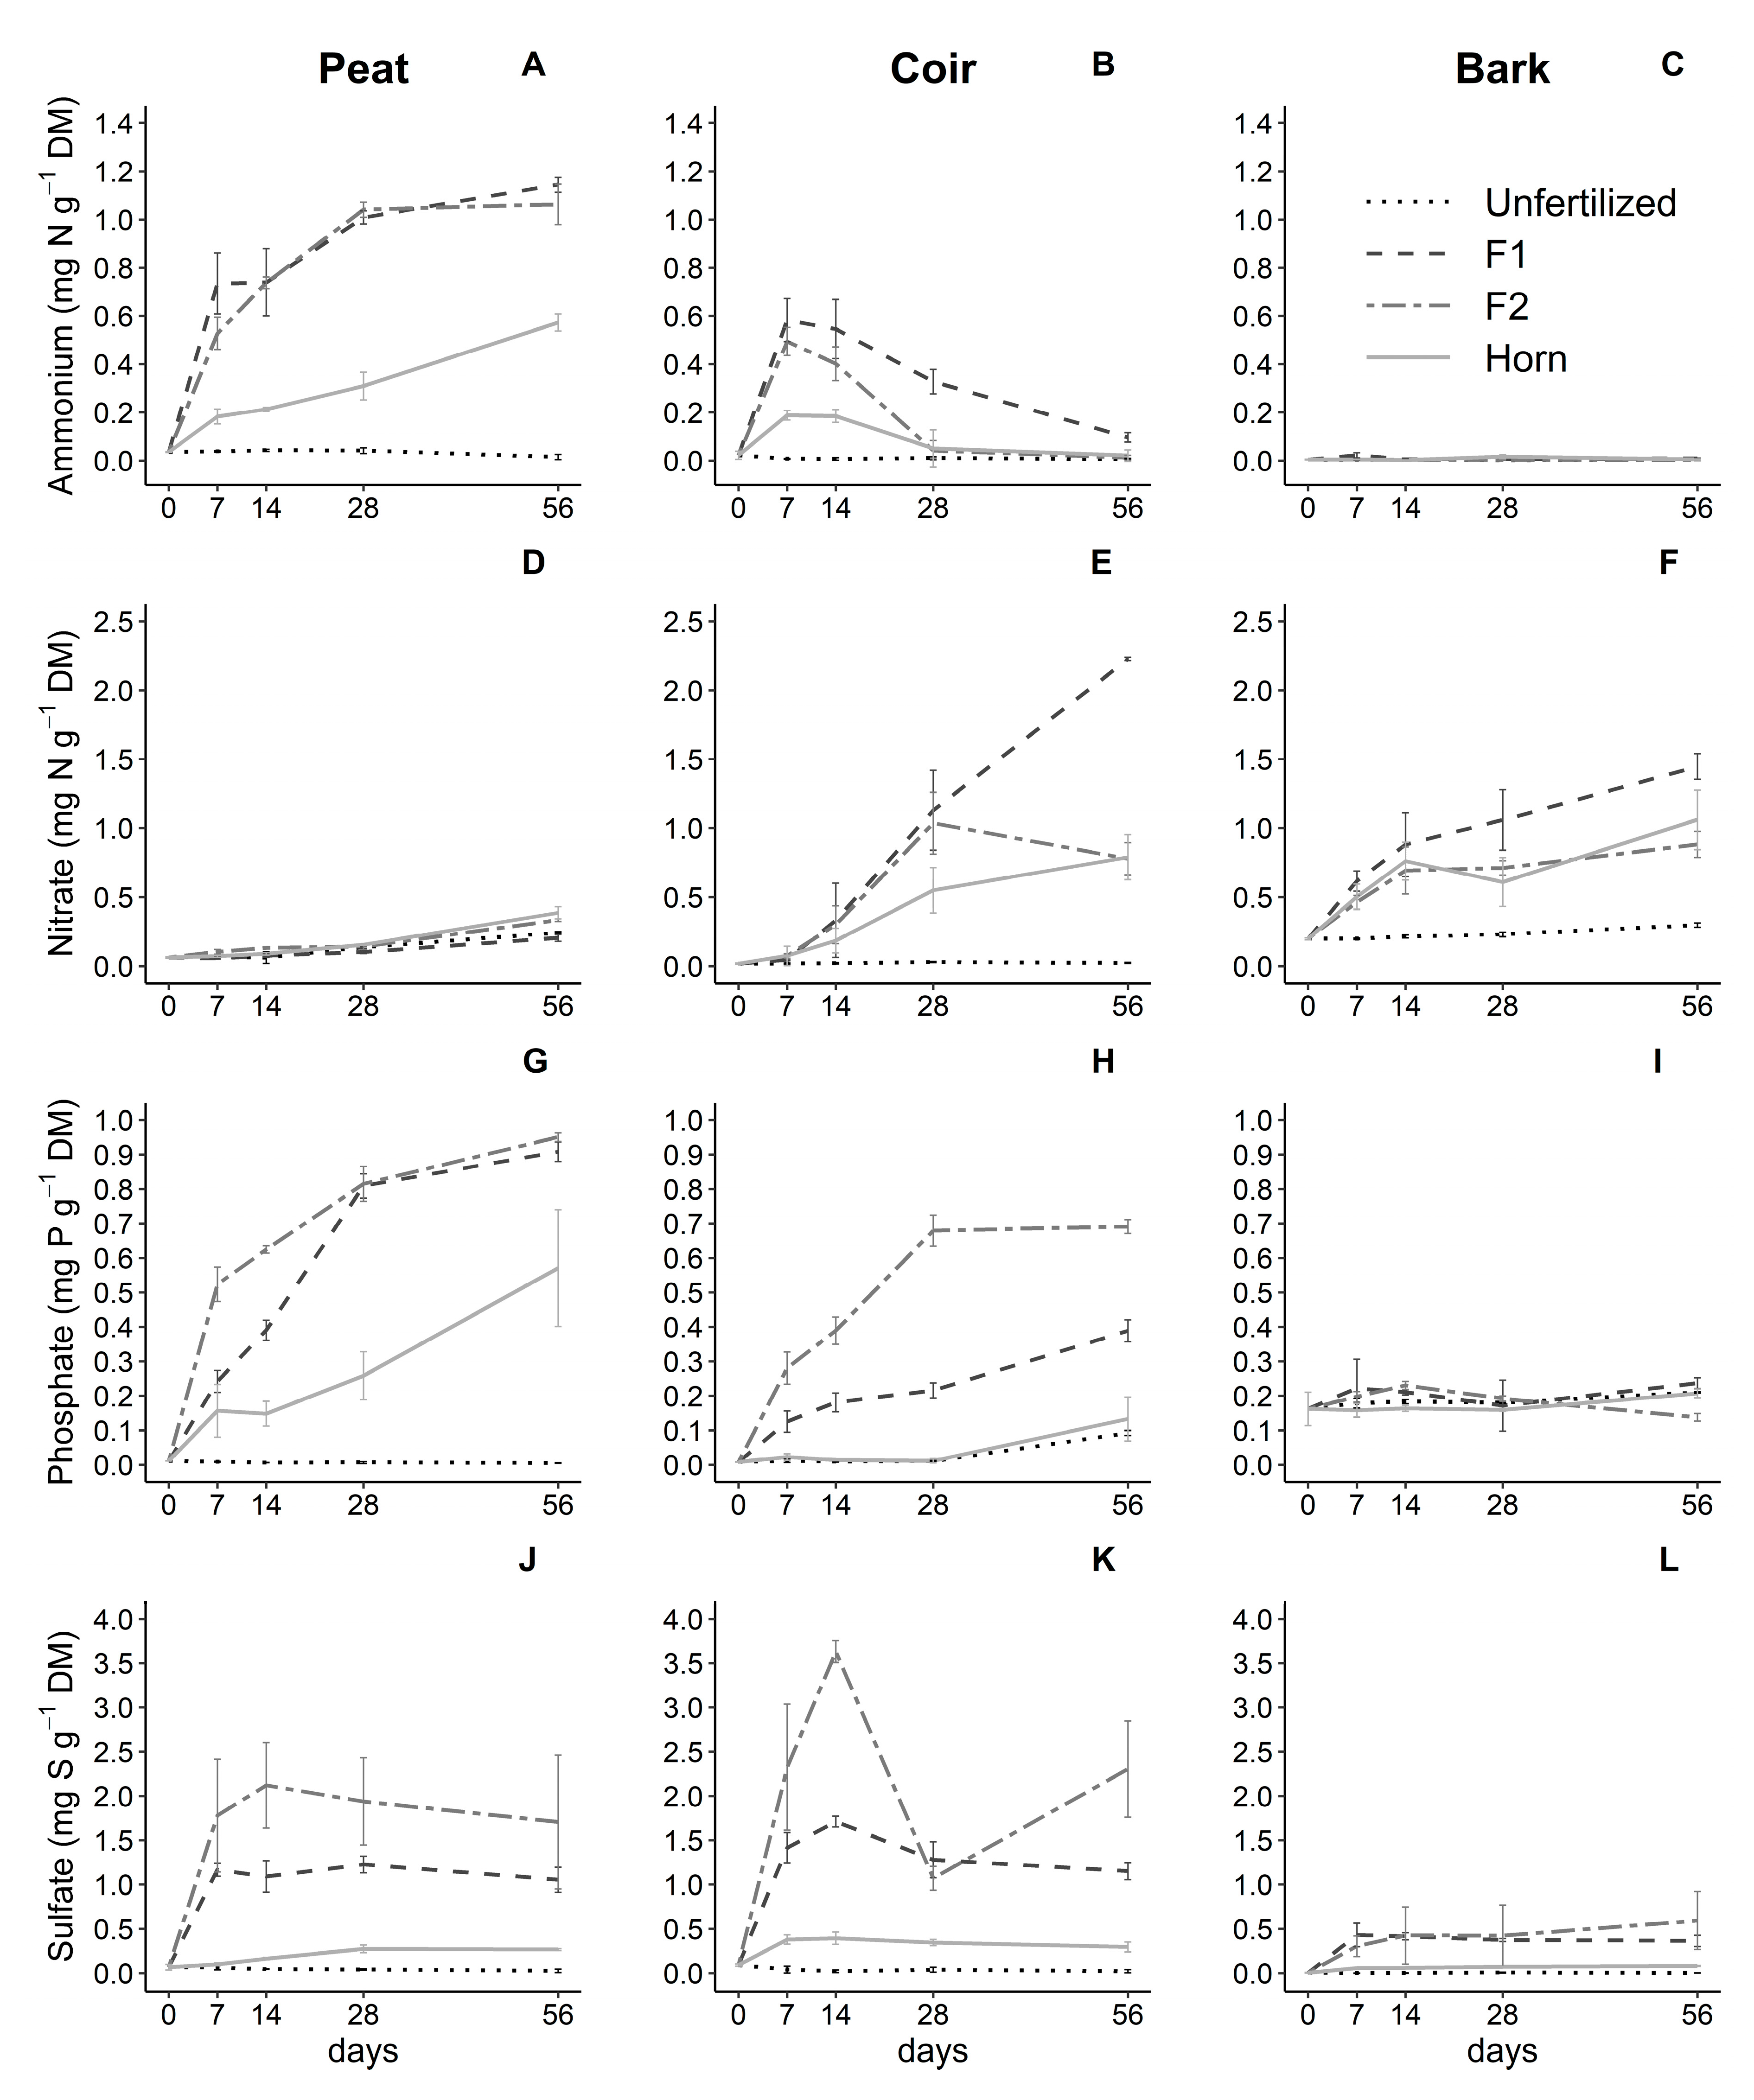
GM, fertilization, and their interactions over time significantly influenced ammonium (NH4+-N), nitrate (NO3−-N), phosphate (PO43−-P), and sulfate (SO42−-S) contents (p < 0.001, Table 2).
More specifically, NH4+-N content in peat samples significantly and strongly increased over time (highest rates at 7 days), reaching 1.1 mg NH4+-N g−1 DM after 56 days with both F1 and F2 (Figure 2A). NH4+-N linearly increased with horn but two times slower, reaching 0.6 mg NH4+-N g−1 DM after 56 days. NH4+-N content did not change from 0 in unfertilized samples (Figure 2A). Peat samples only showed very small levels of NO3−-N content (0.2–0.4 mg NO3−-N g−1 DM) whatever the fertilizer (Figure 2D). The availability of mineral N (sum of NH4+-N and NO3−-N content) reached around 20% of the N added to this GM (Figure S2). In coir samples, NH4+-N content reached a peak at 7 days (0.2–0.6 mg NH4+-N g−1 DM depending on the fertilizer type), stabilized after 14 days, and then decreased by more than 80% during incubation, almost reaching unfertilized samples close to 0 (Figure 2B). These results paralleled with the burst of NO3−-N content reaching 2.5 mg NO3−-N g−1 DM with F1, whereas, with F2, nitrate production was limited by the NH4+-N content, thus decreasing the rate between 28 and 56 days of incubation, reaching a similar level of NO3−-N with horn addition (0.75 mg NO3−-N g−1 DM) (Figure 2E). At 56 days, NO3−-N content was consequently 185% higher with F1 compared to the two others. The sum of NH4+-N and NO3−-N content reached 40% with F1 and a bit more than 10% N added for F2 and Horn (Figure S2). Bark samples did not show changes in NH4+-N content over time (Figure 2C), whereas the NO3−-N content significantly increased over time. The highest level was found with F1 after 56 days (1.4 mg NO3−-N g−1 DM), reaching 60% N added (Figure S2), compared to F2 and horn (0.8 mg NO3−-N g−1 DM). Unfertilized samples maintained a constant level of nitrate (0.3 mg NO3−-N g−1 DM) (Figure 2F).
PO43−-P content increased strongly and significantly in peat samples over time, reaching 0.9 mg PO43−-P g−1 DM for both F1 and F2 reaching 75% P added (Figure S2), being 80% higher than PO43−-P content (0.5 mg PO43−-P g−1 DM) with horn but also reaching nearly 75% P added (being lower than the supply with granular), and it was maintained close to 0 in unfertilized samples (Figure 2G). Coir samples also showed a significant increase in PO43--P content, less sharply, with a fertilization intensity effect in the following order: F2 was about two times higher than F1 being about three times higher than horn, the latter being similar to the unfertilized PO43−-P content (Figure 2H), reaching respectively a bit less than 50, 25, and nearly 0% P added (Figure S2). Bark samples showed almost no contrast of PO43−-P content between treatments (Figure 2I).
SO42−-S content was significantly and consistently higher in peat samples with F2 addition over time (2 mg SO42−-S g−1 DM) corresponding to less than 50% S added (Figure S2), compared to F1 (1 mg SO42−-S g−1 DM) reaching 75% S added (Figure S2), whereas SO42−-S content with horn was four times lower and very weak (0.25 mg SO42−-S g−1 DM) (Figure 2J). Coir observed a burst in SO42−-S content with F2 after 14 days reaching 3.5 mg SO42−-S g−1 DM and 75% S added (Figure S2) but then decreasing by 70% before recovering around 2.5 mg after 56 days. SO42−-S content reached 1.5 mg SO42−-S g−1 DM with F1 (100% S added, Figure S2) and around 0.4 mg SO42−-S g−1 DM with horn (50% S added, Figure S2). SO42−-S content slightly increased with F1 and F2 fertilizers (0.3–0.6 mg SO42−-S g−1 DM) in bark compared to horn and unfertilized treatments (Figure 2L). SO42−-S content was near 0 in the 3 GM types with no fertilization (Figure 2J,K,L). SO42−-S content reached 75% S added with F1 and around 30% S added with F2 and horn (Figure S2).
3.3. Effect of Growing Media and Fertilizer Types on Enzyme Activities
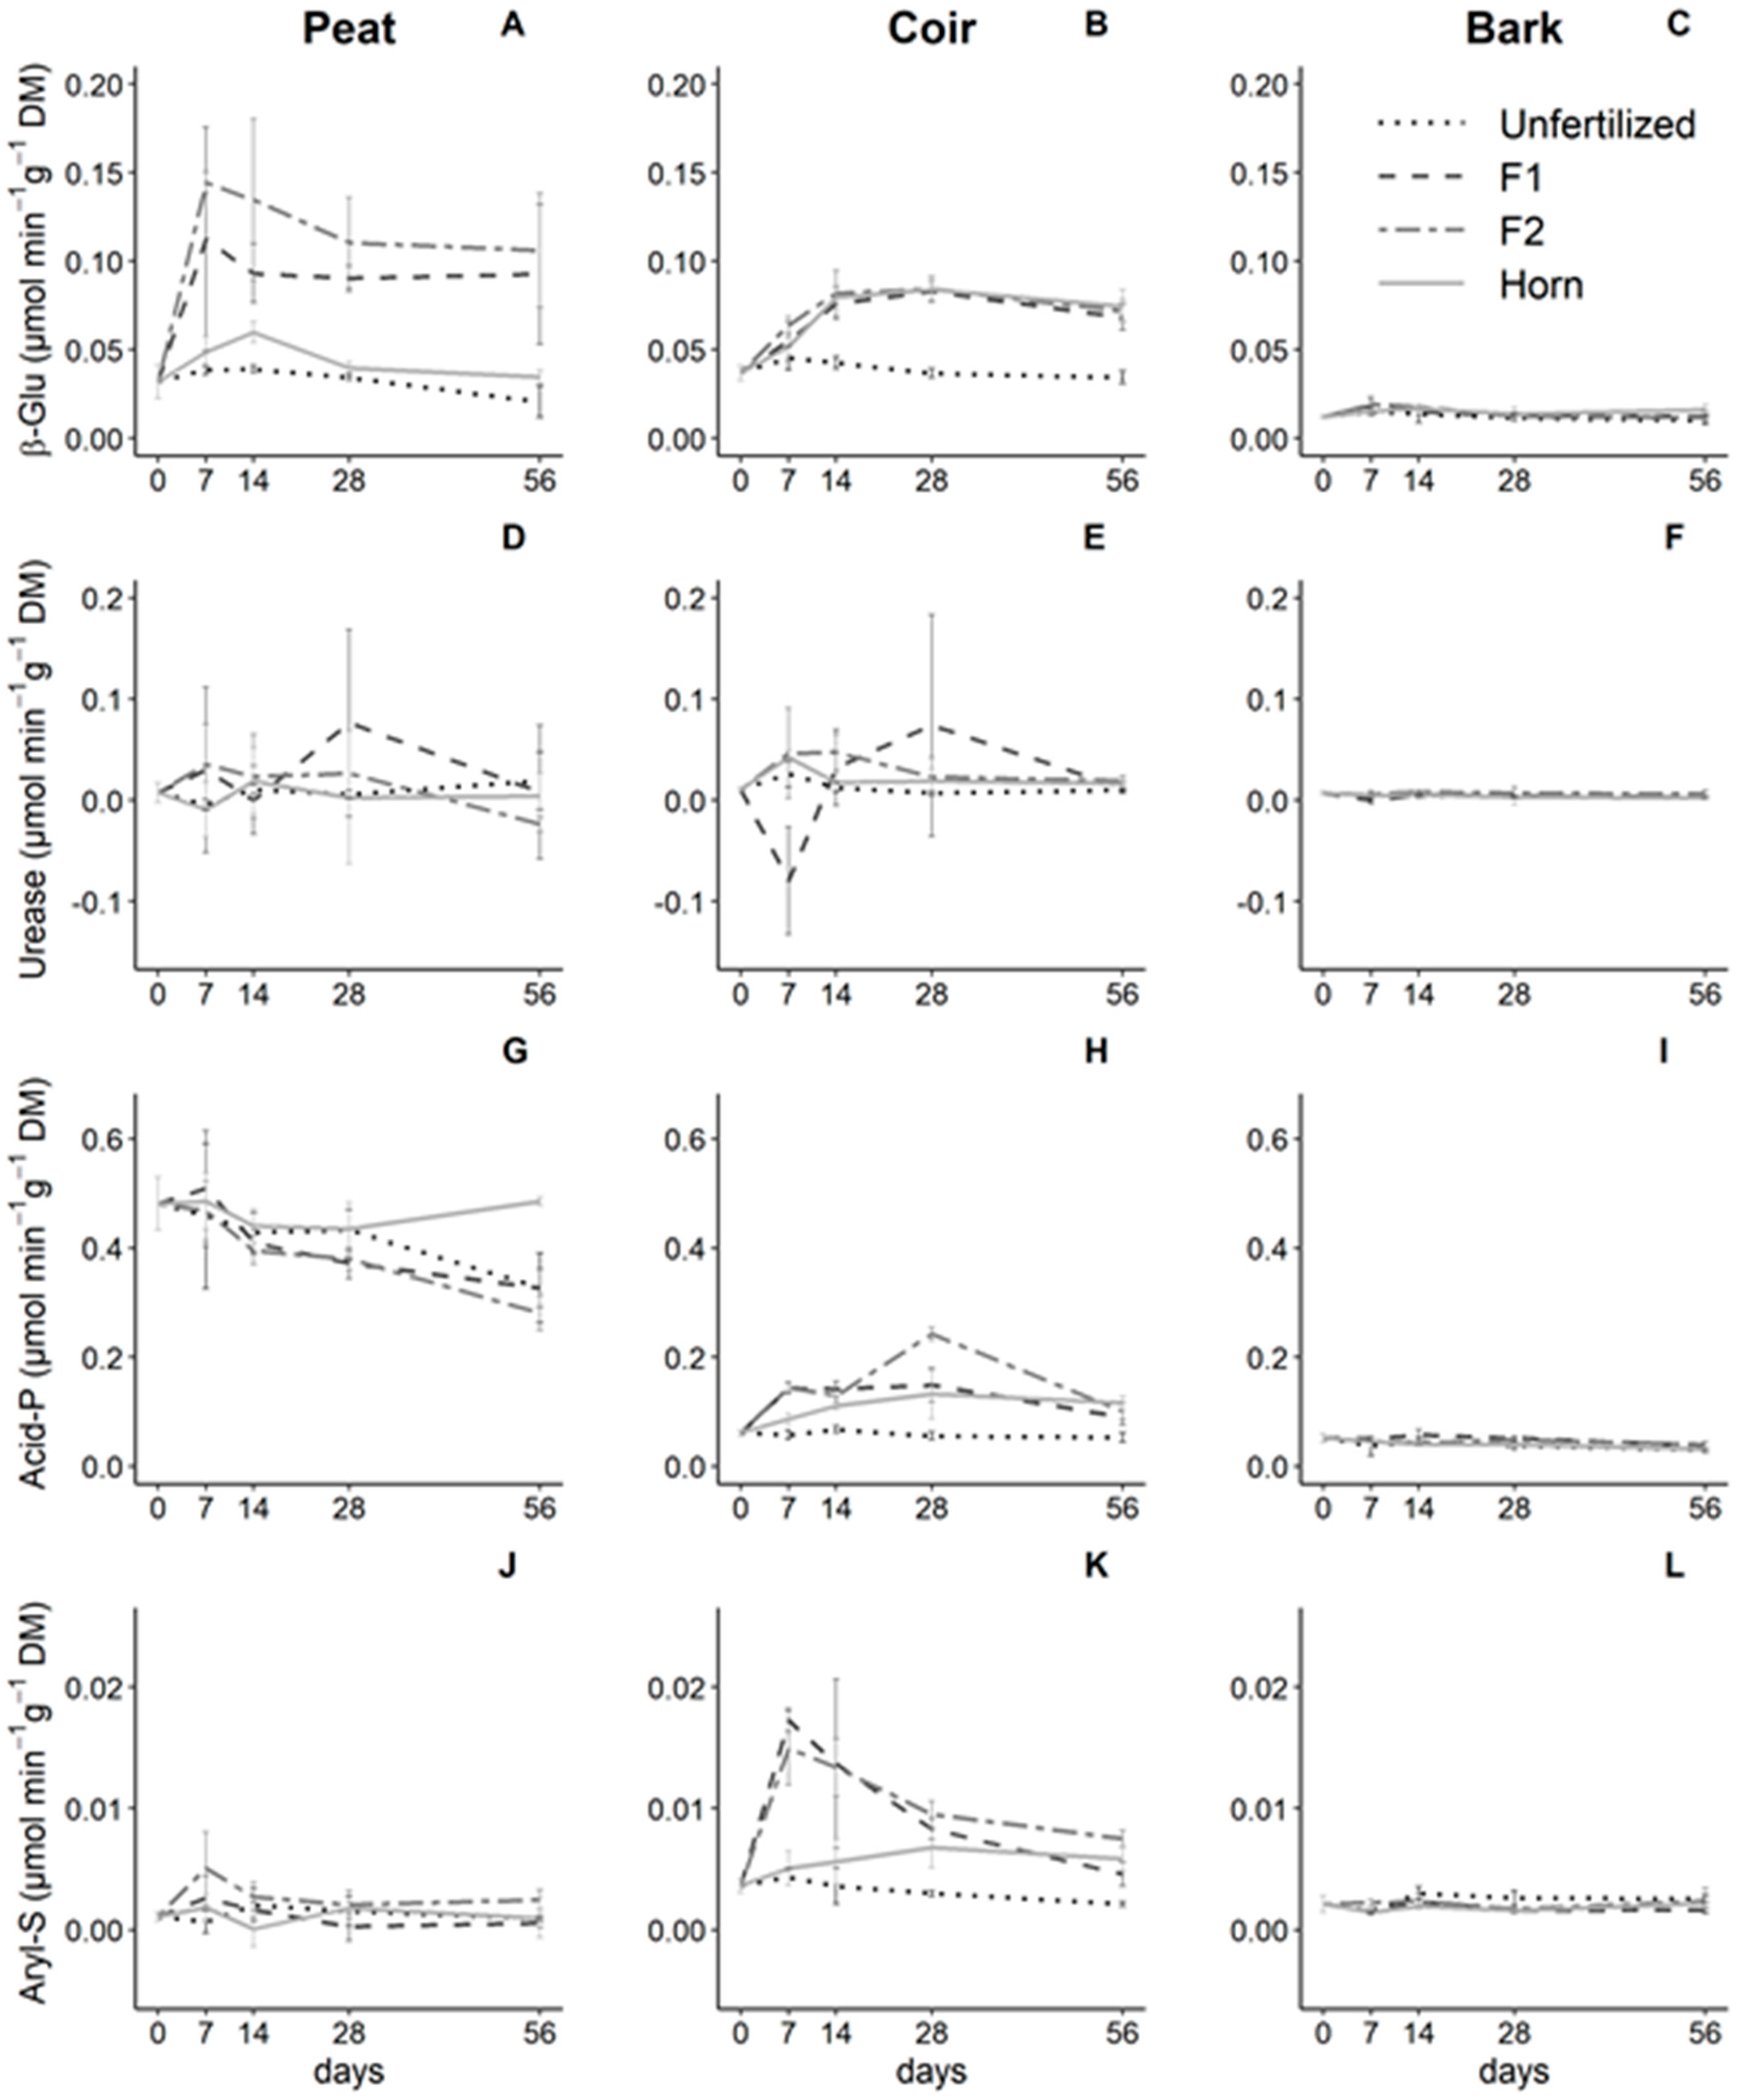
Acid phosphatase (acid-P) and arylsulfatase (aryl-S) activities were affected by GM, fertilizer type, and time (p < 0.05, GM × Fert. × Time interaction, Table 3), while 1,4-β-glucosidase (β-Glu) activity was affected by GM and fertilizer type whatever the time (p < 0.001, GM × Fert. Interaction, Table 3) and urease weekly responded to the experimental design (p < 0.05, Fert. × Time interaction, Table 3).
Except for bark samples that showed no change in the four tested enzyme activities (Figure 3C,F,I,L), we observed specific patterns in peat and coir depending on the enzyme type, the fertilizer, and time. More specifically, acid-P in peat decreased over time even with fertilizer addition except with horn remaining relatively steady (Figure 3G). In coir samples, we observed an increase in acid-P in the three fertilizer types (highest increase with F2) until 28 days of incubation, and then, it stabilized for F1 and horn. Acid-P decreased with F2 until 56 days (Figure 3H). Aryl-S in peat did not change over time nor with fertilization (Figure 3J) but significantly increased after 7 days in coir samples with F1 and F2 and followed by a decrease in activity until the end of the experiment. On the contrary, horn addition increased this activity over time with a least intensity (Figure 3K). The β-Glu in peat strongly increased with F1 and F2 fertilizers and then was maintained steady over time, whereas β-Glu only showed a moderate increase with horn addition (Figure 3A). In coir samples, this activity increased consistently and steadily whatever the fertilizer type (Figure 3B).
3.4. Multivariate and Correlation Analyses between Nutrient Releases and Enzyme Activities
We ran a permutational analysis of variance (PERMANOVA) to statistically test and synthesize the behavior of the GM types combined with different fertilizers (Fert.) over time (Time) on pH, electrical conductivity (EC), nutrient contents, and enzymes activities. This analysis indicated a significant (p < 0·001) main effect of the three factors (Pseudo-F = 51.7, 12.2, and 4.3 for GM, Fert., and Time, respectively) and its interactions at level 2. Indeed, GM × Fert. was the most significant and interesting interaction (Pseudo-F = 2.84, p < 0.001), whereas Time was not significant when considered with other factors (Pseudo-F = 0.51, p > 0.05). Pairwise tests indicated for each GM type that horn was significantly different to F1 and F2, with F1 inducing the highest changes (p < 0.001), but it was not significantly different to F2.
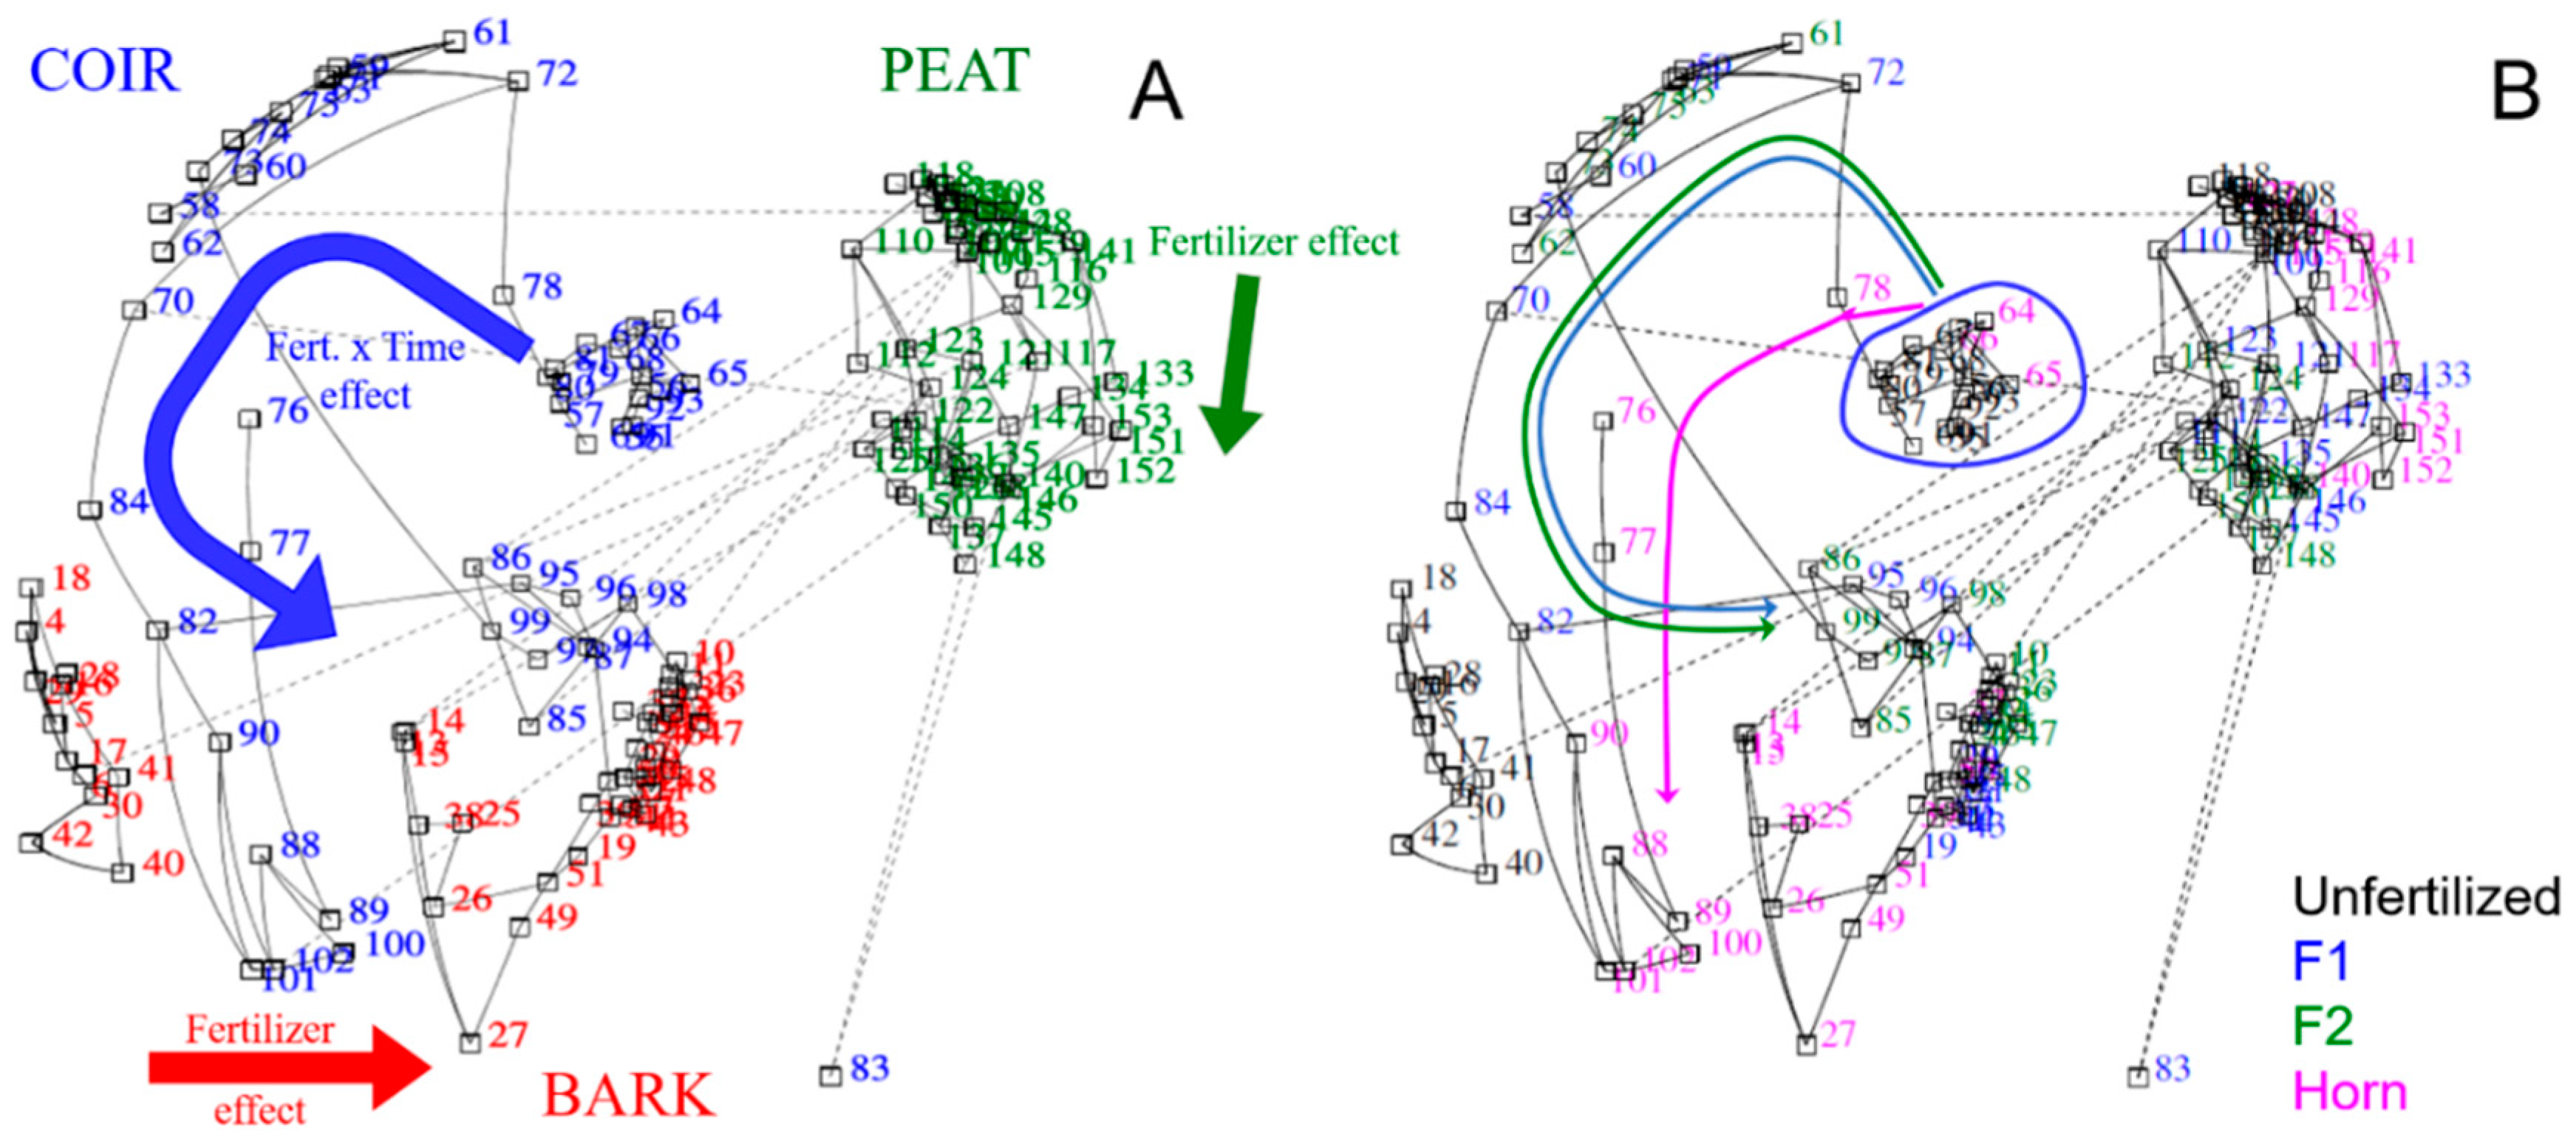
Iconography of correlations on individuals depicted the contrasts between GM types (Figure 4A): Indeed, the strongest differences were found between peat (right side) being far from coir and bark (left side). We also observed a significant effect of fertilizer type depending on the GM type (Figure 4A,B). In bark, fertilized treatments were separated from unfertilized treatment with a gradient: Horn is the closest to unfertilized treatment and F2 is the farthest. Peat weakly responded to F1 and F2 fertilizer, and except for a few individuals, horn was hardly different from unfertilized treatment. In coir, the effect of fertilizers seemed dependent on time (even if we did not find this interaction with PERMANOVA, see above). Indeed, horn depicted several groups according to the time effect (magenta arrow) differentiating from F1 and F2 (blue and green arrows), both starting from a first group (blue circle, Figure 4B) including unfertilized and horn after 7 days.
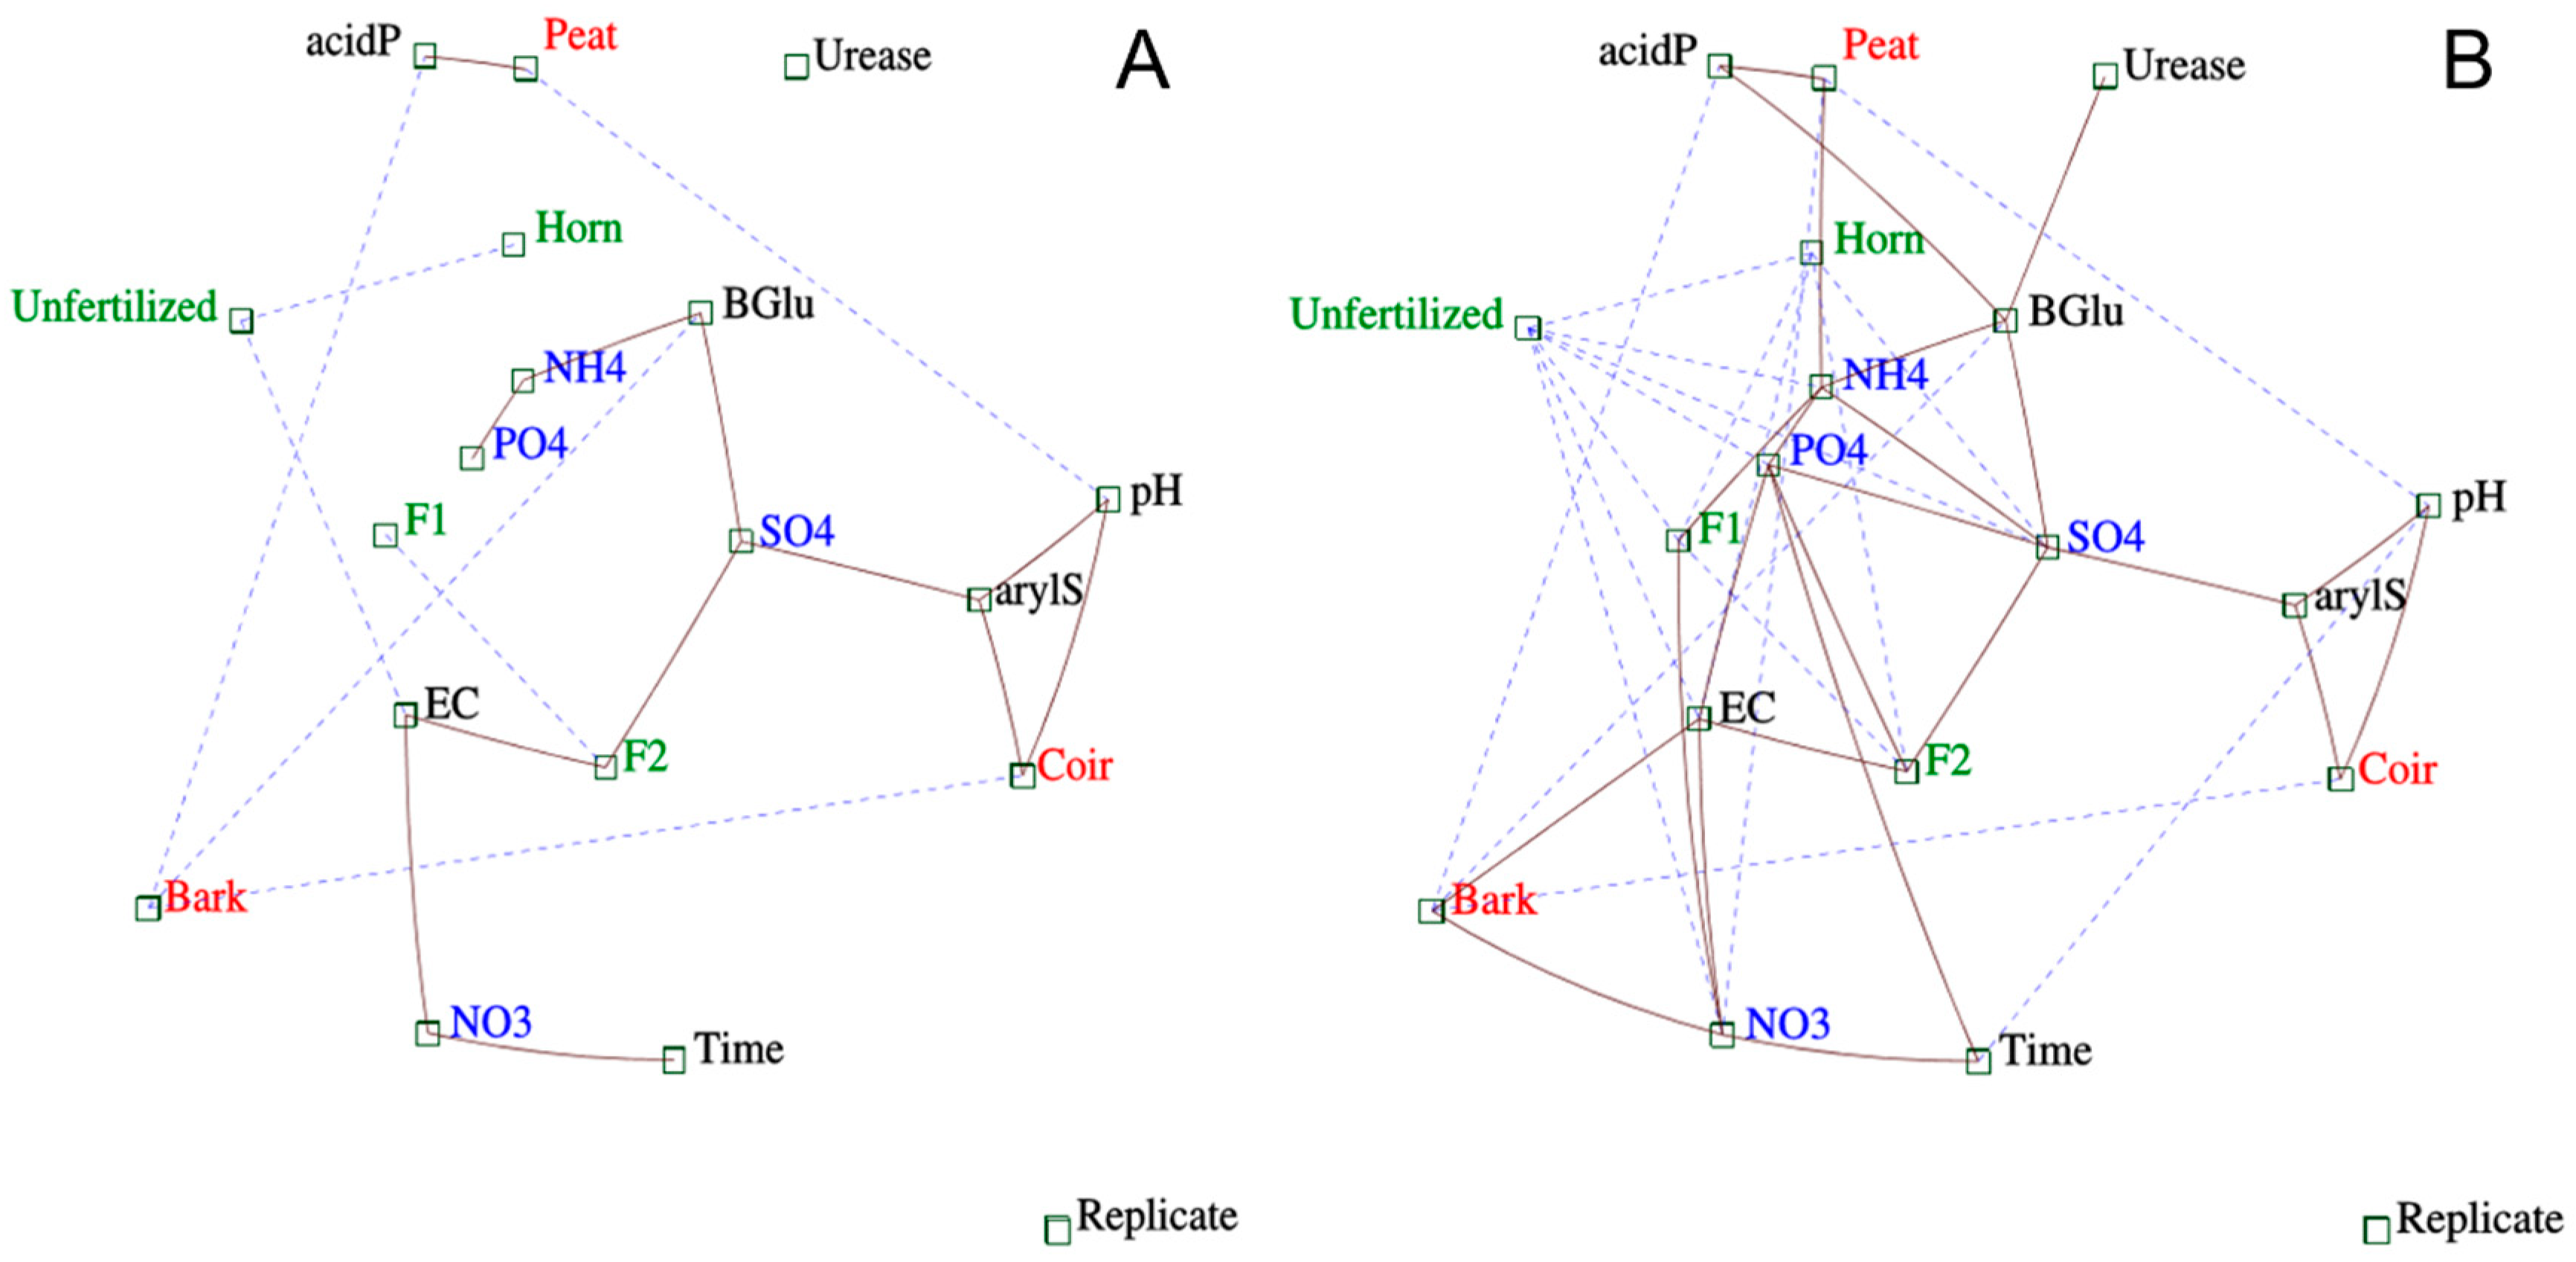
A second iconography of correlations focusing on both independent and dependent variables showed which dependent variables were mostly influenced by GM types (threshold of 0.3, Figure 5A). Indeed, peat differentiated to other GM types by the highest acid phosphatase levels and pH (i.e., lowest levels), bark discriminated to the others by the β-Glu and acid-P as the lowest levels, and coir revealed the highest levels of aryl-S and pH. For fertilizer types, F2 showed the strongest links with SO42−-S content and EC (i.e., highest levels). We also detected relationships between dependent variables such as β-Glu strongly and positively related to SO42−-S and NH4+-N contents, the latest being correlated to PO43−-P content. Aryl-S positively correlated with SO42−-S and pH. NO3−-N content was also strongly related to EC and time. At a lower threshold (i.e., 0.1 depicting links with more dependency on other variables but still remarkable), more relationships appeared (Figure 5B). Peat correlated with NH4+-N content, while bark correlated with EC and NO3−-N content. F2 correlated with PO43−-P, SO4−-S contents, and EC. F1 was related to NH4+-N and NO3−-N content. Unsurprisingly, unfertilized treatment correlated with the lowest values of nutrient contents and EC. Concerning dependent variables, an iconography of correlations indicated positive relationships between nutrient contents from organic matter mineralization (i.e., NH4+-N, PO43−-P, and SO42−-S linked all together) as well as β-Glu to other enzyme activities (urease and acid-P).
4. Discussion
4.1. Nutrient Availability from Fertilizer Mineralization Is Driven by the GM Type
Organic fertilizer mineralization is recognized as primarily controlled by humidity and temperature that were kept constant and supposedly optimal [40,41] in our experiment. Indeed, water content between 50 and 70% of the water-holding capacity (WHC) is known to be an optimal air–water equilibrium for aerobic microbes [71] and supporting enzymatic functions providing energy and nutrients for microbial respiration and growth. In the current study, we maintained the three GM at pF 1.7 (≈60% of WHC and 45–50% WFPS) corresponding to a closely air content of 51 ± 1% of total pores spaces (v:v). Thus, water and dioxygen were assumed to be optimal, and the significance of GM impacts was mainly attributed to the biological and/or chemical properties of the GM types.
Microbes convert organic N compounds (e.g., –NH2 or –NH) into inorganic forms by ammonification releasing mostly nitrogen as NH4+-N in solution (very little is in NH3-N form at our pH conditions). Thus, ammonification uses H+ and releases OH- from water, increasing the pH of the solution (Figure 1). Especially, peat strongly accumulated ammonium content due to weak nitrification (Figure 2). This special link between peat and pH was indeed confirmed by the iconography of correlations (Figure 5A,B). Then, ammonium oxidation by AOB and/or AOA and nitrite oxidation by NOB through nitrification produce two times more protons (acidifying effect) than ammonification. It has to be noticed that nitrification is thus limited by NH4+-N content and can slow down if ammonification intensity decreases or nitrification is faster. Thus, the balance between ammonification and nitrification processes would be a decrease in pH where nitrification was strongly active such as in coir and bark mostly with F1 fertilizer and also horn at a lower intensity. On the contrary, F2 fertilizer did not sustain an increase in nitrification after 28 days in coir (ammonium availability limiting the process, Figure 2B,E) and then resulted in a neutral effect on pH, confirming a very sharp link between N cycle and pH in GM. Moreover, nitrifier’s activities highly depend on pH conditions being optimal at 7.5–8 [14]. Thus, organic fertilization stimulating nitrification could in turn create acidic conditions unfavorable to their survival, if nitrate is not taken up by plant roots [15]. During the plant production phase, root uptake would produce OH− balancing acid/alkali conditions. In production, there is a need to manage N transformations and especially slowing down nitrification at an early stage of the plant growth (low nutrient demand), avoiding losses by lixiviation and/or denitrification. This can be achieved by controlling ammonification with a mixing of GM types or managing nitrifier’s activities by decreasing pH (best at pH 7.5–8 ± 2 units) and thus nitrification.
The burst in electrical conductivity (EC) after fertilization is classically monitored in horticulture and is considered as a risk inducing plant damages or death and can be controlled with a well-known behavior of organic fertilizer or irrigation in case of critical salinity [72]. Thus, buffering the burst of nutrient availability is very important and can strongly depend on the GM properties. The cation exchange capacity (CEC) indicates how many nutrients, mostly cations (e.g., Ca, Mg, K, Na, NH4, etc.), can be stored by adsorption in the GM (i.e., on the negative charges). The pH is indicative of how much the CEC is filled by these nutrients, an acidic pH revealing a non-saturated CEC where most of available exchange sites are filled with protons [73,74]. The CEC of a GM can exceed 96 cmol + kg−1, but since CEC is expressed on a weight basis and GM have a low bulk density (more than 10 times lower than soil), the GM capacity to retain cation is low [74] (Table 1). In this study, the three GM types were similar in terms of CEC (Table 1), indicating no potential differences for buffering nutrient release, as revealed by similar changes in EC increasing after fertilization (Figure 1) driven by fertilizer type (F2 > F1 > horn). Indeed, coir and bark had saturated CEC with mostly Ca2+ (Table S1). Only peat, presenting a non-saturated CEC (48 cmol + kg−1 and 65% saturated, Table S1) due to its very acidic pH (pH = 4), slightly attenuated the increase in EC under the influence of fertilization (Figure 1D), the latter releasing nutrients and replacing protons on the negative charges of the solid phase. Anions such as phosphates or sulfates may rapidly be available for plant and microbes and can increase EC and salinity [74]. Our results were consistent with a high accumulation of these anions (Figure 2), but other ions not monitored in this study can also contribute to the increase of EC. Moreover, the capacity to retain anions is very low in GM [1] generally containing little native aluminium, iron, or calcium, bridging them to the adsorbent complex [74]. It is also possible that precipitation occurs in GM at low pH (e.g., iron or aluminium with phosphates) or on the contrary under alkaline conditions (e.g., calcium with phosphates). Precipitation was probably weakly involved in nutrient availability with our range of pH (Figure 1D–F), being optimal for nutrient availability [74].
4.2. The Role of Fertilizer’s Biochemical Composition on Nutrient Availability
Usually, C:N and C:P ratios are a good predictor of N and P mineralization/immobilization [75,76]. Consequently, a faster release of N and P was expected with F1 compared to F2 (Figure 2) due to higher C:N and C:P ratios of F2 compared to F1 (Table 1). This was confirmed with coir and partially with peat. In peat, ammonification was not affected by F1 and F2 chemistry (Figure 2A), but in coir, F2 seemed to slow down ammonification rates after 14 days (F1 > F2; Figure 2B) with a direct negative feedback on nitrate production. In bark, only the C:N ratio seemed to induce feedback control with faster nitrification with F1 (not visible with ammonification near 0).
We showed in the current study that horn is a very interesting organic fertilizer in terms of nutrient supply with no burst effect and the response intensity depends, as hypothesized, on the GM type. Despite the lowest C:N and C:P ratios, horn induced the weakest releases of nutrient as hypothesized (Figure 2) mainly due to its physical (high density material and hard fibers) and chemical recalcitrance necessitating the protein depolymerization of keratin (i.e., proteins) (Table S1) by microbes [77,78,79]. Horn does not only contain nitrogen, as frequently stated, but it does contain other nutrients necessary for plants and microbes such as P, among many others (Table 1; Table S1) with typical dynamics depending on the GM type (Figure 2). Thus, its mineralization needs to be considered into organic fertilizer formulations and should be added as a slow N release compared to granular.
The two granular fertilizers increased EC much higher than horn, but overall, they were only barely reaching the second class of risk in salinity according to Durand’s classification [80]. Basil was successfully grown in the similar conditions (unpublished data), indicating that the dose of fertilizer used in this study, on a professional recommendation basis (N = 300 mg L−1 of GM), was well established (first negative effects were observed from 600 mg L−1 and mortality above 900 mg L−1, unpublished data). Thus, the nutrient content ratios and biochemistry of fertilizers are important to consider as long as the GM type modulates the microbial response to fertilization.
4.3. Enzyme Activities Are Driven by the GM Type
When organic resources are added to a growing media usually limited by nutrients, one can expect that microbes would transform it in available nutrients for their metabolism. However, an elemental composition of organic resources rarely meets the elemental demand of microbes. Thus, microbes can produce specific extracellular enzymes to achieve its resource demand and regulate their element use efficiency by releasing nutrients in excess [32] that benefit other organisms such as plants. Thus, the stoichiometry of organic resources should be considered regarding the stoichiometry of microbial biomass (C:N:P around 42:6:1 and 60: 7:1) [81,82] constrained by a highly stressful environment.
C-to-nutrient (N, P or S) ratios of GM types (Table 1 and Table S1) are indeed much higher compared to microbial stoichiometry [36] and in our study particularly regarding P (C:P ratio of 2716, 1512, and 608 for peat, coir, and bark, respectively). According to evolutionary–economic theory, investment (i.e., nutrient allocation and energy) into the enzyme synthesis of microbes is controlled by targeted nutrient availability and should be directed toward mining for scarce elements [83]. In the nutrient-limited conditions of GM, we showed a strong effect of the organic fertilizer directly linked to C:N:P:S ratios and biochemistry (Table 1 and Table S1) on microbial enzyme activities [84] depending on the GM type. Fertilizer addition can increase labile organic carbon stimulating microbial growth and activities [85]. Enzyme activities involved in C, P, or S acquisition increased in coir (only partially in peat) after organic fertilizer addition, following economic theory [86]. This would imply that enzyme production is induced to reach greater resource acquisition. Organic fertilization stimulated the 1.4-β-glucosidase activity, NH4+-N, PO43−-P, and SO42−-S releases and were remarkably linked (Figure 5A) together after F1 and F2 addition, specifically in peat and coir (Figure 2A,B,J,K). Especially, the increase of N availability is known to stimulate C-acquiring enzymes as 1.4-β-glucosidase activity [86,87]. However, enzyme activities did not systematically increase with organic fertilization (no increase at all for bark), but nutrient content increased, thus making it difficult to link enzymes to nutrient availability, as also recently reported by Guerra et al. (2018) [88] in a mix of coir fiber and composts. If enzyme substrates are not available, microbes do not strongly regulate enzyme production, or enzyme costs are low enough to allow continuous production [86]. This would corroborate more complex relationships and that numerous types of enzymes and different regulation pathways are involved [35,86]. These complex relationships could be analyzed by an iconography of correlations that consider the links between all variables without simplifying the information (Figure 4 and Figure 5).
4.4. Remarkable Relationships between Enzyme Activities and Nutrient Availabilities in Each Growing Media
In our study, microbial enzyme activities were greater related to GM type and/or nutrient availabilities (especially NH4+-N and SO42−-S) than fertilizer type itself, as shown by the iconography of correlation (Figure 4 and Figure 5). One exception concerned urease activity. High available N can repress urease production and thus the activity as reported previously [89,90] and could explain the low sensitivity of this measure in our study for all the GM types.
Peat was especially linked to acid phosphatase activity highlighted by the iconography of correlations (Figure 5A). Margalef et al. (2017) [91] reported in a meta-analysis that phosphatase activities were better predicted by N availability rather than P, reflecting an increase in P needs (i.e., allocation of N toward P-acquiring enzyme). After N fertilization, P can become limiting for microbial growth [91]. The high acid phosphatase activity over the experiment (Figure 3G) could be inherited from peat bog presenting a huge C:P ratio (Table 1). Indeed, peatland is renowned for high phosphatase activity (0.78 µmol min−1 g−1 on average), indicating P rather than N limitations under these conditions [91]. This high level of activity might have been sufficient in our experiment to ensure complex molecule decomposition and P mineralization in a peat sample. Moreover, a microbial need for C might have exceeded the need for P, as suggested by increasing P availability throughout the experiment, which was previously reported for P-poor soil [92]. Then, the resulting high availability of P after 14 days with F1 and F2 could have repressed acid phosphatase activity, explaining the decreasing trend over time except with horn (Figure 3G). In this latter case, the slower release of PO43−-P could explain the steady level of this activity until the end of incubation (Figure 3G).
Bark was negatively correlated with enzyme activities (Figure 5A,B), being low but detectable and steady throughout the experiment (Figure 3C,F,I,L). These weak activities and investment in enzyme productions in bark samples might indicate the presence of labile organic compounds, containing the carbon and nutrients need for microbial growth [90]. Indeed, the synthesis of enzymes represents an important investment in energy for microbes and might not be always necessary [86]. Composted barks rich in polysaccharides as well as free mono and disaccharides favored an active, indigenous, and varied population of microorganisms [1,11], which are even active without any fertilization (unpublished data). Carlile and Dickinson (2004) [26] indicated a higher dehydrogenase activity and basal respiration compared to peat. Thus, microbes in bark might be more initially limited by nutrients than C, as revealed by low NH4+-N (limiting nitrification) and PO43−-P (Figure 3C,I,K). Microbes are also prone to store in their biomass limiting elements [93], adjusting their own stoichiometric ratios. For instance, C can be stored as lipids and glucan [32], and P can be immobilized as polyphosphates in bacteria cells [94,95]. The immobilization of S in microbial biomass [96] might also explain lower S availability in bark (Figure 3K). A shift in the microbial community structure (and thus biomass stoichiometry) may also generate stoichiometric plasticity to microbial communities and adaptivity to resource type [32]. Organic fertilizer mineralization that occurred (i.e., increasing NO3−-N and SO42−-S) might also be explained by other pathways involving different enzymes than the ones investigated here [35].
In coir, weak initial available nutrients and enzyme activities could reveal C and nutrient limitation for microbes and a need to invest into enzyme production [86], which benefits the outweighed costs in C and N necessary for protein synthesis [32]. This was consistent with the slower N and P mineralization that we observed in this GM. Furthermore, the iconography of correlations depicted an interaction between fertilizer type and time (Figure 4A,B), reflecting dynamics of enzyme and nutrient releases as dependent on fertilizer type (i.e., slower with horn vs. F1 and F2). A remarkable relationship with arylsulfatase activity was highlighted by the iconography of correlation (Figure 5A), its dynamics differing strongly in coir compared to other GM (Figure 3J,K,L). Arylsulfatase production is affected by microbial composition and is not necessarily dependent on available S. Some microbes can produce arylsulfatase independently of S availability, while other sulfate-starving microbes can successively induce their production and then repress it when S availability is high [97]. In our study, we could suspect the latter case of a repressive effect of sulfate on this activity in coir samples, where we discovered a decrease in this activity after 7 days (Figure 3K) subsequently due to the high release of sulfate for F1 and F2 (Figure 2K). The decrease in pH might also be a factor of influence (Figure 5A) as depicted by a positive correlation between pH and this activity as also previously reported for soil [98,99].
5. Conclusions
Our study provides evidence that GM chemical and biological properties drive N mineralization and nitrification after organic fertilization and consequently the amount of nutrients and their forms potentially available for plant uptake. Ammonification is not a limited process in our GM types, but nitrification is limited in peat because of the acidic pH. The microbial communities of each GM responded differently to organic fertilization expressed by both different enzymatic strategies and nutrient release patterns. Although we expected a strong relationship between enzyme activity and the related nutrient availability, our results suggested that enzyme activities in GM might not be strictly stimulated or repressed by nutrient availability but can also result from a constitutive production or a decoupled regulation. An iconography of correlations allowed us to highlight the particularity of each GM compared to the others. Peat was specifically related to ammonium accumulation due to weak nitrification and high acid phosphatase activity, which was probably inherited from peat bog and a strong C:P ratio. On the other hand, bark presented weak enzyme activities, but a strong nitrification capacity; however, this was limited by the ammonium content. Coir had an intermediate profile regarding mineralization processes but also showed a repressive arylsulfatase activity due to high sulfate content and a decrease in pH. Mixing different GM types seems a promising way to optimize microbial functions and thus N-P-S availabilities. This hypothesis needs to be tested, as the physicochemical properties will change in mixes, affecting microbial communities and functions.
Furthermore, fertilizer chemistry modulated mineralization rates and influenced enzyme strategy at some points. Iconography highlighted especially the high release of anions and high EC induced by F2 addition. F1 seemed to provide more suitable conditions for N release as ammonium in peat, as nitrate in bark, and both in coir. Overall, N being the most limiting element in GM, its status has to be managed carefully. Indeed, mining for N can induce a risk of salt toxicity for roots due to an excessive release of other nutrients. Further studies on microbial functions related to N and C cycles (and their interactions) with a wider range of N- and C-related enzymes (e.g., proteases) as well as microbial catabolism (i.e., actual activity) would provide additional clues for better understanding nutrient mineralization in GM.
Supplementary Materials
The following are available online at https://www.mdpi.com/2073-4395/10/12/1955/s1, Table S1: Additional chemical information on growing media and fertilizers. Table S2: Chemical properties on growing media on volume basis. Figure S1: Effect of growing media and fertilizer types on nutrient availability over time as expressed on a volume basis (mg N, P, or S per L DM). Figure S2: Effect of growing media and fertilizer types over time on nitrogen, phosphorus, and sulfur availability as expressed as a percentage of respective supply (% N, P, S added). Figure S3: Effect of growing media and fertilizer types on enzyme 1.4-β-glucosidase (β-Glu), urease, acid phosphatase (Acid-P), and arylsulfatase (Aryl-S) activities, over time, as expressed on volume basis (µmol min−1 L−1 DM).
Author Contributions
Conceptualization, L.P., L.H.-T., P.C. and R.G.; methodology, L.P., L.H.-T., P.C. and R.G.; validation, L.H.-T., P.C. and R.G.; formal analysis, L.P. and R.G.; investigation, L.P. and R.G.; resources, F.B.; writing—original draft preparation, L.P. and R.G.; writing—review and editing, L.P., L.H.-T., P.C. and R.G.; visualization, L.P. and R.G.; supervision, L.H.-T., P.C. and R.G.; project administration, L.P. and P.C.; funding acquisition, L.H.-T., P.C. and R.G. All authors have read and agreed to the published version of the manuscript.
Funding
This research was funded by Premier Tech GHA firm and the French national association of research and technology (Association Nationale de la Recherche et de la Technologie, ANRT) (CIFRE 2017/0752).
Acknowledgments
We are thankful to the following people for their help during the experiment: Maelys Sautel (Master’s internship), Enora Le Romancer (undergraduate student), both Claudie Mazzega and Yvette Barraud-Roussel (technicians from EPHor research unit). We also thank Michel Lesty for CORICO analyses and his guidance for interpretations.
Conflicts of Interest
The funders had no role in the design of the study; in the collection, analyses, or interpretation of data; in the writing of the manuscript, or in the decision to publish the results.
References
- Carlile, W.R.; Raviv, M.; Prasad, M. Organic Soilless Media Components. In Soilless Culture, 2nd ed.; Raviv, M., Lieth, J.H., Bar-Tal, A., Eds.; Elsevier: Boston, MA, USA, 2019; pp. 303–378. ISBN 978-0-444-63696-6. [Google Scholar]
- Zulfiqar, F.; Allaire, S.E.; Akram, N.A.; Méndez, A.; Younis, A.; Peerzada, A.M.; Shaukat, N.; Wright, S.R. Challenges in organic component selection and biochar as an opportunity in potting substrates: A review. J. Plant Nutr. 2019, 42, 1386–1401. [Google Scholar] [CrossRef]
- Bohlin, C.; Holmberg, P. Peat: Dominating growing medium in swedish horticulture. In Proceedings of the International Symposium on Growing Media and Hydroponics, Alnarp, Sweden, 8 September 2001; Acta Horticulturae. International Society for Horticultural Science (ISHS): Leuven, Belgium, 2004; Volume 644, pp. 177–181. [Google Scholar]
- Gruda, N.S. Increasing Sustainability of Growing Media Constituents and Stand-Alone Substrates in Soilless Culture Systems. Agronomy 2019, 9, 298. [Google Scholar] [CrossRef] [Green Version]
- Carlile, B.; Coules, A. Towards sustainability in growing media. In Proceedings of the International Symposium on Growing Media, Composting and Substrate Analysis, Barcelona, Spain, 21 October 2011; Acta Horticulturae. International Society for Horticultural Science (ISHS): Leuven, Belgium, 2013; Volume 1013, pp. 341–349. [Google Scholar]
- Blok, C. Growing media for food and quality of life in the period 2020–2050. In Acta Horticulturae; International Society for Horticultural Science (ISHS): Leuven, Belgium, 2020. (In press) [Google Scholar]
- Clarke, D. The wise use of peat in horticulture. In Proceedings of the the International Symposium on Growing Media, Angers, France, 4 September 2005; Acta Horticulturae. International Society for Horticultural Science (ISHS): Leuven, Belgium, 2008; Volume 779, pp. 161–164. [Google Scholar]
- Barrett, G.E.; Alexander, P.D.; Robinson, J.S.; Bragg, N.C. Achieving environmentally sustainable growing media for soilless plant cultivation systems—A review. Sci. Hortic. 2016, 212, 220–234. [Google Scholar] [CrossRef] [Green Version]
- Burnett, S.E.; Mattson, N.S.; Williams, K.A. Substrates and fertilizers for organic container production of herbs, vegetables, and herbaceous ornamental plants grown in greenhouses in the United States. Sci. Hortic. 2016, 208, 111–119. [Google Scholar] [CrossRef] [Green Version]
- Treadwell, D.D.; Hochmuth, G.J.; Hochmuth, R.C.; Simonne, E.H.; Davis, L.L.; Laughlin, W.L.; Li, Y.; Olczyk, T.; Sprenkel, R.K.; Osborne, L.S. Nutrient management in organic greenhouse herb production: Where are we now? Horttechnology 2007, 17, 461–466. [Google Scholar] [CrossRef] [Green Version]
- Carlile, W.R.; Wilson, D.P. Microbial activity in growing media—A brief review. In Proceedings of the II Symposium on Horticultural Substrates and their Analysis, XXIII IHC, Guernsey–Firenze, UK–Italy, 10 September 1990; Acta Horticulturae. International Society for Horticultural Science (ISHS): Leuven, Belgium, 1991; Volume 294, pp. 197–206. [Google Scholar]
- Caldwell, B.A. Enzyme activities as a component of soil biodiversity: A review. Pedobiologia 2005, 49, 637–644. [Google Scholar] [CrossRef]
- Prosser, J.I.; Nicol, G.W. Archaeal and bacterial ammonia-oxidisers in soil: The quest for niche specialisation and differentiation. Trends Microbiol. 2012, 20, 523–531. [Google Scholar] [CrossRef] [Green Version]
- Prosser, J.I. Autotrophic Nitrification in Bacteria. In Advances in Microbial Physiology; Rose, A.H., Tempest, D.W., Eds.; Elsevier: Boston, MA, USA, 1990; Volume 30, pp. 125–181. [Google Scholar]
- Norton, J.; Ouyang, Y. Controls and Adaptive Management of Nitrification in Agricultural Soils. Front. Microbiol. 2019, 10. [Google Scholar] [CrossRef] [Green Version]
- Hoitink, H.; Boehm, M. Biocontrol within the context of soil microbial communities: A substrate-dependent phenomenon. Annu. Rev. Phytopathol. 1999, 37, 427–446. [Google Scholar] [CrossRef]
- Montagne, V.; Capiaux, H.; Cannavo, P.; Charpentier, S.; Renaud, S.; Liatard, E.; Grosbellet, C.; Lebeau, T. Protective effect of organic substrates against soil-borne pathogens in soilless cucumber crops. Sci. Hortic. 2016, 206, 62–70. [Google Scholar] [CrossRef] [Green Version]
- Fascella, G.; Mammano, M.M.; D’Angiolillo, F.; Pannico, A.; Rouphael, Y. Coniferous wood biochar as substrate component of two containerized Lavender species: Effects on morpho-physiological traits and nutrients partitioning. Sci. Hortic. 2020, 267, 109356. [Google Scholar] [CrossRef]
- Lévesque, V.; Rochette, P.; Ziadi, N.; Dorais, M.; Antoun, H. Mitigation of CO2, CH4 and N2O from a fertigated horticultural growing medium amended with biochars and a compost. Appl. Soil Ecol. 2018, 126, 129–139. [Google Scholar] [CrossRef]
- Domeño, I.; Irigoyen, I.; Muro, J. Comparison of traditional and improved methods for estimating the stability of organic growing media. Sci. Hortic. 2011, 130, 335–340. [Google Scholar] [CrossRef]
- Aendekerk, T.G.L. Decomposition of peat substrates in relation to physical properties and growth of chamaecyparis. In Proceedings of the International Symposium Growing Media and Plant Nutrition in Horticulture, Freising, Germany, 2 September 1996; Acta Horticulturae. International Society for Horticultural Science (ISHS): Leuven, Belgium, 1997; Volume 450, pp. 191–198. [Google Scholar]
- Prasad, M. Physical, chemical and biological properties of coir dust. In Proceedings of the International Symposium Growing Media and Plant Nutrition in Horticulture, Freising, Germany, 2 September 1996; Acta Horticulturae. International Society for Horticultural Science (ISHS): Leuven, Belgium, 1997; Volume 450, pp. 21–30. [Google Scholar]
- Naasz, R.; Michel, J.C.; Charpentier, S. Microbial respiration and its consequences on oxygen availability in peat substrate. In Proceedings of the International Symposium on Growing Media, Angers, France, 4 September 2005; Acta Horticulturae 779. International Society for Horticultural Science (ISHS): Leuven, Belgium, 2008; Volume 779, pp. 91–96. [Google Scholar]
- Verhagen, J.B.G.M. Stability of growing media from a physical, chemical and biological perspective. In Proceedings of the International Symposium on Growing Media, Nottingham, UK, 2–8 September 2007; Acta Horticulturae. International Society for Horticultural Science (ISHS): Leuven, Belgium, 2009; Volume 819, pp. 135–142. [Google Scholar]
- Montagne, V.; Charpentier, S.; Cannavo, P.; Capiaux, H.; Grosbellet, C.; Lebeau, T. Structure and activity of spontaneous fungal communities in organic substrates used for soilless crops. Sci. Hortic. 2015, 192, 148–157. [Google Scholar] [CrossRef]
- Carlile, W.R.; Dickinson, K. Dehydrogenase as an indicator of microbial activity in growing media. In Proceedings of the International Symposium on Growing Media and Hydroponics, Alnarp, Sweden, 8 September 2001; Acta Horticulturae. International Society for Horticultural Science (ISHS): Leuven, Belgium, 2004; Volume 644, pp. 517–523. [Google Scholar]
- Handreck, K.A. Rapid assessment of the rate of nitrogen immobilisation in organic components of potting media: I. Method development. Commun. Soil Sci. Plant Anal. 1992, 23, 201–215. [Google Scholar] [CrossRef]
- Handreck, K.A. Rapid assessment of the rate of nitrogen immobilisation in organic components of potting media: II. Nitrogen drawdown index and plant growth. Commun. Soil Sci. Plant Anal. 1992, 23, 217–230. [Google Scholar] [CrossRef]
- Handreck, K.A. Phosphorus immobilization in wood waste-based potting media. Commun. Soil Sci. Plant Anal. 1996, 27, 2295–2314. [Google Scholar] [CrossRef]
- Plante, A.F.; Stone, M.M.; McGill, W.B. The Metabolic Physiology of Soil Microorganisms. In Soil Microbiology, Ecology and Biochemistry, 4th ed.; Paul, E.A., Ed.; Elsevier: Boston, MA, USA, 2015; pp. 245–272. ISBN 978-0-12-415955-6. [Google Scholar]
- Sinsabaugh, R.L.; Lauber, C.L.; Weintraub, M.N.; Ahmed, B.; Allison, S.D.; Crenshaw, C.; Contosta, A.R.; Cusack, D.; Frey, S.; Gallo, M.E.; et al. Stoichiometry of soil enzyme activity at global scale. Ecol. Lett. 2008, 11, 1252–1264. [Google Scholar] [CrossRef]
- Mooshammer, M.; Wanek, W.; Zechmeister-Boltenstern, S.; Richter, A. Stoichiometric imbalances between terrestrial decomposer communities and their resources: Mechanisms and implications of microbial adaptations to their resources. Front. Microbiol. 2014, 5. [Google Scholar] [CrossRef] [Green Version]
- Burns, R.G.; DeForest, J.L.; Marxsen, J.; Sinsabaugh, R.L.; Stromberger, M.E.; Wallenstein, M.D.; Weintraub, M.N.; Zoppini, A. Soil enzymes in a changing environment: Current knowledge and future directions. Soil Biol. Biochem. 2013, 58, 216–234. [Google Scholar] [CrossRef]
- Grunert, O.; Robles-Aguilar, A.A.; Hernandez-Sanabria, E.; Schrey, S.D.; Reheul, D.; Labeke, M.-C.V.; Vlaeminck, S.E.; Vandekerckhove, T.G.L.; Mysara, M.; Monsieurs, P.; et al. Tomato plants rather than fertilizers drive microbial community structure in horticultural growing media. Sci. Rep. 2019, 9, 1–15. [Google Scholar] [CrossRef] [PubMed]
- Nannipieri, P.; Giagnoni, L.; Renella, G.; Puglisi, E.; Ceccanti, B.; Masciandaro, G.; Fornasier, F.; Moscatelli, M.C.; Marinari, S. Soil enzymology: Classical and molecular approaches. Biol. Fertil. Soils 2012, 48, 743–762. [Google Scholar] [CrossRef]
- Grunert, O.; Reheul, D.; Van Labeke, M.; Perneel, M.; Hernandez-Sanabria, E.; Vlaeminck, S.E.; Boon, N. Growing media constituents determine the microbial nitrogen conversions in organic growing media for horticulture. Microb. Biotechnol. 2016, 9, 389–399. [Google Scholar] [CrossRef] [PubMed] [Green Version]
- Aldén, L.; Demoling, F.; Bååth, E. Rapid Method of Determining Factors Limiting Bacterial Growth in Soil. Appl. Environ. Microbiol. 2001, 67, 1830–1838. [Google Scholar] [CrossRef] [PubMed] [Green Version]
- Thomas, M.B.; Spurway, M.I.; Stewart, D.P.C. A review of factors influencing organic matter decomposition and nitrogen immobilisation in container media. In The International Plant Propagators’ Society Combined Proceedings; The International Plant Propagators’ Society: Carlisle, PA, USA, 1999; Volume 48, pp. 66–71. [Google Scholar]
- Van Gerrewey, T.; Ameloot, N.; Navarrete, O.; Vandecruys, M.; Perneel, M.; Boon, N.; Geelen, D. Microbial activity in peat-reduced plant growing media: Identifying influential growing medium constituents and physicochemical properties using fractional factorial design of experiments. J. Clean. Prod. 2020, 256, 120323. [Google Scholar] [CrossRef]
- Thuriès, L.; Larré-Larrouy, M.-C.; Pansu, M. Evaluation of three incubation designs for mineralization kinetics of organic materials in soil. Commun. Soil Sci. Plant Anal. 2000, 31, 289–304. [Google Scholar] [CrossRef]
- Voroney, R.P.; Heck, R.J. The Soil Habitat. In Soil Microbiology, Ecology, and Biochemistry, 4th ed.; Paul, E.A., Ed.; Elsevier: Boston, MA, USA, 2015; pp. 14–40. ISBN 978-0-12-415955-6. [Google Scholar]
- Von Post, L. Sveriges Geologiska Undersöknings torvinventering och några av dess hittills vunna resultat. Svenska mosskulturföreningens tidskrift 1922, 36, 1–27. [Google Scholar]
- Bunt, A.C. Physical properties of mixtures of peats and minerals of different particle size and bulk density for potting substrates. In Proceedings of the International Symposium on Substrates in Horticulture other than Soils In Situ, Barcelona, Spain, 28 August 1983; Acta Horticulturae. International Society for Horticultural Science (ISHS): Leuven, Belgium, 1984; Volume 150, pp. 143–154. [Google Scholar]
- Caron, J.; Parent, L.E.; Elrick, D.E.; Michel, J.C.; Naasz, R. Physical properties of organic soils and growing media: Water and air storage and flow dynamics. In Soil Sampling and Methods of Analysis, 2nd ed.; Carter, M.R., Gregorich, E.G., Eds.; CRC Press: Boca Raton, FL, USA, 2008; pp. 885–912. ISBN 978-0-8493-3586-0. [Google Scholar]
- AFNOR Amendements du Sol et Supports de Culture—Détermination des Propriétés Physiques—Masse Volumique Apparente Sèche, Volume D’air, Volume d’eau, Valeur de Rétraction et Porosité Totale. NF EN 13041. U44-307. 2000. Available online: https://www.boutique.afnor.org/normes (accessed on 10 March 2018).
- AFNOR Amendements Organiques et Supports de Culture—Préparation des Echantillons Pour les Essais Physiques et Chimiques, Détermination de la Teneur en Matière Sèche, du Taux D’humidité et de la Masse Volumique Compactée en Laboratoire. NF EN 13040. U44-306. 2000. Available online: https://www.boutique.afnor.org/normes (accessed on 10 March 2018).
- AFNOR Amendements du Sol et Supports de Culture—Détermination du pH. NF EN 13037. U44-308. 2000. Available online: https://www.boutique.afnor.org/normes (accessed on 10 March 2018).
- AFNOR Amendements du Sol et Supports de Culture—Détermination de la Conductivité Electrique. NF EN 13038. U44-309. 2000. Available online: https://www.boutique.afnor.org/normes (accessed on 10 March 2018).
- AFNOR Qualité du Sol—Determination de la Capacité D’échange Cationique (CEC) Effective et des Cations Echangeables à L’aide D’une Solution de Trichlorure de Cobaltihexammine. NF EN ISO 23470. X31-440. 2011. Available online: https://www.boutique.afnor.org/normes (accessed on 10 March 2018).
- AFNOR Amendements du Sol et Supports de Culture—Détermination de la Teneur en Matieres Organiques. NF EN 13039. U44-304. 2000. Available online: https://www.boutique.afnor.org/normes (accessed on 10 March 2018).
- AFNOR Qualité du Sol—Détermination de la Teneur Totale en Azote par Combustion Sèche. NF ISO 13878. X31-418. 1998. Available online: https://www.boutique.afnor.org/normes (accessed on 10 March 2018).
- AFNOR Qualité de L’eau—Dosage D’éléments Choisis par Spectroscopie D’émission Optique avec Plasma Induit par Haute Fréquence (ICP-OES). NF EN ISO 11885. T90-136. 2009. Available online: https://www.boutique.afnor.org/normes (accessed on 10 March 2018).
- Keeney, D.R.; Nelson, D.W. Nitrogen—Inorganic Forms. In Methods of Soil Analysis. Part 2. Chemical and Microbiological Properties, 1st ed.; Page, A.L., Ed.; Agronomy Monographs; Soil Science Society of America, Inc.: Madison, WI, USA, 1982; pp. 643–698. ISBN 0-89118-072-9. [Google Scholar]
- Mulvaney, R.L. Nitrogen—Inorganic Forms. In Methods of Soil Analysis: Part 3, Chemical Methods; Sparks, D.L., Page, A.L., Helmke, P.A., Loeppert, R.H., Soltanpour, P.N., Tabatabai, M.A., Johnson, C.T., Sumner, M.E., Eds.; SSSA Book Series No. 5; American Society of Agronomy, Inc.: Madison, WI, USA, 1996; pp. 1123–1184. ISBN 978-0-89118-825-4. [Google Scholar]
- Murphy, J.; Riley, J.P. A modified single solution method for the determination of phosphate in natural waters. Anal. Chim. Acta 1962, 27, 31–36. [Google Scholar] [CrossRef]
- Tabatabai, M.A. A Rapid Method for Determination of Sulfate in Water Samples. Environ. Lett. 1974, 7, 237–243. [Google Scholar] [CrossRef]
- Sörbo, B. Sulfate: Turbidimetric and nephelometric methods. In Methods in Enzymology; Sulfur and Sulfur Amino Acids; Elsevier: Boston, MA, USA, 1987; Volume 143, pp. 3–6. [Google Scholar]
- Eivazi, F.; Tabatabai, M.A. Glucosidases and galactosidases in soils. Soil Biol. Biochem. 1988, 20, 601–606. [Google Scholar] [CrossRef]
- Tabatabai, M.A.; Bremner, J.M. Use of p-nitrophenyl phosphate for assay of soil phosphatase activity. Soil Biol. Biochem. 1969, 1, 301–307. [Google Scholar] [CrossRef]
- Tabatabai, M.A.; Bremner, J.M. Arylsulfatase Activity of Soils. Soil Sci. Soc. Am. J. 1970, 34, 225–229. [Google Scholar] [CrossRef]
- Tabatabai, M.A.; Bremner, J.M. Assay of urease activity in soils. Soil Biol. Biochem. 1972, 4, 479–487. [Google Scholar] [CrossRef]
- TIBCO Software Inc. Statistica (Logiciel D’analyse des Données), 13 ed.; 2017; Available online: http://statistica.io (accessed on 10 July 2019).
- Wickham, H. Ggplot2: Elegant Graphics for Data Analysis; Springer: New York, NY, USA, 2016; ISBN 978-3-319-24277-4. Available online: https://ggplot2.tidyverse.org (accessed on 10 July 2019).
- R Core Team. R: A Language and Environment for Statistical Computing; R Foundation for Statistical Computing: Vienna, Austria, 2018; Available online: https://www.R-project.org/ (accessed on 10 July 2019).
- Anderson, M.J.; Gorley, R.N.; Clarke, K.R. PERMANOVA+ for PRIMER. Guide to Software and Statistical Methods; Primer-E Plymouth: Plymouth, UK, 2008. [Google Scholar]
- Legendre, P.; Anderson, M.J. Distance-Based Redundancy Analysis: Testing Multispecies Responses in Multifactorial Ecological Experiments. Ecol. Monogr. 1999, 69, 1–24. [Google Scholar] [CrossRef]
- Lesty, M. Analyse Informatique de Données Géochimiques sur les Echanges Air-Mer. Thèse de doctorat (PhD. Thesis), Université de Paris VII, Paris, France, 1981. [Google Scholar]
- Lesty, M. Une nouvelle approche dans le choix des régresseurs de la régression multiple en presence d’intéractions et de colinéarités. Modulad 1999, 22, 41–77. [Google Scholar]
- Engrand, C.; Lespagnol, J.; Martin, P.; Thirkell, L.; Thomas, R. Multi-correlation analyses of TOF-SIMS spectra for mineralogical studies. Appl. Surf. Sci. 2004, 231–232, 883–887. [Google Scholar] [CrossRef]
- Lesty, C.; Pleau-Varet, J.; Kujas, M. Geometric Method and Generalized Linear Models. Two Opposite Multiparametric Approaches Illustrated on a Sample of Pituitary Adenomas. J. Appl. Stat. 2004, 31, 191–213. [Google Scholar] [CrossRef]
- Agehara, S.; Warncke, D.D. Soil Moisture and Temperature Effects on Nitrogen Release from Organic Nitrogen Sources. Soil Sci. Soc. Am. J. 2005, 69, 1844–1855. [Google Scholar] [CrossRef] [Green Version]
- Handreck, K.A.; Black, N.D. Growing Media for Ornamental Plants and Turf; Revised Edition; 1989; New South Wales University Press: Kensington, Australia, 1984; ISBN 0 86840 177 3. [Google Scholar]
- Comerford, N.B. Soil Factors Affecting Nutrient Bioavailability. In Nutrient Acquisition by Plants: An Ecological Perspective; BassiriRad, H., Ed.; Ecological Studies; Springer: Berlin/Heidelberg, Germany, 2005; pp. 1–14. ISBN 978-3-540-27675-3. [Google Scholar]
- Caron, J.; Rivière, L.M.; Parent, L.E.; Ilnicki, P. Quality of peat substrates for plants grown in containers. In Organic Soils and Peat Materials for Sustainable Agriculture, 1st ed.; Parent, L.E., Ilnicki, P., Eds.; CRC Press: Boca Raton, FL, USA, 2003; pp. 67–92. ISBN 0-8493-1458-5. [Google Scholar]
- Enwezor, W.O. The mineralization of nitrogen and phosphorus in organic materials of varying C:N and C:P ratios. Plant Soil 1976, 44, 237–240. [Google Scholar] [CrossRef]
- Nannipieri, P.; Paul, E.A. The chemical and functional characterization of soil N and its biotic components. Soil Biol. Biochem. 2009, 41, 2357–2369. [Google Scholar] [CrossRef]
- Bunt, A.C. Some physical and chemical characteristics of loamless pot-plant substrates and their relation to plant growth. In Proceedings of the I Symposium on Artificial Media in Horticulture, Gent, Belgium, 10 September 1973; Acta Horticulturae 37. International Society for Horticultural Science (ISHS): Leuven, Belgium, 1974; pp. 1954–1965. [Google Scholar]
- Wang, B.; Yang, W.; McKittrick, J.; Meyers, M.A. Keratin: Structure, mechanical properties, occurrence in biological organisms, and efforts at bioinspiration. Prog. Mater. Sci. 2016, 76, 229–318. [Google Scholar] [CrossRef] [Green Version]
- Zhang, Y.; Huang, W.; Hayashi, C.; Gatesy, J.; McKittrick, J. Microstructure and mechanical properties of different keratinous horns. J. R. Soc. Interface 2018, 15. [Google Scholar] [CrossRef] [PubMed] [Green Version]
- Durand, J.H. Les Sols Irrigables: Etude Pedologique; Agence de Coopération Culturelle et Technique, Presses Universitaires de France: Paris, France, 1983; 339p, ISBN 2-85319-110-9. [Google Scholar]
- Cleveland, C.C.; Liptzin, D. C:N:P stoichiometry in soil: Is there a “Redfield ratio” for the microbial biomass? Biogeochemistry 2007, 85, 235–252. [Google Scholar] [CrossRef]
- Xu, X.; Thornton, P.E.; Post, W.M. A global analysis of soil microbial biomass carbon, nitrogen and phosphorus in terrestrial ecosystems. Glob. Ecol. Biogeogr. 2013, 22, 737–749. [Google Scholar] [CrossRef]
- Allison, S.D.; Weintraub, M.N.; Gartner, T.B.; Waldrop, M.P. Evolutionary-Economic Principles as Regulators of Soil Enzyme Production and Ecosystem Function. In Soil Enzymology; Shukla, G., Varma, A., Eds.; Soil Biology; Springer: Berlin/Heidelberg, Germany, 2011; pp. 229–243. ISBN 978-3-642-14225-3. [Google Scholar]
- Lashermes, G.; Gainvors-Claisse, A.; Recous, S.; Bertrand, I. Enzymatic Strategies and Carbon Use Efficiency of a Litter-Decomposing Fungus Grown on Maize Leaves, Stems, and Roots. Front. Microbiol. 2016, 7. [Google Scholar] [CrossRef] [Green Version]
- Finn, D.; Kopittke, P.M.; Dennis, P.G.; Dalal, R.C. Microbial energy and matter transformation in agricultural soils. Soil Biol. Biochem. 2017, 111, 176–192. [Google Scholar] [CrossRef] [Green Version]
- Allison, S.D.; Vitousek, P.M. Responses of extracellular enzymes to simple and complex nutrient inputs. Soil Biol. Biochem. 2005, 37, 937–944. [Google Scholar] [CrossRef]
- Jian, S.; Li, J.; Chen, J.; Wang, G.; Mayes, M.A.; Dzantor, K.E.; Hui, D.; Luo, Y. Soil extracellular enzyme activities, soil carbon and nitrogen storage under nitrogen fertilization: A meta-analysis. Soil Biol. Biochem. 2016, 101, 32–43. [Google Scholar] [CrossRef] [Green Version]
- Guerra, P.A.M.; Salas Sanjúan, M.D.C.; López, M.J. Evaluation of physicochemical properties and enzymatic activity of organic substrates during four crop cycles in soilless containers. Food Sci. Nutr. 2018, 6, 2066–2078. [Google Scholar] [CrossRef]
- McCarty, G.W.; Shogren, D.R.; Bremner, J.M. Regulation of urease production in soil by microbial assimilation of nitrogen. Biol. Fertil. Soils 1992, 12, 261–264. [Google Scholar] [CrossRef]
- Mondini, C.; Cayuela, M.L.; Sinicco, T.; Sánchez-Monedero, M.A.; Bertolone, E.; Bardi, L. Soil application of meat and bone meal. Short-term effects on mineralization dynamics and soil biochemical and microbiological properties. Soil Biol. Biochem. 2008, 40, 462–474. [Google Scholar] [CrossRef]
- Margalef, O.; Sardans, J.; Fernández-Martínez, M.; Molowny-Horas, R.; Janssens, I.A.; Ciais, P.; Goll, D.; Richter, A.; Obersteiner, M.; Asensio, D.; et al. Global patterns of phosphatase activity in natural soils. Sci. Rep. 2017, 7, 1337. [Google Scholar] [CrossRef] [PubMed] [Green Version]
- Heuck, C.; Weig, A.; Spohn, M. Soil microbial biomass C:N:P stoichiometry and microbial use of organic phosphorus. Soil Biol. Biochem. 2015, 85, 119–129. [Google Scholar] [CrossRef]
- Chen, J.; Seven, J.; Zilla, T.; Dippold, M.A.; Blagodatskaya, E.; Kuzyakov, Y. Microbial C:N:P stoichiometry and turnover depend on nutrients availability in soil: A 14C, 15N and 33P triple labelling study. Soil Biol. Biochem. 2019, 131, 206–216. [Google Scholar] [CrossRef]
- Bünemann, E.K.; Oberson, A.; Liebisch, F.; Keller, F.; Annaheim, K.E.; Huguenin-Elie, O.; Frossard, E. Rapid microbial phosphorus immobilization dominates gross phosphorus fluxes in a grassland soil with low inorganic phosphorus availability. Soil Biol. Biochem. 2012, 51, 84–95. [Google Scholar] [CrossRef]
- Bünemann, E.K. Assessment of gross and net mineralization rates of soil organic phosphorus—A review. Soil Biol. Biochem. 2015, 89, 82–98. [Google Scholar] [CrossRef]
- Vong, P.-C.; Dedourge, O.; Lasserre-Joulin, F.; Guckert, A. Immobilized-S, microbial biomass-S and soil arylsulfatase activity in the rhizosphere soil of rape and barley as affected by labile substrate C and N additions. Soil Biol. Biochem. 2003, 35, 1651–1661. [Google Scholar] [CrossRef]
- Schmalenberger, A.; Fox, A. Bacterial Mobilization of Nutrients from Biochar-Amended Soils. In Advances in Applied Microbiology; Sariaslani, S., Gadd, G.M., Eds.; Elsevier: Boston, MA, USA, 2016; Volume 94, pp. 109–159. [Google Scholar]
- Acosta-Martínez, V.; Tabatabai, M.A. Enzyme activities in a limed agricultural soil. Biol. Fertil. Soils 2000, 31, 85–91. [Google Scholar] [CrossRef]
- Ekenler, M.; Tabatabai, M.A. Responses of phosphatases and arylsulfatase in soils to liming and tillage systems. J. Plant Nutr. Soil Sci. 2003, 166, 281–290. [Google Scholar] [CrossRef]
Figure 1.
Electrical conductivity and pH in peat (A,D), coir (B,E), and bark (C,F) over time as affected by fertilizer types. Values are means and error bars indicate standard deviations (n = 3). Columns refer to GM types (peat, coir and bark, respectively). Fertilization: Unfertilized (control without fertilizer depicted by dotted lines); F1, F2: plant-based fertilizers (dashed and dotted–dashed lines, respectively) and horn (gray lines).

Figure 2.
Effect of growing media and fertilizer types on ammonium (A–C), nitrate (D–F), phosphate (G–I) and sulfate (J–L) availabilities over time. Values are means and error bars standard deviations (n = 3). Columns refer to GM types (peat, coir and bark, respectively) and rows refer to nutrient content (ammonium, nitrate, phosphate, and sulfate content; mg N, P, or S per g dry mass (DM), respectively). Each graph depicts differences between fertilizer types: Unfertilized (control without fertilizer depicted by dotted lines); F1, F2: plant-based fertilizers (dashed and dotted–dashed lines, respectively) and horn (gray lines).

Figure 3.
Effect of growing media and fertilizer types on enzyme 1.4-β-glucosidase (β-Glu, A–C), urease (D–F), acid phosphatase (Acid-P, G–I) and arylsulfatase (Aryl-S, J–L) activities, over time. Values are means and error bars standard deviations (n = 3). Columns refer to GM types (peat, coir and bark, respectively), and rows refer to each enzyme (µmol min−1 g−1 dry mass (DM)). Each picture depicts differences in fertilizer type: Unfertilized (control without fertilizer depicted by dotted lines); F1, F2: plant-based fertilizers (dashed and dotted–dashed lines, respectively) and horn (gray lines).

Figure 4.
Iconography of correlations between individuals depicted according to GM types (A) and fertilizer types (B). The numbers correspond to individual samples (exact same position in A and B). (A) Peat (green), coir (blue) and bark (red). (B) Unfertilized samples are in black, F1 fertilization samples are in cyan, F2 samples are in green and horn samples are in magenta. The blue circle depicts coir unfertilized samples and with horn after 7 days. Arrows depict an effect of time for horn (magenta), F1 (blue), and F2 (green) in coir. Straight lines depict positive links and dotted lines the negative ones. Once the reader focuses on one color corresponding to a GM type (Figure 4A), the reader can then identify fertilizer types in Figure 4B.

Figure 5.
Iconography of correlations with a threshold at level 0.3 (A) and 0.1 (B), depicting growing media and fertilizer types, time, and replicate and experimental variables. Colors were chosen to facilitate reading: ammonium (NH4), nitrate (NO3), phosphate (PO4), and sulfate (SO4) contents are depicted in blue; pH, electrical conductivity 1.4-β-glucosidase (Bglu), urease, acid phosphatase (acidP) and arylsulfatase (arylS) activities are depicted in black. GM types are depicted in red (peat, bark, and coir), fertilizer types are depicted in green (unfertilized: control without fertilizer. F1, F2: plant-based fertilizers and horn), replicate and time are depicted in black. Straight lines depict positive links and dotted lines depict negative ones.

Table 2.
Effects of growing media (GM), fertilizer (Fert.), Time, and their interactions on chemical properties (pH, electrical conductivity (EC), nutrient availability (ammonium NH4+-N, nitrate NO3−-N, phosphate PO43−-P, and sulfate SO42−-S).
Table 2.
Effects of growing media (GM), fertilizer (Fert.), Time, and their interactions on chemical properties (pH, electrical conductivity (EC), nutrient availability (ammonium NH4+-N, nitrate NO3−-N, phosphate PO43−-P, and sulfate SO42−-S).
| Factors | pH | EC | NH4+-N | NO3−-N | PO43−-P | SO42−-S | |||||||
|---|---|---|---|---|---|---|---|---|---|---|---|---|---|
| Df | F | p | F | p | F | p | F | p | F | p | F | p | |
| GM | 2 | 1946.6 | *** | 773.1 | *** | 1606.8 | *** | 273.1 | *** | 415.4 | *** | 140.7 | *** |
| Fert. | 3 | 82.8 | *** | 3065.5 | *** | 647.4 | *** | 155.7 | *** | 710.9 | *** | 305.2 | *** |
| Time | 3 | 79.9 | *** | 70.8 | *** | 0.5 | ns | 160.3 | *** | 176.8 | *** | 6.9 | *** |
| GM × Fert. | 6 | 71.3 | *** | 35.1 | *** | 263.4 | *** | 44.0 | *** | 213.8 | *** | 39.5 | *** |
| GM × Time | 6 | 78.3 | *** | 3.7 | ** | 119.7 | *** | 31.0 | *** | 54.9 | *** | 6.9 | *** |
| Fert. × Time | 9 | 7.9 | *** | 8.7 | *** | 2.4 | * | 24.4 | *** | 22.1 | *** | 5.5 | *** |
| GM × Fert. × Time | 18 | 17.9 | *** | 1.2 | ns | 20.9 | *** | 13.6 | *** | 16.1 | *** | 4.1 | *** |
| Error | 96 | - | - | - | - | - | - | - | - | - | - | - | - |
*** p < 0.001, ** p < 0.01, * p < 0.05, ns: not significant.
Table 3.
Effects of growing media (GM), fertilizer (Fert.), Time, and their interactions on enzyme activities (β-1.4-glucosidase (β-Glu), urease, acid phosphatase (Acid-P), and arylsulfatase (Aryl-S); µmol min−1 g−1 dry mass).
Table 3.
Effects of growing media (GM), fertilizer (Fert.), Time, and their interactions on enzyme activities (β-1.4-glucosidase (β-Glu), urease, acid phosphatase (Acid-P), and arylsulfatase (Aryl-S); µmol min−1 g−1 dry mass).
| Factors | β-Glu | Urease | Acid-P | Aryl-S | |||||
|---|---|---|---|---|---|---|---|---|---|
| Df | F | p | F | p | F | p | F | p | |
| GM | 2 | 222.7 | *** | 2.8 | ns | 1653.7 | *** | 248.7 | *** |
| Fert. | 3 | 56.9 | *** | 0.7 | ns | 7.0 | *** | 34.8 | *** |
| Time | 3 | 2.6 | ns | 1.4 | ns | 15.0 | *** | 13.5 | *** |
| GM × Fert. | 6 | 27.8 | *** | 1.0 | ns | 11.6 | *** | 25.9 | *** |
| GM × Time | 6 | 3.7 | ** | 0.5 | ns | 9.4 | *** | 9.1 | *** |
| Fert. × Time | 9 | 0.6 | ns | 2.2 | * | 3.3 | ** | 5.4 | *** |
| GM × Fert. × Time | 18 | 0.6 | ns | 1.6 | ns | 2.0 | * | 2.7 | *** |
| Error | 96 | - | - | - | - | - | - | - | - |
*** p < 0.001, ** p < 0.01, * p < 0.05, ns: not significant.
Publisher’s Note: MDPI stays neutral with regard to jurisdictional claims in published maps and institutional affiliations. |
© 2020 by the authors. Licensee MDPI, Basel, Switzerland. This article is an open access article distributed under the terms and conditions of the Creative Commons Attribution (CC BY) license (http://creativecommons.org/licenses/by/4.0/).
Share and Cite
MDPI and ACS Style
Paillat, L.; Cannavo, P.; Barraud, F.; Huché-Thélier, L.; Guénon, R. Growing Medium Type Affects Organic Fertilizer Mineralization and CNPS Microbial Enzyme Activities. Agronomy 2020, 10, 1955. https://doi.org/10.3390/agronomy10121955
AMA Style
Paillat L, Cannavo P, Barraud F, Huché-Thélier L, Guénon R. Growing Medium Type Affects Organic Fertilizer Mineralization and CNPS Microbial Enzyme Activities. Agronomy. 2020; 10(12):1955. https://doi.org/10.3390/agronomy10121955
Chicago/Turabian StylePaillat, Louise, Patrice Cannavo, Fabrice Barraud, Lydie Huché-Thélier, and René Guénon. 2020. "Growing Medium Type Affects Organic Fertilizer Mineralization and CNPS Microbial Enzyme Activities" Agronomy 10, no. 12: 1955. https://doi.org/10.3390/agronomy10121955
Note that from the first issue of 2016, this journal uses article numbers instead of page numbers. See further details here.