CO2 Emissions from Soil Under Fodder Maize Cultivation


Department of Agricultural Chemistry, Agricultural Institute, Warsaw University of Life Sciences–SGGW, Nowoursynowska 159, 02-766 Warsaw, Poland
*
Author to whom correspondence should be addressed.
Agronomy 2020, 10(8), 1087; https://doi.org/10.3390/agronomy10081087
Submission received: 16 June 2020
/
Revised: 20 July 2020
/
Accepted: 24 July 2020
/
Published: 27 July 2020
(This article belongs to the Section Innovative Cropping Systems)
Abstract
:The paper presents the results of a study aimed at assessing the total respiration of arable soil under maize fodder cultivation in the climate conditions of Central Poland over the dry growing season. The study was carried out between 22 April and 30 September 2012 (24 test dates). Total CO2-C emissions from the soil were measured in situ by means of the chamber method. The measured total CO2-C fluxes showed a high variability over the study period (3.63–302.31, mean 84.58 mg CO2-C m−2 h−1). Cumulative CO2-C soil emissions reached 3214.9 kg CO2-C ha−1 during the maize growing season and 106.8 kg CO2-C ha−1 in the post-harvest month. In the specific weather conditions of the year of the study (summer drought), CO2-C fluxes from the soil were stronger correlated with the soil NO3−-N content than with atmospheric temperature and soil moisture. The relationship between total soil CO2-C emissions and soil NH4+-N content was described by a negative correlation. Intensive CO2-C fluxes from the soil coincided with rapid maize development stages (8–15 leaf stage) and, to a lower extent, with earlier leave development stages. Total CO2-C emissions during the emergence, pre-reproductive and reproductive maize stages and, particularly, in the post-harvest period, were lower. Intensive nitrification of the soil, in dry season such as the one of 2012, could serve as an indicator of high CO2-C emissions from the soil. However, further studies are needed to confirm this finding. Decomposers probably used soil NH4+-N in the organic matter degradation process intensively and could compete with nitrifiers and maize roots for this soil source of mineral nitrogen.
1. Introduction
Corn is the world’s most important grain in terms of production volume. Corn production in 2016/2017 reached a level of approximately 1.07 billion tons [1]. In 2018, the share of maize grain in total grain production in EU-28 was 23.4% [2]. Two main production lines generally function in Poland, namely cultivation for grain and fodder. Over the last 10 years, the area of maize cultivation for grain in Poland increased from 333.4 to 664.9 thousand ha, and for fodder from 395.3 to 599,9 thousand ha [3]. Intensive maize cultivation is closely related to intensive animal husbandry, maize representing a highly valuable forage. An increase in the area of maize cultivation, also observed in other countries, follows the market demand for food, fodder and industrial products, including starch, sweeteners, oil, beverages, glue and industrial and fuel ethanol [4]. Among all cereals, maize has the highest requirement for warmth. Due to the specific climate conditions, the maize cultivation differs between the regions of Poland. In the southern part of country, grain maize is primarily cultivated, and, in the northeastern region, forage maize is dominant [5]. The area of maize cultivation has systematically increased as a result of land use conversion from permanent pasture to arable land. Such change in the land use is acknowledged to increase the greenhouse gas emissions from the soil [6]. Land use change has a substantial impact on total organic carbon content in the soil. Guo and Gifford [7] reported that soil organic carbon stocks were lower by up to 59% in croplands than in grasslands. Moreover, Don et al. [8] showed that, 29 years after a conversion of a cropland on a sandstone site with Arenosols in Central Germany into extensively used grassland with sheep grazing, soil organic carbon associated with mineral fraction had not been restored. Ding et al. [9] described a lower decrease in organic carbon in the soil after a grassland conversion to cropland in a temperate zone with continental monsoon climate conditions in northeast China. The differences in the content of organic carbon in the soil profile found by the authors were, however, higher at a depth of up to 60 cm than in the 0–30 cm soil layer. A meta-analysis of 81 case studies by Tang et al. [10] confirmed that, after conversion of grassland to cropland, soil organic carbon content decreased in the 0–60 cm soil layer, but not at depths below 60 cm.
Globally, more than 29% of anthropogenic CO2 additions to the atmosphere came from the loss of soil organic matter in cultivated soils [11]. Besides the content of soil organic carbon, the key factors affecting the CO2 emission from arable soil are the temperature and soil moisture, soil tillage intensity and fertilization [12,13,14]. An increase in the soil temperature leads to a higher soil respiration rate, whereas long periods of drought can significantly reduce the soil respiration [6]. Therefore, different soil tillage and fertilization adopted to the requirements of a given crop species could results in different CO2 soil emissions. Zhai et al. [15] demonstrated that CO2 emission from manured soils was higher under maize than under wheat, yet the emissions from mineral-fertilized soil were similar under both crops. Norberg et al. [16] evidenced no significant differences in CO2 emissions from soil under different crops in similar environmental conditions on 11 field sites in Sweden. CO2 emissions from soil under maize are higher compared to the emissions from other crops [15,17]. At the same dose of nitrogen fertilizer (120 kg N ha−1), Dhadli et al. [17] showed higher daily CO2 fluxes from the soil under maize than those from under wheat (7.6 kg and 4.3 kg CO2-C ha−1 day−1, respectively). Zhai et al. [15] linked this phenomenon to the duration of the growth season (184 days for maize and 125 days for wheat). The authors additionally hypothesized that different crop biomass productivity might also affect the CO2 soil emissions.
Augmentation of the maize cultivation is expected to lead to an increase in CO2 emissions from arable soils. Meanwhile, drought occurring during the growing season is one of the manifestations of the global climate change. Taking into account the key factors affecting the soil respiration, including the soil moisture, it is important to determine the amount of total CO2 emissions and their distribution in drought conditions, which may occur more often in the future. Given that a majority of reports on CO2 soil emissions origin from the sites with different soil and climatic conditions than those of Central and Eastern Europe, it is important to evaluate the amount and the temporal pattern of total CO2 soil emissions over the maize growing season. The focus of the current study included the typical soil and agro-engineering conditions of Central Poland in the year with a notable precipitation deficit. We hypothesized that the drought in the 2012 growing season shaped the CO2-C emissions from the soil. This study quantified total CO2 emission from soil under maize cultivation during the growing period and analyses the relationship between CO2 emissions and environmental factors.
2. Materials and Methods
2.1. Study Area
The study was carried out in 2012 in the village of Mikanów (52°08′25′′ N, 21°35′11′′ E), 39 km from Warsaw (Central Poland). The soil of the arable field was Gleyic Phaeozems containing the following fractions in the 0–20 cm layer: 92% of 2–0.05 mm, 6% of 0.002–0.05 mm and 2% of < 0.002 mm. Total organic carbon content in the soil ploughing layer was 13.00 g C kg−1 and total nitrogen content was 1.44 g N kg−1. Consequently, the soil C:N ratio was 9.0:1. Soil pH (1 M KCl) was 6.4. In the year of the study, the field was used to grow forage maize fertilized in a mineral-organic system (28 April (maize sowing) to 8 September (maize harvest)).
2.2. Weather Conditions
The average annual air temperature in the Mazovia Province in 2012 was 9 °C, with the highest average monthly temperature (22 °C) in July and the lowest (−6.3 °C) in February. Total precipitation in the year of the study was 550 mm, with maximum rainfall in June (73.8 mm) and minimum precipitation in September (20.1 mm) [18]. The average monthly temperatures in 2012 were similar to the corresponding multi-year averages; however, the average monthly temperatures in the study period (April–September of 2012) were higher than the multi-year average by 1.8 °C (June) to 3.6 °C (July) (Figure 1). The precipitation in the year of the study differed from the multi-year average with the monthly precipitation in May, July, August and September noticeably lower than the corresponding multi-year averages, causing an increasing water deficit in the soil between July and September (Figure 2).
2.3. Measurement Descriptions
CO2-C emissions (total CO2-C emissions, i.e., root and microbial respirations) from the soil were measured in situ by means of a portable FT-IR spectrometer model Alpha (Bruker, Ettlingen, Germany). The emission of CO2-C (FCO2) from the soil was calculated as an increase in the amount of CO2-C in the chamber (ø = 29.5 cm, h = 20 cm) after 10 min exposure to the soil surface according to the equation presented by Burton et al. [19]:
where ΔC/Δt is the rate of change in CO2-C concentration inside the chamber, A is the surface area of the chamber, Vc is the total volume of the chamber corrected for temperature, Mmol is molar mass of CO2-C, and Vmol is the molar volume of CO2-C inside the chamber corrected for air temperature using the ideal gas law. CO2-C emission from the soil was expressed in mg CO2-C m−2 h−1. The measurements of CO2-C emissions from soil were carried out every week from 22 April to 30 September 2012 (24 test dates). On each test date, measurements of CO2-C emission from the soil were taken from the same limited areas of the arable field (approximately 10 m2) in four randomly selected locations distributed every approximately 1 m, considered as four replications. Cumulative emissions of CO2-C were quantified on a mass basis (i.e., kg C ha−1) using the trapezoid rule [20].
FCO2 = ΔC/Δt Vc/A Mmol/Vmol
Soil samples were collected from the arable layer of the soil. The samples were analyzed by means of flow colorimetry for NH4+-N and NO3−-N content (San Plus Analyzer, Skalar Analytical BV, Breda, Netherlands) after soil extraction with 0.01 M CaCl2 with a soil/extractant ratio of 1:10. The soil granulometric composition, organic carbon content (Thermo Electron-C analyzer model TOC-500, Shimaidzu, Kyoto, Japan) and total nitrogen content in the soil (Vapodest model VAP 30 analyzer, Gerhardt, Bonn, Germany) were measured in representative samples obtained by combining all soil samples collected on separate test dates. The soil moisture was assessed as a decrease in the sample weigh after oven-drying in 105 °C and expressed as a proportion of pore space filled with water (% WFPS).
2.4. Data Analysis
Statistical analysis was made using the Statistica PL 13.3 software (Tulsa, Okla., USA). To determine the characteristics of the individual parameters, the basic descriptive statistics were calculated: mean, standard deviation, median, minimum-maximum values, variation coefficient and fractals 25 and 75. Correlation and nonlinear regression analyses were used to test relationships between soil CO2 fluxes and other factors.
Regression analysis was used to determine the relationships among total CO2-C emission, soil content of NO3−-N, soil content of NH4+-N, air temperature and soil moisture. The following equations were used:
where y is the measured total CO2-C emission from the soil (mg CO2 m−2 h−1); a, b and c are the equation coefficients; and x is the measured soil content of NO3-N, soil content of NH4+-N, air temperature or soil moisture.
y = ax2 + bx + c
3. Results
3.1. Mineral Nitrogen Soil Content
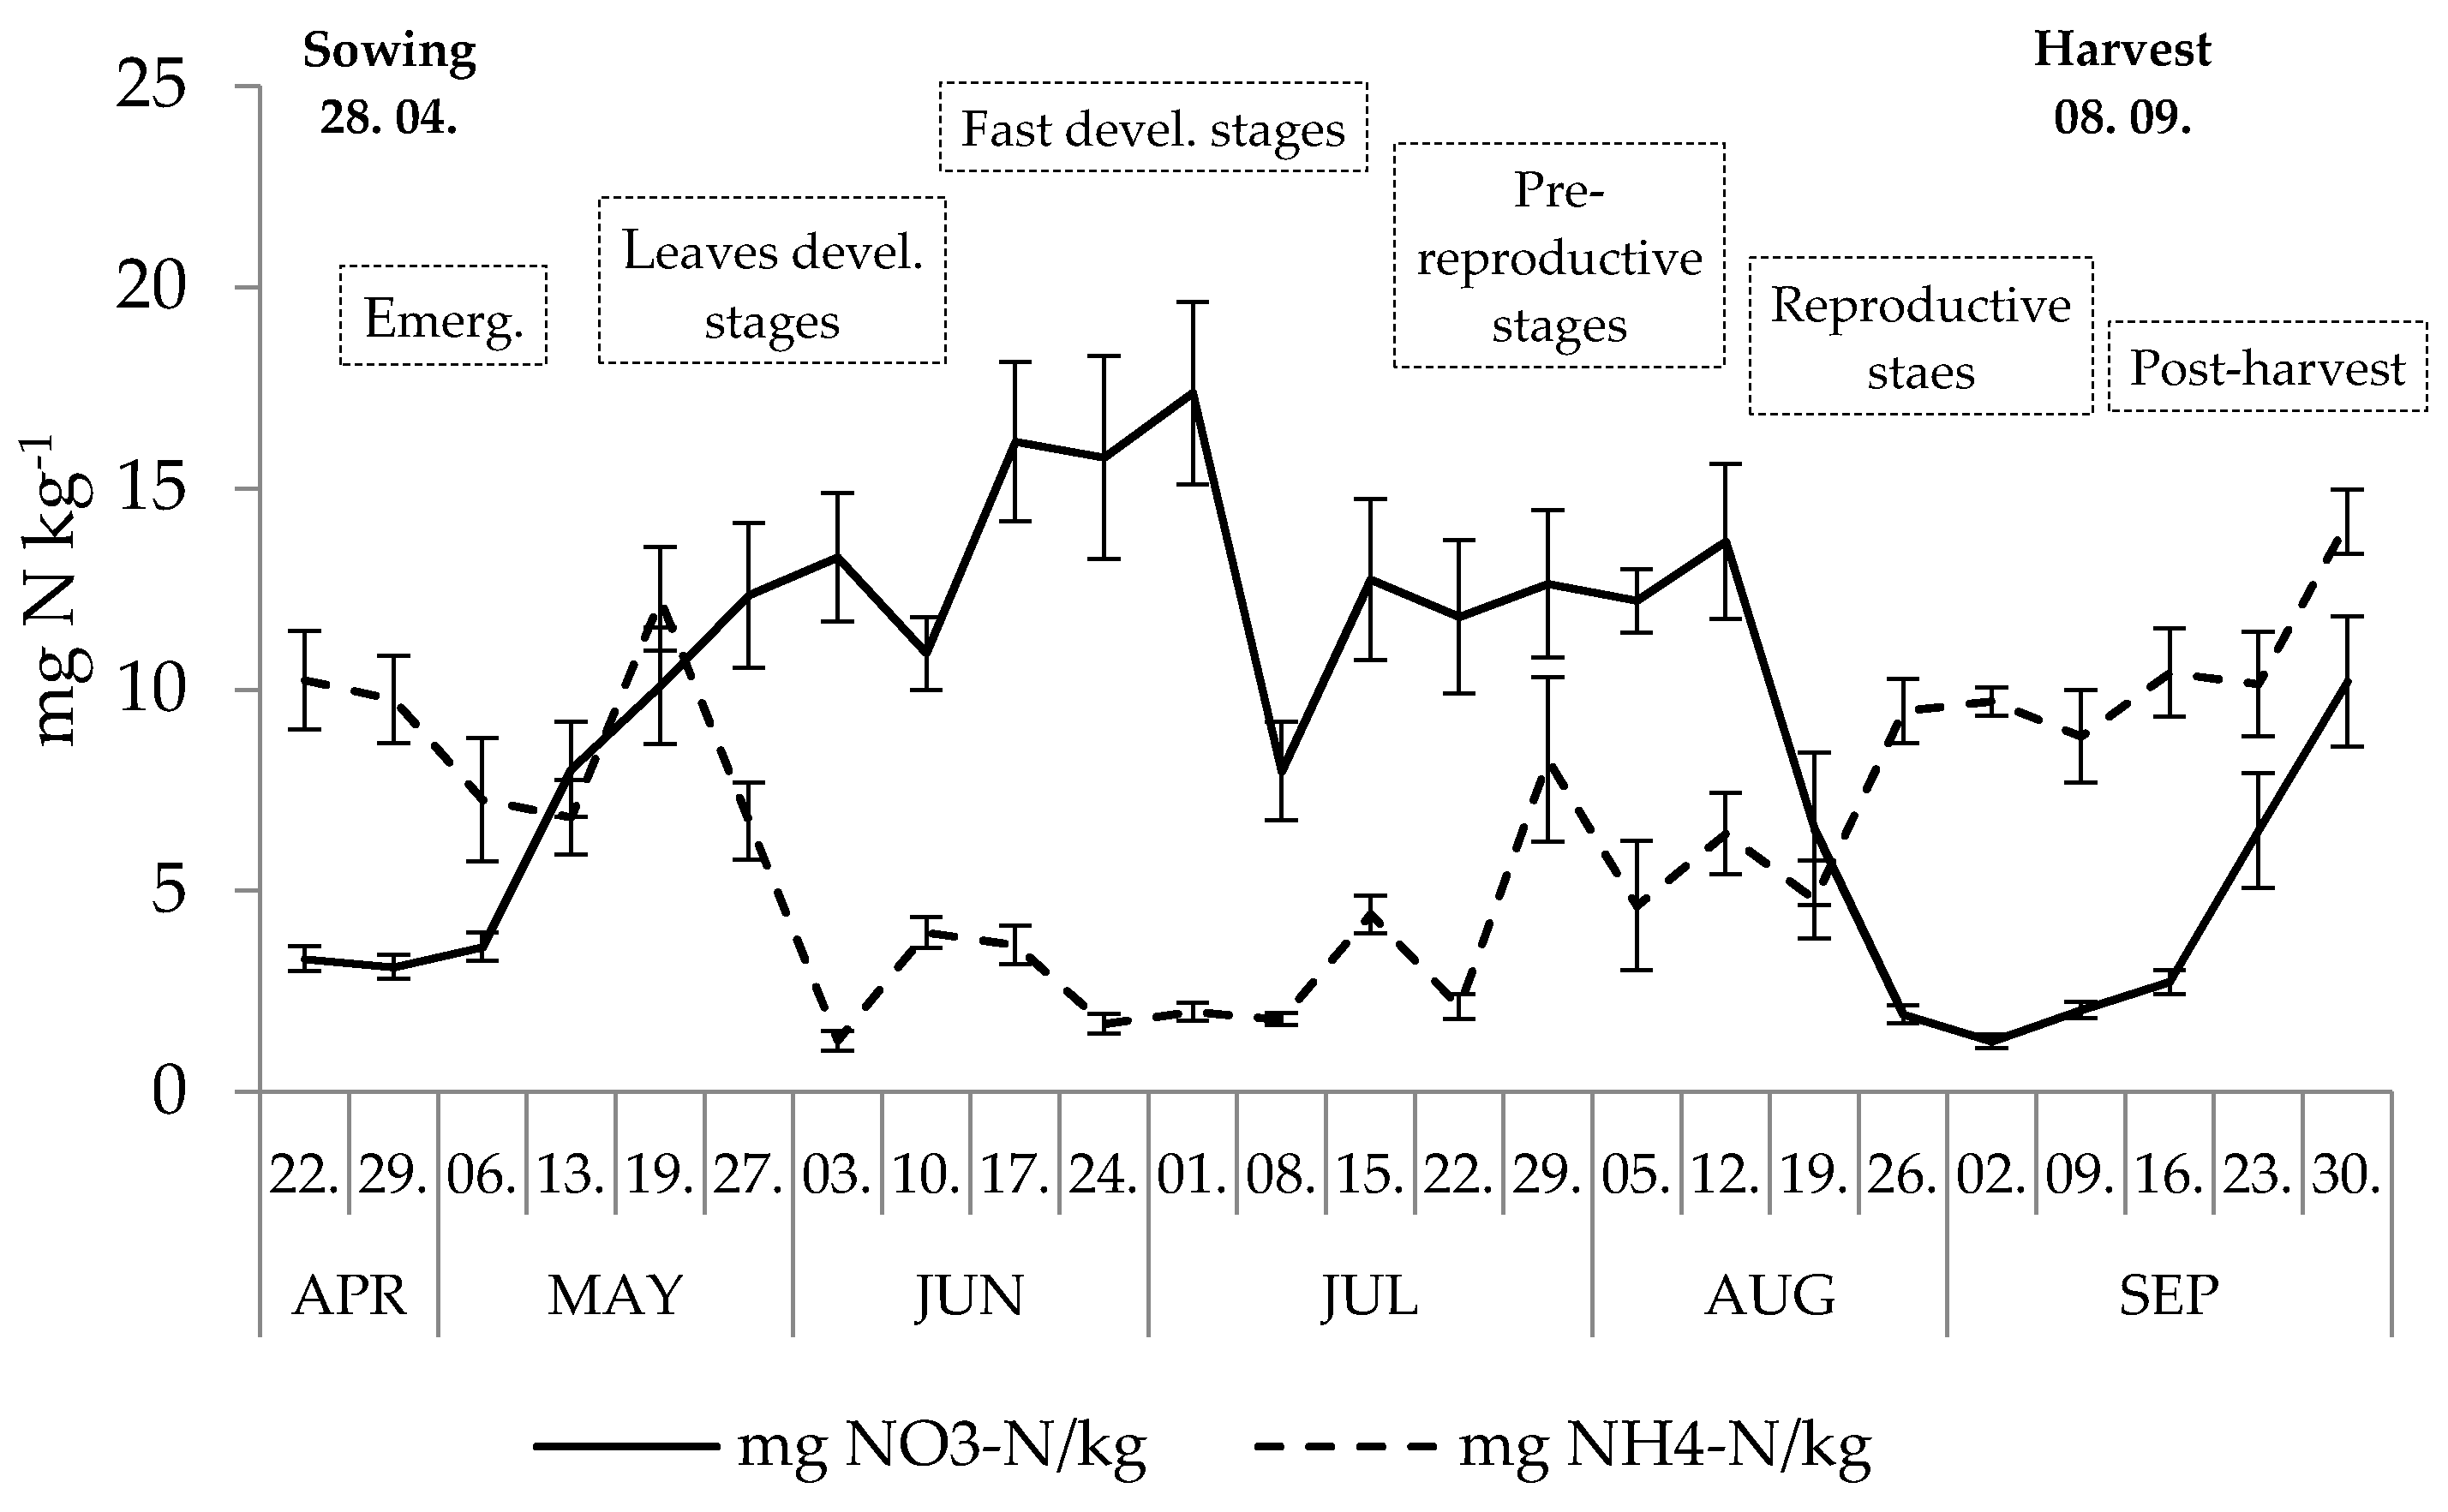
The average content of NH4+-N in the soil (average 6.70 mg NH4+-N kg−1) was lower than that of NO3−-N (average 9.01 mg NO3−-N kg−1 (Table 1). The distribution of both forms of nitrogen differed over time (Figure 3). Soil NH4+-N content decreased gradually from the end of April to mid-May. Subsequently, an increase in the soil content of NH4+-N was observed (until the end of the second decade of May). After a peak in the NH4+-N content, a notable decrease was recorded until the beginning of June. After its decrease, the NH4+-N content in the soil remained at a low level until the second half of July. Subsequently, NH4+-N content in the soil increased with some fluctuations until the end of the study period. NO3−-N content in the soil increased from the beginning of the study period until the beginning of July, and the high soil content persisted with some fluctuations until the beginning of July. In the first decade of July, a considerable decease was observed in the content of NO3-N; however, the content of NO3-N increased subsequently by mid-July. With some fluctuations, soil content of NO3−-N remained at a relatively high level until mid-August. After a subsequent rapid decrease, the content of nitrates in the soil remained low until mid-September. A subsequent peak in NO3−-N soil content was recorded at the end of the study period.
NO3−-N content in soil was significantly (p < 0.05) positively correlated with soil moisture and air temperature (r = 0.53 and r = 0.45, respectively) and negatively correlated with NH4+-N soil content (r = −0.60) (Table 2). NH4+-N content in arable soil was also significantly (p < 0.05) negatively correlated with air temperature (r = −0.56) and soil moisture (r = −0.40) (Table 2).
3.2. CO2-C Soil Emissions
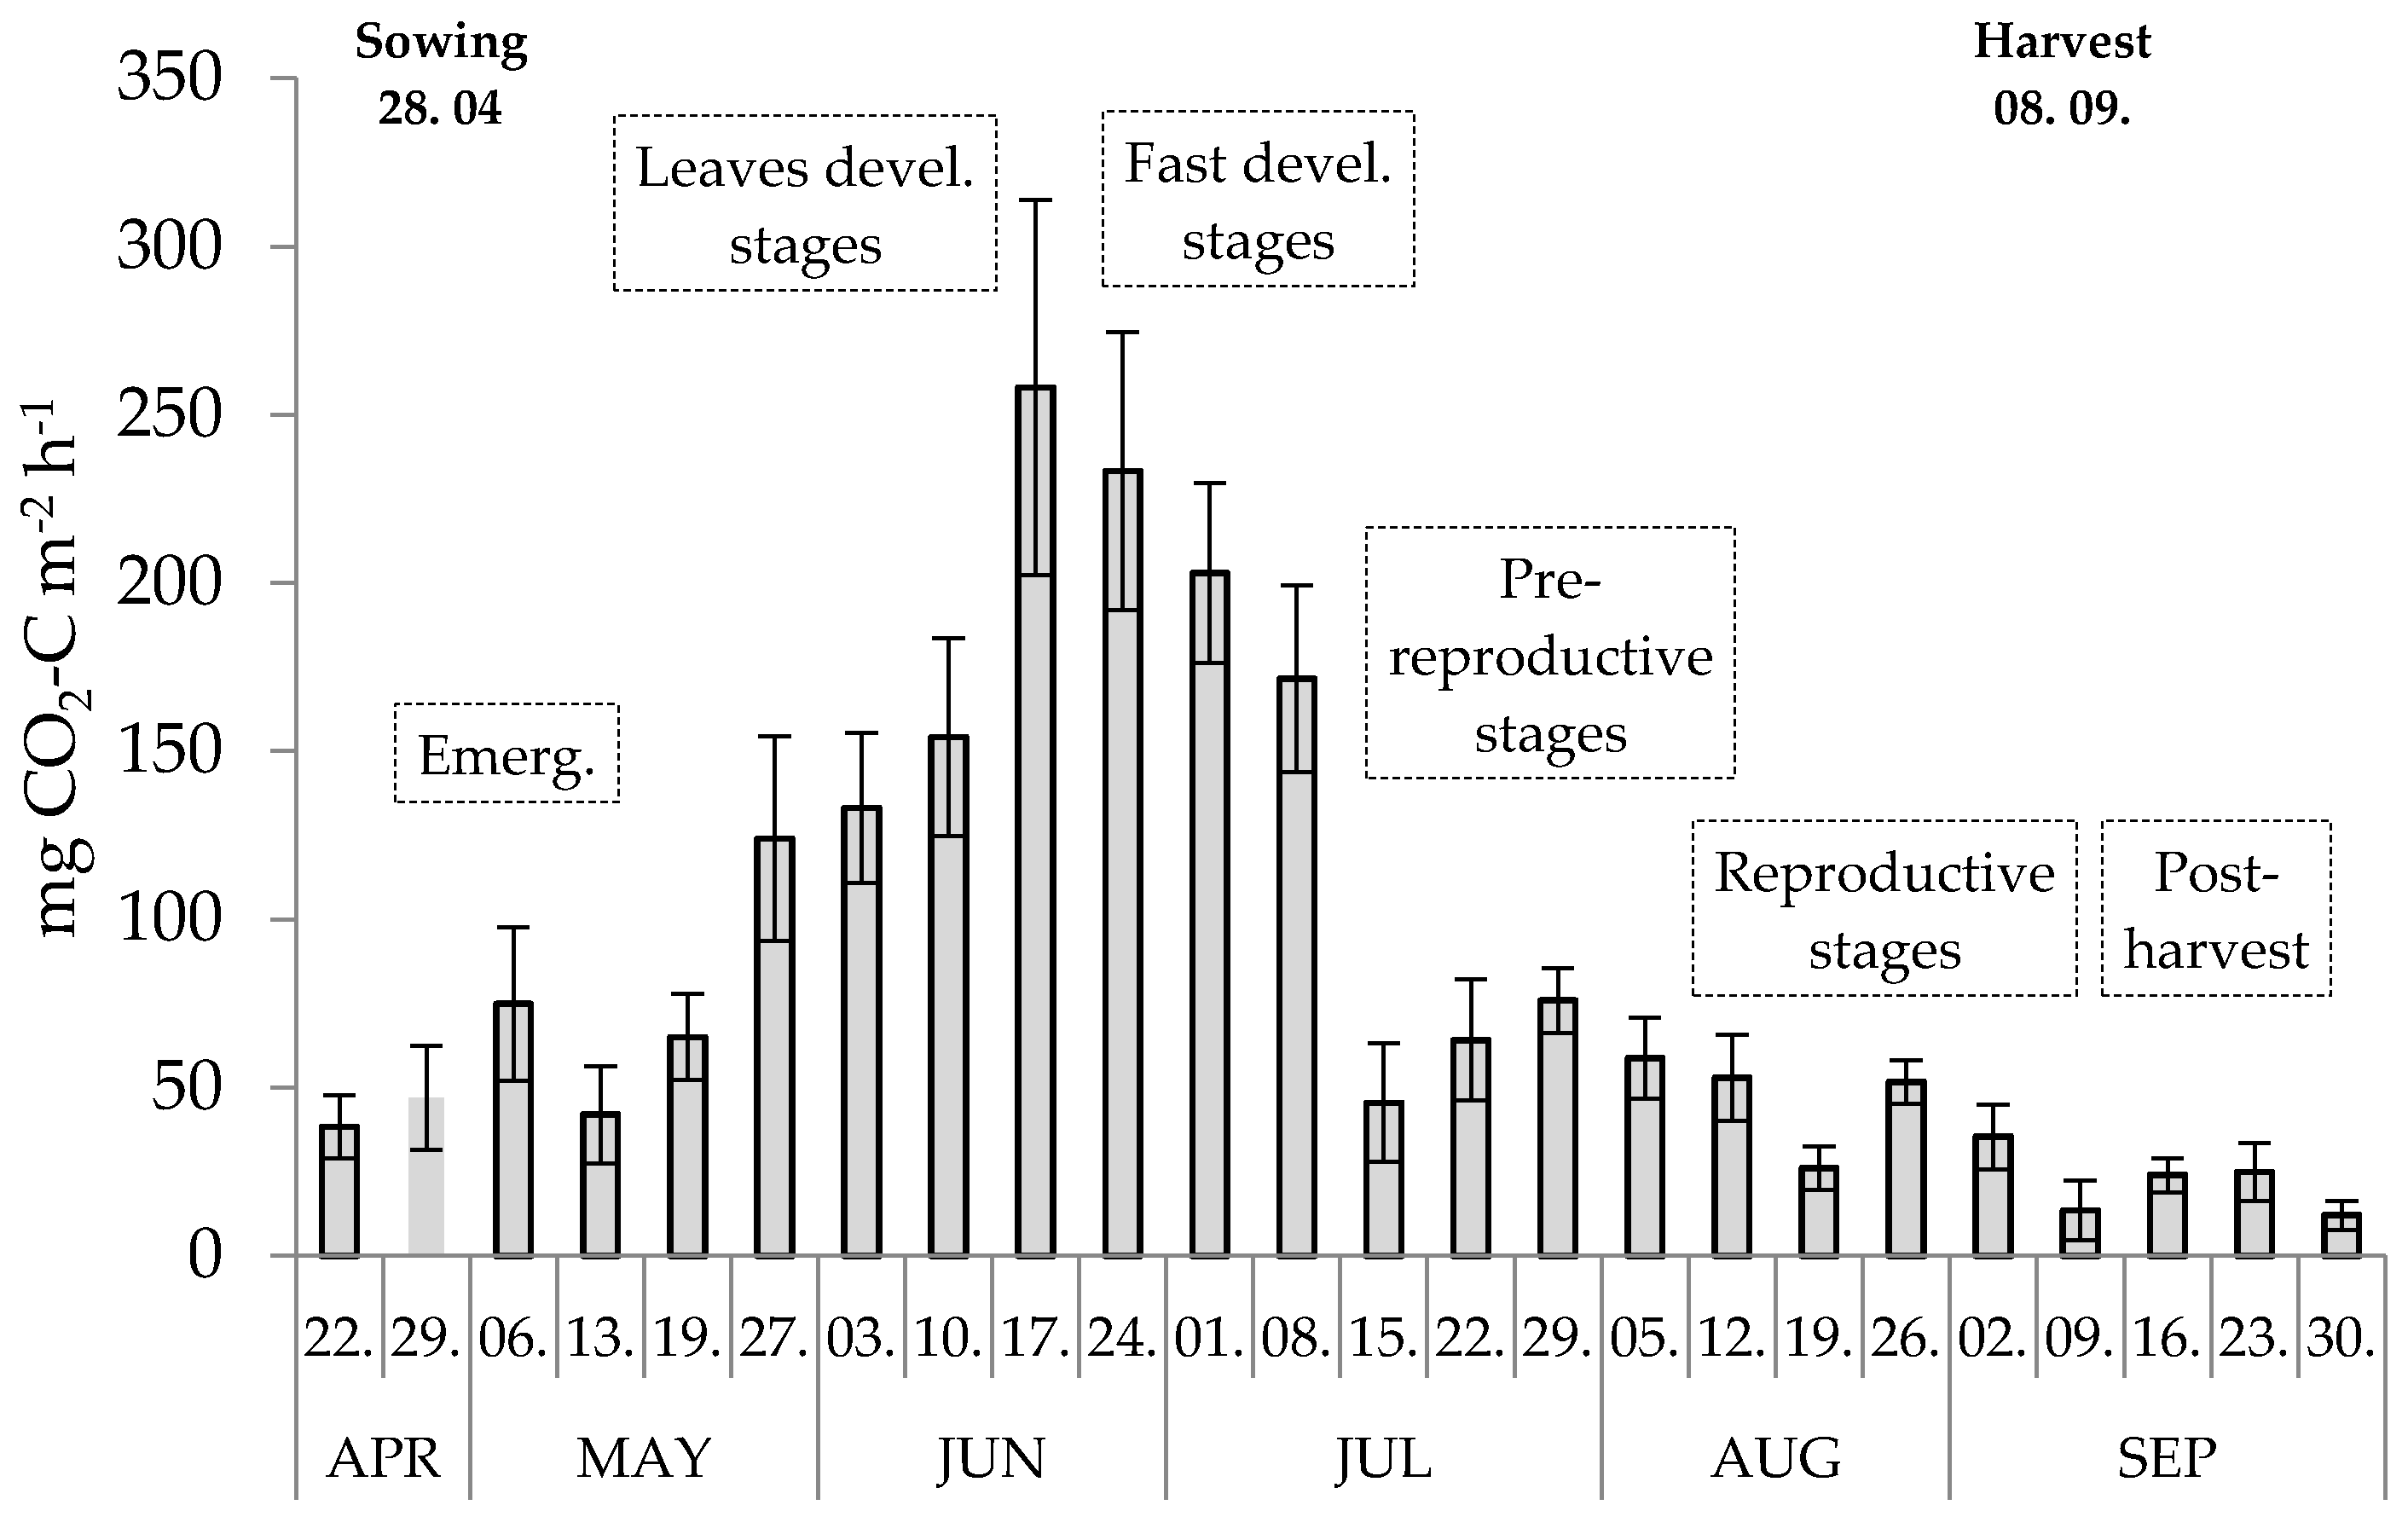
CO2-C fluxes from the soil (average 84.58 mg CO2-C m−2 h−1) are presented in Table 1. Very high variability of emission of CO2-C from the soil (3.63-302.31 mg CO2-C m−2 h−1) was observed over the study period. From the beginning of the study period until mid-June, a gradual increase in the emission of CO2-C from the soil was recorded (Figure 4). After the peak of soil CO2-C emissions at the eight-leaf stage, soil CO2-C gradually decreased. Relatively high soil CO2-C emissions persisted over the next three weeks until the maize 15-leaf stage. Soil CO2-C emissions decreased with some fluctuation during the first decade of July and remained at a low level until the end of the maize growing season. The lowest CO2-C soil emissions were recorded at the beginning of September, right after maize harvest. CO2-C soil fluxes were very low, although with a slight upward trend in soil CO2-C emissions during the post-harvest period.
The emission of CO2-C from the soil was significantly (p < 0.05) positively correlated with soil NO3−-N content, air temperature and soil moisture (r = 0.64, r = 0.52 and r = 0.36, respectively). The relationship between CO2-C emission from the soil and soil NH4+-N content was described by a negative correlation coefficient (r = −0.67, p < 0.05) (Table 2). The correlation between soil content of NO3−-N and CO2-C emissions was confirmed by the regression analysis (Figure 5). The polynomial model (Equation (2)) explained 40.3% of the variation in the soil CO2-C emissions (p < 0.05). Significant relationship was observed between soil content of NH4+-N and CO2-C emissions where the polynomial model (Equation (2)) explained 46.9% of the variation in the soil CO2-C emissions (p < 0.05). A weaker relationship was observed for CO2-C emissions and air temperature and soil moisture, explaining 30.0% and 16.0% of the CO2-C emissions variation, respectively (p < 0.05) (Figure 5).
The average daily CO2-C soil fluxes evaluated for subsequent maize development stages are presented in Table 3. Average daily soil CO2-C fluxes calculated for rapid development stages (from 8- to 17-leaf stage) were higher than in leaves development stages (until the eight-leaf stages) (45.8 kg and 30.8 kg CO2-C ha−1 day−1, respectively). Approximate average daily CO2-C soil fluxes were evaluated for the pre-reproductive stage (between 17-leaf stage and maize silking stage), maize emergence and reproductive stages (above silking stage) (14.9, 12.8 and 8.8 kg CO2-C ha−1 day−1, respectively), although they were lower than in the rapid maize development and leaves development stages. The lowest daily CO2-C flux in the study period was observed in the post-harvest period (4.9 kg CO2-C ha−1 day−1).
In the study period, the cumulative CO2-C soil emissions were estimated at 3382 kg CO2-C ha−1 and, in the growing season, i.e., from maize sowing to harvest, at 3214.9 kg CO2-C ha−1 (Table 4). Higher CO2-C emission from the soil occurred during the fast development stages than during the leaf development stages (1282.5 and 1046.6 kg CO2-C ha−1, respectively). Lower CO2-C soil emissions were observed with the pre-reproductive maize stages, emergence, reproductive maize stages and post-harvest stages (416.5, 282.3, and 247.4 kg CO2-C ha−1, respectively). Nonetheless, no notable differences in cumulative CO2-C soil emissions occurred in these three periods. From maize harvest to the end of September, the cumulative CO2-C soil emissions (106.8 kg CO2-C ha−1) were notably lower than in each of the prior maize development stages.
4. Discussion
4.1. Soil Organic Carbon Content
Several studies have evidenced that conversion of land use from perennial meadow to cropland results in a decrease in total carbon stock in the soil and increases soil CO2-C emissions [7,8,9]. Aslam et al. [21] showed that soil C levels were maintained when pastureland was converted to cropping with no-tillage, but they were markedly reduced with cropping and tillage. Content of organic carbon in the analyzed soil (13 g C kg−1) was relatively high, although the land use change occurred several years before our study. Light sandy soils with low content of soil organic carbon are predominant in the Mazovia province (Central Poland). After 40 years of fertilization of soil with a texture of sandy loam in the long-term experiment in Lyczyn (Central Poland), the baseline content of organic carbon (5.8 g C kg−1) recorded before the experiment set-up in 1960 increased on average to 6.2 and 9.3 g C kg−1 in manured and exclusive mineral treatments, respectively [22]. The soil of long-term experiment in Skierniewice (Mazovia province, Central Poland) belonging to the Warsaw University of Life Sciences features loamy sand. After 90 years of fertilization, content of organic carbon in the soil under rye-monoculture with exclusively mineral fertilization was 0.56 and 10.6 g C kg−1 in the soil treated annually with 20 t manure ha−1 [23].
4.2. Relationship Between CO2-C Soil Emissions and Temperature and Soil Moisture
Aslam et al. [21] reported that CO2-C emissions from silt loam soil under maize cultivated in the plow tillage system ranged from 36 to 81 kg CO2-C ha−1 per day. In our study, soil CO2-C fluxes during the maize growing season (from maize sowing to harvest) ranged from 8.8 to 45.8 kg CO2-C ha−1 day−1 (Table 3) and were lower compared to the ones reported in other studies focusing on maize [14,24,25,26]. Relatively low CO2-C fluxes may have resulted from the drought occurring in the year of the study. In dry years, soil CO2-C fluxes are usually lower than those in a wet year [27]. Over the period of our study (April–September 2012), the average monthly temperatures were higher than the corresponding multi-year averages (Figure 1). At the same time, the precipitation was lower than the respective multi-year averages (in May by 61.3%, in July by 77.4%, in August by 88.8% and in September 2.3-fold lower than in multi-years average). It suggests that the drought in the 2012 growing season has shaped the CO2-C emissions from the soil. The distribution of CO2-C with an emission peak in the summer and lower fluxes in the spring and autumn observed in our research correspond to the findings of numerous studies [12,20,24,25]. It seems that soil respiration in most locations has a pronounced seasonal pattern coinciding with periods of active plant growth. In our study, as a consequence of lower air temperature and absence of root respiration [20,25], the share of soil CO2-C emissions recorded during the maize emergence stage was low, and it did not exceed 8.3% of soil CO2-C emissions recorded in the study period. The soil CO2-C emissions observed during the maize leaves development stages (until 6–7-leaf stage) reached 30.9% of cumulative soil CO2-C emissions. The highest amount of CO2-C was emitted from the soil during the rapid crop development stage (from 8–9- to 15-leaf stage), attributable to the period between the second half of June and first decade of July. The share of CO2-C emissions in this period reached 37.9% of emissions recorded during the study period. Parejra-Sanchez et al. [20] recorded the highest CO2-C soil emissions during July and August, when maximum maize growth rate occurred. According to Adviento-Borbe et al. [25], CO2-C fluxes reached the maximum around the silking stage of maize. In our study, at the time of maize silking, in the second decade of July, no rapid increase in soil CO2-C emissions was observed. This phenomenon can be explained by a multi-relationship between the variables of temperature and soil moisture [12,20,28,29]. Ding et al. [30] reported that this relationship is significantly affected by soil temperature below 20 °C. Bogužas et al. [27] in Lithuanian climatic conditions showed that, when temperature increases above 18 °C, the intensity of CO2-C flux from loam soil starts to decline. Moreover, in both a humid continental climate of Nebraska (USA) and a semi-continental climate of Ontario (Canada) conditions, optimum soil moisture for CO2-C emissions from loam soil is in a range of 60–70% of water-filled pore space (WFPS). When WFPS decreases below 50%, it has no significant impact on soil CO2-C flux during the maize growing season [26,30]. Valuable data on the relationship between CO2-C emissions from the soil and the temperature and soil moisture were published by Francioni et al. [31]. In a study conducted on grasslands in the central Apennines in temperate-oceanic climate conditions, the soil moisture below the soil water content threshold was the key factor for soil respiration, whereas the soil temperature was the main driver of soil respiration at higher water content in the soil. In our research, at the maize silking stage (during the last week of July), air temperature exceeded 20 °C and (in the second half of July) soil WFPS fluctuated between 24% and 28% (Figure 2). CO2-C emissions from the soil, as well as air temperature and soil moisture, was described by a positive correlation coefficient, although soil WFPS during the maize growing season was lower than 40% (Table 2). Song et al. [28] reported that, in temperate humid/sub-humid continental climate in the Northeast of China, CO2-C flux from silty clay soil can be quantitatively described by a linear combination of soil moisture content and soil temperature 5 cm below ground. Sainju et al. [12] showed that, irrespective of climate conditions (semi-arid steppe climate of Eastern Montana, USA or continental climate of North Dakota, USA), the soil CO2-C flux was linearly related (R2 = 0.23–0.43, p ≤ 0.05) with both soil and air temperature. According to Adviento-Borbe et al. [25], seasonal variations in CO2-C emissions from silty clay soil in a humid continental climate of Nebraska (USA) were principally dependent on the temperature and soil water status associated with the precipitation and irrigation events. Bogužas et al. [27] found a strong and moderately strong correlation between the monthly amount of rainfall during the crop growing season and soil CO2-C flux (r = 0.70, p ≤ 0.01 and r = 0.61, p ≤ 0.05 in the first and the second season of the investigation, respectively). Soil and weather conditions could have limited the soil CO2-C emissions in our study during the pre-reproductive maize stages (from 17 leaf stages to the silking maize stage). Noteworthy, the share of soil CO2-C emissions during this period reached 12.3% of cumulative soil emissions. Soil CO2-C fluxes during the reproductive stages of the maize (between silking and maize harvest) were lower than in the prior maize development stages, and it did not exceed 7.3% of the cumulative CO2-C soil emissions. Low soil respiration occurring at the end of the maize growing season seem to be a pattern typical of this process. According to Amos et al. [26], the surface soil flux of CO2 decreased as the plants reached physiological maturity and senescence. In our study, the lowest CO2-C soil flux was observed at the beginning of the post-harvest period. It was followed by a slight increase in soil CO2-C emissions. The decomposition of crop residues in the soil provides a plausible explanation for this observation [25]. Flessa et al. [32] showed that 58% of produced CO2-C originated from maize residues. The share of CO2-C emitted in the post-harvest period, however, reached only 3.2% of CO2-C emission recorded during the study period. The variability of CO2-C emissions in subsequent maize growing stages might be related to the intensity of changes of heterotrophic and autotrophic soil respiration. According to Rochette et al. [33], who studied respiration of soil under maize cultivation at the Central Experimental Farm in the weather condition of Ontario (Canada), on the loam soil, even 50% of soil respiration could be the result of root respiration and decomposition of root exudates. In four high-yielding maize systems on silty clay loam soil in a humid continental climate of Nebraska (USA), Adviento-Borbe et al. [25] estimated that autotrophic respiration could have accounted for 24–36% of total soil respiration. The authors showed a significant effect of autotrophic respiration by testing soil CO2-C emissions between maize rows in comparison to those in rows. Row soil CO2-C flux was, on average, 64% higher than between row flux. Dencso et al. [34] also obtained higher soil CO2-C emissions in rows than between rows. This phenomenon can be explained by enhanced root respiration in the rows.
4.3. CO2-C Soil Emissions and Mineral Nitrogen Soil Content
The application of N-fertilizers leads to an increase in the content of both NO3−-N and NH4+-N in the soil (enhanced by manure mineralization). As a result of intensive nitrogen uptake by crops, a decrease in the soil content of mineral N is observed [35]. In the current study, temporal changes in mineral N soil content as a result of fertilization were generally approximate to those presented in the literature. The essential difference in the temporal patterns of soil NO3−-N and NH4+-N content in the soil, however, consisted in a rapid decrease in NH4+-N content found at the beginning of June, while a decrease in NO3−-N was observed at the end of August. Moreover, important differences in the patterns of NH4+-N and NO3−-N soil content were found during the second part of the growing season. After the peak of mineral N soil content subsequent to fertilization, further changes in mineral N content in manured soils usually show a lower amplitude [35]. In the current study, an increase in NH4+-N and NO3−-N soil content identified in autumn was comparable to that found during the first half of the growing season. The variability of soil content in both mineral N forms probably resulted from the rate of N-uptake by plants and microbial transformations of nitrogen compounds: nitrification and decomposition of organic matter. Our previous work evidenced that nitrification occurs even in acidic arable soils [36]. In the current study, intensive CO2-C emissions from soil were accompanied with high soil NO3−-N content in summer, and decreased in autumn with an increase in the content of both mineral N forms. Fertilization generally increased content of NO3−-N and NH4+-N in the soil, and led to higher autotrophic and heterotrophic respiration rate. Song et al. [28] showed that nitrogen fertilization with 150 kg N ha−1 increased by 14% CO2-C fluxes from silty clay soil in subtropical humid monsoon climate zone. As reported by Zhai et al. [15], in similar climate conditions, the application of manures and fertilizers at a rate of 300 kg N ha−1 increased the CO2-C emissions from red clay soil. A dose of 250 kg N ha−1, however, suppressed soil respiration. Ding et al. [29] also stated that nitrogen fertilization resulted in a reduction of CO2-C flux from a sandy loam soil in semiarid and subhumid monsoon climate. Pareja-Sánchez et al. [20] studied the influence of N-fertilization on CO2-C emissions from the silt loam soil in conventional, reduced, and no tillage cultivation systems in semiarid Mediterranean climate with a continental trend. Contrary to conventional tillage, nitrogen fertilization increased soil CO2-C emissions in reduced tillage and no tillage cultivation systems. Adviento-Borbe et al. [25] showed that seasonal variations in soil CO2-C fluxes depended less on soil NO3−-N than on other analyzed factors (temperature, moisture and crop residue). In our study, CO2-C soil fluxes were positively correlated with soil NO3−-N content. CO2-C emission from the soil was more strongly correlated with soil content of NO3−-N (product of nitrification) than with air temperature and soil moisture. This was confirmed by the regression analysis that highlighted the relationship between the soil respiration and soil content of NO3-N. (Figure 5). The relatively high correlation between CO2-C emission from the soil and NO3−-N soil content suggests that effective nitrification may be an indicator of soil conditions favorable for heterotrophic and autotrophic soil respiration. On the other hand, the negative correlation between soil CO2-C emission and NH4+-N soil content may mean that during the process of organic matter degradation, decomposers primarily use NH4+-N as a source of nitrogen. Plant roots, nitrifiers and decomposers can compete for NH4+-N in the soil, and content of this form of nitrogen can limit plant biomass production and soil heterotrophic respiration.
5. Conclusions
Under climate conditions of Central Poland in a year with a notable deficit of precipitation in May, July, August and September, the CO2-C soil emissions reached 3214.9 kg CO2-C ha−1 in the maize growing season and 106.8 kg CO2-C ha−1 in the post-harvest month. CO2 fluxes from the soil are the highest in the summer, coinciding with rapid maize development (8–15-leaf stage). CO2-C emissions from soil were more strongly correlated with the soil content of NO3-N than with the air temperature or soil moisture. Intensive nitrification of the soil, in dry season such as the one of 2012 could serve as an indicator of high CO2-C emissions from the soil. However, further studies are needed to confirm this finding. Decomposers may have preferred and probably intensively used soil NH4+-N in the organic matter degradation process and could compete with nitrifiers and maize roots for this resource of mineral nitrogen in the soil.
Author Contributions
Conceptualization, T.S.; methodology, T.S.; formal analysis, M.S.; writing—original draft preparation, T.S.; writing—review and editing, M.S.; and visualization, E.S. All authors have read and agreed to the published version of the manuscript.
Funding
This work was supported by the National Science Center, Poland
Conflicts of Interest
The authors declare no conflict of interest.
References
- Statista. Worldwide Production of Grain in 2018. Available online: https://www.statista.com/statistics/263977/world-grain-production-by-type/ (accessed on 4 June 2020).
- Agriculture, Forestry and Fisheries; Eurostat. Statistics Explained. Available online: https://ec.europa.eu/eurostat/statistics-explained/ (accessed on 4 June 2020).
- Rozkrut, D. Statistical Yearbook of Agriculture; Statistics Poland: Warsaw, Poland, 2020; pp. 1–439. (In Polish) [Google Scholar]
- Ranum, P.; Pena-Rosas, J.; Garcia-Casal, M.N. Global maize production, utilization, and consumption. Ann. N.Y. Acad. Sci. 2014, 1312, 105–112. [Google Scholar] [CrossRef] [PubMed]
- Król, A.; Księżak, J.; Kubińska, E.; Rozakis, S. Evaluation of sustainability of Maze cultivation in Poland. A prospect theory—PROMETHEE approach. Sustainability 2018, 1011, 426363. [Google Scholar]
- Oertel, C.; Matschullat, J.; Zurba, K.; Zimmermann, F.; Erasmi, S. Greenhouse gas emissions from soils—A review. Chem. Erde 2016, 76, 327–352. [Google Scholar] [CrossRef] [Green Version]
- Guo, L.B.; Gifford, R.M. Soil carbon stocks and land use change: A meta analysis. Glob. Chang. Biol. 2002, 8, 345–360. [Google Scholar] [CrossRef]
- Don, A.; Scholten, T.; Shulze, E.D. Conversion of cropland into grassland: Implication for soil organic carbon stocks in two soils with different texture. J. Plant Nutr. Soil Sci. 2009, 172, 53–62. [Google Scholar] [CrossRef]
- Ding, F.; Hu, Y.L.; Li, L.J.; Li, A.; Shi, S.; Lian, P.Y.; Zeng, D.H. Changes in soil organic carbon and total nitrogen stocks after conversion of meadow to cropland in Northeast China. Plant Soil 2013, 373, 1–2. [Google Scholar] [CrossRef]
- Tang, S.; Guo, J.; Li, S.; Li, J.; Xie, S.; Zhai, X.; Wang, C.; Zhang, Y.; Wang, K. Synthesis of soil carbon losses in response to conversion of grassland to agriculture land. Soil Tillage Res. 2019, 185, 29–35. [Google Scholar] [CrossRef]
- Paustian, K.; Six, J.; Elliott, E.T.; Hunt, H.W. Management options for reducing CO2 emissions from agricultural soils. Biogeochemistry 2000, 48, 147–163. [Google Scholar] [CrossRef]
- Sainju, U.; Jabro, J.D.; William, B.S. Soil carbon dioxide emissions and carbon content as affected by irrigation, tillage, cropping system and nitrogen fertilization. J. Environ. Qual. 2008, 37, 98–106. [Google Scholar] [CrossRef] [PubMed] [Green Version]
- Al-Kaisi, M.M.; Yin, X. Tillage and Crop residue effects on soil carbon and carbon dioxide emission in corn-soybean rotation. J. Environ. Qual. 2005, 342, 437–445. [Google Scholar] [CrossRef] [PubMed]
- Rutkowska, B.; Szulc, W.; Sosulski, T.; Skowrońska, M.; Szczepaniak, J. Impact of reduced tillage on emission from soil under maize cultivation. Soil Tillage Res. 2018, 180, 21–28. [Google Scholar] [CrossRef]
- Zhai, L.; Liu, H.; Zhang, J.; Huang, J.; Wang, B. Long-term application of organic manure and mineral fertilizer on N2O and CO2 emissions in a red soil from cultivated maize-wheat rotation in China. Agric. Sci. China 2011, 1011, 1748–1757. [Google Scholar] [CrossRef]
- Norberg, L.; Berglund, Ö.; Berglund, K. Seasonal CO2 emission under different cropping systems on Histosols in Southern Sweden. Geoderma Reg. 2016, 2016. 7, 338–345. [Google Scholar] [CrossRef]
- Dhadli, H.S.; Brar, B.S.; Black, T.A. Influence of crop growth and weather variables on soil CO2 emissions in a maize-wheat cropping system. Agric. Res. J. 2015, 52, 28–34. [Google Scholar] [CrossRef]
- VIEP (Voivodeship Inspectorate of Environmental Protection). Environmental State in the Masovian Voivodeship in 2012; Environment Report; VIEP: Warsaw, Poland, 2013; pp. 1–173. (In Polish) [Google Scholar]
- Burton, D.L.; Zebarth, B.J.; Gillam, K.M.; MacLeod, J.A. Effect of split application of fertilizer nitrogen on N2O emissions from potatoes. Can. J. Soil Sci. 2008, 88, 229–239. [Google Scholar] [CrossRef] [Green Version]
- Pareja-Sánchez, E.; Cantero-Martinez, C.; Alvaro-Fuentes, J.; Plaza-Bonilla, D. Tillage and nitrogen fertilization in irrigated maize: Key practices to reduce soil CO2 and CH4 emission. Soil Tillage Res. 2019, 191, 29–36. [Google Scholar] [CrossRef]
- Aslam, T.; Choudhary, M.A.; Saggar, S. Influence of land-use management on CO2 emissions from a silt loam soil in New Zealand. Agric. Ecosyst. Environ. 2000, 77, 257–262. [Google Scholar] [CrossRef]
- Sosulski, T.; Korc, M. Effects of different mineral and organic fertilization on the content of nitrogen and carbon in soil organic matter fractions. Ecol. Chem. Eng. A 2011, 18, 601–609. [Google Scholar]
- Sosulski, T.; Szara, E.; Stępień, W.; Szymańska, M. Nitrous oxide emissions from the soil under different fertilization systems on a long-term experiment. Plant Soil Environ. 2014, 60, 481–488. [Google Scholar] [CrossRef] [Green Version]
- Abdalla, M.; Hastings, A.; Helmy, M.; Prescher, A.; Osborne, B.; Lanigan, G.; Forristal, D.; Killy, D.; Maratha, P.; Williams, M.; et al. Assessing the combined use of reduced tillage and cover crops for mitigating greenhouse gas emissions from arable ecosystem. Geoderma 2014, 223–225, 9–20. [Google Scholar] [CrossRef]
- Adviento-Borbe, M.A.A.; Haddix, M.L.; Binder, D.L.; Walters, D.T.; Dobermann, A. Soil greenhouse gas fluxes and global warming potential in four high-yielding maize systems. Global Chang. Biol. 2007, 13, 1972–1988. [Google Scholar] [CrossRef]
- Amos, B.; Arkebauer, T.J.; Doran, J.W. Soil surface fluxes of greenhouse gases in an irrigated maize-based agroecosystem. Soil Sci. Soc. Am. J. 2005, 69, 387–395. [Google Scholar] [CrossRef] [Green Version]
- Bogužas, V.; Sinkevičienė, A.; Romaneckas, K.; Steponavičienė, V.; Skinulienė, L.; Butkevičienė, L.M. The impact of tillage intensity and meteorological conditions on soil temperature, moisture content and CO2 efflux in maize and spring barley cultivation. Zemdirbyste 2018, 105, 307–314. [Google Scholar] [CrossRef] [Green Version]
- Song, C.; Zhang, J. Effects of soil moisture, temperature, and nitrogen fertilization on soil respiration and nitrous oxide emission during maize growth period in northeast China. Acta Agric. Scand. B 2009, 59, 97–106. [Google Scholar] [CrossRef]
- Ding, W.; Cai, Y.; Cai, Z.; Yagi, K.; Zheng, X. Soil Respiration under Maize Crops: Effects of Water, Temperature, and Nitrogen Fertilization. Soil Biol. Biochem. 2007, 71, 944–951. [Google Scholar] [CrossRef]
- Ding, W.; Meng, L.; Yin, Y.; Cai, Z.; Zheng, X. CO2 emission in an intensively cultivated loam as affected by long-term application of organic manure and nitrogen fertilizer. Soil Biol. Biochem. 2007, 39, 669–679. [Google Scholar] [CrossRef]
- Francioni, M.; Trozzo, L.; Toderi, M.; Baldoni, N.; Allegrezza, M.; Tesei, G.; Kishimoto-Mo, A.W.; Foresi, L.; Santilocchi, R.; D’Ottavio, P. Soil respiration dynamics in Bromus erectus-dominated grasslands under different management intensities. Agriculture 2020, 10, 9. [Google Scholar] [CrossRef] [Green Version]
- Flessa, H.; Ludwig, B.; Heil, B.; Merbah, W. The origin of soil organic C, dissolved organic C and respiration in a long-term maize experiment in Halle, Germany, determined by 13C natural abundance. J. Plant Nutr. Soil Sci. 2000, 163, 157–163. [Google Scholar] [CrossRef]
- Rochette, P.; Flanagan, L.B.; Gregorich, E.G. Separating soil respiration into plant and soil components using analyses of the natural abundance of carbon-13. Soil Sci. Soc. Am. J. 1999, 63, 1207–1213. [Google Scholar] [CrossRef]
- Dencso, M.; Gelybó, G.; Kása, I.; Pokovai, K.; Potyó, I.; Horel, Á.; Birkás, M.; Takács, T.; Tóth, E. Effect of different management systems on soil CO2 emission and plant growth in a maize field. In Proceedings of the 19th EGU General Assembly, EGU2017, Vienna, Austria, 23–28 April. Geophys. Res. Abstr. 2017, 19, 7727. [Google Scholar]
- Sosulski, T.; Szara, E.; Stępień, W.; Rutkowska, B. The influence of mineral fertilization and legumes cultivation on the N2O soil emissions. Plant Soil Environ. 2015, 12, 529–536. [Google Scholar] [CrossRef]
- Sosulski, T.; Szara, E.; Stępień, W.; Szymańska, M. Impact of liming management on N2O emissions from arable soils in three long-term fertilization experiments in Central Poland. Fresenius Environ. Bull. 2016, 25, 6111–6119. [Google Scholar]
Figure 1.
Climatic conditions in the Mazovia Province in 2012 and multi-year average climatic conditions (1921–2012).
Figure 1.
Climatic conditions in the Mazovia Province in 2012 and multi-year average climatic conditions (1921–2012).

Figure 2.
Daily average temperature and soil moisture (% water-filled pore space - WFPS).

Figure 3.
Content of NO3−-N and NH4+-N in the soil.

Figure 4.
CO2-C emissions from the soil.

Figure 5.
Relationship between the variations in the soil respiration and: NO3−-N content (a); NH4+-N soil content (b); atmospheric temperature (Ta) (c); and soil moisture (WFPS) (d). * p < 0.05.
Figure 5.
Relationship between the variations in the soil respiration and: NO3−-N content (a); NH4+-N soil content (b); atmospheric temperature (Ta) (c); and soil moisture (WFPS) (d). * p < 0.05.


Table 1.
Average CO2-C soil emissions and NO3−-N and NH4+-N content in the soil.
| Statistics | CO2 Soil Emissions (mg C m−2 h−1) | Soil Content | |
|---|---|---|---|
| NO3−-N | NH4+-N | ||
| mg N kg−1 | |||
| Mean ± SD | 84.58 ± 72.37 | 9.01 ± 5.01 | 6.70 ± 3.67 |
| Median | 58.01 | 10.15 | 6.78 |
| Min–max | 3.63–302.31 | 1.26–17.37 | 1.28–14.17 |
SD—standard deviation.
Table 2.
Correlation coefficients (at p < 0.05) between CO2-C emission from arable soils and atmospheric temperature (Ta), soil moisture (%WFPS), NO3−-N and NH4+-N soil content.
Table 2.
Correlation coefficients (at p < 0.05) between CO2-C emission from arable soils and atmospheric temperature (Ta), soil moisture (%WFPS), NO3−-N and NH4+-N soil content.
| Parameter | Ta | WFPS | NO3−-N | NH4+-N |
|---|---|---|---|---|
| CO2-C | 0.52 | 0.36 | 0.64 | −0.67 |
| Ta | 1.00 | 0.24 | 0.45 | −0.56 |
| WFPS | 0.24 | 1.00 | 0.53 | −0,40 |
| NO3−-N | 0.45 | 0.53 | 1.00 | −0.60 |
| NH4+-N | −0.56 | −0.40 | −0.60 | 1.00 |
Table 3.
Daily CO2-C soil emissions during four essential periods of maize development.
| Maize Stages | Date | CO2 Soil Emissions | Min–Max | Variation Coefficient (V%) | Fractals 25, 75 | |
|---|---|---|---|---|---|---|
| Mean ± SD | Median | |||||
| kg C ha−1 day−1 | ||||||
| Emergence | 29.04–13.05 | 12.8 ± 2.66 | 12.5 | 9.22–17.99 | 20.76 | 10.5–15.0 |
| Leaves Development Stages | 14.05–16.06 | 30.8 ± 12.3 | 31.0 | 11.66–58.83 | 39.87 | 21.9–35.7 |
| Fast Development Stages | 17.06–14.07 | 45.8 ± 13.2 | 49.2 | 14.71–61.94 | 28.84 | 41.6–56.4 |
| Pre-reproductive Stages | 15.07–11.08 | 14.9 ± 1.9 | 14.7 | 10.93–18.21 | 12.93 | 13.3–16.6 |
| Reproductive Stages | 12.08–08.09 | 8.8 ± 2.4 | 9.2 | 3.91–12.70 | 26.59 | 7.1–10.7 |
| Post-harvest Period | 09.09–30.09 | 4.9 ± 1.0 | 5.0 | 2.90–5.99 | 20.92 | 4.1–5.9 |
SD—standard deviation.
Table 4.
Cumulative CO2-C soil emissions during essential stages of growing maize season (sowing–harvest) and study period.
Table 4.
Cumulative CO2-C soil emissions during essential stages of growing maize season (sowing–harvest) and study period.
| Maize Stages | Date | Average Emissions ± SD | Min–Max | Variation Coefficient (V%) |
|---|---|---|---|---|
| kg CO2-C ha−1 | ||||
| Emergence | 29.04–13.05 | 282.3 ± 18.3 | 263.33–299.86 | 6.49 |
| Leaves Development Stages | 14.05–16.06 | 1046.6 ± 44.7 | 999.84–1088.91 | 4.27 |
| Fast Development Stages | 17.06–14.07 | 1282.5 ± 145.0 | 1128.66–1416.76 | 11.31 |
| Pre-reproductive Stages | 15.07–11.08 | 416.5 ± 62.2 | 344.94–457.92 | 14.94 |
| Reproductive Stages | 12.08–08.09 | 247.4 ± 21.6 | 222.86–263.69 | 8.75 |
| Post-harvest Period | 09.09–30.09 | 106.8 ± 10.4 | 100.64–118.84 | 9.75 |
| Sowing-harvest | 29.04–09.30 | 3214.9 ± 233.2 | 2957.0–3411.1 | 7.25 |
| Study Period | 22.04–30.09 | 3382.1 ± 206.3 | 3155.83–2559.6 | 6.10 |
SD—standard deviation.
© 2020 by the authors. Licensee MDPI, Basel, Switzerland. This article is an open access article distributed under the terms and conditions of the Creative Commons Attribution (CC BY) license (http://creativecommons.org/licenses/by/4.0/).
Share and Cite
MDPI and ACS Style
Sosulski, T.; Szymańska, M.; Szara, E. CO2 Emissions from Soil Under Fodder Maize Cultivation. Agronomy 2020, 10, 1087. https://doi.org/10.3390/agronomy10081087
AMA Style
Sosulski T, Szymańska M, Szara E. CO2 Emissions from Soil Under Fodder Maize Cultivation. Agronomy. 2020; 10(8):1087. https://doi.org/10.3390/agronomy10081087
Chicago/Turabian StyleSosulski, Tomasz, Magdalena Szymańska, and Ewa Szara. 2020. "CO2 Emissions from Soil Under Fodder Maize Cultivation" Agronomy 10, no. 8: 1087. https://doi.org/10.3390/agronomy10081087
Note that from the first issue of 2016, this journal uses article numbers instead of page numbers. See further details here.