Article

Evidence of the Role of QTL Epistatic Interactions in the Increase of Melon Fruit Flesh Content during Domestication

by
Chaymaa Riahi
1,†,
Juan Luis Reig-Valiente
1,‡,
Belén Picó
2,
Aurora Díaz
1,3,4,
Maria José Gonzalo
1,* and
Antonio José Monforte
1,*
1
Instituto de Biología Molecular y Celular de Plantas (IBMCP), Universitat Politècnica de València (UPV)-Consejo Superior de Investigaciones Científicas (CSIC). Ingeniero Fausto Elio s/n, 46022 Valencia, Spain
2
Instituto de Conservación y Mejora de la Agrodiversidad Valenciana, Universitat Politècnica de València (COMAV-UPV), Avenida de los Naranjos s/n, 46011 Valencia, Spain
3
Unidad de Hortofruticultura, Centro de Investigación y Tecnología Agroalimentaria de Aragón (CITA), Avda. Montañana 930, 50059 Zaragoza, Spain
4
Instituto Agroalimentario de Aragón IA2 (CITA-Universidad de Zaragoza), 50059 Zaragoza, Spain
*
Authors to whom correspondence should be addressed.
Current address: Centro de Protección Vegetal y Biotecnología, Instituto Valenciano de Investigaciones Agrarias (IVIA), Carretera CV-315, Km 10,7, 46113 Moncada, Valencia, Spain.
Current address: Department of Plant Biology, Swedish University of Agricultural Sciences and Linnean Center for Plant Biology, 75007 Uppsala, Sweden.
Agronomy 2020, 10(8), 1064; https://doi.org/10.3390/agronomy10081064
Submission received: 16 June 2020 / Revised: 16 July 2020 / Accepted: 20 July 2020 / Published: 23 July 2020

Abstract

:
Cultivated melon was domesticated from wild melons, which produce small fruits with non-edible fruit flesh. The increase in fruit flesh is one of the major domestication achievements in this species. In previous work, a quantitative trait locus (QTL) on chromosome 6 (paqt6.1) linked to fruit flesh content was detected in a cross between cultivated (“Piel de Sapo”, PS) and wild (Ames 24294, TRI) accessions. The QTL was introgressed into the PS background, generating the TRI_6-3 introgression line (IL) that confirmed the effects of paqt6.1. The primary objective of this work was to fine-map paqt6.1 as the first step for the map-based cloning. Two different approaches were carried out; however, the results were not consistent, precluding the fine mapping of paqt6.1. TRI_6-3 and other related ILs were genotyped by genotyping-by-sequencing, finding additional introgressions in other chromosomes. In an F2 population from TRI_6-3-x-PS, we found an epistatic interaction between paqt6.1 and another locus on chromosome 11. The interaction was verified in advanced populations, suggesting that the effects of paqt6.1 are conditioned by the allelic composition at another locus in chromosome 11. Both loci should have TRI alleles to reduce the flesh content in the PS background. The implications on the history of melon domestication are discussed.

1. Introduction

The melon (Cucumis melo L.) is an important horticultural species that belongs to the Cucurbitaceae family, which includes crops such as the cucumber (Cucumis sativus L.), watermelon (Citrullus lanatus Thumb.), pumpkin, squash, and gourd (Cucurbita ssp.). Currently, the melon is cultivated worldwide, and has a high economic value in temperate and tropical countries, not only for self-consumption but also as a product for export.
C. melo includes cultivated and wild forms, with a large phenotypic diversity among the cultivated ones. Pitrat [1] proposed a thorough horticultural classification of melon accessions and varieties based on flowers, fruit morphology, exocarp, mesocarp, placenta, seed, fruit development and postharvest behavior traits. Nineteen groups were defined, one of them strictly wild (agrestis), two of them semi-domesticated or feral (kachri and chito) and sixteen domesticated and cultivated ones. The diversity found in the cultivated melon was a result of a divergent human selection after domestication from wild melons [2].
Cucurbitaceae likely originated in Asia in the Late Cretaceous period [3]. This family spread to Africa, Europe, America and Oceania (Australia, New Zealand). Different species evolved because of adaptation to diverse habits, and even transoceanic dispersal occurred in some species. Thus, Luffa spp. (most likely of Asian origin [4]) is also found in America and Australia [5,6,7]. Lagenaria spp., of African origin, is known to have arrived in Central America with sea currents and/or human migration before domestication [8,9]. The genus Citrullus (watermelon) originated in Africa, although wild forms are also found in Asia [10]. The species of the American Cucurbita genus (pumpkins, squashes, gourds), however, were not found outside of America before 1492 [11]. The Cucumis genus diverged from African relatives around 11.9 Ma. Currently, wild Cucumis species can be found in nature in Africa, Asia and Australia. While there is a scientific consensus that the cucumber (C. sativus L.) originated in India, the origin of the melon (C. melo L.) has been under debate. Molecular phylogenetic analysis supports an Asian/Australian origin [12]. The Australian species C. pricocarpus F. Muell. is the closest wild species to C. melo, although recently, Endl et al. [13] found the Indian species C. trigonus Roxb. as close to C. melo as C. pricocarpus.
As stated before, wild and cultivated C. melo coexist nowadays. Wild melons can be found mostly in central Asia, Australia and Sub-Saharan Africa. African wild melons are found in a cluster that is separated from Asian/Australian wild melons [13], defining a new subspecies, C. melo subsp. meloides. The tibish horticultural group, which includes traditional melon varieties from Sudan and surrounding countries, is closely related to accession of C. melo subsp. meloides [2,14,15], whereas traditional Indian varieties are related to wild Indian accessions [14,15,16]. These data suggest at least two domestication events, one in Africa and one in Asia [13,15]. Additionally, two independent domestication events could have also occurred in Central Asia, giving rise to Oriental and Occidental varieties by diversifying selections [2,15]. The history of melon domestication seems to be, therefore, quite complex. Genetic exchange between wild and cultivated melons still occurs in the primary centers of diversity [2,16]. Additionally, cultivated melons have returned to the wild, such as the feral chito group [1].
Regardless of the origin (Africa, Asia or Australia), wild melons share some morphological and reproductive characteristics, such as being monoecious, and having small leaves, very small fruits (20–50 g), very thin and light green flesh, no cavity, no aroma, very small seeds and long shelf life. Cultivated melons, on the other hand, show a tremendous phenotypic diversity for all those traits. Some of the traits that can be found in all cultivated melons that clearly distinguish them from wild forms are larger fruits, thicker flesh, reduced or absence of bitter taste, and large leaves [1]. Therefore, these traits are considered as the major domestication traits for this species.
Díaz et al. [17] investigated the genetics of several domestication traits in a cross between the Spanish cultivar “Piel de Sapo” (PS) and the wild melon accession Ames 24294 (TRI), previously classified as C. trigonus, although it belongs to the C. melo species [18]. Several quantitative trait loci (QTLs) were detected for fruit weight and flesh thickness. Among them, QTLs for fruit weight in chromosomes 4, 6 and 8 (fwqt4.1, fwqt6.1 and fwqt8.1, respectively) and for fruit flesh content in chromosome 6 (paqt6.1) were verified in advanced backcross populations and introgression lines (ILs) in the PS background including those QTLs from TRI. Interestingly, Zhao et al. [15] also found a reduction of nucleotide diversity in cultivated compared with wild melons in the genomic region where those QTL mapped to. Therefore, those QTLs are candidates as the targets of human selection during melon domestication.
The next step was to try to identify the causal genes underlying the domestication QTLs, as has been completed before in other crops such as maize [19], rice [20] and tomato [21]. In this report, we present our efforts to fine map paqt6.1 for subsequent map-based cloning. However, the fine mapping results were inconsistent, making it impossible to narrow down the position of the QTL. We followed several strategies and we found that the reason for the inconsistent results was the existence of epistatic interactions with loci in the genetic background that changed the effects of paqt6.1 across the different experiments. These results have an important implication for further studies related to the genetics of domestication in melon.

2. Materials and Methods

2.1. Plant Material

All segregating populations and ILs analyzed in the current study derived from advanced backcross populations from the cross between the Spanish cultivar “Piel de Sapo” (PS) and the wild accession Ames 24294 (TRI) obtained from the North Central Regional Plant Introduction Station (Ames, IA, USA).
The segregating population 14M2-F2 was obtained by self-fertilizing the advanced backcross plant 12M81-13 carrying a heterozygous introgression in chromosome 6 from marker AI_19-F11 (approximately in the middle of the chromosome) to the end of the chromosome, covering the confidence interval of paqt6.1. The TRI_6-3 introgression line was obtained by self-fertilizing one of the plants from the 12M125 family used by Díaz et al. [17] to verify paqt6.1. ILs with different recombinant points in the paqt6.1 QTL (TRI_6-1, TRI_6-2, TRI_6-4, TRI_6-5 and TRI_6-6) were developed by identifying recombination in the region in different advanced backcross families and fixing the recombination by self-fertilization. The pedigree of all material is depicted in Supplementary Figure S1. The segregating population TRI_6-3F-2 was an F2 from the cross between TRI_6-3 and PS. Different homozygous plants for the introgressions in chromosomes 6 and 11 (see Results section) from the TRI_6-3-F2 population were self-fertilized to obtain families with different allelic composition at the introgressions (chromosome 6, chromosome 11): 18M55 (PS, PS), 18M56 (TRI, PS), 18M57 (TRI, TRI), 18M60 (PS, TRI).

2.2. Genotyping

DNA was obtained according to Doyle et al. [22] with slight modifications for extraction in 96-well plates [17]. Populations 14M2 and TRI_6-3-F2 were genotyped using the Agena Bioscience iPLEX Gold MassARRAY at the Sección de Epigenética y Genotipado, Unidad Central de Investigación (University of Valencia, Valencia, Spain) with the respective single nucleotide polymorphism (SNP) plexes obtained from previous works [2,14,23] (9 and 12 SNPs, respectively, Supplementary Table S1). Additional genotyping was performed by High Resolution Melting, designing new primers in the same SNP-flanking sequences and using the MeltDoctorTM Master Mix (Thermo Fisher Scientific, Waltham, MA, USA). All ILs, together with the parents, PS and TRI, were genotyped by genotyping-by-sequencing (GBS) by LGC Genomics GmbH (Germany) following the procedure reported by Elshire et al. [24]. Briefly, DNA was digested with the restriction enzyme ApeK I and barcoded libraries were prepared by accession and sequenced on an Illumina HiSeq 2000 platform. SNPs were extracted using TASSEL-GBS Discovery/Production pipeline (https://bitbucket.org/tasseladmin/tassel-5-source/wiki/Tassel5GBSv2Pipeline). Only SNPs, not indels, with a minimum read depth of three were retained. Chromosomal assignment and position of SNPs on the physical map were deduced from the melon reference genome (version 3.5.1) at https://www.melonomics.net/ [25].

2.3. Experimental Designs

Three hundred and thirty 14M2-F2 seedlings were screened with SNP markers PS_19-b07 and a_38-f04 located in the chromosome 6 region where paqt6.1 was mapped. Recombinants were transplanted, together with six plants of PS, to a greenhouse at the Polytechnic University of Valencia (UPV) and genotyped with SNPs located between the above markers (Supplementary Table S1). Flowers were hand pollinated, allowing for a maximum of two fruits per plant.
TRI6-1 to TRI6-5 were evaluated at the Centro de Investigación y Tecnología Agroalimentaria de Aragón (CITA) in Zaragoza in 2016 in an open field with a completely random design of six plots of two plants per IL and 10 plots for PS. Additionally TRI6-6 and PS were evaluated in the greenhouses of Centro de Experiencias de Cajamar (Paiporta, Spain) with a completely randomized design with 10 replicates for each of them.
Two hundred seedlings of the TRI_6-3-F2 population were genotyped with SNP markers for the chromosome 6 and 11 introgressions (Supplementary Table S1). Plants with different combinations of homozygous genotypes at the chromosome 6 and 11 introgressions were selected and transplanted to the UPV greenhouse. Flowers were hand pollinated, allowing a maximum of two fruits per plant.
Progeny from single TRI_6-3-F2 plants having different allelic combination for the introgressions were selected for evaluation in the greenhouses from the Centro de Experiencias de Cajamar (Paiporta, Spain). Eight replicates from each selected progeny (18M55, 18M56, 18M57, 18M60) and TRI_6-3 and ten replicates from PS were randomized in the greenhouse and pollinated by bumblebees, keeping two fruit per plant.
Fruit weight (FW) was recorded for each fruit. Fruit were cut longitudinally and scanned. Digital images were used to calculate pericarp thickness (PT, ratio of the average length of pericarp along X and Y axes to the maximum height and maximum width), pericarp area (PA, relative pericarp area, excluding the placenta, to the total fruit area) and fruit shape (FS, ratio of the maximum height to the maximum width) with Tomato Analyzer 3.0 [26].

2.4. Data Analysis

A linkage map of the 14M2-F2 population was calculated with MAPMAKER 3.0 [27] with the Kosambi map function [28]. Based on data collected from single F2 plants, a composite interval QTL analysis [29] was carried out with Windows QTL Cartographer 2.5 [30], and a logarithm of odds (LOD) score threshold for p < 0.05 was calculated by a permutation test with 1000 resamplings.
TRI_6-1 to TRI_6-6, as well as 18M55 to 18M60 trait means were compared with control PS means with a Dunnett’s test at p < 0.05 to determine which ILs could include QTLs involved in the fruit morphology traits. 18M56 and 18M57 were compared with a t-test to check differences among these families for those traits.
The association between chromosomes 6 and 11 introgressions and the studied traits in the TRI_6-3-F2 experiment were assessed with an analysis of variance (ANOVA):
Yij = µ + SNPj + eij
where µ is the population mean, SNPj is the genotype for the SNP (P, homozygous for PS, T, heterozygous for TRI), eij the error
Interactions between introgressions were investigated with a two-way ANOVA.
Yijk = µ + CHR6j + CHR11k + CHR6*CHR11jk + eijk,
where CHR6j is the genotype for chromosome 6 (P, T), CHR11j is the genotype for chromosome 11 (P, T) and CHR6*CHR11jk the interaction.
All these analyses were performed with JMP 12.1.0 (SAS Institute, Cary, NC, USA).

3. Results

3.1. QTL Analysis in the 14M2-F2 Population

Three hundred and thirty seedlings belonging to the 14M2-F2 family were screened with SNP markers PS_19-b07 and a_38-f04. One hundred and thirty seedlings showed recombination between those markers. Recombinants were genotyped with seven additional SNPs distributed between the flanking markers (Supplementary Table S1). A genetic map was obtained with a total distance of 20.26 cM. The physical distance between flanking markers was 3143 kb. The ratio between physical and genetic distance was 155.13 kb/cM. The ratio was not constant throughout the regions, ranging from 229.13 kb (between Sca21-4509984 and Sca21-3371186) to 13.62 kb (between Sca21-2506312 and a_38-f04). Nevertheless, both physical and genetic maps were colinear.
The 14M2-F2 means for FS, PA and PT were similar to PS, but the FW mean was lower (Table 1). The coefficient of variation was clearly higher in 14M2-F2 compared with PS for FS and FW, but similar for PA and PT.
Table 2 shows the results of the QTL analysis. Two QTLs were found, for FS and FW, with maximum LOD peaks at opposite regions within the introgression, suggesting that the effects on those traits are controlled by different linked QTLs. For both QTLs, TRI alleles reduced the value of the trait (as expected according to [17]). The gene action was additive and the percentage of variance explained by the QTLs was relatively modest (R2 ≈ 10%). Unexpectedly, no significant association was found for PA and PT. This lack of association could be due to several reasons, such as the occurrence of QTL–x-environment interaction or to the fact that the TRI introgression segregating in 14M2-F2 population did not include paqt6.1. Therefore, a different strategy was pursued for further studying the paqt6.1 effects, as described in the next section.

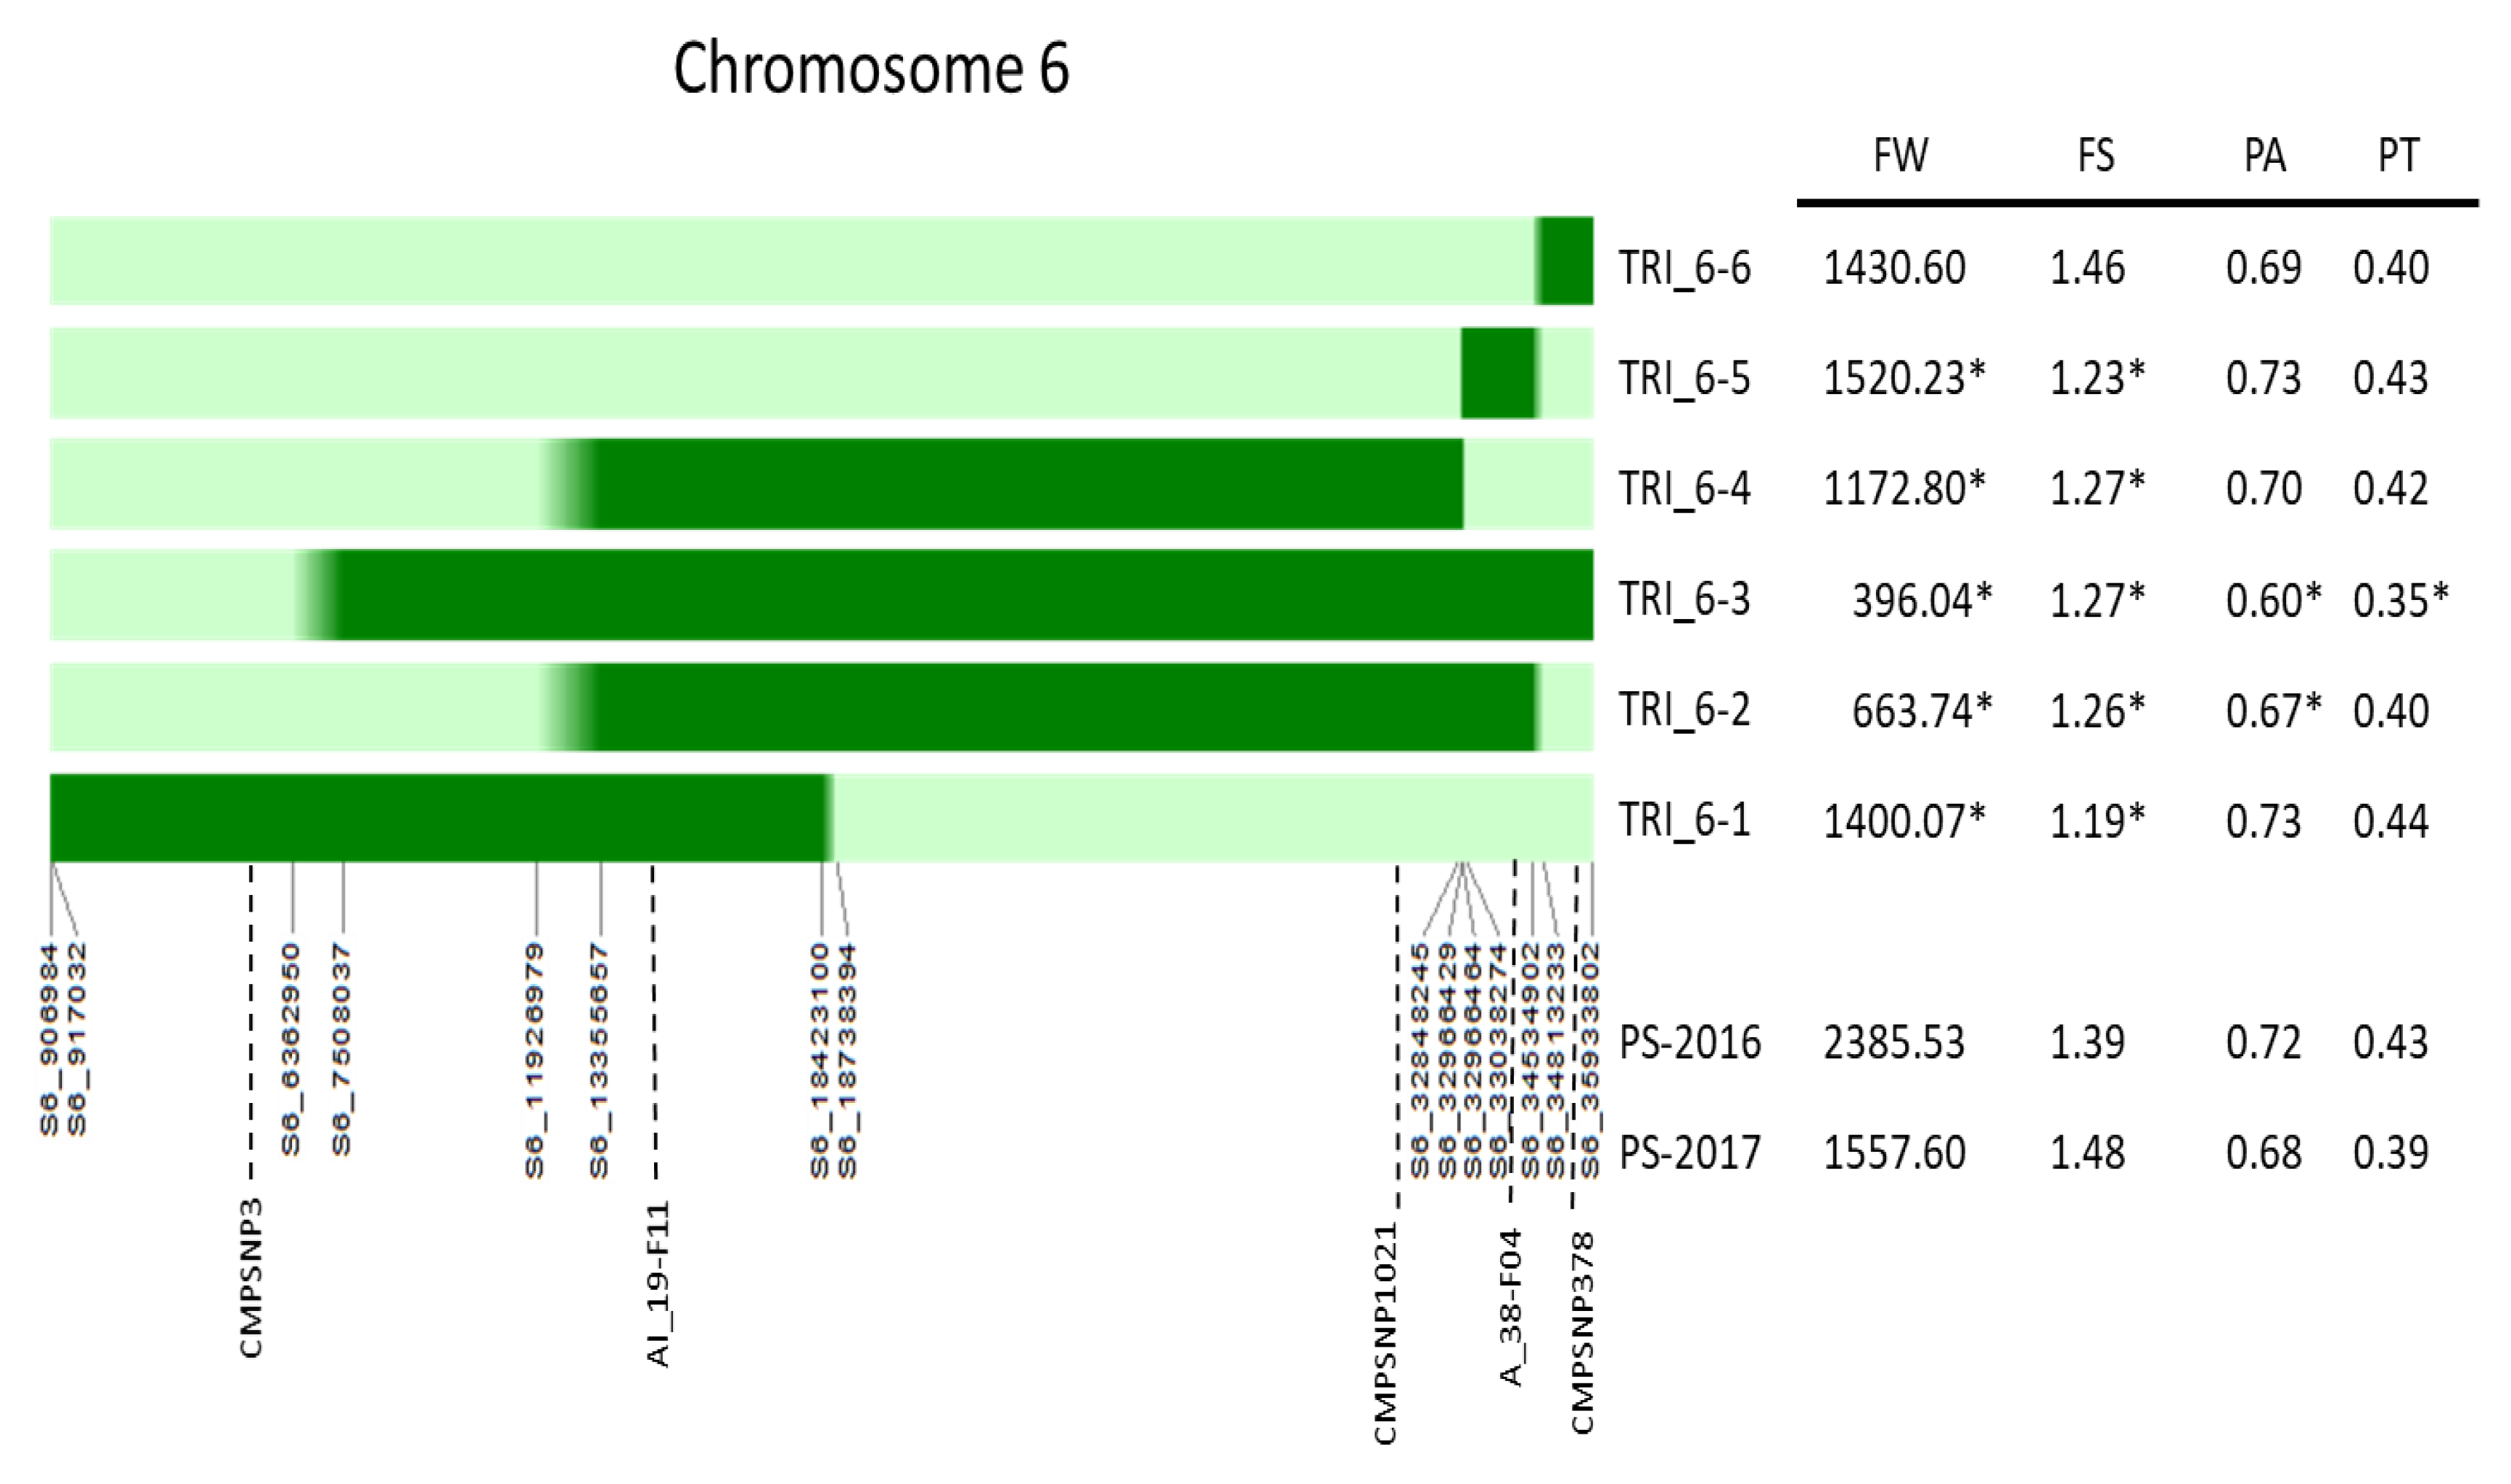
3.2. Analysis of Recombinant Introgression Lines

Five advanced backcross lines, with homozygous TRI introgressions with different recombination events along chromosome 6, were obtained through several rounds of marker assisted selection from advanced backcross populations (TRI_6-1, TRI_6-2, TRI_6-4, TRI_6-5, TRI_6-6). Additionally, the IL TRI_6-3 previously developed by Díaz et al. (2017) was also used to verify the effects of paqt6.1. The extend of the introgressions was verified by GBS. The introgressions covered most of chromosome 6, from position 0.90 Mb to the end of the chromosome, and the length of the introgressions ranged from 1.40 to 29.5 Mb (Figure 1).
TRI6-1 to TRI6-5 significantly reduced FW and FS, consistent with previous results (Díaz et al. 2017) and those found in the 14M2-F2 experiment. In the case of FW, strong differences were also found among ILs, ranging from 396 g to 1520 g (PS FW mean was 2385 g in 2016). These differences may reflect the presence of multiple FW QTLs in chromosome 6. Assuming that there could be two QTLs at the two ends of the region shown in Figure 1, TRI_6-1 and TRI_6-4 may include one QTL and TRI_6-5 the other one. Each QTL would induce a reduction of around 40% of FW, while TRI_6-2, TRI_6-3 would contain the two suggested QTLs resulting in a reduction of around 80%. Regarding FS, the results are similar, also likely reflecting the presence of multiple QTLs in the chromosome, although perhaps in this case, each introgression line (TRI_6-1 to TRI_6-5) would only have one of them, reducing around 10% of FS. The PA means of TRI_6-2 and TRI_6-3 were statistically different than the PS mean, which would confirm the presence of paqt6.1 in chromosome 6. However, other ILs with overlapping introgressions with those ILs did not show any effect on PA, making it impossible to determine the position of paqt6.1 by substitution mapping. This result also suggested that PA may be controlled by more than one QTL in this IL set. Lastly, TRI_6-6 did not show effects on any trait, what suggests that there is no QTL for the studied fruit morphology traits in the introgession at the end of the chromosome, assuming no QTL–x-E interaction.
GBS data also showed that the ILs had from three to six additional introgressions, expanding from 5 to 44 Mb, representing between 1 and 4% of the melon genome (Supplementary Table S2). Therefore, it is possible that some of the observed effects were caused by QTLs located in other chromosomes. In order to solve this controversy, a new approach was followed as described in the next section.

3.3. Effects of Other Genomic Regions on Flesh Content

The IL TRI_6-3 has shown strong effects on PA in the current and previous [17] reports. According to GBS results, TRI_6-3 harbors four additional introgressions on chromosomes 1, 4, 7 and 11 that in the previous experiments [17] were not associated with PA. We selected this IL to further study if other genomic regions on different chromosomes could also be affecting this trait and complicating the genetic analysis. The introgressions on chromosomes 1 and 7 are relatively small (2.5 and 0.5 Mb, respectively). The extension of introgression on chromosome 4 is 24.8 Mb (from positions 2.3 to 27.1 Mb), overlapping most of it with the centromere, which expands approximately from positions 5.5 to 23.0 Mb [31]. On the other hand, the 13.1 Mb introgression on chromosome 11 (from positions 18.3 to end of the chromosome) is located entirely in euchromatin. Given that the genes in euchromatin are usually more expressed (and therefore with more biological impact) than genes in the heterochromatin, we chose the chromosome 11 introgression to explore additional effects on PA and PT in the next experiments.
Thirty three plants with different combinations for the four double homozygous combinations (PS/PS, PS/TRI, TRI/PS, TRI/TRI, chromosome 6 and 11, respectively) were selected from the TRI_6-3-F2 population (approximately eight plants per each genotypic combination). Table 3 depicts the distribution of FW, PA and PT in the 33 TRI_6-3-F2 plants and the recurrent PS parent. TRI_6-3-F2 plants showed a wide distribution for FW, PA and PT. The segregation of that region in chromosome 6 was strongly associated with FW (Table 3), in agreement with all previous experiments. However, no significant association with PA nor PT was found. Interestingly, the joint analysis of both introgressions suggested a possible interaction between introgressions for PA (p = 0.07), a significant one (p < 0.05) for PT (Figure 2), but not for FW. The effects of the chromosome 6 introgression on PT were evident only when chromosome 11 was homozygous for TRI alleles, indicating the presence of a locus in chromosome 11 without major effects but interacting epistatically with the QTL on chromosome 6. Additional introgressions also segregating in the TRI_6-3-F2 population (see above) might also have a role on the control of pericarp thickness either directly or by epistatic interaction with paqt6.1, although this possibility was not checked in the current experiment.

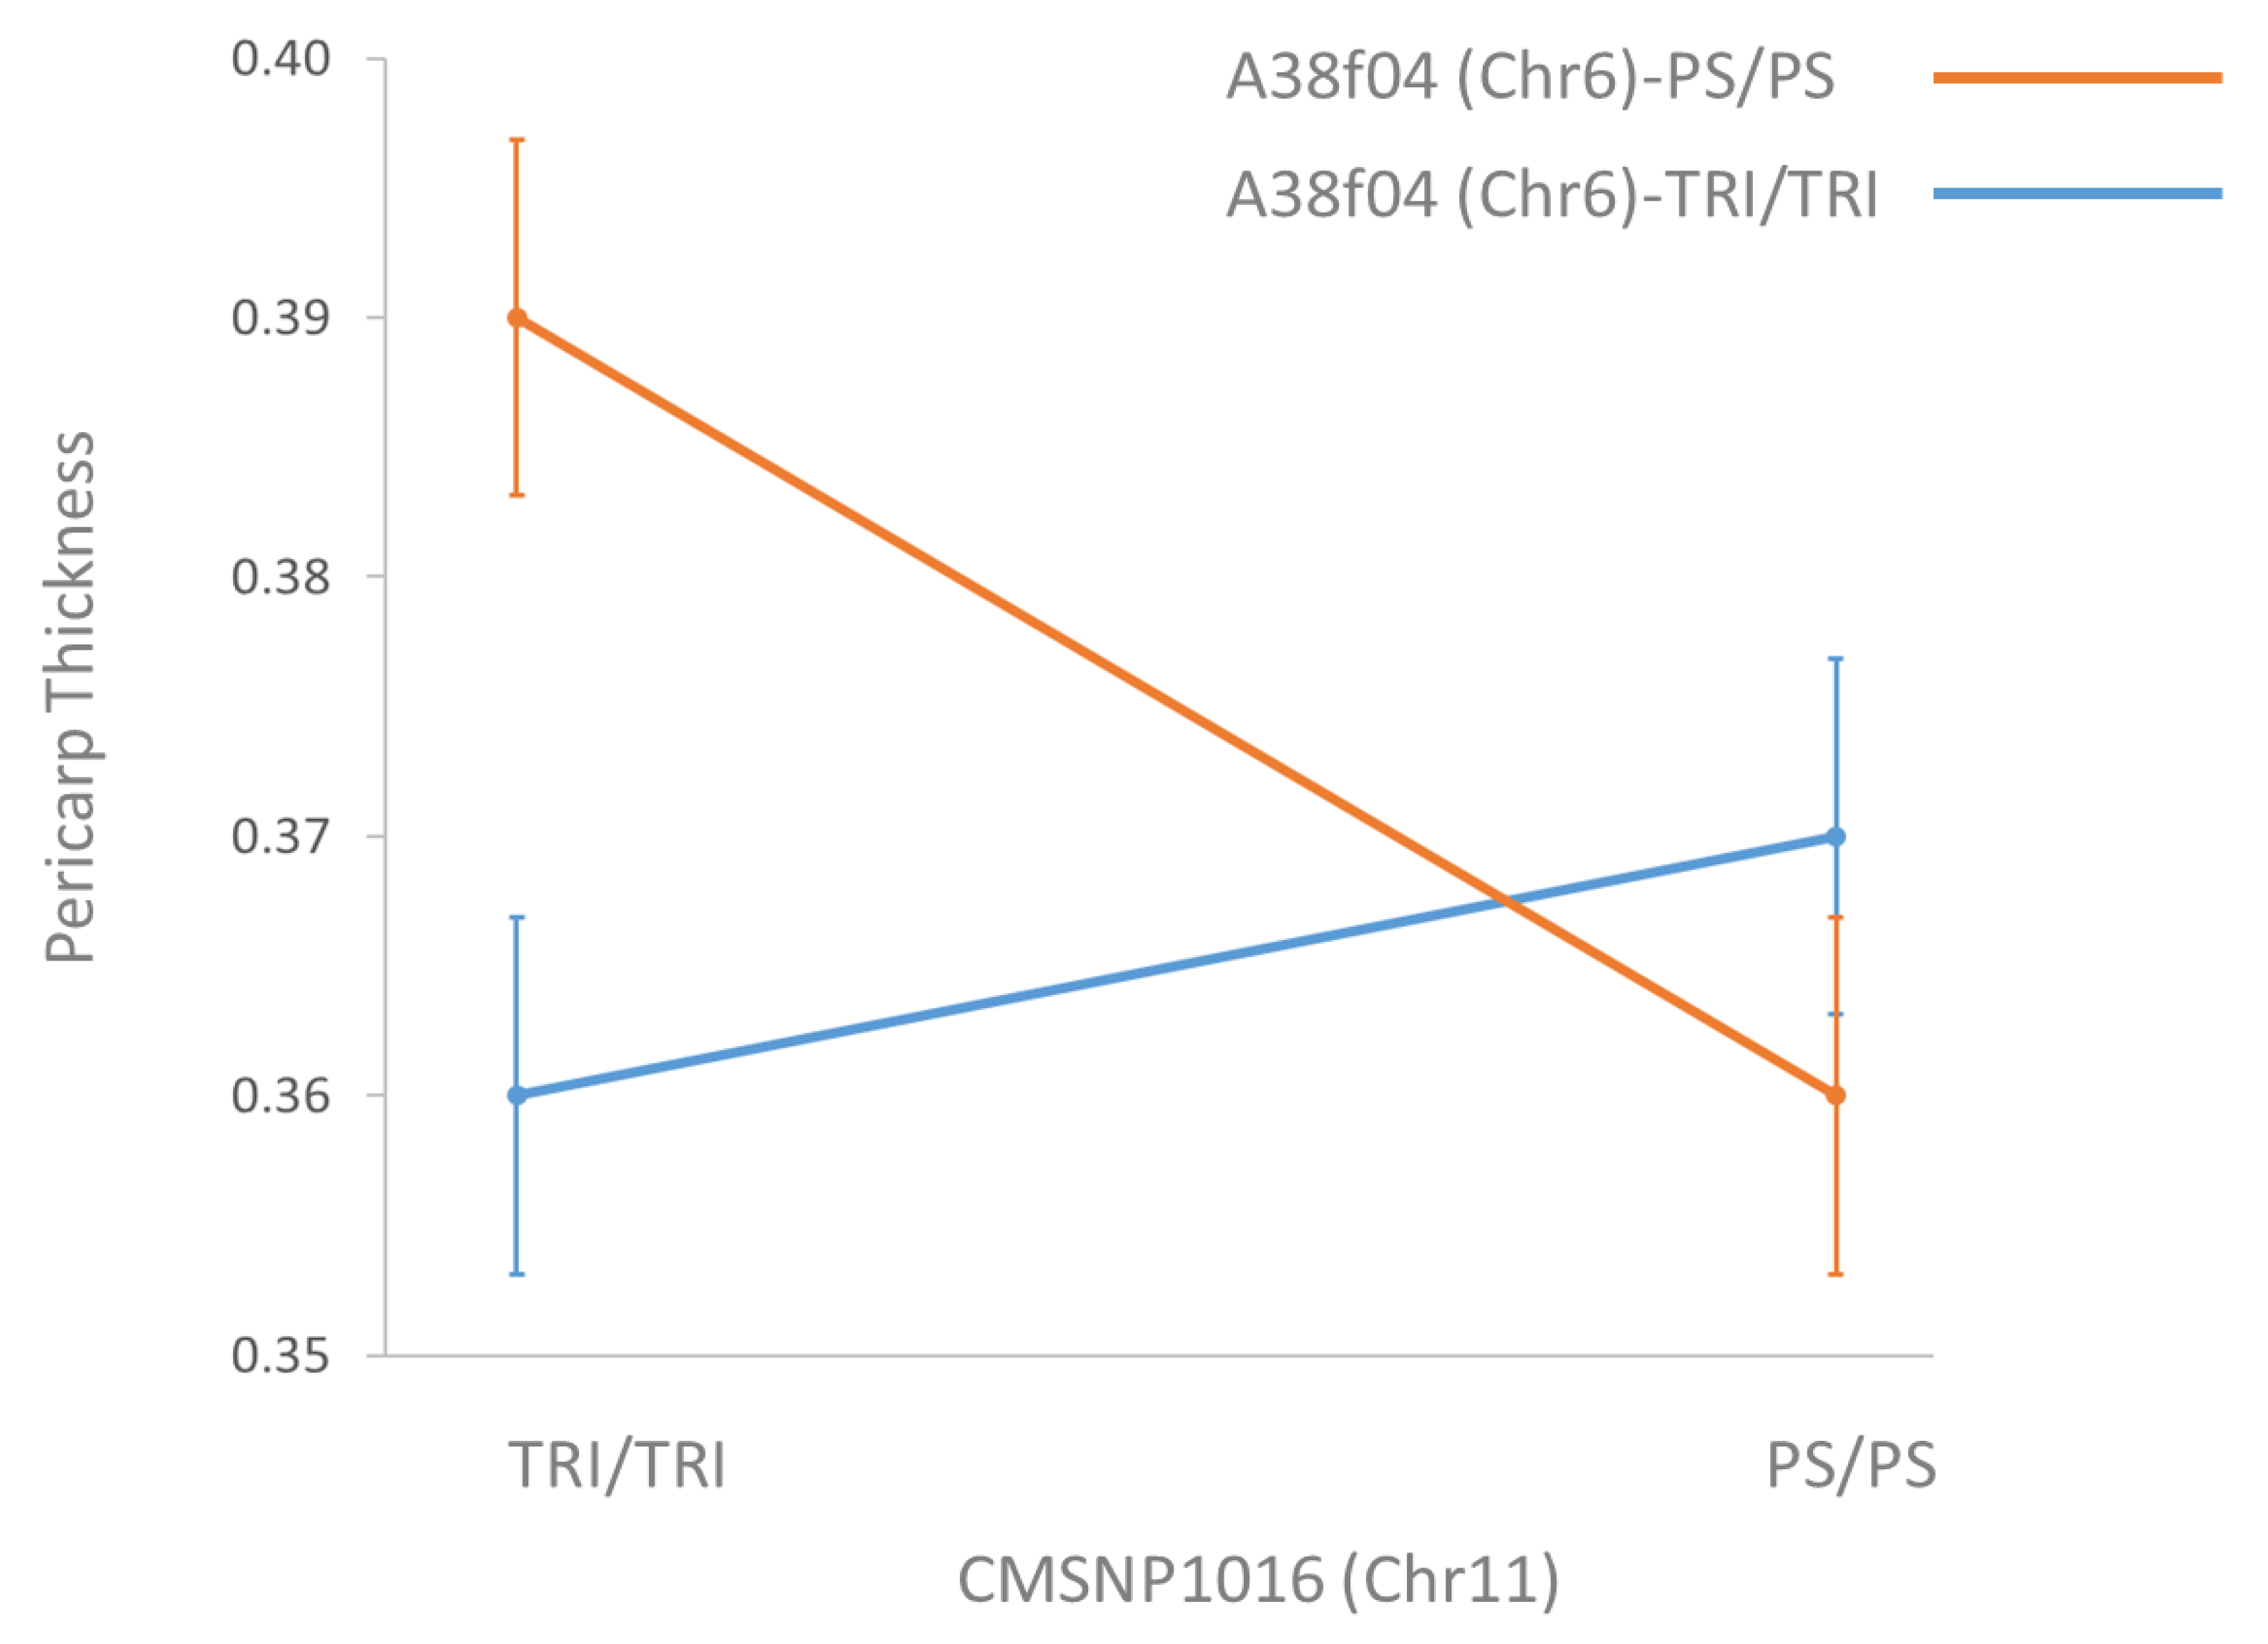
3.4. Verification of Epistatic Interaction

In order to verify the epistatic interaction for PT between loci in chromosomes 6 and 11, seeds from self-fertilized TRI_6-3-F2 plants with different homozygous allelic combinations for whole introgressions in chromosomes 6 and 11 were further studied. Table 4 depicts the means of each family, TRI_6-3 and PS as controls, and the significance of the Dunnett’s test between families and PS and the pairwise comparison between 18M56 and 18M57. Most families showed a reduction of FW compared with PS, although at different degrees. Families with introgressions on chromosome 6 showed a very important reduction of the traits. The self-fertilized progenies 18M55 and 18M60, homozygous PS at chromosome 6, but with different allelic state at chromosome 11 showed a similar reduction on FW but much lower than families with TRI alleles on chromosome 6, suggesting that the reduction was likely due to the genetic background. In fact, 18M56 and 18M57 did not show differences in FW even with different allelic states on chromosome 11. These results confirm the presence of a QTL for FW on chromosome 6 and the absence of QTL for this trait on chromosome 11.
On the other hand, only the families with an introgression on chromosome 6 showed significant differences with PS for PA and PT, which is consistent with the presence of a QTL for these traits in that region, in agreement with previous results. Moreover, 18M57 fruit, with both introgressions on chromosome 6 and 11, displayed significantly lower PA and PT than 18M56, which carries only the TRI chromosome 6 introgression. Overall, these results confirm that gene/genes on the chromosome 11 introgression do not have direct effects on PA and PT, but they interact with gene/genes on chromosome 6, causing a stronger reduction of these traits.

4. Discussion

4.1. paqt6.1 Effects Are Modulated by an Epistatic Locus

Map-based cloning is a powerful strategy for identifying the genes underlying QTLs [32]. Briefly, the standard procedure consists in mendelizing the QTL in a homogeneous genetic background by developing ILs, generating a large number of recombinants to fine-map the QTL at gene resolution and verifying the candidate genes by diverse functional analysis approaches. We tried to follow this strategy to identify the causal gene responsible for the QTL involved in melon fruit flesh content paqt6.1. We used two different fine-mapping strategies. However, the results were not consistent, preventing our initial objective. A more detailed analysis of the genome of the ILs used for the fine mapping revealed the presence of additional introgressions on different chromosomes that were also segregating in the mapping populations, which could interfere with the phenotypes, and therefore in the interpretation of the mapping. We focused our next steps on an introgression on chromosome 11 because it was present in the IL TRI_6-3 that was previously used to verify the effects of paqt6.1 and also the whole introgression was located in a large euchromatin region. An epistatic interaction was observed between chromosome 6 and 11 introgressions in the TRI_6-3-F2 population, which was confirmed in a subsequent experiment. The results showed that the effects of paqt6.1 depend on a locus in chromosome 11. When both loci carry homozygous TRI alleles, the reduction of fruit flesh content is significant and consistent among experiments. However, when the allelic combination is TRI/PS (homozygous for TRI on chromosome 6 and PS con chromosome 11), the effects of paqt6.1 are not so strong and, therefore, they are not detected consistently across experiments. On the other hand, the locus in chromosome 11 does not seem to have any effect when the chromosome 6 introgression is homozygous PS (see 18M55 and 18M60 in Table 4). Under this scenario, advanced lines carrying TRI alleles at paqt6.1, but PS alleles at chromosome 11 locus, would not display effects on flesh content consistently making the initial approach for QTL fine-mapping unsuccessful. To proceed with future fine mapping experiments, the genetic material should be homozygous TRI for chromosome 11 and recombinant for chromosome 6 introgressions.
Epistasis can be defined as biological epistasis (the interaction of gene products in cellular processes [33]) or statistical epistasis (the deviation from the additive model in the segregation of genetic data, [34]). The importance of biological epistasis is clear, as all gene products are included in complex networks. Consequently, statistical epistasis should also be detected in experimental mapping populations. In fact, several examples of epistasis between QTLs have been reported since the early QTL mapping studies; for example, less-than-additive epistasis on tomato yield-associated [35] and fruit quality [36] traits, the role of epistasis on yield heterosis in upland cotton [37] or physiological traits in sugar beet [38]. Interestingly, epistases among loci or QTLs have been reported relatively frequently in melons: external [39] and flesh fruit [40] color, climacteric ripening [41], resistance to Cucumber Mosaic Virus, Tomato Leaf Curl New Delhi Virus, Fusarium oxysporum [42,43,44] and fruit shape [45,46]. However, epistatic interactions between QTLs have not been reported in most QTL mapping works [47,48]. The reasons for the lack of detection of epistasis may be genetic (no variation in one of the interacting genes in the experimental population), or statistical (low power to detect epistatic interactions in the common mapping populations), so most of them remain undetected. On top of that, epistasis has been found when testing specific genes or QTLs [35,36,49,50] and much less frequently in whole genome scans. These results support the hypothesis that epistasis is probably common, but it is not detected due to the low statistical power of the experimental designs. In the current report, an epistatic interaction between paqt6.1 and a chromosome 11 locus was not detected in the original F2 PS×TRI population [17], in line with that hypothesis.
Genes involved in the variation of pericarp thickness have been reported in the tomato. For instance, the silencing of SlPRE2, a member of a bHLH (basic helix-loop-helix) transcription factor gene family, causes the reduction of tomato pericarp thickness, reducing cell size [51]. Cell Size Regulator (CSR) is the causal gene underlying the tomato fruit weight QTL fw11.3 [52]. CSR causes variation on fruit weight by modifying the pericarp size as well as by altering the mesocarp cell size. On the other hand, the over-expression of CDKA1 (cyclin-dependent kinase) increases the number of cell layers in the tomato fruit pericarps, with the concomitant increase of pericarp thickness [53]. The enormous differences in pericarp thickness between wild and cultivated melons cannot be attributed only to the enlargement of cell size (although this may play a role). On the contrary, the increase in cell layers seems to be a more important mechanism for explaining the transition from the tiny pericarp thickness of wild melons to the over-10-cm pericarp thickness displayed by some cultivars. No melon homologues of SLPRE2 and CSR are located in the chromosome 6 and 11 introgressions in TRI_6-3. Interestingly, several melon genes (MELO3C021187, MELO3C021394, MELO3C019687, MELO3C022533) with high homology to the tomato gene CDKA1, that regulates the fruit pericarp development by interaction with other genes [54], are located within the chromosome 11 introgressions, therefore becoming candidate genes for the epistatic locus.

4.2. Epistasis and Melon Domestication

The impact of epistasis during crop domestication has explicitly been discussed in several previous works. From early QTL mapping studies, Doebley et al. [55] reported early-on that the dominance of a given allele may change depending on the genetic background, e.g., domesticated maize alleles showing dominant gene action over wild teosinte allele in the maize background changed to recessive when introgressed into the teosinte background. The opposite was also observed, the teosinte allele turned recessive when introgressed into maize background. Specific epistatic interactions among loci involved in domestication traits have been reported in previous works. Korff et al. [56] found that only the combination of wild alleles at a certain pair of loci caused an altered phenotype in domestication-related traits such as heading date, plant height and yield in a barley mapping population from a cross between cultivated and wild genotypes. Similarly, in the same species, wild alleles at two loci were required to confer shattering [57,58]. Less-than-additive epistasis (i.e., the effect of the double wild allele is smaller than the sum of the effects of the single wild alleles) has also been observed when introgressing wild alleles into cultivated genetic backgrounds in both tomato [35] and barley [56]. Even though relatively few works have provided evidence of epistasis in diverse mapping studies, there is proof of the role of epistasis during the domestication event [48]. Assuming this role, domestication alleles whose effects would reduce the fitness in wild species could be maintained in wild populations. This kind of variation is usually classified as cryptic variation, as the effects of those loci are not evident until they are transferred to a different (domesticated in this case) background. The cryptic variation would explain the success of advanced backcross strategies to find new valuable genetic diversity for modern breeding in wild accessions [59,60,61]. On the other hand, Doust et al. [62] concluded that the effects of major domestication alleles are less affected by the genetic background than wild alleles, implying that the selection on those alleles would be very effective and, therefore, a rapid domestication process would be possible, although this does not agree with archaeobotanical observations. Nevertheless, more works are needed to understand the role of epistasis in domestication processes.
In the current report, the interaction between chromosomes 6 and 11 was similar to the one found in barley by Korff et al. [56]. The mutation in the chromosome 11 locus present in domesticated melons clearly altered the relationship of that region with paqt6.1 when harboring the wild allele, making its effect on pericarp thickness weaker and less consistent and therefore allowing for the increase of the pericarp. It is thought that melon was originally consumed for its seeds [1]. The appearance of the edible pericarp was probably a secondary step in melon domestication. The locus on chromosome 11 could have played a major role in this change during the domestication event, allowing for the increase in pericarp and therefore the human selection for this trait. In fact, among the 145 putative domestication sweeps detected in both subspecies, C. melo subsp. melo and C. melo subp. agrestis, 11 are located in the genomic region harbored by the chromosome 11 introgression in TRI_6-3. Therefore, the current results support the importance of epistasis in domestication processes and reinforces the interest of studying it in the genetics of domestication research.

Supplementary Materials

The following are available online at https://www.mdpi.com/2073-4395/10/8/1064/s1. Supplementary Figure S1. Pedigree of the genetic materials developed and investigated. The pedigree starts from the original PS-x-TRI cross. Backcrosses are indicates with xPS and selfing with (x). Supplementary Table S1. Single Nucleotide Polymorphism (SNP) markers used to genotype 14M2-F2 and TRI_6-3-F2 populations. The position of the SNPs in the 14M2-F2 genetic map and melon genome (v3.5.1) and the sequence flanking them are also provided. Supplementary Table S2. Genotype of TRI_6-1 to TRI_6-6 introgression lines based on genotype-by-sequence data. Only genotypic regions in which the introgression line displays at least a Trigonus introgression are shown. The rest of the genome is “Piel de Sapo” in all the introgression lines. The sequences flanking the SNPs are also given.

Author Contributions

Investigation and formal analysis, C.R., J.L.R.-V., B.P., A.D., M.J.G.; conceptualization and writing-original draft preparation, M.J.G., A.J.M.; writing—review and editing, C.R., B.P., A.D., J.L.R.-V. All authors have read and agreed to the published version of the manuscript.

Funding

This research was funded by the Spanish Ministerio de Ciencia, Innovación y Universidades grants AGL2017-85563-C2-1-R and RTI2018-097665-B-C22) (jointly funded by FEDER).

Acknowledgments

Authors thank Soledad Casal and all staff at Centro de Experiencias Fundación Cajamar for technical support. CR was supported by a fellowship from the Instituto Agronómico Mediterráneo de Zaragoza (CIHEAM-IAMZ).

Conflicts of Interest

The authors declare no conflict of interest.

Nomenclature

ANOVAanalysis of variance
bHLHbasic helix-loop-helix
CVcoefficient of variation
FSfruit shape
FWfruit weight
GBSgenotyping by sequencing
ILintrogression line
LODlogarithm of odds
PApericarp area
PSPiel de Sapo
PTpericarp thickness
QTLquantitative trait locus
SNPsingle nucleotide polymorphism
TRItrigonus

References

  1. Pitrat, M. Melon genetic resources: Phenotypic diversity and horticultural taxonomy. In Genetics and Genomics of Cucurbitaceae; Grumet, R., Katzir, N., Garcia-Mas, J., Eds.; Springer Nature: Cham, Switzerland, 2017; pp. 25–60. [Google Scholar]
  2. Gonzalo, M.J.; Diaz, A.; Dhillon, N.P.S.; Reddy, U.K.; Pico, B.; Monforte, A.J. Re-evaluation of the role of Indian germplasm as center of melon diversification based on genotyping-by-sequencing analysis. BMC Genom. 2019, 20, 448. [Google Scholar] [CrossRef] [PubMed] [Green Version]
  3. Renner, S.S.; Schaefer, H. Phylogeny and evolution of the Cucurbitaceae. In Genetics and Genomics of Cucurbitaceae; Grumet, R., Katzir, N., Garcia-Mas, J., Eds.; Springer Nature: Cham, Switzerland, 2017; pp. 13–24. [Google Scholar]
  4. Whitaker, T.W.; Davis, G.N. Cucurbits: Botany, Cultivation, and Utilization; Interscience Publishers: New York, NY, USA, 1962. [Google Scholar]
  5. Telford, I.R.H.; Schaefer, H.; Greuter, W.; Renner, S.S. A new Australian species of Luffa (Cucurbitaceae) and typification of two Australian Cucumis names, all based on specimens collected by Ferdinand Mueller in 1856. Phytokeys 2011, 5, 21–29. [Google Scholar] [CrossRef] [PubMed]
  6. Telford, I.R.H.; Sebastian, P.; Bruhl, J.J.; Renner, S.S. Cucumis (Cucurbitaceae) in Australia and Eastern Malesia, including newly recognized species and the sister species to C. melo. Syst. Bot. 2011, 36, 376–389. [Google Scholar] [CrossRef]
  7. Filipowicz, N.; Schaefer, H.; Renners, S.S. Revisiting Luffa (Cucurbitaceae) 25 years after c. Heiser: Species boundaries and application of names tested with plastid and nuclear DNA sequences. Syst. Bot. 2014, 39, 205–215. [Google Scholar] [CrossRef]
  8. Clarke, A.C.; Burtenshaw, M.K.; McLenachan, P.A.; Erickson, D.L.; Penny, D. Reconstructing the origins and dispersal of the polynesian bottle gourd (Lagenaria siceraria). Mol. Biol. Evol. 2006, 23, 893–900. [Google Scholar] [CrossRef]
  9. Kistler, L.; Montenegro, A.; Smith, B.D.; Gifford, J.A.; Green, R.E.; Newsom, L.A.; Shapiro, B. Transoceanic drift and the domestication of African bottle gourds in the Americas. Proc. Natl. Acad. Sci. USA 2014, 111, 2937–2941. [Google Scholar] [CrossRef] [Green Version]
  10. Levi, A.; Jarret, R.; Kousik, S.; Wechter, W.P.; Nimmakayala, P.; Reddy, U.K. Genetic resources of watermelon. In Genetics and Genomics of Cucurbitaceae; Grumet, R., Katzir, N., Garcia-Mas, J., Eds.; Springer Nature: Cham, Switzerland, 2017; pp. 87–110. [Google Scholar]
  11. Paris, S.P. Genetic resources of pumpkins and squash, Cucurbita spp. In Genetics and Genomics of Cucurbitaceae; Grumet, R., Katzir, N., Garcia-Mas, J., Eds.; Springer Nature: Cham, Switzerland, 2017; pp. 111–154. [Google Scholar]
  12. Sebastian, P.; Schaefer, H.; Telford, I.R.H.; Renner, S.S. Cucumber (Cucumis sativus) and melon (C. melo) have numerous wild relatives in Asia and Australia, and the sister species of melon is from Australia. Proc. Natl. Acad. Sci. USA 2010, 107, 14269–14273. [Google Scholar] [CrossRef] [Green Version]
  13. Endl, J.; Achigan-Dako, E.G.; Pandey, A.K.; Monforte, A.J.; Pico, B.; Schaefer, H. Repeated domestication of melon (Cucumis melo) in Africa and Asia and a new close relative from India. Am. J. Bot. 2018, 105, 1662–1671. [Google Scholar] [CrossRef] [Green Version]
  14. Esteras, C.; Formisano, G.; Roig, C.; Díaz, A.; Blanca, J.; Garcia-Mas, J.; Gomez-Guillamon, M.L.; Lopez-Sese, A.I.; Lazaro, A.; Monforte, A.J.; et al. SNP genotyping in melons: Genetic variation, population structure, and linkage disequilibrium. Theor. Appl. Genet. 2013, 126, 1285–1303. [Google Scholar] [CrossRef]
  15. Zhao, G.W.; Lian, Q.; Zhang, Z.H.; Fu, Q.S.; He, Y.H.; Ma, S.; Ruggieri, V.; Monforte, A.J.; Wang, P.Y.; Julca, I.; et al. A comprehensive genome variation map of melon identifies multiple domestication events and loci influencing agronomic traits. Nat. Genet. 2019, 51, 1607–1615. [Google Scholar] [CrossRef]
  16. Roy, A.; Bal, S.S.; Fergany, M.; Kaur, S.; Singh, H.; Malik, A.A.; Singh, J.; Monforte, A.J.; Dhillon, N.P.S. Wild melon diversity in India (Punjab State). Gen. Res. Crop Evol. 2012, 59, 755–767. [Google Scholar] [CrossRef]
  17. Díaz, A.; Martin-Hernandez, A.M.; Dolcet-Sanjuan, R.; Garces-Claver, A.; Alvarez, J.M.; Garcia-Mas, J.; Pico, B.; Monforte, A.J. Quantitative trait loci analysis of melon (Cucumis melo L.) domestication-related traits. Theor. Appl. Genet. 2017, 130, 1837–1856. [Google Scholar] [CrossRef] [PubMed]
  18. Garcia-Mas, J.; Monforte, A.J.; Arús, P. Phylogenetic relationships among Cucumis species based on the ribosomal internal transcribed spacer sequence and microsatellite markers. Plant Syst. Evol. 2004, 248, 191–203. [Google Scholar] [CrossRef]
  19. Studer, A.J.; Zhao, Q.; Ross-Ibarra, J.; Doebley, J. Identification of a functional transposon insertion in the maize domestication gene tb1. Nat. Genet. 2011, 43, 1160–1164. [Google Scholar] [CrossRef] [PubMed] [Green Version]
  20. Li, C.B.; Zhou, A.L.; Sang, T. Rice domestication by reducing shattering. Science 2006, 311, 1936–1939. [Google Scholar] [CrossRef] [PubMed] [Green Version]
  21. Frary, A.; Nesbitt, T.C.; Grandillo, S.; van der Knaap, E.; Cong, B.; Liu, J.P.; Meller, J.; Elber, R.; Alpert, K.B.; Tanksley, S.D. fw2.2: A quantitative trait locus key to the evolution of tomato fruit size. Science 2000, 289, 85–88. [Google Scholar] [CrossRef] [PubMed] [Green Version]
  22. Doyle, J.J.; Doyle, J.L. Isolation of plant DNA from fresh tissue. Focus 1990, 12, 13–15. [Google Scholar]
  23. Sanseverino, W.; Henaff, E.; Vives, C.; Pinosio, S.; Burgos-Paz, W.; Morgante, M.; Ramos-Onsins, S.E.; Garcia-Mas, J.; Casacuberta, J. Transposon insertions, structural variations, and SNPs contribute to the evolution of the melon genome. Mol. Biol. Evol. 2015, 32, 2760–2774. [Google Scholar] [CrossRef] [Green Version]
  24. Elshire, R.J.; Glaubitz, J.C.; Sun, Q.; Poland, J.A.; Kawamoto, K.; Buckler, E.S.; Mitchell, S.E. A robust, simple genotyping-by-sequencing (GBS) approach for high diversity species. PLoS ONE 2011, 6, e19379. [Google Scholar] [CrossRef] [Green Version]
  25. Garcia-Mas, J.; Benjak, A.; Sanseverino, W.; Bourgeois, M.; Mir, G.; Gonzalez, V.M.; Henaff, E.; Camara, F.; Cozzuto, L.; Lowy, E.; et al. The genome of melon (Cucumis melo L.). Proc. Natl. Acad. Sci. USA 2012, 109, 11872–11877. [Google Scholar] [CrossRef] [Green Version]
  26. Brewer, M.T.; Lang, L.X.; Fujimura, K.; Dujmovic, N.; Gray, S.; van der Knaap, E. Development of a controlled vocabulary and software application to analyze fruit shape variation in tomato and other plant species. Plant Phys. 2006, 141, 15–25. [Google Scholar] [CrossRef] [PubMed] [Green Version]
  27. Lander, E.S.; Botstein, D. Mapping Mendelian factors underlying quantitative traits using RFLP linkage maps. Genetics 1989, 121, 185–199. [Google Scholar] [PubMed]
  28. Kosambi, D.D. The estimation of map distances from recombination values. Ann. Eug. 1943, 12, 172–175. [Google Scholar] [CrossRef]
  29. Zeng, Z.B. Precision mapping of quantitative trait loci. Genetics 1994, 136, 1457–1468. [Google Scholar] [PubMed]
  30. Wang, S.; Basten, C.J.; Zeng, Z.B. Windows QTL Cartographer V2.5_011. Available online: http://statgen.ncsu.edu/qtlcart/WQTLCart.htm (accessed on 22 July 2020).
  31. Argyris, J.M.; Pujol, M.; Martin-Hernandez, A.M.; Garcia-Mas, J. Combined use of genetic and genomics resources to understand virus resistance and fruit quality traits in melon. Phys. Plant 2015, 155, 4–11. [Google Scholar] [CrossRef]
  32. Sun, S.; Wang, X.T.; Wang, K.T.; Cui, X. Dissection of complex traits of tomato in the post-genome era. Theor. Appl. Genet. 2020, 133, 1763–1776. [Google Scholar] [CrossRef]
  33. Bateson, W. Heredity and variation in modern lights. In Darwin and Modern Science; Seward, A.C., Ed.; Cambridge University Press: Cambridge, UK, 1909; pp. 85–101. [Google Scholar]
  34. Fisher, R.A. The correlation between relatives on the supposition of Mendelian inheritance. Trans. R. Soc. Edinb. 1918, 52, 399–433. [Google Scholar] [CrossRef] [Green Version]
  35. Eshed, Y.; Zamir, D. Less-than-additive epistatic interactions of quantitative trait loci in tomato. Genetics 1996, 143, 1807–1817. [Google Scholar]
  36. Causse, M.; Chaib, J.; Lecomte, L.; Buret, M.; Hospital, F. Both additivity and epistasis control the genetic variation for fruit quality traits in tomato. Theor. Appl. Genet. 2007, 115, 429–442. [Google Scholar] [CrossRef]
  37. Shang, L.; Liang, Q.; Wang, Y.; Zhao, Y.; Wang, K.; Hua, J. Epistasis together with partial dominance, over-dominance and QTL by environment interactions contribute to yield heterosis in upland cotton. Theor. Appl. Genet. 2016, 129, 1429–1446. [Google Scholar] [CrossRef]
  38. Würschum, T.; Maurer, H.P.; Schulz, B.; Moehring, J.; Reif, J.C. Genome-wide association mapping reveals epistasis and genetic interaction networks in sugar beet. Theor. Appl. Genet. 2011, 123, 109–118. [Google Scholar] [CrossRef] [PubMed]
  39. Monforte, A.J.; Oliver, M.; Gonzalo, M.J.; Alvarez, J.M.; Dolcet-Sanjuan, R.; Arus, P. Identification of quantitative trait loci involved in fruit quality traits in melon (Cucumis melo L.). Theor. Appl. Genet. 2004, 108, 750–758. [Google Scholar] [CrossRef] [PubMed]
  40. Clayberg, C. Interaction and linkage test of flesh color genes in Cucumis melo L. Rep. Cucurbit Genet. Coop. 1992, 15, 53. [Google Scholar]
  41. Vegas, J.; Garcia-Mas, J.; Monforte, A.J. Interaction between QTLs induces an advance in ethylene biosynthesis during melon fruit ripening. Theor. Appl. Genet. 2013, 126, 1531–1544. [Google Scholar] [CrossRef]
  42. Guiu-Aragones, C.; Monforte, A.J.; Saladie, M.; Correa, R.X.; Garcia-Mas, J.; Martin-Hernandez, A.M. The complex resistance to cucumber mosaic cucumovirus (CMV) in the melon accession PI161375 is governed by one gene and at least two quantitative trait loci. Mol. Breed. 2014, 34, 351–362. [Google Scholar] [CrossRef]
  43. Saez, C.; Esteras, C.; Martinez, C.; Ferriol, M.; Dhillon, N.P.S.; Lopez, C.; Pico, B. Resistance to tomato leaf curl New Delhi virus in melon is controlled by a major QTL located in chromosome 11. Plant Cell Rep. 2017, 36, 1571–1584. [Google Scholar] [CrossRef]
  44. Perchepied, L.; Dogimont, C.; Pitrat, M. Strain-specific and recessive QTLs involved in the control of partial resistance to Fusarium oxysporum f. sp. melonis race 1.2 in a recombinant inbred line population of melon. Theor. Appl. Genet. 2005, 111, 65–74. [Google Scholar] [CrossRef]
  45. Díaz, A.; Zarouri, B.; Fergany, M.; Eduardo, I.; Alvarez, J.M.; Picó, B.; Monforte, A.J. Mapping and introgression of QTL involved in fruit shape transgressive segregation into ‘Piel de Sapo’ Melon (Cucumis melo L.). PLoS ONE 2014, 9, e104188. [Google Scholar]
  46. Oren, E.; Tzuri, G.; Dafna, A.; Meir, A.; Kumar, R.; Katzir, N.; Elkind, Y.; Freilich, S.; Schaffer, A.A.; Tadmor, Y.; et al. High-density NGS-based map construction and genetic dissection of fruit shape and rind netting in Cucumis melo. Theor. Appl. Genet. 2020, 133, 1927–1945. [Google Scholar] [CrossRef]
  47. Wallace, J.G.; Larsson, S.J.; Buckler, E.S. Entering the second century of maize quantitative genetics. Heredity 2014, 112, 30–38. [Google Scholar] [CrossRef] [Green Version]
  48. Stitzer, M.C.; Ross-Ibarra, J. Maize domestication and gene interaction. New Phytol. 2018, 220, 395–408. [Google Scholar] [CrossRef] [PubMed] [Green Version]
  49. Weber, A.L.; Briggs, W.H.; Rucker, J.; Baltazar, B.M.; Sanchez-Gonzalez, J.D.; Feng, P.; Buckler, E.S.; Doebley, J. The genetic architecture of complex traits in teosinte (Zea mays ssp parviglumis): New evidence from association mapping. Genetics 2008, 180, 1221–1232. [Google Scholar] [CrossRef] [PubMed] [Green Version]
  50. Studer, A.J.; Doebley, J.F. Do Large Effect QTL Fractionate? A Case Study at the Maize Domestication QTL teosinte branched1. Genetics 2011, 188, 673–681. [Google Scholar] [CrossRef] [PubMed] [Green Version]
  51. Zhu, Z.G.; Liang, H.L.; Chen, G.P.; Li, F.F.; Wang, Y.S.; Liao, C.G.; Hui, Z.L. The bHLH transcription factor SlPRE2 regulates tomato fruit development and modulates plant response to gibberellin. Plant Cell Rep. 2019, 38, 1053–1064. [Google Scholar] [CrossRef]
  52. Mu, Q.; Huang, Z.J.; Chakrabarti, M.; Illa-Berenguer, E.; Liu, X.X.; Wang, Y.P.; Ramos, A.; van der Knaap, E. Fruit weight is controlled by Cell Size Regulator encoding a novel protein that is expressed in maturing tomato fruits. PLoS Genet. 2017, 13, e1006930. [Google Scholar] [CrossRef]
  53. Czerednik, A.; Busscher, M.; Angenent, G.C.; de Maagd, R.A. The cell size distribution of tomato fruit can be changed by overexpression of CDKA1. Plant Biotech. J. 2015, 13, 259–268. [Google Scholar] [CrossRef] [Green Version]
  54. Czerednik, A.; Busscher, M.; Bielen, B.A.; Wolters-Arts, M.; de Maagd, R.A.; Angenent, G.C. Regulation of tomato fruit pericarp development by an interplay between CDKB and CDKA1 cell cycle genes. J. Exp. Bot. 2012, 63, 2605–2617. [Google Scholar] [CrossRef] [Green Version]
  55. Doebley, J.; Stec, A.; Gustus, C. Teosinte branched1 and the origin of maize—Evidence for epistasis and the evolution of dominance. Genetics 1995, 141, 333–346. [Google Scholar]
  56. von Korff, M.; Leon, J.; Pillen, K. Detection of epistatic interactions between exotic alleles introgressed from wild barley (H. vulgare ssp. spontaneum). Theor. Appl. Genet. 2010, 8, 1455–1464. [Google Scholar] [CrossRef]
  57. Azhacuvel, P.; Vidya-Saraswathi, D.; Komatsuda, T. High-resolution linkage mapping for the non-brittle rachis locus btr1 in cultivated x wild barley (Hordeum vulgare). Plant Sci. 2006, 170, 1087–1094. [Google Scholar] [CrossRef] [Green Version]
  58. Sakuma, S.; Salomon, B.; Komatsuda, T. The domestication syndrome genes responsible for the major changes in plant form in the Triticeae crops. Plant Cell Phys. 2011, 52, 738–749. [Google Scholar] [CrossRef] [PubMed] [Green Version]
  59. Monforte, A.J.; Friedman, E.; Zamir, D.; Tanksley, S.D. Comparison of a set of allelic QTL-NILs for chromosome 4 of tomato: Deductions about natural variation and implications for germplasm utilization. Theor. Appl. Genet. 2001, 102, 572–590. [Google Scholar] [CrossRef]
  60. Gur, A.; Zamir, D. Unused natural variation can lift yield barriers in plant breeding. PLoS Biol. 2004, 2, 1610–1615. [Google Scholar] [CrossRef] [PubMed]
  61. Kovach, M.J.; McCouch, S.R. Leveraging natural diversity: Back through the bottleneck. Curr. Opin. Plant Biol. 2008, 11, 193–200. [Google Scholar] [CrossRef]
  62. Doust, A.N.; Lukens, L.; Olsen, K.M.; Mauro-Herrera, M.; Meyer, A.; Rogers, K. Beyond the single gene: How epistasis and gene-by-environment effects influence crop domestication. Proc. Natl. Acad. Sci. USA 2014, 111, 6178–6183. [Google Scholar] [CrossRef] [Green Version]
Figure 1. Extent of introgressions and phenotypic characterization of TRI_6-1 to TRI_6-6 introgression lines. The graphical genotype for chromosome 6 of the introgression lines (ILs) is depicted on the left, dark green indicates the Ames 24294 (TRI) introgression and light green the “Piel de Sapo” (PS) background. The recombination points are indicated by a blurred green. On the lower part, the position of the markers flanking the recombination points defined by genotyping-by-sequencing (GBS) and the approximate positon of markers used in the previous work [17] are shown. The GBS markers are named as the chromosome number (S6_) and the position in bp. The mean phenotypic values (fruit weight, FW, fruit shape, FS, pericarp area, PA, pericarp thickness, PT) for ILs and control “Piel de Sapo” (PS) are depicted on the right. TRI_6-1 to TRI_6-5 were evaluated in the 2016 experiment, whereas TRI_6-6 was evaluated in 2017. Asterisks (*) indicate significant differences (p < 0.05) among IL and PS means (measured the same year) based on a Dunnett’s test.
Agronomy 10 01064 g001
Figure 2. Epistasis between chr6 and chr11 loci for pericarp thickness in the TRI_6-3-F2 population. Means of the four possible allelic combinations only considering the homozygous (PS/PS, homozygous “Piel de Sapo”; TRI/TRI homozygous Trigonus) for markers located within the introgressions on chromosome 6 (A38f04) and chromosome 11 (CMSNP1016).
Agronomy 10 01064 g002
Table 1. Descriptive statistics of “Piel de Sapo” and 14M2-F2 population.
Piel de Sapo 14M2-F2
TraitMean ± sdCVMean ± sdCV
Fruit Shape (FS)1.30 ± 0.020.0151.30 ± 0.150.115
Pericarp Area (PA)0.68 ± 0.050.0740.65 ± 0.0820.126
Pericarp Thickness (PT)0.40 ± 0.040.1000.41 ± 0.040.098
Fruit Weight (FW)2485.00 ± 356.380.1431273.9 ± 402.90.316
The means, standard deviation (sd) and coefficient of variation (CV) for “Piel de Sapo” and 14M2-F2 population for fruit morphology traits are shown.
Table 2. Quantitative trait locus (QTL) analysis in the 14M2-F2 population.
TraitMarkerLOD ThresholdLODGenetic Position (cM)Physical Position (bp)Confidence Intervaladd/[a]R2
Fruit ShapeSca21-33711862.13.293.1232,568,6740.0–13.5−0.070.000.050.11
Fruit WeightSca21-28011852.22.7718.0433,138,6755.98–20.07−191.94−21.82−0.110.13
For each trait, the marker closest to the QTL peak, the logarithm of odds (LOD) threshold for p < 0.05 after resampling, the LOD value, genetic position in the 14M2-F2 map, physical position in the melon genome v3.5.1, for the QTL peak, the two-LOD confidence interval, the additive (a), dominance (d) effects, gene action (d/[a]) and percentage of variance explained by the QTL (R2) are depicted.
Table 3. Statistical analysis for TRI_6-3-F2 population and “Piel de Sapo” (PS).
Fruit Weight Pericarp AreaPericarp Thickness
mean1036.37 0.630.36
TRI_6-3-F2sd424.09 0.030.02
PSmean1557.61 0.680.39
sd322.11 0.020.02
SNPChromosomeGenotype
a38f046PS/PS1426.21*0.640.37
TRI/TRI828.91 0.630.36
Mean and standard deviation (sd) for the fruit morphology traits of the TRI_6-3-F2 population and PS. In the lower part, the means of TRI_6-3-F2 plants homozygous “Piel de Sapo” (PS/PS) or Trigonus (TRI/TRI) for marker a38f04 on the introgression of chromosome 6 are shown. Statistically highly significant (p < 0.001) differences between means are indicated with “*”.
Table 4. Performance of families derived from the TRI_6-3-F2 population.
FamilyChr6Chr11Pericarp AreaDunnet18M56 vs. 18M57Pericarp ThicknessDunnet18M56 vs. 18M57Fruit WeightDunnet18M56 vs. 18M57
TRI_6-3TRITRI0.58 ± 0.02* 0.33 ± 0.01* 295.7 ± 33.55*
18M55PSPS0.66 ± 0.05 0.38 ± 0.01 953.67 ± 259.2*
18M56TRIPS0.61 ± 0.04**0.34 ± 0.01**499.48 ± 55.09*n.s
18M57TRITRI0.55 ± 0.04**0.30 ± 0.01**415.03 ± 105.78*n.s
18M60PSTRI0.66 ± 0.03 0.38 ± 0.01 1252.75 ± 118.27*
PSPSPS0.68 ± 0.01 0.39 ± 0.01 1578.25 ± 150.36
TRI_6-3 is the original introgression line, PS is the recurrent parent “Piel de Sapo”, used as control, and 18M55-60 are the selfed progeny of TRI_6-3-F2 plants with different homozygous allelic composition for chromosome 6 and 11 target regions. The allelic states (TRI, homozygous Trigonus; PS, homozygous “Piel de Sapo”) of the two chromosomic regions are depicted in Chr6 and Chr11 columns. Means and standard deviation for all the families for pericarp area, pericarp thickness and fruit weight are also given. Dunnett´s test was performed for all families against PS, additional 18M56 and 18M57 means were compared with a t-test. Statistical significance at p < 0.05 is indicated (*), n.s., no significant differences.

