Article

Modeling Planting-Date Effects on Intermediate-Maturing Maize in Contrasting Environments in the Nigerian Savanna: An Application of DSSAT Model

1
International Institute of Tropical Agriculture (IITA), P.M.B. 5320, Oyo Rd, Ibadan 200211, Nigeria
2
Department of Agronomy, Ahmadu Bello University, P.M.B. 1045, Zaria 810222, Nigeria
3
Department of Agronomy, Bayero University, P.M.B. 3011, Kano 700241, Nigeria
4
Centre for Dryland Agriculture, Bayero University, Kano 700241, Nigeria
*
Author to whom correspondence should be addressed.
Agronomy 2020, 10(6), 871; https://doi.org/10.3390/agronomy10060871
Submission received: 7 May 2020 / Revised: 11 June 2020 / Accepted: 16 June 2020 / Published: 18 June 2020
(This article belongs to the Special Issue Cropping Systems Models for Sustainable and Intensive Management)

Abstract

:
The Crop Environment Resource Synthesis (CERES)-Maize model in Decision Support System for Agricultural Technology Transfer (DSSAT) was calibrated and evaluated with experimental data for simulation of response of two intermediate-maturing maize varieties to different sowing dates in the Nigerian savannas. The calibration experiments involved 14 consecutive field trials conducted in the rainy and dry seasons in Bayero University Kano (BUK), Dambatta, and Zaria between 2014–2019. Two sets of field experiments were conducted simultaneously for model evaluation in Iburu in the southern Guinea savanna zone and Zaria in the northern Guinea savanna zone during 2015 and 2016 cropping seasons. The experiments for calibration had two maize (SAMMAZ-15 and SAMMAZ-16) varieties planted under optimum conditions with no water and nutrients stresses. The trials for model evaluation were conducted using the same varieties under four different nitrogen (N) rates (0, 60, 120 and 180 kg N ha−1). A 30-year (1985–2014) term simulation was performed to determine effect of varying sowing dates on yields of two maize varieties (SAMMAZ-15 and SAMMAZ-16) in the Sudan savanna (SS), northern Guinea savanna (NGS), and southern Guinea savanna (SGS) zones. The calibration results showed that the cultivar coefficients of the two maize varieties resulted in simulated growth and development parameters that were in good agreement with observed parameters. Model evaluation showed a good agreement between simulated and observed data for phenology and growth of maize. This demonstrated the potential of the CERES-Maize model to simulate growth and yield of maize in the Nigeria savannas. Results of 30-year sensitivity analysis with 9 different sowing windows showed that in SS, sowing the intermediate maize varieties from early to mid-June produced the highest grain yields. In NGS, the optimum sowing windows were found between late June and late July for the both varieties. In SGS, the optimum sowing window is from early June to late July for SAMMAZ-15 and mid-June to late July for SAMMAZ-16. These planting windows gave the highest long-term average yields for each variety. The variety SAMMAZ-15 was found to be best performing across the three agro-ecologies. Maize performance was generally higher in NGS than in SGS. SS in the Sudan savanna recorded the lowest yield compared with other locations.

1. Introduction

In most areas of West and Central Africa, delay in onset of the rainy season has been consistently observed [1,2]. Also, long dry spells at the beginning, mid and end of the rainy season are becoming more frequent even in the wetter Southern and Northern Guinea Savannas [3]. Frequent uncertainties due to changing weather patterns are making rainfed agricultural production to become more variable and riskier to farmers. There is, therefore, a need for developing optimal timing of all production practices in the maize production regions of Africa [4]. In the Nigerian savannas, farmers plant with the first onset of rain because of the uncertainty of rainfall duration and to avoid high temperature and terminal drought during anthesis and grain-filling period [5]. Numerous studies in Nigeria [6,7,8] have reported an increase in maize yield with early sowing when crops best used moisture, nutrients, and solar radiation. Reductions in yield when sowing was delayed beyond the optimum periods have also been frequently reported. Sowing too early may result in crop failure due to drought that occurs at seedling stage which necessitates farmers to replant their crops. Sowing too late might reduce valuable growing time and reduce grain-filling durations thereby leading to reduction in both grain and stover yields [6].
Intermediate maize varieties that can tolerate the effects of reduced moisture supply around anthesis [9] could reduce farmers’ risk in drought-affected ecologies. According to Kamara et al. [5] improved maize varieties tolerant to drought had more ears plant−1 and kernels ear−1 that could stabilize maize grain yield in the savanna zone, where recurrent drought threatens grain production. Similarly, long duration maize varieties when sown early were found to out-yield early maturing ones with yield gain of 34.3% because they could make use of the longer period for grain-filling [10]. Maize production technologies such as planting date and resilient varieties have been developed and evaluated extensively in the West African sub-region to mitigate the effect of climate variability in order to enhance adaptation and food security [6,11,12,13,14,15]. However, the reports on the performance of these technologies are largely site specific and do not take into consideration variability in soils and climate conditions outside the areas where the technologies have been tested. Assessment of the performance of these technologies on a large scale across maize growing regions in the Nigeria savannas are time consuming and expensive.
Decision Support System for Agricultural Technology Transfer (DSSAT) present very important opportunity for scaling out short-duration field experimental results making use of long-term weather and soil information [16,17,18]. The CERES-Maize model of DSSAT has been tested and evaluated extensively by many researchers in the tropics for a wide range of applications [19,20,21,22,23,24,25]. In Nigeria, the model was used to provide planting-date recommendations of early maturing maize varieties in the drylands by Jibrin et al. [24], while more recently Adnan et al. [3] provided planting-date recommendations for early and extra early maturing maize varieties using seasonal analysis of DSSAT for the drier Sudan and slightly wetter Guinea savannas. Despite the potentials and use of medium-maturing maize varieties in the Nigeria savannas, little or no research was conducted to evaluate the response of these varieties to crop management practices including planting dates in the savannas of Nigeria using crop simulation models. The objective of the current study was therefore to evaluate the performance of the CERES-Maize model in simulating growth and yield of intermediate-maturing maize varieties and to provide recommendations for optimum sowing dates under rainfed conditions in three major agro-ecologies of northern Nigeria.

2. Materials and Methods

2.1. Study Locations

The model calibration experiments were conducted in three locations namely: Bayero University, Kano (BUK) agricultural research farm (11.516° N, 8.516° E, 466 m a.s.l.); Audu Bako College of Agriculture Dambatta (12.333° N, 8.517° E, 442 m a.s.l.) and Institute for Agricultural Research (IAR) irrigation farm, Zaria (11.187° N, 7.147° E, 702 m a.s.l.). The three locations were selected for the calibration experiments based on access to irrigation facilities to ensure optimal moisture conditions by providing irrigations when the moisture content is below field capacity.
Model evaluation was done in two separate locations in the northern Guinea and southern Guinea savannas only. The locations for model evaluation were in the Maikanti Bello farm at Iburu (10.269° N, 7.789° E, 662 m a.s.l) and IITA research station at Shika, Zaria (11.054° N, 7.702° E, 686 m a.s.l.). This approach was considered to get a true validation of the model, since the experimental data used in model evaluation was not used in the initial calibration.
For model application using long-term weather data, the three agro-ecologies were considered with Kano (12.002° N, 8.5920° E, ~488 m a.s.l.) representing the Sudan savanna (SS), Zaria (11.086° N, 7.719° E, ~675 m a.s.l) representing the northern Guinea savanna (NGS) and Abuja (9.076° N, 7.399° E, ~476 m a.s.l) representing the southern Guinea savanna (SGS). The three locations were selected to represent the three agro-ecologies with the largest production area for maize.

2.2. Field Experiments for Model Calibration and Evaluation

The calibration involved 14 consecutive field experiments conducted in the rainy (June to December) and dry (February to May) seasons between 2014–2019. However, only 10 experiments were used for variety SAMMAZ-16. Time Domain Reflectometry (TDR) Meter 6050 × 1 TRASE SYSTEM (Soilmoisture Equipment Corp, Santa Barbara, CA, USA) was used to monitor moisture conditions to ensure optimal moisture across all fields. To ensure near-optimal nutrient conditions, recommended inorganic fertilizer rate of 120 kg N: 60 kg P2O5: 60 kg K2O per ha were applied. A compound fertilizer (N.P.K. 15:15:15) was used to supply 60 kg each of N, P, and K ha−1 at 10 days after sowing (DAS). Urea (46% N) was used to supply the remaining dose (60 kg N ha−1) of nitrogen at 45 DAS. In addition to inorganic fertilizer, poultry manure was also applied in the calibration experiment at the rate of 2 tons ha−1 to increase soil organic matter and improve nutrient retention at the sites. The calibration experiments were set in a randomized complete block design (RCBD) with four different maturing maize varieties (only two are presented in this study) used as treatments and replicated three times. The experimental plot consisted of 4 rows 5 m in length and spaced 0.75 m apart. Maize was planted at intra-row spacing of 0.25 m.
Four evaluation experiments were conducted during the rainy seasons (June–November) of 2015 and 2016 each at Zaria and Iburu as described in 2.1. In 2015, planting was done on June 16 in Zaria and June 17 in Iburu, while in 2016 planting was done on June 18 in Zaria and June 24 in Iburu. Three different inorganic fertilizers were used for the evaluation experiment. Recommended rates of P and K were applied. Triple super phosphate in form of powder (19.89% P) was used to supply P at the rate of 60 kg P2O5 ha−1 (equivalent to 26.2 kg P ha−1) and potassium in form of muriate of potash (MOP) was used to supply K also at the rate of 60 K2O ha−1 (equivalent to 49.8 K ha−1). Urea (46% N) was used as source for the four N treatments (0, 60, 120 and 180 kg N ha−1). Half (50%) of the N and full rate of P and K were properly mixed and applied 10 DAS. The remaining half of nitrogen was applied 45 DAS. The fertilizers were applied at the depth of 5 cm and buried 8 cm away from the plant using band application method. The evaluation experiments were set up as a split plot design in randomized complete blocks with four nitrogen rates (0, 60, 120 and 180 kg N ha−1) set as the main plot and the two maize varieties used in the calibration experiment set as sub-plots. The experiments had three replications with a subplot measuring 3 m × 5 m (15 m2) containing four rows of 0.75 m apart and 5 m in length with intra-row spacing of 0.25 m between stands which gave a plant population of 53,333 plants ha−1. The experimental plots were kept free from weeds using an integrated approach to control weeds. A mixture of primextra (Atrazine 223 g L−1 + Metolachlor 277 g L−1) and gramaxone (1:1-dimethyl-4,4-bipyridinum dichloride) at a rate of 1 L ha−1 each was applied immediately after sowing using a knapsack sprayer. Manual hoe weeding carried out later at 4 and 8 WAS controlled the subsequent weeds that emerged.

2.3. Plant Measurements

The crop data collected during the experimental periods include phenology dates (anthesis and physiological maturity), grain yield, and shoot dry matter at harvest. Number of days to 50% anthesis was collected by counting the number of plants with flowers daily, until half of the number of plants in the net plot had flowers. Likewise, number of days to maturity was measured when 95% of the cobs in the net plot matured and the kernels reached physiological maturity (signified by black layer located at the placental region of kernel), this was visually estimated. At harvest, a quadrat measuring 1.25 m × 1.5 m (1.875 m2) was placed across the two middle rows of the net plot; all the plants in the quadrat were harvested for grain number, dry matter determination, and grain yield per area. The plant samples were separated into leaves, stem, and cobs. The cobs bearing the grains were sun-dried to a constant weight and calculated as cob yield m−2, this was threshed and grain yield per unit area of 1.875 m2 was converted to 1 m−2. The leaves and stems (including the husks) were further oven-dried to a constant weight at 60 °C for 76 h in a force-draft oven [26] and later weighed using Mettler Toledo balance Model XP60025, the result was converted to a square meter. Cob yield m−2, leaf dry matter yield m−2 and stem dry matter yield m−2 were added up to achieve total dry matter yield m−2. The result was expressed in kg ha−1 and recorded for each plot. Grain yield was determined by adding the yields from the quadrat harvest and remaining net plot harvest and expressed in grain yield kg ha−1. Matured cobs from the remaining net plot from the two middle rows excluding the quadrat area were harvested and sun-dried to a constant weight. Dried cobs were shelled manually using hand held thresher and their grains weighed. Percentage grain moisture was determined using portable moisture meter (Farmex MT-16). Grain yield ha−1 was adjusted to 12% moisture computed from the grain using the relationship below:
G r a i n   y i e l d   ( k g   h a 1 ) = k g   g r a i n   y i e l d   p e r   n e t   p l o t × 10,000   m 2
A d j u s t e d   g r a i n   y i e l d = G r a i n   y i e l d   ( k g   h a 1 ) × [ 100 m c 88 ]
where mc = grain moisture content.

2.4. Weather and Soil Data

Daily records of rainfall, temperature (minimum and maximum) and solar radiation for the experimental periods were collected from an automated WatchDog weather station device (2000 Series, Spectrum Technologies, Aurora, IL, USA) located adjacent to the experimental locations. Thirty (30) years records of daily precipitation, daily minimum and maximum temperatures, and daily solar radiation were collected the from Nigerian Meteorological Agency (NIMET) [27] and used for the long-term simulation studies. The weather data was inputted into the weatherman utility software in the DSSAT v4.7 where it was checked for errors before use.
For model parameterization, evaluation, and sensitivity analysis, soil profile pits were dug in all the study areas. The generic horizons of the profiles and soil types were classified using the FAO guidelines [28]. Total soil organic carbon (total C) was measured using a modified Walkley and Black chromic acid wet chemical oxidation and spectrophotometric method [29]. Total nitrogen (total N) was determined using a micro-Kjeldahl digestion method [30]. Soil pH in water (S/W ratio of 1:2.5) was measured using a glass electrode pH meter and the particle size distribution following the hydrometer method [31]. Available phosphorus was extracted using the Bray 1 method [32].

2.5. CSM-CERES Maize Model Calibration

The DSSAT crop models require genotype specific parameters (GSPs), which are specific for each cultivar. GSPs allow the model to simulate performance of diverse varieties under different soil, weather and management conditions [33]. GSPs of two intermediate-maturing maize varieties (SAMMAZ-15 and SAMMAZ-16) were first calibrated by adjusting the six coefficients P1, P2, P5, G2, G3, and phyllochron interval (PHINT) (Table 1) which describe the growth and development characteristics for each individual variety. Three parameters (P1, P2 and P5) define the life cycle development characteristics, two coefficients (G2 and G3) define growth and yield characteristics and one coefficient, PHINT, defines leaf tip appearances [34]. Development coefficients are calculated in degree days (or thermal time) in the CERES-Maize. Thermal time in any given day is equal to mean air temperature minus base temperature [35].
G D D = i = 1 n ( T m a x i + T m i n i 2 ) T b a s e
where GDD is growing degree days, Tmax is maximum temperature, Tmin is minimum temperature and Tbase is base temperature (Tbase for maize = 8 °C). GDD is cumulative and is measured in °C day−1.
In the CERES-Maize model, the GSPs were calibrated by comparing simulated and measured data for days to anthesis, days to maturity, biomass, and grain yield from the calibration experiments. Since both varieties are not in DSSAT, we created them in the genetic file (MZCER047.CUL) of DSSAT-CSM. Initial values of the GSPs were obtained from the generic medium season cultivar (990002 MEDIUM SEASON), already available in the genotype files. The computed crop specific parameters values for MEDIUM SEASON cultivar were copied into MZCER047.CUL file to operate the simulation. The Generalized Likelihood Uncertainty Estimation (GLUE) Coefficient Estimator module [36] fixed in the DSSAT model was used to estimate the GSPs for both maize varieties.
The soil, weather, and crop management information were used to provide the environmental calibration for the model. The soil information was inputted into the soil utility software (soil.sol) of DSSAT. The model estimated the drained upper limit (DUL), the saturated upper limit (SAT), the lower limit of plant-available soil water (LL), saturated hydraulic conductivity (Ksat) and root growth factor (RF) for each soil layer. The volumetric water content for each soil layer in the model is between a lower limit (LL) to which plants can absorb soil moisture and a saturated upper limit (SAT) as described by Singh et al. [37]. For model calibration, water and nitrogen balance simulation controls were switched off, to ensure that no stress for water or nitrogen were simulated since near-optimal conditions were assumed for water and nitrogen in the calibration experiments.

2.6. CSM-CERES-Maize Model Evaluation

Model evaluation was done to test the parameters already optimized in the calibration exercise using independent experimental data. Data used in model evaluation include final grain yield and shoot dry matter ha−1. Root mean square error (RMSE) and model forecasting efficiency (EF) were used to evaluate the mode performance.
R M S E = i = 1 n ( m i s i   ) n
E F = i = 1 n ( m 1 m ¯ ) 2 i = 1 n ( s i m i ) 2 i = 1 n ( m i m ¯ ) 2
where n is the number of measured datasets, S i . is the simulated data, m i . is the measured data, and m ¯ . is the mean of the measured data. In addition, an index of agreement (d) statistic [38] was employed in this study.
d = 1 i = 1 n ( m i S i ) 2 i = 1 n | S i | + | m i | ) 2
where: S i = S i m ¯ and m i = m i m ¯ .
The d-index statistics is recommended for making cross-comparisons where the d value is both relative and has bounded measures. The d-statistics and EF are range of values between 0 and 1, the closer the index value is to 1, the better the model agreement and efficiency between the two variables that are being compared. The Microsoft excel software 2016 was used to graph and compare simulated model outputs with observed data. The graph builder in DSSAT v4.7 was used to calculate model performance statistics [39].

2.7. Model Application

After model calibration and evaluation, seasonal analysis tool of DSSAT was applied to test the effect of varying sowing windows on grain yield of the intermediate-maturing maize in three agro-ecologies mentioned in 2.1. Nine sowing windows (early June, mid-June, late June, early July, mid-July, late July, early August, mid-August and late August) were simulated with a view to identifying the optimal planting window. In each year of simulation, sowing was done according to treatment with conditions set to only sow when a total rainfall exceeding 10 mm occurred within the previous three days before the sowing window. Generally, sowing was done at soil depth of 5 cm, with a sowing density of 5.3 plants m−2. The model was set to harvest when the crop reached harvest maturity. The mean, minimum and maximum yields with their standard deviations for 30 years planting date for each variety and location were calculated. Cumulative frequency plots were used to present the results of simulated yields over 30-year period.

3. Results

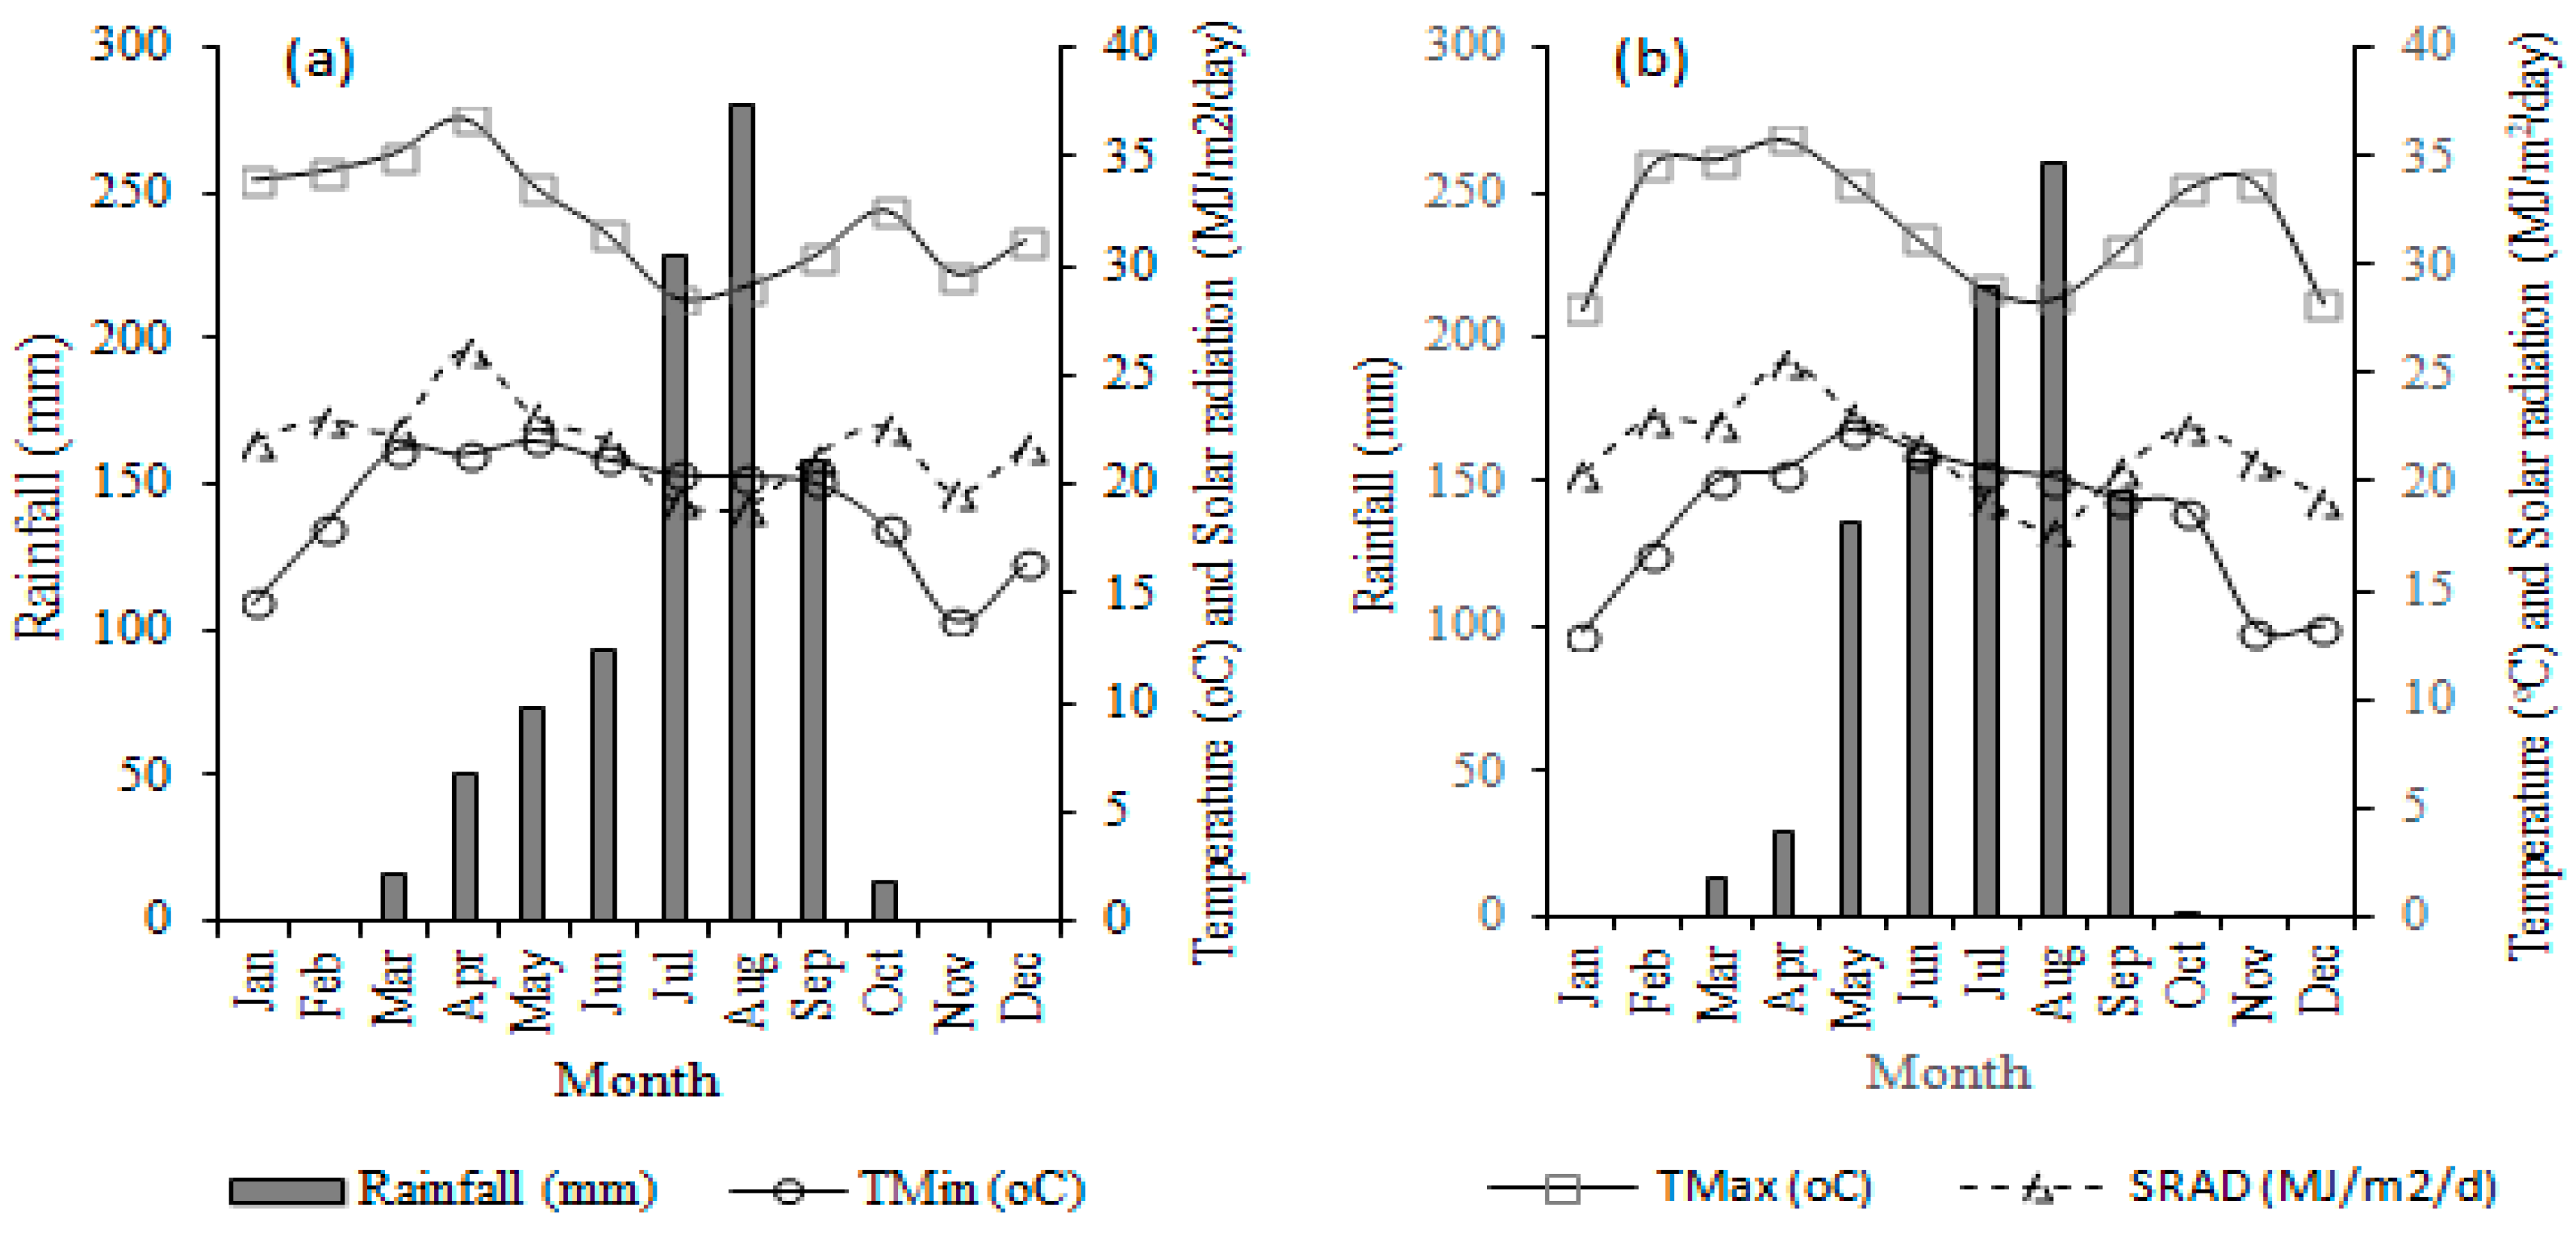
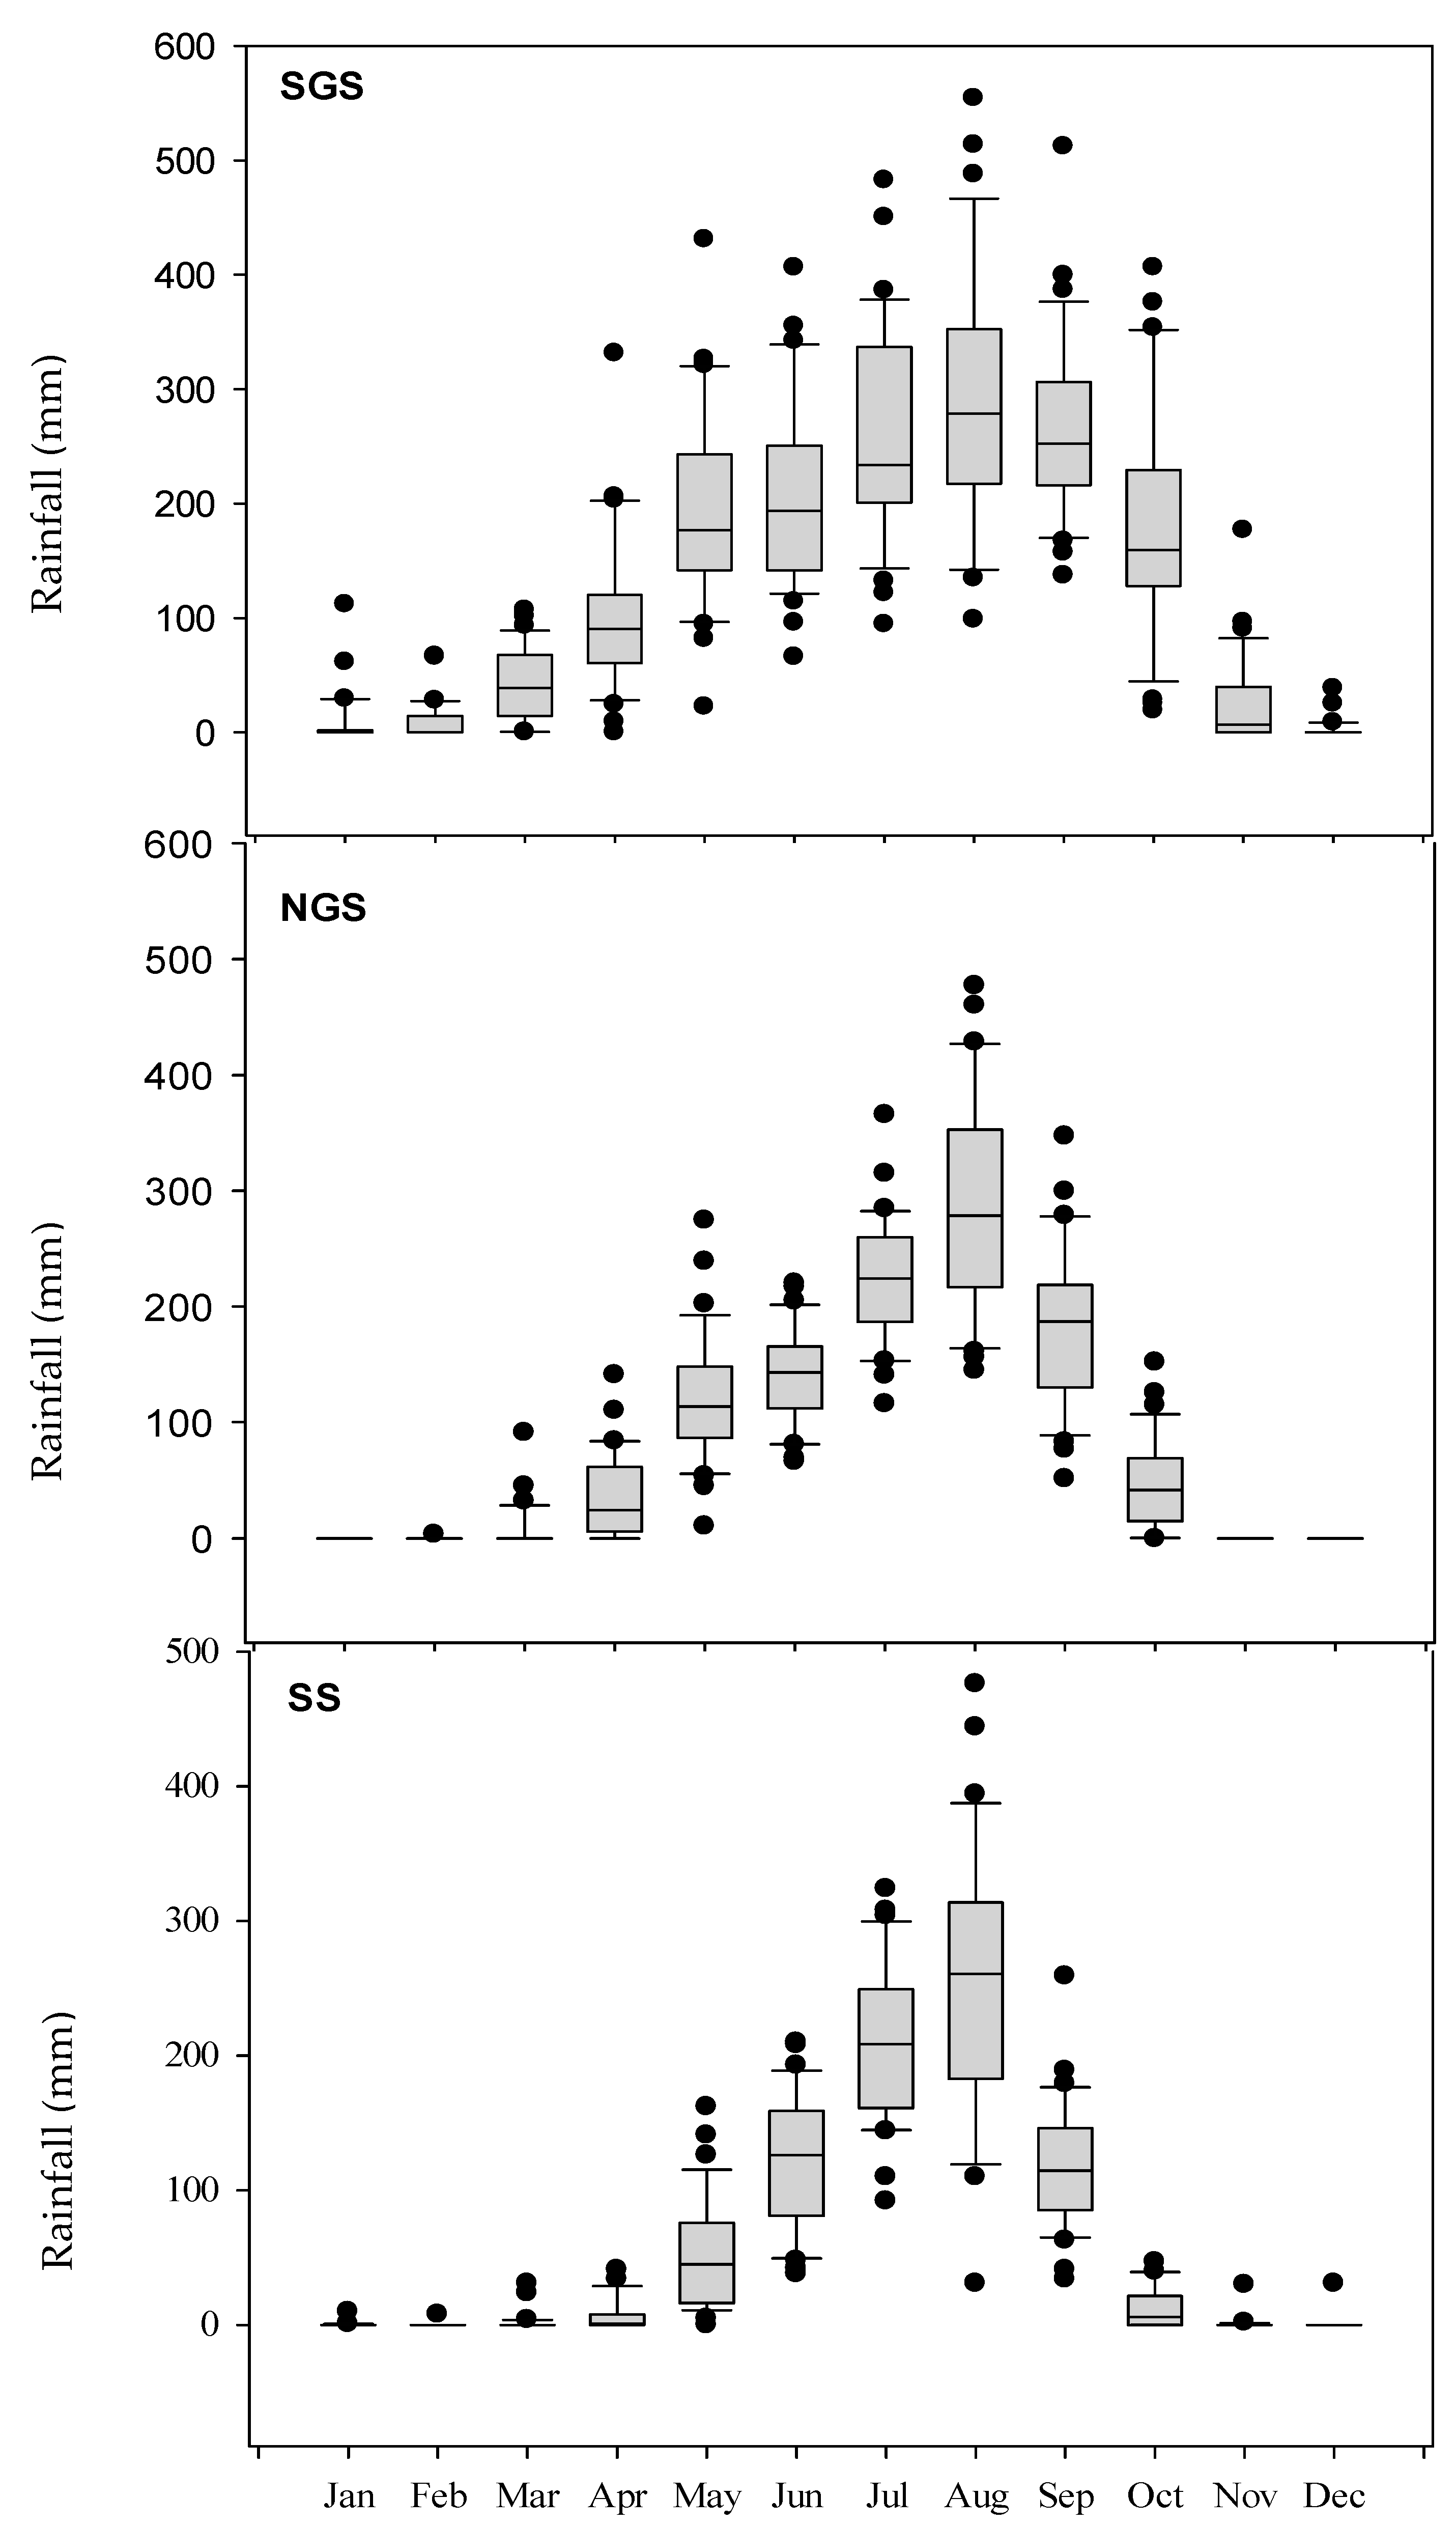
3.1. Soil and Weather Condition

Table 1 shows the result of soil parameters used for model calibration. The LL water content of the soils ranged between 0.1 to 0.13 in BUK; 0.06 to 0.09 in Dambatta, and 0.14 to 0.29 in Zaria. The maximum drain upper limit was 0.21 in BUK, 0.16 in Dambatta and 0.41 in Zaria. The pH values of the subsurface oilss were neutral (6.6) in BUK, slightly acidic (6.1) in Dambatta and acidic (4.7) in Zaria. The soil organic carbon contents were low in BUK and Zaria (4–10 g kg−1) while in Dambatta the range was very low (<4.0 g kg−1). The values for subsurface total nitrogen at BUK and Dambatta were in the very low range (<0.6 g kg−1) while Zaria had low total N (0.8 g kg−1) content. Available soil phosphorus levels observed in the soils fell within the very low (<3 mg kg−1) category.
During model evaluation experiments, the total amount of rainfall was higher at Iburu in both years. Total annual rainfalls at Iburu were 1286.9 in 2015 and 1173.3 mm in 2016. At Zaria however, total rainfalls were 983.1 in 2015 and 863.3 in 2016, respectively (Figure 1 and Figure 2). In both years and locations, rains were less at the beginning and at the end of the growing season with generally even distribution during mid-season (July/August). At Iburu, the mean minimum and maximum air temperatures during the experimental periods were 20.3 and 33.2 °C in 2015 and 20.1 and 33.0 °C in 2016. In Zaria, the mean minimum and maximum air temperatures were 19.0 and 32.3 °C in 2015 and 18.3 and 31.9 °C in 2016. The average solar radiation was 20 and 21 MJ m−2 day−1 at Iburu and Zaria, respectively. Results from long-term historical weather data on rainfall over a 30-year period from 1985 to 2014 in the model application sites are presented in Figure 3. The result shows that there was higher rainfall and with better distribution in the SGS and NGS compared to Sudan savanna (SS). Average rainfall obtained for the 30-year period is 795, 1042, and 1611 mm for SS, NGS, and SGS, respectively.

3.2. CSM CERES-Maize Model Calibration

GSPs generated from the model calibration experiments for SAMMAZ-15 and SAMMAZ-16 maize varieties are presented in Table 2. The estimated values for thermal time from seedling emergence to the end of juvenile phase (P1) for SAMMAZ-15 was 274.3 while that of SAMMAZ-16 was 253.3. Generated value for P2 (Delay in development for each hour that day-length is above 12.5 h) was 0.489 for SAMMAZ-15 and 0.424 for SAMMAZ-16. The thermal time from silking to time of physiological maturity (P5) value was slightly higher for SAMMAZ-15. The values of the yield-determining parameters (maximum kernel number per plant (G2)) and kernel growth rate during linear grain-filling stage under optimum conditions (G3) were found to be higher for SAMMAZ-15.
To assess the accuracy of the cultivar coefficients derived from model calibration, simulated values for days to anthesis, days to physiological maturity, grain yield, and shoot dry matter at harvest for SAMMAZ-15 and SAMMAZ-16 varieties were compared with the corresponding observed values (Table 3). A close agreement was found between simulated and observed values for all four measured parameters. The model slightly under estimated all the parameters for both varieties except grain yield for SAMMAZ-15 and shoot dry matter for both varieties, although they are within acceptable range according to the evaluation statistics (Table 4). The statistical values of simulated and measured days to anthesis and physiological maturity ranged from −0.002 to −0.02 days for mean error, 1.9 to 2.3 days for RMSE and 0.93 to 0.97 for d-index for both varieties. The comparison between simulated and observed grain yields were also quite good for both maize varieties. The RMSE values for grain yield was 470 kg ha−1 for SAMMAZ-15 and 245 kg ha−1 for SAMMAZ-16 while d-index values were above 0.90 for both varieties. The predictions for shoot dry matter were also good for both varieties; the RMSE values for shoot dry matter was 1728 kg ha−1 for SAMMAZ-15 and 1152 kg ha−1 for SAMMAZ-16 while d-index value was 0.75 and 0.80 for SAMMAZ-15 and SAMMAZ-16, respectively.

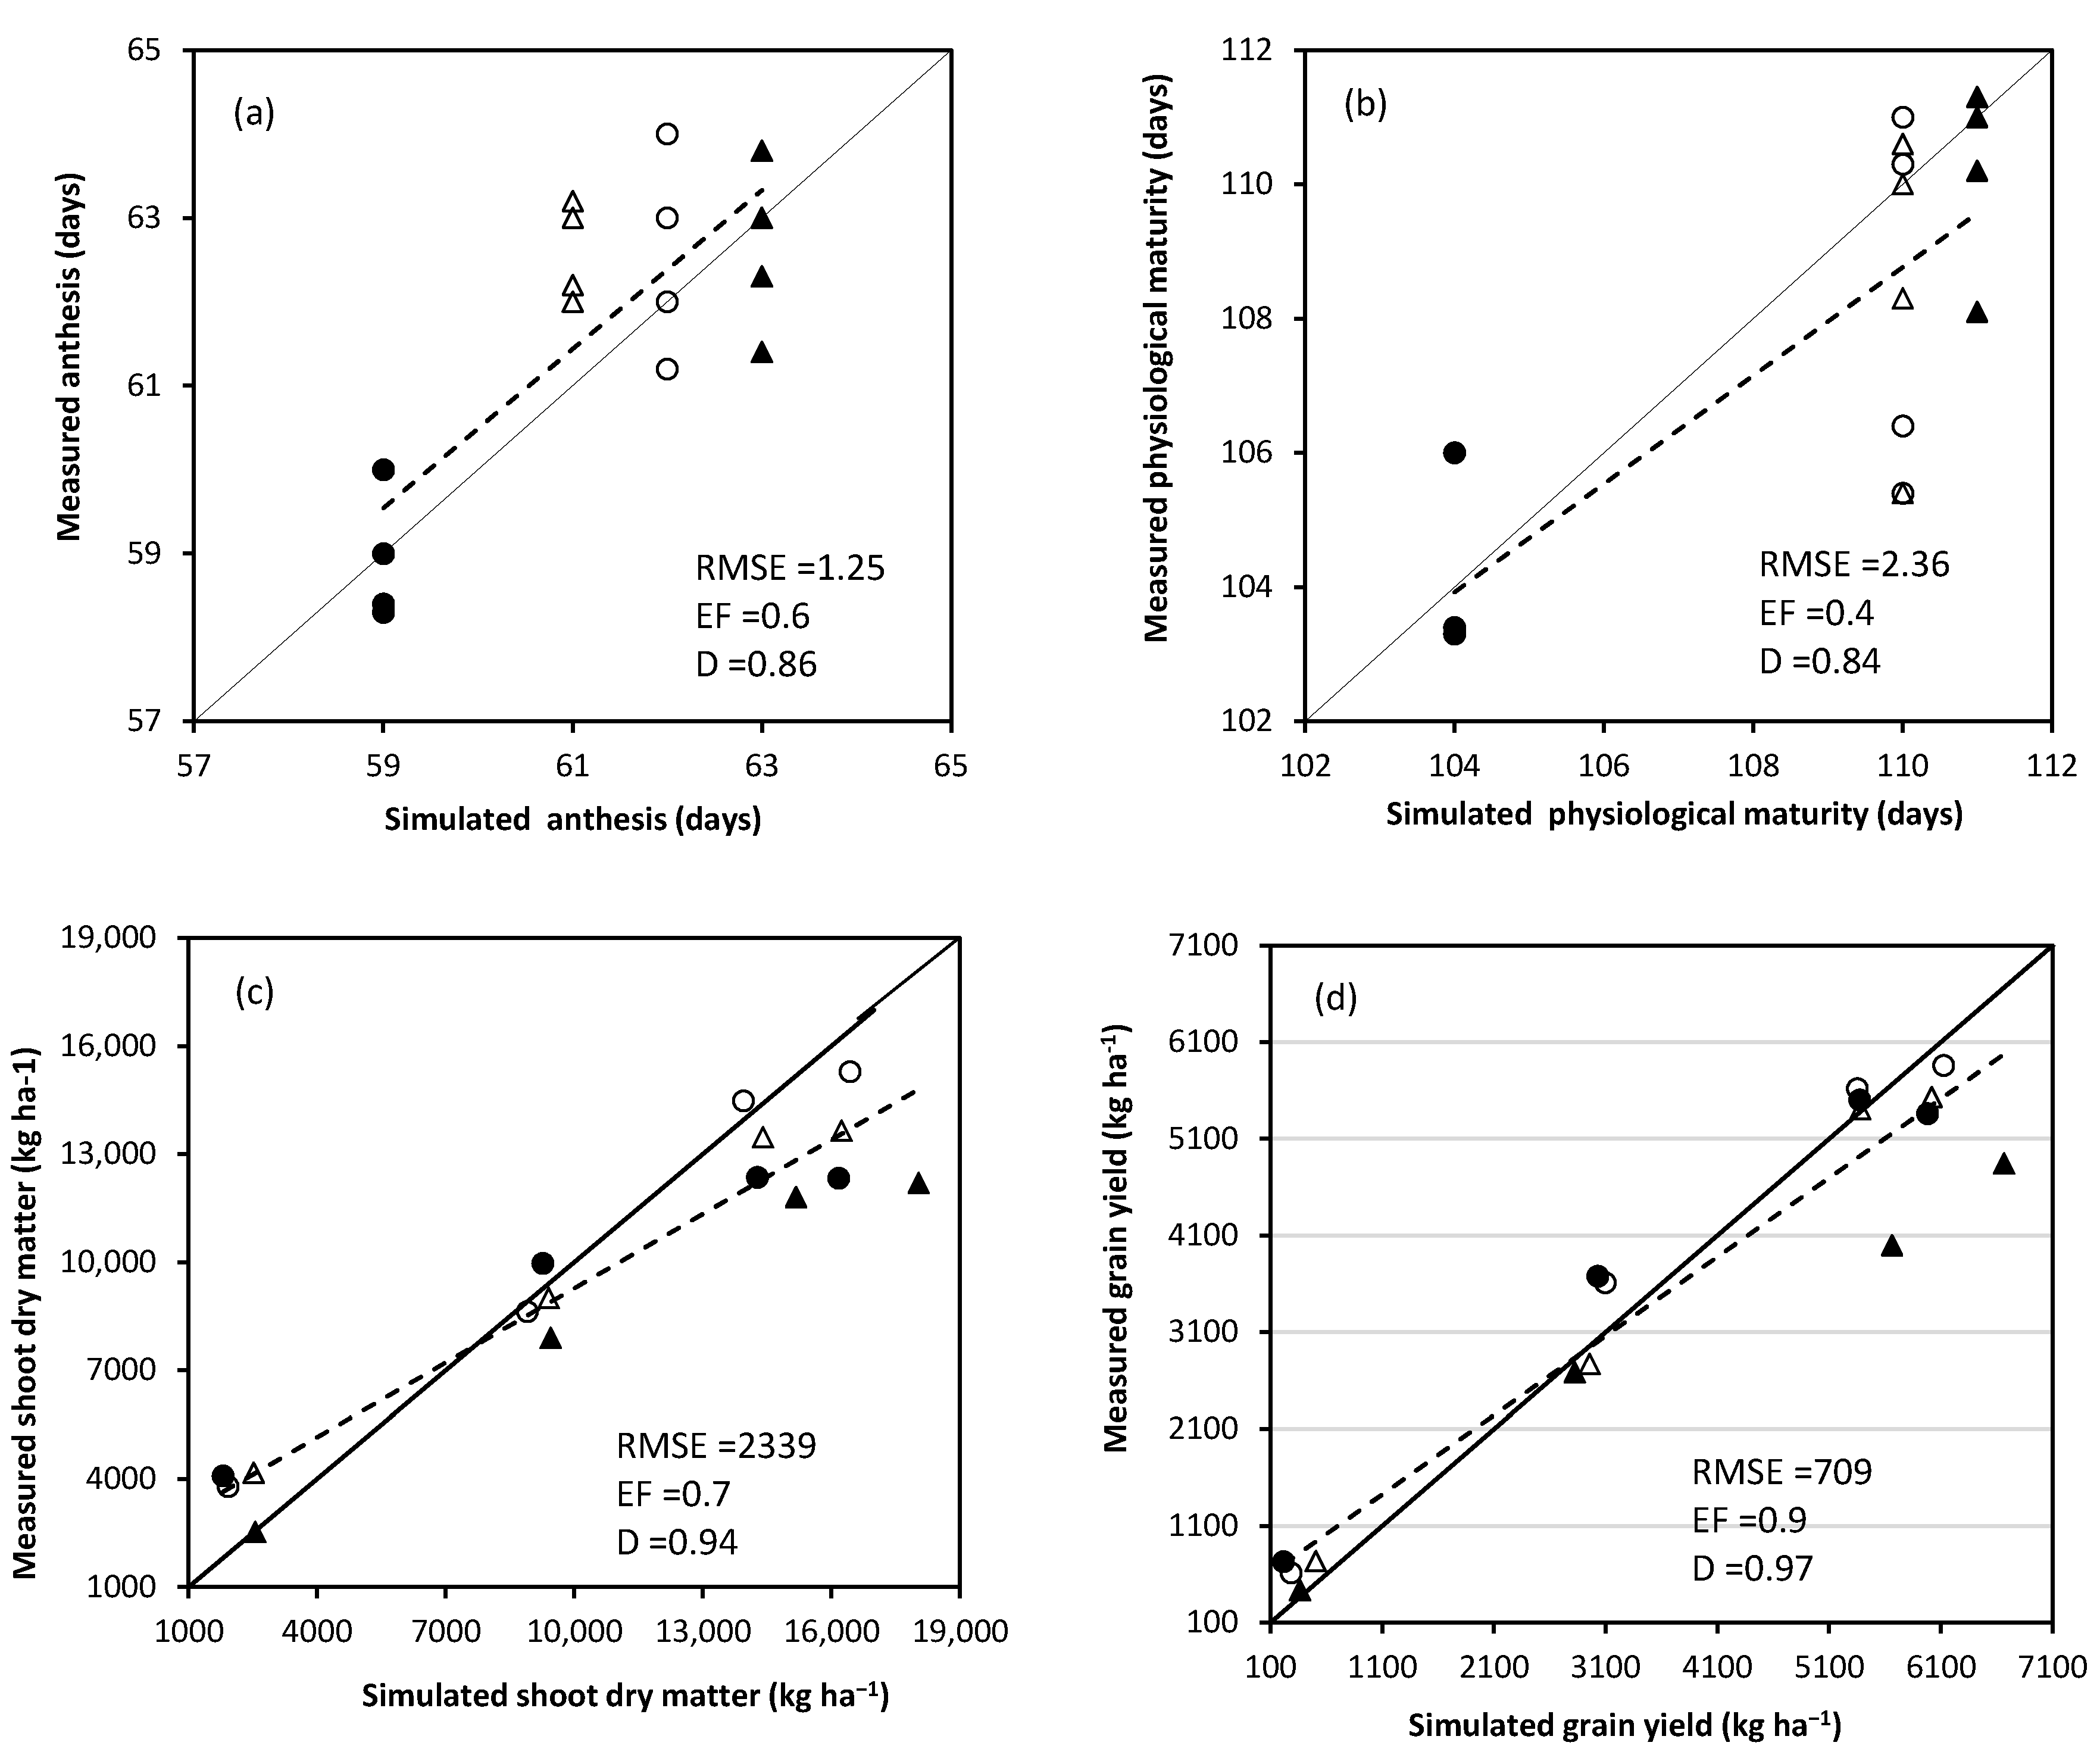
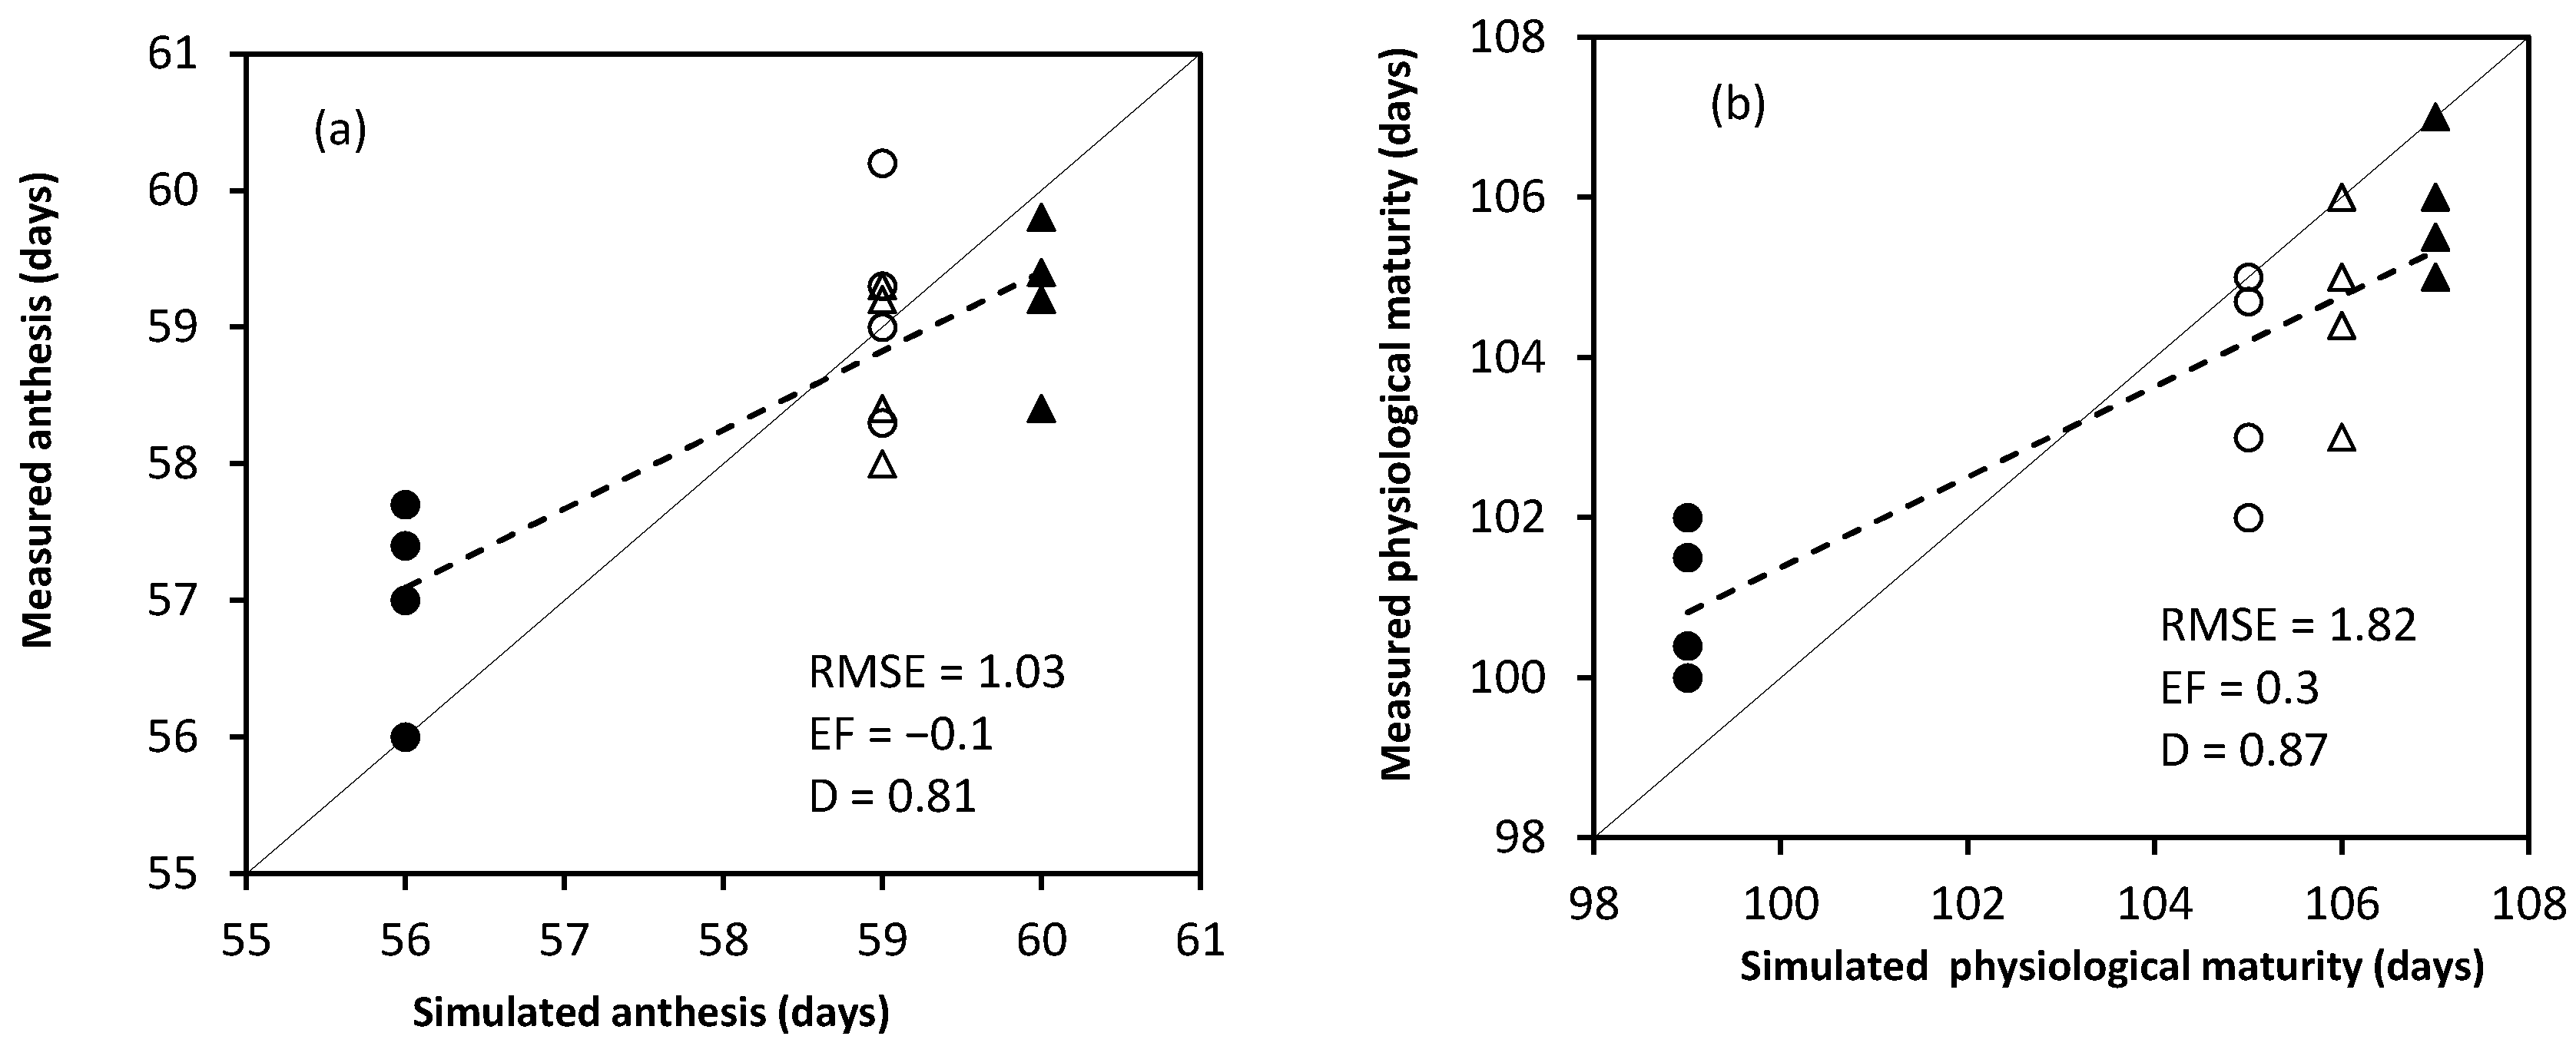
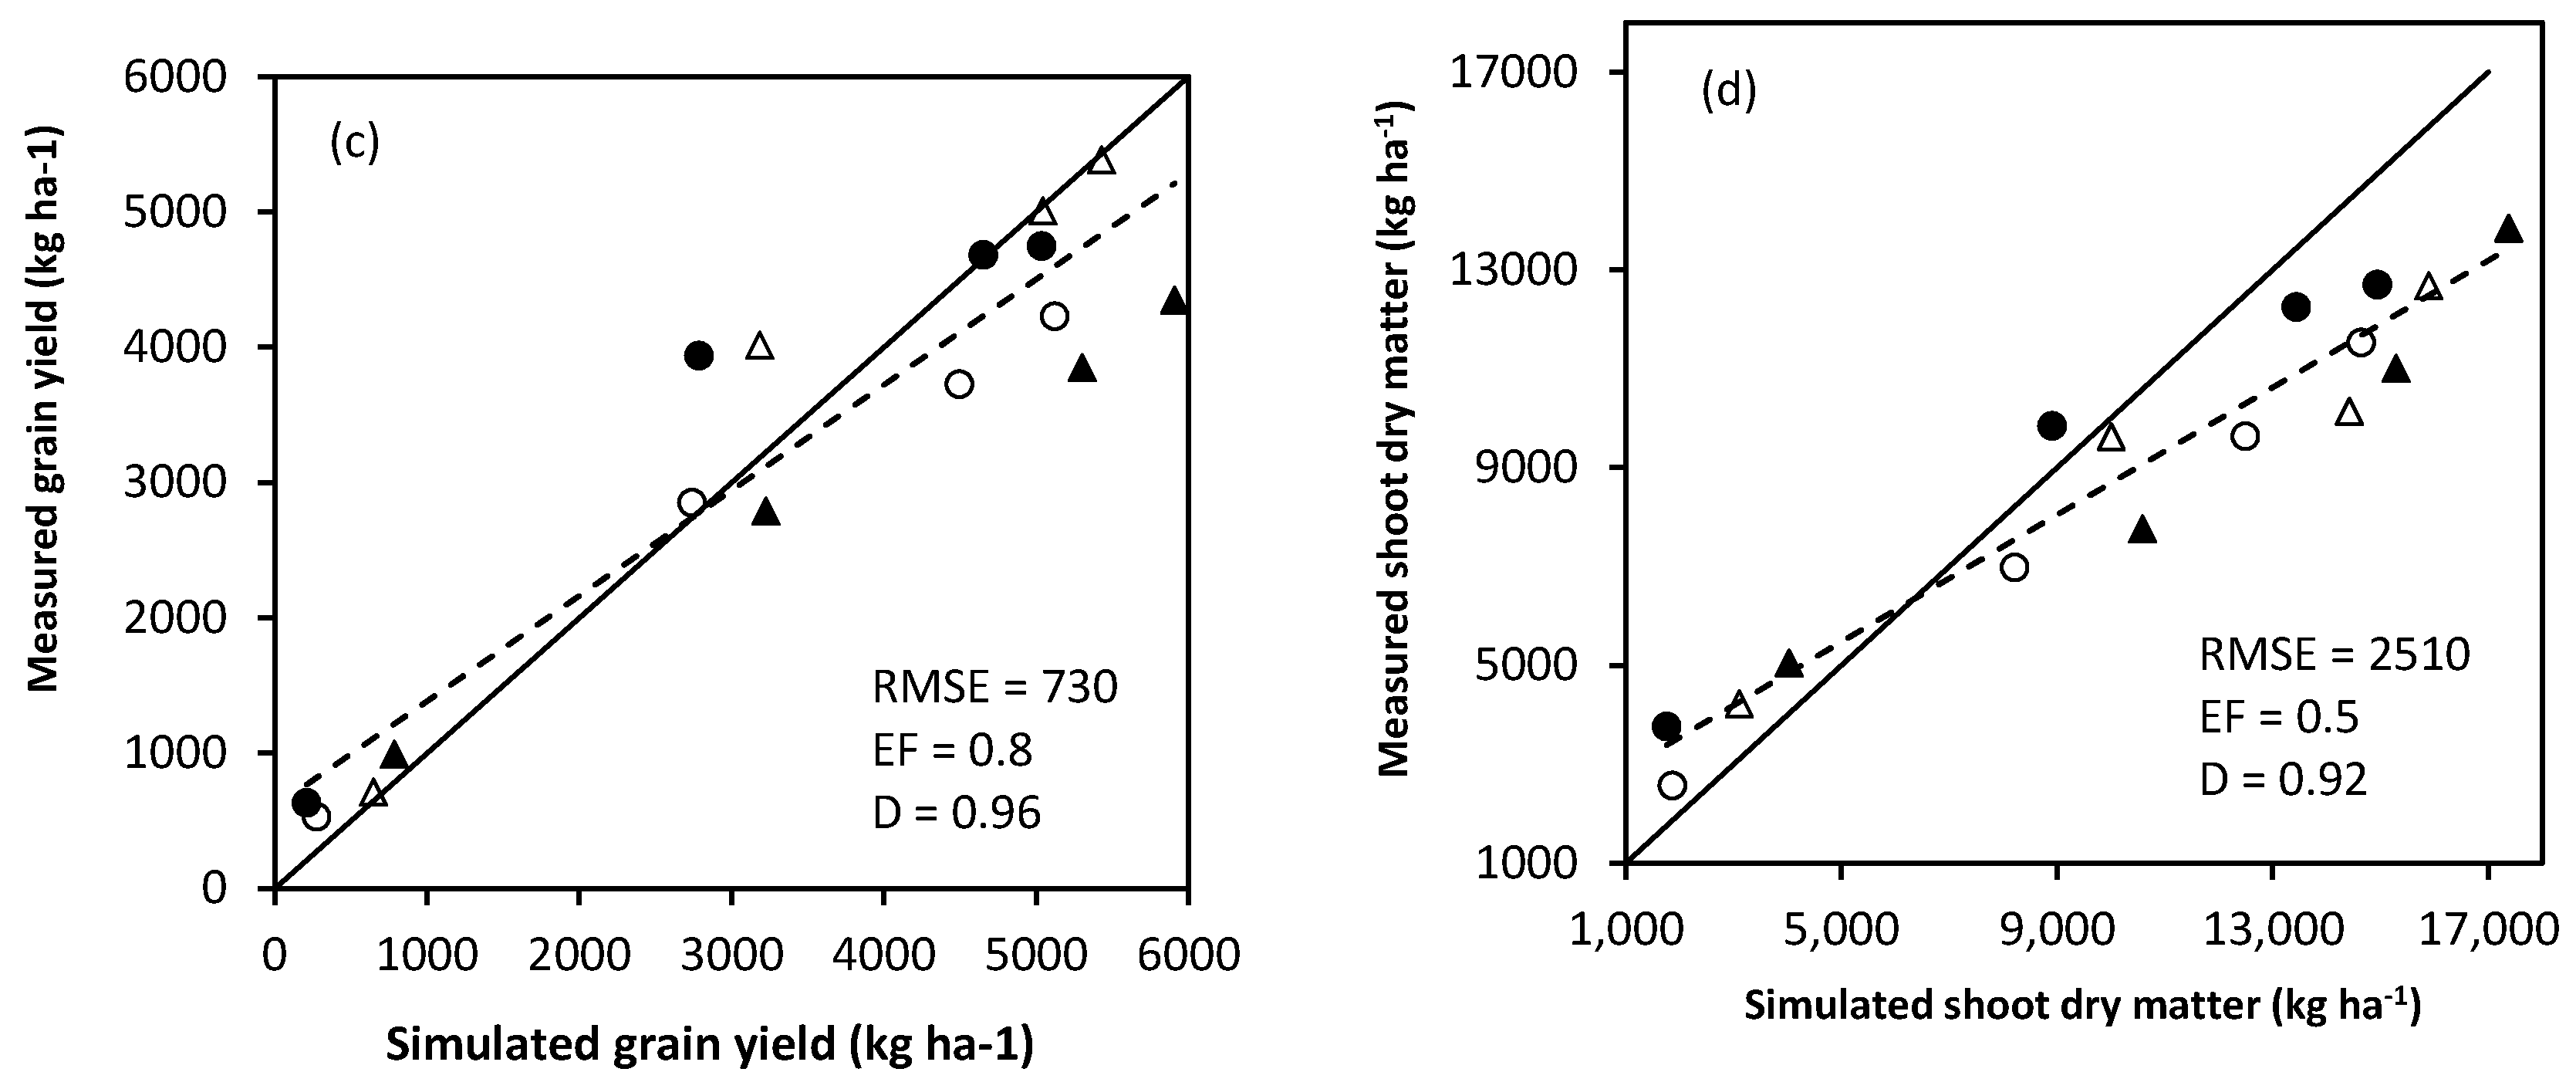
3.3. CSM CERES-Maize Model Evaluation

The accuracy of the CERES-Maize model simulations and performance of genetic coefficients were assessed by running the model with independent data sets collected during 2015 and 2016 growing seasons under four levels of nitrogen (0, 60, 120 and 180 kg N ha−1) application in two locations (Iburu and Zaria). Days to anthesis, days to physiological maturity, grain yield at maturity and shoot dry matter at maturity were used for model evaluation (Figure 4 and Figure 5).
The results show high accuracy with RMSE values of <1.5 days for number of days to 50% anthesis and <3 days for several days to physiological maturity with high d-index (above 0.80) values for both varieties (Figure 4 and Figure 5). There was a good fit in the model prediction of grain yield with low RMSE of 709 kg ha−1 for SAMMAZ-15 and 730 kg ha−1 for SAMMAZ-16. The shoot dry matter value of RMSE was 2339 for SAMMAZ-15 and 2510 kg ha−1 for SAMMAZ-16. There were also high d-index values (above 0.90) for both grain and shoot dry matter for the two varieties. Estimation efficiency (EF) values between 0.5 to 0.9 were observed for grain yield and shoot dry matter for both varieties. Generally, grain yield and shoot dry matter increased with increase in nitrogen; however, the model slightly underestimated grain yield and shoot dry matter at 0 N. However, with application of N the parameters were mostly and slightly overestimated.

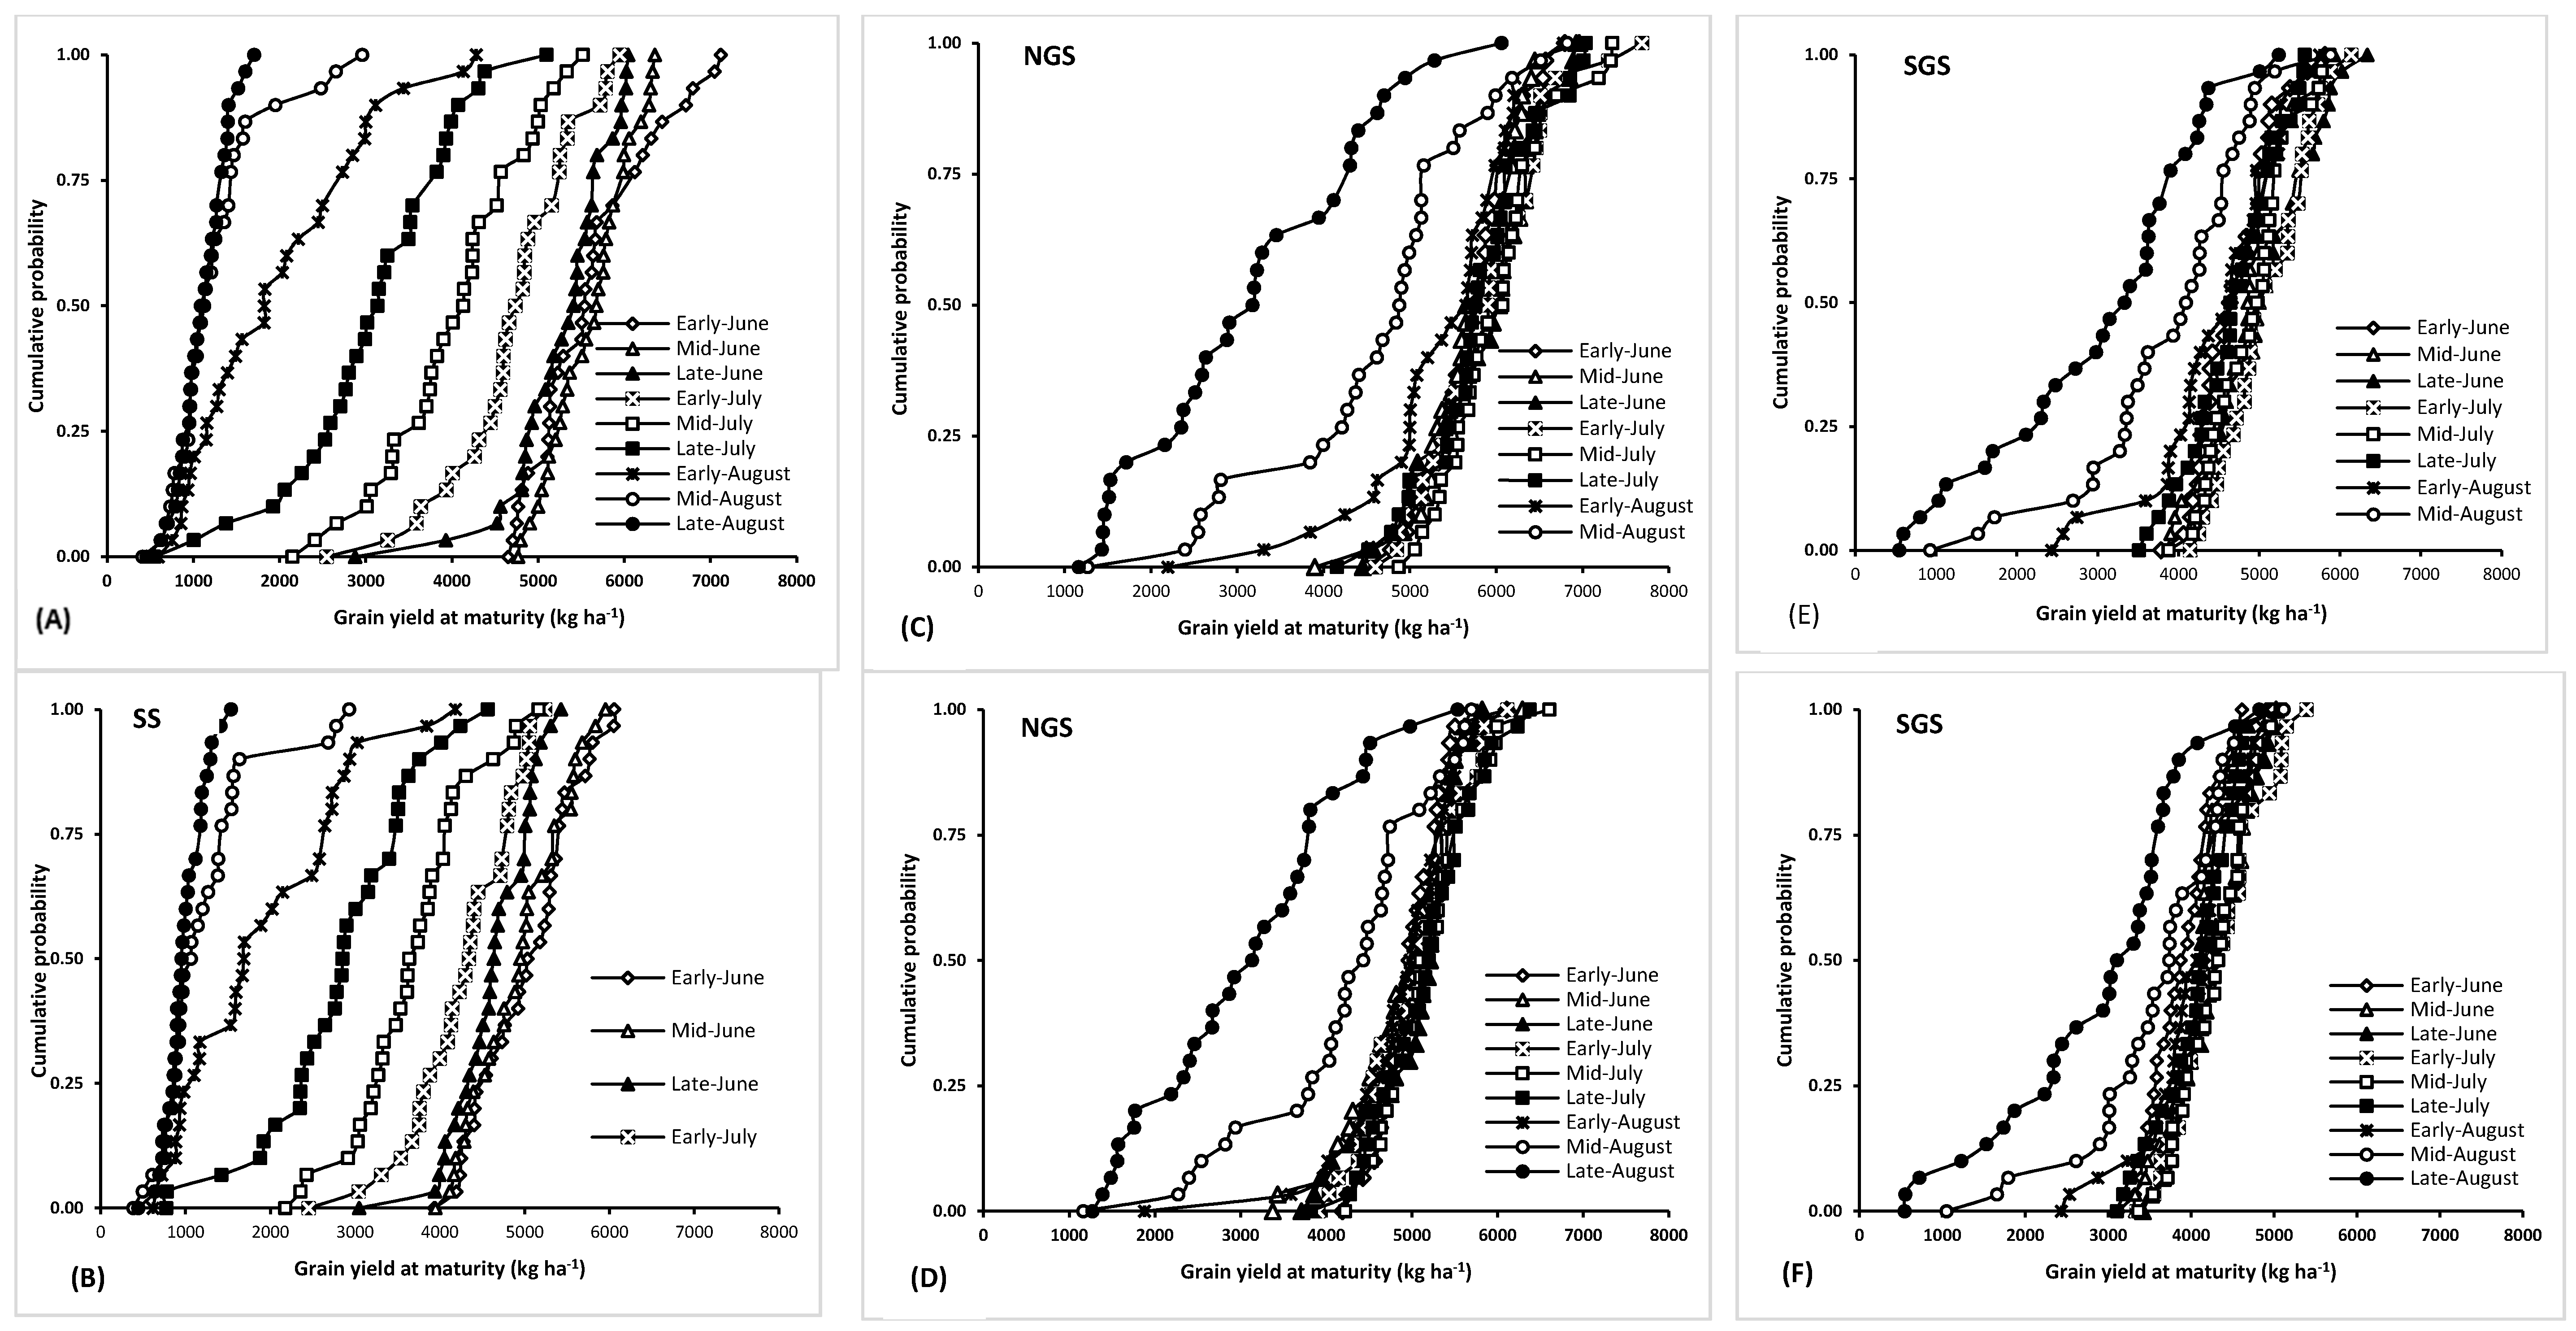
3.4. Model Application

Results of seasonal analysis for the two varieties conducted at the three locations over a 30-year period for the different sowing windows are shown in Table 4. The results indicate minimum and maximum yield within the 30-year period of simulation with their mean and standard deviations. In SS, sowing between early to mid-June recorded the highest grain yield for the two varieties. In this location, delay in sowing beyond mid-June consistently reduced grain yields. Delaying sowing of SAMMAZ-15 from mid-June to mid-July reduced grain yield by 25% and further delay to mid-August, reduced grain yields by 78%, Delaying sowing of SAMMAZ-16 to mid-July and mid-August reduced grain yield by 26% and 75%, respectively. The lowest mean grain yields (<1500 kg ha−1) were recorded from mid to late August sowing windows for both varieties.
Results showed that sowing SAMMAZ-15 in NGS from early June to late July produced mean grain yields (above 5.7 t ha−1) that were higher than those of the other sowing windows (Table 4). Delaying the sowing of this variety beyond late July reduced grain yields by 8 to 46%. Sowing SAMMAZ-16 between late June and late July gave mean grain yields (5.0 t ha−1) that was higher than those of the other sowing windows. When sowing was delayed beyond late July grain yields reduced by 6–41%. The model simulated consistently minimum grain yields with higher standard deviations when sowing was delayed to August.
In SGS, higher mean (<5 t ha−1), maximum (<6 t ha−1) and minimum (<4 t ha−1) grain yields with low standard deviations were obtained when sowing was done from late June to early July for SAMMAZ-15. However, for SAMMAZ-16 highest mean (4314 kg ha−1) and maximum (5389 kg ha−1) grain yields were produced when planting was done in early July. Mean grain yields above 4.5 tons ha−1 were observed for all sowing dates from early June to late July for SAMMAZ-15, while yields above 4 tons ha−1 were obtained between mid-June to late July for SAMMAZ-16 (Table 4). In this location, delayed sowing from late July to late August led to a reduction in mean grain yields by 36% for SAMMAZ-15 and 30% for SAMMAZ-16. The minimum grain yields (<1.1 tons ha−1) were recorded with sowing window from mid to late August for both varieties.
Figure 6 show cumulative distribution functions (CDF) plots for simulated grain yields of SAMMAZ-15 and SAMMAZ-16 in SS, NGS, and SGS. For SAMMAZ-15 in SS, early sowing (early to late June) resulted in grain yields above 4 tons ha−1 in all years of simulations, except for sowing in late June where 28 out of 30 years recorded yields above 4 tons ha−1. For the early sowings, yields above 6 tons ha−1 were simulated in 6 out of the 30 years of simulation for sowing in both early and mid-June. Delaying sowing to early, mid, and late July, progressively decreases yield of SAMMAZ 15 in SS with the lowest yields simulated for late July where yields below 4 tons are only guaranteed 50% of the time. The simulations show that sowing SAMMAZ 15 in mid and late August resulted in yields below 2 tons in 28 out of the 30 years of simulations, while sowing in early August could only produce yields above 2 tons with a 55% probability. Similar trends were observed for SAMMAZ-16 in SS, with the highest yields simulated when sowing was done early, and lowest yields simulated when sowing was delayed to August. The only difference is that the yield of SAMMAZ 15 was consistently higher than that of SAMMAZ 16 in all sowing windows (Figure 6A,B). The CDF plot in NGS showed that sowing SAMMAZ-15 from early June to mid-July gave a grain yield of at least 4 tons ha−1 at the lowest probability, delaying sowing from late July to early, mid and late August reduced guaranteed grain yield by 47, 70 and 72%, respectively (Figure 6C). At 50% probability, sowing SAMMAZ-15 from early June to late July produced a grain yield above 5500 kg ha−1. For SAMMAZ-16, the CDF plot shows that sowing from early June to late July gave grain yield of at least between 3.4 to 4.2 tons while sowing in August gave grain yields between 1.3 to 1.9 tons (Figure 6D). At 50% probability, sowing SAMMAZ-16 from early June to late July produced a grain yield above 5000 kg ha−1. In SGS, the CDF plot shows that at lowest probability sowing SAMMAZ-15 from late June to early July recorded grain yield of at least 4 tons ha−1. Delaying sowing to August gave a minimum obtainable grain yields ranging between 0.5 and 2.4 tons (Figure 6E). Yields above 5 tons were observed when sowing was done between late June and mid-July with probability of 50%. For SAMMAZ-16, the CF plot shows that sowing from late June to mid-July gave a guaranteed grain yields of at least 3.3 tons ha−1 while sowing in mid and late August windows gave lowest obtainable grain yields of ≤1000 kg ha−1 (Figure 6F). Yields above 4 tons were observed when sowing was done between late June and mid-July with probability of 50%.

4. Discussion

The model statistics for calibration and evaluation as indicated by high d-index and low RMSE values indicated good agreements between observed and model predicted values. This shows that the CERES-Maize model can be used as a suitable tool for decision making in crop production in the Nigeria savannas. The accuracy of model calibration and evaluation in the current study agrees with previous research conducted using CERES-Maize in Nigeria [3,20,24]; Ghana [25]; and in the Sub-humid Region of Benin [40].
The model performed well in predicting phenological parameters (anthesis and physiological maturity), grain yield, and shoot dry matter of both varieties in the savannas of Nigeria. The average d-index values for measured parameters were above 0.90 for each variety at both locations. Adnan et al. [41] evaluated CERES-Maize model with many varieties and different maturity groups in northern Nigeria and reported average d-index value for grain yield as 0.99 from experimental data and 0.96 from breeder data. Adnan et al. [3] also reported a d-index of 0.82 for shoot dry matter in northern Nigeria. The overall accuracy of the model evaluation might be as a result of close agreements between simulated and measured phenological parameters of the calibration experiments. Better prediction of maize phenological parameters is among the important stages for model calibration. Robertson et al. [42] stated that when phenology is accurately calibrated, it is expected that models will be able to capture all genotypic variations that affect the leaf area development, total dry matter, and grain yield. The closeness of simulated and measured grain yields in both calibration and evaluation experiments can be as a result of accurate estimation of maximum grains number per plant and kernel growth rate under optimum conditions as suggested by Adnan et al. [3].
Selecting the appropriate sowing window is among the crop management strategies that is costless to the farmer [22]. To date, the major challenge among maize growers in the savanna regions is finding the appropriate window between sowing too early and sowing too late that gives an optimum yield [43]. Early sowing at the onset of rainy season is quite risky as the crop might mature in humid and cloudy weather that favors cob/grain rot due to high moisture content at the time of harvesting. While late sowing also leads to a higher yield reduction and has the potential of resulting in total crop failure due to shorter period for exposure to moisture, sunlight as well as less nutrient uptake [3]. Irrespective of maize varietal differences, the recommended sowing date for maize in Nigeria is early to mid-June in the major three (SS, NGS, and SGS) agro-ecologies of northern Nigeria [44]. These recommendations are made from cropping experiments conducted in a few sites across the maize zones in Nigeria. Sowing date is usually recommended for multiple years and multiple locations irrespective of seasonal and spatial variations as well as varietal differences [3]. However, our findings with the simulation model are contrary to the recommendations.
The model application results show that the highest average yield for the 30 years in Sudan savanna was simulated when sowing was done in mid-June. However, when sowing was delayed to mid-July, a reasonable minimum grain yield of 2 tons for both varieties were obtained. Rainfall in this agro-ecological zone usually ends in September, meaning that intermediate-maturing maize should be sown in the Sudan savanna as soon as the rain establishes in the second or third week of June to avoid yield reduction due to insufficient moisture and dry spell in September which coincides with grain-filling stage of the crop. Kamara et al. [6] and simulation results from Jibrin et al. [24], reported late June and early July as the optimum sowing dates in Sudan savanna of northern Nigeria for early and intermediate/late varieties from short-duration experiments.
The model simulated the optimum sowing window from late June to late July for both varieties in the NGS. Higher mean grain yields were observed when sowing was slightly delayed in this window. However, higher guaranteed grain yields were obtained when both varieties were sown in mid-July. In this location, however, sowing window can be as wide as from early June to late July as evident by the potential yield of >5.6 tons ha−1 for SAMMAZ-15 and >4.9 tons for SAMMAZ-16. This suggests that farmers in this zone can delay planting both varieties to late July which reduces the risk of replanting and labor demand constraints at the peak periods of the growing season. The present results are contrary to the recommendation by NAERLS [44] which suggested that the best planting date under NGS climatic conditions is between early to mid-June a period where farmers bear a risk of poor crop establishment because of unstable rainfall. In the SGS, the sowing window is as wide as that of NGS agro-ecology. However, for minimum obtainable yields, the model predictions show that sowing should not be delayed beyond late July for both varieties. However, evidence from the average grain yields, farmers in this zone can start planting intermediate-maturing maize varieties from mid-June since rainy season usually established in June in this savanna agro-ecology.
Despite the high amount of rainfall observed in the Northern and Southern Guinea Savannas, late sowing in August is not advisable according to the simulation results. This is demonstrated by low minimum obtainable yields in majority of years when planting was delayed in both agro-ecologies. The reduction in yields when intermediate/late maturing maize was sown in August may be due to water logging which may reduce soil temperature and high cloud cover that negatively affects yield of C4 plants such as maize if planted in August when rainfall is highest and solar radiation is lowest. Alberta [45] reported that when moisture content is maintained, every decrease in soil temperature resulted in a decrease in water and nutrient uptakes. At low temperature, transportation from the root to the shoot and vice versa will also reduce. Also, according to [46] very high or very low relative humidity is not conducive for high grain yield of maize. High humidity negatively correlates with grain yield of maize. The yield reduction was 144 kg ha−1 with an increase in one per cent of mean monthly relative humidity. Carter et al. [47], reported that solar radiation was the primary yield limiting climate variable and Oke [48] indicated that increase in mean relative humidity resulted in decline in grain yield. Likewise, the reduction in crop growth cycle when planted in August particularly from sowing to the grain-filling stage which is likely to extend to the end of October characterized by low rainfall and insufficient moisture might reduce the grain yield significantly. Additionally, late sowing could result in silking and grain-filling periods coinciding with periods of cessation of rainfall, thereby leading to flower abortions, low grain-filling rates, and reduction in grain-filling durations.
Maize performance varied among the tested agro-ecologies in this study. This could be as a result of high variability in the soil conditions and weather elements (rainfall, solar radiation and temperature) in the three agro-ecologies. Lin et al. [49] stated that climate, soil condition, and crop variety are the most important factors that influence crop production. Averaged mean grain yield across planting windows for both varieties were generally higher in the NGS followed by the SGS. The lowest yields were recorded in the SS. The higher grain yield obtained in the NGS and SGS could be attributed to the sufficient moisture and longer growing periods that increases dry matter accumulation and extend grain-filling duration of the crop. The SS has a shorter growing season, low rainfall and poor soil fertility that reduces the availability of water and dry matter accumulation leading to low yields. This makes the zone to be the least conducive for production of medium and late maturing maize varieties when compared with NGS and SGS agro-ecological zones.

5. Conclusions

Results from this study show that the CERES-Maize model when well calibrated and evaluated can be used to simulate the response of intermediate and late maturing maize varieties to varying sowing dates in the Nigerian savannas. Long-term simulations using 30-years weather data showed that the best planting window for both varieties was between early to mid-June in the SS and late June to late July in the NGS. However, in the SGS farmers can start planting SAMMAZ-15 from early June to late July and SAMMAZ-16 from mid-June to late July. For SAMMAZ-15, the drought-tolerant variety is recommended to farmers as an adaptation strategy to mitigate the impact of the current climate change especially in areas prone to intermittent droughts because it gives the highest grain yield under the three ecological conditions. Findings from this study have also shown that yield potential of intermediate maize varieties was highest in the NGS region. Results also show planting of intermediate-maturing maize can be delayed to late July in the NGS and the SGS if the onset of rainfall is delayed or the labor demand is high at the peak period of the season.

Author Contributions

Conceptualization, A.I.T., U.F.C., B.A.B., and A.Y.K.; methodology, A.I.T., A.Y.K., and A.A.A.; validation, A.I.T., and A.B.; formal analysis, A.I.T., and A.M.A.; field experimentation, A.I.T., U.F.C., B.A.B., A.Y.K., and A.B.; resources, A.Y.K.; data curation, A.I.T., A.Y.K., and A.A.A.; writing—original draft preparation, A.I.T., and A.Y.K.; writing—review and editing, A.I.T., A.Y.K., A.A.A.; supervision, U.F.C., B.A.B., and A.Y.K.; funding acquisition, A.Y.K. All authors have read and agreed to the published version of the manuscript.

Funding

This research was funded by Bill and Melinda Gates Foundation under the Project Taking Maize Agronomy to Scale in Africa (TAMASA) with Grant no. OPP1113374.

Acknowledgments

We would also like to thank the Center for Dryland Agriculture Bayero University, Kano and Nigerian Meteorological Agency (NIMET) for providing climate data and the staff of Agronomy unit of IITA, Kano office for collecting the experimental data in this research study.

Conflicts of Interest

The authors declare no conflict of interest.

References

  1. Graef, F.; Haigis, J. Spatial and temporal rainfall variability in the Sahel and its effects on farmers’ management strategies. J. Arid. Environ. 2001, 48, 221–231. [Google Scholar] [CrossRef]
  2. Marteau, R.; Sultan, B.; Moron, V.; Alhassane, A.; Baron, C.; Traoré, S.B. The onset of the rainy season and farmer’s sowing strategy for pearl millet cultivation in South-west Niger. Agric. For. Meteo. 2011, 151, 1356–1369. [Google Scholar] [CrossRef] [Green Version]
  3. Adnan, A.A.; Jibrin, M.J.; Kamara, A.Y.; Abdulrahman, B.L.; Shuaibu, A.S.; Garba, I.I. CERES-Maize model for determining the optimum planting dates of early maturing maize varieties in northern Nigeria. Front. Plant Sci. 2017, 8, 1–18. [Google Scholar] [CrossRef] [PubMed] [Green Version]
  4. Staggenborg, S.A.; Fjell, D.L.; Devlin, D.L.; Gordon, W.B.; Maddux, L.D.; Marsh, B.H. Selecting optimum planting dates and plant populations for dryland corn in Kansas. J. Prod. Agric. 1999, 12, 85–90. [Google Scholar] [CrossRef]
  5. Kamara, A.Y.; Menkir, A.; Badu-Apraku, B.; Ibikunle, O. Reproductive and stay-green trait responses of maize hybrids, improved open-pollinated varieties and farmers’ local varieties to terminal drought stress. Maydica 2003, 4, 29–37. [Google Scholar]
  6. Kamara, A.Y.; Friday, E.; David, C.; Lucky, O.O. Planting date and cultivar effects on grain yield in dryland corn production. Agron. J. 2009, 101, 91–98. [Google Scholar] [CrossRef]
  7. Namakka, A.; Abubakar, I.U.; Sadik, I.A.; Sharifai, A.I.; Hassan, A.H. Effect of sowing date and nitrogen level on yield and yield components of two extra early maize varieties (Zea mays L.) in Sudan savanna of Nigeria. ARPN J. Agric. Biol. Sci. 2008, 3, 1–5. [Google Scholar]
  8. Maryam, J.I.; Fereshteh, D.; Rahim, N.; Hoshang, N.; Saman, B. Effect of planting date and nitrogen fertilizer application on grain yield and yield components in maize (SC 704). Am. Eurasian J. Agric. Environ. Sci. 2013, 13, 914–919. [Google Scholar]
  9. Fischer, K.S.; Edemeades, G.O.; Johnson, E.C. Selection for the improvement of maize yield under moisture deficit. Field Crop. Res. 1989, 22, 227–243. [Google Scholar] [CrossRef]
  10. Bello, O.B.; Azeez, M.A.; Mahmud, J.; Afolabi, M.S.; Ige, S.A.; Abdulmaliq, S.Y. Evaluation of grain yield and agronomic characteristics in drought-tolerant maize varieties belonging to two maturing groups. J. Agric. Sci. 2012, 2, 70–74. [Google Scholar]
  11. FAO. Optimizing variety x sowing date. In On-Farm Trials for Adapting and Adopting Good Agricultural Practices; Food and Agriculture Organization of the United Nations: Rome, Italy, 2003. [Google Scholar]
  12. Liwenga, E.T. Food Insecurity and Coping Strategies in Semi-Arid Areas: The Case of Mvumi in Central Tanzania. Ph.D. Thesis, Stockholm University, Stockholm, Sweden, 2003. [Google Scholar]
  13. Ngigi, S.N. Climate Change Adaptation Strategies: Water Resources Management Options for Smallholder Farming Systems in Sub-Saharan Africa; The MDG Centre for East and Southern Africa, the Earth Institute at Columbia University: New York, NY, USA, 2009; p. 189. [Google Scholar]
  14. Urama, K.; Ozor, N. Agricultural innovations for climate change adaptation and food security in western and central Africa. Agro-Sci. 2011, 10. [Google Scholar] [CrossRef]
  15. Akinnagbe, O.M.; Irohibe, I.J. Agricultural adaptation strategies to climate change impacts in Africa: A review. Bang. J. Agric. Res. 2014, 39, 407–418. [Google Scholar] [CrossRef]
  16. Tsuji, G.Y.; Hoogenboom, G.; Thornton, P.K. Understanding options for agricultural production. In Systems Approaches for Sustainable Agricultural Development; Kluwer Academic: Dordrecht, The Netherlands, 1998; Volume 7. [Google Scholar]
  17. Jones, J.W.; Hoogenboom, G.; Porter, C.H.; Boote, K.J.; Batchelor, W.D.; Hunt, L.A.; Wilkens, P.W.; Singh, U.; Gijsman, A.J.; Ritchie, J.T. DSSAT cropping system model. Eur. J. Agron. 2003, 18, 235–265. [Google Scholar] [CrossRef]
  18. Hoogenboom, G.; Jones, J.W.; Wilkens, P.W.; Porter, C.H.; Boote, K.J.; Hunt, L.A. Decision Support System for Agrotechnology Transfer (DSSAT). Version 4.6; DSSAT Foundation, Prosser: Washington, DC, USA, 2015. [Google Scholar]
  19. Mathews, R.; Stephens, W.; Hess, T.; Middleton, T.; Graves, A. Application of crop/soil simulation model in tropical agricultural systems. Advan. Agron. 2002, 76, 31–124. [Google Scholar]
  20. Gungula, D.T.; Kling, J.G.; Togun, A.O. CERES-Maize predictions of maize phenology under nitrogen-stressed conditions in Nigeria. Agron. J. 2003, 95, 892–899. [Google Scholar] [CrossRef]
  21. Dzotsi, K.A.; Agboh-Noameshie, A.; StruifBontkes, T.E.; Singh, U.; Dejean, P. Using DSSAT to derive optimum combinations of cultivar and sowing date of maize in southern Togo. In Decision Support System Tools for Smallholders Agriculture in Sub-Saharan Africa; A Practical Guide; Bontkes, T., Wopereis, M., Eds.; IFDC & CTA: Muscle Shoals, AL, USA, 2003; pp. 100–113. [Google Scholar]
  22. Amaral, T.A.; Andrade, C.; Alves, M.E.B.; Silva, D.F. Applying CSM-CERES-Maize to define a sowing window for irrigated maize crop—The riacho’s farm case study. Interdisp. J. Appl. Sci. 2011, 6, 38–53. [Google Scholar]
  23. Wafula, B.M. Application of crop simulation in agricultural extension and research in Kenya. Agric. Syst. 1995, 49, 399–412. [Google Scholar] [CrossRef]
  24. Jibrin, M.J.; Kamara, A.Y.; Ekeleme, F. Simulating planting date and cultivar effects on dryland maize production using CERES-maize model. Afric. J. Agric. Res. 2012, 7, 5530–5536. [Google Scholar]
  25. MacCarthy, D.S.; Adiku, S.G.K.; Freduah, B.S.; Gbefo, F.; Kamara, A.Y. Using CERES-maize and ENSO as decision support tools to evaluate climate-sensitive farm management practices for maize production in the northern regions of Ghana. Front. Plant Sci. 2017, 8, 1–13. [Google Scholar] [CrossRef] [Green Version]
  26. Kamara, A.Y.; Ewansiha, S.U.; Menkir, A.; Tofa, A.I. Agronomic response of drought-tolerant and Striga-resistant maize varieties to nitrogen fertilization in the Nigerian Guinea savannahs. Maydica 2012, 57, 114–120. [Google Scholar]
  27. NIMET. Nigerian Meteorological Agency; NIMET: Abuja, Nigeria, 2016. [Google Scholar]
  28. FAO. World Reference Base for Soil Resources. A Framework for International Classification, Correlation and Communication; World Soil Resources Reports; Food and Agriculture Organization (FAO): Rome, Italy, 2006; pp. 1–128. [Google Scholar]
  29. Heanes, D.L. Determination of total organic-C in soils by an improved chromic acid digestion and spectrophotometric procedure. Commun. Soil Sci. Plant Anal. 1984, 15, 1191–1213. [Google Scholar] [CrossRef]
  30. Bremmer, J.M. Nitrogen-total. In Method of Soil Analysis Part 3—Chemical Methods; Sparks, D.L., Ed.; SSSA Book Series 5; Soil Science Society of America: Madison, WI, USA, 1996; pp. 1085–1122. [Google Scholar]
  31. Gee, G.W.; Or, D. Particle-size analysis. In Methods of Soil Analysis Part 4. Physical Methods; SSSA Book Series; Soil Science Society of America: Madison, WI, USA, 2002; pp. 255–293. [Google Scholar]
  32. Bray, R.H.; Kurtz, L.T. Determination of total organic and available forms of phosphorus in soils. Soil Sci. 1945, 59, 39–45. [Google Scholar] [CrossRef]
  33. Hunt, L.A.; Pararajasingham, S.; Jones, J.W.; Hoogenboom, G.; Imamura, D.T.; Ogoshi, R.M. GENCALC-software to facilitate the use of crop models for analysing field experiments. Agron. J. 1993, 85, 1090–1094. [Google Scholar] [CrossRef]
  34. Jones, C.A.; Kiniry, J.R. CERES-Maize: A Simulation Model of Maize Growth and Development; Texas A & M University Press: College Station, TX, USA, 1986. [Google Scholar]
  35. Ritchie, J.T.; Singh, U.; Godwin, D.C.; Bowen, W.T. Cereal growth, development, and yield. In Understanding Options for Agricultural Production; Tsuji, G.Y., Hoogenboom, G., Thornton, P.K., Eds.; Kluwer Academic Publishers: Dordrecht, The Netherlands, 1998; pp. 79–98. [Google Scholar]
  36. He, J.; Jones, J.W.; Graham, W.D.; Dukes, M.D. Influence of likelihood function choice for estimating crop model parameters using the generalized likelihood uncertainty estimation method. Agric. Syst. 2010, 103, 256–264. [Google Scholar] [CrossRef]
  37. Singh, P.; Boote, K.; Kumar, U.; Srinivas, K.; Nigam, S.; Jones, J. Evaluation of genetic traits for improving productivity and adaptation of groundnut to climate change in India. J. Agron. Crop Sci. 2012, 198, 399–413. [Google Scholar] [CrossRef] [Green Version]
  38. Willmott, C.J. Some comments on the evaluation of model performance. Bull. Am. Meteorol. Soc. 1982, 63, 1309–1313. [Google Scholar] [CrossRef] [Green Version]
  39. Yang, J.Y.; Huffman, E.C. EasyGrapher. Software for graphical and statistical validation of DSSAT outputs. Comput. Electron. Agric. 2004, 45, 125–132. [Google Scholar] [CrossRef]
  40. Tovihoudji, P.G.; Akponikpè, P.B.I.; Agbossou, E.K.; Bielders, C.L. Using the DSSAT model to support decision making regarding fertilizer microdosing for maize production in the Sub-humid region of Benin. Front. Environ. Sci. 2019, 7, 1–13. [Google Scholar] [CrossRef]
  41. Adnan, A.A.; Diels, J.; Jibrin, J.M.; Kamara, A.Y.; Craufurd, P.; Shuaibu, A.S.; Mohammed, I.B.; Tonnang, Z.E.H. Options for calibrating CERES-maize genotype specific parameters under data-scarce environments. PLoS ONE 2019, 14, 1–20. [Google Scholar] [CrossRef] [Green Version]
  42. Robertson, M.J.; Carberry, P.S.; Huth, N.I.; Turpin, J.E.; Probert, M.E.; Poulton, P.L.; Bell, M.; Wright, G.; Yeates, S.J.; Brinsmead, R.B. Simulation of growth and development of diverse legume species in APSIM. Aust. J. Agric. Res. 2002, 53, 429–446. [Google Scholar] [CrossRef]
  43. Sallah, P.Y.K.; Twumasi-Afriyie, S.; Kasei, C.N. Optimum planting dates for four maturity groups of maize varieties grown in the Guinea savanna zone. Ghana J. Agric. Sci. 1997, 30, 63–70. [Google Scholar] [CrossRef]
  44. NAERLS. Wet season in Nigeria. Services. In Agricultural Performance Survey of 2012; National Agricultural Extension and Research Liaison Federal Ministry of Agriculture and Rural Development Ahmadu Bello University: Zaria, Nigeria, 2013. [Google Scholar]
  45. Alberta, G. Soil Moisture and Temperature Consideration. Factors that Contribute to Crop Growth. Available online: https://www.alberta.ca/soil-moisture-and-temperature-consideration.aspx#toc-5 (accessed on 11 July 2019).
  46. TNAU. Agrometeorology. Relative Humidity and Plant Growth; Tamil Nadu Agricultural University: Coimbatore, India, 2016; p. 641003. [Google Scholar]
  47. Carter, E.K.; Melkonian, J.; Susan, J.R.; Stephen, B.S. Separating heat stress from moisture stress: Analyzing yield response to high temperature in irrigated maize. Environ. Res. Lett. 2016, 11, 1–11. [Google Scholar] [CrossRef]
  48. Oke, O.F. Effects of agro-climatic variables on yield of Zea mays L. in a humid tropical rainforest agroecosystem. J. Environ. Earth Sci. 2016, 6, 148–151. [Google Scholar]
  49. Lin, Y.; Feng, Z.; Wu, W.; Yang, Y.; Zhou, Y.; Xu, C. Potential impacts of climate change and adaptation on maize in northeast China. Agron. J. 2017, 109, 1476–1490. [Google Scholar] [CrossRef] [Green Version]
Figure 1. Monthly rainfall, temperature and solar radiation at Iburu for 2015 (a) and 2016 (b) experimental year.
Agronomy 10 00871 g001
Figure 2. Monthly rainfall, temperature and solar radiation at Zaria for 2015 (a) and 2016 (b) experimental year.
Agronomy 10 00871 g002
Figure 3. Thirty years monthly rainfall in SGS, NGS and SS, from 1985 to 2014. Source of data: NIMET [27].
Agronomy 10 00871 g003
Figure 4. Comparison of simulated and measured anthesis (a), physiological maturity (b), grain yield at maturity (c) and shoot dry matter at maturity (d) for SAMMAZ-15 using Iburu and Zaria experimental data sets. (Iburu = ▲2015, ○2016 and Zaria = ● 2015, Δ 2016, the plants were grown under four N treatments within each location and date).
Agronomy 10 00871 g004
Figure 5. Comparison of simulated and measured anthesis (a), physiological maturity (b), grain yield at maturity (c) and shoot dry matter at maturity (d) for SAMMAZ-16 using Iburu and Zaria experimental data sets. (Iburu = ▲2015, ○2016 and Zaria = ● 2015, Δ 2016, the plants were grown under four N treatments within each location and date).
Agronomy 10 00871 g005aAgronomy 10 00871 g005b
Figure 6. Cumulative function plots for simulated grain yields of SAMMAZ-15 (A) and SAMMAZ-16 (B) in SS; SAMMAZ 15 (C) and SAMMAZ-16 (D) in NGS; SAMMAZ-15 (E) and SAMMAZ-16 (F) in SGS over a 30-year (1985–2014) period.
Agronomy 10 00871 g006
Table 1. Soil properties used for calibration experiments at BUK, Dambatta, and Zaria.
LocationSoil Layer Depth
(cm)
Silt
(g kg−1)
Clay (g kg−1)Lower Limit (cm3/cm3)Drained Upper Limit (cm3/cm3)Saturated Water Content (cm3/cm3)Bulk Density (g cm−3)pH in H2O (1:2.5)Organic Carbon (g kg−1)Total N (g kg−1)Available P (mg kg−1)
BUK281202000.1000.2010.4011.566.64.40.042.0
581601900.1270.2070.3821.586.7 0.021.7
1201801600.1120.1940.3851.575.92.10.022.8
1561801700.1120.1910.3761.607.00.40.011.3
2101801500.1020.1800.3761.606.10.40.012.4
Dambatta14160600.0590.1290.4011.536.11.10.211.2
23140800.0680.1350.3861.576.10.80.181.1
26110900.0780.1430.3851.576.12.50.150.3
631301200.0920.1620.3821.585.92.10.180.2
Zaria204202000.1390.2770.4521.384.74.60.82.5
453004900.2810.4100.4671.345.64.10.71.7
842405000.2810.3940.4501.395.71.70.20.1
1202604600.2600.3750.4431.415.23.20.20.2
1902404800.2670.3770.4411.425.02.70.10.4
Table 2. Genetic coefficients of maize varieties used in the study.
CoefficientDescriptionUnitSAMMAZ-15SAMMAZ-16
P1Thermal time from seedling emergence to the end of juvenile phase°C day−1274.3253.3
P2Delay in development for each hour that day-length is above 12.5 hday0.4890.424
P5Thermal time from silking to time of physiological maturity°C day−1840.5794.9
G2Maximum kernel number per plantgrains ear−1816.3743.3
G3Kernel growth rate during linear grain-filling stage under optimum conditionsmg day−16.306.25
PHINTThermal time between successive leaf tip appearances°C day−140.0038.90
Table 3. Simulated and observed mean values for anthesis, physiological maturity, grain yield, and shoot dry matter at maturity with their respective statistical indices for the calibrated maize varieties.
ParameterNE ƪSimulatedObservedME ªRMSEd-Index
SAMMAZ-15
Anthesis (DAS)1059.060.0−0.0201.90.93
Maturity (DAS)10105.0107.0−0.0172.30.95
Grain yield at harvest (kg ha−1)10650363110.0314700.92
Shoot dry matter (kg ha−1)1017299159140.08717280.75
SAMMAZ-16
Anthesis (DAS)1455.456.4−0.0201.90.93
Maturity (DAS)14100.2100.4−0.0022.00.97
Grain yield at harvest (kg ha−1)1452535272−0.0042450.91
Shoot dry matter (kg ha−1)1415606149900.04111520.80
ƪ = number of experiments, ª Mean error = (simulated-observed)/observed, DAS = days after sowing, d-index = Willmott index of agreement [38] ranging from 0 to 1, 1 being perfect agreement.
Table 4. Grain yield (kg ha−1) of 30-year (1985–2014) seasonal analysis (model application) for SAMMAZ-15 and SAMMAZ-16 using different sowing windows at SS, SGS, and SGS in Nigeria.
SAMMAZ-15SAMMAZ-16
Sowing WindowMeanSt. Dev.Max.Min.MeanSt. Dev.Max.Min.
SS
Early June560171171174652500258760573934
Mid-June559147863524768491356159543947
Late June522867760442875459850254263048
Early July467377559472547434465152412453
Mid-July400185955182150365472251642176
Late July30241010509854828009014567772
Early August19521007428159218629574182617
Mid-August1256590296041112176252931383
Late August110229317074579822411536442
NGS
Early June571153667934492497740661024188
Mid-June567863569573896486466162893372
Late June583568369244453500057358163708
Early July587471976864600500859161103904
Mid-July598363373434867516056566024218
Late July576571070364151513860363723818
Early August530397667772197481076857561877
Mid-August45431314682112664172110656941161
Late August31231314606011633031114455321270
SGS
Early June467247858143783388240446103120
Mid-June482253359243866406038250093323
Late June504859763384145424546250253415
Early July505953161394139431453753893340
Mid-July488251158653877425542549643361
Late July465058155613511405648150743105
Early August443484357472428397362749052434
Mid-August382011095883926354590651151052
Late August296413135242543282611274822546
Min. = Minimum, Max. = Maximum, St. Dev. = Standard Deviation.

