Article

A Combined Method of Image Processing and Artificial Neural Network for the Identification of 13 Iranian Rice Cultivars

by
Yousef Abbaspour-Gilandeh
1,*,
Amir Molaee
1,
Sajad Sabzi
1,
Narjes Nabipur
2,*,
Shahaboddin Shamshirband
3,4,* and
Amir Mosavi
5,6,7,8
1
Department of Biosystems Engineering, College of Agriculture and Natural Resources, University of Mohaghegh Ardabili, Ardabil 56199-11367, Iran
2
Institute of Research and Development, Duy Tan University, Da Nang 550000, Vietnam
3
Department for Management of Science and Technology Development, Ton Duc Thang University, Ho Chi Minh City, Vietnam
4
Faculty of Information Technology, Ton Duc Thang University, Ho Chi Minh City, Vietnam
5
Faculty of Health, Queensland University of Technology, 130 Victoria Park Road, Kelvin Grove, QLD 4059, Australia
6
Institute of Structural Mechanics, Bauhaus University Weimar, D-99423 Weimar, Germany
7
Institute of Automation, Kalman Kando Faculty of Electrical Engineering, Obuda University, 1034 Budapest, Hungary
8
School of the Built Environment, Oxford Brookes University, Oxford OX3 0BP, UK
*
Authors to whom correspondence should be addressed.
Agronomy 2020, 10(1), 117; https://doi.org/10.3390/agronomy10010117
Submission received: 15 November 2019 / Revised: 19 December 2019 / Accepted: 23 December 2019 / Published: 14 January 2020

Abstract

:
Due to the importance of identifying crop cultivars, the advancement of accurate assessment of cultivars is considered essential. The existing methods for identifying rice cultivars are mainly time-consuming, costly, and destructive. Therefore, the development of novel methods is highly beneficial. The aim of the present research is to classify common rice cultivars in Iran based on color, morphologic, and texture properties using artificial intelligence (AI) methods. In doing so, digital images of 13 rice cultivars in Iran in three forms of paddy, brown, and white are analyzed through pre-processing and segmentation of using MATLAB. Ninety-two specificities, including 60 color, 14 morphologic, and 18 texture properties, were identified for each rice cultivar. In the next step, the normal distribution of data was evaluated, and the possibility of observing a significant difference between all specificities of cultivars was studied using variance analysis. In addition, the least significant difference (LSD) test was performed to obtain a more accurate comparison between cultivars. To reduce data dimensions and focus on the most effective components, principal component analysis (PCA) was employed. Accordingly, the accuracy of rice cultivar separations was calculated for paddy, brown rice, and white rice using discriminant analysis (DA), which was 89.2%, 87.7%, and 83.1%, respectively. To identify and classify the desired cultivars, a multilayered perceptron neural network was implemented based on the most effective components. The results showed 100% accuracy of the network in identifying and classifying all mentioned rice cultivars. Hence, it is concluded that the integrated method of image processing and pattern recognition methods, such as statistical classification and artificial neural networks, can be used for identifying and classification of rice cultivars.

1. Introduction

Experts in the field of rice can determine and identify the cultivars by their experience and evaluating geometric properties (dimensions, and the convexity of the seeds), color and texture specificities (the darkening or lightening, roughness, and fineness of seeds), and the way of putting seeds together in a mass. These experimental methods are time-consuming and need experts. It should be noted that the mental and physical conditions of the experts affect the results of the analysis, and human errors caused by fatigue are involved in these methods. Therefore, evaluation and design a new method to identify cultivars in a short time and the development of an automatic system through new advanced technology without involving human interference are necessary. The image processing method plays an important role in the automatic system. Various researchers employed these methods to diagnosis rice disease [1,2], measure the number of broken seeds [3], visual inspection of the quality of various seeds, such as rice [4,5,6], evaluation of rice seed germination [7], and the identification of various cultivars of rice [8,9,10,11,12].
Yang et al. [13,14] developed a research on the classification of various samples of rice from different geographic areas using laser-induced breakdown spectroscopy. In this research, the classification was carried out using a support vector machine (SVM) method. Finally, the results showed a higher than 98% classification. The accuracy of this method is acceptable, but since the method is based on spectral data, the cost of setup for extract spectral data to identify various samples of rice is higher than the method based on visible image processing. The cost of developing a portable device for this method is prohibitive. This research was based on spectroscopy. Kuo et al. [5] identified rice seeds by image analysis and sparse-representation-based classification (SRC) and evaluated various rice cultivars. The results indicated that the method had an 89.1% ability to identify various rice cultivars. The accuracy of this method is low, so it is unreliable in the field when identifying various cultivars. Anami et al. [15] evaluated the behavioral co-occurrence HSI (hue, saturation, intensity) color characteristics to identify the cultivar form of a rough mass. The results demonstrated that the accuracy of multilayer neural network classification was more than 92%. Chaugule [16] evaluated the color and shape characteristics to classify four paddy cultivars. The results showed that the highest classification accuracy of 90.9% was obtained using color attributes. In addition, the highest classification accuracy of the specificities was 93.6%. In the segmentation of the cultivars, the highest accuracy of 98%was obtained using a combination of color and shape specificities. In this study, only four paddy cultivars were studied. The number of cultivars is low for proving the performance of the proposed method. Kambo and Yerpude [17] classified common Basmati rice using PCA and employed a digital camera to capture an image of the seeds and transpose it onto a black background. They developed algorithms in MATLAB 2016a (MathWorks, Inc.) to extract morphologic specificities of each seed, including area, long axis length, small axle length, distance from the center, and circumference. Two effective components in cultivars’ segmentation were selected using PCA, and k-nearest neighbors were employed to classify cultivars. The accuracy of Classic, Rozana, and Mini cultivars were respectively obtained to be 80%, 75%, and 80%. Therefore, the categorization of cultivars was performed with a mean accuracy of 79%. The accuracy of this method is low. Therefore, a system based on it would not deliver high performance in the identification of different varieties of rice.
As described above, many studies have been conducted on rice, and various methods have been employed. Because of the high consumption of rice worldwide and its variety, research into methods for the identification and classification of different varieties of indigenous rice cultivars is necessary. Therefore, in the present study, 13 indigenous rice cultivars of Iran, including Tencc (10cc), Alikazemi, Asgari, Binam, Domsiyah, Dorfak, Gohar, Hasani, Hashemi, Kadoos, Khazar, Khazaregarm, Lenjan, were classified using integrated image processing and an artificial neural network (ANN).
The highlights and novelties of the present research are listed below:
-
Using more rice varieties in the form of white rice, brown rice, and paddy compared to other research work.
-
Selecting the effective color, morphological, and textural features of the rice varieties’ images using principal component analysis (PCA).
-
Classification of the rice varieties in the form of white rice, brown rice, and paddy with backpropagation- artificial neural network (ANN) and linear discriminant analysis (DA).

2. Materials and Methods

2.1. Providing Samples

Based on reviewing different references, available information, and asking experts, 13 common rice cultivars, Tencc (10cc), Alikazemi, Asgari, Binam, Domsiyah, Dorfak, Gohar, Hasani, Hashemi, Kadoos, Khazar, Khazaregarm, Lenjan, were identified in Iran. Various samples of rice cultivars were obtained from the Iranian Rice Research Institute. The samples were paddy, and about one to two kilograms were prepared from each cultivar.

2.2. Samples Preparation

To prepare white rice, the following process was performed on paddy: winnowing, drying, cleaning, peeling, bleaching, and brightening. After the rice moisture was dropped to the optimum level, it was cleaned, and then its skin was removed by a peeling machine to obtain brown rice. After harvesting rice moisture varied between 18% and 26% on a wet basis. The initial drying was performed in the field. In doing so, the harvested crop remained in the field for 24 h to 72 h. After reducing the moisture content to a range of 15% to 17% of a wet basis, the crop was transferred to the depot. This amount of moisture is high for converting paddy to white one; therefore, its moisture content was reduced until the standard level. The suitable drying temperature and final paddy moisture were effective in the reduction of the size of the microscopic cracks, decreasing the number of cracked grains, and reducing the fracture percentage resulting from these cracks in the next steps. Based on the view of Iran rice research institute’s experts, 45 °C was used to reduce the moisture. Paddy was placed into a small rectangular-shaped sieve with small openings, after the name of cultivars were attached to the sieves. They were placed in the dryer for about 20 h. The seeds moisture was checked during the drying process several times, until the moisture content samples reached a 10% wet basis. Then, all samples were transferred into plastic bags to prevent interaction with ambient moisture. Due to the limitations in the capacity of the peeling machine, 150 gr-paddy of each cultivar was placed in the laboratory for about 5 min to equalize their temperature with ambient temperature. This was done to minimize the damage caused by thermal stresses. In the next step, the bleaching of brown rice of each cultivar was performed. After finishing the mentioned process in the Rice Research Institute, paddy, brown rice, and white rice of all cultivars were transferred to the Laboratory of Physical and Mechanical Properties at the University of Mohaghegh Ardabili. After removing possible waste materials and separating broken grains, all samples were poured into small plastic containers.

2.3. Imaging of Samples

2.3.1. Hardware System

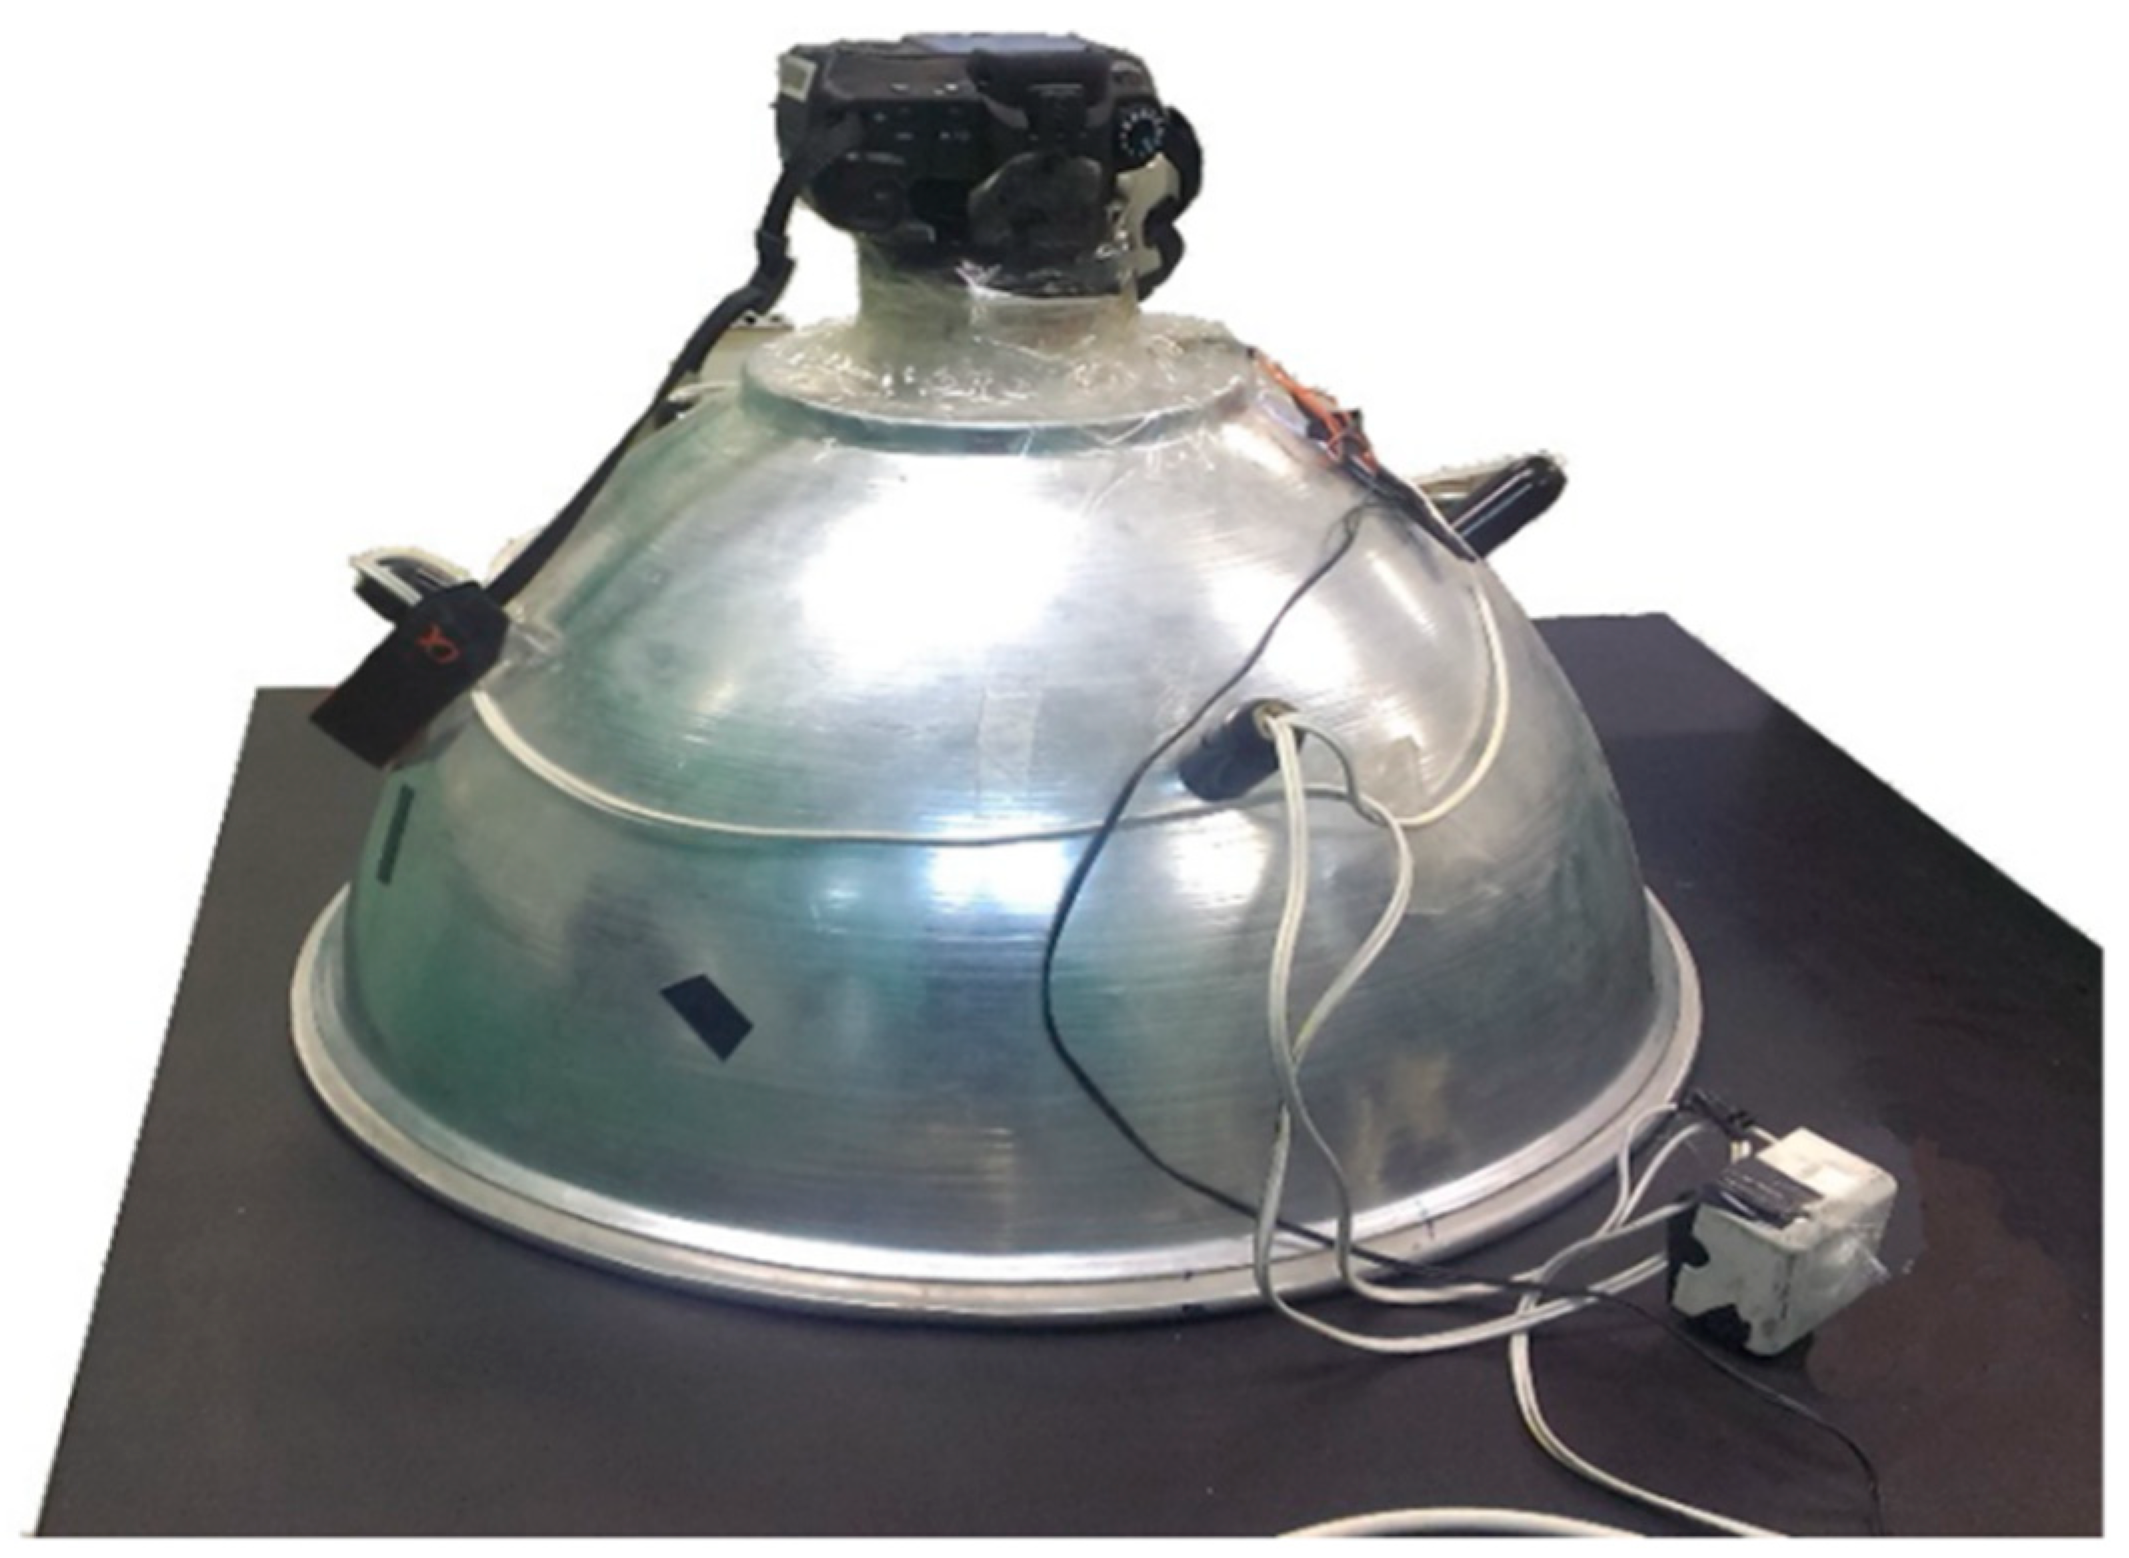
To take the image of paddy, brown rice, and white rice, the imaging system at the Laboratory of Physical and Mechanical Properties at the University of Mohaghegh Ardabili was employed. The system used in this study included a steel hemisphere compartment, a lightening system, and a digital camera. The proper lightening of a scene before photographing is one of the effective factors in visual image quality and, consequently, obtaining accurate data and results. The combination of the placement of light sources as well as the ability of the spherical chamber to properly reflect the light beams will result in uniformity of light throughout the compartment and thus minimize the presence of shadows in the images. Therefore, a 30 cm diameter ring of white LED lamps and four fluorescent lamps placed 90 degrees apart were positioned in the upper half of the compartment. A digital camera (DFK 23GM021, CMOS, 120 f/s, Imaging Source GmbH, Maisach, Germany) was mounted perpendicular to the background with the lens approximately 30 cm from the samples in the upper part of the compartment. The images were directly transferred from the camera to a computer (processor Intel Core i3 CFI, 330M at 2.13 GHz, 4 GB of RAM-4GB, and Windows 10) programmed with MATLAB 2016a software. Figure 1 shows the imaging compartment. Considering good diffraction of samples’ color with black color, A 30 × 20 cm sheet of black paper was mounted on a flat surface to contrast the diffraction of the samples’ color and minimize distortions. To ensure the equality of lightning, all images were taken one hour after the light source was switched on when the light source had reached optimal propagation and was in a steady state. Seeds were distributed randomly, and were completely separated from each other.

2.3.2. The Number of Samples for Imaging

To take images, 20 seeds scattered with a plastic straw in a 4 × 5 dimension on a background. In each repetition, for each cultivar and form, former seeds were removed, and new ones were used. JPG images with dimensions of 3872 × 2592 pixels were used. For the 13 rice cultivars in 3 forms, rough, brown, and white, with 5 images for each form, a total of 180 images were obtained, and 3600 seeds were used (20 seeds per image).

2.3.3. Segmentation

Segmentation is a process of dividing the image into its constituent regions or identifying the object in an image. The segmentation level depends on the problem that should be solved. It means that segmentation will be stopped when considered objects of regions are identified. Segmentation is one of the important tasks in image processing. The accuracy of segmentation determines the success or failure of final computer analysis. Therefore, the accuracy of this process is of central importance [18]. 
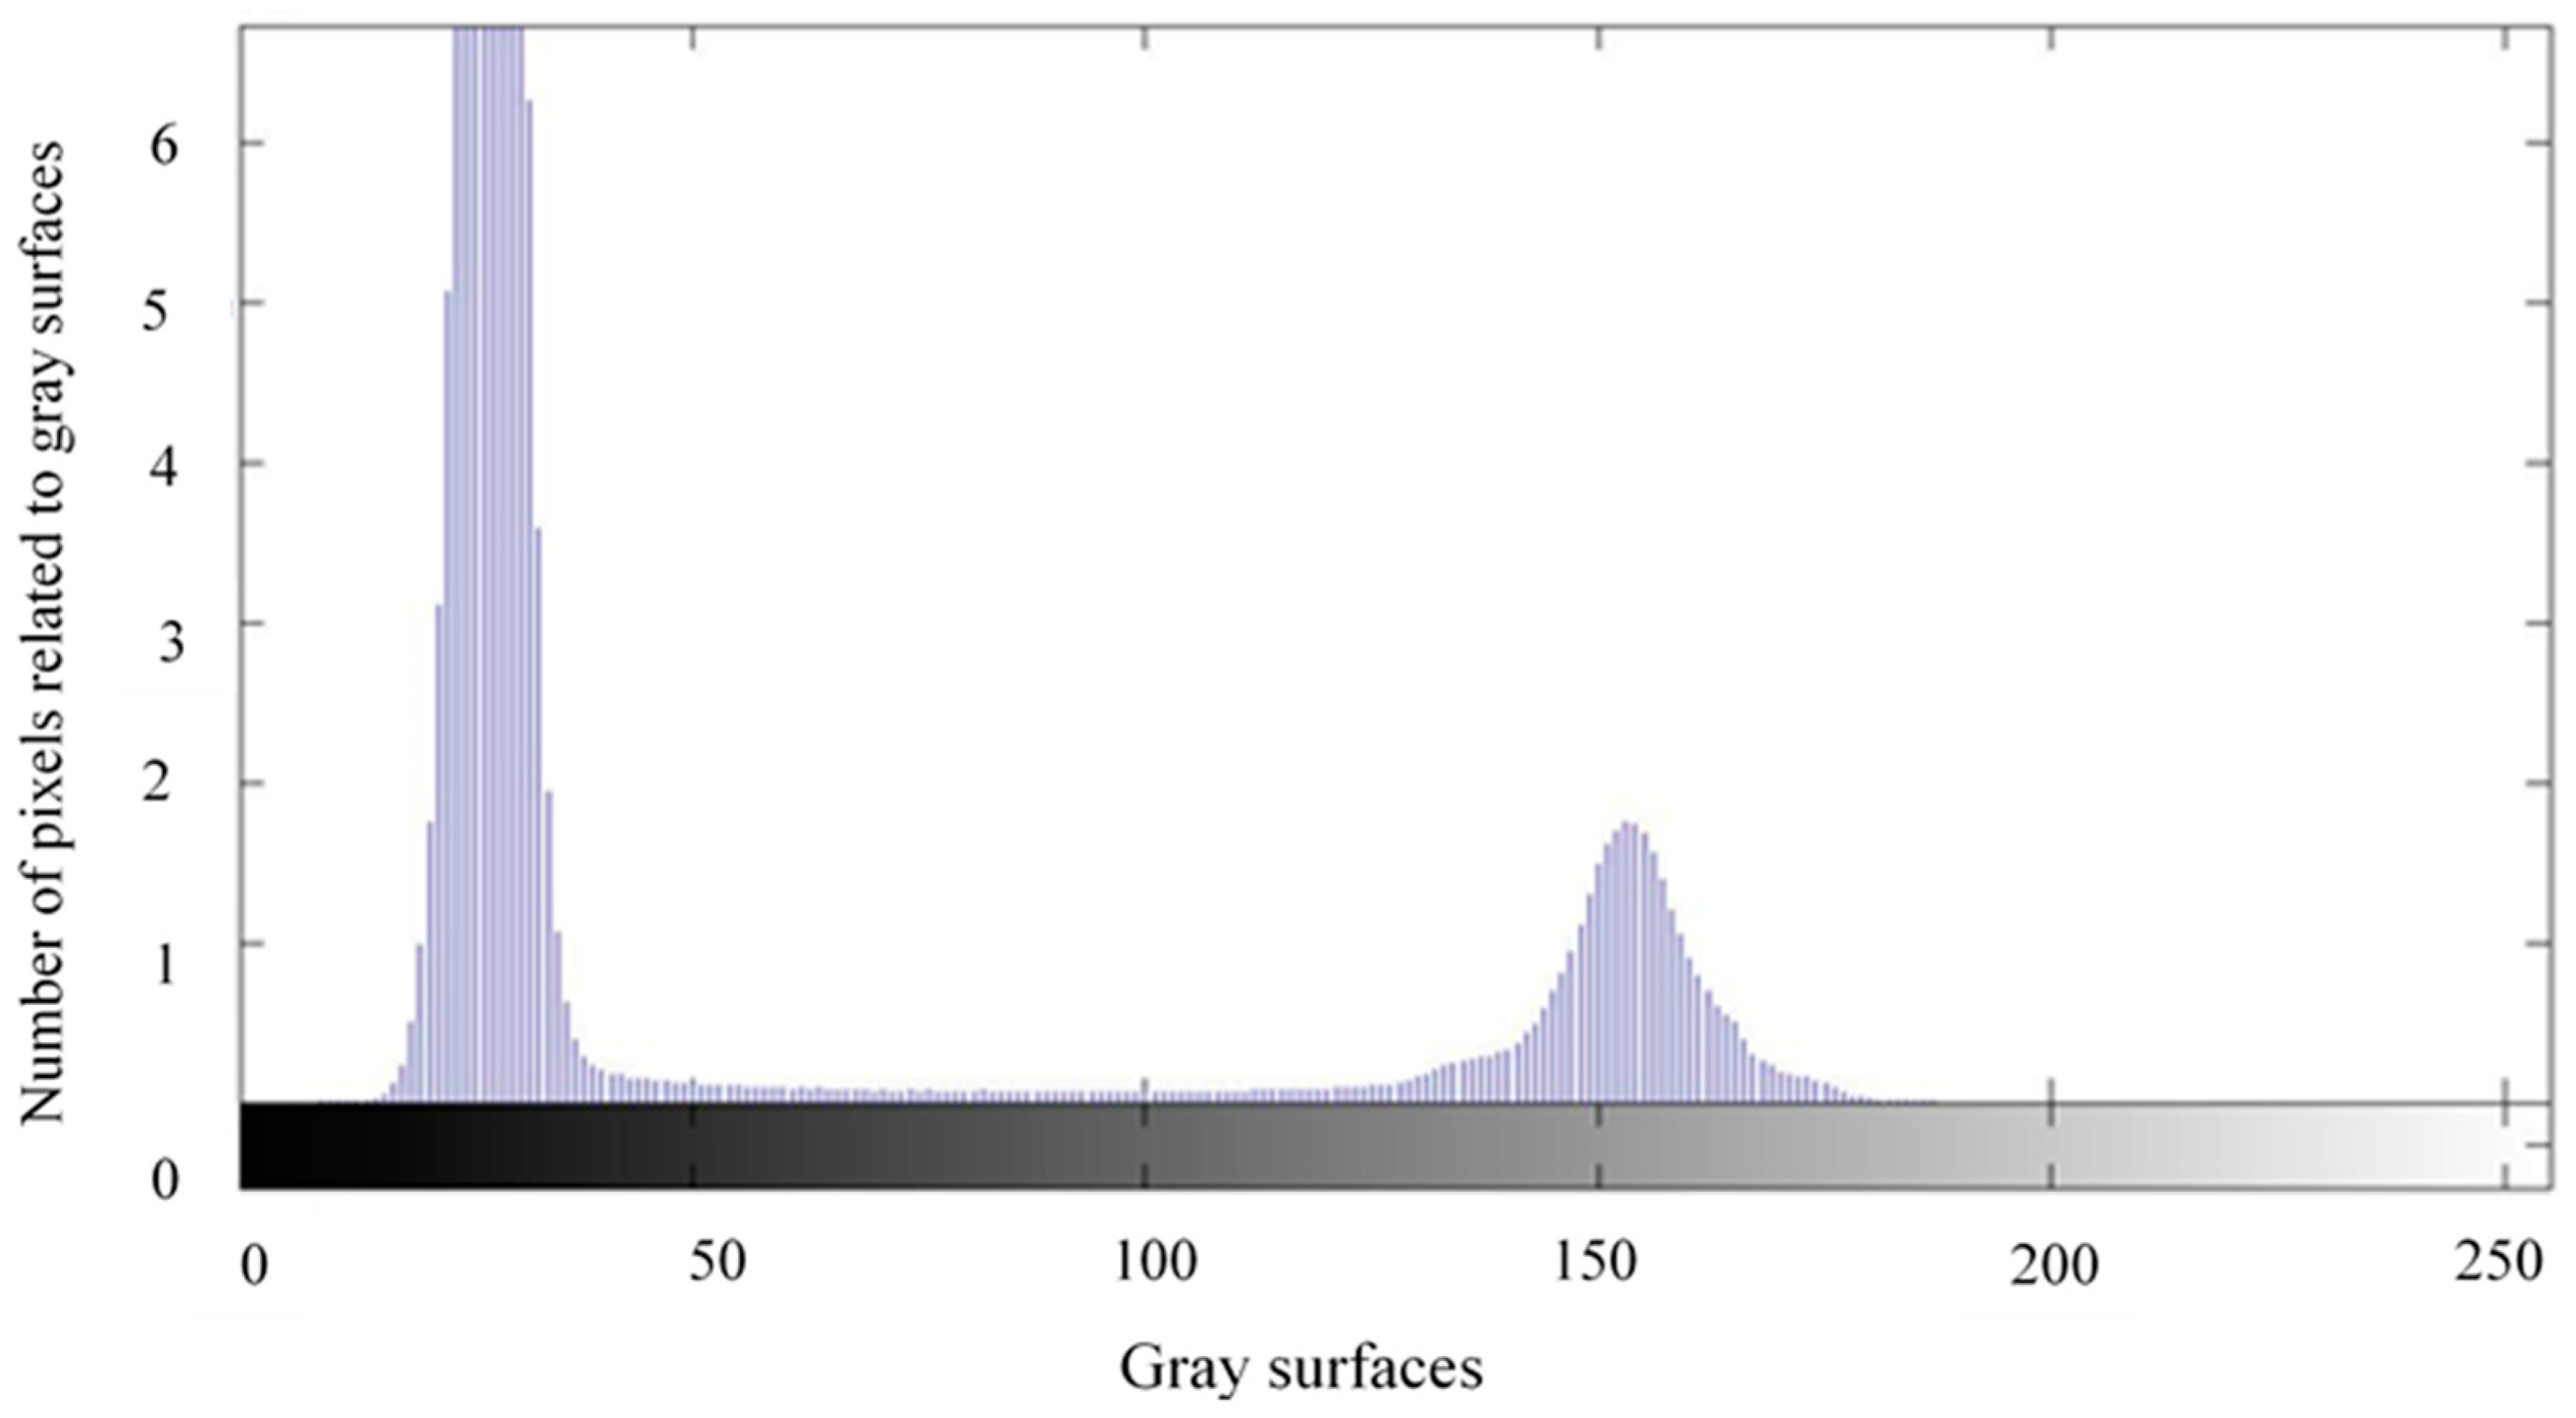
Figure 2 shows the intensity histogram of a taken image so that seeds pixels and background were divided into domain groups. The peaks in the right and left sides are related to rice seeds and background pixels, respectively. As seen, the peaks are far from each other, which ensures high-accuracy segmentation. The various steps of applying a threshold to segment the rice samples from the background are as follows:
  • Otsu’s method: it is an automatic thresholding method that produces a threshold value considering the image histogram. In this step, after thresholding, the image converts to a binary one with only black and white pixels.
  • Elimination of objects with less than 100 pixels: due to the noise related to rice powder on the background, objects with less than 100 pixels were removed. This threshold was selected after the evaluation of images of rough, brown, and white rice.
  • After the elimination of the aforementioned objects and producing a new binary image, some background-colored cavities were observed on the seeds. This issue can occur due to the unsuitable light reflection, especially on the edges. These very small black spots were observed, especially in rough and brown rice. To fill the cavities, the “imfill” order of the MATLAB software was run.

2.3.4. Extraction Characteristics of Samples

Color Features

Several color models are available to extract the color attributes, which are defined and used as international standards. The aim of the color model is to facilitate the determination of color attributes in a standard form. In fact, a color model is a coordinate system specification, in which each color is expressed by just one point. To extract the color characteristics of each rice seed in an image, a code was written in MATLAB software to calculate the mean, mean square, variance, and standard deviation of the color component values of pixels of each seed per image. Five color models of RGB (Red, Green, and Blue), YIQ, YCbCr, HSV, and HIS were used to extract color attributes. Finally, given the existence of three color components in each model, the color attribute of 4 × 5 × 3 = 60 was extracted. Table 1 shows the extractive characteristics of this form. There is a high chance of having effective inputs after using the PCA method when the features are extracted from each image.

Morphological Characteristics

Morphology can be defined as a theory for analyzing spatial structures. The aim of this scientific field is to analyze the shape of objects. Therefore, this scientific branch is a powerful method for analyzing images. Morphological image processing is a set of nonlinear operators that is related to the shape and characteristics of an image [19,20]. Table 2 shows the extracted morphological characteristics of rice samples. To extract each feature, at first, each seed was identified based on a MATLAB code, then these features were extracted from each seed. The code of all these features exists in MATLAB software.

Texture Characteristics

An important method for describing a region is to quantify its texture content. Although there is no formal definition for texture, the intuitive character of this descriptor provides some properties such as smooth, coarse, and orderly [21]. The three main methods used in image processing to describe the texture of a region are statistical methods, structural methods, and spectral methods. The statistical methods characterize the texture properties as smooth, coarse, fine, etc. Structural methods deal with the layout of basic image operations, such as texture descriptions based on parallel lines with regular spacing. Spectral methods are based on the properties of the Fourier spectrum and are used to determine the photocurrent capability by identifying high and narrow peaks in the image spectrum [22]. Table 3 shows the extracted texture properties for each rice seed. Finally, 92 color, morphology, and texture characteristics were extracted from each seed. Table 3 shows the extracted texture features for each seed where L is the number of levels, zi a random variable of intensity values, p(zi) is the histogram of intensity level values in one region, m is the mean intensity value over that region of the image, σ is Standard deviation.

2.4. ANOVA

By extracting values for all parameters and completing the analysis of images, data were transferred to Microsoft Excel software (Microsoft Corporation) and categorized. To measure the probability of significance, the differences between cultivars mean in various parameters were analyzed using ANOVA by MSTATC software (Michigan State Univ., MI, USA).

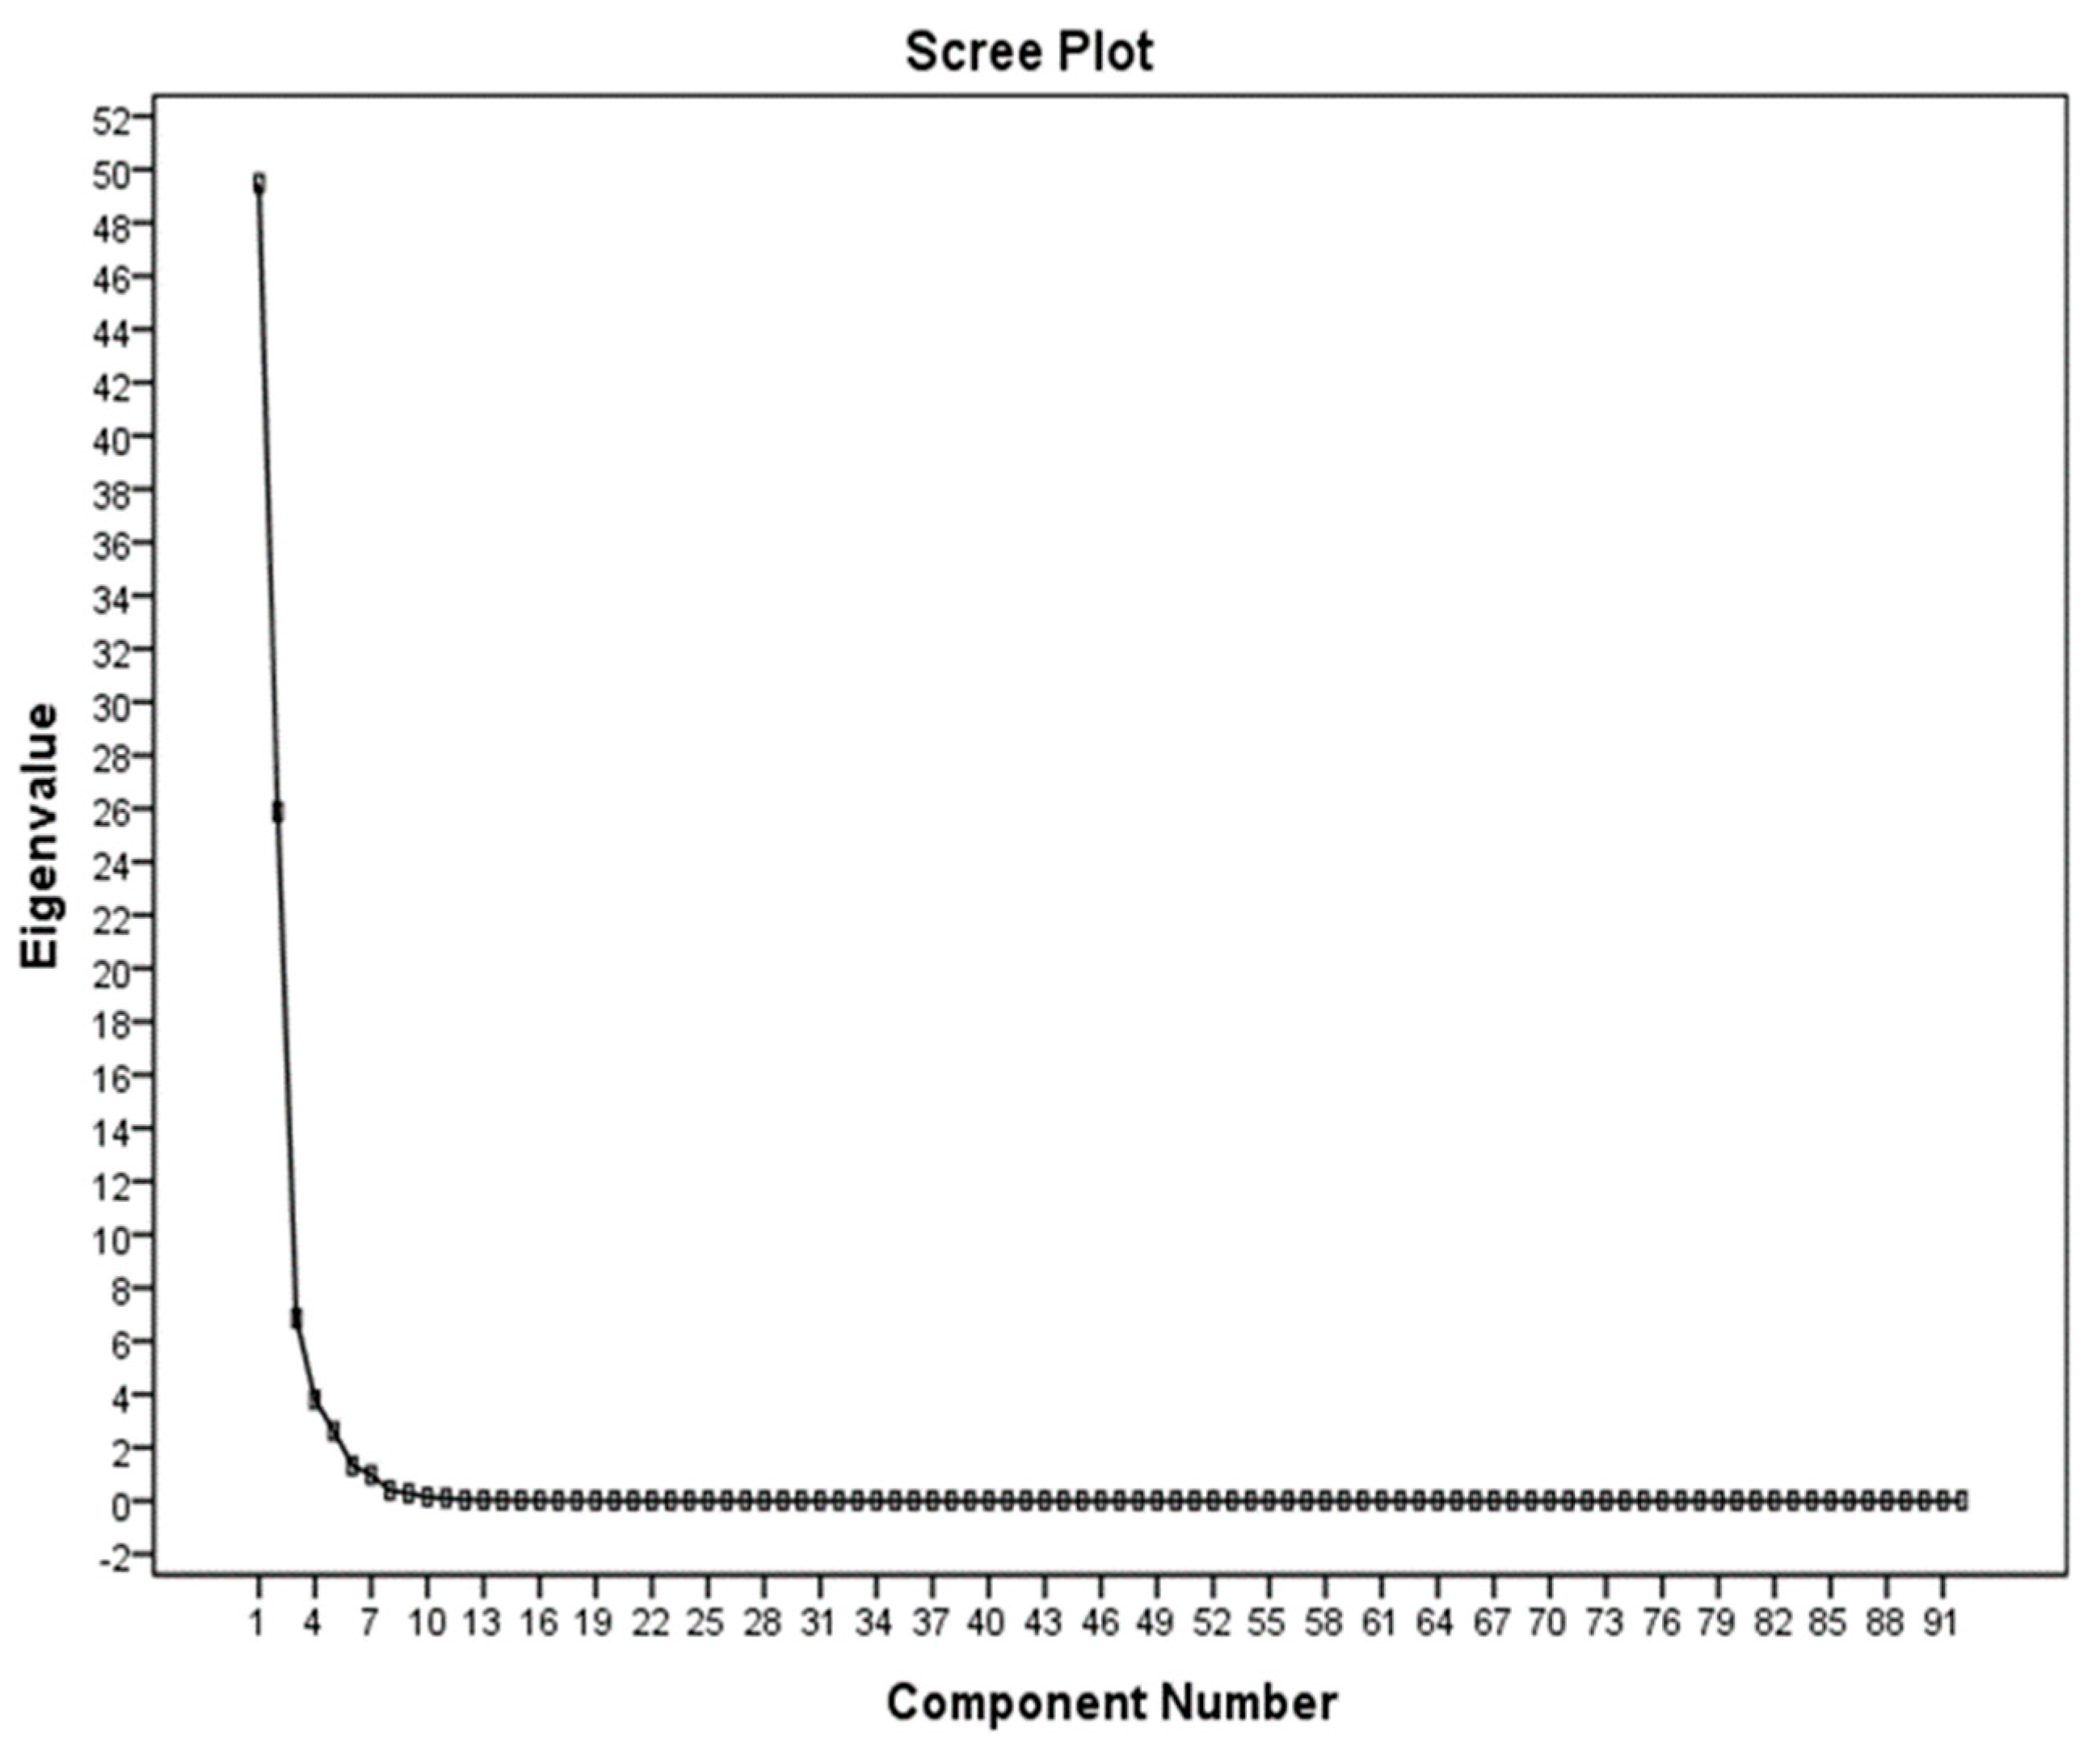
2.5. Analyzing Principal Components

Sometimes a high amount of data is collected for variables related to society or sample. Since there exist numerous binary relationships between variables, the distribution matrix will be very large. Graphic representation of data is also unlikely to help because, for the 12 variables, more than 200 three-dimensional dispersion charts should be studied. Therefore, for a comprehensive interpretation of the data, it is necessary to reduce the number of variables and provide a linear combination of data, so that each linear combination is related to one of the parameters. The PCA method is a conversion in vector space, which is employed to reduce the dimensions of the data set [7]. For a set of data, the PCA of the system’s axles is determined by the principal directions of the variance. If the changes in a set of data are created by some natural properties or by accidental laboratory errors, we expect normal data distribution. But if changes in a dataset are created by other factors, then we can identify the most effective parameters by the PCA from the parameters involved [23]. In this study, SPSS software (IBM, Armonk, NY, USA) was used to perform PCA.

2.6. Classification

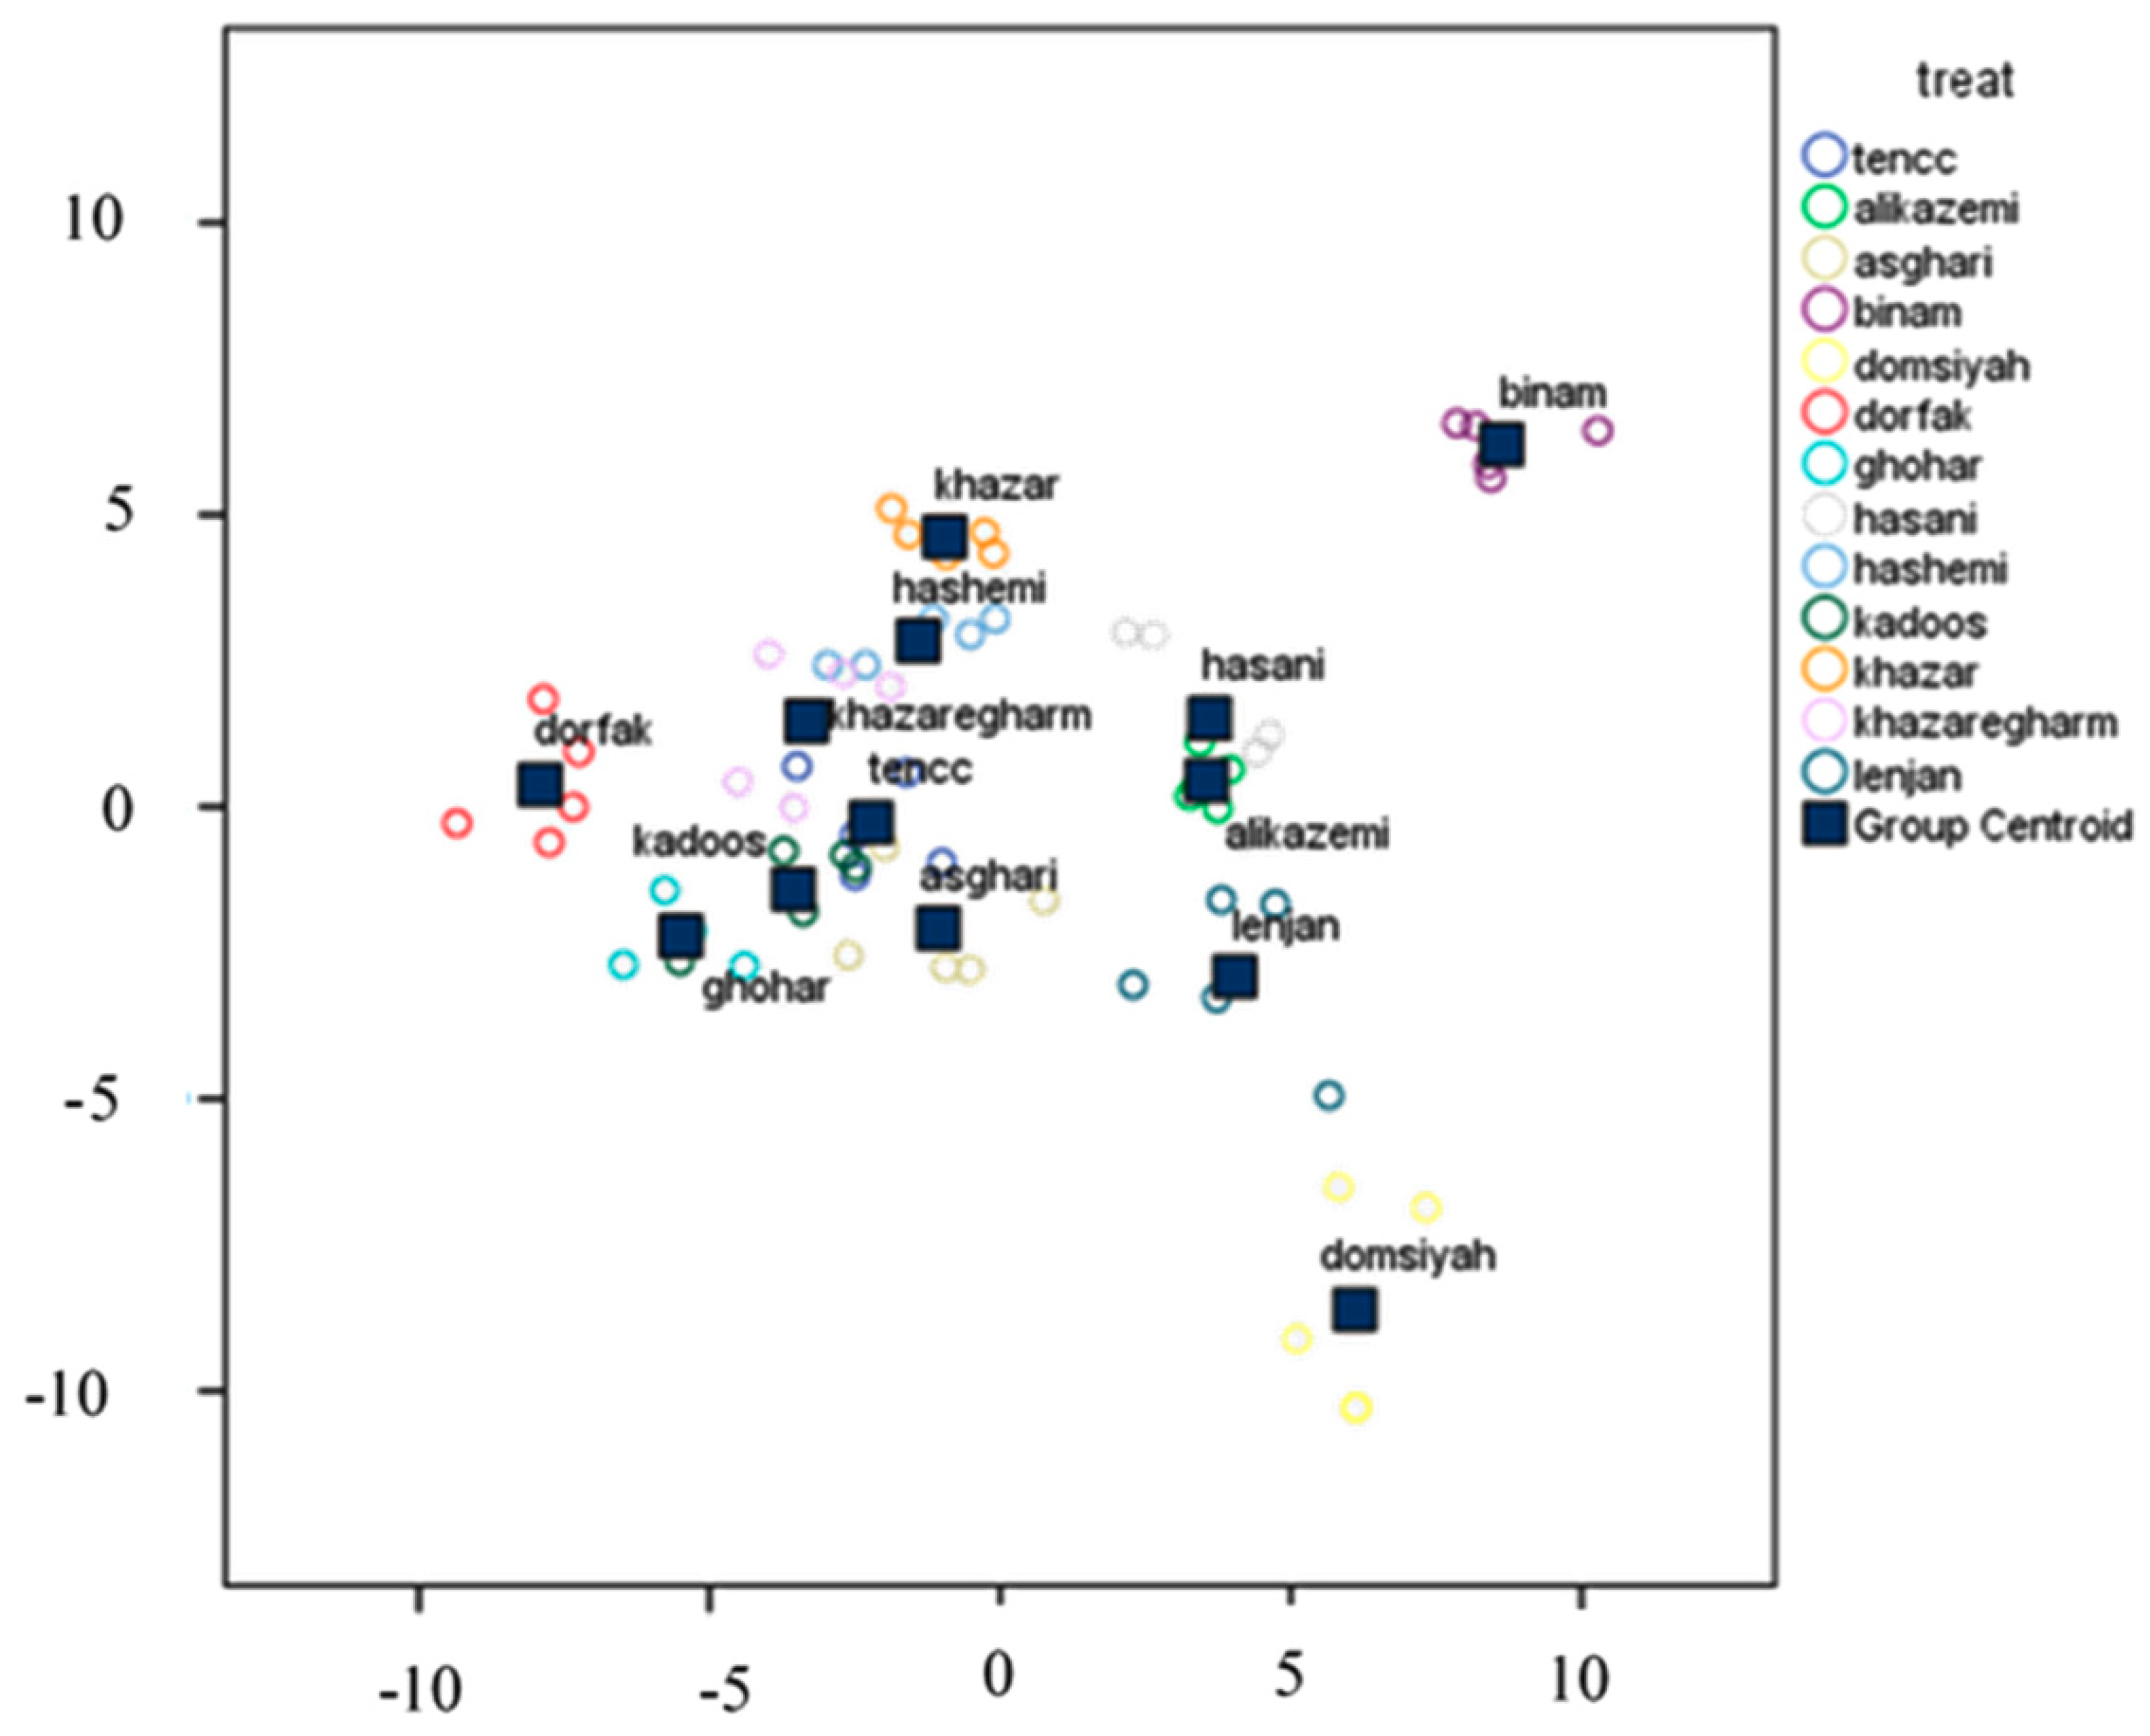
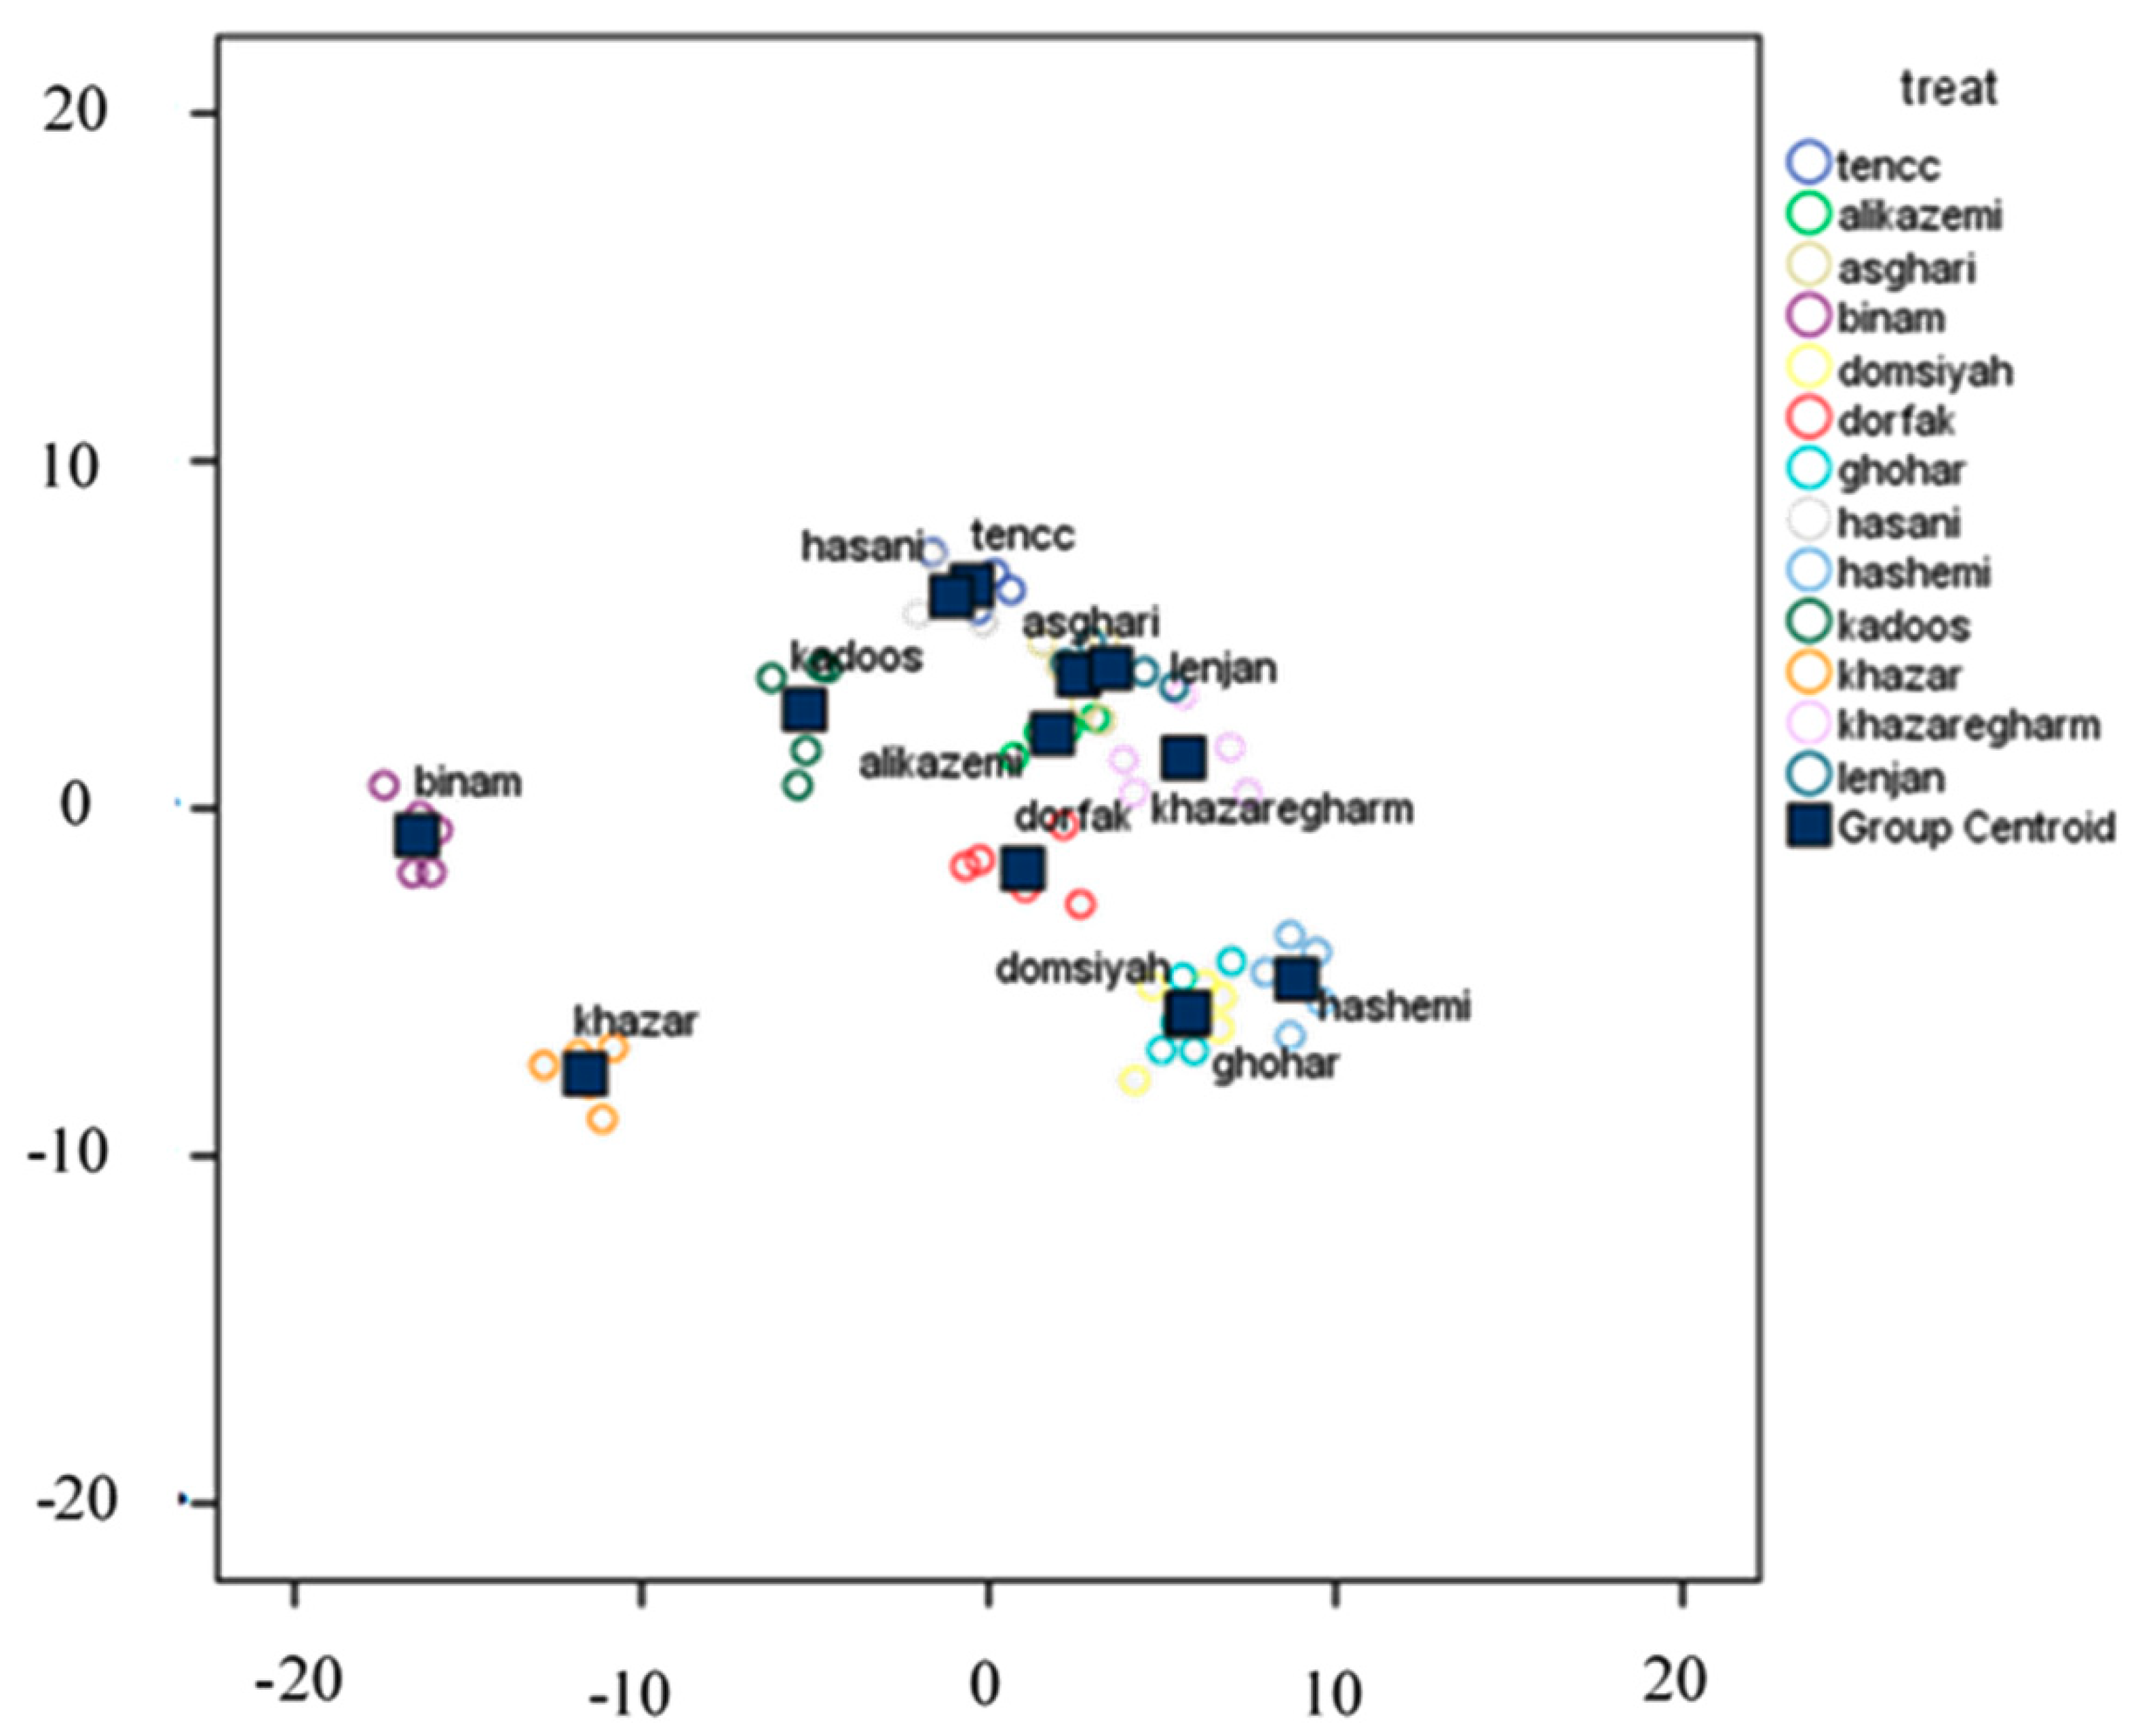
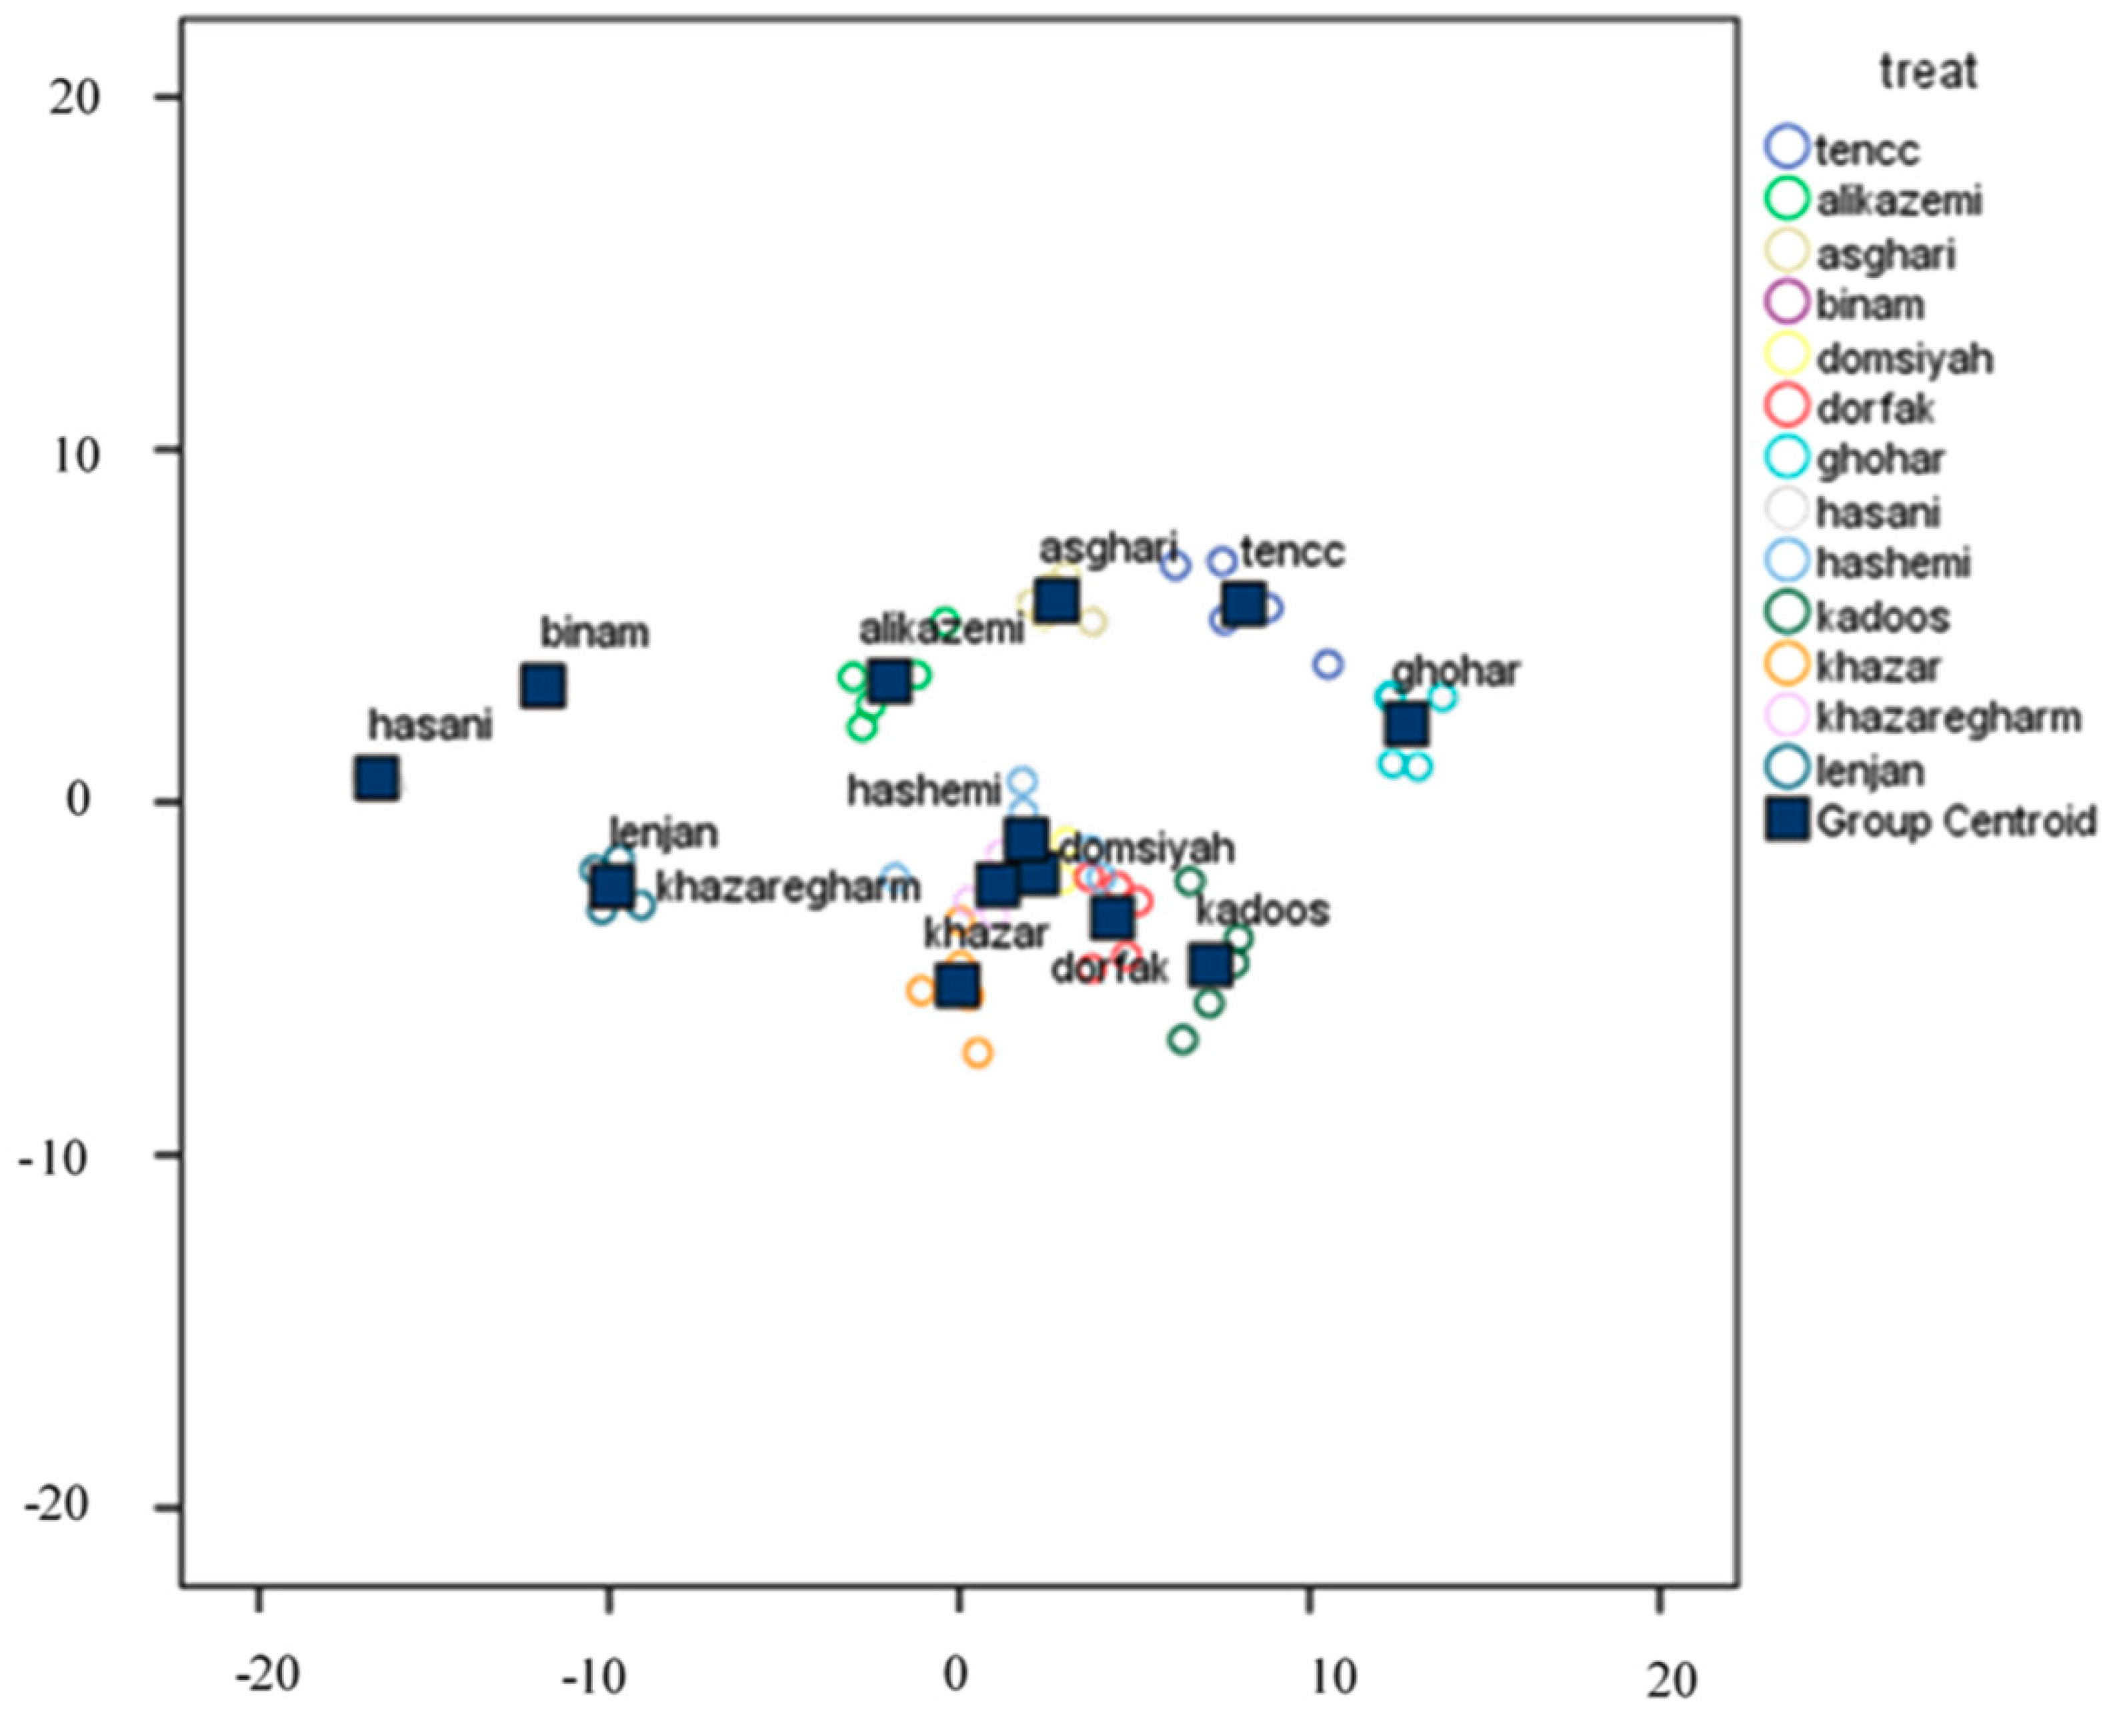
2.6.1. Discriminant Analysis (DA)

Discriminant analysis (DA) is an approach to divide independent variables into separated groups. In fact, this method is used to determine an equation whereby an property of the member society can be input, and the belonging group can be predicted [7,24]. The aim of DA is a classification of data into homogeneous groups (less similarity between observations of various groups). Therefore, we need to have good samples from each group to obtain a powerful discriminant function. SPSS software was used to perform DA.

2.6.2. Back-Propagation Artificial Neural Network

A neural network consists of a large number of simple processor components called neuron, unit, cell, or node. Each neuron is connected to other neurons by joints or edges that each has its own weight. These weights represent the information used by the network to solve the problem. A neuron can send only one signal at any given time, although this signal can be sent to several other neurons [
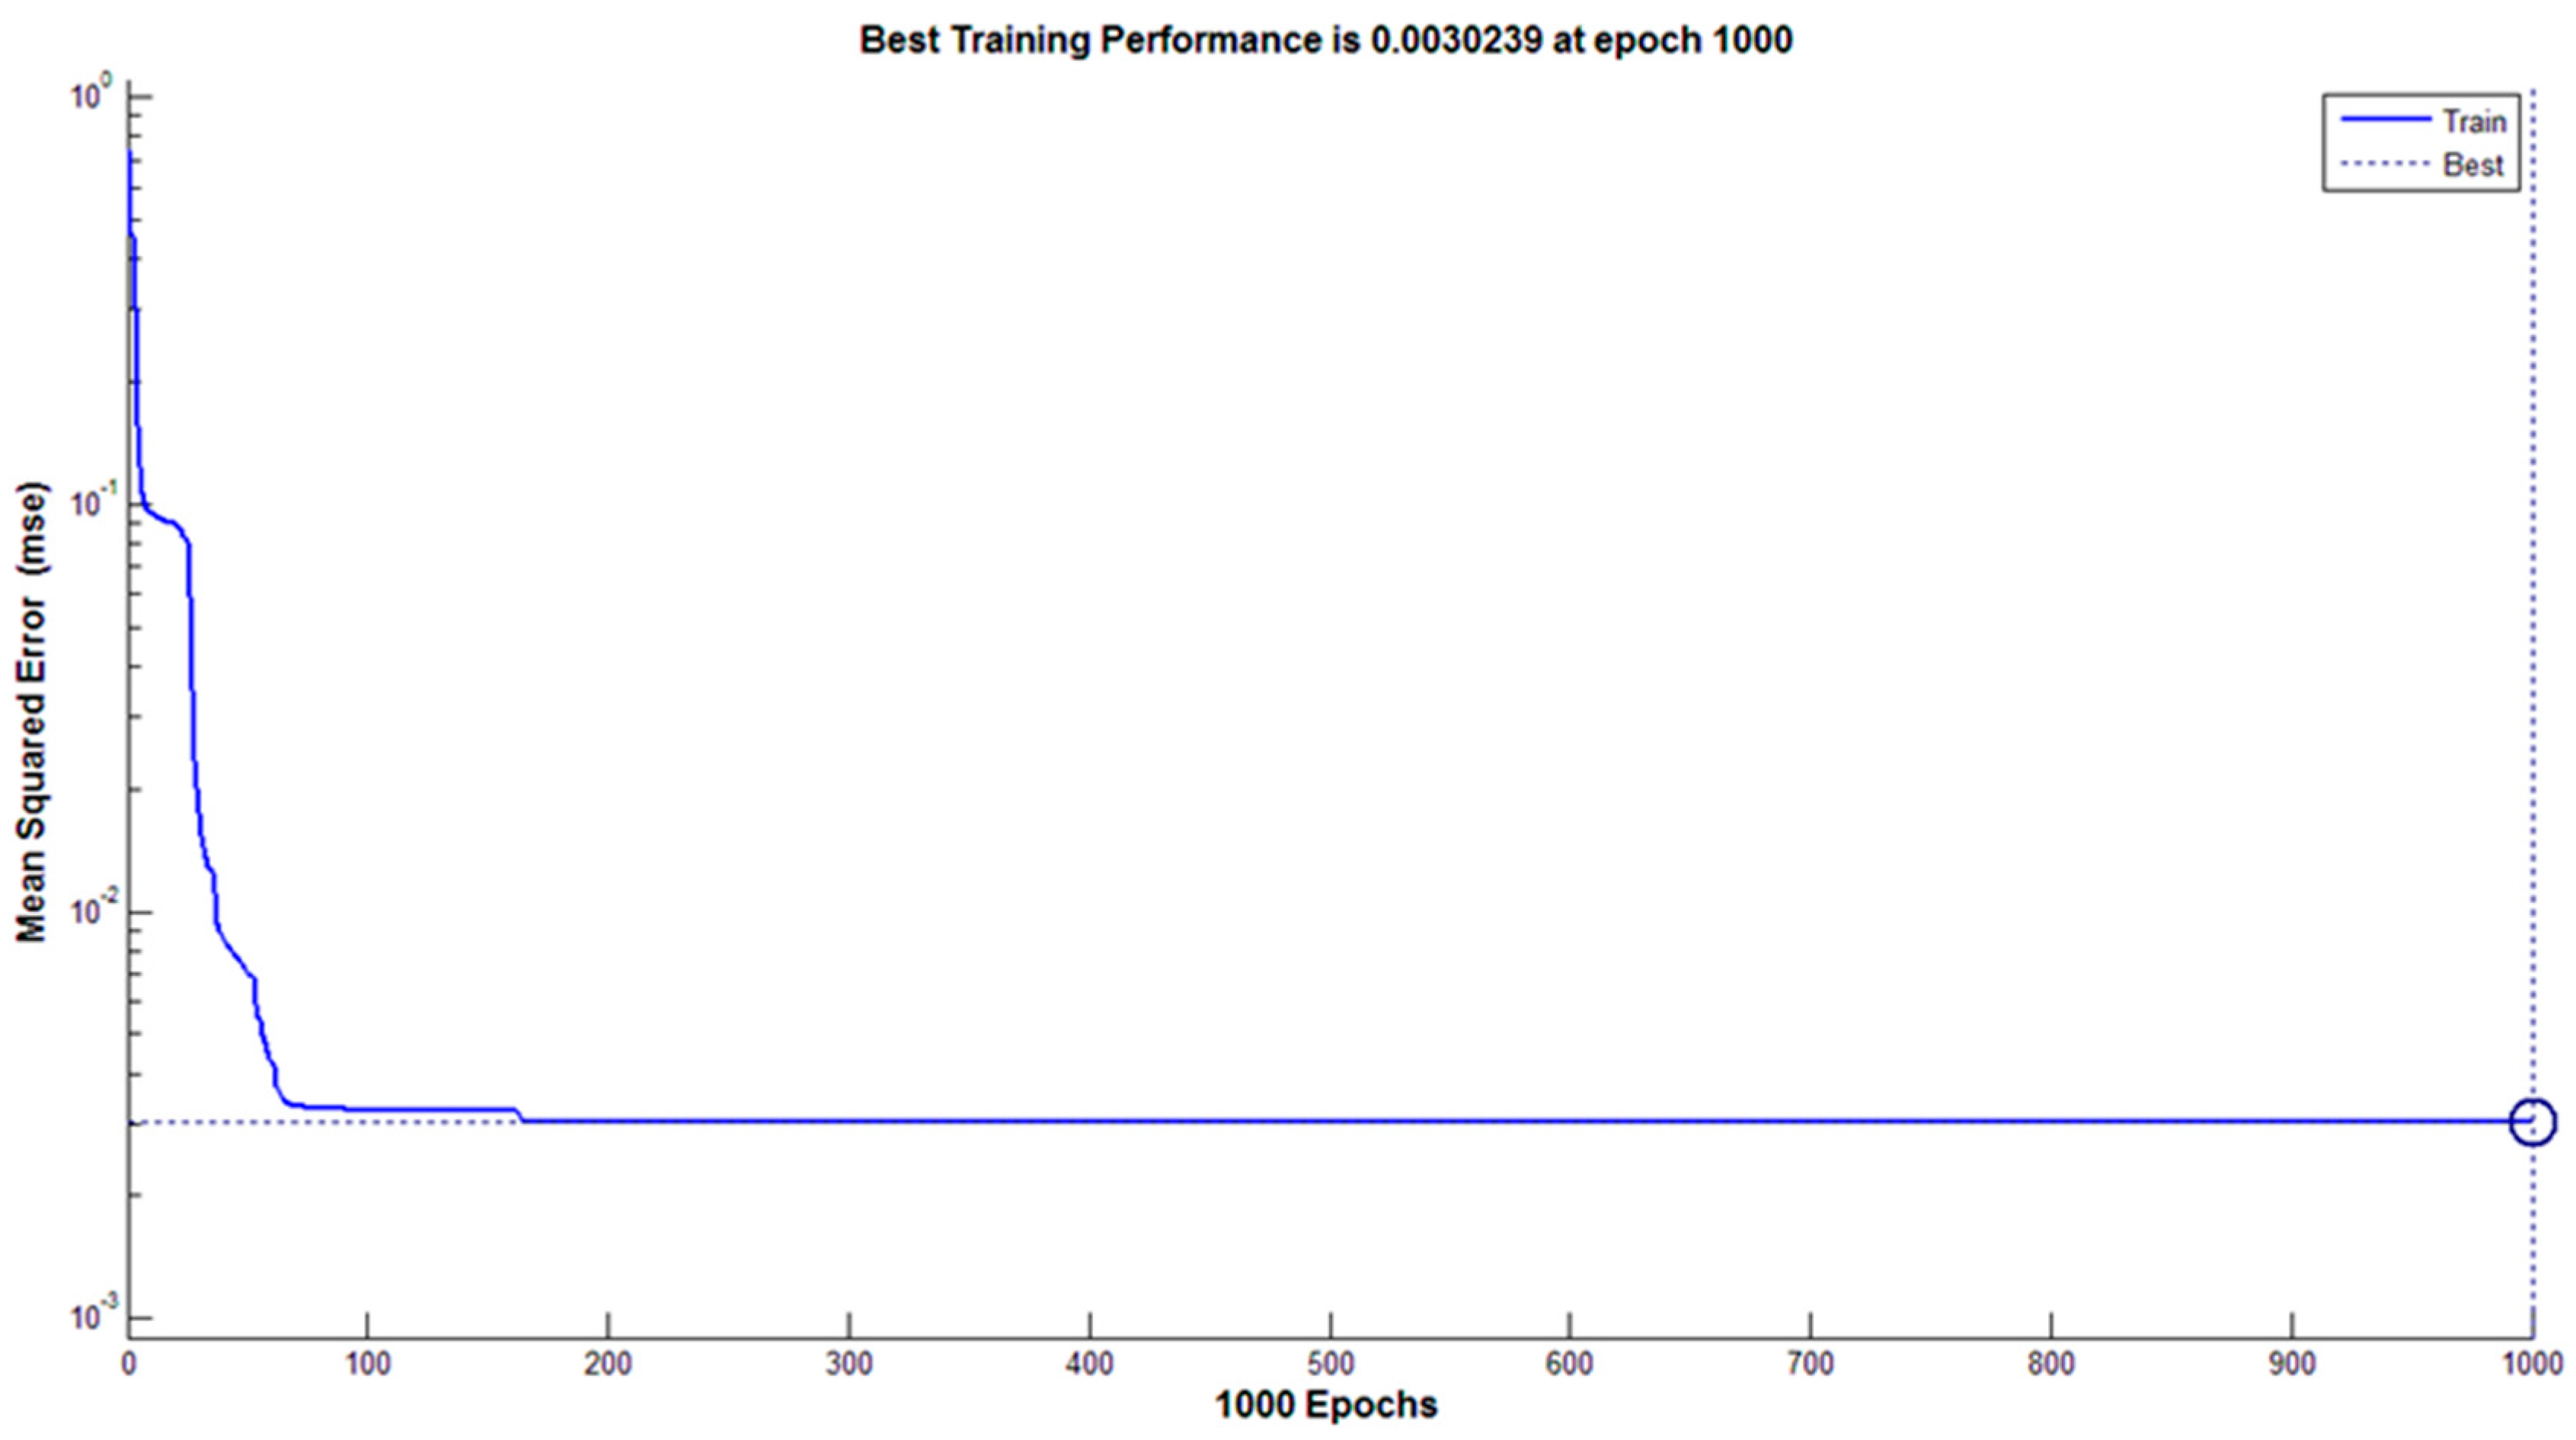
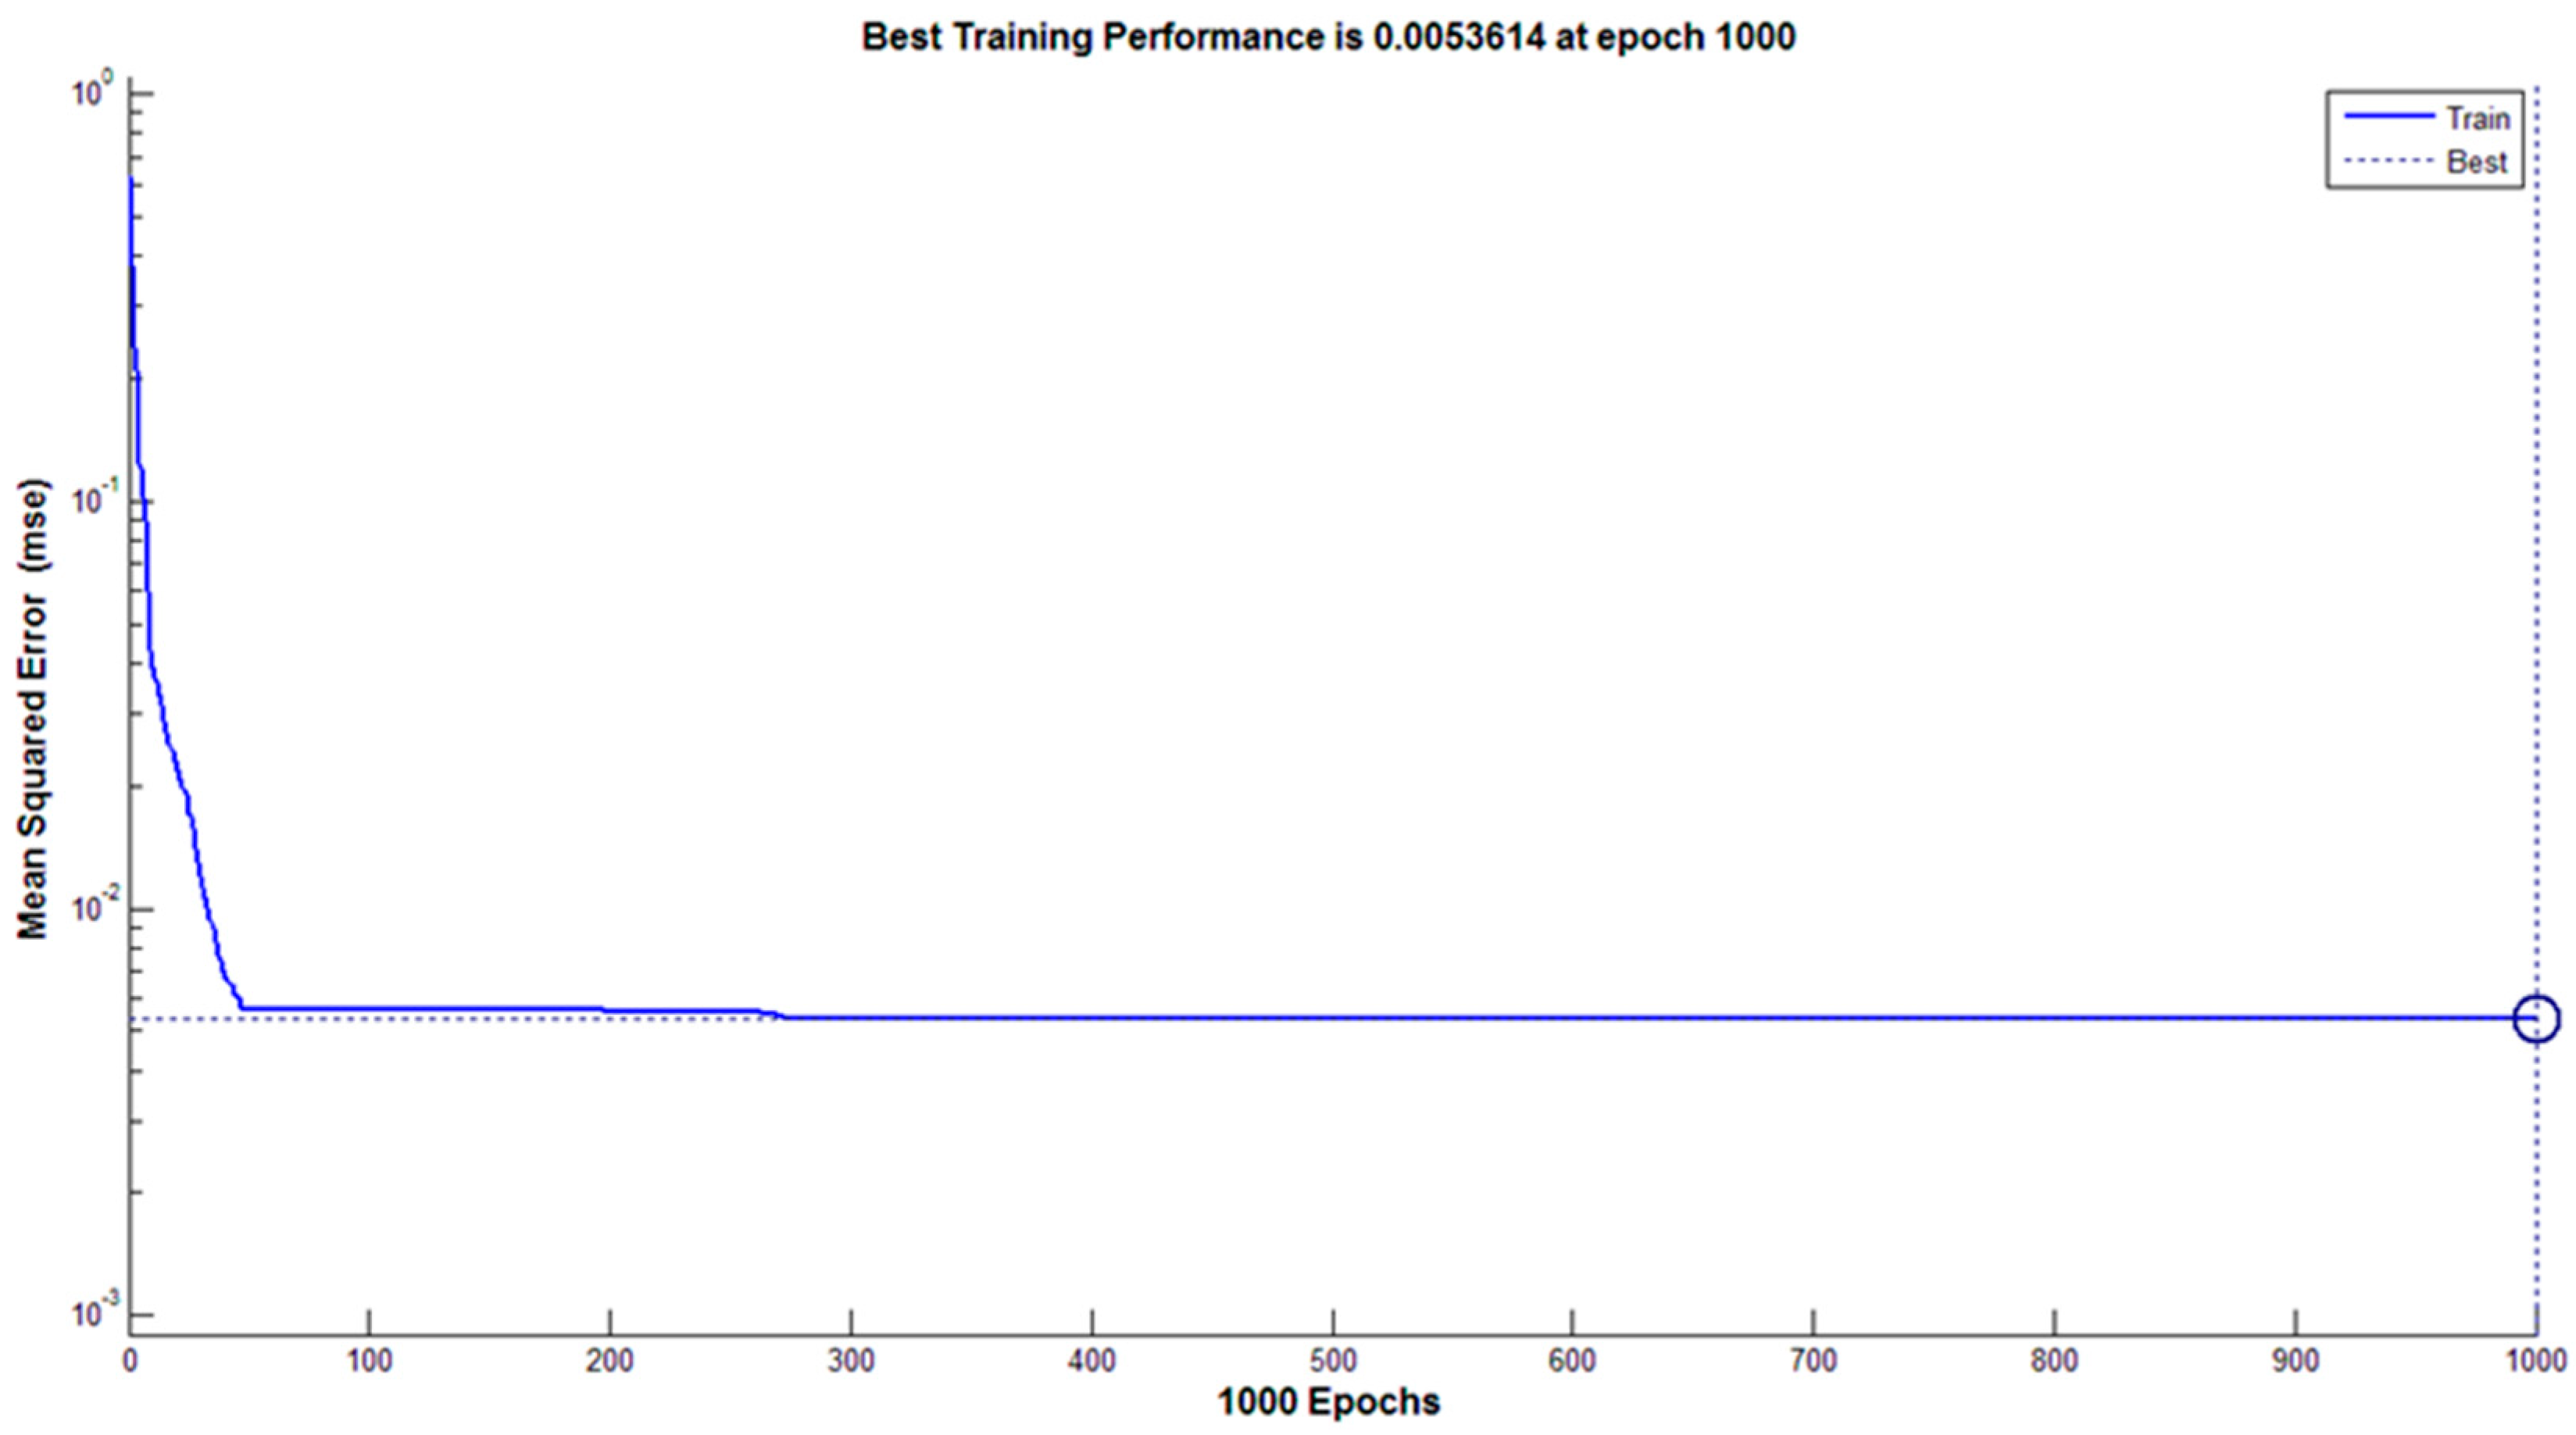
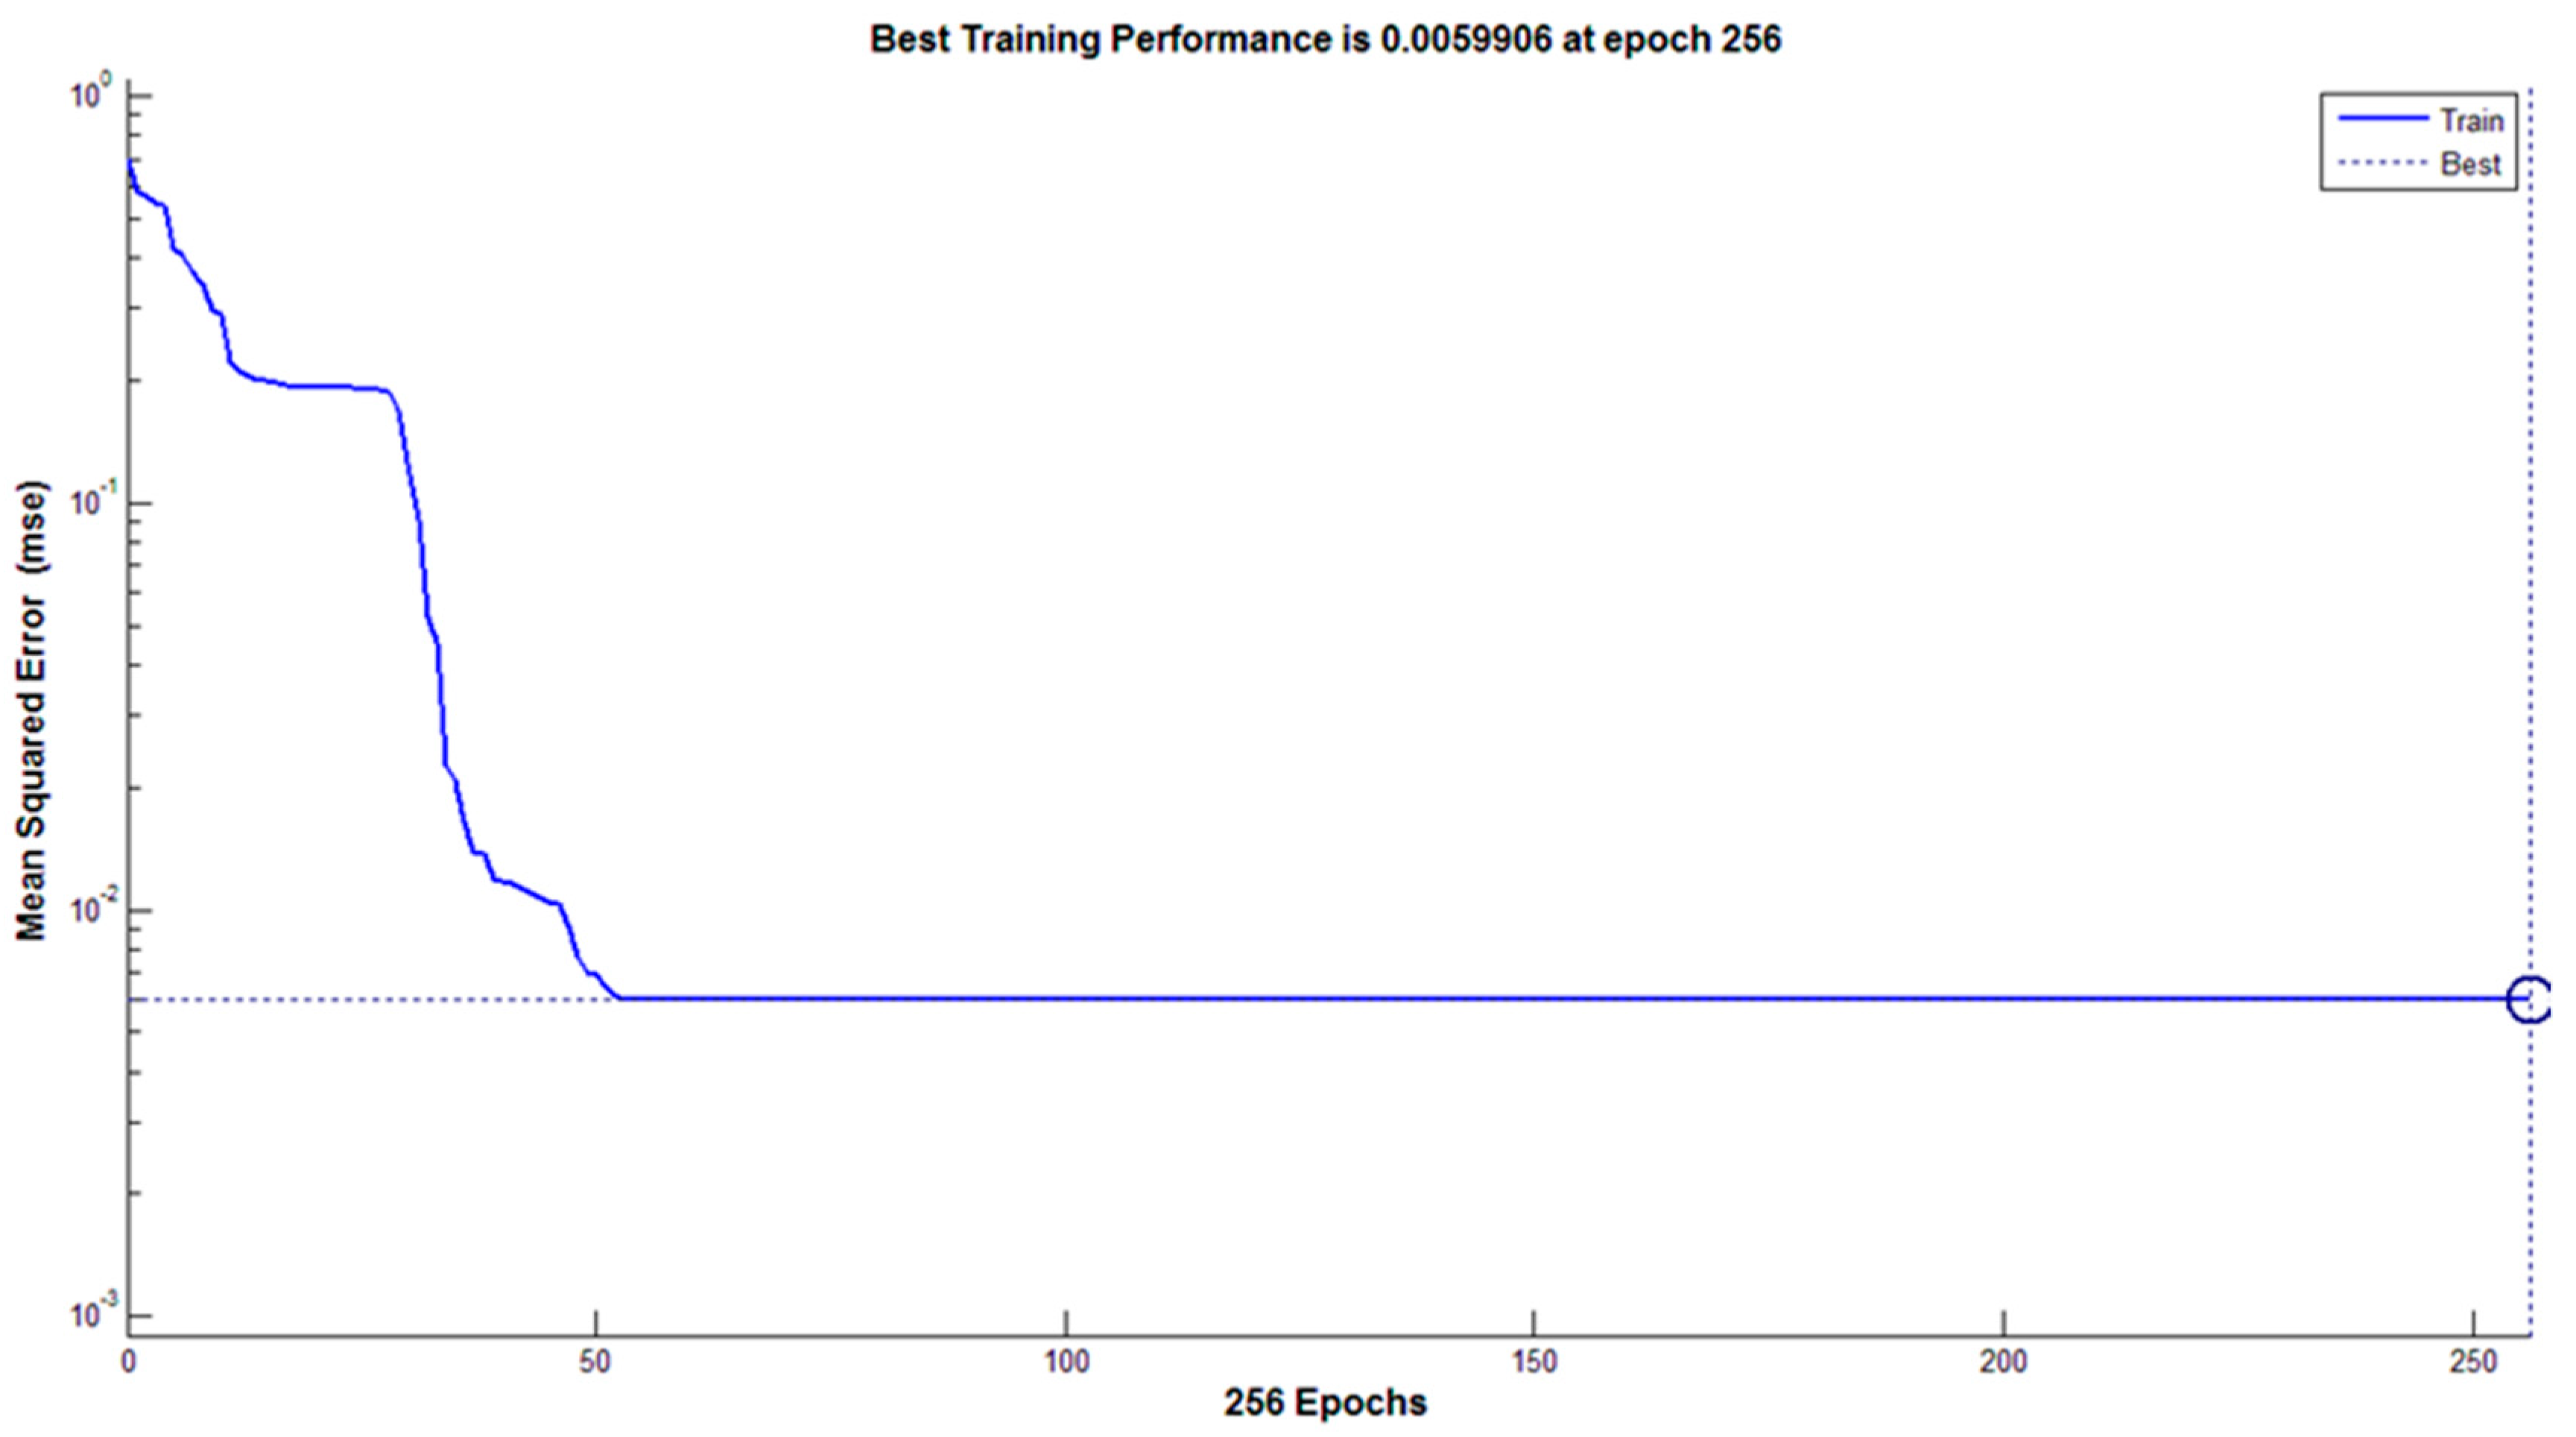
25]. In this research, we used a back-propagation artificial neural network to identify and categorize 13 rice cultivars in three forms of rough, brown, and white rice. We developed code in MATLAB, and the network architecture was defined in this program. The number of input layer neurons was equal to the number of characteristics used for the separation of rice cultivars, and the number of output layer neurons was equal to the number of under-examined cultivars. The number of hidden layers in the neural network, as well as the number of neurons in each hidden layer, was determined by the trial and error method, which is the most important decision in the neural network configuration. This method plays an important role in the capability of the network in the classification of cultivars and learning time. After performing the trial and error method several times, a network with two hidden layers was used for the present study. The optimal numbers of neurons for first and second hidden layers were 20 and 10 neurons, respectively. The activation function of the first and second hidden layers was a sigmoid tangent, and the activation function of the output layer was considered to be a sigmoid logarithm. In addition, 70% of the data was used for network training and network validation, and 30% for network testing. The Levenberg–Marquardt algorithm was used to train the network. The maximum number of training courses was considered to be 1000 periods, and the mean square error (MSE) of classified data was used to evaluate the network performance.

2.7. Criteria for Performance Evaluation of Classifiers

Sensitivity, specificity, and accuracy are the three main characteristics in the classifier analysis. The sensitivity is a fraction of a well-ordered sample, while specificity is a fraction of the relevant sample categorized by the system, and the accuracy is the total classification rate of classifiers. These three criteria are expressed using Equations (1)–(3).
  Sensitivity = TP TP + FN ,
  Specificity = TN FP + TN   ,
  Accuracy = TP + TN TP + TN + FP + FN ,
where TR is the number of correctly classified samples in each class. TN is the number of samples on the main diameter of the conjugation matrix minus the number of samples that are correctly classed in the class. The FN is defined as the sum of the horizontal samples minus the number of samples that are correctly classified in the class. Finally, FP is the sum of the vertical samples of the class under consideration, minus the number of samples that are correctly categorized in the class [26]. The lowest values of sensitivity, specificity, and accuracy are 0, and the highest of these values is 100. Observe that sensitivity of 100% means that no sample of a given class was incorrectly classified in another one. A specificity of 100% means that no sample of other classes was incorrectly classified in the class of interest. An accuracy of 100% appears when any sample of the intended class is correctly classified, and no sample of other classes is assigned to the intended class incorrectly [11]. This parameter work based on the number of samples that classify in different classes.

3. Results and Discussion

3.1. Data Normalization Test

In the present study, color, morphology, and texture characteristics of rice cultivars in three forms were extracted. To evaluate the normal distribution of independent variables, the box plot of all data was plotted for all variables in SPSS software. In this diagram, a box is used to display data between the first and third quartiles, and a line inside the box specifies the data median or the second quartile. Out of the box, the minimum and maximum data values are specified, and the data outside this range is specified as dots with the number of lines as offset data. In each seed form, after evaluating the box plot of all independent variables, 300 out of range data far from the top and bottom of the chart were determined and removed from the data list. Then, the box was again plotted for all the examined specificities. For example, the Cb (represents the difference between the blue component and a reference value) standard deviation box plot for 13 cultivars in white form, the quadrate square box plot for 13 cultivars in brown form are presented in Figure 3, and the entropy box plot in the green band for the 13 cultivars is presented in Figure 4. Figure 5 indicates the histogram and normal distribution curve of red band entropy for 13 paddy cultivars. From the objective inspection of the diagrams, it can be seen that due to the removal of outliers, the box plot of each rice cultivar is well distributed. Of course, there were some data outside the range for some rice cultivars in some of the specificities that are identified by their number. Due to the close proximity of these data to the beginning or end of the box plot, it can be assured that it has little effect on statistical analysis.

3.2. ANOVA and Mean Comparison

After extracting the specificity of seeds from each image, their average was calculated as a result of that image. For example, the mean of the standard deviation of the blue color component for 13 paddy cultivars, the mean values of the variance of the YN color component for 13 white rice cultivars and the mean values of the green color component variance for 13 brown rice cultivars are presented in Figure 6, Figure 7 and Figure 8 in the form of a diagram.
To evaluate the homogeneity of intra-treatment variances, the Bartlett test was used by the MSTATC software (Michigan State Univ., MI, USA). To approve intra-group variance homogeneity, Chi-squared should be less than the determined critical amount for the freedom degree and the level of desired probability. According to the tables in the statistical sources, the critical value of Chi-squared in the freedom degree of 11 and the probability level of 0.01 is equal to 24.725, which means that all Chi-squared values are less than the critical value. Therefore, intra-treatment variances are homogeneous for all variables in all forms, and it is not difficult to perform variance analysis. ANOVA was performed for all variables at a probability level of 0.01 to determine which parameters have the probability of a significant difference between the cultivars. The results of this test showed that in all variables, the obtained probability level was the lower desired probability level; therefore, there is the probability of a significant difference between the cultivars in all parameters in all three forms. The least significant difference (LSD) test provides the possibility of accurately evaluating results and determining the significant difference in terms of specificity between cultivars. An example of the results obtained by the test (three components) is presented in Figure 9, Figure 10 and Figure 11. Figure 9 shows that B standard deviation classified rough cultivars into nine classes, so that Tencc, Asgari, Domsiyah, and Dorfak cultivars were placed in a group and Binam, and Kadoos cultivars were placed in another group. Therefore, the classification accuracy of the parameter was 75%. The results of the comparison of the mean of brown cultivars in G variance shows that this component is able to identify the cultivars in seven classes, so that Binam and Hasani cultivars; Ali Kazemi, Dorfak, Hashemi, and Khazar cultivars; Kados, and Lanjan; Domsiayah and Gohar were placed in different classes. Therefore, according to Figure 10, the identification accuracy of the components was 58.33%. As seen in Figure 11, this component was able to identify the cultivars in 10 separated classes; so that Dorfak and Lanjan; Kados and Khazar; and Hashemi and Khazaregarm cultivars placed in various groups. Therefore, the identification accuracy of the component was 83.33%.

3.3. Application of the PCA Method in the Selection of Effective Properties

As stated, the results of ANOVA showed that there is a probability of significant differences in the variables in all 92 characteristics. However, considering the high number of parameters, evaluation of their effects is time-consuming. Therefore, to reduce the dimensions of the problem, the PCA method was used. The results of all cultivars in three forms are presented in Figure 12, Figure 13 and Figure 14 in the form of a scree plot. This plot shows the special value of new parameters against the number of each parameter. As seen in Figure 12, after the eighth component, the chart is almost flat; it means that after the eighth component, the white form has a low contribution in total variance. Generally, we interested in preserving components with values higher than one. Hence it is clear that seven and eight parameters, respectively, are the most effective ones in the identification and separation of cultivars in brown and paddy forms. Therefore, to classify by cultivar, the eight cultivars obtained by PCA were used. It means that these eight components were sent to classifiers as input. To classify the cultivars in brown and paddy, respectively, 13 and 14 components obtained by PCA were transferred to classifiers as input.

3.4. Classification of Various Rice Cultivars

3.4.1. Classification Using Linear DA

DA is a linear separator, which is implemented using SPSS software to classify data. The results of rice cultivars classification in brown form by this method are presented in Figure 15, which shows 87.7% accuracy. The classification of rough and white form by DA method is shown in Figure 16 and Figure 17, with 89.2% and 83.1% accuracy in classification, respectively. As can be seen, the highest classification accuracy obtained by the DA method was 89.2%.

3.4.2. Classification Using Artificial Neural Network

After training and validation of the network, for all 13 rice cultivars, the correct classification percentage was estimated to be 100% (for training, validation, and testing data). The results of white, brown, and rough forms are presented in Figure 18, Figure 19 and Figure 20. As seen in Figure 18, Figure 19 and Figure 20, in the case of brown and paddy forms, the neural network was able to achieve a minimum error of 0.0030239 after 1000 repetitions and mean square error of 0.0053614 after 1000 repetitions, respectively.

3.4.3. Evaluating the Performance of Cultivars Using Three Properties of Sensitivity, Specificity, and Accuracy

The results of the performance of ANN classifiers and linear DA in the classification of 13 rice cultivars in three forms of the brown, rough, and white forms based on three properties of sensitivity, specificity, and accuracy are shown in Table 4, Table 5 and Table 6. In general, 100% sensitivity means that no sample of the class is misidentified in other classes. For example, in Table 4, the sensitivity of the linear DA for the 10 cc class is 100%, since all samples of this class were properly categorized. It should be noted that 100% accuracy will be achieved if neither the sample of the class is mistakenly classified in other classes nor any sample of other classes is classified incorrectly in the class.
As shown in Table 4, Table 5 and Table 6, all values of the accuracy, sensitivity, and specificity of classification different varieties of rice in the form of white rice, brown rice, and paddy using artificial neural network, were 100%. The highest accuracy, sensitivity, and specificity in separating the different varieties of white rice, brown rice, and paddy using linear DA were obtained 100%, 100%, and 100%, respectively. However, the lowest values of the accuracy, sensitivity, and specificity, for example, in classifying white rice varieties, was 40%, 90%, and 42.86%.
Table 7 shows the accuracy of different methods for identifying different varieties of rice. The accuracy of the proposed method in this article is higher than other researcher methods.
The reason for the high accuracy of the classification of neural network methods compared to other methods can be attributed to the nonlinearity of this method.

4. Conclusions

In the present study, a combined method of image processing and ANN method was used to identify and classify 13 common rice cultivars in Iran in three forms of paddy, brown, and white rice. The results showed that the highest classification accuracy obtained by the DA method was less than 90%. This is a linear method, and obtained values indicated the nonlinear relationship between the various rice cultivars of the present study in terms of different attributes, such as color, texture, and morphology. It should be noted that to achieve a higher separation rate, a nonlinear classifier, such as an artificial neural network, is required. The results of the neural network method in identifying and classifying rice cultivars in the white form indicated that the neural network was able to minimize the error by 256 repetitions and identify and categorize the cultivars with a precision of 100%. Fewer repetitions to the default setup of the network, which was 1000 repetitions, showed a suitable learning rate and coverage of network toward the subject (the correct classification of cultivars). Due to the ANN classifier being a nonlinear method, it is able to separate similar cultivars, while DA was unable to separate samples. For example, one can name Kadoos in brown rice, Domsiyah and Gohar in paddy, and Hashemi and Khazargarm in white rice, but the other cannot. The most important advantage of the suggested method is high-accuracy classification, high-speed classification, the possibility of use in cell phones by creating a small file to record video, and the capability of classifying most of the rice cultivars in Iran because it can classify indigenous 13 cultivars. As the accuracy of the method in identifying different varieties of rice in natural conditions is high, it would be possible to develop an application for mobile use to identify different varieties of rice.

Author Contributions

Conceptualization, Y.A.-G., A.M. (Amir Molaeei), S.S. (Sajad Sabzi); methodology, Y.A.-G., S.S. (Sajad Sabzi), A.M. (Amir Molaeei), and S.S. (Shahaboddin Shamshirband); software, A.M. (Amir Molaeei), S.S. (Sajad Sabzi); validation, A.M. (Amir Molaee), Y.A.-G., and S.S. (Shahaboddin Shamshirband); formal analysis, A.M. (Amir Molaee), Y.A.-G., and S.S. (Shahaboddin Shamshirband); investigation, Y.A.-G., A.M. (Amir Molaee), S.S. (Sajad Sabzi), and S.S. (Shahaboddin Shamshirband); resources, Y.A.-G. and A.M. (Amir Molaee); data curation, A.M. (Amir Molaee); writing—original draft preparation, Y.A.-G.; writing—review and editing, N.N., A.M. (Amir Mosavi), and S.S. (Shahaboddin Shamshirband); visualization, Y.A.-G., S.S. (Sajad Sabzi); supervision, Y.A.-G.; project administration, A.M. (Amir Mosavi), Y.A.-G.; funding acquisition A.M. (Amir Mosavi). All authors have read and agreed to the published version of the manuscript.

Funding

This study was financially supported by the University of Mohaghegh Ardabili.

Acknowledgments

We acknowledge the support of this work by the Hungarian State and the European Union under the EFOP-3.6.1-16-2016-00010 project. We also acknowledge the support of the German Research Foundation (DFG) and the Bauhaus-Universität Weimar within the Open-Access Publishing Programme.

Conflicts of Interest

The authors declare no conflicts of interest.

References

  1. Lu, Y.; Yi, S.; Zeng, N.; Liu, Y.; Zhang, Y. Identification of rice diseases using deep convolutional neural networks. Neurocomputing 2017, 267, 378–384. [Google Scholar] [CrossRef]
  2. Mucherino, A.; Papajorgji, P.J.; Pardalos, P.M. Data Mining in Agriculture; Springer: New York, NY, USA, 2009. [Google Scholar]
  3. Zareiforoush, H.; Minaei, S.; Alizadeh, M.R.; Banakar, A. A hybrid intelligent approach based on computer vision and fuzzy logic for quality measurement of milled rice. Measurement 2015, 66, 26–34. [Google Scholar] [CrossRef]
  4. Golpour, I.; Parian, J.A.; Chayjan, R.A. Identification and classification of bulk paddy, brown, and white rice cultivars with colour features extraction using image analysis and neural network. Czech J. Food Sci. 2014, 32, 280–287. [Google Scholar] [CrossRef] [Green Version]
  5. Kuo, T.Y.; Chung, C.L.; Chen, S.Y.; Lin, H.A.; Kuo, Y.F. Identifying rice grains using image analysis and sparse-representation-based classification. Comput. Electron. Agric. 2016, 127, 716–725. [Google Scholar] [CrossRef]
  6. Liu, J.; Tang, Z.; Gui, W.; Liu, W.; Xu, P.; Zhu, J. Application of statistical modeling of image spatial structures to automated visual inspection of product quality. J. Process. Cont. 2016, 44, 23–40. [Google Scholar] [CrossRef]
  7. Lurstwut, B.; Pornpanomchai, C. Image analysis based on color, shape and texture for rice seed (Oryza sativa L.) germination evaluation. Agric. Nat. Resour. 2018, 51, 383–389. [Google Scholar] [CrossRef]
  8. Guzman, J.D.; Peralta, E.K. Classification of Philippine rice grains using machine vision and artificial neural networks. In Proceedings of the World Conference on Agricultural Information and IT, Tokyo, Japan, 23–26 August 2008; Volume 6, pp. 41–48. [Google Scholar]
  9. Hobson, D.M.; Carter, R.M.; Yan, Y. Characterisation and identification of rice grains through digital image analysis. In Proceedings of the Instrumentation and Measurement Technology Conference, Warsaw, Poland, 1–3 May 2007. [Google Scholar]
  10. Liu, Z.Y.; Cheng, F.; Ying, Y.B.; Rao, X.Q. Identification of rice seed varieties using neural network. J. Zhejyang Univ. Sci. 2005, 6, 1095–1100. [Google Scholar] [CrossRef] [PubMed] [Green Version]
  11. Phadikar, S.; Sil, J.; Das, A.K. Rice diseases classification using feature selection and rule generation techniques. Comput. Electron. Agric. 2013, 90, 76–85. [Google Scholar] [CrossRef]
  12. Silva, C.S.; Sonnadara, U. Classification of rice grains using neural networks. Process. Tech. Sessions 2013, 29, 9–14. [Google Scholar]
  13. Yang, A.; Gao, R.; Liu, Y.; Sun, X.; Pan, Y. An automatic method for identifying different variety of rice seeds using machine vision technology. In Proceedings of the Sixth International Conference on Natural Computation, Yantai, China, 10–12 August 2010; pp. 84–88. [Google Scholar]
  14. Yang, P.; Zhu, Y.; Yang, X.; Li, J.; Tang, S.; Hao, Z.; Guo, L.; Li, X.; Zeng, X.; Lu, Y. Evaluation of sample preparation methods for rice geographic origins classification using laserinduced breakdown spectroscopy. J. Cereal Sci. 2018, 80, 111–118. [Google Scholar] [CrossRef]
  15. Anami, B.S.; Naveen, N.M.; Hanamaratti, N.G. Behavior of HSI color co-occurrence features in variety recognition from bulk paddy grain image samples. Int. J. Signal Process. Image Process. Pattern Recognit. 2015, 8, 19–30. [Google Scholar] [CrossRef]
  16. Chaugule, A.A.; Mali, S.N. Evaluation of shape and color features for classification of four paddy varieties. Int. J. Image Graph. Signal Process. 2014, 6, 32. [Google Scholar] [CrossRef] [Green Version]
  17. Kambo, R.; Yerpude, A. Classification of basmati rice grain variety using image processing and principal component analysis. Int. J. Comput. Trends Technol. 2014, 11, 80–85. [Google Scholar] [CrossRef] [Green Version]
  18. Gonzalez, R.C.; Woods, R.E.; Eddins, S.L. Digital Image Processing Using MATLAB; Prentice Hall: Upper Saddle River, NJ, USA, 2004. [Google Scholar]
  19. Sabzi, S.; Abbaspour-Gilandeh, Y.; García-Mateos, G. A fast and accurate expert system for weed identification in potato crops using metaheuristic algorithms. Comput. Ind. 2018, 98, 80–89. [Google Scholar] [CrossRef]
  20. Soille, P. Morphological Image Analysis: Principles and Applications; Springer: Berlin/Heidelberg, Germany, 2002. [Google Scholar]
  21. Toriwaki, J.; Yoshida, H. Fundamentals of Three-Dimensional Digital Image Processing; Springer: London, UK, 2009. [Google Scholar]
  22. Meyer, G.E.; Mehta, T.; Kocher, M.F.; Mortensen, D.A.; Samal, A. Textural imaging and discriminant analysis for distinguishing weeds for spot spraying. Trans. ASAE 1998, 41, 1189–1197. [Google Scholar] [CrossRef]
  23. Bevington, P.R.; Robinson, D.K.; Blair, J.M.; Mallinckrodt, A.J.; McKay, S. Data reduction and error analysis for the physical sciences. Comput. Phys. 1993, 7, 415–416. [Google Scholar] [CrossRef]
  24. Klecka, W.R.; Iversen, G.R.; Klecka, W.R. Discriminant Analysis; SAGE Publications Ltd.: Thousand Oaks, CA, USA, 1980; Volume 19. [Google Scholar]
  25. Rojas, R. Neural Networks—A Systematic Introduction; Springer: Berlin, Germany, 1996. [Google Scholar]
  26. Wisaeng, K. A Comparison of Decision Tree Algorithms for UCI Repository Classification. Int. J. Eng. Trends Technol. 2013, 4, 3393–3397. [Google Scholar]
Figure 1. View of the imaging system.
Agronomy 10 00117 g001
Figure 2. An example of an intensity histogram obtained by images.
Agronomy 10 00117 g002
Figure 3. The box plot of Cb-standard deviation for 13 white rice cultivars.
Agronomy 10 00117 g003
Figure 4. The box plot for 13 brown rice cultivars.
Agronomy 10 00117 g004
Figure 5. The box plot of red band entropy for 13 paddy cultivars.
Agronomy 10 00117 g005
Figure 6. The mean standard deviation of the blue component for 13 paddy cultivars.
Agronomy 10 00117 g006
Figure 7. The mean-variance values of YN component for 13 white rice cultivars.
Agronomy 10 00117 g007
Figure 8. The mean-variance values of G component for 13 brown rice cultivars.
Agronomy 10 00117 g008
Figure 9. Comparison of the standard deviation of B values of paddy cultivars.
Agronomy 10 00117 g009
Figure 10. Test results of the least significant difference (LSD) for the variance values of G in brown rice cultivars.
Agronomy 10 00117 g010
Figure 11. The results of the LSD test for the mean G of white rice cultivars.
Agronomy 10 00117 g011
Figure 12. Scree plot to determine the most effective separator components. White rice cultivars.
Agronomy 10 00117 g012
Figure 13. Scree plot to determine the most effective separator components. Brown rice cultivars.
Agronomy 10 00117 g013
Figure 14. The results of principal component analysis (PCA) to determine the most effective specificities in the determination of paddy cultivar.
Agronomy 10 00117 g014
Figure 15. Classification of 13 cultivars. Brown rice.
Agronomy 10 00117 g015
Figure 16. Classification of 13 cultivars. Paddy using linear discriminant analysis (DA).
Agronomy 10 00117 g016
Figure 17. Classification of 13 white rice cultivars using linear DA.
Agronomy 10 00117 g017
Figure 18. The curve of how to train a designed neural network to identify and classify. Brown rice cultivars.
Agronomy 10 00117 g018
Figure 19. The curve of how to train a designed neural network to identify and classify. Paddy cultivars.
Agronomy 10 00117 g019
Figure 20. The curve of how to train a designed neural network to identify and classify white rice cultivars.
Agronomy 10 00117 g020
Table 1. Extracted color features for rice seeds.
FeatureSymbolDescription
The mean RGB componentsBm, Gm, RmExtracted from the original image
The mean square of RGB componentsBms, Gms, Rms
The variance of RGB componentsBrav, Grav, Rrav
The standard deviation of RGB componentsBdts, Gdts, Rdts
The mean YIQ componentsNYm, NIm, Qm, Using the rgb2ntsc command
The mean square of YIQ componentsNYms, NIms, Qms
The variance of YIQ componentsNYrav, NIrav, Qrav
The standard deviation of YIQ componentsYNstd, NIstd, Qstd
The mean YCbCr componentsYYm, Cbm, CrmUsing the rgb2 and cbcr command
The mean square of YCbCr componentsYYsm, Cbsm, Crsm
The variance of YCbCr componentsYYvar, Cbvar, Crvar
The standard deviation of YCbCr componentsYYstd, Cbstd, Crstc
The mean HSV componentsHVm, SVm, VmUsing the rgb2hsv
The mean square of HSV componentsHVsm, SVsm, Vsm
The variance of HSV componentsHVvar, SVvar, Var
The standard deviation of HSV componentsHVstd, SVstd, Vstd
The mean HSI componentsHIm, SIm, IImUsing code written in MATLAB software
The mean square of HSI componentsHIsm, SIsm, IIsm
The variance of HSI componentsHIvar, SIvar, IIvar
The standard deviation of HSI componentsHIstd, SIstd, IIstd
Table 2. Extracted morphological specificities for each rice seeds.
FeatureSymbolDescriptionUnits
AreaarUsing the region props commandPixel2
Distance from centerec Pixel
The length of the large axisma Pixel
The length of the small axismi Pixel
Perimeterpe Pixel2
The square of the areasar(area)2Pixel2
The square of the distance from the centersec(eccentricity)2Pixel2
The square of the long axissma(major axis length)2Pixel2
The square of the small axissmi(minor axis length)2Pixel2
The square of perimeterspe(perimeter)2Pixel4
Aspect ratioasAspect ratio = major axis length/minor axis length-
The square of aspect ratiosas(Aspect ratio)2-
EllipticalelElliptical = major axis length − minor axis length-
The square of Ellipticalsel(Elliptical)2-
Table 3. The extracted texture features for each seed.
FeatureSymbolDescription
The mean of gray level in red, green, and blue bandsRagl, Gagl, Bagl m = i = 0 L 1 z i p ( z i )
The mean contrast in red, green, and blue bandsRac, Gac, Bac μ 2
The smoothness in red, green, and blue bandsRs, Gs, Bs 1 1 1 + σ 2
The third moment in red, green, and blue bandsRtm, Gtm, Btm μ 3
The homogeneity in red, green, and blue bandsRu, Gu, Bu U ( z ) = i = 0 L 1 p 2 ( z i )
The entropy in red, green, and blue bandsRe, Ge, Be e ( z ) = i = 0 L 1 p ( z i ) log 2 p ( z i )
Table 4. Performance criteria for the two classifiers in the classification of Brown rice varieties.
Discriminant Analysis (DA)Artificial Neural Networks (ANN)
ClassSensitivity (%)Accuracy (%)Specificity (%)Sensitivity (%)Accuracy (%)Specificity (%)
1. Tencc10096.6171.43100100100
2. Alikazemi10096.6171.43100100100
3. Asgari100100100100100100
4. Binam100100100100100100
5. Domsiyab100100100100100100
6. Dorfak100100100100100100
7. Dorfak8091.6880100100100
8. Hasani6096.61100100100100
9. Hashemi8091.6880100100100
10. Kadoos4093.4466.66100100100
11. Khazar100100100100100100
12. Khazaregarm8091.6880100100100
13. Lenjan100100100100100100
Table 5. Performance criteria for the two classifiers in the classification of paddy varieties.
Discriminant Analysis (DA)Artificial Neural Networks (ANN)
ClassSensitivity (%)Accuracy (%)Specificity (%)Sensitivity (%)Accuracy (%)Specificity (%)
1. Tencc10096.4371.43100100100
2. Alikazemi100100100100100100
3. Asgari8098.18100100100100
4. Binam100100100100100100
5. Domsiyab4091.5250100100100
6. Dorfak100100100100100100
7. Dorfak609042.83100100100
8. Hasani100100100100100100
9. Hashemi10098.1883.33100100100
10. Kadoos62.594.73100100100100
11. Khazar100100100100100100
12. Khazaregarm8098.19100100100100
13. Lenjan10098.1850100100100
Table 6. Performance criteria for the two classifiers in the classification of white rice varieties.
Discriminant Analysis (DA)Artificial Neural Networks (ANN)
ClassSensitivity (%)Accuracy (%)Specificity (%)Sensitivity (%)Accuracy (%)Specificity (%)
1. Tencc8098.19100100100100
2. Alikazemi100100100100100100
3. Asgari100100100100100100
4. Binam100100100100100100
5. Domsiyab4091.5250100100100
6. Dorfak10096.4271.43100100100
7. Dorfak10096.4271.43100100100
8. Hasani100100100100100100
9. Hashemi4091.5250100100100
10. Kadoos66.6696.43100100100100
11. Khazar8098.18100100100100
12. Khazaregarm609042.86100100100
13. Lenjan100100100100100100
Table 7. Comparison of the accuracy of the proposed method with other research.
Classification Rate (%)Number of SamplesMethod
1003600Proposed in this study
89.11500Kuo et al. [24]
93.63000Anami et al. [15]
802500Kambo and Yerpude [17]

