Article

Effect of Irrigation Management and Water Quality on Soil and Sorghum bicolor Payenne Yield in Cape Verde

by
María del Pino Palacios-Diaz
1,
Juan Ramón Fernández-Vera
2,
Jose Manuel Hernández-Moreno
1,
Regla Amorós
3 and
Vanessa Mendoza-Grimón
1,*
1
Instituto de Investigación IUNAT, Grupo GEOVOL, Universidad de Las Palmas de Gran Canaria, 35017 Las Palmas de Gran Canaria, Spain
2
Laboratorio Agroalimentario y Fitopatológico del Cabildo de Gran Canaria, 35413 Arucas, Spain
3
Instituto Nacional de Investigação e Desenvolvimento Agrário (INIDA), Cidade da Praia 84, Cape Verde
*
Author to whom correspondence should be addressed.
Agriculture 2023, 13(1), 192; https://doi.org/10.3390/agriculture13010192
Submission received: 25 November 2022 / Revised: 5 January 2023 / Accepted: 8 January 2023 / Published: 12 January 2023

Abstract

:
Treated water use for agriculture will promote sustainable irrigation development and food sovereignty. The aim of this study is to assess the feasibility of subsurface drip irrigation (SDI) compared to drip irrigation (DI) and of reclaimed water (RW) versus conventional groundwater (CW), to produce forage sustainably in a warm arid region. A sorghum experiment was conducted in a field on Santiago Island (Cape Verde). A forage yield of 200 t fresh matter·ha−1·year−1, irrigated by RW, was obtained. Considering Cape Verde regulations, it is possible to irrigate sorghum using a drip system and RW without adding fertilizers. Soil fertility (OM and Ntot) increased, while risk parameters (EC, nitrate, and Na) returned to their initial values after the rainy season. The best irrigation water use efficiency was obtained by RWSDI (200 L·kg−1 DM) compared to RWDI, which needed 34% more water. According to the results, a high nitrate elimination rate in treatment plants might not be desirable if agricultural reuse is planned to irrigate high-N-demanding species. Establishing new salinity tolerance levels under reuse conditions with SDI, and irrigating in rainy months to promote the lixiviation of salts in arid regions are also necessary.

1. Introduction

Reusing treated water in agriculture is essential for water-scarce areas to guarantee economic and environmental sustainability in semiarid regions [1]. Cape Verde is located in the Atlantic area of Macaronesia, lies in the sub-Saharan African climatic zone, and is exposed to natural disasters. The Cape Verde wet season lasts from 1 to 3 months, with potential evaporation exceeding precipitation throughout the year (precipitation from 80–300 mm in arid coastal zones to 1200–1600 mm in the highlands of mountain islands) [2]. Cape Verde agriculture depends very much on rainfall because irrigated land represents only 3.52% of the total agricultural area [3]. Santiago, the biggest island in Cape Verde, uses the largest area for agriculture (52%) [4]. Agricultural/livestock sector is its main economic activity, and agricultural sector growth is one of the most effective ways to reduce poverty and to achieve food security in rural areas [3].
It is necessary to find alternative water resources, such as reusing treated wastewater for agriculture, to promote irrigation development because unconventional resources are one of the alternatives to alleviate the hydrological imbalance between water use and renewable resource availability [5]. Cape Verde has been investing and encouraging the practice of reusing treated wastewater in agriculture and has a regulation that includes treated water irrigation [6].
Animal production plays a crucial role in its rural economy and food sovereignty. Forage production is the most suitable choice for reusing reclaimed water (RW) given its lower quality demands and lack of fresh forage crops to feed livestock in arid regions, and efficient irrigation systems are necessary because water scarcity is a limiting factor [7]. Several Sorghum bicolor L. Moench hybrids and varieties exist that could be used a fodder crop with high nutritive value. The Payenne variety has the following agronomic characteristics: 60–63 days sowing–flowering cycle; 87–90 days seedling–maturity cycle; not photosensitive; barely resists lodging; sensitive in humid areas; maximum yields of 3500 kg·ha−1 [8]. As subsurface irrigation systems (SDI) use soil as a natural advanced, but not high-cost water treatment, the in situ RW reuse produced by low-tech wastewater treatment plants (WWTP) would provide a valuable resource for small rural villages [7]. As practically all the supplied water is absorbed by plants, irrigating by SDI and applying accurate management reduce the required water [9]. Costly water prices also represent a high percentage of the total forage production costs [10].
Farneselli et al. [11] showed that high fertigation and/or irrigation frequency can be a strategy to increase N uptake efficiency in tomato fed a very high N and water supply. Ramos et al. [12] modeled water and N transport. They indicated that high nitrate uptake occurs with more fertigation events and the used amount in each event is smaller. Studies have indicated that nitrate is the commonest and most widespread groundwater contaminant in the world and can lead to health problems [13]. Best management practices that reduce the amount of water and N influx without decreasing yields can lower the nitrate pollution potential of groundwater [14]. Optimum nutrient applications in the crop root zone ensures their optimum utilization, higher crop yield, and fewer nutrient losses [15].
The aim of this study was to assess the feasibility of using subsurface drip irrigation (SDI) compared to conventional drip irrigation (DI), and of reclaimed water (RW) versus conventional groundwater (CW), for sustainable forage produce in a warm arid region (Cape Verde). The assumption of the present study is that the best water use efficiency shown by SDI vs. DI and the safety provided by this irrigation system in avoiding plant and water contact will permit irrigation using water produced by low-tech WWTP of rural zones in a sustainable way.

2. Materials and Methods

2.1. Experimental Field

In 2019, a sorghum experiment was conducted in a field (540 m2) located in Rocha Lama (15°7′43″ N; 23°31′38″ W; 6 asl), Santa Cruz, on Santiago Island, Cape Verde. The area had a warm, humid, and sunny climate, with a mean minimum temperature, a mean maximum temperature, and a mean humidity of 20.7 °C, 24.1 °C, and 71.6%, respectively, from 2007 to 2021. From 1979 to the present day, the driest year was 1983, along with the wettest in 2015 [16], producing annual precipitation (Pr) ranging from 77 (1983) to 359 mm·year−1 (2015) and a mean of 186 mm·year−1 (236 mm/year, considering only the last 15 years). Reference evapotranspiration (ETo), which is less variable, ranged between 1468 and 1413 mm·year−1, with a mean of 1440 mm·year−1. This is lower than 1454 mm/year, which was the mean from 2007 to the present day (Table S1), with mean daily ETo values going from 3.9 mm·day−1 (1983–2021) to 4.0 mm·day−1 (2007–2021) (Table S1). Rain falls mainly between August and October (121 and 221 L·m−2 in 2019 and 2020, respectively), with 91.7% (2019) and 88.4% (2020) of the total annual precipitation during this period. Detailed information about the ETo and precipitation data are available in ST2. Using the daily ETo and Pr of 2019 and 2020 for each month (Table S2), the effective amount of water used for irrigation by each harvest (Table 1), which was measured by a flowmeter, was estimated using ETo and a mean factor of 0.9. It was also influenced by unusual events of infrastructure malfunctioning.
Soil conditioning consisted of removing stones and adding 1.76 kg·m−2 of cow manure in October 2018. The Sorghum bicolor Payenne variety was seeded on 8 April 2019. Plants were harvested nine times from seeding to 6 November 2020 (Table 1). Harvesting was conducted between the soft and hard dough stages. Using the climate data provided in Table S2, the ETo values from the different harvests were calculated and appear in Table 1.
Birds caused problems during the emergence and fruiting period. No chemical control of weeds or other pests was necessary.
As previously described by Mendoza-Grimon et al. [17], three treatments based on irrigation management (SDI vs. DI) and water quality (conventional groundwater, CW vs. RW) were used to irrigate the experimental field: T1, RW applied by SDI (60 m2); T2, RW plus DI (60 m2); T3, CW plus SDI (60 m2). Each treatment was repeated in three blocks in which all three treatments were irrigated (nine plots), adding the same amount of water in each of them. Each plot consisted of eight lines separated by 0.75 m, which were 10 m long.

2.2. Irrigation System and Water Scheduling

An irrigation head with one controller and two different lines were installed, each consisting of one pump and one sand filtration system per water quality. A UV disinfection lamp was installed to the applied RW. Integral drippers (0.5 m apart) operating at delivery rates of 2.3 L·h−1 were employed. Lateral lines (spaced 0.75 m) were buried at a depth of 0.20 m. Irrigation was performed twice daily by the irrigation controller, and irrigation time varied weekly according to ETo information. Each irrigation period applied the irrigated water volumes (Table 1), which were calculated according to CROPWAT [18] by employing a mean of 90% to the ETo data given by the weather station of Santa Cruz [16]. The same water volume was applied for both SDI and DI, with a total water quantity equivalent to 21,257 m3·ha−1 for the whole study period (equaling 13,047 m3·ha−1 per year).

2.3. Water Quality

RW was supplied by a low-energy wastewater treatment plant (WWTP) adapted to rural villages in Cape Verde. This plant consists of a pretreatment area, an anaerobic digester as the primary treatment, and a series of vertical flow gravel filtration beds as the secondary treatment. Despite being designed to treat 1000 m3 per day, presently, this WWTP effectively treats 200 m3 per day [19]. RW (used in T1, RWSDI and T2, RW DI) parameters pH, electrical conductivity (EC), chemical oxygen demand (COD), biochemical oxygen demand (5 days, BOD5), nitrate NO3, Cl, Na+, Ca2+, Mg2+, B, total suspended solids (TSS), and sodium adsorption ratio (SAR) (Table 2) were analyzed by INLAB at the Laboratorio Agroalimentario del Cabildo de Gran Canaria (LabGC). CW quality (T3, CWSDI) was obtained from the wells close to the experimental plot (wells PT33 and FT59), which were analyzed by LabGC, including sulfate (SO42−) and microelements (Table 3).

2.4. Soil Analysis

The soils of the experimental parcel were Torriarents, isoperthermic [20], or Anthrosols, with qualifiers “irragric” and “salic” [21]. The parcel was divided into three blocks, with loam to clay–loam textures, consisting of 26.8%, 27.1%, and 35.3% clay, 29.4%, 29.8%, and 27.1% silt, and 43.8%, 43.1%, and 37.6% sand for Blocks 1, 2, and 3, respectively. As previously described in Mendoza-Grimón et al. [17], the composite soil samples from each plot (one per block and, thus, three per treatment) were taken from the first 0.2 m on different dates, i.e., prior to manure application (May 2017), post manure application (Nov 2018), seeding day (Apr 2019), which coincided with the first harvest (Jul 2019), and 1 month after the last harvest (Dec 2020). To determine the effect of treatments on soil properties through depth, an additional sampling procedure was applied in December 2020. Soil sampling was conducted considering two depths: topsoil from 0 to 0.07 m and from 0.07 to 0.2 m. Organic C (OC, %) and total N (Ntot, %) were determined by dry combustion with a LECOTM TruMac NC analyzer. Soluble salts were estimated by electrical conductivity (EC1:5, soil-to-water ratio; dS·m−1) with shaking as the equilibration method. The equivalent EC values in the saturated paste extract (ECe) were estimated using the relations obtained by Yangbo et al. [22]. Available nitrate was determined by soil extraction, at the 1:5 ratio, with 0.01 M Ca chloride, and was analyzed by ion chromatography. Available soil P (mg·kg−1) was extracted by sodium bicarbonate according to the method of Olsen [23], and was measured using the “Murphy and Riley colorimetric method” [24]. Exchangeable cations (K, Ca, Mg, and Na, meq·100 g−1) were extracted with buffered 1 M ammonium acetate at pH 7 to be analyzed by ICP-OES. To estimate Fe, Cu, Mn, and Zn (mg·kg−1) availability, the diethylene triamine penta acetic acid (DTPA)/triethanolamine (TEA).CaCl2 method was followed. Analyses were performed using ICP-OES. B was extracted using the hot-water method and analyzed using ICP-OES. All the parameters were determined at LabGC.

2.5. Forage Production

For each harvest and in every plot, fresh matter production was weighed in the field from 1 m of three central lines to avoid the border effect. Then, fresh yield was expressed as equivalent kg/ha. Once constant weight reached 105 °C in a laboratory oven, the percentage of dry matter was calculated. The yield weighed at each harvest was expressed as both fresh and dry matter, being the product of fresh yield multiplied by the dry matter percentage. A new variable for irrigation water use efficiency (WUE; L/kg dry matter) was calculated by dividing the amount of irrigation water used during each harvest by the dry matter obtained in each block and treatment. Lastly, the accumulated yield (expressed as fresh and dry) was calculated as a sum of the respective yield by harvests per block and treatment.

2.6. Statistical Analysis

In order to analyze soil parameters, a multivariate analysis of variance was carried out using the SPSS statistical package (version 27, Armonk, NY, USA: IBM Corp.) by applying the generalized linear model (GLM). The model included the date of soil sampling, treatment, and their interactions. F tests were performed on the basis of linearly independent pairwise comparisons among the estimated marginal means. Levene’s test of equality of error variances was used to analyze the experimental data. Considering the whole experimental period (from June 2017 to December 2020), soil parameters pH, EC, Ntot, nitrate, P, K, Ca, Cu, and Mn showed that the error variance was not equal across groups. Separation subsets were tested by considering p = 0.05 using Tukey’s and Games–Howell tests for homogeneous and nonhomogeneous variances, respectively. To discriminate soil P separation subsets, p = 0.1 was used due to the low P mobility in soil.
Crop yield and dry matter per harvest were analyzed by a multivariate analysis of variance using the generalized linear model, including harvest date, treatment (RWSDI, RWDI, and CWSDI), and their interactions. Levene’s test was used to analyze the forage data, and separation subsets were tested by considering p = 0.05 with Tukey’s and Games–Howell tests. Lastly, the nonparametric Kruskal–Wallis test analyzed the effect of treatments.

3. Results

3.1. Water Quality

Cape Verde has a regulation [6] to control water quality for irrigation purposes. It aims to protect health public and animal life, the quality of surface waters and groundwater, crops that can be affected by poor quality irrigation water, and soils whose suitability for plant growth can be degraded by using systems with poor-quality irrigation water. This regulation establishes the maximum admissible value (VMA) and the maximum recommended values (VMRs) for some parameters according to the risk inherent to the form of use or being in contact with irrigated crops. It also defines the parameters applied to control the agronomic quality of irrigation water in terms of those that may impact soil and water for three restriction levels, regardless of the origin of water. The recommendations of Ayers and Westcot [25] are followed by this regulation, although these authors mentioned that their guidelines are too restrictive for specialized irrigation methods, such as localized DI, which results in near daily irrigations.
Considering the aforementioned Cape Verde regulation [6], the RW parameters (Table 2) included the following use limitations: (i) nitrate, Cl, and Na presented severe use restrictions; (ii) Mg presented values higher than the VMA. Otherwise, EC had a slight to moderate use restriction, while SST, SAR, and Ca presented no use restriction and were below the VMA.
For CW (Table 3), the following limitations were detected: only nitrate presented severe use restriction, and EC and Na had slight to moderate use restriction. The three parameters were below the VMA, but above the VMR, while SAR and Cl had no restriction use. Sulfate, B, Cu Zn, and Mg were below the MRVs, while Fe and Mg were under the VMA.

3.2. Soil

Table 4 presents soil evolution due to manure incorporation, forage cultivation, irrigation, and the employed water quality.

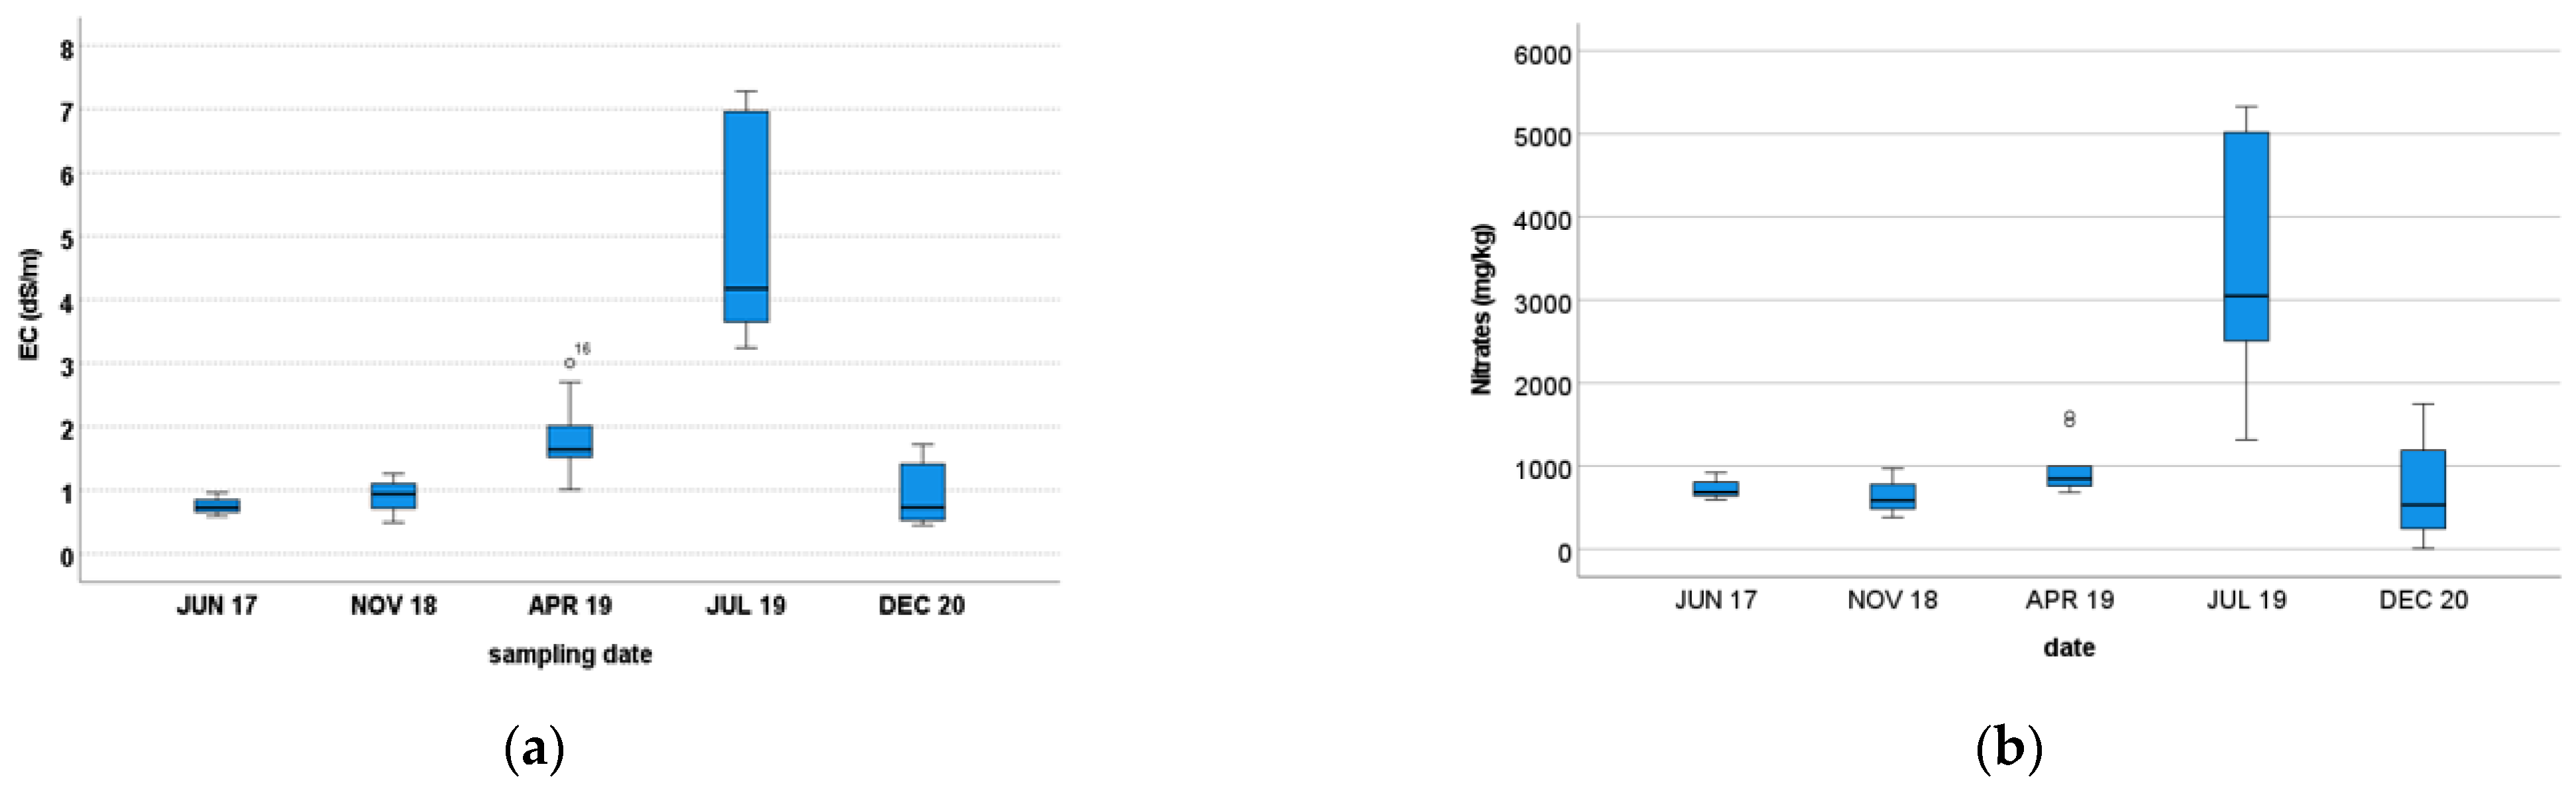
3.2.1. Soil Salinity and Nitrate

Figure 1 shows the soil EC and nitrate evolution over time (mean of the whole experimental field), including prior to (Jun 2017) and post manure additions (Nov 2018), and once irrigation treatments had been applied (Apr 2019, Jul 2019, and Dec 2020). The pH values showed a different trend (Figure S1), which rose and lowered in the opposite way to EC according to the general effect of salts on the pH values.
Regarding treatments, the soils irrigated with RWSDI presented significantly higher EC (Table 4) and nitrate, N tot, and B contents (Figure 2) than CWSDI, while the RWDI soils were no different than the other two treatments. Lastly, when comparing treatments per date, the soils irrigated by RWSDI had the significantly highest EC contents in Jul 2019 and B in Dec 2020 (Table 4, different letters). The same tendency of having higher nitrate, Na, and B contents in the 0.07 m topsoil, compared to 0.07–0.2 m (Table S3), was observed for both the treatments irrigated by SDI (RWSDI and CWSDI). Conversely, lower contents of the aforementioned parameters were obtained from topsoil at depth by DI. Furthermore, as expected, the RW-irrigated soils had higher values for the abovementioned soil parameters than the CW-irrigated ones.

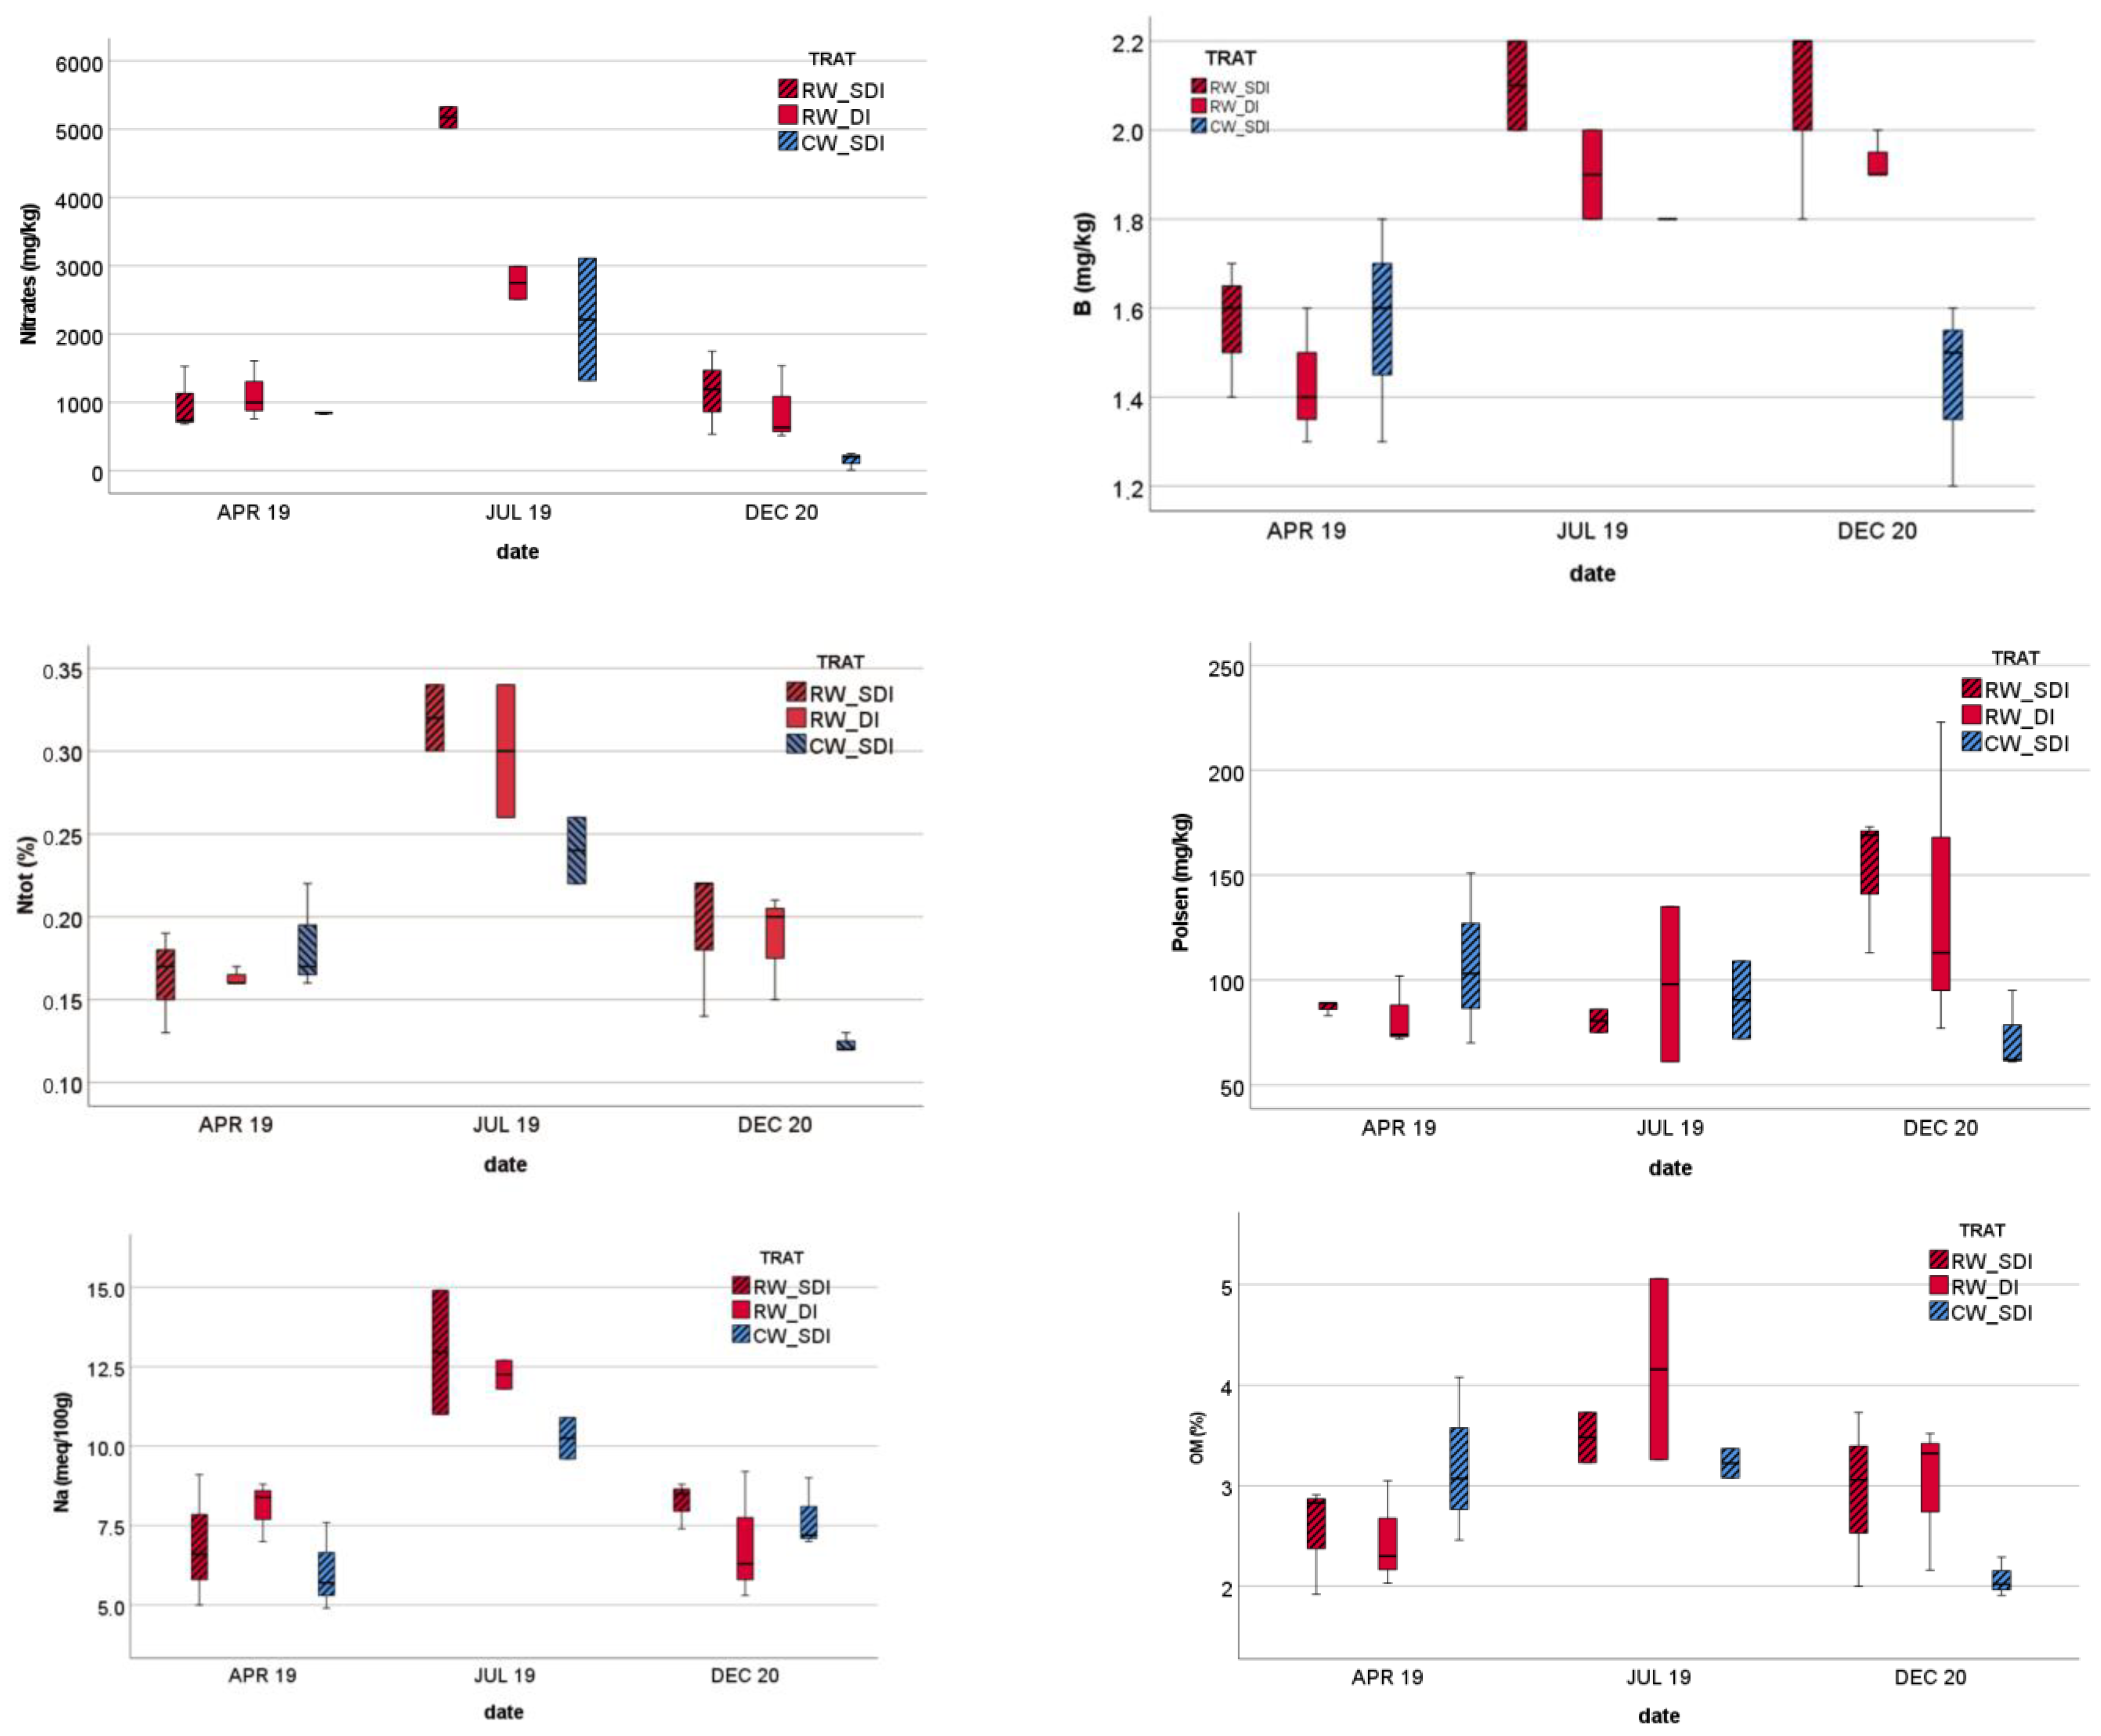
3.2.2. Soil C, N, and Nutrients

As presented in Table 4, only soil Ca and Cu (Figure S1) did not show any significant changes throughout the period (from Apr 2017 to Dec 2020).
Soon after manure addition, gradual increments were observed for Ntot, OM, P, B (Figure S1), and Mn, which were significant upon seeding (prior to irrigation): OM, Ntot, C/N (Figure S1), P, K, and micronutrients B, Mn, and Zn. Furthermore, the marked increases in OM, Ntot, Nitrate, Mg, Na, and B and Zn as irrigation progressed seemed to be associated more with irrigation than with manure addition. After the 2019 and 2020 rainy seasons (121 L·m−2 and 221 L·m−2 of rain, respectively), the values of the most mobile compounds (EC, nitrate, and Na) and of OM, Ntot, Mg, and Mn decreased, and were similar to those of prior to irrigation. Only P, B, and Fe contents increased throughout the experiment, even after rainy periods. Table 5 presents SAR values, which were calculated using data from Table 4.
With SAR values, always less than 2.99, there is no risk regarding SAR (Table 5); hence, soil permeability is not expected to be affected with the proposed water and soil management. Finally, at the end of the experiment, the contents of fertility parameters such as OM and Ntot, and of nutrients such as P, K, Fe, and Zn increased in soil, while precautionary parameters such as EC (Figure 1a), nitrate (Figure 1b), and Na returned to the initial values. Only B, which was not lixiviated from soil during the rainy season, had to be carefully monitored, although its value of 1.8 mg·kg−1 did not come close to the value considered hazardous, i.e., 5 mg·kg−1 [26].

3.3. Forage Production

The fresh yield (expressed as equivalent kg of fresh matter (FM)·ha−1) and dry yield (kg dry matter (DM)·ha−1) obtained per harvest and treatment appear in Table 6 and Table 7, respectively. Regarding fresh matter production (Table 6 and Figure S2) over time, the last harvests (Sept and Nov 2020) were significantly more productive than the others being affected by decreased soil salinity, as later discussed. The yield obtained during some harvests showed no differences among treatments, whereas, on other dates, the SDI treatments were significantly more productive for both RW and CW compared to DI (Table 6). Consequently, the SDI treatments considered throughout the experiment were significantly higher than those of DI. These results were confirmed by nonparametric tests (Figure S2).
Dry matter yields showed more significantly different dates than fresh matter ones (Table 7 and Figure S2). By way of example, the dry matters obtained in Nov 2020 and in Dec 2019 and Sep 2020 were significantly higher than for the other harvests. Despite the Dec 2019 fresh matter (FM) yield not being significantly higher than the rest, the high percentage of dry matter (60.6%) due to the long period before harvesting (110 days) can explain this result. As the dry matter percentage showed no differences among treatments, its DM production followed the same effect per treatment as FM (Figure S2).
Table 8 shows that the lowest WUE values, with means of 97 and 132 L·kg−1 DM for Sept 2020 and Nov 2020, respectively, coincided with the more productive harvests (Table 5), which already had a developed root system and grew in fertile soils capable of providing them with water and nutrients. Table 8 also indicates that the WUE of RWSDI, with a mean of 182 L·kg−1 DM, was significantly more efficient than the other two treatments. Albeit not significantly higher, CWSDI was 21% more efficient than RWDI (Figure S2). Consequently, RWSDI is the better option for water quality and management because it was more productive and efficient.
Figure 3 depicts the curvilinear relation between irrigation WUE (L·kg−1 dry matter) and yield (kg FM·ha−1), which is valid for all treatments. It shows how many results had a WUE < 200 L·kg−1 DM, and that it was not easy to obtain WUE values below 100 L·kg−1 DM.
Accumulated yield (expressed as fresh and dry, Figure 4a,b) clearly showed that production was higher for irrigation by SDI regardless of the employed water quality. Figure 4 also illustrates that a large amount of forage can be obtained using efficient irrigation (300 t FM·ha−1 for SDI vs. 225 t FM·ha−1 for DI for the whole study; 200 t FM·ha−1 and year vs. 150 t FM·ha−1 and year). Therefore, on a semiarid island where forage scarcity limits livestock production, RW reuse represents an important resource to increase profitability and resilience.

4. Discussion

4.1. Water

Ayers and Westcott [25] mentioned that their guidelines are too restrictive for drip irrigation, which leads to safe irrigation with high EC, Cl, and Na values, and allows reassigning from severe to moderate use restriction to, therefore, avoid problems when water is properly managed.
To properly determine the harmfulness of nitrate, which is basically related to aquifer contamination in the study area, water movement through the unsaturated zone and plant absorption should be considered. Regulations are usually developed in humid zones, where temperate species with fewer N needs are cultivated. In semiarid and arid regions, best-adapted farmers carefully manage water using DI and cultivate warm species with high N demand. Under these agro-climate conditions, N lixiviation is less likely to reach aquifers. Hence, regulations should be revised in relation to this parameter. The Cape Verde regulation indicates that, given the interaction of factors such as soil, climate, cultural practices, irrigation methods, and crops, the indicated VMAs may be exceptionally exceeded and approved by the pertinent authority on the basis of water–soil plant biosystem monitoring.
In summary, both water RW and CW present good quality for the intended use and management, although N balance must be carefully developed case by case.

4.2. Soils

4.2.1. Soil C, N, and Nutrients

Some fertility parameters (OM, Ntot, P, K, Fe, and Zn) increased in soil from not only manure addition, but also as a main consequence of irrigation. These parameters increased even in the CW-irrigated soils, although this water did not provide these nutrients. While the OM content of soils in arid regions is usually low under natural conditions, it frequently increases with irrigation water applications and cultivation, especially when crop management is good [27]. Previous studies [28] have reported increased microbiological activity due to constant water availability, which can explain these increased availability results for soil nutrients. Albeit not significant, Ntot and Na contents were, respectively, 50% and 6% higher in the soils irrigated with RW than with CW according to the cited authors. Contrarily to their results, orthophosphate displayed a tendency to increase in RW soils in December 2020, mainly in SDI (Figure 2), probably because microbial activity had enough time to mobilize the P added by RW once the SDI system had increased phosphorous mobility. As previously noted for this case study [17], overall soil fertility increased in the proposed water reuse system. Installing a DI system on soils has a positive effect, which is sustainable by using a new and renewable resource (RW), even though water is classified as a moderate use restriction.

4.2.2. Soil Salinity and Nitrate

In line with Palacios-Diaz et al. [28], salinity rose and was more remarkable in RWSDI than in RWDI or CWSDI (Figure 2). The highest EC saturated extract (ECSE) equivalent values of soil were calculated for July 2019: 22–23 dS·m−1 in the RWSDI soils, while these values ranged from 12 to 14 dS/m in CWSDI. The lowest ones (recorded in December 2020) were about 4 dS·m−1 in the CWSDI soils, from 5 to 7 dS·m−1 in the RWSDI soils, and 5 dS·m−1 in the RWDI soils. These values are similar to those measured before irrigation (from 4 to 6 dS·m−1). These are expected results because the soil from the December 2020 soil sampling was taken at the end of the rainy season. The nitrate capillary rise from the treated water irrigated by SDI can explain this result (nitrate was significantly higher at 10% in the RWSDI soil), while Na was similar in both irrigation systems. Hence, no nitrate leaching by this system was expected beyond the rainy period, which lowered the nitrate contamination risk. This renders sorghum an optimal crop for being a C4 salinity-tolerant grass capable of absorbing large quantities of nitrate. Further discussion on N and nitrate appears after analyzing the yield results.
As the data from the soils sampled in December 2020 demonstrate, irrigation water management can be optimized to not only prevent soil salinity build-up by leaching salts, but to also promote nitrate uptake by plants. As SDI has a limited leaching capacity by increasing EC values mainly on the surface [28,29], it is necessary to make the best of the rainy season. Irrigating to compensate for ET without accounting for rain provides soil with excess water. This water management is the simplest way to decrease soil salinity with SDI by putting rainwater for salt leaching to good use. It also coincides with that recommended by Maas and Grattan [30], who highlighted the advantages of imposing water management practices that allow salinity profiles to change over time. Furthermore, mainly in summer and by means of SDI systems, cultivating moderate to tolerant saline species with high N demands is recommended to avoid salinity and nitrate leaching problems. As most species are salt-sensitive during the emergence period and salt concentrates in topsoil by SDI systems, an additional mobile irrigation system might be needed during the seeding period.
Cape Verde regulations indicate the possibility of monitoring the water–soil plant biosystem to quantify the amount of fertilizer to be annually applied, in addition to the nutrients present in irrigation water, and to evaluate the effect of irrigation on the chemical characteristics of soil and water sources. Therefore, considering the aforementioned regulations and the results of this study, it is possible to irrigate sorghum by a drip system and treated water by the Santa Cruz WWTP without adding fertilizers.
The salt content of soils above which plant growth is affected depends on several factors, including soil texture, salt distribution in the profile, salt composition, and plant species [27]. For spatial distribution purposes, the best effective salinity estimate when salt is not uniformly distributed with depth is either water uptake-weighted salinity in the root zone for high-frequency irrigation purpose [31] or the mean salinity in the root zone [32]. When using SDI, Palacios-Diaz et al. [28] revealed that water management modifies the salt distribution in the profile with salts concentrating in topsoil, which remains dry because salts are transported upwardly by the capillary flow, and the mobility of some substances such as P also increases. This scenario coincides with the results presented in Table S3. Therefore, SDI use affects the salinity threshold tolerated by crops defined for conventional water management. For salt composition, the relation between electrical conductivity and salt contents is variable among several solutions because, depending on the considered salt, higher or lower conductivities than other salts can be obtained at equivalent concentrations [27]. Nitrate is a water component that ordinarily occurs only in very small amounts [30]. Therefore, salt tolerance levels are usually determined for low-nitrate natural water conditions. However, nitrate can be a dominant ion in RWs. By assuming an ionic mobility of 50 mho·cm−1·eq·cm−3 [33], the contribution of nitrate to the EC of the aqueous extract (EC 1:5) ranged between 15% and 30% in this experiment. The highest value was obtained during the June 2017 sampling with the lowest one in April 2019, and it remained at 20% once the crop had grown. Hence, higher salinity tolerance levels can be expected for RW than tabulated for CW quality, as discussed later.

4.3. Forage Production

4.3.1. Yield Affected by Water Quality and Management

As mentioned in Section 1, sorghum production using SDI represents a good opportunity for arid and semiarid regions in developing countries. Murley et al. [34] concluded that SDI can be successful regardless of access to high-precision guidance systems because overall yields are affected more by irrigation and climate conditions, and not by row offsets in relation to SDI tape. They also concluded that yield increased as the row moved closer to the subsurface drip tape, which is a good indication of setting up the irrigation system. In the present study, all the plant rows were close to drip tapes, which ensures high yields if enough water and nutrients are supplied.
Scordia et al. [35] reported that sorghum can yield as much as 27.1 t DM·ha−1 with sufficient resource availability (100% crop evapotranspiration of 798 mm, applied by DI and with enough nutrients) after 163 days between sowing and harvest. Mygdakos et al. [36] evaluated the biomass production of sorghum grown in Greece with DI and SDI with three different amounts of irrigating water. They concluded that SDI performed significantly better than DI in biomass production. Their results revealed the highest average biomass production for full irrigation (609.52 mm) with SDI, a yield of 42,875 kg·ha−1 and a difference of 20.69% that favored SDI more. These authors seeded a longer variety than that seeded in this Cape Verde experiment, which explains the high yields obtained by Mygdakos et al. [36] versus the bigger harvest of this study (24,419 kg·ha−1 in Dec 2020) by SDI with RW. In contrast, these authors only obtained one harvest, while six harvests per year were collected in Cape Verde and yielded 75,000 kg DM·ha−1·year−1. By comparing the results for 100% ET in both studies, SDI presented a range from 20% to 25% higher production than DI. Other studies about yields with SDI [9,37] concluded that farmers can save 25% irrigation water by this system. This fact can explain the lower yields obtained when comparing RW to DI vs. SDI, caused by lower water availability to crop absorption and by greater evaporation losses from topsoil.
Mass and Hoffman [38] pointed out that absolute salt tolerances by plants cannot be established because many interactions among plant, soil, water, and environmental factors influence plants’ ability to tolerate salt. Thus, high atmospheric humidity tends to increase some crops’ salt tolerance. In this experiment, where the mean air humidity was around 71%, a higher salinity threshold than that tabulated could be expected. Moreover, as plants tend to respond to the sum of the osmotic potential of soil solution and the soil matric potential, the more saline soil water is, the more frequent irrigations must be to minimize plant water stress. As the irrigation in this experiment was frequent, it minimized the soil matric potential influence and, therefore, increased salt tolerance. Maas and Grattan [30] included Sorghum bicolor (with a threshold value of ECSE 6.8 dS·m−1 and a 16% decrease in yield per dS·m−1 increase in salinity) in the moderately tolerant field crops group. Dourado et al. [39] showed that sorghum plants osmotically adjust by accumulating solutes and, thus, lower stress. They mentioned that inorganic solutes, such as K, Mg, chloride, and nitrate, all contribute to as much as 52% osmotic adjustment in sorghum plants, while organic solutes contribute approximately 30% osmotic adjustment. They concluded that sorghum appears to adapt to high soil salinity via both osmotic adjustment and stomatal regulation. The increased nutrient availability from soil, as a consequence of frequent irrigation, as well as the nutrients provided by RW, could explain the good yields obtained (Table 6 and Table 7) despite the high soil salinity measured in July 2019 (Table 4).
When reviewing the relation between the N application level and salinity, Kijne et al. [40] found that very few studies report a response to higher N fertilization levels at high salinity than those considered to be optimal levels under non saline conditions. The commonest type of response reported in the literature is either that N addition results in the same relative yield increase at all salinity levels [32], or that the response in relative yield is greater at low salinity levels than at high ones.
In our experiment, sorghum yields were affected by high salinity levels (equivalent ECSE values within a range from 22 to 23 dS·m−1 in RW and from 12 to 14 in the CW sampled in July 2019) because the highest yields were collected at the end of the experiment (in Nov 2020 after salt lixiviation).
After considering the tabulated values by Maas and Grattan [30], the predicted drop in yield would be higher than that obtained. Yet despite the tabulated threshold for 100% yield reduction being exceeded, yield drops were only 39% in RW and 32% in CW (note that the RW soil had twice the salinity than the CW soil in July 2019, but it did not markedly differ between yields). As Rakgotho et al. [41] pointed out, one of the effects of excessive salt is a change in element distribution with a rising Na+/K+ ratio. They demonstrated that this ratio lowered when they used nanoparticles to mitigate salt stress. Therefore, when applying frequent irrigation and using RW, which increased more nutrients such as K (see Table 4) than Na, higher salinity threshold levels can be expected.
Therefore, given high environmental humidity, high irrigation frequency, and the fact that 20% osmotic potential was due to nitrates, having modified plant response to soil salinity, these results demonstrate that it is necessary to conduct more studies to establish new salinity tolerance levels under reuse conditions with SDI.
Karandish and Šimůnek [42] modeled N uptake and the leaching risk in drip-irrigated maize. They determined that nutrient uptake by roots can be calculated from the water uptake values multiplied by the nitrate concentration absorbed by roots, which depends on the soil nitrate concentration and the maximum nitrate concentration of N uptake by roots. Those authors concluded that the optimum fertilization amount was 200 kg N·ha−1, which lowered N leaching below different soil layers (12–99%), but reduced crop N uptake by only 5.4%. As maximum nitrate uptake occurs according to space and time, water management capable of consistently maintaining soluble nitrate in soil and increasing water availability (e.g., when irrigating by SDI with RW) will optimize the N uptake of N-NO3. Accordingly, Ramos et al. [12] cultivated sorghum by DI and fertigation. They reported higher N-NO3 uptakes for more numerous fertigation events, as well as when the amounts applied per event were smaller, as in this experiment.
Karandish and Šimůnek [42] and Scordia et al. [35] cultivated sorghum by DI. They found that dry biomass yield was significantly affected by the irrigation amount, while N fertilization rates had no effect. They also concluded that N-fertilizer uptake was lower with no irrigation treatment, while soil was considerably N-impoverished in the non-fertilization treatment because sorghum was apt to benefit from the soil N reserve agroecosystem. Likewise, our results showed higher dry biomass yields in the SDI treatments (Table 7 and Figure 4), irrespectively of the used water quality. Coinciding with the above-cited authors, the CW soil in our experiment was strongly N-impoverished as a result of sorghum N uptake from the soil N reserve, which lowered contents by half from 0.22 to 0.11 mg N·kg−1 soil (Jul 2019–Dec 2020, Table 4), but allowed high yields. The previous results obtained in this experimental field in 2019 [17] showed significantly higher N contents in the plants irrigated with RW than with CW. Following the 2020 harvests, these authors also obtained higher N contents in the RW plants (data not shown here). Note that low N contents in the CW plants would lower their nutritional value.
This result indicates the need to apply enough N to balance N uptake, as added using RW. The total nitrate amount applied via irrigation water can be calculated using its average concentration and the amount of water applied to fields. When comparing N uptake by plants per harvest and N supplied by irrigation water during different cultivated periods (Table S4), only exceptional N addition exceeded N absorption because a smaller amount of N was applied to soil by RW with SDI than that absorbed by plants. Only in the third harvest (during which an unnecessary amount of water was applied in relation to the obtained yield) was an excessive N quantity applied to soil. With RW and because of the lower collected yield with DI, excess 127 kg N·ha−1 was applied during the experimental period.
After the data analysis, two recommendations can be made: improve information about N contents in water (with at least monthly data) to better calculate the N balance; conserve higher N levels in RW than those regulated to avoid performing additional treatments to RW to lower N (which would increase the water cost). It would, hence, enable farmers to make good use of the N carried by RW. Both the abovementioned salinity excess in RW and the lower N availability in CW vs. RW can explain the similar yields obtained by the studied water qualities using SDI (Figure 4). Despite the maximum contents controlled by the Cape Verde reuse regulation, the high N uptake shown by the C4 plants recommends legally admitting higher nitrate levels (exceeding the VMA) in treated water. This rise in N limits avoids the need for costly water treatments, and without affecting groundwater quality, as long as RW management, like that herein applied, is used. A similar conclusion was reached by Shahrivar et al. [43]. Their study demonstrated that a relatively higher C4 grass (Pennisetum clandestinum) yield (16,241 kg DM·ha−1) without any fertilizer types is possible with recycled water irrigation using secondary treated wastewater. Those authors also pointed out that while irrigation with recycled water and advanced treatment was more costly, it did not result in increased yields. Palacios et al. [44] also concluded that a high effluent desalinization cost may not be necessary and might, in fact, be harmful. Indeed, due to the high N uptake by a C4 grass in the Macaronesian zone, Palacios-Diaz et al. [45] recommended increasing the maximum N limits to be added to soil, which are authorized in regulations. Therefore, in these conditions, the results demonstrate that the irrigation system was more important than the used water quality. Hence, this fieldwork proves that it is possible to produce forage irrigated by RW sustainably if proper design and water management are applied.

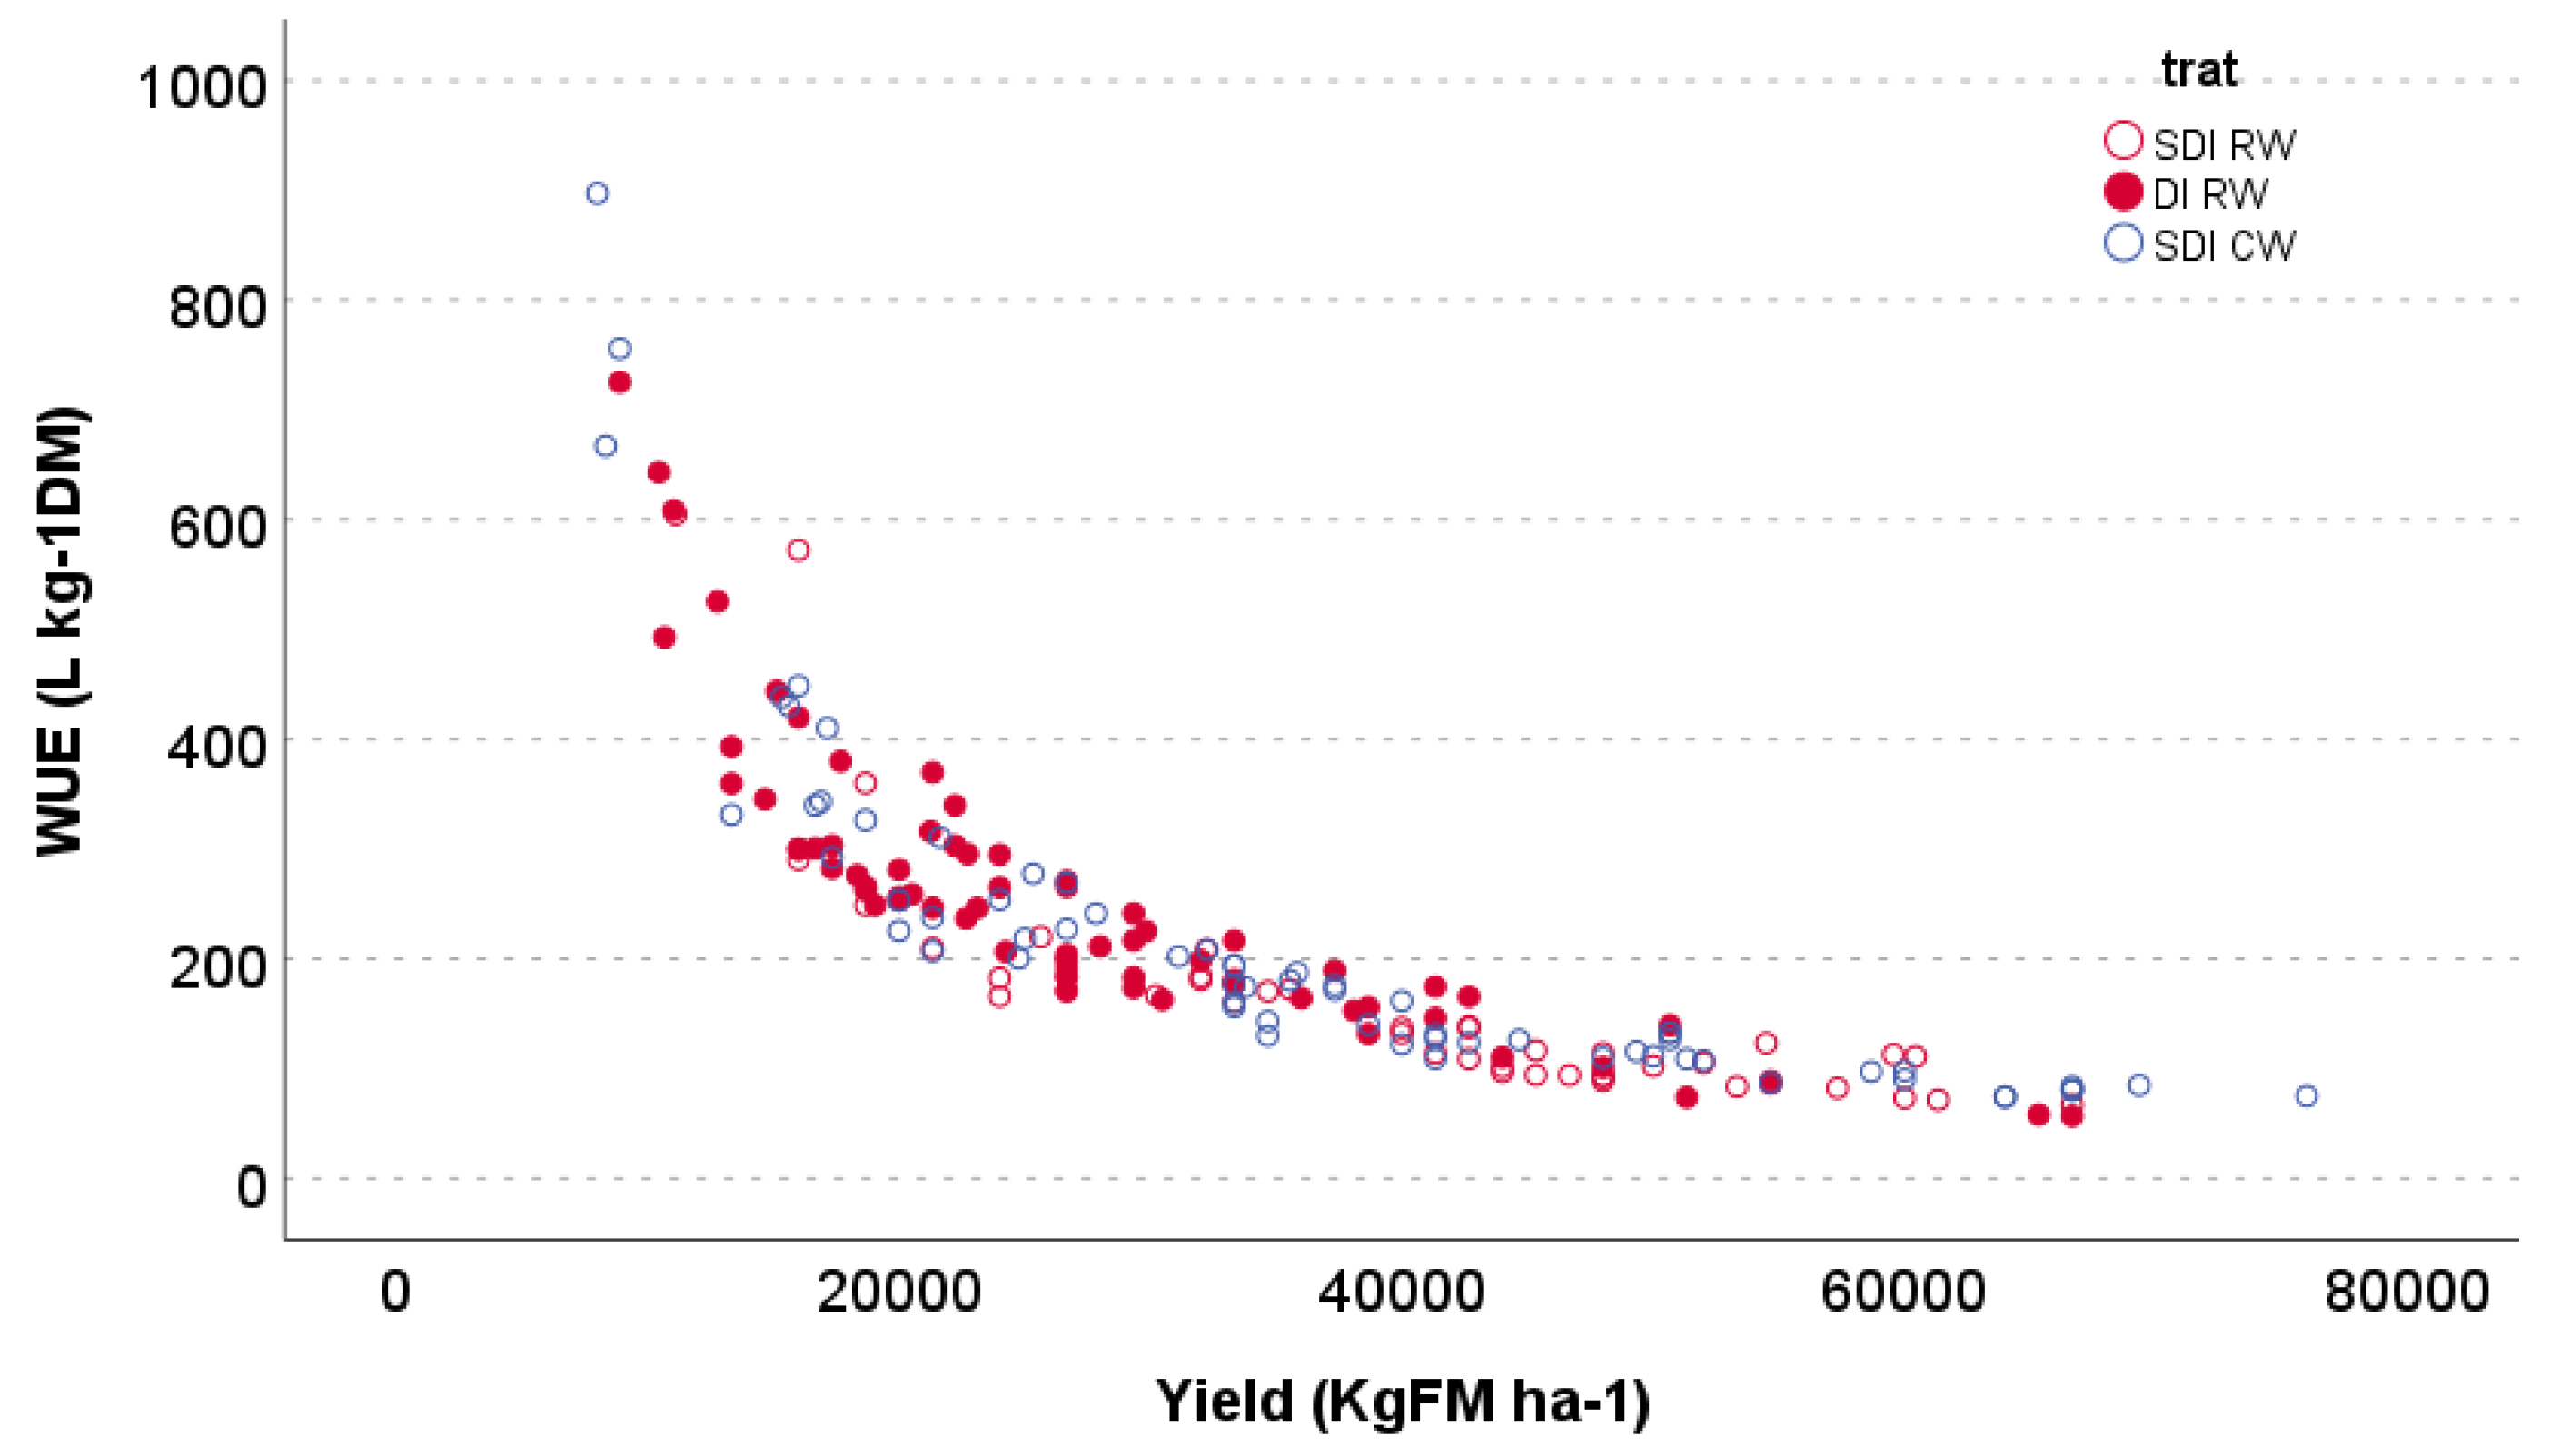
4.3.2. Irrigation Water Use Efficiency

When attempting to adapt irrigation sustainability to climate change in water-scarce regions, some of the adaptation/mitigation measures to be taken increase water productivity, the use of nonconventional irrigation waters, crop diversification, and crop rotation [46]. Two of these recommendations (increased WUE and RW use) were herein applied. Nikolaou et al. [46] presented a table that included WUE (expressed as kg/m3) for several crops and growth conditions. To compare our results to those presented by those authors, our data are herein expressed as kg·m−3. When we varied treatments and harvests, our values went from 2.7 to 11.8 (RWSDI), from 2.3 to 8.6 (RWDI), and from 3.1 to 10.9 (CWSDI). As previously pointed out, SDI RW was clearly the most efficient treatment. Furthermore, albeit not significantly higher, CWSDI was 21% more efficient than RWDI. This means that DI obtained the lowest values. In fact, when comparing our WUE data to those presented by Nikolaou et al. [46] (including the results of irrigating by DI), greater efficiency was achieved in this experiment than when cultivating horticultural crops under open field conditions (from 1 to 7 kg·m−3), which fell within the WUE range when growing in low tunnels.
By comparing the best WUE of 100 L·kg−1 DM shown in Figure 3 to the best value obtained by Bhattarai et al. [47], and after transforming their best value from 120 kg FM·ha−1·mm−1 into 238 L·kg−1 DM, their data showed higher water use for every kg of dry matter. Bazaluk et al. [48] cultivated sorghum in the Ukraine. They reported WUE values of 115 kg FM·ha−1·mm−1 under rain-fed conditions with 350 mm, which is the equivalent to 703 L·kg−1 DM. The best WUE value obtained by them was 140 kg FM·ha−1·mm−1 under rain-fed conditions with 500 mm, and WUE was clearly worse than the values herein obtained. As our experiment was run under optimal climate and soil and water availability conditions, we argue that it is difficult to obtain a WUE value < 100 L·kg−1 dry matter for sorghum.

5. Conclusions

Our fieldwork demonstrates that it is possible to produce forage irrigated by RW sustainably if proper design and water management are applied. Considering the Cape Verde regulations, it is possible to irrigate sorghum by a drip system and treated RW from the Santa Cruz WWTP without adding fertilizers. The contents of the fertility parameters, such as OM and Ntot, and nutrients, such as P, K, Fe, and Zn, increase in soil, while risky parameters such as EC, nitrate, and Na return to their initial values after the rainy season. Only B has to be carefully monitored, but its value is far from the value considered to be dangerous.
Despite the maximum nitrate contents regulated in the Cape Verde reuse regulation, the high N uptake shown by the C4 plants recommends legally admitting higher nitrate levels (exceeding the VMA) in treated water to irrigate C4 species, which would avoid the need for costly advanced treatments, and would not affect groundwater quality. In fact, despite the advanced wastewater treatment to decrease nitrate being more expensive, it would not result in either increased yields or better groundwater protection compared to RW use with appropriate N balance. To avoid nitrate leaching and, therefore, groundwater contamination, it is necessary to improve RW quality information because at least monthly N contents are needed to calculate the N balance.
This pilot project also revealed the possibility of producing 200 t FM·ha−1·year−1. Hence, on a semiarid island where forage scarcity limits livestock production, RW use represents an important resource to increase both profitability and resilience. The best irrigation WUE was obtained by RWSDI, with values under 200 L·kg−1 DM compared to RWDI, which needed 34% more water to produce every kilogram of dry matter.
The results demonstrate that it is necessary to conduct more studies to establish new salinity tolerance levels under reuse conditions with SDI. Especially in arid and semiarid regions, it is also necessary to irrigate in rainy months to promote the lixiviation of accumulated salts. Mainly in summer by means of SDI systems, cultivating moderate to tolerant saline species with high N demands is recommended to avoid salinity and nitrate leaching problems. As most species are salt-sensitive during the emergence period, and salt concentrates in topsoil when using SDI systems, additional mobile irrigation systems might be necessary during the seeding period.
The yield response functions of RW management and unconventional salt equilibrium, in which nitrate acts as one of the major constituents transported by RWs, should be known to establish the environmental, economic, and political implications of the agronomic and irrigation practices to be implemented. In this context, a high nitrate elimination rate from wastewater in treatment plants might not be desirable if agricultural reuse is planned. More studies to determine emerging contaminants should be performed to completely evaluate the sustainability of RW reuse.

Supplementary Materials

The following supporting information can be downloaded at https://www.mdpi.com/article/10.3390/agriculture13010192/s1, Figure S1. Soil parameters evolution over time: prior to (Jun 2017) and post manure use (Nov 2018) upon seedling (April 2019), after the first harvest (Jul 2019), and 1 month after the last harvest (Dec 2020); Figure S2. Yield (expressed as fresh and dry matter, kg·ha−1) and WUE (L·kg−1 of DM) obtained per treatment and over time; Table S1. Precipitation (Prc) and potential evapotranspiration (ETo): averaged since 1982, driest and wettest year, averaged since 2007 (last 15 years), and daily ETo during both the aforementioned periods; Table S2. Monthly precipitation and ETo from the last 15 years and wet period determination; Table S3. Soil parameter comparison at the end of the experiment between topsoil (0–0.07 m) and deeper soil (0.07–0.2 m); Table S4. Nitrogen balance, according to comparison of N uptake by green plants per harvest and N supplied by irrigation water during different cultivated periods.

Author Contributions

Conceptualization, M.d.P.P.-D., J.R.F.-V., J.M.H.-M. and V.M.-G.; methodology, M.d.P.P.-D., J.R.F.-V., R.A. and V.M.-G.; validation, M.d.P.P.-D., J.R.F.-V. and V.M.-G.; formal analysis, M.d.P.P.-D., J.M.H.-M., R.A. and V.M.-G.; investigation, M.d.P.P.-D., J.R.F.-V., R.A. and V.M.-G.; resources, M.d.P.P.-D. and V.M.-G.; data curation, M.d.P.P.-D., J.R.F.-V., J.M.H.-M., R.A. and V.M.-G.; writing—original draft preparation, M.d.P.P.-D., J.R.F.-V., J.M.H.-M. and V.M.-G.; writing—review and editing, M.d.P.P.-D., J.R.F.-V., J.M.H.-M., R.A. and V.M.-G.; supervision, M.d.P.P.-D.; project administration, M.d.P.P.-D., R.A. and V.M.-G.; funding acquisition, M.d.P.P.-D. and V.M.-G. All authors have read and agreed to the published version of the manuscript.

Funding

This research was funded by the European Regional Development Fund, FEDER, the Interreg MAC 2014–2020 Program (ADAPTaRES (MAC/3.5b/102) http://adaptares.com/es/ (accessed on 15 November 2022), MITIMAC (MAC2/1,1a/263) https://mitimac.com/ (accessed on 15 November 2022), and Proyecto Puente (Ref CEI2020-02), funded by the Consejería de Economía, Industria, Comercio, y Conocimiento del Gobierno de Canarias.

Institutional Review Board Statement

Not applicable as studies did not involve humans or animals.

Data Availability Statement

The data presented in this study are available upon request from the corresponding author.

Acknowledgments

We thank the cooperation of the Laboratorio Agroalimentario del Cabildo de Gran Canaria, Instituto Tecnológico de Canarias (ITC), especially Gilberto Martel for his help and project administration, SISTEMA INGENIERIA, INDUS, AdS, ANAS, Ministerio Agricultura Cabo Verde, and INIDA.

Conflicts of Interest

The authors declare no conflict of interest. Funders played no role in the design of the study; the collection, analyses, or interpretation of data; the writing of the manuscript, or the decision to publish the results.

References

  1. Palacios-Diaz, M.D.P.; Mendoza-Grimón, V.; Garcia, A.D.V. Influence of Policy Making in the Profitability of Forage Production Irrigated with Reclaimed Water. Water 2015, 7, 4274–4282. [Google Scholar] [CrossRef] [Green Version]
  2. Duarte, M.C.; Romeiras, M.M. Cape Verde Islands. In Encyclopedia of Islands; University of California Press: Berkeley, CA, USA, 2009; Available online: https://www.researchgate.net/publication/231168292_Cape_Verde_Islands (accessed on 25 July 2020).
  3. Food and Agriculture Organization (FAO). 2022. Available online: https://www.fao.org/countryprofiles/index/en/?iso3=CPV&paia=2 (accessed on 25 July 2020).
  4. Monteiro, F.; Fortes, A.; Ferreira, V.; Pereira Essoh, A.; Gomes, I.; Correia, A.M.; Romeiras, M.M. Current Status and Trends in Cabo Verde Agriculture. Agronomy 2020, 10, 74. [Google Scholar] [CrossRef] [Green Version]
  5. Mendoza-Grimón, V.; Fernández-Vera, J.R.; Hernández-Moreno, J.M.; Palacios-Díaz, M.D.P. Sustainable Irrigation Using Non-Conventional Resources: What has Happened after 30 Years Regarding Boron Phytotoxicity? Water 2019, 11, 1952. [Google Scholar] [CrossRef] [Green Version]
  6. Decreto Regulamentar n° 4/2020. Série—No 24 «B.O.» da República de Cabo Verde. Critérios e os Parâmetros Para Controlo da Qualidade da Água Para Rega, Águas de Origem Superficial ou Subterrânea, Dessalinizada, Águas Pluviais Recuperadas ou Águas Residuais Tratadas, Com o Objetivo de Satisfazer ou Complementar as Necessidades Hídricas de Culturas Agrícolas, Florestais, Ornamentais, Viveiros, Relvados e Outros Espaços Verdes, Previamente à Adição de Fertilizante. Available online: https://kiosk.incv.cv/1.1.24.3139 (accessed on 10 October 2022).
  7. Palacios, M.P.; Mendoza-Grimón, V.; Fernández, F.; Fernández-Vera, J.R.; Hernández-Moreno, J.M. Sustainable Reclaimed Water Management by Subsurface Drip Irrigation System: A study case for forage production. Water Pract. Technol. 2008, 3, wpt2008049. [Google Scholar] [CrossRef]
  8. ISRA. Fiches Techniques. In Institut Sénégalais de Recherches AgricolesFiches Variétales Niébé & Sorgho; ISRA: Dakar, Senegal, 2015; Volume 8, ISSN 0850-9980. [Google Scholar]
  9. Mendoza-Grimón, V.; Fernández-Vera, J.R.; Silva, G.D.; Semedo-Varela, A.; Palacios-Díaz, M.D.P. Cape Verde (West Africa) Successful Water Reuse Pilot Project: A Sustainable Way for Increasing Food Production in a Climate Change Scenario. Water 2021, 13, 160. [Google Scholar] [CrossRef]
  10. Mendoza-Grimón, V.; Hernández-Moreno, J.M.; Palacios-Díaz, M.D.P. Improving Water Use in Fodder Production. Water 2015, 7, 2612–2621. [Google Scholar] [CrossRef] [Green Version]
  11. Farneselli, M.; Benincasa, P.; Tosti, G.; Simonne, E.; Guiducci, M.; Tei, F. High fertigation frequency improves nitrogen uptake and crop performance in processing tomato grown with high nitrogen and water supply. Agric. Water Manag. 2015, 154, 52–58. [Google Scholar] [CrossRef]
  12. Ramos, T.B.; Šimůnek, J.; Gonçalves, M.C.; Martins, J.C.; Prazeres, A.; Pereira, L.S. Two-dimensional modeling of water and nitrogen fate from sweet sorghum irrigated with fresh and blended saline waters. Agric. Water Manag. 2012, 111, 87–104. [Google Scholar] [CrossRef]
  13. Marinov, I.; Marinov, A.M. A coupled mathematical model to predict the influence of nitrogen fertilization on crop, soil and groundwater quality. Water Resour. Manag. 2014, 28, 5231–5246. [Google Scholar] [CrossRef]
  14. Shrestha, R.K.; Ladha, J.K. Nitrate pollution in groundwater and strategies to reduce pollution. Water Sci. Technol. 2002, 45, 29–35. [Google Scholar] [CrossRef]
  15. Azad, N.; Behmanesh, J.; Rezaverdinejad, V.; Abbasi, F.; Navabian, M. Developing an optimization model in drip fertigation management to consider environmental issues and supply plant requirements. Agric. Water Manag. 2018, 208, 344–356. [Google Scholar] [CrossRef]
  16. Food and Agriculture Organization (FAO). AQUASTAT Climate Information Tool. Available online: https://aquastat.fao.org/climate-information-tool/climate-data?lat=15.145455259654996&lon=-23.540149773372228 (accessed on 26 September 2022).
  17. Mendoza-Grimón, V.; Amorós, R.; Fernández-Vera, J.R.; Hernádez-Moreno, J.M.; Palacios-Díaz, M.D.P. Effect of Different Water Quality on the Nutritive Value and Chemical Composition of Sorghum bicolor Payenne in Cape Verde. Agronomy 2021, 11, 1091. [Google Scholar] [CrossRef]
  18. Smith, M. CROPWAT: A Computer Program for Irrigation Planning and Management; FAO Irrigation and Drainage Paper 46; Food and Agriculture Organization of the United Nations: Rome, Italy, 1992; ISBN 29251031061. Available online: http://www.fao.org/land-water/databases-and-software/cropwat/es/ (accessed on 10 March 2021).
  19. ANAS. Estação de Tratamento de Águas Residuais “ETAR” Cabo Verde. In Estudo e Caracterização; Departamento de Gestão de Recursos Hídricos e Saneamento “DGRHS”. Agência Nacional de Água e Saneamento “ANAS”; 2016. Available online: www.http://anas.gov.cv (accessed on 10 March 2021).
  20. Soil Survey Staff. Keys to Soil Taxonomy, 8th ed; USDA, NRCS, Lincoln: Lincoln, NE, USA, 1998. [Google Scholar]
  21. IUSS Working Group WRB. World Reference Base for Soil Resources 2014, Update 2015. International Soil Classification System for Naming Soils and Creating Legends for Soil Maps; World Soil Resources Reports No. 106; FAO: Rome, Italy, 2015. [Google Scholar]
  22. Yangbo, H.; Thomas, D.; David, H.; Xinhua, J.; Wysocki Douglas, A. Predicting ECe of the saturated paste extract from value of EC1:5. Can. J. Soil Sci. 2013, 93, 585–594. [Google Scholar] [CrossRef]
  23. Olsen, S.R.; Sommers, L.E. Phosphorus. In Methods of Soil Analysis. Part2. Chemical and Microbiological Properties, Agronomy Monograph 9.2; Miller, R.H., Keeney, E.R., Eds.; America Society Agronomy, Inc.: Madison, WI, USA; Soil Science of America, Inc.: Madison, WI, USA, 1982; pp. 1035–1049. [Google Scholar]
  24. Murphy, J.; Riley, J.P. A modified single solution method for the determination of phosphate in natural waters. Anal. Chim. Acta 1962, 27, 31–36. [Google Scholar] [CrossRef]
  25. Ayers, R.S.; Westcot, D.W. Water Quality for Agriculture; FAO Irrigation and Drainage, Paper 29; Food and Agriculture Organization: Rome, Italy, 1985.
  26. Nable, R.O.; Banuelos, G.S.; Paull, J.G. Boron toxicity. Plant Soil 1997, 193, 181–198. [Google Scholar] [CrossRef]
  27. Allison, L.E.; Bernstein, L.; Bower, C.A.; Brown, J.W.; Fireman, M.; Hatcher, J.T.; Hayward, H.E.; Pearson, G.A.; Reeve, R.C.; Richards, L.A.; et al. Chapter 2. Determination of the Properties of Saline and Alkali Soils. In Diagnosis and Improvement of Saline and Alcali Soils US Agriculture Handbook No. 60; Richards, L.A., Ed.; Soil and Water Conservation Research Branch, Agricultural Research Service: Washington, DC, USA, 1954; pp. 7–33. Available online: https://www.ars.usda.gov/ARSUserFiles/20360500/hb60_pdf/hb60complete.pdf (accessed on 26 September 2022).
  28. Palacios-Díaz, M.P.; Mendoza-Grimón, V.; Fernández-Vera, J.R.; Rodríguez-Rodríguez, F.; Tejedor-Junco, M.T.; Hernández-Moreno, J.M. Subsurface drip irrigation and reclaimed water quality effects on phosphorus and salinity distribution and forage production. Agric. Water Manag. 2009, 96, 1659–1666. [Google Scholar] [CrossRef]
  29. Freddie, R.; Lamm, F.R.; Carl, R.; Camp, C.R. Subsurface Drip Irrigation; Lamm, F.R., Ayars, J.E., Nakayama, F.S., Eds.; Developments in Agricultural Engineering; Elsevier: Amsterdam, The Netherlands, 2007; Volume 13, pp. 473–551. [Google Scholar] [CrossRef]
  30. Maas, E.V.; Grattan, S.R. Crop Yields as Affected by Salinity. In Agricultural Drainage; Skaggs, R.W., van Schilfgaarde, J., Eds.; American Society of Agronomy: Madison, WI, USA, 1999; pp. 55–109. [Google Scholar]
  31. Rhoades, J.; Loveday, J. Salinity in Irrigated Agriculture. In American Society of Civil Engineers; Stewart, B.A., Nielsen, D.R., Eds.; Irrigation of Agricultural Crops; Monograph, American Society of Agronomists: Madison, WI, USA, 1990; Volume 30, pp. 1089–1142. [Google Scholar]
  32. Shalhevet, J. Using water of marginal quality for crop production: Major issues. Agric. Water Manag. 1994, 25, 233–269. [Google Scholar] [CrossRef]
  33. Bolt, G.H.; Bruggenwert, M.G.M. Soil Chemistry. A Basic Elements; Elsevier Scientific Publishing Company: Amsterdam, The Netherlands, 1978. [Google Scholar]
  34. Murley, C.B.; Sharma, S.; Warren, J.G.; Arnall, B.B.; Raun, W.R. Yield response of corn and grain sorghum to row offsets on subsurface drip laterals. Agric. Water Manag. 2018, 208, 357–362. [Google Scholar] [CrossRef]
  35. Scordia, D.; Cosentino, S.L.; Mantineo, M.; Testa, G.; Patanè, C. Nitrogen Balance in a Sweet Sorghum Crop in a Mediterranean Environment. Agronomy 2021, 11, 1292. [Google Scholar] [CrossRef]
  36. Mygdakos, E.; Papanikolaou, C.; Sakellariou-Makrantonaki, M. Sorghum economics under different irrigation methods and water doses. New Medit J. Econ. Agric. Environ. 2009, 8, 47–54. [Google Scholar]
  37. Camp, R.C. Subsurface drip irrigation: A review. Trans. ASAE 1998, 41, 1353–1367. [Google Scholar] [CrossRef]
  38. Maas, E.V.; Hoffman, G.J. Crop Salt Tolerance-Current Assessment. J. Irrig. Drain. Div. 1977, 103, 115–134. [Google Scholar] [CrossRef]
  39. Dourado, P.R.M.; de Souza, E.R.; Santos, M.A.D.; Lins, C.M.T.; Monteiro, D.R.; Paulino, M.K.S.S.; Schaffer, B. Stomatal Regulation and Osmotic Adjustment in Sorghum in Response to Salinity. Agriculture 2022, 12, 658. [Google Scholar] [CrossRef]
  40. Kijne, J.W.; Prathapar, S.A.; Wopereis, M.C.S.; Sahrawat, K.L. How to Manage Salinity in Irrigated Lands: A Selective Review with Particular Reference to Irrigation in Developing Countries; SWIM Paper 2; International Irrigation Management Institute: Colombo, Sri Lanka, 1998. [Google Scholar]
  41. Rakgotho, T.; Ndou, N.; Mulaudzi, T.; Iwuoha, E.C.; Mayedwa, N.; Ajayi, R.F. Green synthesized zinc oxide nanoparticles mitigate salt stress in Sorghum bicolor. Agriculture 2022, 12, 597. [Google Scholar] [CrossRef]
  42. Karandish, F.; Šimůnek, J. Two-dimensional modeling of nitrogen and water dynamics for various N-managed water-saving irrigation strategies using HYDRUS. Agric. Water Manag. 2017, 193, 174–190. [Google Scholar] [CrossRef] [Green Version]
  43. Shahrivar, A.A.; Rahman, M.M.; Hagare, D.; Maheshwari, B. Variation in kikuyu grass yield in response to irrigation with secondary and advanced treated wastewaters. Agric. Water Manag. 2019, 222, 375–385. [Google Scholar] [CrossRef]
  44. Palacios, M.P.; Haman, D.; Del-Nero, E.; Pardo, A.; Pavón, N. Banana production irrigated with treated effluent in Canary Islands. Trans. ASAE 2000, 43, 309–314. [Google Scholar] [CrossRef]
  45. Palacios-Díaz, M.P.; Mendoza-Grimón, V.; Fernández-Vera, J.R.; Hernández-Moreno, J.M. Effects of defoliation and nitrogen uptake on forage nutritive values of Pennisetum sp. J. Anim. Plant Sci. 2013, 23, 566–574. [Google Scholar]
  46. Nikolaou, G.; Neocleous, D.; Christou, A.; Kitta, E.; Katsoulas, N. Implementing Sustainable Irrigation in Water-Scarce Regions under the Impact of Climate Change. Agronomy 2020, 10, 1120. [Google Scholar] [CrossRef]
  47. Bhattarai, B.; Singh, S.; West, C.P.; Ritchie, G.L.; Trostle, C.L. Water Depletion Pattern and Water Use Efficiency of Forage Sorghum, Pearl millet, and Corn Under Water Limiting Condition. Agric. Water Manag. 2020, 238, 1062062. [Google Scholar] [CrossRef]
  48. Bazaluk, O.; Havrysh, V.; Fedorchuk, M.; Nitsenko, V. Energy assessment of sorghum cultivation in southern Ukraine. Agriculture 2021, 11, 695. [Google Scholar] [CrossRef]
Figure 1. Soil EC and nitrates (mean of the whole experimental field) evolution over time, including the pre- and post-manure additions, and once irrigation treatments had been applied ((a), EC; (b), nitrates).
Agriculture 13 00192 g001
Figure 2. Soil affected by treatment: nitrate, B and N tot showed significant differences at the 0.05% level, and P showed a significant difference at the 10% level, but Na and OM showed no significant differences.
Agriculture 13 00192 g002
Figure 3. Curvilinear relation between WUE (L·kg−1 dry matter) and yield (expressed as kg FM·ha−1) for all treatments.
Agriculture 13 00192 g003
Figure 4. Accumulated yield, expressed as kg fresh matter (FM)·ha−1 (a) and dry matter (DM)·ha−1 (b) obtained when irrigating by subsurface drip irrigation and drip irrigation utilizing reclaimed water (SDIRW and DI RW, respectively) and SDI using conventional water (SDI CW).
Agriculture 13 00192 g004
Table 1. Harvest number, harvest date, growing period (days), ETo for each period (mm), and irrigated water volumes added by period (m3·ha−1∙harvest−1).
Harvest No.Harvest DateDays to HarvestETo Period
mm
Irr Water
m3·ha−1∙harvest−1
18 July 2019903923204
229 August 2019532252167
317 December 20191104214201
43 February 2020481591472
525 March 2020512011503
620 May 2020562492240
79 July 2020502252341
82 September 2020552342096
96 November 2020642542034
Table 2. Chemical parameters analyzed in reclaimed water, RW.
pHECCODBOD5NO3ClNaCaMgBTSSSAR
dS·m−1mg·L−1(meq·L−1)1/2
RWmean7.43.09326.341042735593.275.20.282.146.51
SD0.20.161.40.4127.317.749.52.65.37-0.20.4
Table 3. Chemical parameters analyzed of groundwater, CW, from two wells.
Well pHECSARNaKCaMgClNO3SO42−BCuFeZnMn
dS·m−1(meq·L−1)1/2mg·L−1
PT33mean8.11.152.21999.15556214045.539.50.135<0.015<0.0150.016<0.005
SD00.050.0310.051201.52.50.005----
FT59mean7.951.2512.8565.57.39660.519045460.07<0.015<0.015<0.010<0.005
SD0.040.1060.012.470.289.95.3042.40.711.410----
Table 4. Soil properties sampled during the experiment: pre-manure and post-manure applications, seeding day (Apr 2019), first harvest (Jul 2019), and 1 month after the last harvest (Dec 2020) per treatment (1: RWSDI, reclaimed water plus subsurface drip; 2: RWDI, reclaimed water plus surface drip; 3: CWSDI, conventional water plus subsurface drip irrigation, expressed as the mean and SD, standard deviation.
DateTreatpHEC1:5OMNtotC/NNO3PKCaMgNaBCuFeMnZn
dS·m−1%mg·kg−1meq·100 g−1mg·kg−1
Jun 17 mean8.3 120.76 11.3 10.09 18.2 12737 156.0 1*3.3 129.115.6 236.7 11.1 11.25.4 122.3 11.1 1
SD0.190.190.170.010.551693.460.3510.042.562.950.340.152.000.310.24
Nov 18 mean8.2 10.9 121.8 120.12 128.5 12648 165.0 12 *3.6 126.514.1 1235.7 11.4 121.25.4 124.4 121.1 1
SD0.120.390.500.030.683009.850.859.922.291.390.170.181.070.530.24
Apr 191mean8.01.62.50.29.298487.05.919.615.1 26.91.61.54.711.11.8
SD0.140.920.550.030.784743.461.371.751.322.070.150.740.100.650.41
2mean8.02.22.50.28.7112482.76.0 118.313.7 28.11.41.44.411.91.9
SD0.120.700.530.011.6143716.770.260.721.990.950.150.000.211.720.13
3mean8.011.63.20.2110.02843108.06.9125.212.926.111.711.44.4115.732.0
SD0.120.070.820.031.0011.840.731.4212.242.401.390.250.150.064.580.37
totmean8.0 11.8 22.7 230.2 29.3 2984 1292.6 12 *6.3221.013.9 127.0 11.5 21.44.5 112.9 31.9 12
SD0.110.660.660.021.1834525.021.096.951.961.590.180.100.293.250.29
Jul
19
1mean8.017.13 b3.520.326.31517580.58.8221.316.0312.922.121.75.027.522.7
SD0.050.230.350.030.072197.780.571.480.072.760.140.280.852.400.11
2mean8.013.93 a4.220.328.01275098.08.5229.817.4312.321.921.75.829.722.4
SD0.080.441.270.061.0633952.333.3916.051.980.640.140.210.853.890.61
3mean8.03.73 a3.220.227.71221590.58.8220.618.310.321.821.65.329.221.9
SD0.230.590.210.030.35126626.160.492.331.410.920.000.070.572.050.30
totmean8.0 14.9 33.6 30.3 37.3 13380 289.7 12 *8.7223.917.2 311.821.9 31.65.4 128.8 22.3 2
SD0.131.750.740.050.97153127.541.568.591.471.830.160.180.692.460.47
Dec
20
1mean8.621.32.91 0.218.721158151.77.3120.011.418.212.12 b1.25.523.312.0
SD0.470.450.870.050.9560833.550.872.662.280.740.230.120.960.710.46
2mean8.621.113.01 0.219.32896137.76.2120.411.916.911.92 b1.76.123.612.4
SD0.250.570.730.030.6756176.061.600.360.812.030.060.810.510.80.65
3mean8.920.512.11 0.1110.0215272.75.7120.311.817.711.42 a1.15.723.211.6
SD0.120.040.200.010.4913019.350.562.150.671.100.210.100.980.360.35
totmean8.7 21.0 12.7 230.2 29.3 2736 1120.7 2*6.4 220.211.7 17.6 11.8 231.35.8 23.4 12.0 2
SD0.330.520.730.040.8461556.161.181.731.271.340.330.500.790.590.55
Different numbers show significant differences referring to sampling periods at α 0.05 and * at α 0.1. Different letters show significant differences referring to treatments on a given date at α 0.05.
Table 5. SAR values per date and treatment 1: RWSDI, reclaimed water plus subsurface drip; 2: RWDI, reclaimed water plus surface drip; 3: CWSDI, conventional water plus subsurface drip irrigation.
Jun 17Nov 18Apr 2019Jul 19Dec 2020
Treat--123123123
SAR1.421.271.662.031.402.992.532.342.071.721.92
Table 6. Mean and SD of fresh yield (kg FM·ha−1) obtained per harvest and treatment.
Yield, Fresh Matter (kg·ha−1)
RW SDIRW DICW SDIMean
DateMeanSDMeanSDMeanSDMeanSD
07.08.201943,567 b471517,431 a351428,749 ab351429,916 13914
08.29.201941,667745522,523333437,778351433,989 14768
12.17.201919,556 a608729,630 ab351434,111 b372827,766 14443
02.03.202027,556608717,976372822,762430422,765 14706
03.25.202033,482 b351421,593 a351422,815 ab351425,963 13514
05.20.202032,843608719,259608730,889608727,664 16087
07.09.202031,408 ab608722,222 a608732,593 ab608728,741 16087
09.03.202047,333372837,630351448,296351444,420 23585
11.06.202052,593351447,481351459,630351453,235 23514
Mean36,667 b180726,194 a140935,291 b144132,7171552
Different numbers denote significant differences referring to sampling periods at α = 0.05. Different letters show significant differences referring to treatments on a given date at α = 0.05.
Table 7. Mean and SD of dry matter yield (kg DM·ha−1) obtained per harvest and treatment.
Yield, Dry Matter (kg/ha)
RW SDIRW DICW SDIMean
DateMeanSDMeanSDMeanSDMeanSD
07.08.201920,796 b22839302 a170112,742 ab170114,280 3,41895
08.29.201917,32036099505161410,837170112,554 2,3,42308
12.17.201910,691 a294718,088 b170122,462 b180517,080 5,62151
02.03.20208275294752881805634720846637 12279
03.25.202018,799170113,342170113,730170115,290 1,21701
05.20.202020,937294711,825294715,092294715,951 1,2,32947
07.09.202014,992 b294710,608 a294715,558 b294713,719 1,2,32947
09.03.202019,438 b180513,012 a170118,275 b170116,908 4,51736
11.06.202024,419170121,466170122,832170122,906 61701
Mean17,296 b87512,493 a68215,320 b69815,036752
Different numbers show significant differences referring to sampling periods at α = 0.05. Different letters denote significant differences referring to treatments on a given date at α = 0.05.
Table 8. Irrigation water use efficiency (WUE) obtained per harvest and treatment.
SDI RWDI RWSDI CWMean
L·kg−1 DM
DateMeanSDMeanSDMeanSDMeanSD
07.08.2019232514293831538325 325
08.29.2019132802453621538197 2,332
12.17.2019366662383820140268 2,329
02.03.2020178663044026246248 330
03.25.2020171382473831838245 2,322
05.20.2020175664236622466274 338
07.09.2020185663066619366228 2,338
09.03.2020111401643812038132 1,222
11.06.2020853811638923897 122
Mean182 a19275 b15215 b1622417
Different numbers depict significant differences referring to sampling periods at α = 0.05. Different letters show significant differences referring to treatments on a given date at α = 0.05.
Disclaimer/Publisher’s Note: The statements, opinions and data contained in all publications are solely those of the individual author(s) and contributor(s) and not of MDPI and/or the editor(s). MDPI and/or the editor(s) disclaim responsibility for any injury to people or property resulting from any ideas, methods, instructions or products referred to in the content.

