Article

Comparative Accuracy of In Vitro Rumen Fermentation and Enzymatic Methodologies for Determination of Undigested Neutral Detergent Fiber in Forages and Development of Predictive Equations Using NIRS

1
Research Institute of Eco-Friendly Livestock Science, Institute of GreenBio Science Technology, Seoul National University, Pyeongchang 25354, Korea
2
Graduate School of International Agricultural Technology, Seoul National University, Pyeongchang 25354, Korea
3
Department of Agricultural Biotechnology, College of Agriculture and Life Sciences, Seoul National University, Seoul 08826, Korea
*
Author to whom correspondence should be addressed.
Agriculture 2022, 12(11), 1914; https://doi.org/10.3390/agriculture12111914
Submission received: 21 September 2022 / Revised: 31 October 2022 / Accepted: 7 November 2022 / Published: 14 November 2022
(This article belongs to the Section Farm Animal Production)

Abstract

:
Undigested neutral detergent fiber (uNDF) is becoming more widely recognized as an important fiber fraction in forage quality assessment because it explains a portion of NDF that is inaccessible to digestion in the ruminant digestive system and is, thus, important in modeling the digestion kinetics of the potentially degradable component of NDF. In experiment 1, uNDF was determined in several forage species in order to compare the accuracy of two reference methods: (1) a long-term in vitro ruminal fermentation (240 h) using an Ankom DaisyII incubator and (2) a multi-step enzymatic method without ruminal fluid. The objective of experiment 2 was to construct predictive equations for uNDF estimation using acid detergent lignin (ADL) and near-infrared reflectance spectroscopy (NIRS) in a pool (n = 264) of alfalfa hay, timothy hay, and tall fescue straw, using the most accurate reference method selected in experiment 1. Partial least squares regression analysis was used to calibrate the reference values against NIRS spectra. Several indicators were used to assess the performance of validation results, including standard error of cross-validation (SECrV), coefficient of determination of cross-validation (R2CrV), and ratio percentage deviation (RPD). The findings of experiment 1 suggested that, relative to the in vitro ruminal methodology, the enzymatic approach overestimated uNDF concentration of forages. Repeatability coefficient was also greater when uNDF was determined using the in vitro versus enzymatic procedure, potentially disqualifying the enzymatic method for the uNDF analysis in forages. In experiment 2, a poor relationship was established between ADL and uNDF (R2 < 0.60), suggesting the inadequacy of ADL parameter to represent the uNDF pool size in these forages. The best predictive equation using NIRS was obtained for alfalfa hay (R2CrV = 0.92; SECrV = 1.16; RPD = 3.57), using the in vitro fermentation as a reference method. The predictive equations were moderately accurate for timothy hay (R2CrV = 0.80; SECrV = 1.31; RPD = 2.08) and tall fescue straw (R2CrV = 0.79; SECrV = 1.38; RPD = 2.18). Our findings suggested the inadequacy of the enzymatic procedure in accurately determining uNDF concentration of forages as compared with the in vitro rumen fermentation protocol. Although the NIRS equations developed using the alfalfa hay dataset were more accurate than that of timothy hay and tall fescue straw, the validation results verified applicability of the equations as a fast screening tool for qualitative prediction of uNDF in these forages, which is important in commercial settings.

1. Introduction

The indigestible fraction of neutral detergent fiber (NDF) could explain the nonuniformity of NDF, even though this fraction is not biologically relevant for the animal. Indigestible NDF is important for the more precise prediction of the NDF digestibility rate and feed-intake behavior in ruminants [1]. Indigestible NDF remains undigested in the rumen environment even after an infinite retention time, leaving the rumen only by passage. However, because digestibility cannot be prolonged infinitely, undigested NDF (uNDF) has been introduced as a more correct terminology to represent the laboratory approximation of indigestible NDF [2] and is usually quantified by long-term in vitro (240 h) or in situ incubations (288 h) [3,4,5]. Undigested NDF can describe the inherent properties of forage cell walls; thus, it could be viewed as an intrinsic marker for more reliable prediction of in vivo digestibility in diet formulation models [6,7,8]. Recently, uNDF has received increased attention as a fiber fraction that influences passage rate, physical effectiveness of fiber, and the effect it may have on voluntary feed intake in ruminants because of its rumen filling effect [9,10,11]. For example, dairy cow performance was different when fed diets with almost identical forage proportion and chemical composition (i.e., NDF concentration) [11], which was explained by the differences in uNDF concentration among diets. Palmonari et al. [8] suggested that the uniformity of predictable digestibility provided by the uNDF fraction relative to NDF alone qualifies uNDF as an entity that must be included in routine forage quality analyses. The updated version of Cornell Net Carbohydrate and Protein System (CNCPS; version 6.5) requires approximation of uNDF fraction using the 240 h in vitro fermentation method as opposed to the static estimation (lignin × 2.4), as this entity has been shown to vary depending on growing and agronomic conditions, and the in vitro digestion method can accurately quantify the dynamic differences in the NDF pool sizes [10,12].
Determination of uNDF in forages using the in vitro and in situ procedures is usually accurate; however, the rumen-based methodologies are potentially subject to errors originating from inherent animal variations and the inconsistent nature of rumen fluid inoculum. The latter may also be influenced by differences in feeding conditions under which the donor animals are managed [13,14,15]. The rumen-based techniques are associated with additional concerns, such as rumen fluid collection and long incubations, maintenance cost of the donor animals, as well as increased public scrutiny surrounding animal welfare issues [15,16,17].
More recently, Gallo et al. [18] reported the optimization of an enzymatic methodology without ruminal fluid for uNDF quantification as an alternate to the ruminal in situ incubation procedure. Their findings confirmed that, compared with the in situ incubation method, the accuracy of the enzymatic method was satisfactory in determination of uNDF concentration of various forage species. Additional research is required to validate the enzymatic method against standard methodologies using different forage species before it can be adopted as a reliable method for routine analysis of uNDF component in forage evaluation studies.
Previous studies confirmed that prediction of the forage-quality parameters using near-infrared reflectance spectroscopy (NIRS) was in adequate agreement with values from wet chemistry analyses [4,19,20]. The NIRS technique is nondestructive and noninvasive and can quickly produce reproducible results, thereby minimizing the need for the cannulated animals and laboratory analyses that have their own intrinsic limitations [21,22]. The correctness of NIRS calibration equations is largely determined by the accuracy of the reference protocol used in building the calibration dataset. Therefore, it is necessary to have a reliable, accurate, and preferably fast reference (laboratory) methodology for the construction of calibration equations using NIRS [23,24,25]. Errors in determining uNDF component using imprecise reference procedures may result in the development of poor calibration equations using NIRS [13,18].
This study had two objectives. In experiment 1, the objective was to compare the repeatability of the two reference methods in order to identify the most accurate method for determination of uNDF component; the methods were (1) a long-term (240 h) in vitro technique using rumen fluid inoculum and (2) a multi-step enzymatic method without rumen fluid. In experiment 2, the objective was to employ the most accurate reference method selected in experiment 1 for uNDF determination of a large pool of alfalfa hay, timothy hay, and tall fescue straw and to assess the accuracy of predicting uNDF component using acid detergent lignin (ADL) parameter or predictive equations developed using NIRS.

2. Materials and Methods

2.1. Sample Preparation

In experiment 1, we collected a diverse set of forages, including alfalfa hay, timothy hay, tall fescue straw, and whole-plant forages from corn, proso millet, and sorghum–sudangrass hybrid. Whole-plant forages were provided in dried form (55 °C; 48 h) that had been hammer-milled and passed through a 1 mm screen. Hays and straws were directly collected from bales and subjected to a hammer-milling step (1 mm screen; Thomas Scientific, Inc., Swedesboro, NJ, USA). Each forage type was divided into 27 subsamples: 24 subsamples for uNDF determination using the in vitro rumen fermentation or the enzymatic method, each replicated in two runs in different days (6 replications × 2 methods × 2 runs). The remaining 3 samples were used in chemical composition analysis.
In experiment 2, a calibration dataset was built from a forage set of 264 samples, including alfalfa hay (Medicago sativa L.; n = 88), timothy hay (Phleum pratense L.; n = 88), and tall fescue straw (Schedonorus arundinacea Schreb.; n = 88). This set was collected from the main forage importers in Korea, and they mostly originated from the United States, Australia, Canada, and Spain. The forage set was selected to represent a diverse range of fiber concentration and digestibility characteristics.

2.2. Compositional Analysis

Residual dry matter (DM) concentration was determined in ground samples (1 mm screen) subjected to drying at 105 °C for 24 h. Total nitrogen was quantified via the Dumas combustion method [26] using a Euro Vector EA3000 elemental analyzer (EVISA Co., Milan, Italy). Neutral detergent fiber (NDF) and acid detergent fiber (ADF) were measured following the method of Van Soest et al. [27] using an Ankom2000 fiber analyzer (Ankom Technology Corp., Fairport, NY, USA). The procedure of NDF analysis was inclusive of heat-stable amylase (Ankom Technology) and sodium sulfite (Na2SO3). For determination of ADL, the 0.5 g (DM basis) samples in F57 filter bags were initially subjected to ADF determination using an Ankom fiber analyzer, and then the cellulose fraction of the residues (cellulose + lignin) was digested using 72% sulfuric acid (H2SO4) for 3 h in beakers [28].

2.3. In Vitro Rumen Incubation

The in vitro determination of uNDF was performed using an Ankom DaisyII Incubator system (Ankom Technologies, Inc., Fairport, NY, USA) in two consecutive runs, according to Valentine et al. [29]. The empty Ankom F57 bags (25 μm pore size; 4 cm × 5 cm) were prerinsed in acetone according to the manufacturer’s instructions. Each ground sample (0.5 ± 0.05 g) was added to the filter bag and sealed with an impulse sealer (Lovero SK-210, China). The digestion jars had bags evenly distributed on both sides. To account for the variability in within-unit position, the forage types were distributed in four rotating jars in each run. Two ruminally cannulated Holstein steers (body weight = 690 ± 27 kg) were chosen as rumen fluid donors. Collection of rumen fluid was always undertaken before the morning feeding. Animals were kept in the Animal Experimental Farm at Seoul National University (Pyeongchang campus). Caring for animals was according to the guidelines of the Animal Ethical Committee (Seoul National University, Korea) under the approval number of SNU-160105-1. Steers were fed twice daily (08:00 and 16:00 h) with rice straw (75% NDF) and a commercial concentrate mix (15.4% crude protein, 29.2% NDF, 13.2% ADF, and 5.24% crude fat). The rumen fluid was collected and squeezed through two layers of cheesecloth into thermos flasks and immediately transferred to the laboratory. The thermos flasks were kept at 39 °C until the ruminal fluid was introduced. The ruminal fluid was once again filtered through 4 layers of cheesecloth in the laboratory and mixed with the medium/buffer solution [30] at 1:4 (v/v) ratio while being continuously flushed with CO2. It took less than 30 min from the time the ruminal fluid was collected to the time it was added to the jars. Each jar was sealed with a lid after being purged with oxygen-free carbon dioxide for 30 s. The rotating jars were incubated at 39 °C for 240 h, which has been confirmed as the maximum duration for the in vitro determination of uNDF [1,31]. Two blank filter bags were also introduced in each jar to account for any particles inserted in the bags from the rumen fluid or weight loss of bags over the incubation time. Following the completion of incubation, the bags were thoroughly washed under tap water and digested in the neutral detergent solution using the Ankom2000 fiber analyzer. The NDF procedure included alpha-amylase but not Na2SO3 because it may attack the lignin fraction [32,33] and cause uNDF concentration to be underestimated. The residual NDF in dried bags was ashed (510 °C; 4 h) and uNDF was expressed on an organic matter (OM) basis.

2.4. Multi-Step Enzymatic Method

The enzymatic method for uNDF measurement was conducted in two consecutive runs following the procedure of Gallo et al. [18], which consisted of a preincubation phase and two sequential enzymatic phases. The 0.3 g forage samples were weighed in triplicate into Ankom F57 filter bags. Bags were initially soaked in a 0.2 M sodium hydroxide solution (15 mL/bag) for 90 min, and then rinsed thoroughly with distilled water until pH neutrality was achieved. In the first enzymatic hydrolysis phase, the bags were placed in a buffered enzyme solution. Potassium phosphate (KH2PO4, 3.56 g/L) and sodium phosphate (Na3PO4, 5.77 g/L) were used to make a pH-adjusted buffer solution (pH 6) using H3PO4 (0.85 w/w). Hemicellulase (Aspergillus niger, Sigma-Aldrich, St. Louis, MO, USA), cellulase (Trichoderma viride, Sigma-Aldrich, St. Louis, MO, USA), and Viscozyme® L (Sigma-Aldrich, St. Louis, MO, USA) were then added to the buffer solution at 4 g/L, 10 g/L, and 10 mL/L, respectively. After 1 h of stirring, the bags were immersed in the buffered-enzyme solution (15 mL/bag) and incubated at 39 °C for 24 h. In the second phase of enzymatic hydrolysis process, xylanase (Thermomyces lanuginosus, Sigma-Aldrich, St. Louis, MO, USA) was added at 2 g/L to a buffer solution consisting of KH2PO4 and Na3PO4 adjusted to pH of 5. Bags were immersed in the buffered-enzyme solution (15 mL/bag) and incubated at 39 °C for 24 h. Bags were thoroughly rinsed with tap water and dried in a 55 °C oven until constant weight was achieved. The residual NDF in dried bags was ashed and uNDF was quantified on an OM basis. The reagents for the second run of the enzymatic experiment were repurchased from the same supplier as in the first run.

2.5. Spectra Acquisition and Calibration Development

A total of 528 spectra (two packing replicates/sample) was acquired using an NIR analyzer (SpectraStar™ XT; Unity Scientific; KPM Analytics, Westborough, MA, USA). The NIR analyzer had a sample holder (diameter = 85 mm) that was equipped with a quartz window and a spinning cup holder. Chemometric analysis was conducted based on an average of two scans/each ground sample to increase the calibration accuracy. Each sample was scanned at 1 nm intervals at the wavelengths ranging from 680 to 2500 nm. Absorption was recorded as reflectance (R) mode, which was transformed to log 1/R. For chemometric modeling, the uNDF values determined using the in vitro fermentation method were matched to the respective spectra. The in vitro experiment was performed using Ankom DaisyII incubator in two runs with two replications of each sample in each run. Calibration and validation of the predictive models were made in the software UCalTM ver. 4.0 (Unity Scientific, Brookfield, CT, USA). Prior to data modeling, detrend and standard normal variate were utilized as scatter corrective methods to minimize background noise and imperfections on calibration performance [34]. The calibration accuracy was further improved by removal of outliers from the calibration dataset. For outlier detection in the spectra data, the Mahalanobis distance was set at 3.0 [23]. The critical T-statistic value was set at 3.0 for outlier detection in the laboratory dataset. A value was considered an outlier in the laboratory dataset if the difference between the predicted and observed value was more than 3 standard errors [35,36]. In the process of calibrating spectra data against the uNDF values obtained from the in vitro method, the regression method was partial least squares [4,37,38]. The majority of the variation in the original dataset is retained by this regression method, which minimizes the risk of multicollinearity [37]. The selection criteria for the optimum number of factors in the partial least square equation were the maximum coefficient of determination of calibration (R2C) and minimum standard error of calibration (SEC) [4]. Cross-validation statistics included coefficient of determination of cross-validation (R2CrV), standard error of cross-validation (SECrV), and ratio percentage deviation (RPD), which was computed as SD of the observed dataset divided by SECrV. RPD is an indicator of model performance that explains the proportion of variations in the reference values to the variations not accounted by NIRS [39]. Range error ratio (RER) was also calculated as the ratio of SECrV to the range in the observed (reference) dataset.

2.6. Computations and Data Analysis

In experiment 1, data were analyzed using Proc Mixed of SAS [40] with Tukey’s multiple range test used for means comparison at a significance level of p < 0.05. The equality of variance was tested using Levene’s test [41] in SPSS (IBM SPSS Statistics, Version 24.0 Armonk, NY, USA, INM Corp.). This test runs an ANOVA on the absolute deviation of individual observations from the group median [13]. The repeatability (RT) of each method was computed using several variance components, which were estimated using restricted maximum likelihood method in Proc Mixed of SAS. Sources of variations originating from run (R), forage types (F), interaction (R × F), and residual variance were considered in the model as the random variables [42,43].
Repeatability proportion (RT%) was computed according to the following equation:
RT %   = σ 2 R + σ 2 F + σ 2 R × F σ 2 R + σ 2 F + σ 2 R × F + σ 2 e × 100 ,
where σ2R = run-to-run variance, σ2F = variance among forages (n = 6), σ2R × F = run × forage variance, and σ2e = residual variance.
In the definition by International Organization for Standardization [44,45], RT is the expected value (with 95% probability) below the absolute difference between two separate measurements that were collected from the same method under identical experimental conditions, such as same sample and incubation requirements.
The repeatability standard deviation (SDr) and ratio of range (maximum − minimum)/SDr from the reference procedure (in vitro fermentation method) were calculated according to Williams [46]. These indicators allowed the interpretation of performance of the calibration dataset in experiment 2. The SDr explains the inevitable and normal errors introduced into NIRS calibration by the reference procedure, with a lower value indicating greater precision of the reference method. A higher range/SDr ratio corresponds to increased odds of accurate calibration development using NIRS [21].

3. Results and Discussion

3.1. Experiment 1

The chemical composition of forage species used in experiment 1 is presented in Table 1. The comparative accuracy of uNDF measurement in various forage species using the in vitro method versus enzymatic method is also reported in Table 2. A substantial difference was noted in uNDFom concentration among the forage species, ranging from 16.1% of DM in whole-plant corn to 32.1% of DM in tall fescue straw, as determined using the in vitro ruminal fermentation procedure. A similar trend was also observed with values determined using the enzymatic procedure. Agronomic variables, including harvest maturity, cut number, hybrid genetics, and growing conditions, such as latitude and climate, have been identified as causing differences in lignification extent and, thus, variations in uNDF concentration among and within forage species [47,48,49].
Levene’s test, a test that assesses the homogeneity of variance, was not significant (p = 0.45), suggesting the adequate comparability of variances to test the difference between the two methods. Except for alfalfa hay, the uNDF values obtained with the enzymatic method were higher than those of the in vitro method (p < 0.01). In addition, the data obtained using the enzymatic approach versus those obtained using the DaisyII incubator were less repeatable (97.4 vs. 92.3%). Rymer et al. [50] identified that rumen fluid inoculum accounts for the majority of run-to-run variations in the in vitro techniques involving ruminal fluid, and including a repetition term (run) in statistical models reduced variation in rumen fluid inoculum. In this study, the in vitro fermentation experiment was undertaken in two runs, which may have reduced the run-to-run variability caused by rumen fluid inoculum and resulted in a high repeatability coefficient. Overall, the results of experiment 1 demonstrated that uNDF determination through the in vitro rumen fermentation method is more accurate and reliable than the enzymatic approach. Further optimizations of the enzymatic procedure could possibly make it a reliable reference method for the accurate estimation of uNDF in various forage species. The in vitro rumen fermentation approach was selected as the more accurate reference method for use in subsequent experiments that aimed to identify the relationship between uNDF and ADL parameter, and also develop NIRS calibration equations for prediction of uNDF in the commonly imported hay and straw in Korea (alfalfa hay, timothy hay, and tall fescue straw) [51,52].

3.2. Experiment 2

Descriptive statistics of the nutrient composition and nutritive value of alfalfa hay, timothy hay, and tall fescue straw are reported in Table 3. Based on the statistics, alfalfa hay samples provided a more robust dataset, particularly NDF concentration that ranged from 39.5 to 61.6% of DM. Similarly, ADL concentration ranged from 6.09 to 11.6% of DM. A narrower range of NDF concentration was observed in timothy hay (63.9 to 70.6% of DM) and tall fescue straw (65.1 to 75.7% of DM). Concentration of ADL also followed a similar trend. This likely suggests a wide range of fiber digestibility in the alfalfa dataset relative to timothy hay and tall fescue straw.
Descriptive statistics of uNDF concentration from the hay and straw used in building the calibration dataset are presented in Table 4. Concentration of uNDFom ranged from 14.3 to 34.1% of DM in alfalfa hay, 17.1 to 32.8% of DM in timothy hay, and 24.5 to 43.7% of DM in tall fescue straw. Zhang et al. [54] used an alfalfa set of 144 samples that originated from different varieties and harvest intervals to predict uNDF component using NIRS. In their study, uNDF concentration ranged from 8.60 to 22% of DM using the in situ incubation procedure with F57 bags, signifying a more robust selection of alfalfa set in the present work.
The SDr of the reference method was lowest with alfalfa hay, intermediate with tall fescue straw, and greatest with timothy hay. Accordingly, alfalfa hay had a higher range/SDr than timothy hay and tall fescue straw. The higher ratio of range/SDr is usually associated with the increased likelihoods of developing accurate predictive equations using NIRS [46]. Alfalfa hay samples may have formed fewer fine particles during the grinding step than timothy hay and tall fescue straw, possibly due to the differences in their physicochemical properties [55]. Loss of very small particles from the Ankom bags (25 µm pore size) in alfalfa hay may have occurred to a lesser extent during the long-term fermentations and washing procedure. Moreover, the variability in particle loss among various forages during the ruminal fermentation could be explained by the inherent characteristics of plants [56,57]. Less lignification in forages was associated with a lower degree of lignin cross-linking to the carbohydrate components, which facilitates the formation of fine particles and may reduce the recovery of uNDF fraction during long-term fermentations [58,59]. In this experiment, ADL concentration was lower in timothy hay and tall fescue straw than in alfalfa hay (Table 3), possibly providing evidence for the lower SDr value observed with alfalfa hay. More recently, Zhang et al. [54] discovered that the small (25 µm pore size) versus large bags (50 µm pore size) resulted in more accurate measurement of uNDF using the in situ rumen incubation procedure. Although the 25 µm sized filter bag is adequate for the accurate quantification of uNDF component [54], our findings identified a substantially greater SDr value in timothy hay than in alfalfa hay and tall fescue straw. Krämer et al. [60] found differences in particle dimensions among forages during in situ rumen incubations, which resulted in particle loss from the Dacron bags (38 μm pore size). The comparative accuracy of bags with smaller porosity relative to the F57 Ankom bags (25 µm pore size) has received less attention in previous studies. Use of bags with a smaller pore size in long-term fermentations may result in more uniform recoveries of particles from timothy hay and tall fescue straw. It is important to choose bag pore sizes that allow for both the influx of ruminal microorganisms and efflux of the digested materials, while avoiding the escape of undigested materials from the filter bags [29,61]. Therefore, more experiments are needed to further standardize the in vitro rumen methodology, such as standardization of bag porosity to more accurately determine uNDF concentration in various forage species.

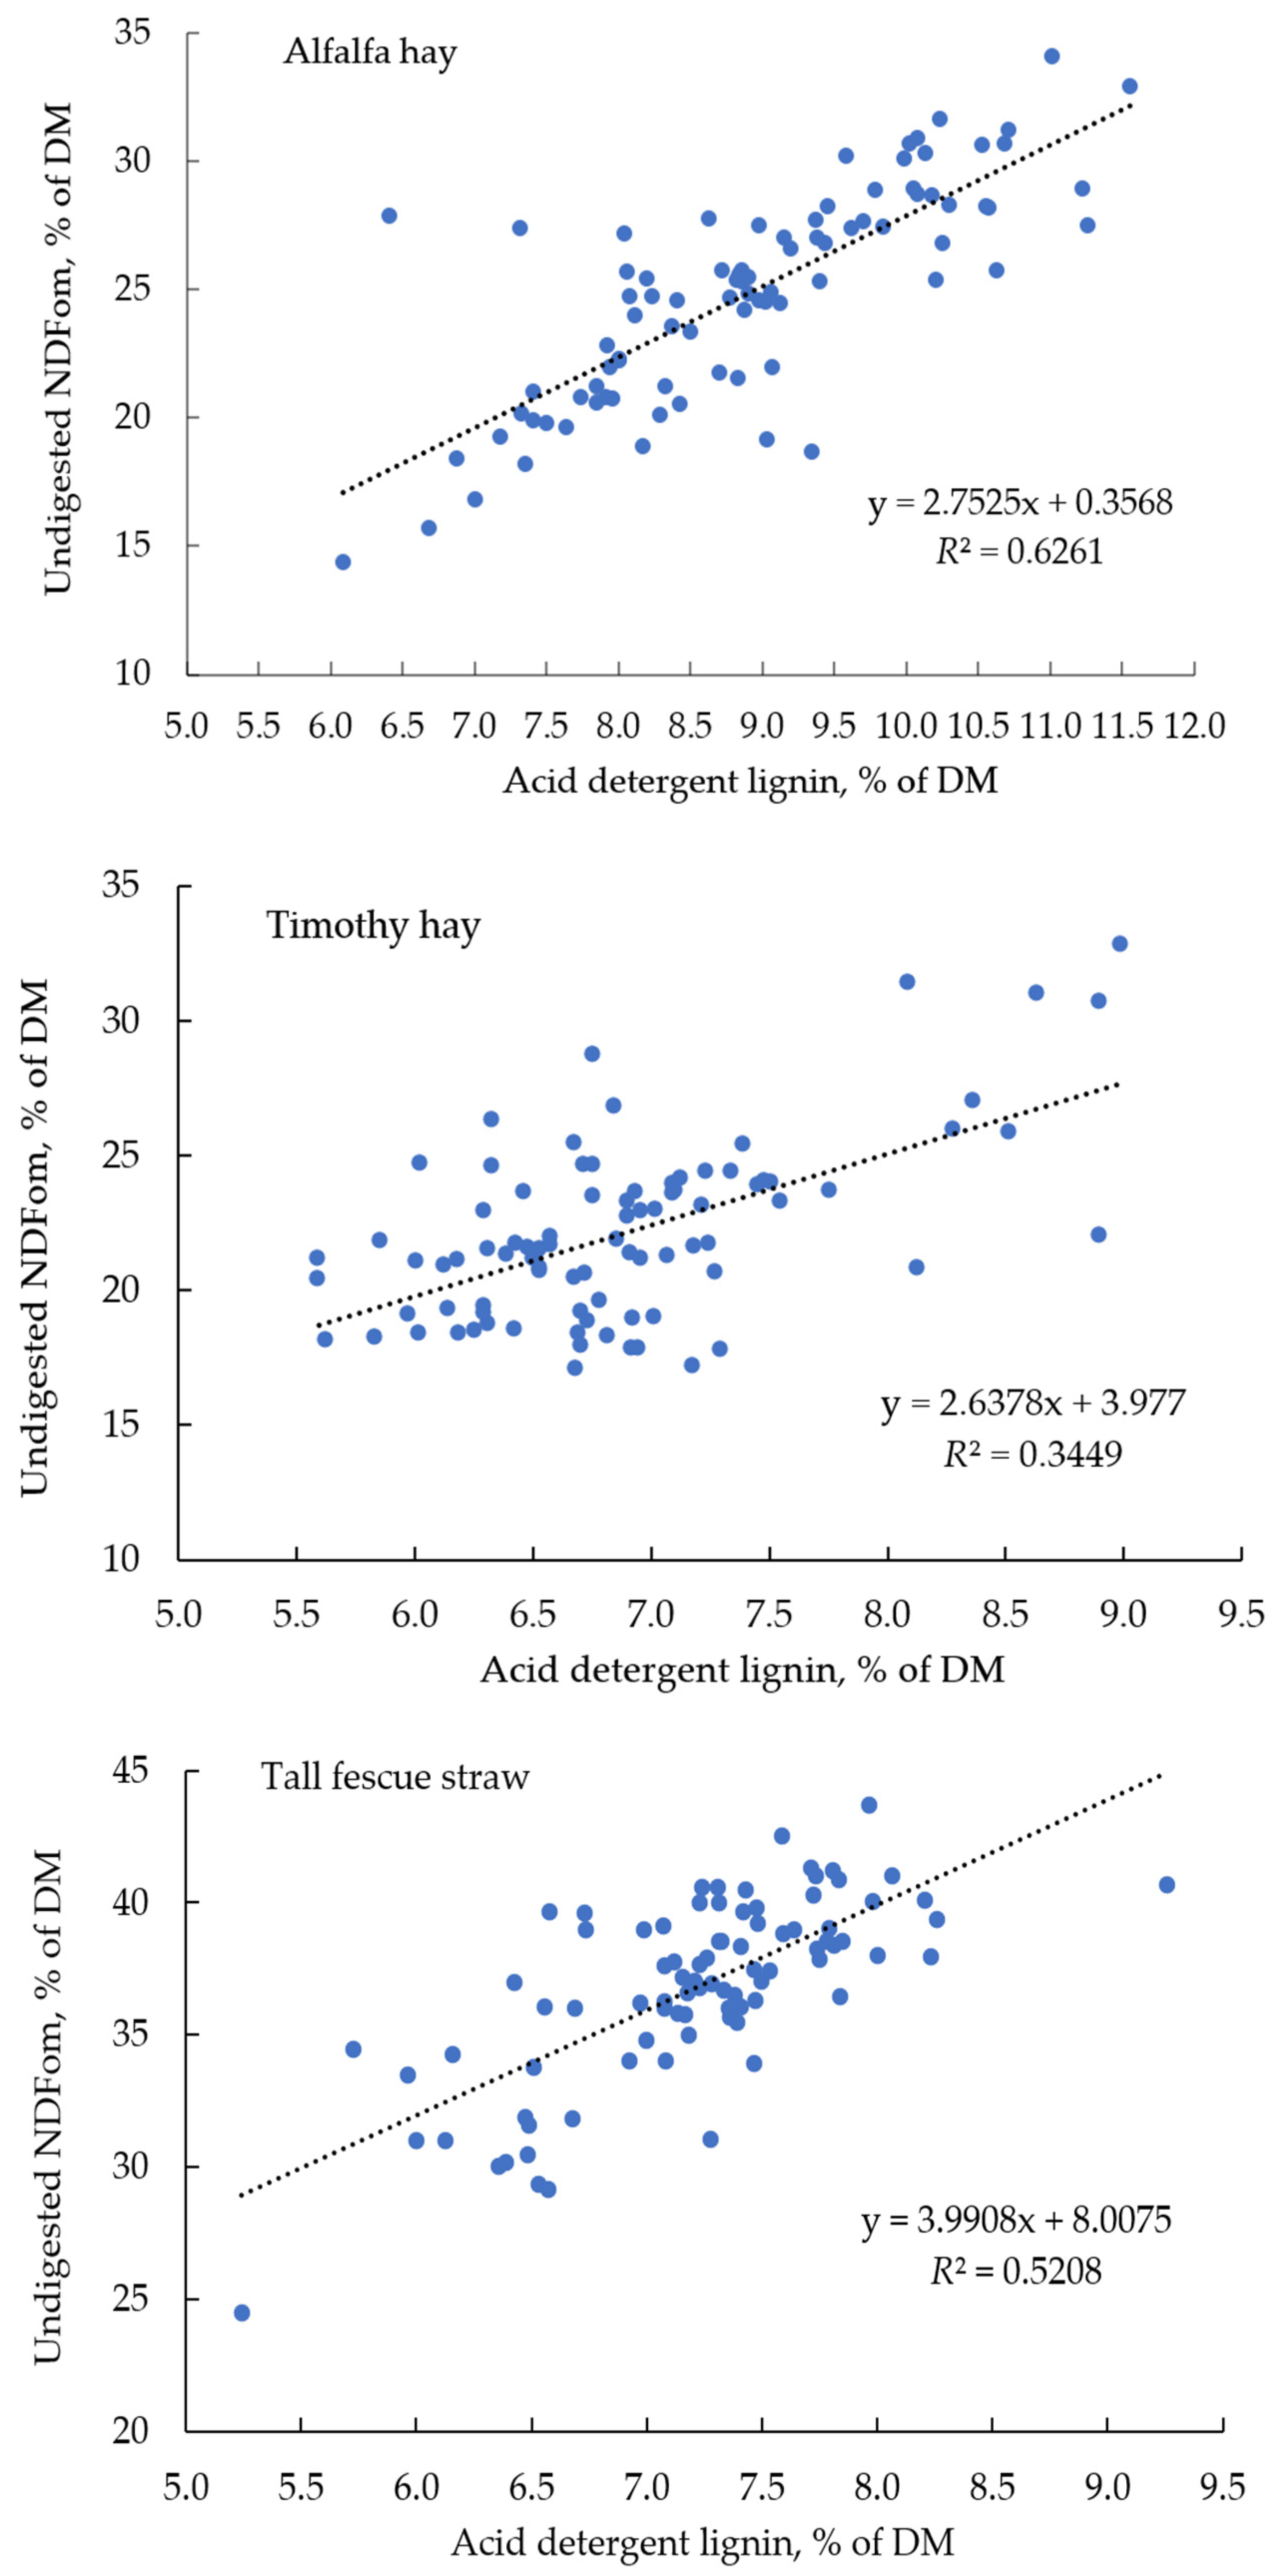
3.2.1. Relationship between ADL and uNDF

Regression of the uNDF obtained from the 240 h in vitro incubation on ADL is illustrated in Figure 1. The ratio of uNDF to ADL ranged from 2.01 to 4.34 in alfalfa hay, 2.39 to 4.25 in timothy hay, and 4.27 to 6.03 in tall fescue straw. The regression coefficient was greatest in alfalfa hay (R2 = 0.63), intermediate in tall fescue straw (R2 = 0.52), and poorest in timothy hay (R2 = 0.35). These values contradict with past studies that identified a stronger relationship (R2 > 0.70) between uNDF (from the 240-h in vitro incubation) and lignin concentration in a variety of forage species [8,62]. However, Raffrenato et al. [59] identified a poor relationship between ADL and uNDF (determined using 240-h in vitro incubation) in mature grasses (hays and straw; R2 = 0.68) and alfalfa forages (R2 = 0.56). Raffrenato and Van Amburgh [55] discovered that escape of fine particles during both ADF and ADL procedures could occur in varying degrees among forage families, owing to the differences in their physicochemical properties and cell wall structure. The poor relationship between uNDF and ADL in tall fescue straw and, in particular, timothy hay could partly be explained by the variable retention of particles in bags during both ADL and uNDF procedures (both performed with F57 filter bags) that possibly resulted in significant variations in the uNDF to ADL ratio [55,63]. Additional experiments are suggested to assess the ability of a filtering aid during both ADF and ADL assays in order to compare the particle recovery.
The laboratory method of lignin determination is another important factor that needs to be taken into consideration. Fukushima et al. [64] identified that the ADL method (using concentrated sulfuric acid) provided an underestimation of lignin concentration in grasses when compared with the spectrophotometric acetyl bromide lignin method. Hemicellulose solubilization during the ADF treatment was suggested to leave lignin components in a configuration that facilitates the detachment of some lignin groups, thereby resulting in lignin solubilization and loss during the ADL procedure [65,66]. Further research into the comparative evaluation of lignin determination methods (i.e., ADL vs. acetyl bromide lignin method) may result in a better establishment of the relationship between ADL and uNDF.
A general regression equation using a pool of alfalfa hay, timothy hay, and tall fescue straw (uNDF regressed on ADL) revealed a very poor predictive accuracy (R2 < 0.1; data not presented) and an overall average uNDF/ADL ratio of 3.71, ranging from 2.01 to 6.03. In order to improve the predictability of uNDF using ADL parameter, additional attempts were undertaken to generate a general regression equation by incorporating NDF and ADL. Among a series of equations, the best fit was achieved using a power function (y = 16.11x−0.6, R2 = 0.35), in which y represents the ratio of uNDF/ADL and x represents ADL as a proportion of NDF (Supplementary Figure S1). Although these data were less variable than when uNDF was predicted using ADL alone (% of DM), this approach (uNDF/ADL regressed on ADL expressed as a proportion of NDF) still displayed significant variability, potentially limiting the applicability of the regression equations based on ADL (% of DM or % of NDF) for prediction of uNDF in these hays and straw. Consistent with these findings, Raffrenato et al. [59] also reported that R2 ranged from 0.23 in alfalfa forages to 0.77 in conventional corn silage when uNDF/ADL was regressed on ADL (% of NDF). These findings clearly contradict the validity of a universal factor for estimation of uNDF concentration in forages. In agreement, Weisbjerg et al. [67] reported the substantial variability in the ratio of uNDF to lignin in legumes (1.22 to 3.59) and grasses (1.27 to 4.57). Krizsan and Huhtanen [9] also stated that, despite the important role of lignin in cell wall degradation and its close correlation with uNDF, a universal factor could not be valid for uNDF estimation in a wide range of feed and forages. Raffrenato et al. [63] identified a wide variation in the ratios of uNDF to ADL, ranging from 1.6 to 8 in a large forage set from South Africa and Australia, and suggested that the dynamicity of lignification potentially influences the uNDF pool size in various forage species. Agronomic conditions, as well as stage of forage maturity, could cause a significant variation in ratio of uNDF to ADL [59,68]. Therefore, owing to the high variability of the relationship between uNDF and lignin, a static factor should not be adopted for uNDF estimation in forage species. Attempts were continued to assess the utility of NIRS for the uNDF prediction of the imported hays and straw.

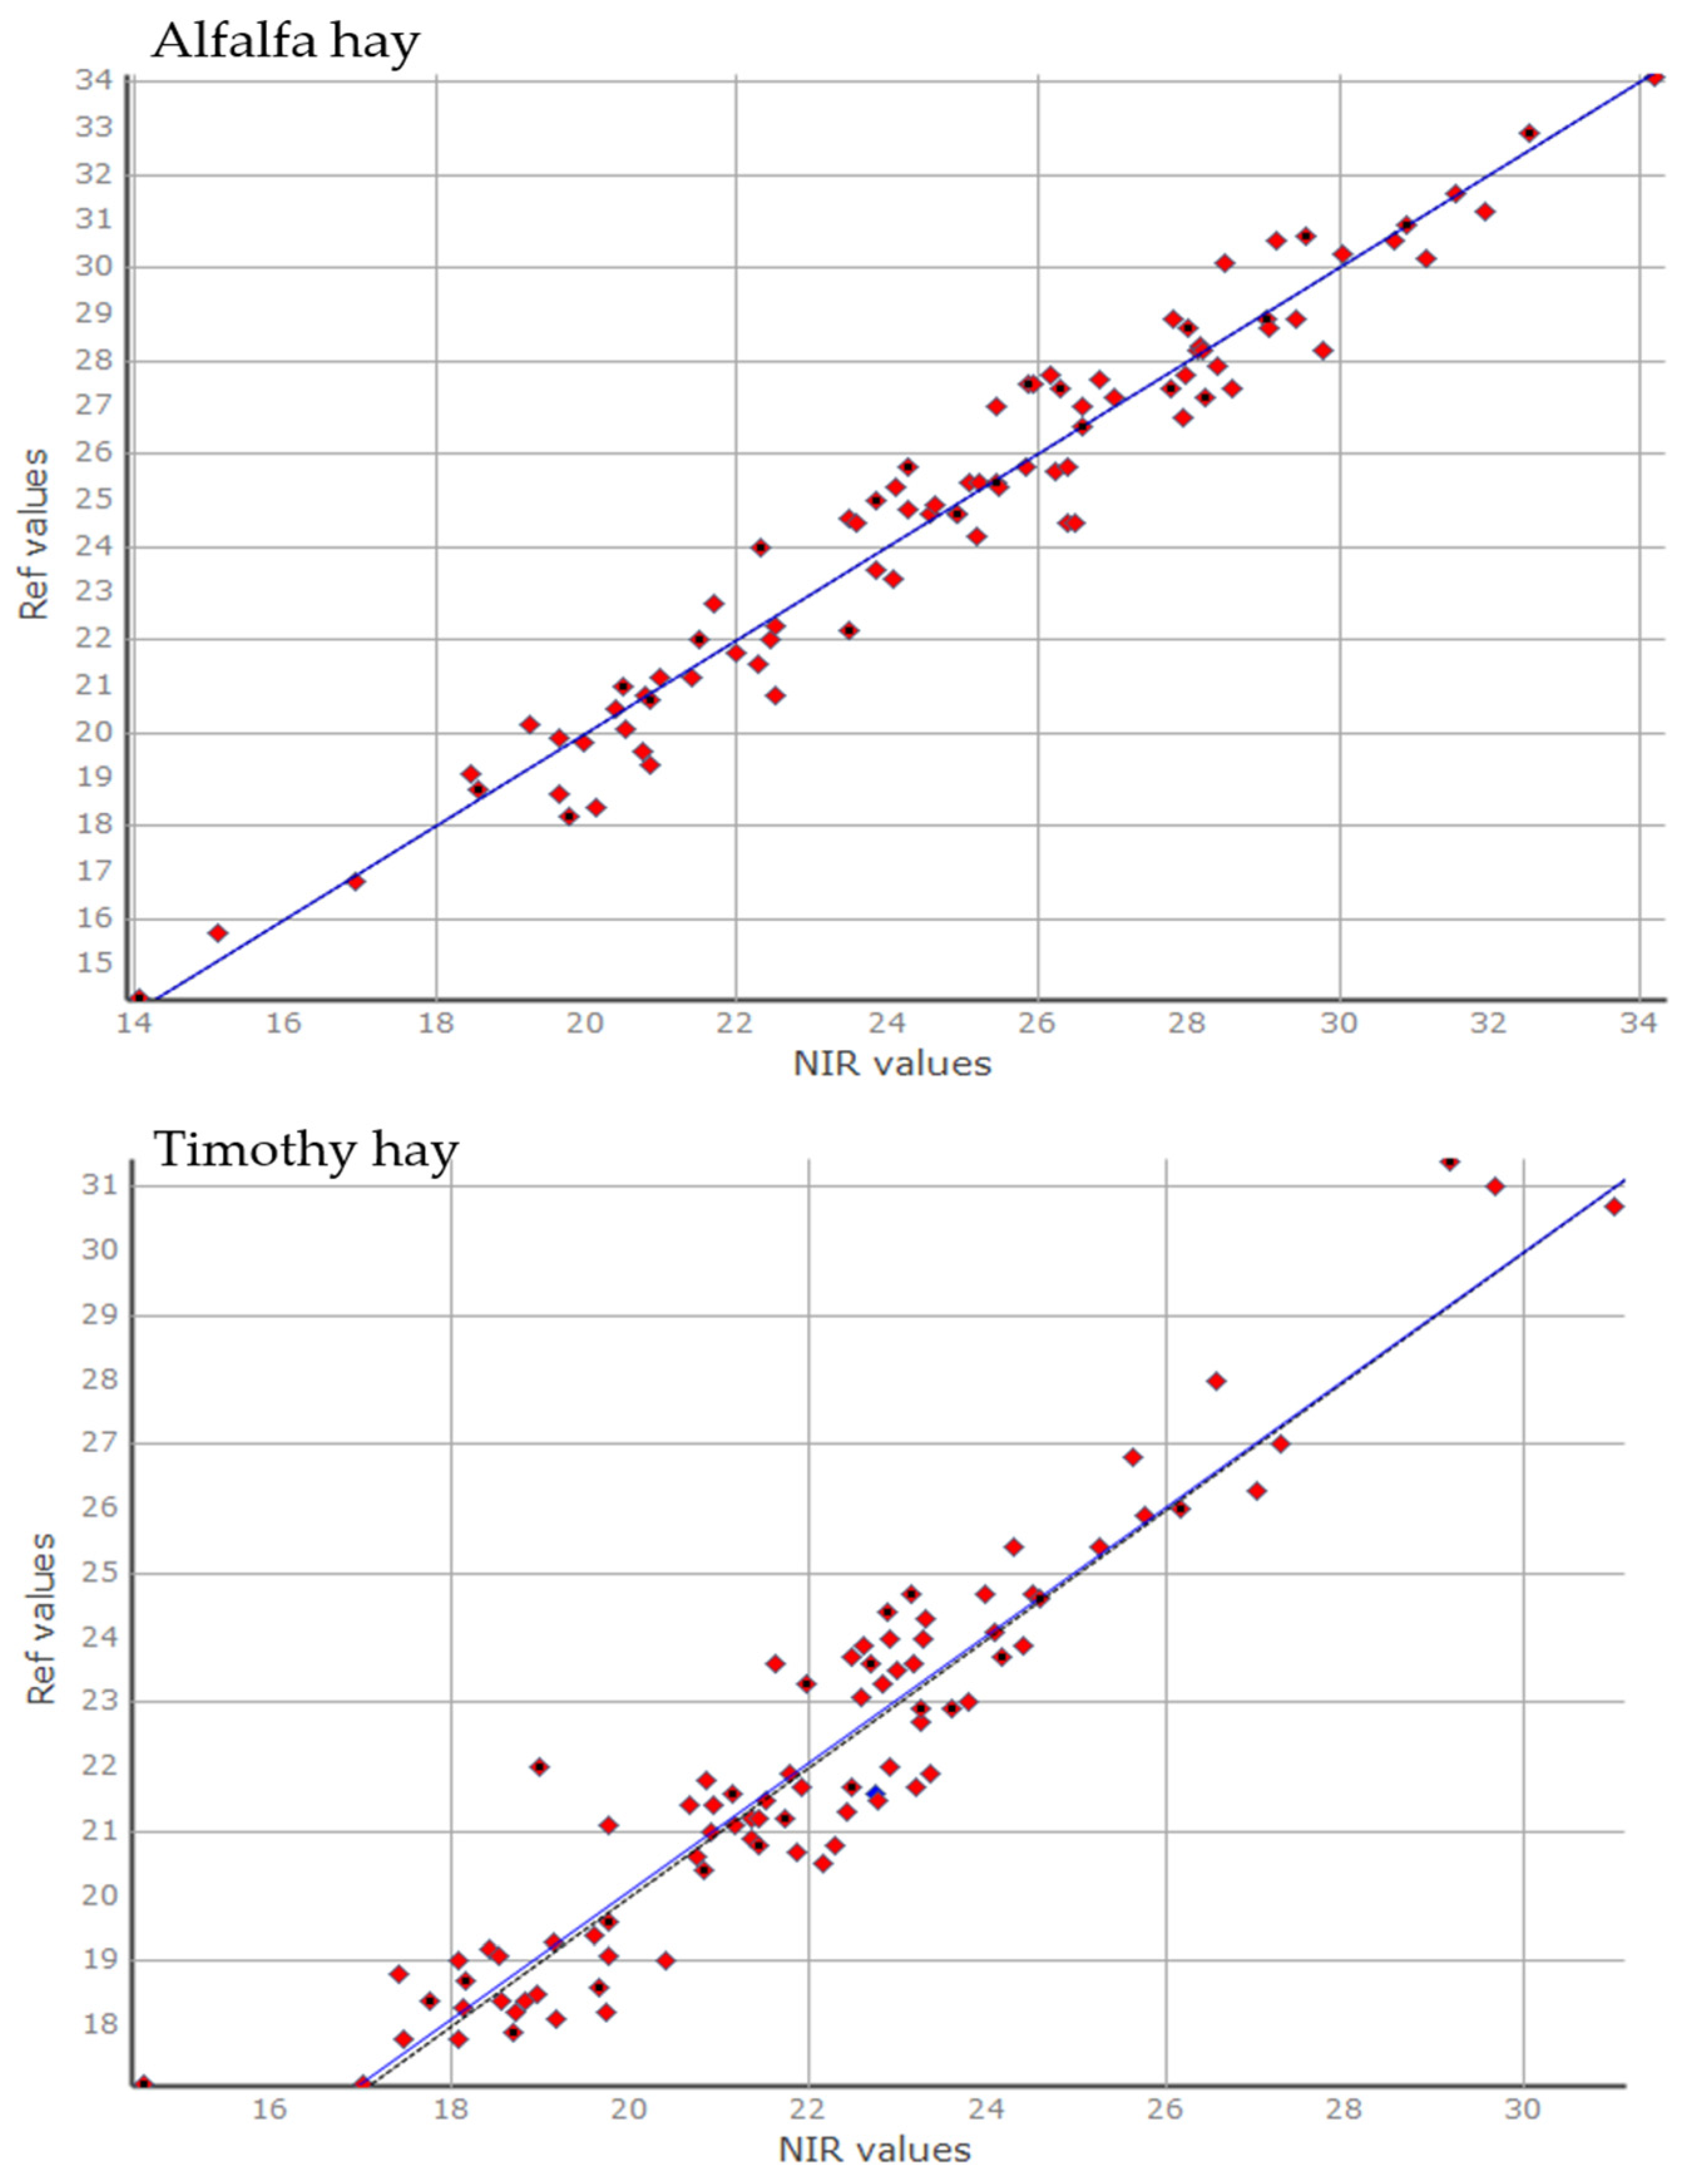
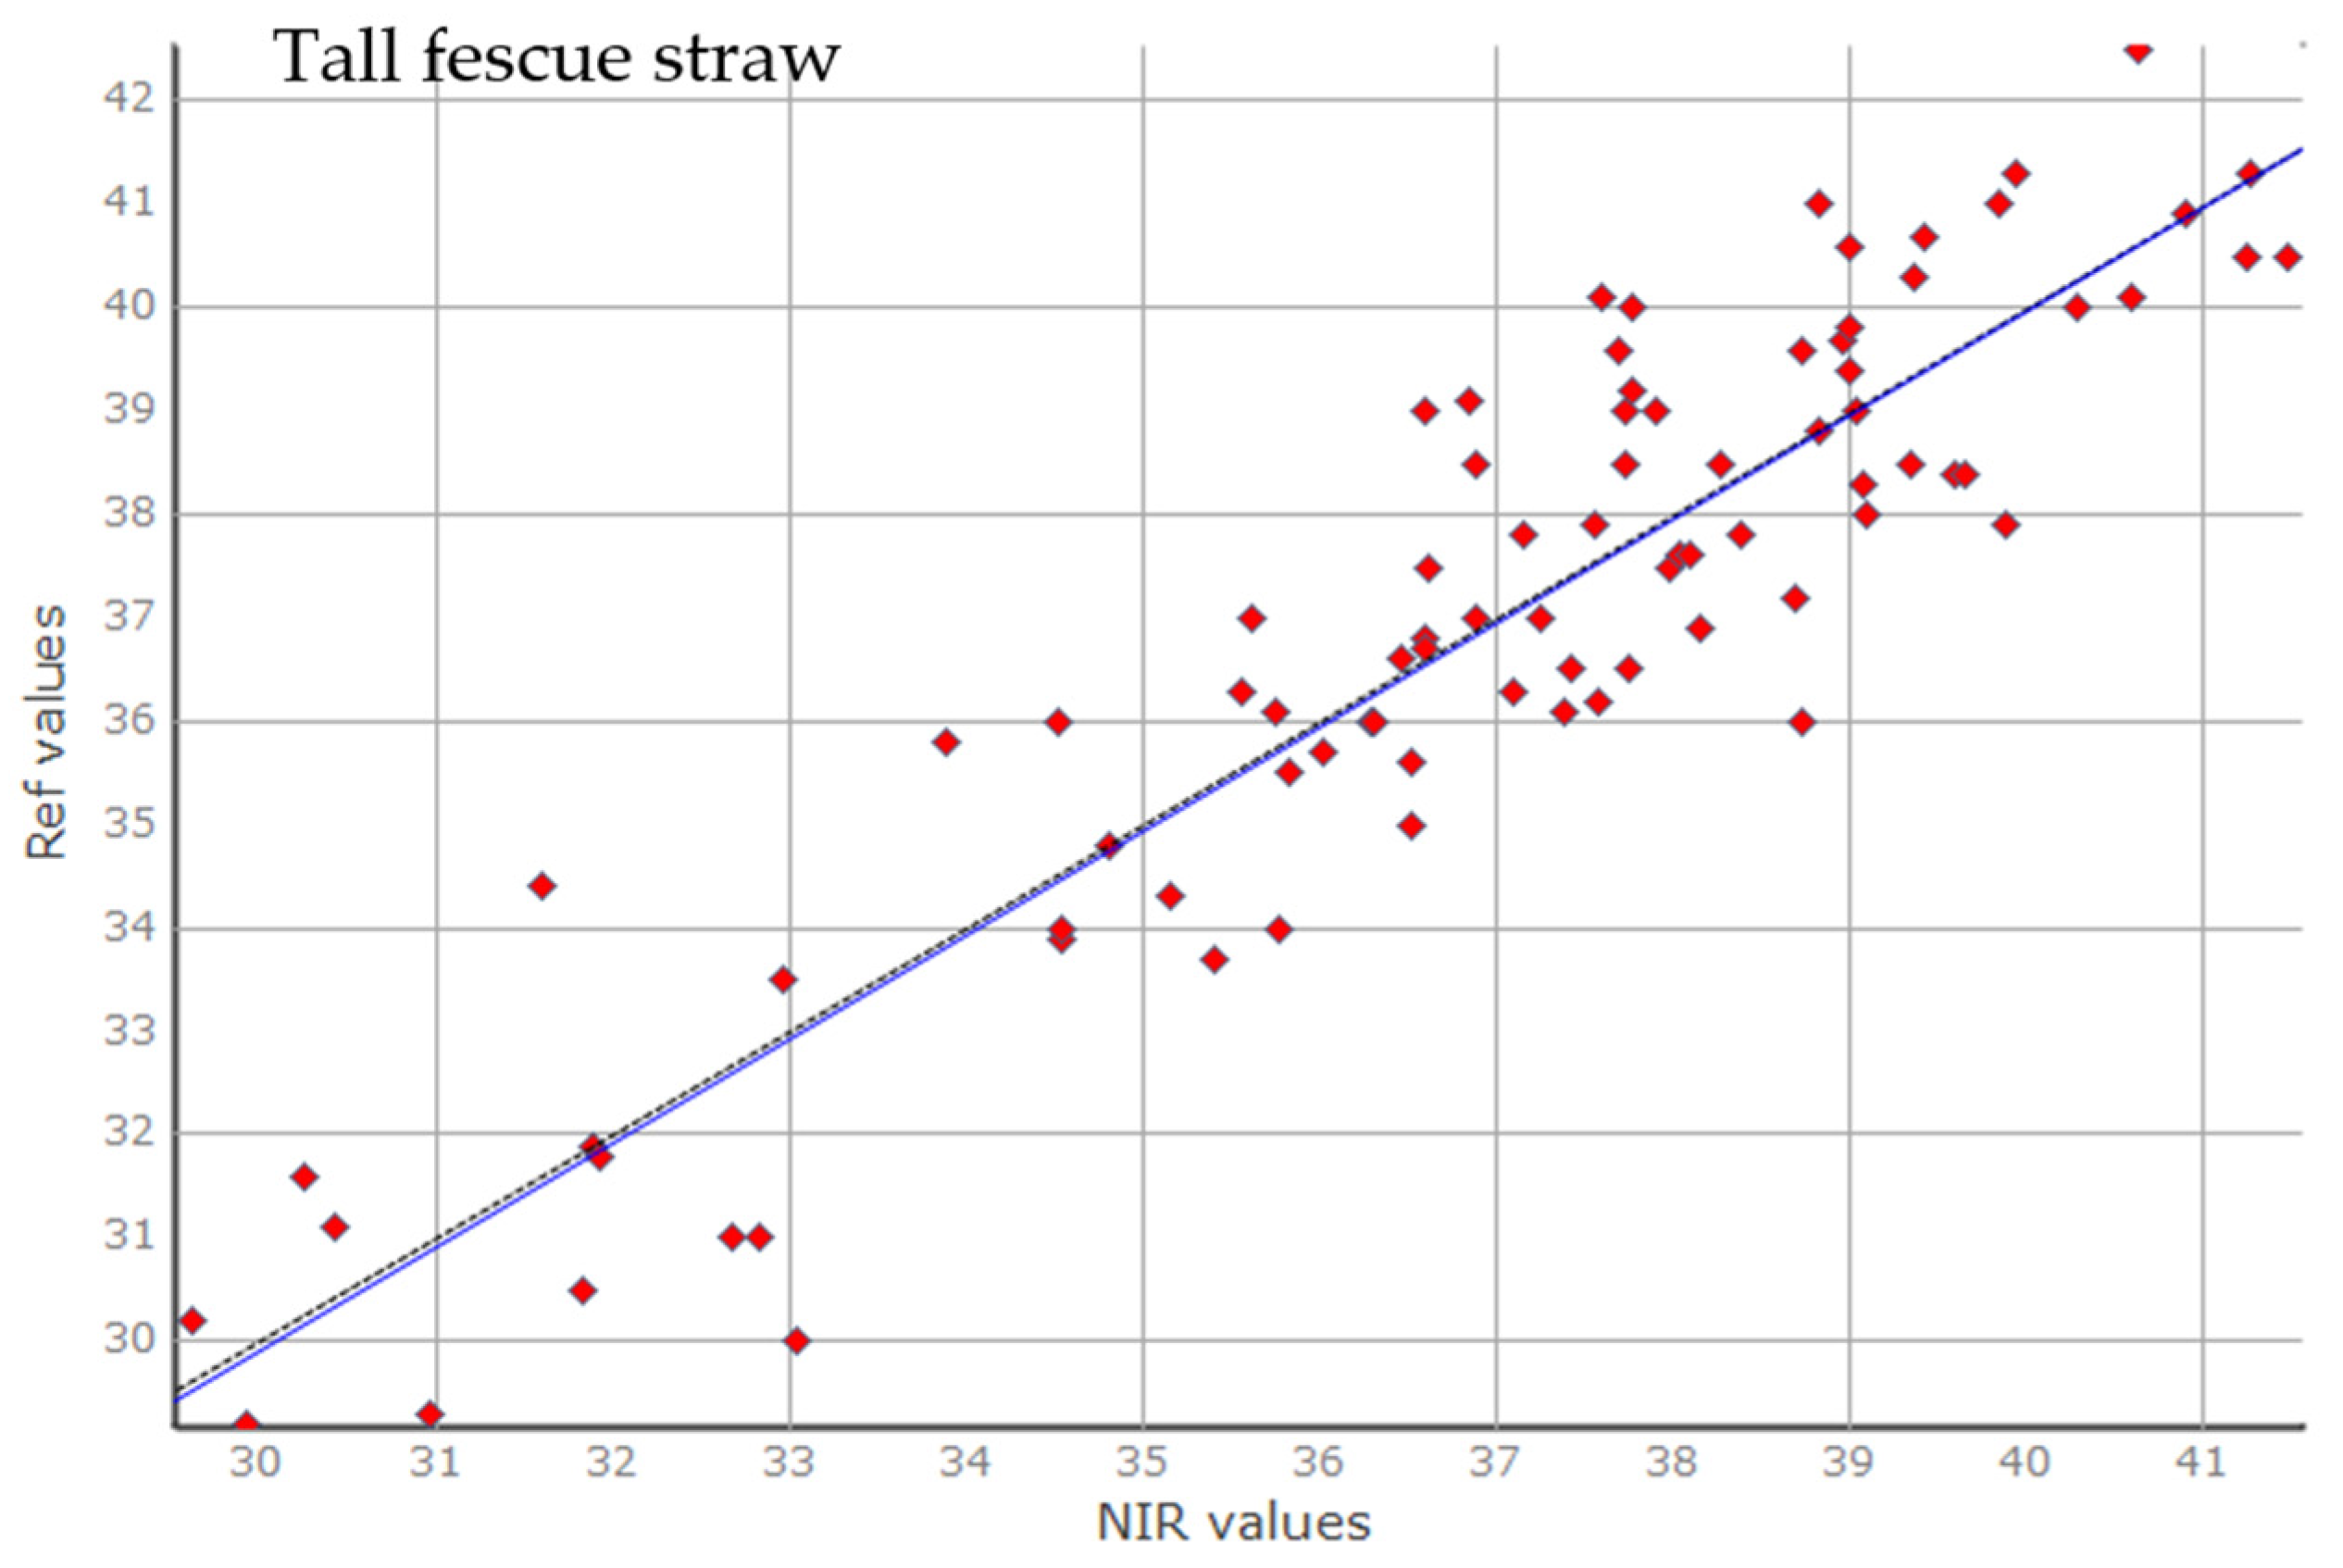
3.2.2. Prediction of uNDF Using NIRS

The calibration and cross-validation statistics for NIRS analysis of uNDF in alfalfa hay, timothy hay, and tall fescue straw are presented in Table 5. Plots of observed (in vitro fermentation as a reference method) versus predicted (NIRS) values of uNDF are also illustrated in Figure 2. After cross-validation, R2CrV was always lower than R2C, and the difference between R2C and R2CrV was wider in timothy hay and tall fescue straw than in alfalfa hay, possibly suggesting the need for a larger dataset to strengthen the calibration accuracy of timothy hay and tall fescue straw [4,69]. The NIRS statistics suggested the higher accuracy of the predictive equation developed using alfalfa hay samples (R2CrV = 0.92; SECrV = 1.16; RPD = 3.57; RER = 17.1) relative to the equations developed using timothy hay (R2CrV = 0.80; SECrV = 1.31; RPD = 2.08; RER = 10.4) and tall fescue straw datasets (R2CrV = 0.79; SECrV = 1.38; RPD = 2.18; RER = 9.64). The lower accuracy of the equations developed from timothy hay and tall fescue straw datasets compared to alfalfa hay could be explained, in part, by their higher intra-laboratory repeatability (SDr; Table 4), which is the main source of error in the calibration process [21]. As discussed in Section 3.2.1, further standardization of the in vitro rumen fermentation procedure using bags with smaller porosity could possibly result in the development of NIRS calibrations with lower prediction errors, in particular, for timothy hay and tall fescue straw. More recently, Zhang et al. [54] used a less diverse set of alfalfa hays than the present experiment (8.60–22.0 vs. 14.3–34.1% of DM) and identified comparable calibration and cross-validation statistics for uNDF prediction, with an in situ rumen incubation approach (Ankom F57 bags) as a reference method.
According to Karoui et al. [70], an R2CrV between 0.82 and 0.90 is interpreted to have an acceptable estimation of the reference value, while a value greater than 0.91 suggests an excellent estimation. This criterion implies that uNDF prediction in alfalfa hays using NIRS provided an excellent estimation but an approximate estimation for timothy hay and tall fescue straw. The poorer predictive results for timothy hay and tall fescue straw relative to alfalfa hay could possibly be related to the narrower range of uNDF values in timothy and tall fescue forages [71]. The RPD and RER values for timothy hay and tall fescue straw suggested that the models developed were moderately useful, with limited applicability for quantitative purposes [69,72,73].
Fiber fractions are made up of different chemical entities with a wide range of spectral absorption regions, making it particularly difficult to establish an accurate relationship between reference and NIRS spectra in fiber digestibility evaluations [4,74,75]. The absorbance of residual water and the occurrence of C–H bond absorbance in several spectral regions may overlap with the absorbance of the NDF components, resulting in difficulties in interpreting NIRS spectra in relation to fiber digestibility [4,75].

4. Conclusions

The multi-step enzymatic procedure overestimated uNDF concentration of the forages and resulted in values that were less repeatable than the in vitro, rumen-based technique, potentially disqualifying the enzymatic method for routine analysis of uNDF in forages. Prediction of uNDF using ADL parameter in alfalfa and timothy hays and tall fescue straw produced equations with low accuracy, demonstrating that a constant factor would be unable to adequately represent the pool size of uNDF in forages. Prediction of uNDF using NIRS resulted in development of equations with a greater accuracy in alfalfa hay than in timothy hay and tall fescue straw, possibly because of a wider range of uNDF concentrations in the alfalfa hay dataset. The predictive models developed for timothy hay and tall fescue straw were moderately accurate and could possibly be used as a screening tool for quick and qualitative estimation of uNDF in these forages. Cross-validation statistics for uNDF prediction confirmed the higher predictive accuracy of NIRS than regression technique based on ADL parameter. Additional investigation of bags with smaller porosity in the long-term incubation is recommended in order to compare their efficacy in recovery of the undigested material. The quick and satisfactorily accurate estimation of uNDF concentration using NIRS, particularly in alfalfa hay, could be useful for nutritionists and forage importers in commercial settings.

Supplementary Materials

The following supporting information can be downloaded at: https://www.mdpi.com/article/10.3390/agriculture12111914/s1, Figure S1: Ratio of undigested NDF/acid detergent lignin (ADL) versus ADL/neutral detergent fiber (NDF) using a pool of alfalfa hay, timothy hay, and tall fescue straw (n = 264).

Author Contributions

Conceptualization: F.A. and J.-G.K.; Data curation: F.A., J.-G.K. and E.-C.J.; Formal analysis: F.A., E.-C.J., Y.-F.L. and L.-L.W.; Methodology: F.A., E.-C.J. and R.B.; Software: F.A., Y.-F.L. and L.-L.W.; Validation: J.-G.K. and F.A.; Investigation: L.-L.W. and Y.-F.L.; Writing—original draft: F.A. and J.-G.K.; Writing—review and editing: J.-G.K., F.A. and R.B. All authors have read and agreed to the published version of the manuscript.

Funding

This work was supported by Korea Institute of Planning and Evaluation for Technology in Food, Agriculture and Forestry (IPET) through Livestock Industrialization Technology Development Program, funded by Ministry of Agriculture, Food and Rural Affairs (MAFRA) (121036-2).

Institutional Review Board Statement

Caring for animals was according to the guidelines of the Animal Ethical Committee (Seoul National University, Korea) under the approval number of SNU-160105-1.

Data Availability Statement

Upon reasonable request, the datasets of this study can be available from the corresponding author.

Conflicts of Interest

The authors declare no conflict of interest.

References

  1. Raffrenato, E.; Van Amburgh, M.E. Development of a mathematical model to predict sizes and rates of digestion of a fast and slow degrading pool and the indigestible NDF fraction. In Proceedings of the 2010 Cornell Nutrition Conference for Feed Manufacturers, Ithaca, NY, USA, 19–21 October 2010; pp. 52–65. [Google Scholar]
  2. Mertens, D.R. Indigestible Versus Undigested: The Distinction; Fiber Group Mtg.: Syracuse, NY, USA, 2013. [Google Scholar]
  3. Krizsan, S.; Rinne, M.; Nyholm, L.; Huhtanen, P. New recommendations for the ruminal in situ determination of indigestible neutral detergent fibre. Anim. Feed Sci. Technol. 2015, 205, 31–41. [Google Scholar] [CrossRef]
  4. Brogna, N.; Palmonari, A.; Canestrari, G.; Mammi, L.; Prà, A.D.; Formigoni, A. Technical note: Near infrared reflectance spectroscopy to predict fecal indigestible neutral detergent fiber for dairy cows. J. Dairy Sci. 2018, 101, 1234–1239. [Google Scholar] [CrossRef] [PubMed] [Green Version]
  5. Raffrenato, E.; Nicholson, C.; Van Amburgh, M. Development of a mathematical model to predict pool sizes and rates of digestion of 2 pools of digestible neutral detergent fiber and an undigested neutral detergent fiber fraction within various forages. J. Dairy Sci. 2019, 102, 351–364. [Google Scholar] [CrossRef] [Green Version]
  6. Lee, C.; Hristov, A. Evaluation of acid-insoluble ash and indigestible neutral detergent fiber as total-tract digestibility markers in dairy cows fed corn silage-based diets. J. Dairy Sci. 2013, 96, 5295–5299. [Google Scholar] [CrossRef] [Green Version]
  7. Mertens, D.R. Using uNDF to predict dairy cow performance and design rations. In Proceedings of the Four-State Dairy Nutrition and Management Conference, Dubuque, IA, USA, 15–16 June 2016; pp. 12–19. [Google Scholar]
  8. Palmonari, A.; Gallo, A.; Fustini, M.; Canestrari, G.; Masoero, F.; Sniffen, C.J.; Formigoni, A. Estimation of the indigestible fiber in different forage types. J. Anim. Sci. 2016, 94, 248–254. [Google Scholar] [CrossRef]
  9. Krizsan, S.; Huhtanen, P. Effect of diet composition and incubation time on feed indigestible neutral detergent fiber concentration in dairy cows. J. Dairy Sci. 2013, 96, 1715–1726. [Google Scholar] [CrossRef]
  10. Van Amburgh, M.; Collao-Saenz, E.; Higgs, R.; Ross, D.; Recktenwald, E.; Raffrenato, E.; Chase, L.; Overton, T.; Mills, J.; Foskolos, A. The Cornell Net Carbohydrate and Protein System: Updates to the model and evaluation of version 6.5. J. Dairy Sci. 2015, 98, 6361–6380. [Google Scholar] [CrossRef]
  11. Fustini, M.; Palmonari, A.; Canestrari, G.; Bonfante, E.; Mammi, L.; Pacchioli, M.; Sniffen, G.; Grant, R.; Cotanch, K.; Formigoni, A. Effect of undigested neutral detergent fiber content of alfalfa hay on lactating dairy cows: Feeding behavior, fiber digestibility, and lactation performance. J. Dairy Sci. 2017, 100, 4475–4483. [Google Scholar] [CrossRef] [Green Version]
  12. Huhtanen, P.; Nousiainen, J.; Rinne, M. Recent developments in forage evaluation with special reference to practical applications. Agric. Food Sci. 2006, 15, 293–323. [Google Scholar] [CrossRef] [Green Version]
  13. Goeser, J.; Hoffman, P.; Combs, D. Modification of a rumen fluid priming technique for measuring in vitro neutral detergent fiber digestibility. J. Dairy Sci. 2009, 92, 3842–3848. [Google Scholar] [CrossRef]
  14. Harper, K.J.; McNeill, D.M. The role iNDF in the regulation of feed intake and the importance of its assessment in subtropical ruminant systems (the role of iNDF in the regulation of forage intake). Agriculture 2015, 5, 778–790. [Google Scholar] [CrossRef] [Green Version]
  15. Bender, R.W.; Cook, D.E.; Combs, D.K. Comparison of in situ versus in vitro methods of fiber digestion at 120 and 288 hours to quantify the indigestible neutral detergent fiber fraction of corn silage samples. J. Dairy Sci. 2016, 99, 5394–5400. [Google Scholar] [CrossRef] [PubMed] [Green Version]
  16. Stern, M.; Bach, A.; Calsamiglia, S. Alternative techniques for measuring nutrient digestion in ruminants. J. Anim. Sci. 1997, 75, 2256–2276. [Google Scholar] [CrossRef] [PubMed]
  17. Gallo, A.; Giuberti, G.; Bruschi, S.; Fortunati, P.; Masoero, F. Technical note: Relationship between in situ NDF degradability and enzymatic NDF hydrolysis in forages, nonforage fibrous feeds, and crop residues. J. Anim. Sci. 2017, 95, 4172. [Google Scholar] [CrossRef] [PubMed]
  18. Gallo, A.; Bruschi, S.; Masoero, F. Technical note: Evaluation of a novel enzymatic method to predict in situ undigested neutral detergent fiber of forages and nonforage fibrous feeds. J. Dairy Sci. 2019, 102, 6235–6241. [Google Scholar] [CrossRef]
  19. Baath, G.S.; Baath, H.K.; Gowda, P.H.; Thomas, J.P.; Northup, B.K.; Rao, S.C.; Singh, H. Predicting forage quality of warm-season legumes by near infrared spectroscopy coupled with machine learning techniques. Sensors 2020, 20, 867. [Google Scholar] [CrossRef] [Green Version]
  20. Norman, H.C.; Hulm, E.; Humphries, A.W.; Hughes, S.J.; Vercoe, P. Broad near-infrared spectroscopy calibrations can predict the nutritional value of >100 forage species within the Australian feedbase. Anim. Prod. Sci. 2020, 60, 1111–1122. [Google Scholar] [CrossRef]
  21. Mentink, R.; Hoffman, P.; Bauman, L. Utility of near-infrared reflectance spectroscopy to predict nutrient composition and in vitro digestibility of total mixed rations. J. Dairy Sci. 2006, 89, 2320–2326. [Google Scholar] [CrossRef]
  22. Ghilardelli, F.; Ferronato, G.; Gallo, A. Near-infrared calibration models for estimating volatile fatty acids and methane production from in vitro rumen fermentation of different total mixed rations. JDS Commun. 2022, 3, 19–25. [Google Scholar] [CrossRef]
  23. Shenk, J.S.; Westerhaus, M.O. The application of near infrared reflectance spectroscopy (NIRS) to forage analysis. In Forage Quality Evaluation and Utilization; Fahey, G.C., Ed.; American Society of Agronomy: Madison, WI, USA, 1994; pp. 406–449. [Google Scholar]
  24. Harris, P.A.; Nelson, S.; Carslake, H.B.; Argo, C.M.; Wolf, R.; Fabri, F.B.; Brolsma, K.M.; van Oostrum, M.J.; Ellis, A.D. Comparison of NIRS and wet chemistry methods for the nutritional analysis of haylages for horses. J. Equine Veter. Sci. 2018, 71, 13–20. [Google Scholar] [CrossRef]
  25. Samadi; Wajizah, S.; Munawar, A.A. Near infrared spectroscopy (NIRS) data analysis for a rapid and simultaneous prediction of feed nutritive parameters. Data Brief 2020, 29, 105211. [Google Scholar] [CrossRef] [PubMed]
  26. AOAC International. Official Methods of Analysis, 19th ed.; AOAC Int.: Arlington, VA, USA, 2012. [Google Scholar]
  27. Van Soest, P.J.; Robertson, J.B.; Lewis, B.A. Methods for dietary fiber, neutral detergent fiber, and nonstarch polysaccharides in relation to animal nutrition. J. Dairy Sci. 1991, 74, 3583–3597. [Google Scholar] [CrossRef]
  28. Ankom Technology. Method 8—Determining Acid Detergent Lignin in Beakers. Available online: https://www.ankom.com/sites/default/files/document-files/Method_8_Lignin_in_beakers.pdf (accessed on 13 March 2022).
  29. Valentine, M.E.; Karayilanli, E.; Cherney, J.H.; Cherney, D.J. Comparison of in vitro long digestion methods and digestion rates for diverse forages. Crop Sci. 2019, 59, 422–435. [Google Scholar] [CrossRef]
  30. Goering, H.K.; Van Soest, P.J. Forage Fiber Analysis (Apparatus, Reagents, Procedures, and Some Applications); Agricultural Handbook no. 379; US Department Agriculture-Agricultural Research Service (USDA-ARS): Washington, DC, USA, 1970.
  31. Cotanch, K.W.; Grant, R.J.; Van Amburgh, M.E.; Zontini, A.; Fustini, M.; Palmonari, A.; Formigoni, A. Applications of uNDF in ration modeling and formulation. In Proceedings of the Cornell Nutrition Conference for Feed Manufacturers, Department of Animal Science, College of Agriculture and Life Sciences, Cornell University, Ithaca, NY, USA, 2014; pp. 114–131. [Google Scholar]
  32. Van Soest, P.J. Nutritional Ecology of the Ruminant; Cornell University Press: Ithaca, NY, USA, 1994. [Google Scholar]
  33. Coblentz, W.K.; Akins, M.S.; Ogden, R.K.; Bauman, L.M.; Stammer, A.J. Effects of sample size on neutral detergent fiber digestibility of triticale forages using the Ankom DaisyII Incubator system. J. Dairy Sci. 2019, 102, 6987–6999. [Google Scholar] [CrossRef]
  34. Barnes, R.J.; Dhanoa, M.S.; Lister, S.J. Standard normal variate transformation and de-trending of near-infrared diffuse reflectance spectra. Appl. Spectrosc. 1989, 43, 772–777. [Google Scholar] [CrossRef]
  35. De Marchi, M.; Riovanto, R.; Penasa, M.; Cassandro, M. At-line prediction of fatty acid profile in chicken breast using near infrared reflectance spectroscopy. Meat Sci. 2012, 90, 653–657. [Google Scholar] [CrossRef]
  36. Simoni, M.; Goi, A.; De Marchi, M.; Righi, F. The use of visible/near-infrared spectroscopy to predict fibre fractions, fibre-bound nitrogen and total-tract apparent nutrients digestibility in beef cattle diets and faeces. Ital. J. Anim. Sci. 2021, 20, 814–825. [Google Scholar] [CrossRef]
  37. Murphy, D.J.; Brien, B.O.; Donovan, M.O.; Condon, T.; Murphy, M.D. A near infrared spectroscopy calibration for the prediction of fresh grass quality on Irish pastures. Inf. Process. Agric. 2021, 9, 243–253. [Google Scholar] [CrossRef]
  38. Burns, G.A.; Gilliland, T.J.; Grogan, D.; Watson, S.; O’Kiely, P. Assessment of herbage yield and quality traits of perennial ryegrasses from a national variety evaluation scheme. J. Agric. Sci. 2013, 151, 331–346. [Google Scholar] [CrossRef]
  39. Bittante, G.; Patel, N.; Cecchinato, A.; Berzaghi, P. Invited review: A comprehensive review of visible and near-infrared spectroscopy for predicting the chemical composition of cheese. J. Dairy Sci. 2022, 105, 1817–1836. [Google Scholar] [CrossRef]
  40. SAS Institute. SAS User’s Guide; Version 9.1.; SAS Institute Inc.: Cary, NC, USA, 2003. [Google Scholar]
  41. Levene, H. Robust tests for equality of variances. In Contributions to Probability and Statistics: Essays in Honor of Harold Hotelling; Olkin, I., Ed.; Stanford University Press: Redwood City, CA, USA, 1961; pp. 279–292. [Google Scholar]
  42. Cattani, M.; Tagliapietra, F.; Maccarana, L.; Hansen, H.H.; Bailoni, L.; Schiavon, S. Technical note: In vitro total gas and methane production measurements from closed or vented rumen batch culture systems. J. Dairy Sci. 2014, 97, 1736–1741. [Google Scholar] [CrossRef] [PubMed] [Green Version]
  43. Rahavi, S.M.H.; Ahmadi, F.; Vahid, A.; Moinoddini, H.; Ghayour, M.; Tagliapietra, F. Technical note: Design, development and validation of an automated gas monitoring equipment for measurement of the dynamics of microbial fermentation. MethodsX 2022, 9, 101641. [Google Scholar] [CrossRef] [PubMed]
  44. ISO 5725-1; Accuracy (Trueness and Precision) of Measurement Methods and Results—Part 1: General Principles and Definitions. ISO: Geneva, Switzerland, 1994.
  45. ISO 5725-2; Accuracy (Trueness and Precision) of Measurement Methods and Results—Part 2: Basic Method for the Determination of Repeatability and Reproducibility of a Standard Measurement Method. ISO: Geneva, Switzerland, 1994.
  46. Williams, P.C. Variables affecting near-infrared reflectance spectroscopic analysis. In Near-Infrared Technology in the Agricultural and Food Industries; American Association of Cereal Chemists: St. Paul, MN, USA, 1987; pp. 143–167. [Google Scholar]
  47. Van Soest, P.J.; Mertens, D.R.; Deinum, B. Preharvest factors influencing quality of conserved forage. J. Anim. Sci. 1978, 47, 712–720. [Google Scholar] [CrossRef]
  48. Rinne, M.; Olt, A.; Nousiainen, J.; Seppälä, A.; Tuori, M.; Paul, C.; Fraser, M.D.; Huhtanen, P. Prediction of legume silage digestibility from various laboratory methods. Grass Forage Sci. 2006, 61, 354–362. [Google Scholar] [CrossRef]
  49. Palmonari, A.; Fustini, M.; Canestrari, G.; Grilli, E.; Formigoni, A. Influence of maturity on alfalfa hay nutritional fractions and indigestible fiber content. J. Dairy Sci. 2014, 97, 7729–7734. [Google Scholar] [CrossRef] [Green Version]
  50. Rymer, C.; Williams, B.A.; Brooks, A.E.; Davies, D.R.; Givens, D.I. Inter-laboratory variation of in vitro cumulative gas production profiles of feeds using manual and automated methods. Anim. Feed Sci. Technol. 2005, 123–124, 225–241. [Google Scholar] [CrossRef]
  51. Kim, J.D.; Seo, M.; Lee, S.C.; Han, K.-J. Review of the current forage production, supply, and quality measure standard in South Korea. J. Korean Soc. Grassl. Forage Sci. 2020, 40, 149–155. [Google Scholar] [CrossRef]
  52. Ahmadi, F.; Lee, Y.; Ko, M.; Choi, D.; Kwak, W. In situ ruminal degradation characteristics of dry matter and crude protein of imported hays marketed to the Korean cattle industry: A field study. Food Agric. Environ. 2017, 15, 80–85. [Google Scholar]
  53. Rohweder, D.A.; Barnes, R.F.; Jorgensen, N. Proposed hay grading standards based on laboratory analyses for evaluating quality. J. Anim. Sci. 1978, 47, 747–759. [Google Scholar] [CrossRef]
  54. Zhang, G.J.; Wang, Y.; Yan, Y.H.; Hall, M.H.; Undersander, D.J.; Combs, D.K. Comparison of two in situ reference methods to estimate indigestible NDF by near infrared reflectance spectroscopy in alfalfa. Heliyon 2021, 7, e07313. [Google Scholar] [CrossRef]
  55. Raffrenato, E.; Van Amburgh, M.E. Improved methodology for analyses of acid detergent fiber and acid detergent lignin. J. Dairy Sci. 2011, 94, 3613–3617. [Google Scholar] [CrossRef] [PubMed]
  56. Akin, D.E. Histological and physical factors affecting digestibility of forages. Agron. J. 1989, 81, 17–25. [Google Scholar] [CrossRef]
  57. Wilson, J.; Kennedy, P.M. Plant and animal constraints to voluntary feed intake associated with fibre characteristics and particle breakdown and passage in ruminants. Aust. J. Agric. Res. 1996, 47, 199–225. [Google Scholar] [CrossRef]
  58. Udén, P. Recovery of insoluble fibre fractions by filtration and centrifugation. Anim. Feed Sci. Technol. 2006, 129, 316–328. [Google Scholar] [CrossRef]
  59. Raffrenato, E.; Ross, D.A.; Van Amburgh, M.E. Development of an in vitro method to determine rumen undigested aNDFom for use in feed evaluation. J. Dairy Sci. 2018, 101, 9888–9900. [Google Scholar] [CrossRef] [PubMed]
  60. Krämer, M.; Nørgaard, P.; Lund, P.; Weisbjerg, M. Particle size alterations of feedstuffs during in situ neutral detergent fiber incubation. J. Dairy Sci. 2013, 96, 4601–4614. [Google Scholar] [CrossRef] [Green Version]
  61. Kitessa, S.; Irish, G.G.; Flinn, P.C. Comparison of methods used to predict the in vivo digestibility of feeds in ruminants. Aust. J. Agric. Res. 1999, 50, 825–842. [Google Scholar] [CrossRef] [Green Version]
  62. Hristov, A.; Harper, M.; Roth, G.; Canale, C.; Huhtanen, P.; Richard, T.; DiMarco, K. Effects of ensiling time on corn silage neutral detergent fiber degradability and relationship between laboratory fiber analyses and in vivo digestibility. J. Dairy Sci. 2020, 103, 2333–2346. [Google Scholar] [CrossRef]
  63. Raffrenato, E.; Lombard, R.; Erasmus, L.; McNeill, D.; Barber, D.; Callow, M.; Poppi, D. Prediction of indigestible NDF in South African and Australian forages from cell wall characteristics. Anim. Feed Sci. Technol. 2018, 246, 104–113. [Google Scholar] [CrossRef]
  64. Fukushima, R.; Kerley, M.; Ramos, M.; Kallenbach, R. The acetyl bromide lignin method accurately quantitates lignin in forage. Anim. Feed Sci. Technol. 2021, 276, 114883. [Google Scholar] [CrossRef]
  65. Lowry, J.B.; Conlan, L.L.; Schlink, A.C.; McSweeney, C.S. Acid detergent dispersible lignin in tropical grasses. J. Sci. Food Agric. 1994, 65, 41–49. [Google Scholar] [CrossRef]
  66. Kondo, T.; Mizuno, K.; Kato, T. Variation in solubilities of lignin in acid detergent and in alkali. J. Jpn. Grassl. Sci. 1987, 33, 296–299. [Google Scholar]
  67. Weisbjerg, M.R.; Lund, P.; Chrenkova, M.; Larsen, M.K. Estimation of indigestible NDF (iNDF) in forages. In Proceedings of the 3rd EAAP International Symposium on Energy and Protein Metabolism and Nutrition, Parma, Italy, 6–10 September 2010; Wageningen Academic Publishers: Wageningen, The Netherlands, 2010; pp. 721–722. [Google Scholar]
  68. Van Soest, P.J.; Van Amburgh, M.E.; Robertson, J.B.; Knaus, W.F. Validation of the 2.4 times lignin factor for ultimate extent of NDF digestion, and curve peeling rate of fermentation curves into pools. In Proceedings of the Cornell Nutritional Conference for Feed Manufacturers, Cornell University, Ithaca, NY, USA, 18–20 October 2005; pp. 139–149. [Google Scholar]
  69. Campbell, M.; Ortuño, J.; Koidis, A.; Theodoridou, K. The use of near-infrared and mid-infrared spectroscopy to rapidly measure the nutrient composition and the in vitro rumen dry matter digestibility of brown seaweeds. Anim. Feed Sci. Technol. 2022, 285, 115239. [Google Scholar] [CrossRef]
  70. Karoui, R.; Mouazen, A.M.; Dufour, E.; Pillonel, L.; Picque, D.; Bosset, J.-O.; De Baerdemaeker, J. Mid-infrared spectrometry: A tool for the determination of chemical parameters in Emmental cheeses produced during winter. Le Lait 2006, 86, 83–97. [Google Scholar] [CrossRef] [Green Version]
  71. Albanell, E.; Martínez, M.; De Marchi, M.; Manuelian, C.L. Prediction of bioactive compounds in barley by near-infrared reflectance spectroscopy (NIRS). J. Food Compos. Anal. 2021, 97, 103763. [Google Scholar] [CrossRef]
  72. Cherney, J.H.; Digman, M.F.; Cherney, D.J. Handheld NIRS for forage evaluation. Comput. Electron. Agric. 2021, 190, 106469. [Google Scholar] [CrossRef]
  73. Gohain, B.; Kumar, P.; Malhotra, B.; Augustine, R.; Pradhan, A.K.; Bisht, N.C. A comprehensive Vis-NIRS equation for rapid quantification of seed glucosinolate content and composition across diverse Brassica oilseed chemotypes. Food Chem. 2021, 354, 129527. [Google Scholar] [CrossRef]
  74. Berzaghi, P.; Cozzi, G.; Andrighetto, I. The use of near infrared analysis for in situ studies. J. Dairy Sci. 1997, 80, 3263–3270. [Google Scholar] [CrossRef]
  75. Nousiainen, J.; Ahvenjärvi, S.; Rinne, M.; Hellämäki, M.; Huhtanen, P. Prediction of indigestible cell wall fraction of grass silage by near infrared reflectance spectroscopy. Anim. Feed Sci. Technol. 2004, 115, 295–311. [Google Scholar] [CrossRef]
Figure 1. Undigested NDFom regressed on acid detergent lignin, as classified by forage type (experiment 2).
Agriculture 12 01914 g001
Figure 2. Plots of reference (observed) versus NIRS values (predicted) of undigested aNDFom concentration of alfalfa hay, timothy hay, and tall fescue straw (experiment 2). Plots were created using a calibration dataset that was devoid of outliers.
Agriculture 12 01914 g002aAgriculture 12 01914 g002b
Table 1. Chemical composition of forage species used in experiment 1.
Forage SpeciesChemical Composition, % of DM
DM, %CPNDFADFADL
Alfalfa hay92.516.352.137.07.40
Timothy hay91.15.7365.837.86.08
Tall fescue straw92.94.6169.241.17.11
Sorghum-sudangrass hybrid, whole plant93.55.6568.140.94.51
Corn silage, whole plant91.96.1151.926.83.63
Proso millet, whole plant93.06.6362.835.94.25
DM = dry matter. CP = crude protein (total nitrogen × 6.25). NDF = neutral detergent fiber. ADF = acid detergent fiber. ADL = acid detergent lignin. Each value is an average of 3 analytical replications.
Table 2. Precision parameters associated with undigested NDF determination in various forages by the in vitro method versus enzymatic method (experiment 1).
ItemsUndigested NDFom, % of DMp Value
In Vitro MethodEnzymatic Method
Forage species
Alfalfa hay27.1 ± 0.6326.8 ± 1.240.61
Timothy hay22.2 ± 3.2333.4 ± 1.83<0.01
Tall fescue straw32.1 ± 0.6437.4 ± 1.22<0.01
Sudangrass, whole plant23.9 ± 0.9333.1 ± 1.54<0.01
Corn, whole plant16.1 ± 0.7322.4 ± 1.07<0.01
Proso millet, whole plant24.0 ± 0.6230.5 ± 1.87<0.01
Levene’s test 1, % of DM3.824.220.45
Repeatability coefficient, % 297.492.3
Each value is an average of 12 determinations (6 observations/run) ± standard deviation. 1 The Levene’s test for evaluation of homogeneity of the variance between the two methods. 2 Repeatability coefficient = σ 2 R + σ 2 F + σ 2 R × F σ 2 R + σ 2 F + σ 2 R × F + σ 2 e × 100 , where σ2R = variance between runs, σ2F = variance among forages, and σ2R×F = run × forage variance.
Table 3. Descriptive statistics of chemical composition and nutritive value of alfalfa hay, timothy hay, and tall fescue straw (experiment 2).
ItemsMeanMinimumMaximumSD
Alfalfa hay (n = 88)
Dry matter, %91.789.694.41.08
Neutral detergent fiber, % of DM50.139.561.63.43
Acid detergent fiber, % of DM34.827.243.73.41
Acid detergent lignin 1, % of DM8.916.0911.61.24
Crude protein, % of DM15.811.121.22.31
Relative feed value 211684.214612.1
Timothy hay (n = 88)
Dry matter, %90.285.992.01.16
Neutral detergent fiber, % of DM67.163.970.61.72
Acid detergent fiber, % of DM38.132.941.91.99
Acid detergent lignin, % of DM6.885.598.990.73
Crude protein, % of DM5.602.4010.81.84
Relative feed value82.274.791.53.90
Tall fescue straw (n = 88)
Dry matter, %92.688.795.61.10
Neutral detergent fiber, % of DM69.365.175.72.25
Acid detergent fiber, % of DM40.435.145.52.25
Acid detergent lignin, % of DM7.225.249.260.65
Crude protein, % of DM4.793.017.380.85
Relative feed value77.265.788.54.66
Each value is an average of 3 analytical replications. SD = standard deviation. 1 Acid detergent lignin was measured after cellulose solubilization with 72% H2SO4. 2 Calculated using the equation of Rohweder et al. [53]: ((digestible dry matter × dry matter intake)/1.29), where digestible dry matter was calculated as (88.9 − (0.779 × ADF%)), and dry matter intake as (120/(NDF%)).
Table 4. Descriptive statistics of undigested NDFom concentration (% of DM) from three forage species used in building the calibration dataset (experiment 2) 1.
StatisticsForage Species
Alfalfa HayTimothy HayTall Fescue Straw
Minimum14.317.124.5
Maximum34.132.843.7
Range19.815.719.2
Mean24.922.136.8
Standard deviation4.103.273.42
SDr0.561.050.73
Range/SDr35.423.325.9
1 Undigested NDFom was determined using the in vitro ruminal fermentation method (240 h) with an Ankom DaisyII incubator. Range = maximum − minimum. Repeatability standard deviation (SDr) was calculated as: i = 1 n D i 2 2 n , where n = number of observations (n = 88) and Di = the difference between duplicates. The in vitro experiment was performed in two runs, with two replications of each sample in each run. For SDr calculation, each replicate observation in two runs was pooled, resulting in duplicate data/each sample.
Table 5. Calibration and cross-validation statistics for NIRS analysis of undigested NDFom (uNDF, % of DM) using in vitro fermentation procedure (experiment 2) 1.
StatisticsForage Species
Alfalfa HayTimothy HayTall Fescue Straw
N 2868381
Outliers257
Mathematical treatment 34, 16, 16
SNV + detrend
4, 16, 16
SNV + detrend
2, 16, 16
SNV + detrend
PLS factors 4794
Calibration statistics 5
Standard deviation4.142.733.01
Mean24.921.936.9
R2C0.950.900.82
SEC0.890.861.26
Cross-validation statistics 6
R2CrV0.920.800.79
SECrV1.161.311.38
RPD3.572.082.18
RER17.110.49.64
1 In vitro fermentation procedure was a long-term incubation with rumen fluid (240 h) using an Ankom DaisyII incubator. 2 Number of samples, exclusive of outliers, used in building the calibration dataset. 3 In mathematical treatments, the first, second, third, and fourth numbers indicate derivative order, gap (nm) over which the derivatives are computed, and derivative smooth, respectively. Detrend and standard normal variate (SNV) were utilized as scatter corrective methods. 4 Number of factors in partial least square equation, which was selected according to the maximum R2C and minimum SEC. 5 R2C = coefficient of determination of calibration. SEC = standard error of calibration. 6 R2CrV = coefficient of determination of cross-validation. SECrV = standard error of cross-validation. RPD = ratio percentage deviation (standard deviation/SECrV). RER = range error ratio (range/SECrV).
Publisher’s Note: MDPI stays neutral with regard to jurisdictional claims in published maps and institutional affiliations.

