1. Introduction
Conventional tillage practices aim to create appropriate conditions for plant germination, establishment, and growth [
1]. Extensive research has been conducted to investigate the impact of different management practices on soil hydraulic properties under various conditions and crop cultivations. Nonetheless, it is difficult to identify the most appropriate management procedure to be implemented in agricultural areas, as they are subject to temporal and spatial variability of plant growth, climate, and soil type [
2].
Soil deterioration is a widespread issue across tropical countries. It is, in general, related to soil structure degradation, which leads to alterations in the soil pore distribution, porosity, and hydraulic properties. These modifications, in turn, typically influence water infiltration, runoff, storage, thermal conductivity, air permeability, and soil penetration resistance [
3,
4]. Tillage is also associated with changes in soil reconsolidation, soil aggregate size distribution, soil organic carbon, nutrient profile, microbial activity, species diversity, the population of earthworms, etc. [
5].
The predominant agricultural management practices in Brazil are conventional tillage (CT), minimum tillage (MT), and no tillage (NT). Due to intense agricultural procedures, CT is mainly characterized by promoting substantial changes in soil structure associated with the preparation of a seedbed. In tropical soils, it can often induce erosive processes, soil compaction, and migration of fine particles to the soil’s deeper layers [
6]. Conservation management practices were introduced in the early 1960s in the USA and the early 1970s in Brazil. They appeared as an alternative for minimizing risks of soil erosion, non-point source pollution, and the high cost of fuel associated with CT [
5]. Conservation management practices, such as NT and MT, have been widely promoted in many regions as an important way to enhance soil quality and improve agronomic productivity [
7].
In contrast to CT, MT and NT are characterized by minimum disturbance to soil structure. These managements have frequently demonstrated positive impacts on soil conservation due to the increase in water infiltration rate, plant available water, and decrease in surface runoff. They are considered conservation management practices, as the intensive land preparation induced by harrowing and plowing operations in CT is minimized or even removed under MT and NT [
6]. There are studies indicating that bulk density can increase and total porosity can decrease with NT as compared to tilled soils [
1]. Nonetheless, some results indicate a more stable soil structure in the NT soils, especially over time, as well as an increased number of continuous earthworm channels that are connected to the soil surface, a greater presence of macropores in the soil pore system, and more connected pores, as compared with CT [
1,
6,
8,
9].
Soil structural modifications are frequently used for inferring changes in soil hydraulic characteristics. Nonetheless, only ‘global’ information can be extracted from traditional methods of investigation, i.e., a single reading from a single sample. Advances in X-ray Computed Tomography (XCT) have permitted a more detailed and accurate study of the soil’s morphologic pore space characteristics importantly in three dimensions (3D) and in an undisturbed fashion [
10,
11]. Depending on the sample characteristic dimensions and the X-ray beam energy, the XCT image resolution can reach few micrometers.
There is increasing interest in the study of 3D morphological properties of the soil structure. Despite its high cost, XCT has been demonstrated to be effective for the kind of study proposed here [
9]. Important pore morphological characteristics can be obtained and analyzed by XCT [
9,
12,
13,
14,
15]. Studies quantifying pore distribution in terms of equivalent diameters, pore connectivity, pore coordination number, pore continuity, and pore tortuosity, have been presented in the recent literature [
6,
16,
17]. In addition, some aspects related to soil water retention characteristics have been established by using XCT reconstructed images [
18,
19,
20]. This approach has been used for investigating how agricultural procedures and natural phenomena can modify the soil structure [
3,
4,
6,
7].
Although numerous papers in the scientific literature have used XCT to study soil morphological properties, there is still only a small number of papers analyzing the morphological and geometrical properties of pores within small aggregates (a few centimeters in diameter) [
9,
12,
13,
14,
15,
16]. This is likely due to the difficulty in accessing XCT scanners that can provide sufficient image resolution at this pore size scale. The number of articles becomes even scarcer when soils subjected to more conservationist, long-term management practices (>40 years) are analyzed. In addition, there are few studies addressing the impact of conservation agriculture on weathered tropical soils and what happens to their morphological properties over time at the scale of a few micrometers in 3D. Hence, this study aimed to use 3D XCT images to quantify the soil pore system modifications introduced by conservation management practices, such as MT and NT, compared to samples under secondary forest. We tested the following hypotheses: (1) the secondary forest samples are characterized by a more complex pore system at the scale of small soil aggregates, and (2) after long-term conservation management practices, a soil pore system similar to those found in the secondary forest, considered as a reference, will develop.
2. Materials and Methods
2.1. Soil Sampling
An Oxisol from the experimental farm of the “Instituto de Desenvolvimento Rural do Paraná” near the city of Ponta Grossa, Brazil (−25.15, −50.15, 875 m a.s.l.) was analyzed in order to assess the impact of long-term conservation management practices on soil pore morphology. The area selected for the study has gentle slopes ranging from 2 to 7%. The soil development is from clastic sediments of the Devonian period characterized by a mixture of the Ponta Grossa shale. The soil profile shows a deep and well-structured soil, possessing high porosity, allowing good soil drainage conditions [
21]. The regional climate (Köppen classification) is a humid mesothermal Cfb-subtropical with mild summers. The annual average rainfall is approximately 1505 mm, with an average annual temperature of 18.3 °C, with some frost occurrences in the coldest months (June to August).
In 1967, some areas under native forest in the experimental study area were converted to pasture. Soil preparation involved plowing at a depth of 20 cm, followed by a double disk pass to break up soil aggregates. Eleven years later (1978), after grazing, the experimental area was converted for the cultivation of agricultural crops. Initially, rice (
Oryza sativa L.) was grown for two years, and soybean (
Glycine max, L. Merril) for one year. Then, the experimental area was divided (1981) into three management practices: conventional tillage (CT), minimum tillage, and no tillage [
21] (see
Supplementary Figure S1).
As described, the experimental sites had been under no tillage and minimum tillage practices since 1981. Another area, under a secondary forest adjacent to the experimental fields, was selected as a comparison and to reference an undisturbed condition. The choice of this experimental field was due to the long-term experiment carried out under these two management practices [
21]. According to USDA soil taxonomy, the Rhodic Hapludox soil (Oxisol) studied has a clay texture [
22]. More details about some of the soil characteristics can be found in Pires et al. [
23] and Cássaro et al. [
24].
Thus, the main plots analyzed consisted of three systems (no tillage—NT, minimum tillage—MT, and secondary forest—SF). The area under MT had been cultivated using chisel tillage (25 cm depth) followed by narrow disking (10 cm depth), causing minimum soil disturbance. The crop residues were maintained at the soil surface. The area under NT had not undergone any cultivation disturbance since 1981. In this tillage system, the agricultural traffic was restricted to sowing equipment, with a cutting disc for sowing the summer and winter crops. The tilled areas consisted of the following crop rotations: oats (Avena strigosa), vetch (Vicia sativa), or wheat (Triticum aestivum L.) in winter, and corn (Zea mays) or soybean (Glycine max) in summer.
Eighteen soil samples were collected by taking undisturbed cores of c. 91 cm3 (c. 5.0 cm high and c. 4.8 cm inner diameter) from each experimental plot from the 0–10 cm layer. All the samples were taken before soil preparation for a new crop production season. The topsoil vegetation (crop residues) was removed prior to sampling. The soil cores were inserted into the topsoil through hammering using stainless steel volumetric rings (cylinders). Following sampling, soil cores were wrapped in plastic and transported to the laboratory for preparation. In the laboratory, the soil excess outside the steel cylinders was carefully trimmed off, and the top and bottom surfaces of the samples were made flat to ensure that the soil volume was equal to the internal volume of the cylinder. Six samples were taken from each experimental area, totaling eighteen (6 samples × 3 systems).
Prior to XCT imaging, small soil aggregates (c. 2.0 cm length) were extracted from the cores after soil drying (oven drying for two weeks at 40 °C). The aggregate extraction was necessary to increase image resolution relative to XCT images obtained for the core samples [
23]. Only the most stable aggregates, i.e., those that did not break into aggregates smaller than 2 cm after breaking up the cores using a spade, were chosen for the XCT analysis. Preference was given to the innermost aggregates (distant from the core borders) to avoid compacted regions due to the force required for soil sampling.
2.2. X-ray Computed Tomography (XCT) and Image Processing
The soil aggregates were scanned with X-rays generated at 90 kV voltage and 70 μA current. A total of 1800 image projections were captured from each sample with an exposure time of 750 ms over a rotation of 360°. The voxel size obtained for the reconstructed 3D tomographs was 5.25 μm. The X-ray scanner used was a Nanotom microCT scanner (Phoenix X-ray/GE Measurement & Control Systems at the Hounsfield Facility, The University of Nottingham, Sutton Bonington Campus, UK) composed of a 180 kV nano focus X-ray source offering high-resolution images, from small (1 mm) to medium (70 mm) sized samples. The imaging system was a 5 MP CMOS digital detector. A 0.1 mm thick copper filter was placed in front of the X-ray source to remove low-frequency X-rays (beam-hardening artifact reduction). The 3D images were reconstructed using Phoenix datos-x2 rec reconstruction software. Images were reconstructed in 16-bit grayscale, aiming to avoid overlapping gray tones.
All the images were submitted to a 3D median filter with a radius of two voxels, followed by an unsharp mask with a standard deviation of one voxel and a weight of 0.8, to reduce noise and artifacts. The image segmentation procedure was undertaken using ImageJ/Fiji software (version 1.42) [
25]. The images were binarized into two phases: pores and soil matrix (see
Supplementary Figure S2). The Otsu algorithm was selected for image segmentation. The refinement on the threshold limits for segmenting each of the 3D images was made upon visual inspection utilizing the zoom-in tool (ImageJ/Fiji) in different portions and slices.
Before the quantification, XCT images were cropped using the Region of Interest (ROI) tool in ImageJ/Fiji. This procedure provided 600 images per sample with sizes of 500 × 500 pixels. We decided to eliminate pores smaller than nine voxels from the image analysis in order to avoid misclassification of noise from the non-solid fraction of the soil samples [
26].
2.3. Aggregate Pore Architecture Analysis
The ImageJ/Fiji software was employed for the quantification of different pore system parameters. Specific plugins were used for measuring the imaged porosity (P), the number of pores (NP), the degree of anisotropy (DA), the pore connectivity (EN), the pore tortuosity (τ), pore skeleton properties, and pore size and shape distributions. The P and NP were calculated considering the volume of pores (Vp) inside the total volume (Vt) analyzed (ROI) (). The module Particle Analyzer in ImageJ/Fiji was utilized to obtain P and NP.
The DA was analyzed through the module Anisotropy in BoneJ [
27]. This tool allowed us to obtain information about the directionality of the pores, i.e., to verify if a specific structure has a particular orientation or not. The shortest (s) and longest (l) radius of a fitted ellipsoid are utilized for calculating DA (
). When the ellipsoid is close to a sphere, we have a DA close to 0.0 (isotropic image). On the other hand, elongated ellipsoids indicate a DA close to 1.0 (anisotropic image). The connectivity of the pores was based on the Euler number (EN) obtained using the module Connectivity in BoneJ. This software scans the region of interest, counting the number of isolated clusters or islands (I), holes (H), and branches (B) to calculate the EN value (
).
The pore tortuosity was determined using the plugin Tortuosity, developed by Roque and Costa [
28]. This parameter is calculated by the ratio of the geodesic distance (d
g) to the Euclidian distance (d
e), considering two points in a connected pore path (
). When τ equals the unit, we have a non-sinuous pore (rectilinear), while pores having sinuosity present increasing values of τ (>1). The modules Skeletonize 3D and Analyze Skeleton in BoneJ were employed for calculating the number of networks (N
net), number of branches (N
branch), number of junctions (N
junct), and maximum branch length (BrL). The last parameter indicates the length of the longest branch detected.
The classification of the pores based on their shapes was made considering the major, intermediate, and minor axes of the ellipsoids representing each pore in the 3D images [
23]. The module Particle Analyzer in ImageJ/Fiji was utilized for fitting the ellipsoids. The 3D shape classification was performed according to Zingg [
29], based on the relations between the ellipsoid axes (intermediate/major and minor/intermediate). In our paper, pores were classified as Equant (EQ), Prolate (PR), Oblate (OB), and Triaxial (TR) (see
Supplementary Figure S3 and
Supplementary Table S1). We also evaluated the contribution of the unclassified pores (NC) to the imaged porosity. These NC pores mean one of the ellipsoid axes was not determined, which is associated with the complexity of individual pores. As the size of pores plays an important role in the movement and retention of solutes, we determined the pore size (volume) distribution using the module Particle Analyzer in ImageJ/Fiji. All of the pores were divided into four size intervals: <0.01, 0.01–0.1, 0.1–1, and >1 mm
3.
2.4. Statistical Analyses
All statistical analyses were performed using PAST (PAleontological STatistics) software [
30]. Differences in the soil morphological parameters were evaluated by a one-way analysis of variance (ANOVA), followed by Tukey’s HSD post hoc tests. Results were classified as statistically significant at a 95% confidence level. The normality and homogeneity of the data were checked after the residual diagnosis. When necessary, data transformation was performed. The mean and standard errors were the other parameters used to show differences between management practices. Pearson correlations among each pair of variables were measured for the morphological properties (see
Supplementary Figure S4). This analysis was carried out considering all the systems together, aiming to show possible general tendencies among the variables analyzed.
3. Results
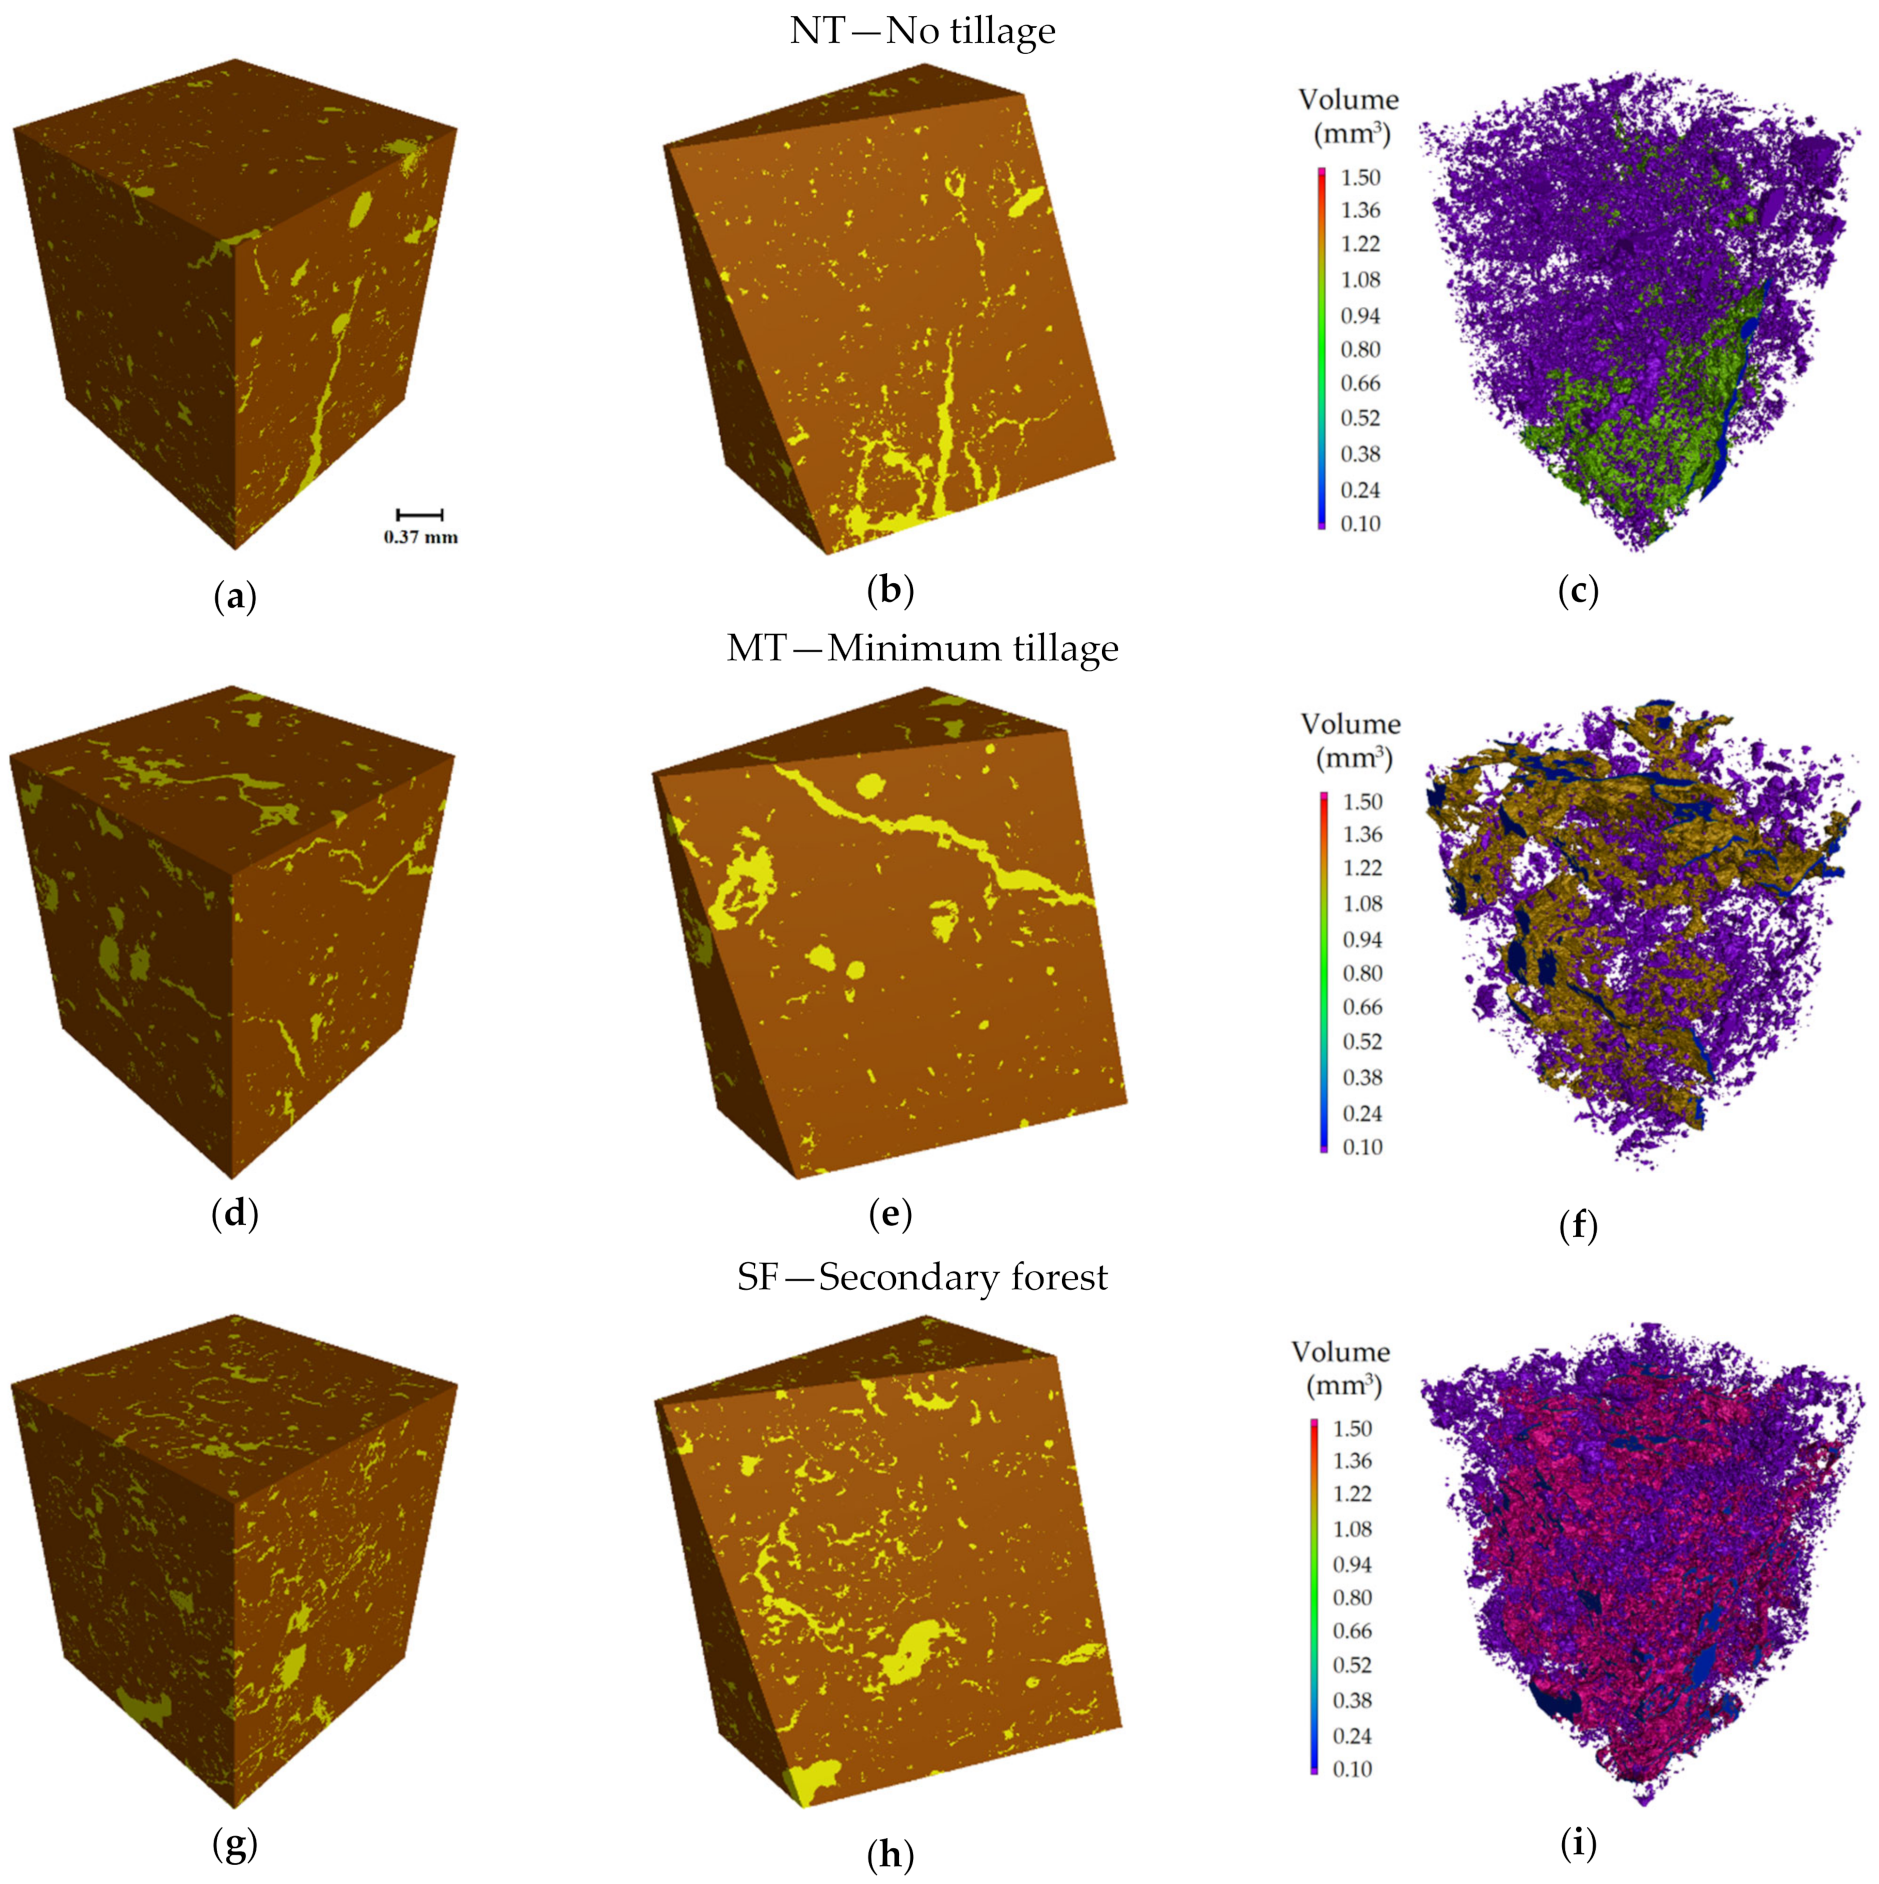
Example regions of interest from the soil aggregates are shown in
Figure 1. These results demonstrate that the soil samples from SF visually presented the highest porosity (
Figure 1g,h) compared to the samples from NT (
Figure 1a,b) and MT (
Figure 1d,e). A greater number of isolated pores (yellow regions) characterized the soil aggregates under NT and MT compared to SF. Through the analysis of the 3D images, it is possible to verify that SF presents a significant portion of the porous system occupied by larger pore volumes (
Figure 1i). The distribution of pores based on volume in the aggregates under MT (
Figure 1f) appeared similar to the aggregates under NT (
Figure 1c). These qualitative results indicate that the tillage operations’ effect was similar between NT and MT, reducing the volume of the pores in relation to SF.
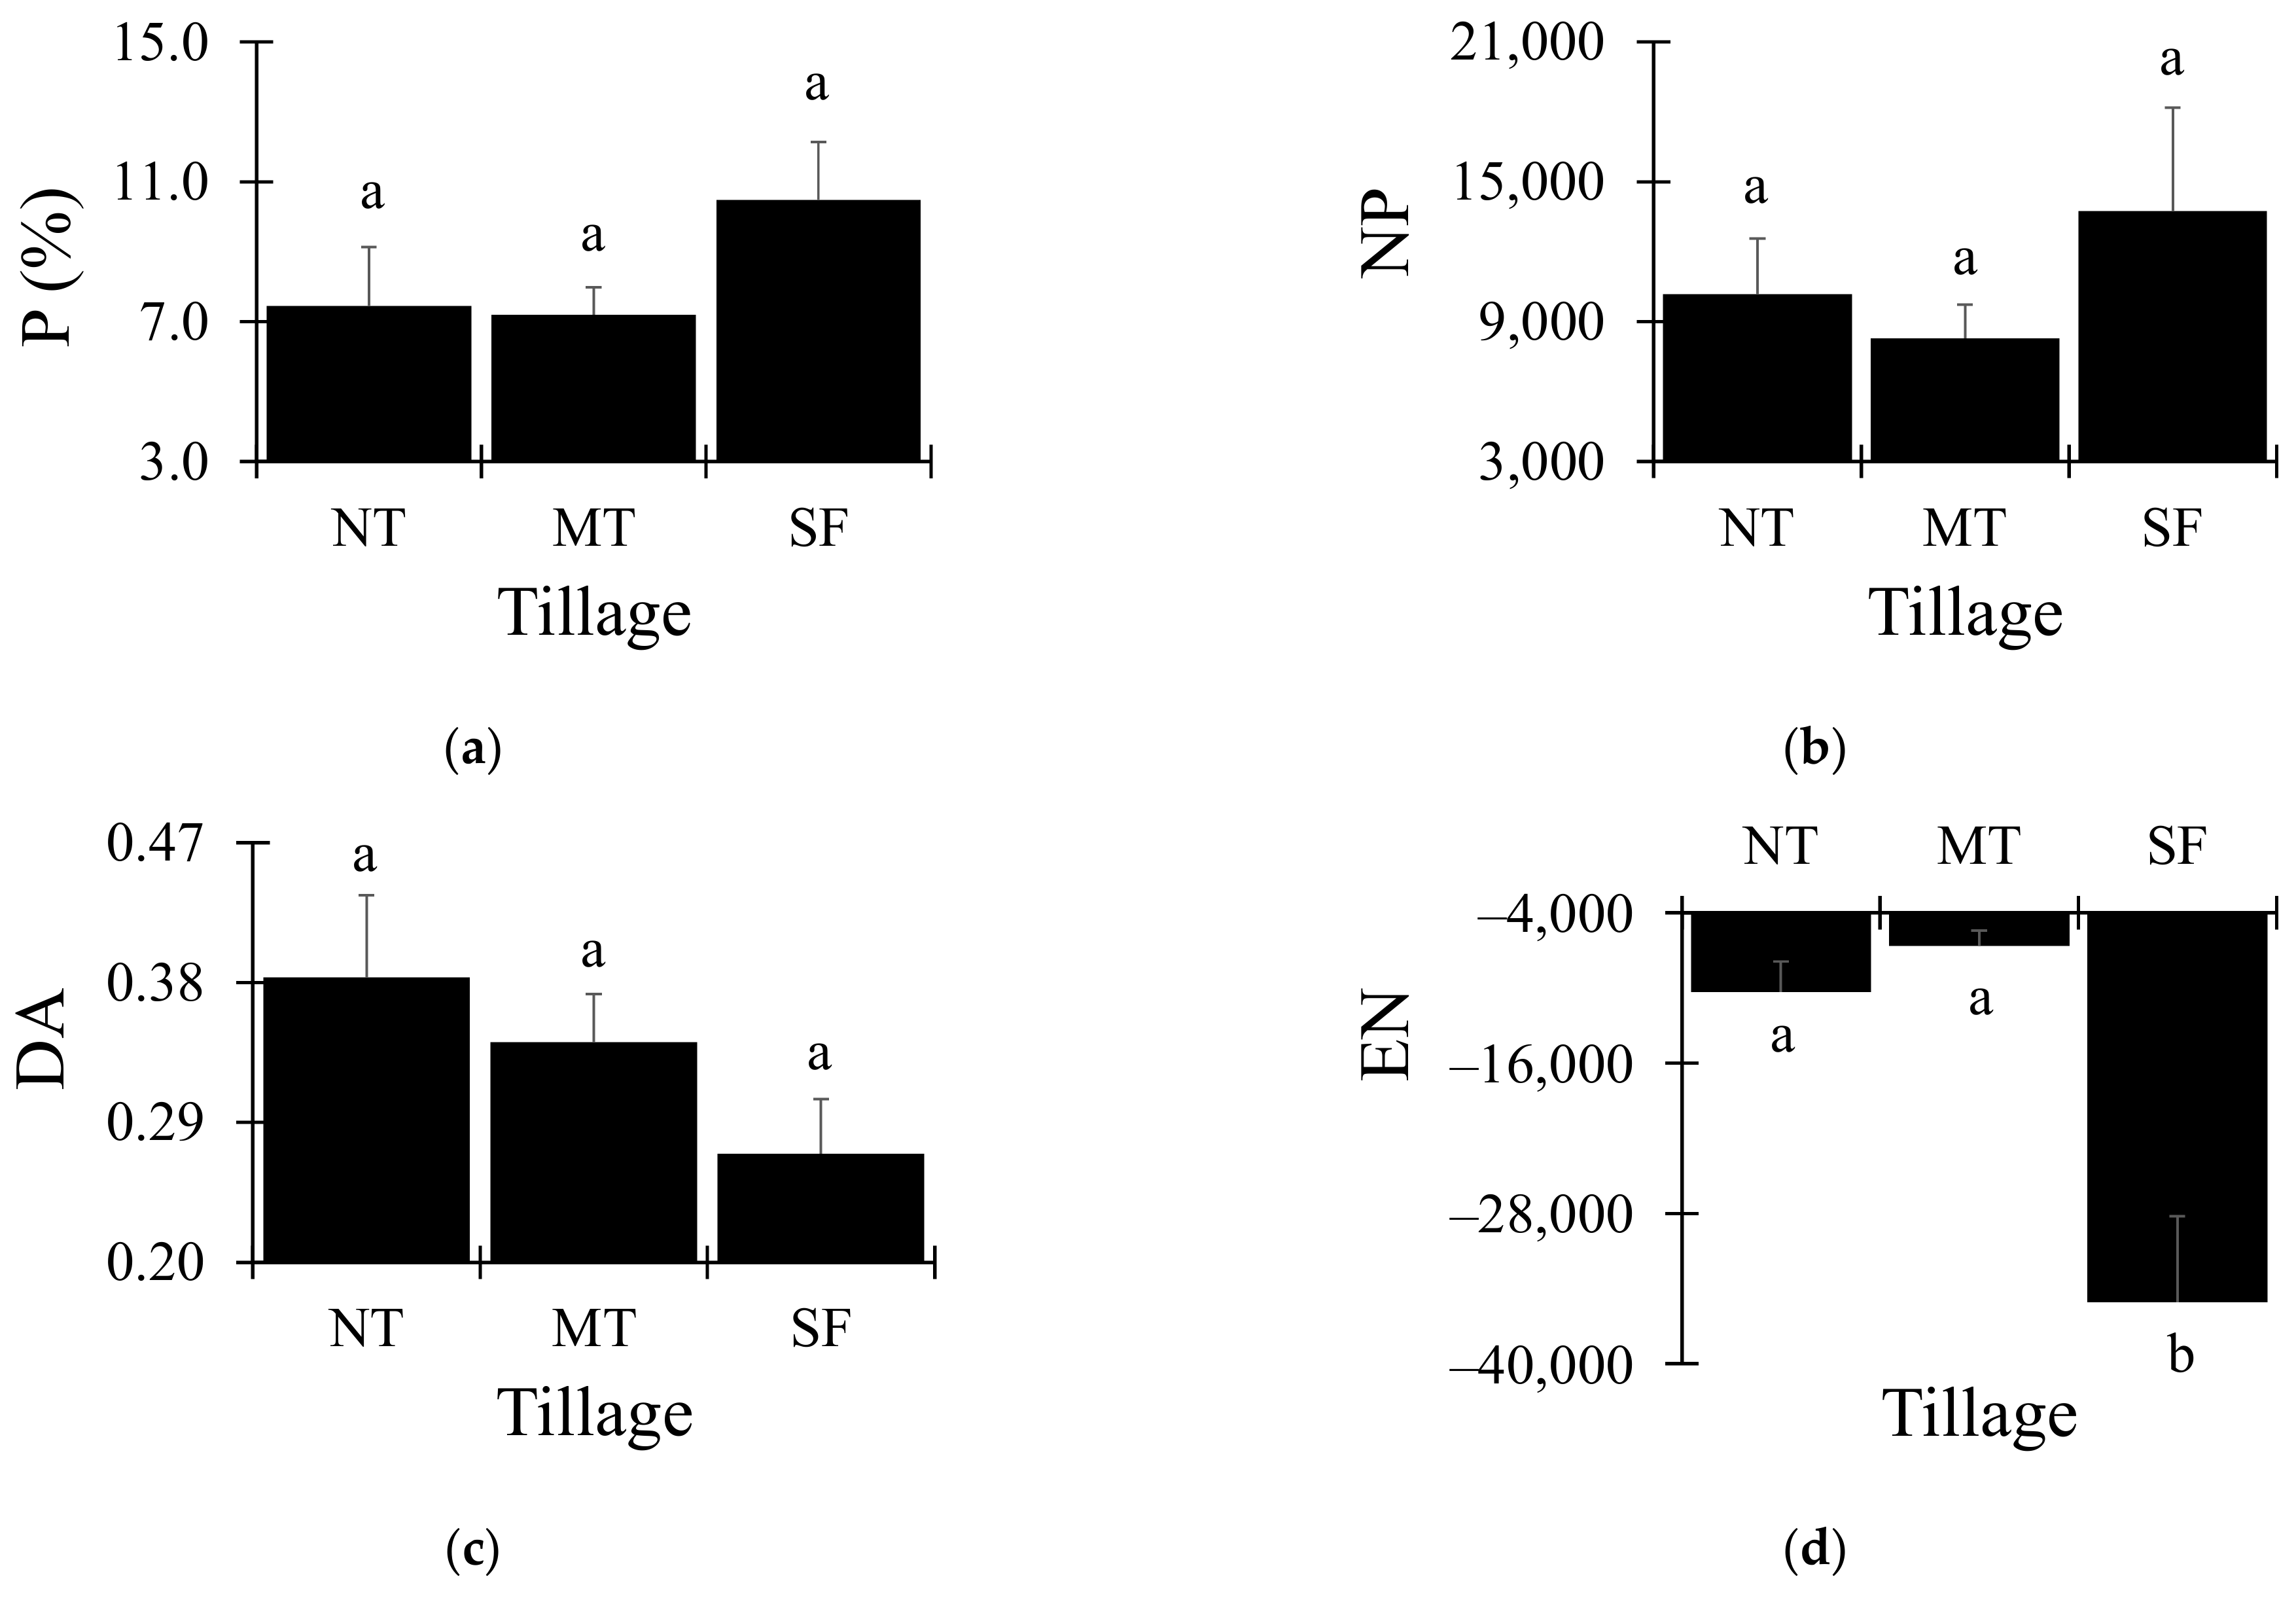
The aggregate imaged porosity was not significantly different between the management practices and SF (
Figure 2a). However, both management practices had a porosity decrease of ~30% when compared to SF. The aggregates under SF also presented a greater number of pores than the aggregates of NT (c. 35% concerning SF) and MT (c. 65% concerning SF), despite no significant differences (
Figure 2b). The degree of anisotropy, a measure of how highly oriented substructures are within a volume, did not significantly differ between systems at the scale of pore sizes evaluated (
Figure 2c). However, NT and MT management practices increased pore system anisotropy compared to SF (c. 42% concerning NT). This difference in anisotropy indicates that, for the case of MT and NT, there have been changes in the soil porous system-related properties in the analyzed volume, i.e., variations in pore volume distribution, pore connectivity, or pore tortuosity. Finally, the pore connectivity was affected by the management practices, with decreases for NT (by a factor of c. 3.4) and MT (by a factor of c. 5.3) when compared to SF (
Figure 2d). This suggests that the management practices caused a break in the aggregates’ pore continuity in relation to SF.
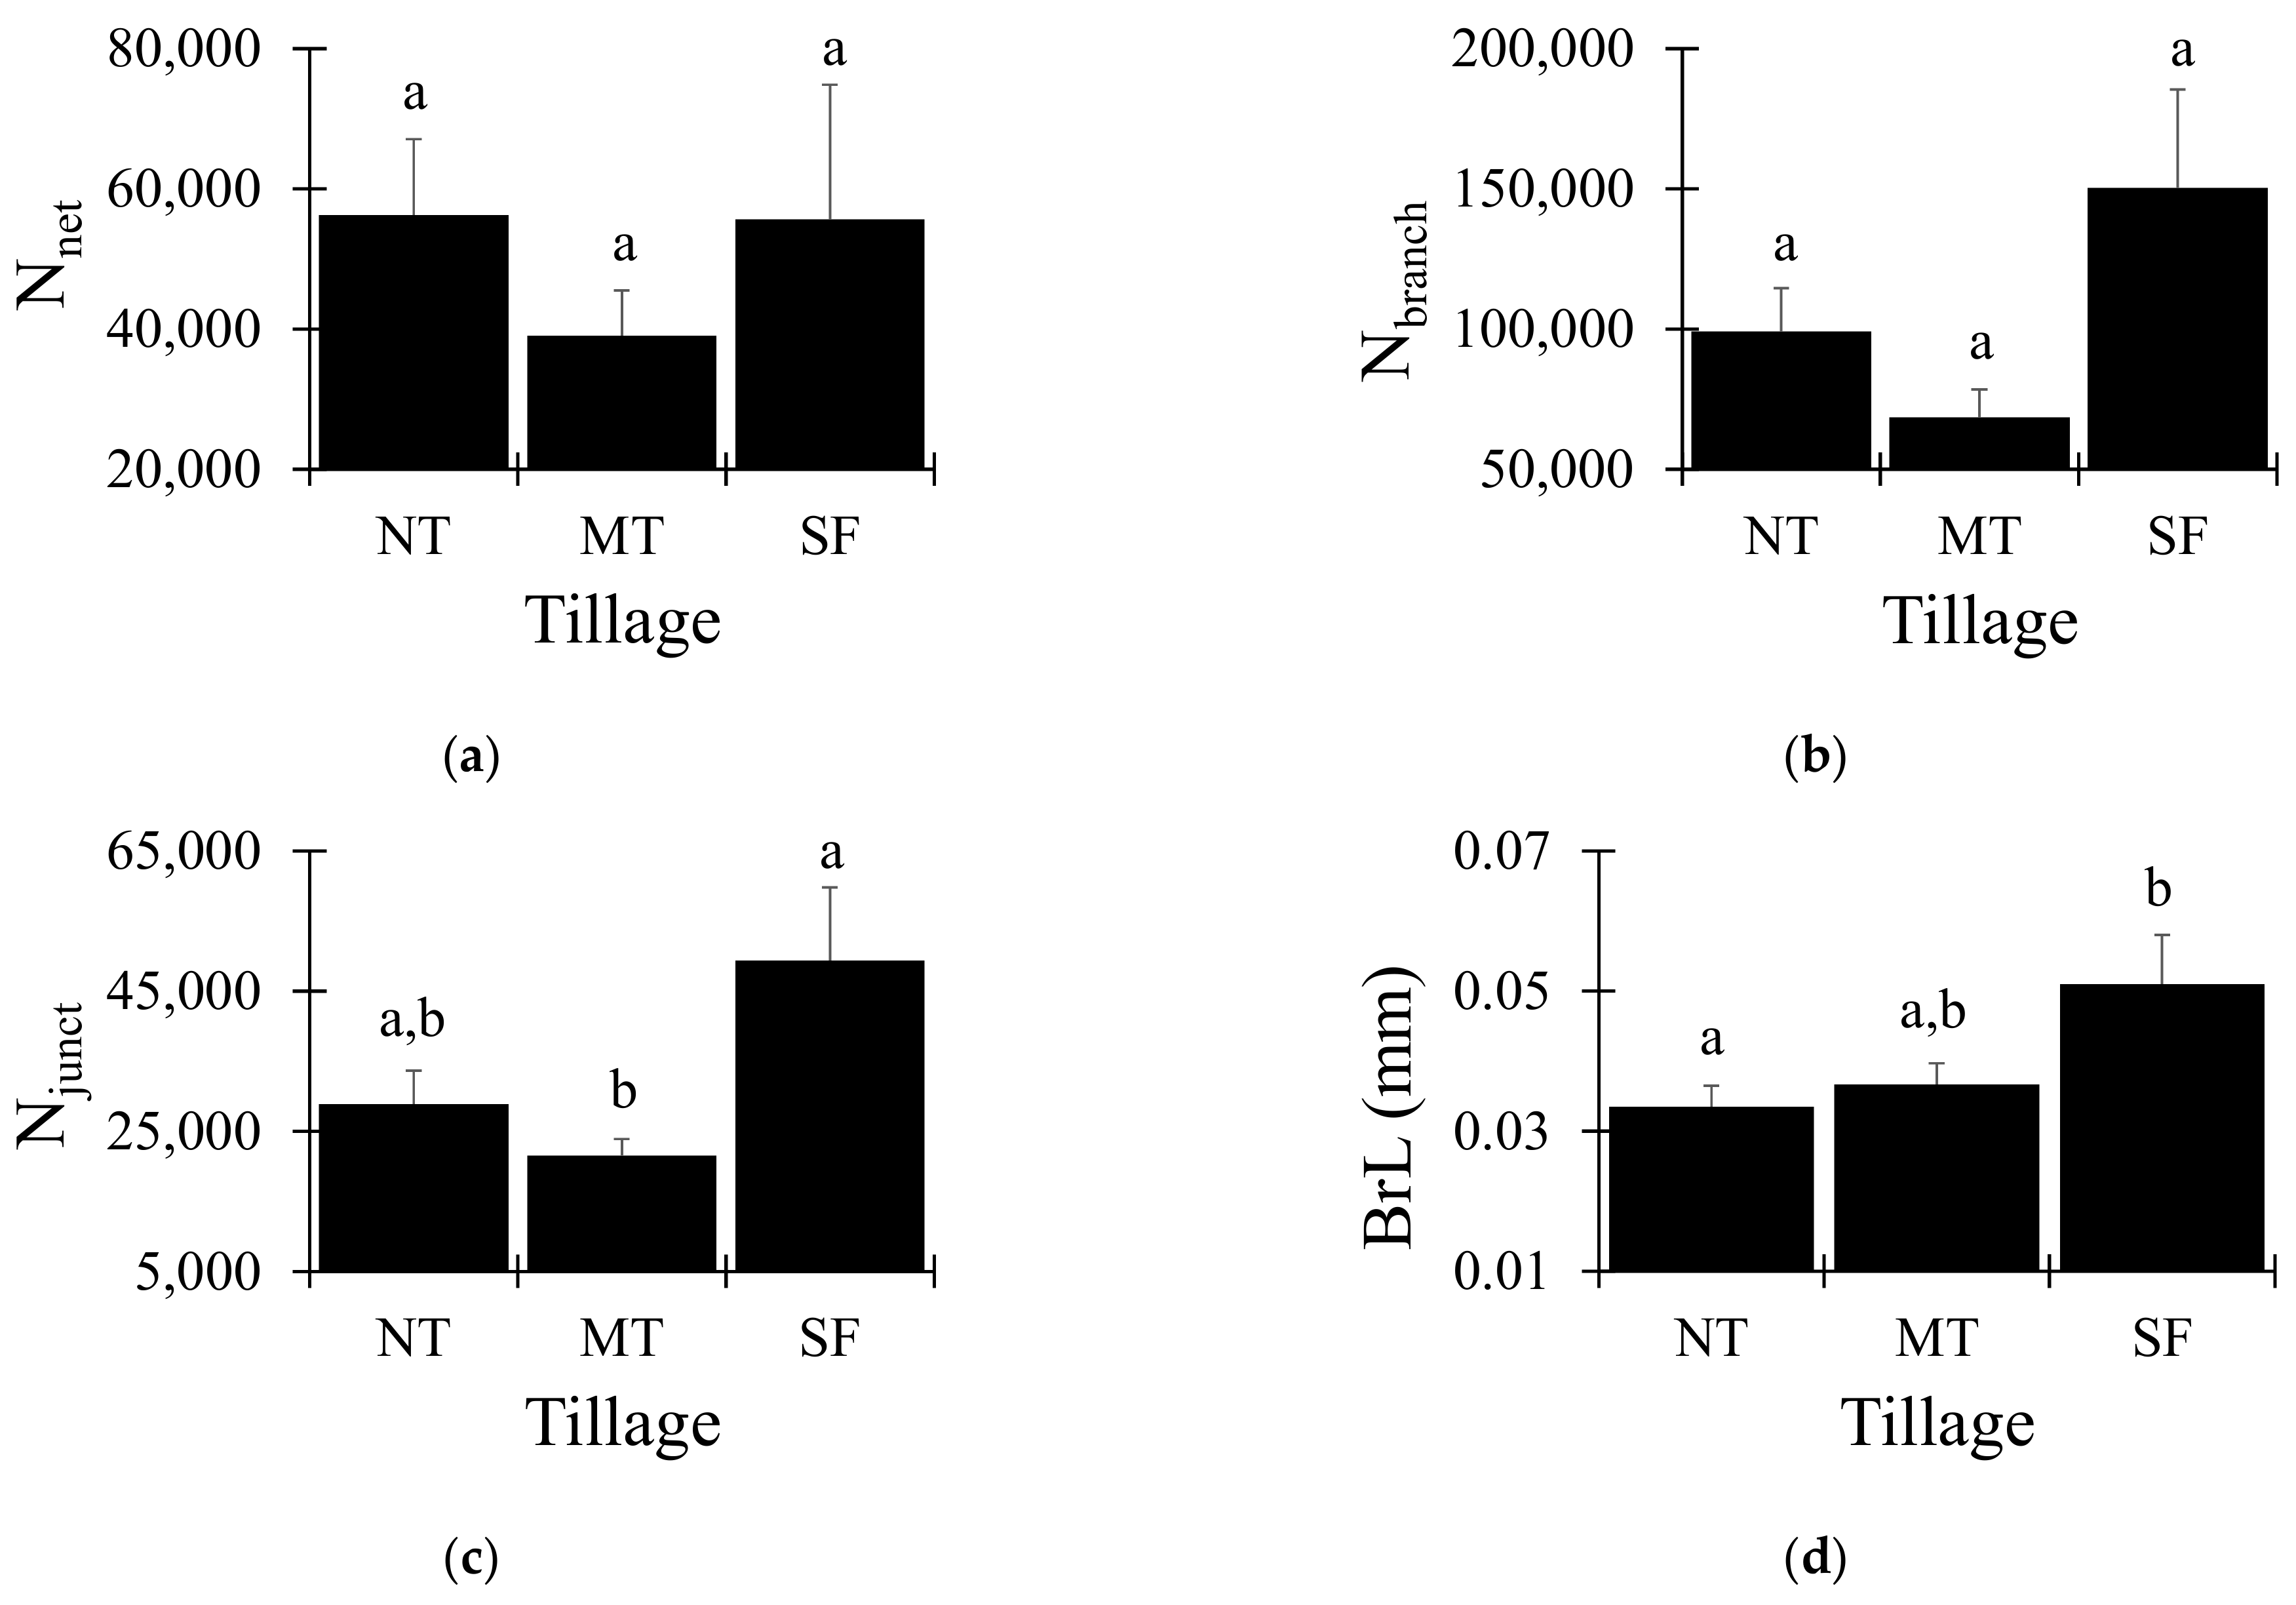
Regarding the skeletonized pore network, no significant differences in the number of networks and the number of branches were observed between treatments (
Figure 3a,b). However, NT (except N
net) and MT were characterized by decreases in these numbers (N
net and N
branch) in relation to SF. For example, MT decreased by a factor of c. 1.4 (N
net) and c. 2.2 (N
branch) in relation to SF. This means that by analyzing the skeleton of the pores, there was a reduction in the complexity of pores under NT and MT. Nonetheless, the number of junctions (N
junct) had significant differences between MT and SF (
Figure 3c). The reduction in MT when compared to SF was by a factor of c. 2.3. However, the two management practices had the same effect on the soil structure. When the maximum length of branches (BrL) was analyzed, only differences between NT and SF were recorded (
Figure 3d). The reduction between these two systems was by a factor of c. 1.5. This result is also in line with the qualitative analyses based on the 3D images (
Figure 1). We observed in the images the presence of more regions not occupied by pores for NT and MT (
Figure 1c,f).
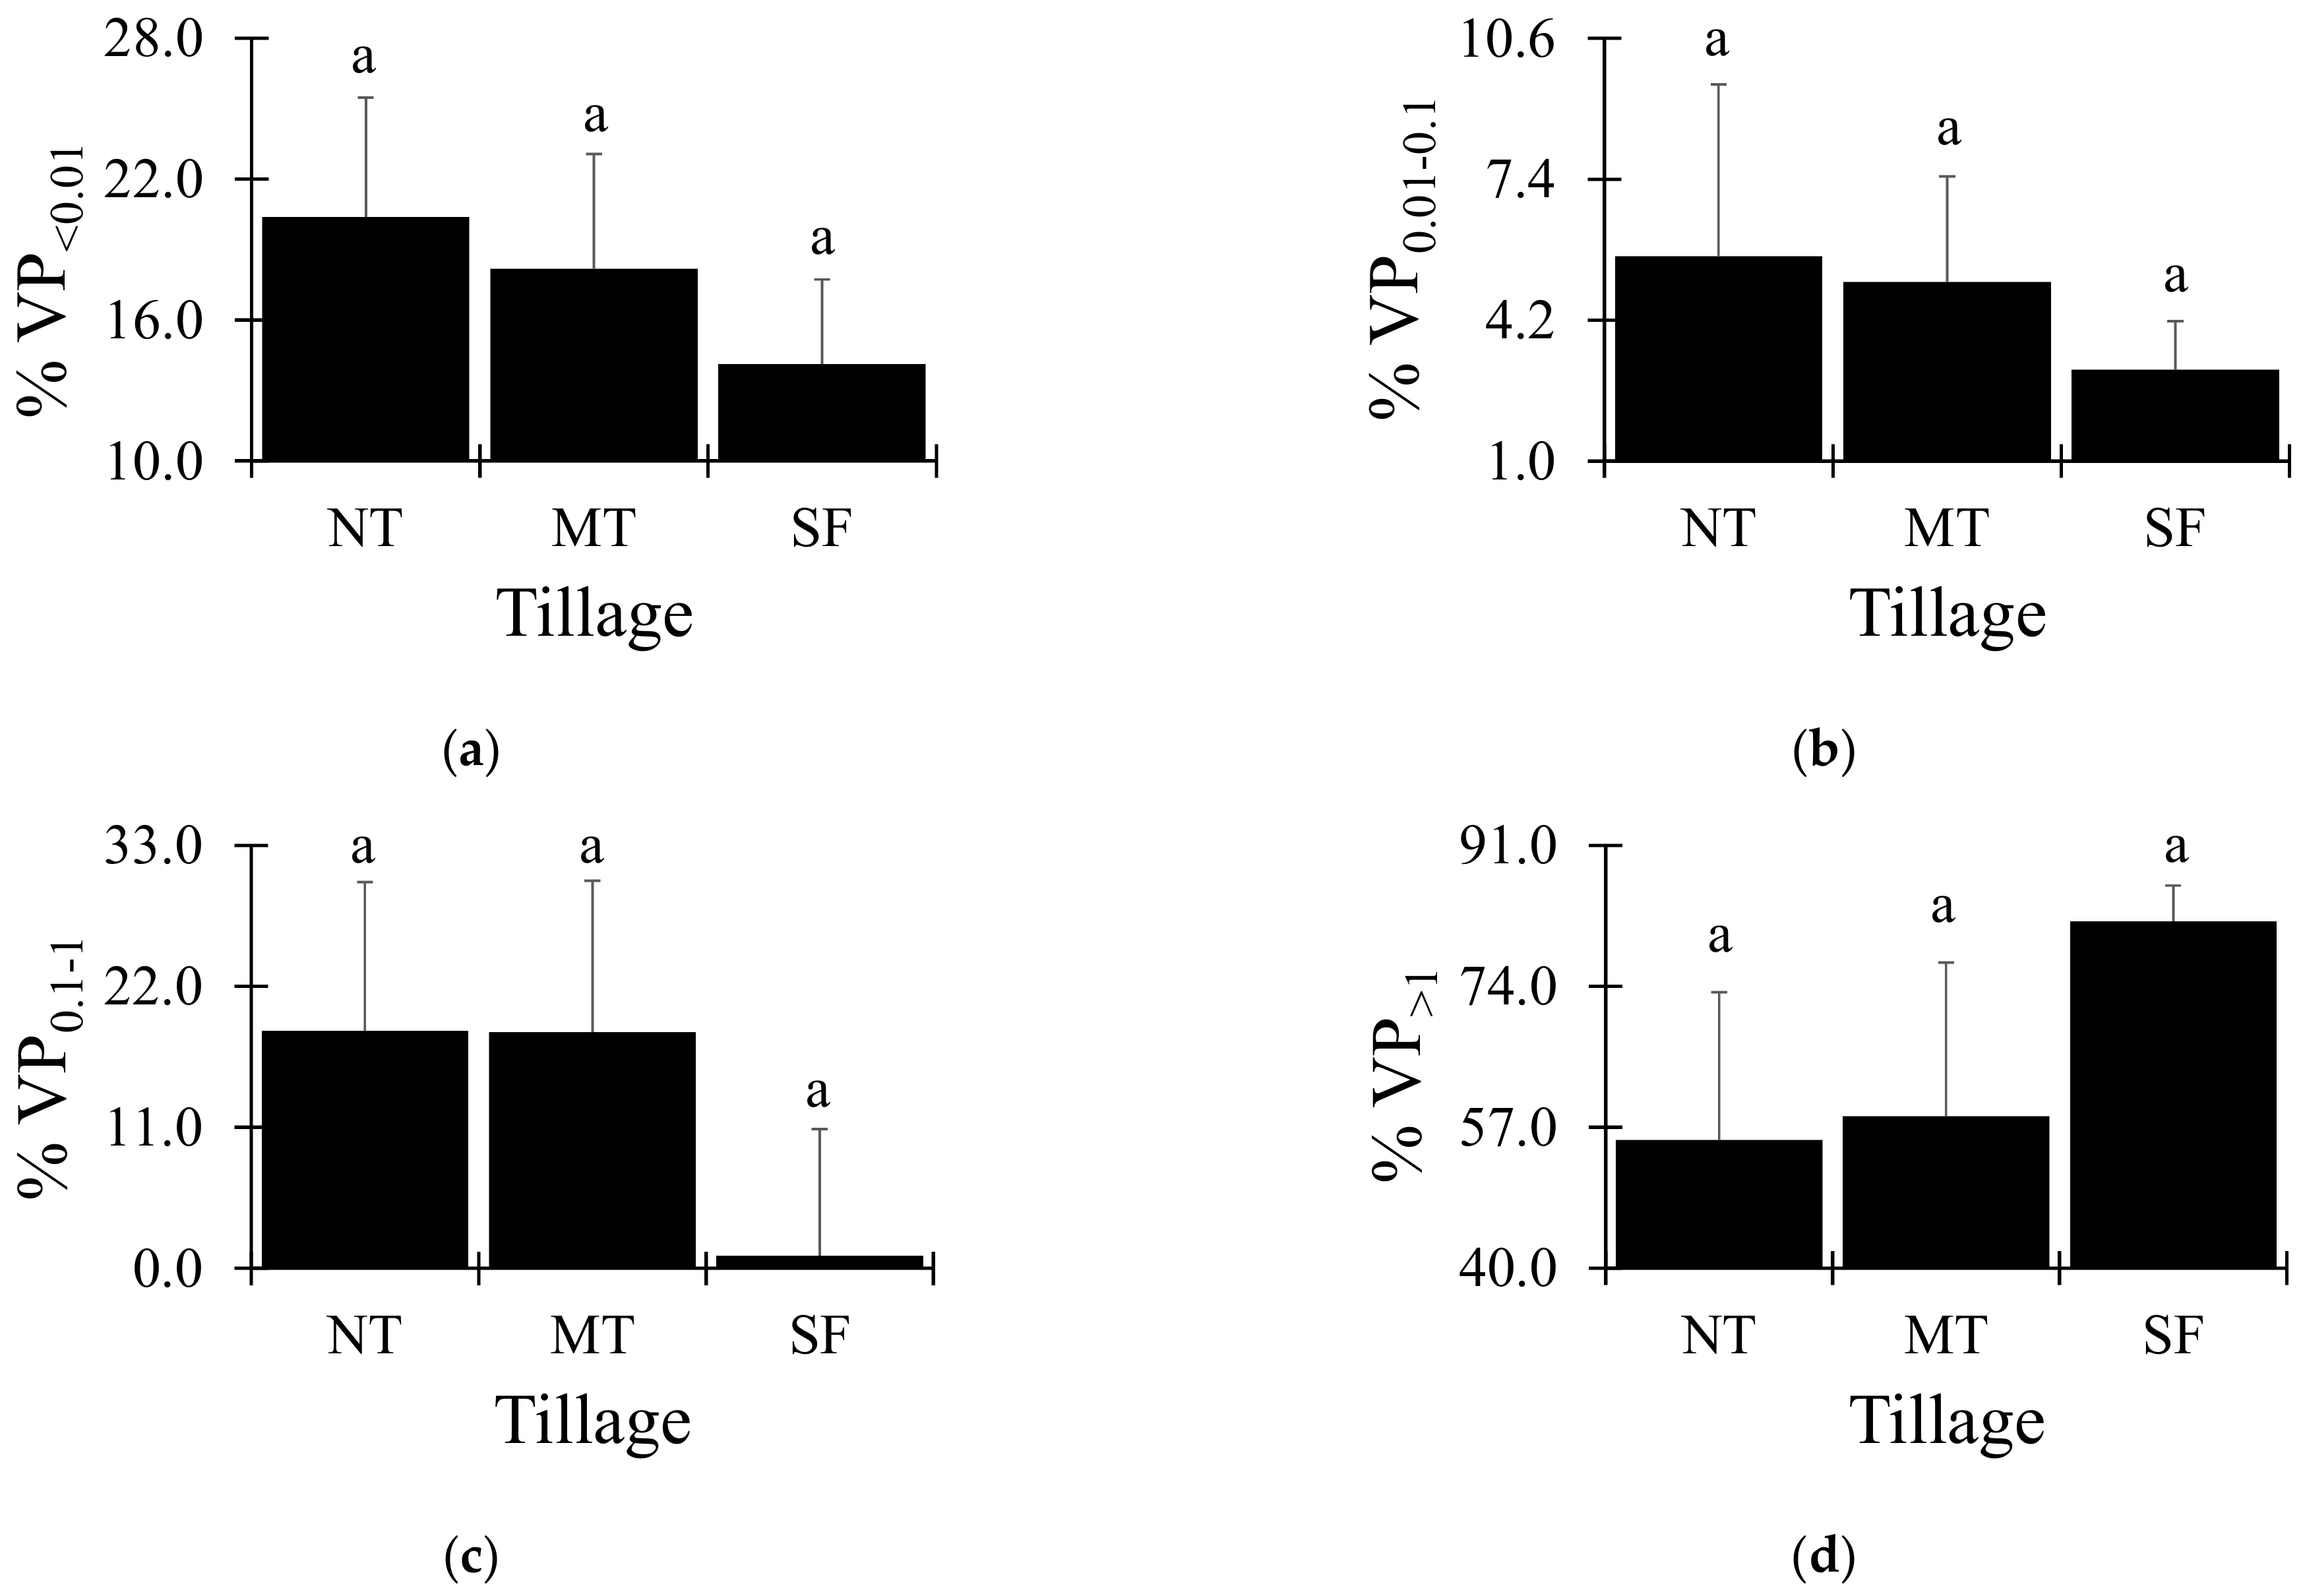
The pore size class distribution based on the volume of pores showed no differences among management practices for the size classes evaluated (
Figure 4). The smallest pores evaluated (<0.01 mm
3) presented the highest number for NT, followed by MT and SF (
Figure 4a). The same tendency was noticed for pores between 0.01 and 0.1 mm
3 (
Figure 4b), which indicates that for the smallest pores analyzed, the effect of the tillage operations was almost the same as compared to the reference area (SF). In relation to the largest pores investigated (ranging from 0.1 to 1 mm
3 and >1 mm
3), a reduction was noticed between NT (contribution of 18.5% to imaged porosity) and MT (contribution of 18.4% to imaged porosity), in comparison to SF (contribution of 1.0% to imaged porosity), for pores between 0.1 and 1 mm
3. Practically, there are no pores in this size class under SF. Another way to analyze this result is by considering that the agriculture operations caused increases for pores with these volumes when compared to SF. On the other hand, when the contribution of the largest pore class is evaluated (>1 mm
3), the SF aggregates are characterized by c. 1.5 times more contribution than aggregates under NT and MT. We can observe that around 80% of the imaged porosity under SF aggregates belong to the largest size classes, noting the high standard errors.
The shape of pores across the systems was different only for the equant-shaped pores (cube-like) (
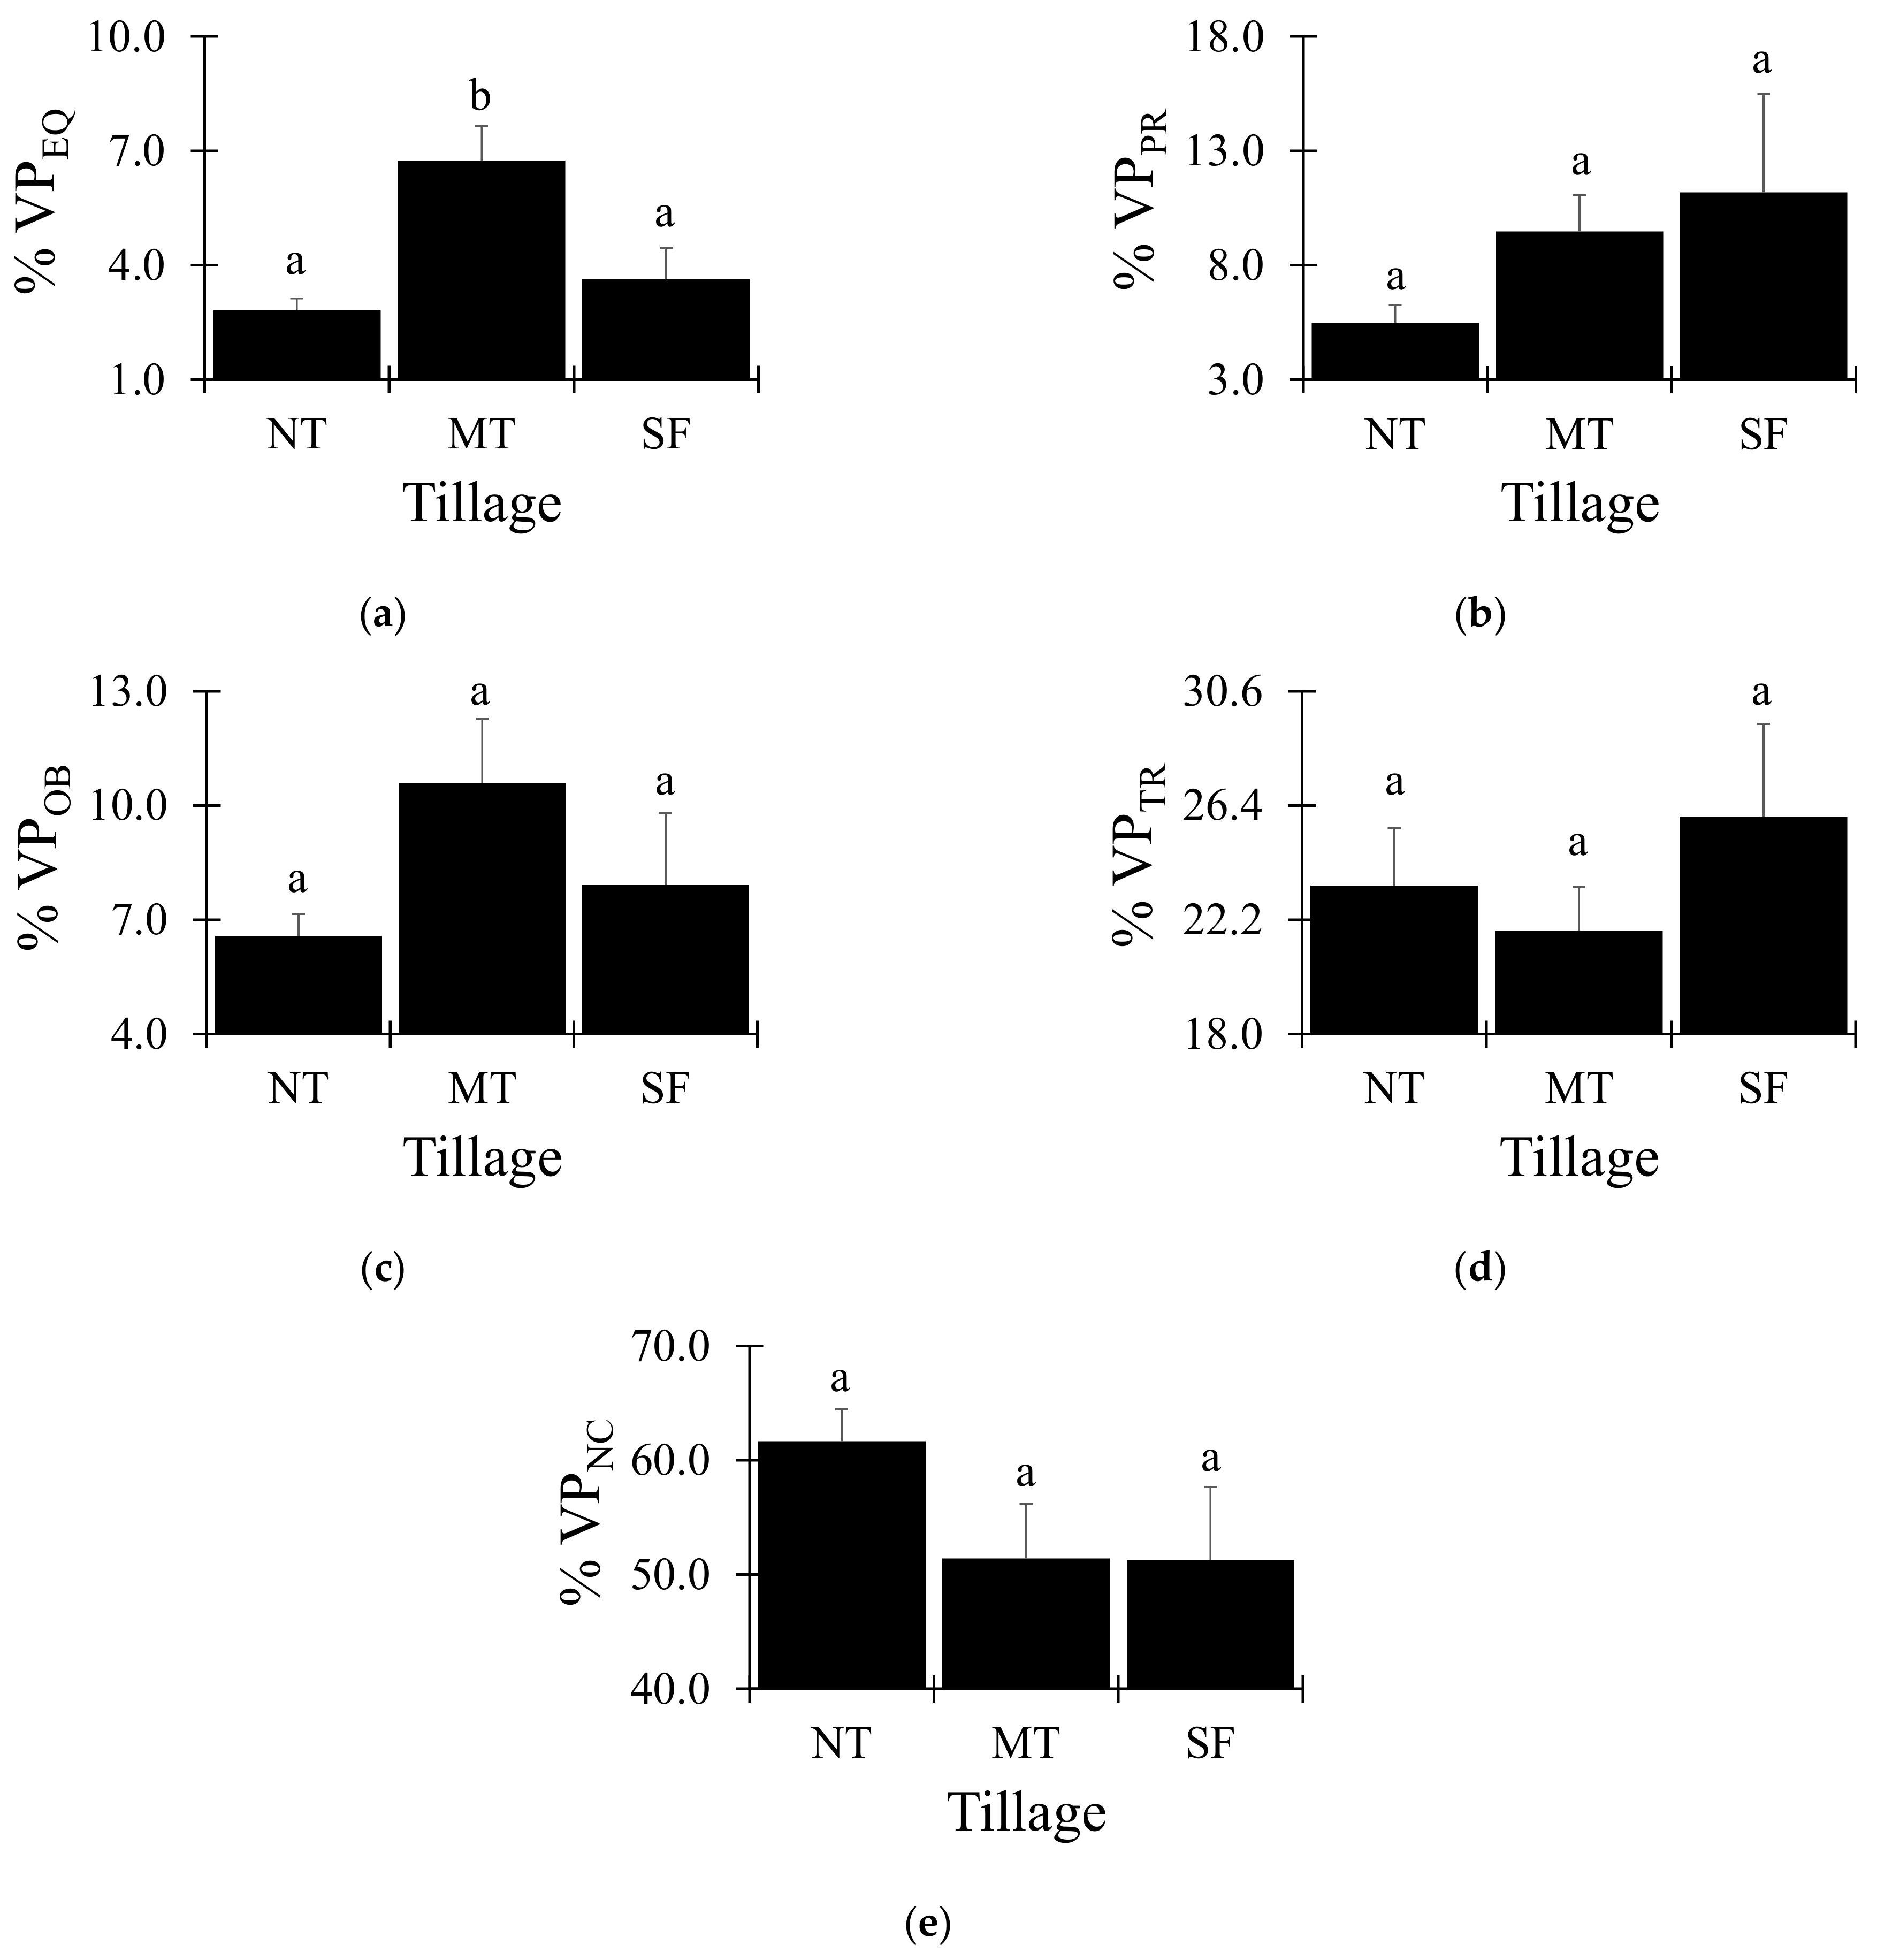
Figure 5a). The MT system presented an increase (c. 85% concerning SF) in this shape of pores compared to NT and SF. The contribution of the prolate-shaped pores (cuboid-like) among systems was not different, but we observed the following tendency: SF > MT > NT (
Figure 5b). The difference between SF and NT was a factor of c. 2.0 for this moderately non-equant pore. The oblate-shaped pores (cube to plate-like) showed the same tendency as the equant-shaped pores (
Figure 5c). Again, MT presented an increase (c. 35% concerning SF) in these slightly to moderately non-equant pores compared to SF. The triaxial-shaped pores (cuboid to blade-like; moderately to very non-equant pores) exhibited a decrease for NT and MT when compared to SF (
Figure 5d). The difference between MT and SF was a factor of c. 1.2. The non-classified shaped pores contributed to more than 50% of the imaged porosity (
Figure 5e). This is mainly related to the complexity of the pores, which did not allow us to classify them based on their shapes. The NT management practice presented an increase (c. 20% concerning SF) in NC pores compared to MT and SF. This indicates that the long-term tillage system conducted in the experimental field contributed to an increase in the distribution of complex pores for NT.
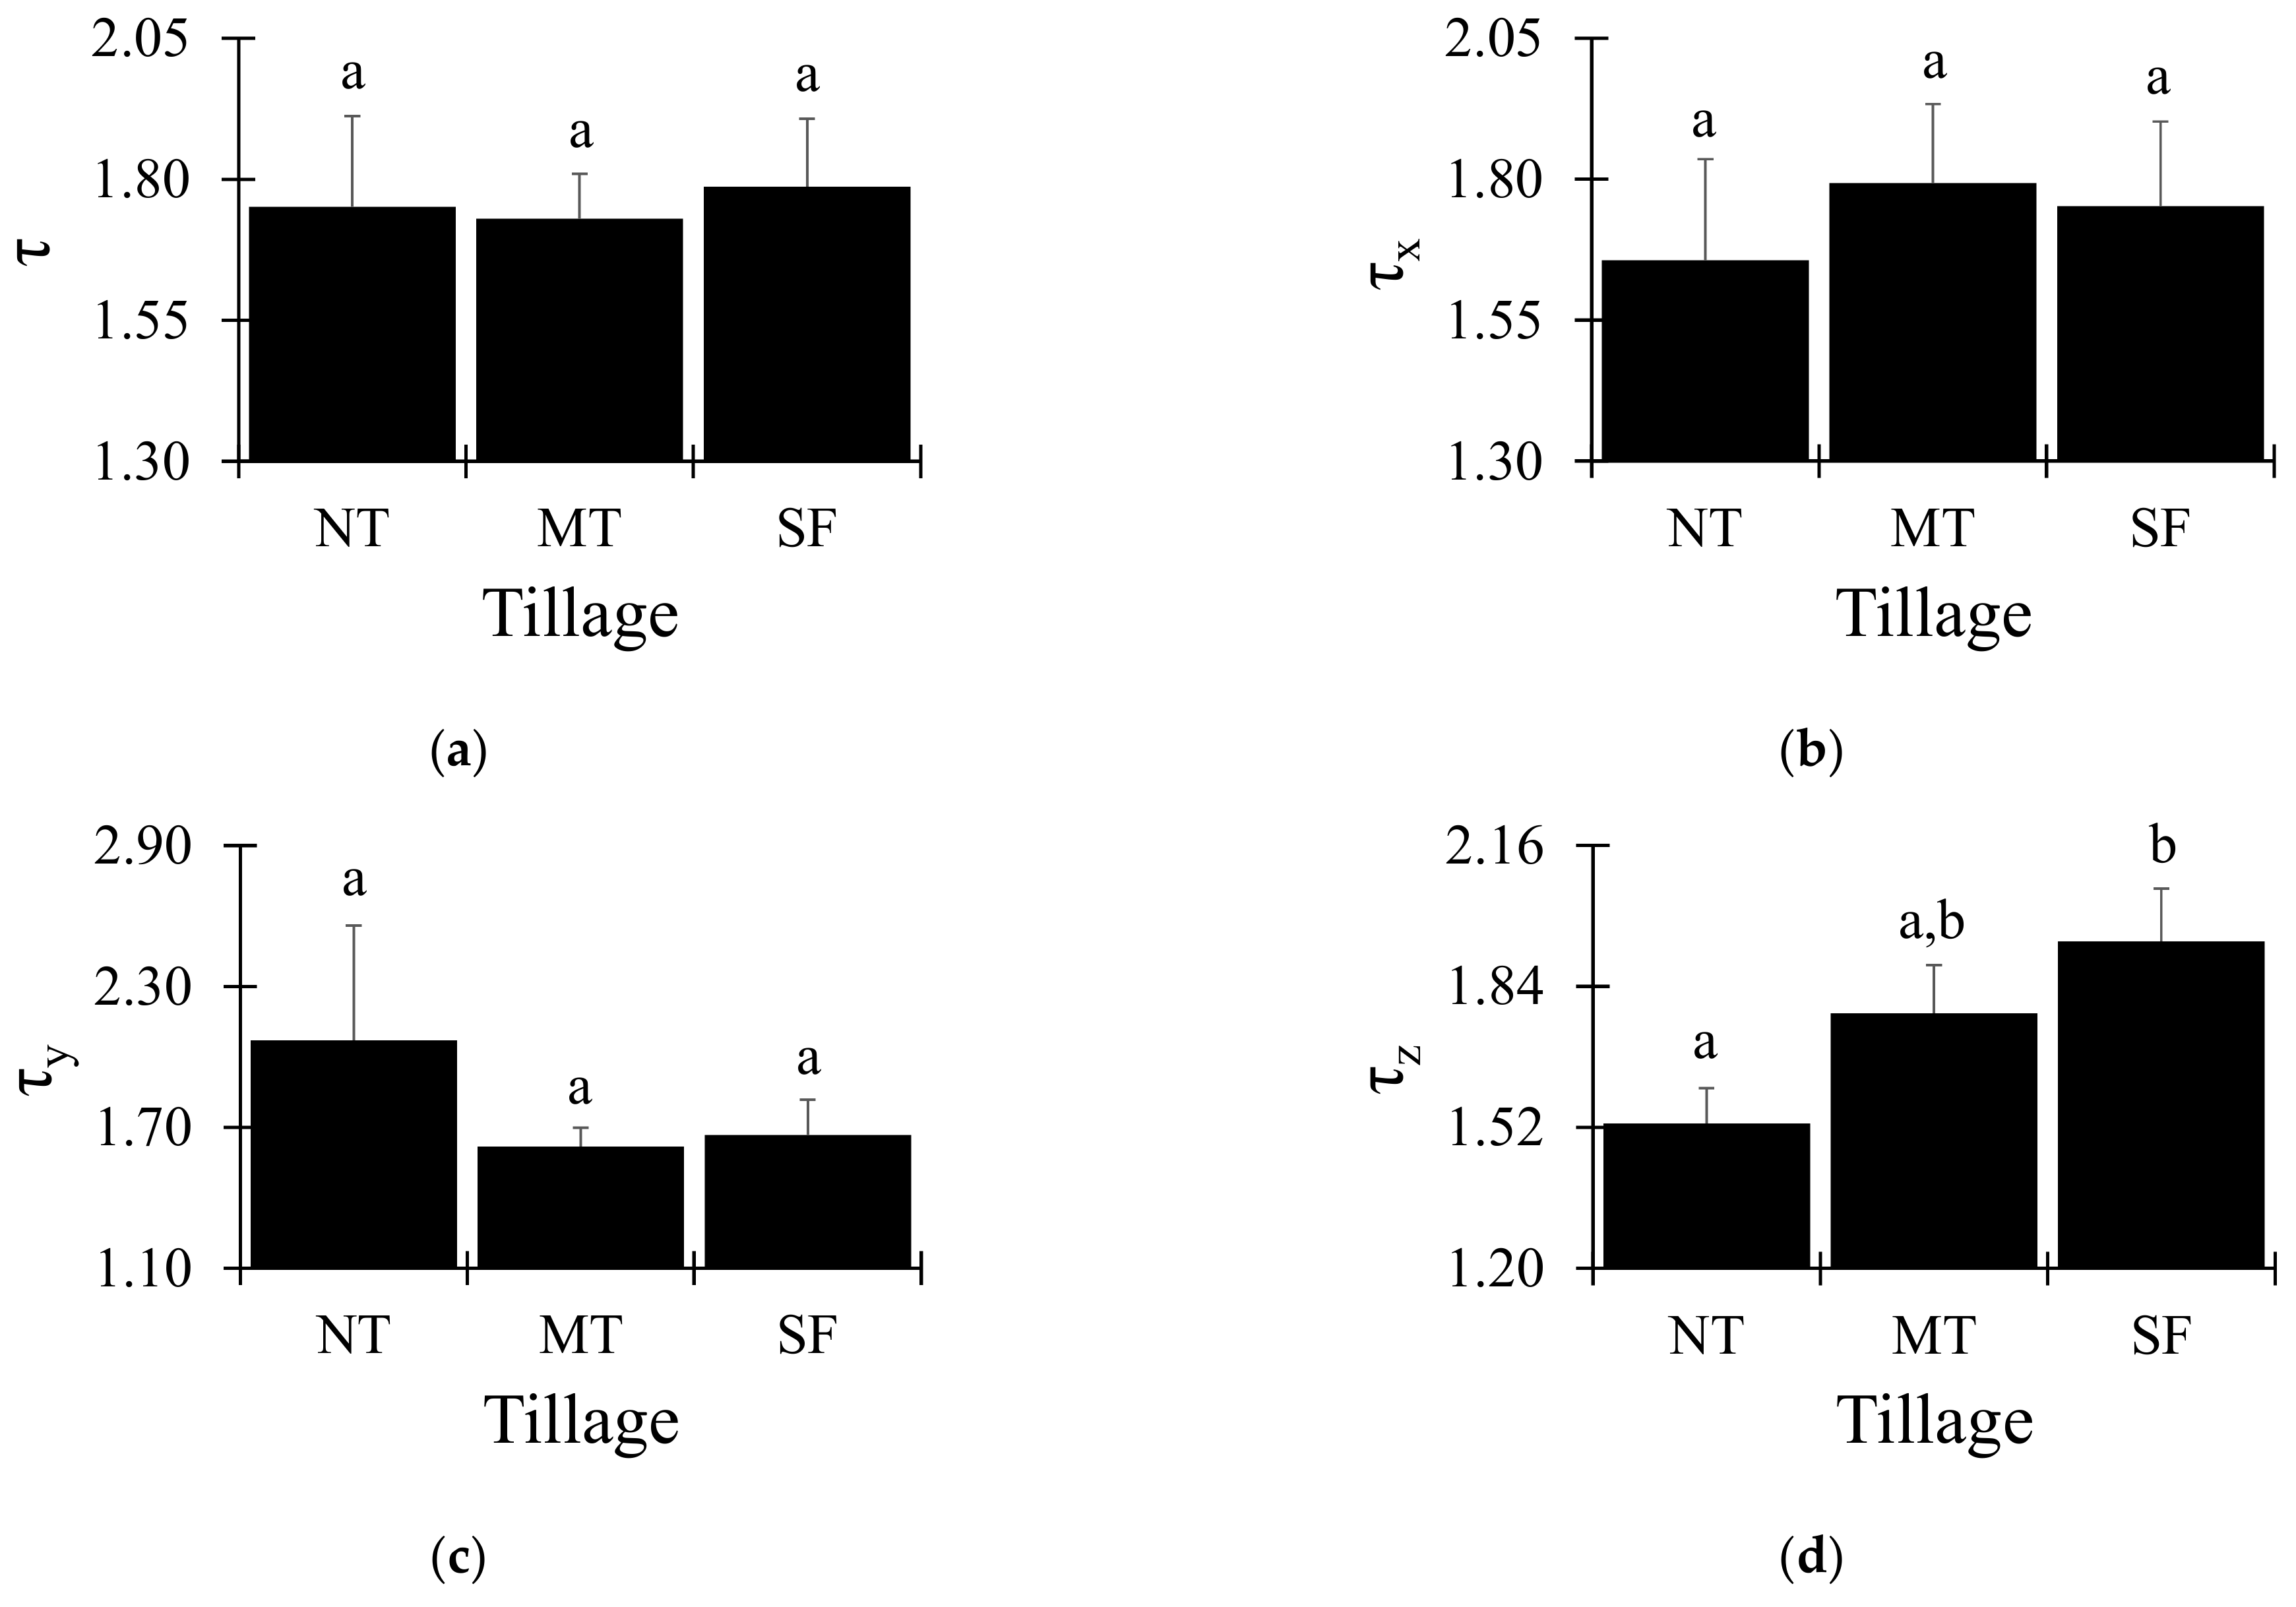
The tortuosity was analyzed in three directions (x, y, z). However, we must mention that these directions are not related to the actual directions found in the soil profile, e.g., z represents the soil depth. This was not possible in this study because the small aggregates were obtained from a larger soil sample. However, we chose to keep the analysis in all three directions to also check if there were variations in the heterogeneity of the porous system when tortuosity was analyzed. The average tortuosity did not present differences among systems (
Figure 6a). It was almost the same, varying from 1.73 (MT) to 1.79 (SF). This means that the management practices did not influence the tortuosity compared to SF. The tortuosity in the x- and y-directions showed a different behavior (
Figure 6b,c), with the largest τ
x found for MT (1.79) and the smallest for NT (1.66). In the case of τ
y, the tortuosity increased for NT (2.07) compared to SF (1.67), which indicates an increase in pore complexity in this direction. Finally, the tortuosity in the z-direction was unique, demonstrating differences among systems. The two management practices presented a decrease in τ
z when compared to SF. The difference between NT and SF was a factor of c. 1.3, meaning more aligned pores for this specific direction in the case of NT.
4. Discussion
For decades, conventional agricultural practices have been responsible for land degradation, causing large scale soil erosion, decreasing soil organic matter, and depleting nutrient levels [
31]. There is now an increasing pressure on governments and landowners to support the global movement towards more sustainable management practices in order to help meet net zero targets for carbon whilst increasing ecosystem services. In recent years, there has been a shift to conservation agricultural practices, with this management being practiced on an estimated 157 Mha, corresponding to c. 11% of field cropland [
32]. Another strategy, which has also been gaining momentum more recently, is to take agricultural land out of production completely, sometimes referred to as rewilding, to provide a wider range of alternative ecosystem services, e.g., forestry and biodiversity. Whilst many recent studies have assessed the impacts of conservation agriculture on soil properties in comparison to conventional approaches, e.g., ploughing [
23,
33,
34,
35], very few have compared the soil properties between long-term conservation agriculture (in this example, c. 40 years) to adjacent long-term, undisturbed ‘natural’ soils in order to examine the lasting effects of degradation on agricultural land and the recovery potential of conservation agriculture approaches.
In this study, X-ray imagery revealed that the soil under SF had a significantly more complex soil porous architecture compared to soils under NT and MT. Secondary forests are generally characterized by having a much wider range of surface leaf litter, with very large roots and a diverse variety of microbial function and composition, which we hypothesize would lead to the formation of more complexity in the soil pore network. Neal et al. [
36] found similar results when comparing long-term fallow with grassland and arable soils. We also noted that larger connected soil pores were observed for the soil under the SF system, which is most likely an indication of greater biological activity, e.g., roots and fauna. The presence of earthworms and insects is well known to contribute to the appearance of elongated soil pores [
37,
38,
39].
The process of changing from conventional to conservation agricultural practices has been shown to initiate a new, biologically driven development of the pore structure, which can recover and enhance total and surface connected porosity beyond the values observed in conventionally tilled soils [
40,
41]. We hypothesized that after c. 40 years of reduced or no tillage, the soil pore architecture would be similar to that of the SF. The statistical analysis confirmed that this was largely the case; however, lower soil porosity was still observed in the conservation agriculture soils. A possible explanation for this is a “zero-tillage pan”, which has been previously observed in long-term NT soil in the south of Brazil (down to 20 cm soil depth) [
42,
43,
44]. A decrease in soil pore connectivity and total porosity in NT can occur after long periods due to machinery traffic passing over during sowing and harvesting, no mechanical disturbance, and natural soil arrangement [
23]. One of the consequences of this compaction is the simultaneous reduction in macroporosity and the increase in microporosity (which we observed in this study) [
35,
44,
45,
46,
47].
The contrasting management practices did not demonstrate a significant difference in the degree of anisotropy, but it was observed to be highest in the NT, followed by MT, and then the SF system. This parameter was c. 42% greater for NT soils compared to those in the SF system. The smallest degree of anisotropy obtained for the SF indicates a more isotropic porous system, whereby pores are not oriented in any particular direction, but have similarities in the pore orientation [
48,
49,
50,
51,
52]. Therefore, this example of the soil pore network will not have a tendency for preferential flow of water, but that water will redistribute into the soil in all directions, similar to that of Darcy’s Law [
23,
49].
This research demonstrates that the soil structures that emerge under arable agriculture as part of a conservationist approach and those under undisturbed forestry are different. However, a c. 40-year recovery period is long enough to reverse some of the damage caused by intensive agriculture, which may explain why we did not observe significant differences for key soil properties such as total porosity and pore size and shape distributions. Where differences were observed, this was often associated with measures related to complexity in the pore network, such as the Euler number [
53,
54,
55]. It is likely that this is driven by differences in soil biology, particularly in terms of soil biodiversity and microbial community structure (e.g., [
36]). In undisturbed soils, fauna are allowed to develop and proliferate, which can have a profound impact on soil porosity and structure. Conversely, they can be significantly negatively impacted upon by processes such as tillage. This finding demonstrates that recovery of the soil system, from a structural perspective, takes places over a decadal timescale rather than a seasonal or annual basis.
5. Conclusions
Although the period of c. 40 years led to similar pore network characteristics among the managements, such as total porosity, number of pores, and degree of anisotropy, the pore connectivity (Euler number) was significantly higher for the soil under SF. Moreover, SF presented the greatest proportion of larger pores and the smallest proportion of smaller pores. The skeletonization analysis demonstrated that SF was characterized by more complex pores, with the highest number of branches, junctions, and maximum length of branches. In line with these findings, SF had more isotropic pores than NT and MT, i.e., without preferential flow paths for water redistribution.
Therefore, we conclude that even when soil is left for a significant time period to naturally recover, long-term conservation management practices may still exhibit some signs of degradation caused by conventional agriculture, particularly for important properties such as pore connectivity and complexity. These findings are likely related to the intrinsic greater biological activity in a ‘natural’ soil, such as under SF relative to NT and MT.

 ,
, 


