


Measurement and Spatial–Temporal Characteristics of Agricultural Carbon Emission in China: An Internal Structural Perspective

College of Economics and Management, China Agricultural University, Beijing 100083, China
*
Author to whom correspondence should be addressed.
Agriculture 2022, 12(11), 1749; https://doi.org/10.3390/agriculture12111749
Submission received: 25 September 2022
/
Revised: 12 October 2022
/
Accepted: 17 October 2022
/
Published: 22 October 2022
(This article belongs to the Special Issue Energy Economics and Low Carbon Policy in the Agriculture Sector)
Abstract
:The focus of world governance on climate change has been on the industrial and transport sectors, yet the agricultural sector produces a lot of greenhouse gases, and this has always been ignored. This paper focuses on China, one of the world’s largest agricultural countries, and it investigates its agriculture carbon emission from a new perspective of the internal structure of it, which is relatively under-researched. Carbon metrology, the emission factor method and kernel density estimations are used to analyze China’s agricultural carbon emissions structure and its regional differences and its dynamic evolution characteristics. We find that: (1) China’s total amount of agricultural carbon emissions showed a ladder-like upward trend, but the growth rate of it has gradually slowed down; the inter-provincial heterogeneity of the agricultural carbon emissions was obvious. (2) From the standpoint of the grain functional areas, the annual total amount of agricultural carbon emissions and the amount of carbon emissions of each carbon source in the major grain producing areas were significantly higher than those in the major grain sales areas and the production–sales balance areas, and the carbon emission intensity in the major grain producing areas was the lowest overall. (3) In regard to the internal structure, China’s agricultural carbon emissions mainly came from the livestock and poultry, rice planting and agricultural energy sectors; the proportion of carbon emissions that were caused by the agricultural materials, agricultural energy and soil increased in general, and the inter-provincial differences between them expanded, while the inter-provincial differences between livestock and poultry gradually decreased. The proportion of carbon emissions from the six major agricultural carbon sources showed a convergence trend, and their kernel density had a right tail phenomenon. Our research deepens the understanding of China’s agricultural carbon emission structure, contributes to the rational optimization of the agricultural structure, and helps the agriculture sector and the rural areas to reach the carbon peak.
1. Introduction
The achievement of the “carbon peaking and carbon neutrality” goals is inseparable from the joint efforts of various fields, including agriculture. The world’s responses to climate change are mainly concentrated in the field of industry and transport, while agriculture has been a neglected part for a long time. The large quantities of greenhouse gases from agriculture have a great influence on climate change. A latest specialized report, which was released by the FAO, shows that about 9.3 billion tons of CO2e were generated from agriculture around the world in 2018, and they approximately accounted for a proportion of 17% of the greenhouse gases (GHGs) emissions in all of the sectors of the whole world [1]. The data which were released by the IPCC, an intergovernmental and authoritative agency that deals with climate change, are even higher, and they indicate that about 23% of the total anthropogenic GHGs emissions come from agriculture, forestry, and other land use sectors [2]. Agricultural carbon sources are fairly complicated, and if we do not adopt any technical means and management optimization procedures to address this, the proportion of agricultural carbon emissions will surge to 50% in the future, thereby becoming the largest carbon emission sector [3]. As we are facing the climate threat and pressure, it is urgent and imperative for world agriculture to take actions to cut down their carbon emissions and inhibit temperature rise.
As one of the largest agricultural countries and the largest developing country in the world, the actions to decrease agricultural carbon emissions in China are crucial to the world’s agricultural field. Although China has not established a statistical system ultimately to measure its agricultural carbon emissions yet, related experts estimated that agricultural production activities account for about 15–17% of the total carbon emissions of China [4,5,6], and the total amount is still going up [7].
Compared with other sectors, though, the carbon dioxide that is emitted by agriculture is relatively small, but its positive externalities cannot be underestimated. On the one hand, the solutions for the reduction in agricultural carbon emissions in China has great potential [8,9]; on the other hand, to cut down the carbon emissions in the agriculture field means that the agricultural production materials such as fertilizer, pesticide, and agricultural plastic film are effectively used to an extent as well as the optimization and upgrading of the agricultural industrial structure, and low-carbon technologies of agricultural waste disposal are being promoted and used in China. These are significant to the green and sustainable development of agriculture. China’s agricultural greenhouse gas emission comprise about 11–12% of the agricultural emissions of the world [10]. Accordingly, the reduction in the agricultural carbon emissions in China is crucial to the agricultural carbon reduction in world. The latest “No.1 Central Document”, which was released by the Ministry of Agriculture and Rural Affairs of the People’s Republic of China in February 2022, has emphasized that continuing to promote green development in agriculture and rural areas is an important task in comprehensively promoting rural revitalization. Consequently, in the context of green development, it is critical to accurately understand the current situation of China’s agricultural carbon emissions and find out how it evolved with an overall and internal perspective, which is crucial for China to achieve the “dual carbon” goal, accelerate the green transformation of China’s agriculture, and formulate targeted agricultural emissions reduction plans.
The complexity and diversity of agricultural production activities make agricultural carbon sources complicated and various [11]. In spite of an increasing number of studies in the literature on the issue of agriculture carbon emissions, there are still some problems that have not reached a consensus. A large number of studies do not consider agricultural carbon emission sources completely, and most of them use the “preemptive” methods to set carbon emission factors and then, measure them [12]. Obviously, this rough way of doing this may have a great subjectivity. At present, the specific calculation of agricultural carbon emissions mainly defines the agricultural carbon sources from the agricultural energy [13,14,15], agricultural materials [16], rice planting [17], agricultural land use [18], ruminant breeding [19,20], and straw burning [21], and other aspects. In general, most researchers commonly adopt a comprehensive index system to calculate the agricultural carbon emissions, which mainly includes: (1) the consumption of such agricultural resources as pesticides, fertilizers, and agricultural films in agricultural production activities, as well as greenhouse gases that are produced by waste; (2) carbon emissions and other gas emissions in the producing and processing of agricultural products; (3) the intestinal fermentation of various animals and greenhouse gas emissions from excrements, which are produced during the livestock and poultry breeding seasons [22,23,24]. In conclusion, it is a relatively simplified calculation method, which is used by most scholars due to its convenience [16,25,26]. However, it is not consistent with the relevant standards that are used at home and abroad. Most of the existing studies abroad are based on the 2006 IPCC Guidelines for National Greenhouse Gas Inventories (2006 IPCC Guidelines) to calculate the world’s agricultural carbon emissions and other greenhouse gases, while the domestic research on the international carbon emissions calculation system lags in relation to this [12,27].
Although a growing literature has contributed to the measurement and influences of agricultural carbon emissions, which provides a certain theoretical basis and reference value for this paper, there are still a few shortages. The premise of an accurate analysis of the agricultural carbon emissions is to identify the agricultural carbon sources, but China has yet to establish a clear calculating system for their agricultural carbon emissions. At present, only data from 2005, 2010, 2012, and 2014 are officially available for the greenhouse gas emission from agriculture. (China submitted to the United Nations Framework Convention on Climate Change in 2004, 2012, 2017, and 2019, successively, the National Communication of the People’s Republic of China on Climate Change Initial Information, the Second National Communication of the People’s Republic of China on Climate Change, the First Biennial Update on Climate Change in the People’s Republic of China, the Third National Communication of the People’s Republic of China, and the Second Biennial Update of the People’s Republic of China. They officially documented the amount of total agriculture carbon emissions for 2005, 2010, 2012, and 2014 in China, which were 820 million tons, 828 million tons, 938 million tons, and 830 million tons (the unit for this is CO2e), respectively. In addition, there are no continuous official data.) However, the data do not include information about agricultural energy, straw burning, and so on, and the carbon sources that were included were relatively fewer in number. The government only publicized the total amounts, which means they did not show the emission structure and the accurate sources for these. Therefore, this provides a research space for our paper.
In addition, there is no unified standard for calculating agricultural carbon emissions in academia. Researchers often use different emission factors of agricultural carbon sources, thereby resulting in great differences in the calculation results. Some studies often underestimate the true level of China’s agricultural carbon emissions due to merely focusing on the main carbon sources and ignoring the small ones that are more complicated and tinier. Surprisingly and confusingly, some do not differentiate between the carbon element, carbon dioxide and greenhouse gases. Apparently, they are dissimilar concepts and have different conversion coefficients, requiring uniform units of measurement. If these indicators are handled without being distinguished carefully, it may lead to some mistakes being made, imperceptibly. Furthermore, a large proportion of researchers estimated the carbon emissions based on the 2006 IPCC Guidelines for National Greenhouse Gas Inventories [28,29,30], an internationally official and authoritative instruction. However, the guidelines were revised in 2019, namely under the name of the 2019 Refinement to the 2006 IPCC Guidelines for National Greenhouse Gas Inventories. Now, the 2019 Refinement is the latest and the most authoritative scientific basis to support the preparation of national greenhouse gas inventories, and it supplements the carbon sources and carbon emission factors that were not involved before. Thus, it is necessary and reasonable to use them in combination. In addition, most of the existing macro studies on agricultural carbon emissions are simply based on the perspective of the total amount of carbon emissions, which cannot identify the internal fluctuations in the change of the total amount of them, while this is the key to our optimization agricultural structure to achieve carbon emission reduction. The analysis perspective of the mentioned studies are relatively simple, and most of them provide policy implications at the entire national level, which means that it is difficult to generate a specific focus for policy implementation.
Therefore, our paper studies the agricultural carbon emissions from an internal perspective, which can effectively supplement the shortcomings of the existing studies that often ignore this point. Meanwhile, this paper will help us to better understand the specific situation of agricultural carbon emissions in China and provide some targeted suggestions to tackle it.
This paper makes several important contributions to the literature: (1) Based on the latest IPCC Guidelines for National GHG Inventories, a meticulous calculation inventory of China’s agricultural carbon emissions has been constructed, which comprehensively considers the agricultural carbon sources that have been neglected in previous studies, and this has a high degree of practicality. This paper uses the reconstructed index system to calculate the agricultural carbon emissions in China and its provinces, and the results of this are more scientific and valuable. (2) Unlike the previous studies which mainly considered the total amount of agricultural carbon emissions, this paper focuses more on the internal structure and sources of the carbon emissions. Further, the regional differences and dynamic evolution characteristics of the agricultural carbon emissions structure are investigated in detail, which provides a new perspective for clarifying the evolution of agricultural carbon emissions in China.
2. Material and Methods
2.1. The Calculation of China’s Agricultural Carbon Emissions
Based on the 2006 IPCC Guidelines, the 2019 Refinement and related studies, this paper constructs a calculation inventory of the agricultural carbon emissions that are in line with China’s national conditions. We comprehensively adopted a carbon metrology and emission factor method to construct an inventory, which includes six major types of agricultural carbon sources: the agricultural materials, rice planting, livestock and poultry, agricultural energy, straw burning, and soil. The relationship between these can be modeled using the following formula:
where E is the total amount of agricultural carbon emissions; Ei denotes the quantity of carbon emissions from the category i carbon sources; Qi is the quantity of the category i carbon sources; EFi denotes the emission factors of the category i carbon sources. According to the IPCC calculation principle, the GHGs are equal to the data of various activities multiplied by the emission factors. When it is applied to agriculture, it is the data of the agricultural activities which produce the greenhouse gases multiplied by the according emission factors. In this paper, a variety of GHGs are converted into the carbon dioxide equivalents (CO2e) according to the international standards. The six agricultural carbon sources and the corresponding segmentations of these are shown in Figure 1.
2.2. Kernel Density Function Approach
A kernel density function can describe the distribution characteristics of the research variables through smooth and continuous density curves, which is an important non-parametric estimation method, and it has the advantages of a strong level of stability and a weak level of dependence. It is a useful analysis tool for our paper to further investigate the absolute differences and spatial dynamic evolution characteristics of the agriculture carbon emission structure. Generally speaking, the longitudinal comparison of the kernel density curves during different periods in the same region can explore the dynamic evolution trend of the distribution characteristics of the agricultural carbon emission structure in this region, while a horizontal comparison of the kernel density curves in the different regions during the same period can capture the differences in the change in the trajectories of the agricultural carbon emission structure. The function is presented as follows:
In Equations (2) and (3), N represents the number of observations, K (·) represents the kernel density function, Xi denotes the independent and identically distributed observations, denotes the mean value, and h denotes the bandwidth.
2.3. Data Source
Based on the agricultural carbon emission inventory that is constructed in Figure 1, this paper calculates the agricultural carbon emission data of 30 provinces (cities, districts) in China from 1991 to 2019. Hong Kong, Macau, Taiwan, and Tibet are not involved in this due to the data inaccessibility. Table 1 shows the all of the data sources for our calculation.
It should be noted that the chemical fertilizers, pesticides, agricultural film, agricultural sown areas, crop yields, and agricultural energy consumptions of the varieties that are used in this paper are all calculated according to the actual situation that occurred during that year. The feeding quantities of cattle, mules, camels, donkeys, horses, pigs, sheep, rabbits, poultry and other livestock are modified according to the conversion formula with reference to their breeding rate and the year-end stock situation of each year. In addition, the price variables that are used in this chapter including the gross output value of the agriculture, forestry, animal husbandry, and fishery sectors are adjusted to the constant price in 2005 (2005 is in the middle of the sample range in this paper) for a longitudinal comparative analysis to be performed.
3. Results and Discussion
3.1. Spatial–temporal Evolution Characteristics of Agricultural Carbon Emissions in China
Figure 2 shows the temporal evolution characteristics of the total amount of agricultural carbon emissions and the growth rate of this in China from 1991 to 2019. Overall, the agricultural carbon emissions in China showed an obvious upward trend, but there were also some fluctuations in it, and the growth rate of this has gradually slowed in recent years. China’s total amount of agricultural carbon emissions in 2019 were 1497.27 million tons of carbon dioxide equivalent (CO2e), with it increasing by 39.54% when it was compared with the 1073.02 million tons that were produced in 1991, with an average annual growth rate of 1.19%. According to the peak, the agricultural carbon emissions can be divided into four stages: (1) The first stage is 1991–1996. This was a period of rapid ascent, whereby the agricultural carbon emissions increased from 1073.02 million tons to 1302.42 million tons, increasing by 21.38% rapidly. The growth rate was from slow to fast, and the average annual growth rate was 3.88%. The potential reason why the rate grew quickly is that during the initial stage of agricultural modernization when the farmers left their villages in the early 1990s, increasing demands for various production elements led to a large production of agricultural carbon emissions. (2) The second stage is 1996–2007. During this time, the agricultural carbon emissions showed a fluctuating upward trend, and the growth rate of this gradually increased. The emissions increased from 1302.42 million tons to 1505.59 million tons, increasing by 15.60%, with an average annual growth rate of 1.72%. Compared with the previous stage, the growth rate fell sharply, but the fluctuant rising characteristic was still obvious. Environmental changes that occurred at home and abroad is an important reason for the emergence of this volatility. Specifically, in 1997, there was a severe summer drought in northern China, which had a negative impact on agricultural production activities. The Asian financial crisis that occurred in the same year also negatively shocked China’s agricultural exports. Then this was followed by a major flood in southern China in 1998 and natural disasters in 1999, which all had an adverse effect on China’s agricultural development. Then came the turning point. China joined the WTO in 2001 and gradually abolished agricultural taxes in the following years, which greatly increased the farmers’ enthusiasm for production and led to a rapid rise in agricultural carbon emissions to an extent. (3) The third stage is 2007–2015. During this time, the agricultural carbon emissions overall showed a “w” type, the trajectory of which first dropped sharply, then rebounded rapidly and rose slowly then again. The emissions increased from 1505.59 million tons to 1582.51 million tons, which is an increase of 5.11%, with an average annual growth rate of 0.71%. Livestock and poultry breeding structure adjustments and scale reductions that were implemented during this time were the main reasons for the reduction in the agricultural carbon emissions. (4) The fourth stage is 2015–2019. During this time, the agricultural carbon emissions fluctuated and dropped to 1497.27 million tons in 2019, declining for three consecutive years with it declining by 5.39%, and the average annual growth rate was −0.51%. A negligible fact is that Chinese government’s efforts, in the past five years, to promote the green development of agriculture have been an important driving force for the reduction in the agricultural carbon emissions. Overall, in the past nearly 30 years, China’s agricultural carbon emissions have experienced ups and downs, showing an obvious “ladder” evolution characteristic. That is, a rapid rise, then a rise in volatility, then, a fall and then, a drop in volatility. It is worth noting that the overall growth trend was obvious, with there being 20 years of increase in carbon emissions during the sample period.
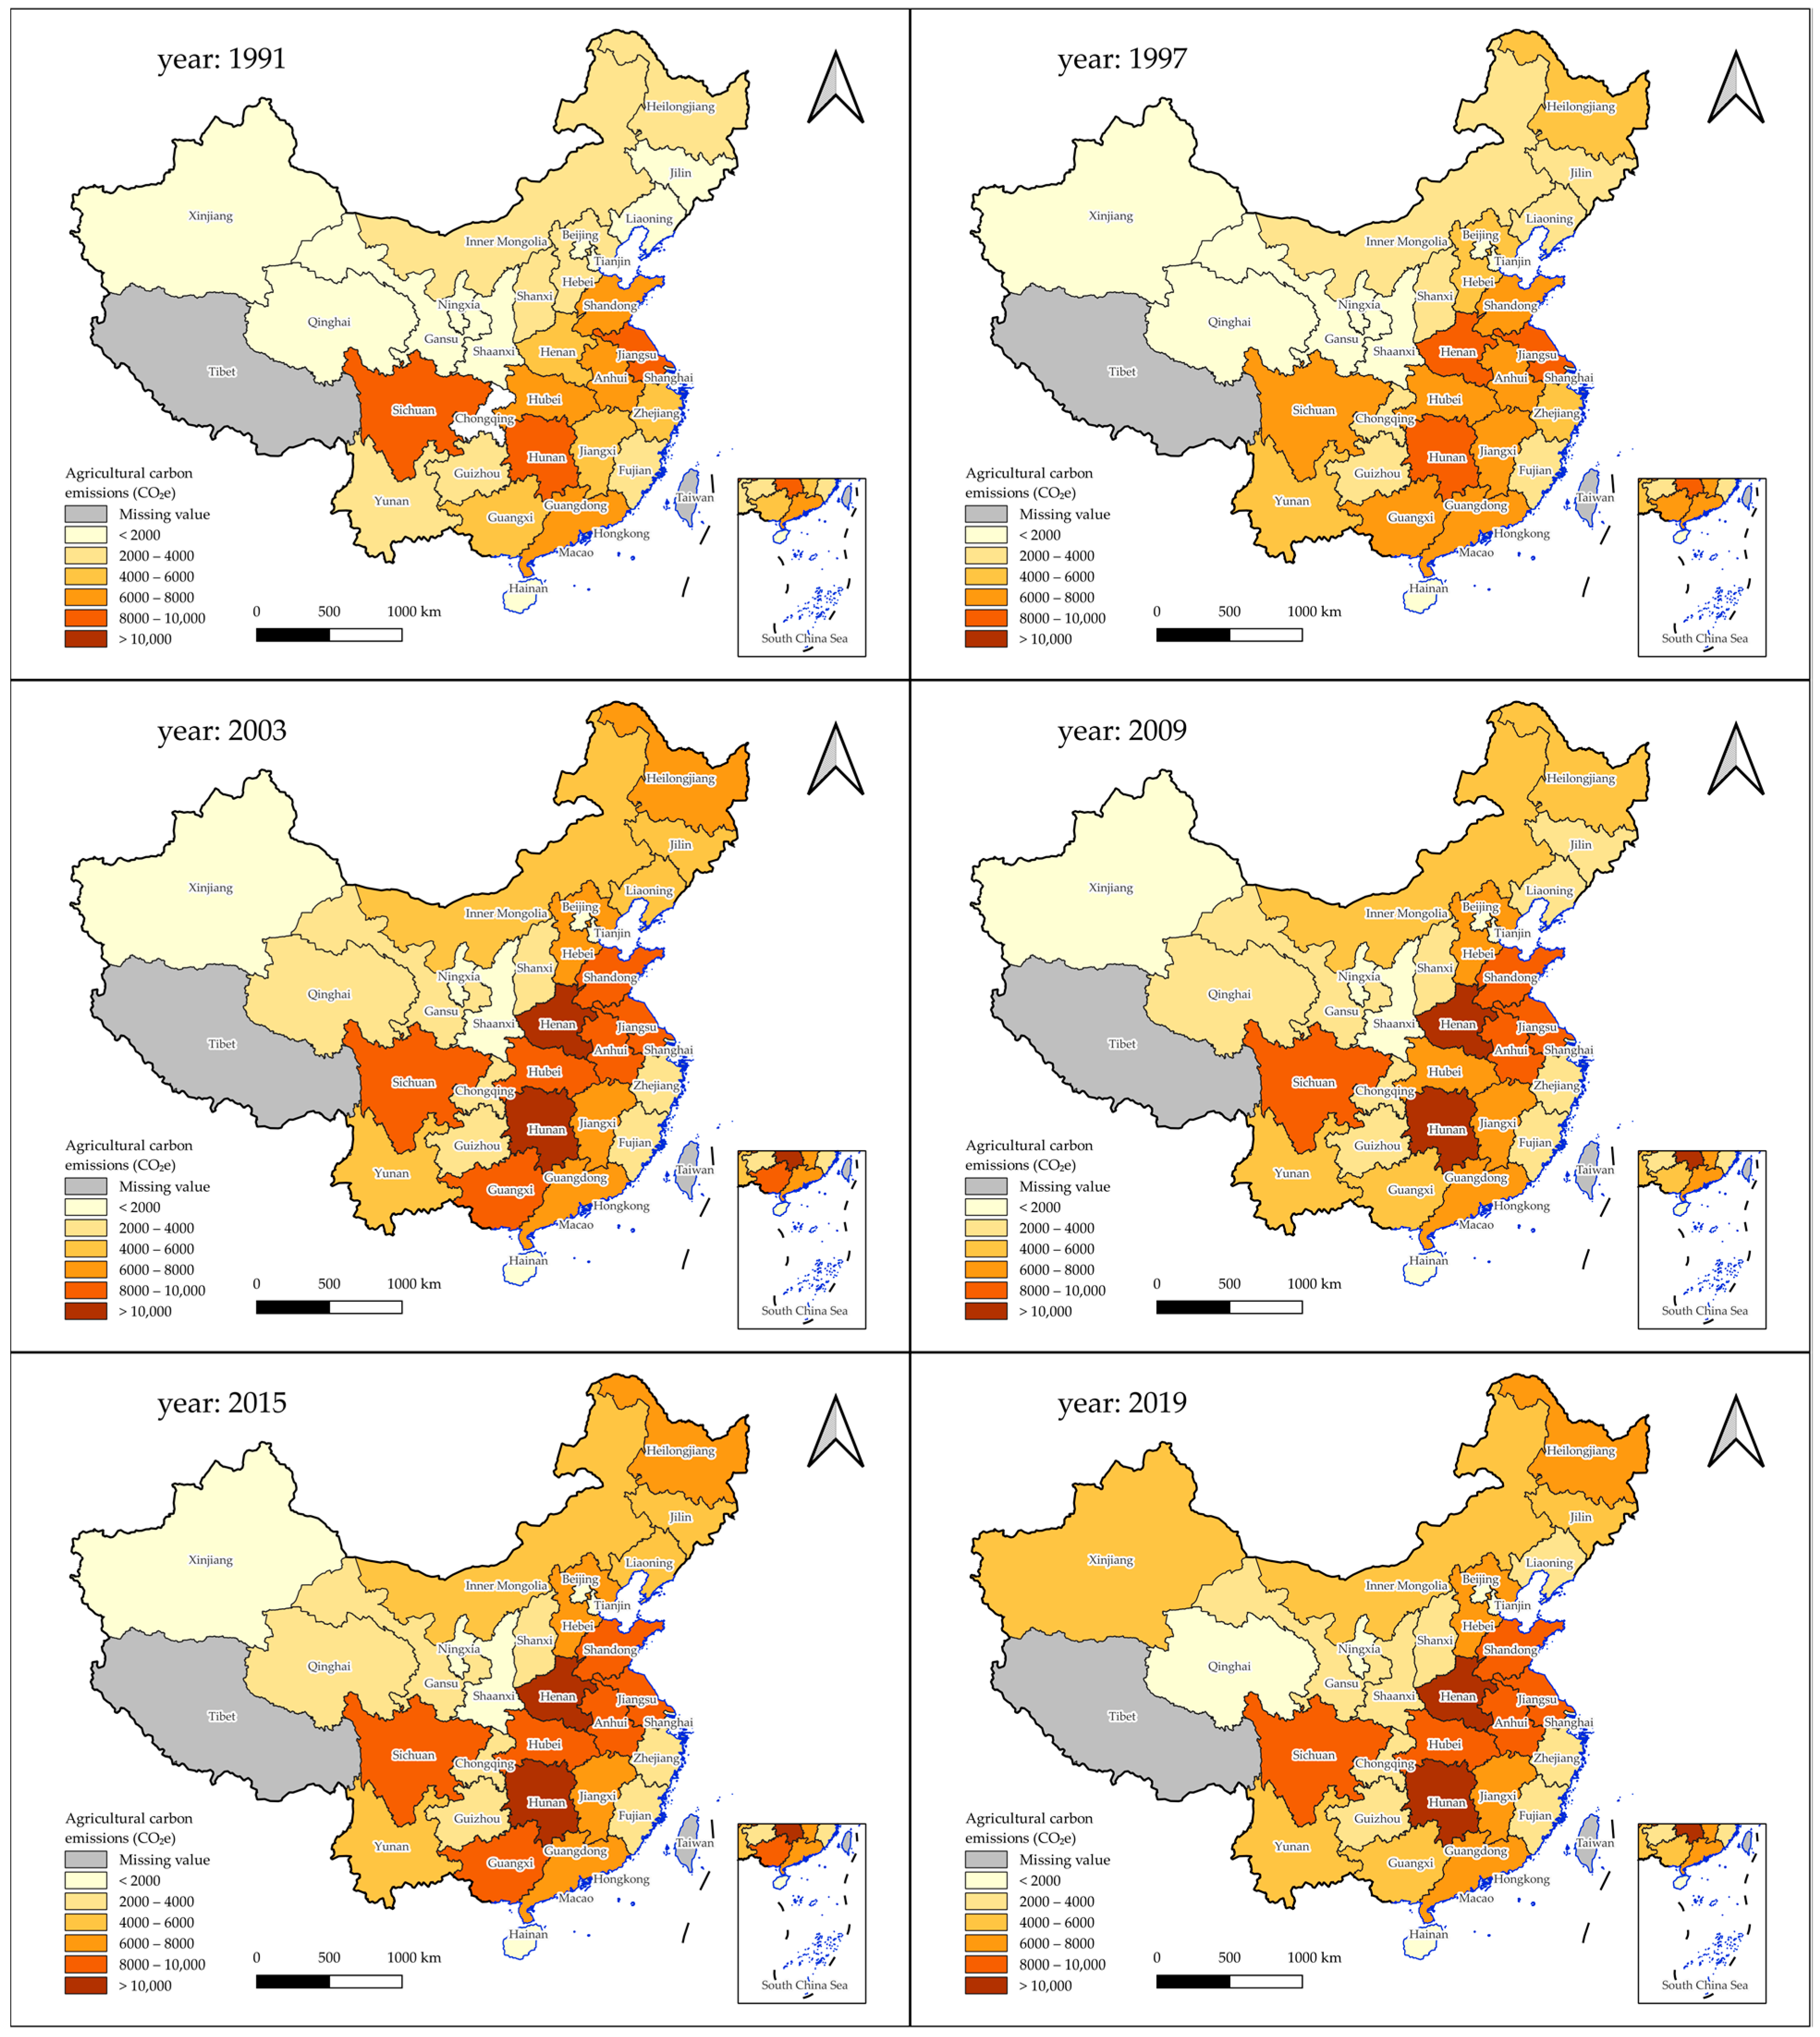
Figure 3 shows the features of China’s agricultural carbon emissions in recent decades. From the time dimension, the colors of the six maps from 1991–2019 gradually deepen, with the size of the light-colored areas gradually decreasing and the size of the dark-coloured areas gradually expanding, indicating that China’s agricultural carbon emissions were increasing year by year. From the spatial dimension, the distribution of agricultural carbon emissions across the provinces from 1991–2019 was uneven, with there being higher levels of agricultural carbon emissions in the central region and relatively lower levels of this in the northwestern region. It can be seen from the color differences that there was a tendency for the differences in the agricultural carbon emissions between the different provinces to widen, and a carbon emissions lock effect may have formed in some provinces. We can see from the figure that provinces such as Hunan, Henan, and Sichuan are the most prolific emitting provinces. On the contrary, Beijing, Tianjin, Hainan, and Qinghai produced relatively few emissions. There is a significant gap in the agricultural carbon emissions among the provinces. The possible reason why the carbon emissions are different is that the agricultural resource endowments of each province are diverse, and the agricultural output value, the population that is engaged in agriculture and the internal structure of the agricultural sector are also various. As traditional, large agricultural provinces in China such as Hunan, Henan, Sichuan, Shandong, and Jiangsu have superior agricultural production conditions, which means that they have larger rice planting areas and larger scales of livestock and poultry breeding. Among them, Hunan, Henan, and Jiangsu are the primary large rice planting provinces, while Shandong and Sichuan are the provinces with the more developed animal husbandry in China. Beijing, Tianjin, and Shanghai are responsible for the goals of economic development, which makes their secondary and tertiary industries the main development forces as well as one of the main sales places for the agricultural products. Hainan, which is affected by its geographical location, primarily develops tropical agriculture, while the agriculture in Qinghai is mainly dominated by animal husbandry, but the overall scale of the agriculture between them is small. Next, this paper comprehensively analyzes the potential reasons for these regional differences in the agricultural carbon emissions from the standpoint of the grain functional areas.
Table 2 shows the average annual agricultural carbon emissions and the carbon emissions of six agricultural carbon sources in various regions of the country from the standpoint of the three major grain functional areas. From calculations of the total amount, the annual total agricultural carbon emissions and the carbon emissions of each carbon source in the major grain producing areas were significantly higher than those in the major grain sales areas and the production–sales balance areas. As one of the major grain producers, Hunan has the highest annual carbon emission value of 106.21 million tons in China, while Beijing has the lowest agricultural carbon emissions, which may be accounted for its political and economic status.
From the standpoint of the agricultural carbon emission intensity, which is the agricultural carbon emission that is caused by GDP per unit of the primary industry, the average national agricultural carbon emission intensity was 4.18 tons/ten thousand yuan. The carbon emission intensities of the three major grain functional areas were ranked from high to low, and this went in the order of the production–sales balance areas (5.49 tons/ten thousand yuan), the major grain producing areas (3.94 tons/ten thousand yuan), and the major grain sales areas (2.74 tons/ten thousand yuan). Furthermore, Qinghai had the highest agricultural carbon emission intensity (15.26 tons/ten thousand yuan), while Liaoning had the lowest agricultural carbon emission intensity (2.06 tons/ten thousand yuan). According to the rank of the carbon emission intensity, we can find that the rank of the major grain sales areas was at the top overall, yet the rank of the production–sales balance areas was at the bottom. The possible reason for this lies in the significant differences in the production and consumption patterns of the two functional areas. As a matter of fact, the main grain sales areas had a large population and less land, and the focus of their economic development depended on the secondary and tertiary industries, which means that it felt relatively less pressure to produce grain. To some extent, this analysis considered the agricultural economic growth and carbon emissions. In addition, the production–sales balance areas were positioned to maintain food self-sufficiency. Their internal agricultural production mode and technology were quite different, and the dependence that they had on chemical inputs and energy production elements was relatively high. Although they can maintain the balance of food production and food consumption, its carbon production efficiency was not high.
3.2. Dynamic Evolution Characteristics of Agricultural Carbon Emission Structure in China
The existing literature mainly analyzes the spatial–temporal variation of the agricultural carbon emissions in China from the perspective of the total amount of it, but there are few quantitative studies which have been based on the internal structure of agricultural carbon emissions in order to analyze the regional differences and dynamic evolution of the agricultural carbon emissions in China. The structure of the agricultural carbon emissions reflects the structure of the agricultural production activities to some extent, which is the internal composition of various agricultural production sectors and the proportional relationship between them. To optimize the internal structure of the agricultural industry is an important way to reduce agricultural carbon emissions [31]. In view of this, this paper further studies the dynamic evolution characteristics of the internal structure of the agricultural carbon emissions in China from a structural perspective.
Based on six agricultural carbon sources, Figure 4 shows the differences and trends in the agricultural carbon emission structure in China from 1991 to 2019. We can find that the carbon emissions that were generated by livestock and poultry were the primary source of agricultural greenhouse gases. Its proportion rose in a fluctuating manner from 39.53% in 1991 to 46.50% in 2003 and then, it decreased to 37.34% in 2019, with an average annual proportion of 41.89%. Rice planting was the second largest source of agricultural carbon emissions. The proportion of this decreased from 25.73% in 1991 to 18.14% in 2019, which was a large decline, but it was still the second largest source. The proportion of agricultural energy in the agricultural carbon emissions persistently increased from 11.24% in 1991 to 17.84% in 2019, which may be caused by the scale and mechanization of agricultural production in China in recent years. The continuous increase in energy demand made the agricultural energy sector have become the third largest source of agricultural carbon emissions, which cannot be ignored. The proportion of the emissions that were caused by straw burning changed slightly, showing a downward trend in general. The proportion of the emissions that were caused by the agricultural materials sector increased (1991–2014), and then decreased (2014–2019). The proportion of the emissions that were caused by soil basically showed an increasing trend, which was 3.35% higher than it was in 1991.
Figure 5 shows the differences in the agricultural carbon emission structures in China in 1991, 2005, and 2015. The results showed that the agricultural carbon emission structure between each province had certain regularity and obvious regional heterogeneity. Firstly, the carbon emissions from the agricultural materials and soil accounted for only a small proportion of the total agricultural carbon emissions, especially from rice planting, which was basically maintained at a level that was below 5%.
The carbon emissions from livestock and poultry, rice planting, and agricultural energy were the main sources of provincial carbon emissions, and straw burning was also an important agricultural carbon emissions source. Secondly, there were obvious differences in the structure of the agricultural carbon emissions among the provinces in China, mainly in the proportions from the livestock and poultry, rice planting, and agricultural energy sectors. For example, the rice planting in Jiangsu, Zhejiang, Shanghai, Anhui, Fujian, Jiangxi, Anhui, Fujian, Hubei, Hunan, Guangdong, and Guangxi caused a high proportion of the agricultural carbon emissions. However, as it was influenced by the type of soil, the topography, and other factors, the western region was not good at rice and grain production, while it had developed animal husbandry. Therefore, the proportion of livestock and poultry in the western region was very high, which also reflected the regional differences in the agricultural development in China. From 1991 to 2019, the proportion of it that was caused by the agricultural materials was rather low, but this small proportion of soil carbon emissions showed a gradual growth trend. The rice planting in Jiangsu, Zhejiang, Shanghai, Anhui, Fujian, Jiangxi, Hubei, Hunan, Guangdong, and Guangxi which accounted for a high proportion of the agricultural carbon emissions in each province unexpectedly decreased.
The above-mentioned analysis shows that China’s agricultural carbon emission structure presents obvious regional spatial and temporal heterogeneity. In order to analyze the absolute difference and dynamic evolution trend of the agricultural carbon emission structure in China more vividly, the authors of this paper used the kernel density function to analyze the distribution position, the peak shape, the distribution ductility, and the polarization phenomenon, as shown in Figure 6.
(1) From the standpoint of the distribution position, the kernel density function center of agricultural energy and soil continued to shift right, and the proportion of carbon emissions increased during the study period. The center of the density function of agricultural materials moved to the right overall, but there was a pattern of movement that went “right and then left”. With the rapid development of China’s agriculture, the investment in agricultural materials continued to increase, and the proportion of agricultural carbon emissions that were caused by agricultural materials i also continued to increase. After 2010, China continued to promote the green and low-carbon transformation of agriculture, and the long-term reckless agricultural development model that was characterized by high investment, high consumption, and high pollution had been improved, and as a result of the proportion of agricultural materials investment had decreased. The central density function of straw burning gradually shifted to the left. The possible reason for why it shifted was that the government restricted the farmers to burn the straw step-by-step, which made the proportion of agricultural carbon emissions that were caused by straw burning decrease. The density function position of the sub-peak position of rice planting gradually shifted to the left, indicating that the planting structure was more diverse in some of the main rice producing areas, and the proportion of rice planting decreased. The density function position of livestock and poultry fluctuated continuously during the study period, showing a pattern of movement that went “right and then left”. The reason for the fluctuation may be the rapid development of animal husbandry in China during the 1990s, the level of animal husbandry production increased sharply, and the proportion of carbon emissions that were caused by livestock and poultry increased rapidly. However, in the 21st century, the reckless development model led to structural overproduction in some areas. China’s animal husbandry entered the adjustment and optimization stage, and the proportion of carbon emissions that were caused by livestock and poultry decreased gradually. (2) From the standpoint of the peak shape, the peak evolution of the kernel density functions of agricultural materials, agricultural energy, and soil were basically the same, showing a rapid decline in the peak, and the peak width was expanding, and the absolute gap of the three carbon sources was significantly increased between each province. The peak value of the density function center of livestock and poultry increased, and the peak width decreased, indicating that the regional difference for domestic livestock and poultry was reduced and more concentrated. The density center function peak of straw burning showed a trend of it increasing, and then it decreased, and the peak width also showed the evolution characteristics of “rapid narrowing-light expansion-gradually stable”, which was stable after 2010. (3) From the standpoint of the distribution ductility, the proportions of carbon emissions by the six carbon sources showed a convergence trend, but their curve distribution ductility was different. The kernel density curves of livestock and poultry, agricultural energy, and soil had the right tailings phenomena, indicating that the proportions of the carbon emission gap of these three carbon emission sources were gradually widening. (4) From the standpoint of the polarization factor, the kernel density functions of rice planting, livestock and poultry, agricultural energy, and straw burning were basically composed of ‘one main and one small ’peaks, indicating that the carbon emissions that were caused by these carbon sources were currently slightly polarized, and the proportions of the carbon emissions in some provinces were relatively high.
4. Conclusions
This paper uses carbon metrology, the emission factor method, and the kernel density estimation to explore China’s agricultural carbon emissions, structure, and its regional differences and dynamic evolution characteristics. Based on the existing literature and the official documents such as the 2006 IPCC Guidelines and the 2019 Refinement of them, this paper firstly compiles the agricultural carbon emissions calculation inventory, and then scientifically and comprehensively calculates the agricultural carbon emissions of 30 provinces in China from 1991 to 2019 from six carbon emission sources such as agricultural materials, rice planting, and so on. From the perspective of the internal structure, this paper further deepens the understanding of the evolution process of the agricultural carbon emissions in China. The main conclusions are as follows:
- (1)
- In terms of time, China’s total agricultural carbon emissions showed a trend of a gradual “ladder”, with it fluctuating in an upward trend, and the growth rate was gradually slowing. In terms of space, inter-provincial heterogeneity was significant, and the differences between the factors were expanding. The average annual amount of agricultural carbon emissions and the carbon emissions of each carbon source in the major grain producing areas were significantly higher than those in the major grain sales areas and the production–sales balance areas, and those in the major grain sales areas were lower than they were in the other two kinds of areas. The carbon emission intensities of the three major grain functional areas which were ranked from high to low were the production–sales balance areas (5.49 tons/ten thousand yuan), the major grain producing areas (3.94 tons/ten thousand yuan), and the major grain marketing areas (2.74 tons/ten thousand yuan).
- (2)
- From the perspective of the carbon emission structure, agricultural greenhouse gases mainly come from carbon emissions that are produced by livestock and poultry, which is followed by rice planting and agricultural energy. The proportion of the carbon emissions that were caused by straw burning changed slightly, showing a downward trend in general. The carbon emissions from agricultural materials and soil accounted for a small proportion of total amount of agricultural carbon emissions. The proportion of carbon emissions that were caused by agricultural materials increased (1991–2014), and then decreased (2014–2019), and the proportion of carbon emissions that were caused by soil showed an increasing trend.
- (3)
- From the perspective of the internal dynamic evolution, the evolution of the kernel density curve of agricultural energy and soil was similar, showing that the center of the curve continued to shift to the right. The peak value decreased rapidly, and the peak width expands continuously. The center of the density function of agricultural materials shifted to the right, but there was a ‘right and then left’ pattern in this. The peak value decreased, and the peak width expanded. The density function center of livestock and poultry fluctuated in 2001. The density center function of straw burning gradually shifted left, and the peak width increased. The proportion of the carbon emissions of the six major carbon sources showed a convergence trend, and there was a right tail phenomenon. The kernel density curves of rice planting, livestock and poultry, agricultural energy, and straw burning were basically composed of two peaks of “one main and one small” peak, while the peak of the agricultural material density function evolved from “one main and one small” peak to a single peak pattern, and the function of the soil evolved from a double peak to a single peak during the evolution process.
Author Contributions
Conceptualization, S.W. and H.L.; methodology, S.W. and Y.H.; software, S.W.; validation, S.W. and H.L.; formal analysis, S.W. and Y.H.; investigation, S.W., Y.H. and H.L.; resources, S.W.; data curation, S.W. and Y.H.; writing—original draft preparation, S.W. and Y.H.; writing—review and editing, S.W., Y.H. and H.L.; visualization, S.W.; supervision, H.L.; project administration, S.W. and H.L.; funding acquisition, H.L. All authors have read and agreed to the published version of the manuscript.
Funding
This research was founded by the Major Bidding Program of National Social Science Foundation of China (Grant No. 18ZDA074).
Institutional Review Board Statement
Not applicable.
Data Availability Statement
Not applicable.
Conflicts of Interest
The authors declare no conflict of interest.
References
- FAO. Emissions due to agriculture. Global, Regional and Country Trends 2000–2018; FAO: Rome, Italy, 2021. [Google Scholar]
- IPCC. Climate Change and Land: An IPCC Special Report on Climate Change, Desertification, Land Degradation, Sustainable Land Management, Food Security, and Greenhouse Gas Fluxes in Terrestrial Ecosystems; IPCC: Cambridge, UK; New York, NY, USA, 2019. [Google Scholar]
- Leila, F.; Reza, M.; Safdar, H. Agricultural energy demand modeling in Iran: Approaching to a more sustainable situation. Energy Rep. 2018, 4, 260–265. [Google Scholar]
- Huang, Z.; Mi, S. Research on agricultural carbon footprint—Taking Zhejiang Province as an example. Issues Agric. Econ. 2011, 32, 40–47. [Google Scholar]
- Li, B.; Zhang, J.; Li, P. Spatial-Temporal characteristics and influencing factors of agricultural carbon emissions in China. China Popul. Resour. Environ. 2011, 21, 80–86. [Google Scholar]
- Xiong, C.; Yang, D.; Xia, F.; Huo, J. Changes in agricultural carbon emissions and factors that influence agricultural carbon emissions based on different stages in Xinjiang, China. Sci. Rep. 2016, 6, 36912. [Google Scholar] [CrossRef] [PubMed] [Green Version]
- Liu, H.; Wen, S.; Zhang, Z. Agricultural production agglomeration and total factor carbon productivity: Based on NDDF-MML index analysis. China Agric. Econ. Rev. 2022, 14, 709–740. [Google Scholar] [CrossRef]
- Gilbert, N. One-third of our greenhouse gas emissions come from agriculture. Nature 2012, 31, 10–12. [Google Scholar] [CrossRef]
- Jin, S.; Lin, Y.; Niu, K. Green transformation of agriculture driven by low carbon: Characteristics of agricultural carbon emissions and its reduction path in China. Reform 2021, 5, 29–37. [Google Scholar]
- AGFEP. 2021 China and Global Food Policy Report; AGFEP: Beijing, China, 2021. [Google Scholar]
- Chen, R.; Jiang, Z. Study on Ecological Compensation Standard of Low Carbon Agricultural Production. J. Arid. Land Resour. Environ. 2018, 32, 63–70. [Google Scholar]
- Cheng, L. Spatial-Temporal Differentiation of Agricultural Carbon Productivity in China: Mechanism and Empirical Analysis. Ph.D. Thesis, Huazhong Agricultural University, Wuhan, China, 2018. [Google Scholar]
- Liu, X.; Yu, Y.; Luan, S. Empirical study on the decomposition of carbon emission factors in agricultural energy consumption. In Proceedings of the 4th International Conference on Environmental Science and Material Application (ESMA), Xi’an, China, 15–16 December 2018; IOP Publishing: Bristol, UK, 2019; Volume 252, pp. 15–16. [Google Scholar]
- Wu, J.; Ge, Z.; Han, S.; Xing, L.; Zhu, M.; Zhang, J.; Liu, J. Impacts of agricultural industrial agglomeration on China’s agricultural energy efficiency: A spatial econometrics analysis. J. Clean. Prod. 2020, 260, 121011. [Google Scholar] [CrossRef]
- Rehman, A.; Ma, H.; Ahmad, M.; Irfan, M.; Traore, O.; Chandio, A. Towards environmental Sustainability: Devolving the influence of carbon dioxide emission to population growth, climate change, Forestry, livestock and crops production in Pakistan. Ecol. Indic. 2021, 125, 107460. [Google Scholar] [CrossRef]
- Tian, Y.; Zhang, J.; He, Y. Research on Spatial-Temporal characteristics and driving factor of agricultural carbon emissions in China. J. Integr. Agric. 2014, 13, 1393–1403. [Google Scholar] [CrossRef] [Green Version]
- Wu, X.; Zhang, J.; You, L. Marginal abatement cost of agricultural carbon emissions in China: 1993-2015. China Agric. Econ. Rev. 2018, 10, 558–571. [Google Scholar] [CrossRef]
- Zhang, C.; Zhao, L.; Zhang, H.; Chen, M.; Fang, R.; Yao, Y.; Zhang, Q.; Wang, Q. Spatial-temporal characteristics of carbon emissions from land use change in Yellow River Delta region, China. Ecol. Indic. 2022, 136, 108623. [Google Scholar] [CrossRef]
- Herrero, M.; Henderson, B.; Havlik, P.; Thornton, P.; Conant, R.; Smith, P.; Wirsenius, S.; Hristov, A.; Gerber, P.; Gill, M.; et al. Greenhouse gas mitigation potentials in the livestock sector. Nat. Clim. Change 2016, 6, 452–461. [Google Scholar] [CrossRef] [Green Version]
- Shi, R.; Irfan, M.; Liu, G.; Yang, X.; Su, X. Analysis of the impact of livestock structure on carbon emissions of animal husbandry: A sustainable way to improving public health and green environment. Front. Public Health 2022, 10, 835210. [Google Scholar] [CrossRef] [PubMed]
- Da Silva, M.; Lisbôa, A.; Hoffmann, R.; Da Cunha Kemerich, P.; de Borba, W.; Fernandes, G.; de Souza, É. Greenhouse gas emissions of rice straw-to-methanol chain in Southern Brazil. J. Environ. Chem. Eng. 2021, 9, 105202. [Google Scholar] [CrossRef]
- Huang, X.; Xu, X.; Wang, Q.; Zhang, L.; Gao, X.; Chen, L. Assessment of agricultural carbon emissions and their spatiotemporal changes in China, 1997-2016. Int. J. Environ. Res. Public Health 2019, 16, 3105. [Google Scholar] [CrossRef] [Green Version]
- Wang, G.; Liao, M.; Jiang, J. Research on agricultural carbon emissions and regional carbon emissions reduction strategies in China. Sustainability 2020, 12, 2627. [Google Scholar] [CrossRef] [Green Version]
- Huang, Q.; Zhang, Y. Decoupling and decomposition analysis of agricultural carbon emissions: Evidence from Heilongjiang province, China. Int. J. Environ. Res. Public Health 2022, 19, 198. [Google Scholar] [CrossRef]
- Norse, D. Low carbon agriculture: Objectives and policy pathways. Environ. Dev. 2012, 1, 25–39. [Google Scholar] [CrossRef]
- Liu, M.; Yang, L. Spatial pattern of China’s agricultural carbon emission performance. Ecol. Indic. 2021, 133, 108345. [Google Scholar] [CrossRef]
- Zhou, X. Study on the Impact of Agricultural Trade Opening on China’s Agricultural Carbon Emission Performance. Ph.D. Thesis, Beijing Forestry University, Beijing, China, 2020. [Google Scholar]
- Yang, H.; Wang, X.; Bin, P. Agriculture carbon-emission reduction and changing factors behind agricultural eco-efficiency growth in China. J. Clean. Prod. 2022, 334, 130193. [Google Scholar] [CrossRef]
- Zhang, L.; Pang, J.; Chen, X.; Lu, Z. Carbon emissions, energy consumption and economic growth: Evidence from the agricultural sector of China’s main grain-producing areas. Sci. Total Environ. 2019, 665, 1017–1025. [Google Scholar] [CrossRef] [PubMed]
- Cui, Y.; Khan, S.; Deng, Y.; Zhao, M. Spatiotemporal heterogeneity, convergence and its impact factors: Perspective of carbon emission intensity and carbon emission per capita considering carbon sink effect. Environ. Impact Assess. Rev. 2022, 92, 106699. [Google Scholar] [CrossRef]
- Stefan, F.; Robert, B.; Petr, H.; Hugo, V.; Mario, H.; Aline, M.; Tomoko, H.; Jared, C.; Shaun, R.; Michael, O. Structural change as a key component for agricultural non-CO2 mitigation efforts. Nat. Commun. 2018, 9, 1060. [Google Scholar]
Figure 1.
Compilation of Agricultural Carbon Emissions Calculation Inventory.

Figure 2.
Total agricultural carbon emissions and their growth rates in China, 1991–2019.

Figure 3.
The spatial distribution of China’s agricultural carbon emissions.

Figure 4.
Differences and trends of agricultural carbon emission structure in China, 1991–2019.

Figure 5.
Differences in annual agricultural carbon emission structure among provinces in China, 1991–2019.
Figure 5.
Differences in annual agricultural carbon emission structure among provinces in China, 1991–2019.

Figure 6.
The kernel density estimation analysis of six agricultural carbon sources. The subplot (a–f) are the kernel density results of agricultural carbon emissions from agricultural materials, rice cultivation, livestock and poultry, agricultural energy, straw burning and soil, respectively.
Figure 6.
The kernel density estimation analysis of six agricultural carbon sources. The subplot (a–f) are the kernel density results of agricultural carbon emissions from agricultural materials, rice cultivation, livestock and poultry, agricultural energy, straw burning and soil, respectively.


Table 1.
Agricultural carbon emissions data sources.
| Agricultural Carbon Source | Indicator | Data Sources |
|---|---|---|
| Agricultural materials | Fertilizers, pesticides, agricultural film usage | “China Agricultural Statistics (1949–2019)”; Database of the National Bureau of Statistics of the People’s Republic of China; |
| Rice planting | Early, middle and late rice planting area | “Compilation of Agricultural Statistics for 30 Years of Reform and Opening-up”; Database of the National Bureau of Statistics of the People’s Republic of China |
| Livestock and poultry | Annual output of various livestock and poultry | “China Animal Husbandry and Veterinary Yearbook”; “China Agricultural Statistics”; “China Agricultural Yearbook”; |
| Agricultural energy | Year-end inventory of various livestock and poultry | Regional energy balance sheet of “China Energy Statistical Yearbook” |
| Straw burning | Agricultural sector consumption by fuel species | “Compilation of Agricultural Statistics for 30 Years of Reform and Opening-up”; Database of the National Bureau of Statistics of the People’s Republic of China |
| Soil | Nitrogen fertilizer, production of various crops, annual output and year-end inventory of various livestock and poultry | “China Agricultural Yearbook”; “Compilation of Agricultural Statistics for 30 Years of Reform and Opening-up”; Database of the National Bureau of Statistics of the People’s Republic of China; “China Animal Husbandry and Veterinary Yearbook”; “China Agricultural Statistics”. |
Table 2.
Annual agricultural carbon emissions in regions.
| Agricultural Carbon Source | Gross | Carbon Intensity | Rank | |||||||
|---|---|---|---|---|---|---|---|---|---|---|
| Area | Agricultural Material | Rice Cultivation | Livestock and Poultry | AgriculturalEnergy | Straw Burning | Soil | ||||
| Major Grain Producing Areas | Jiangxi | 163.48 | 3223.12 | 1776.21 | 362.62 | 946.73 | 147.99 | 6620.15 | 6.05 | 29 |
| Hunan | 262.18 | 3631.34 | 3316.52 | 841.08 | 2370.69 | 199.44 | 10,621.24 | 5.50 | 28 | |
| Anhui | 326.64 | 2703.12 | 1973.06 | 473.61 | 2438.07 | 400.42 | 8314.92 | 5.09 | 25 | |
| Hubei | 334.21 | 2898.90 | 2211.15 | 802.67 | 1147.47 | 269.19 | 7663.59 | 4.46 | 21 | |
| Inner Mongolia | 149.20 | 24.65 | 2615.01 | 764.75 | 366.84 | 112.89 | 4033.35 | 4.23 | 19 | |
| Heilongjiang | 207.64 | 526.57 | 1771.58 | 1102.90 | 1344.14 | 195.93 | 5148.77 | 4.21 | 18 | |
| Sichuan | 280.12 | 1594.37 | 5303.43 | 540.24 | 1263.27 | 180.94 | 9162.38 | 4.20 | 17 | |
| Jiangsu | 366.81 | 3272.61 | 1484.25 | 1146.58 | 2063.69 | 338.30 | 8672.24 | 3.75 | 15 | |
| Jilin | 177.45 | 97.02 | 1545.69 | 370.62 | 815.55 | 279.95 | 3286.28 | 3.35 | 14 | |
| Henan | 568.12 | 270.53 | 4812.65 | 1096.91 | 2593.06 | 420.17 | 9761.44 | 3.25 | 12 | |
| Shandong | 581.21 | 78.20 | 4000.58 | 1681.34 | 1872.09 | 409.44 | 8622.87 | 2.56 | 6 | |
| Hebei | 336.88 | 44.47 | 2970.64 | 1580.30 | 771.95 | 210.62 | 5914.86 | 2.51 | 5 | |
| Liaoning | 184.67 | 138.44 | 1702.71 | 580.42 | 442.18 | 150.05 | 3198.47 | 2.07 | 1 | |
| Major Grain Sales Areas | Guangdong | 255.03 | 2170.27 | 2086.64 | 929.91 | 865.80 | 321.70 | 6629.35 | 3.08 | 10 |
| Shanghai | 26.26 | 204.73 | 172.53 | 152.61 | 78.32 | 12.75 | 647.20 | 3.00 | 9 | |
| Zhejiang | 133.98 | 1344.87 | 766.13 | 952.81 | 495.45 | 74.35 | 3767.58 | 2.95 | 8 | |
| Hainan | 48.54 | 236.48 | 432.15 | 187.69 | 91.79 | 88.51 | 1085.16 | 2.86 | 7 | |
| Tianjin | 23.37 | 10.04 | 219.82 | 249.90 | 50.25 | 13.86 | 567.24 | 2.51 | 4 | |
| Beijing | 20.73 | 3.27 | 216.74 | 270.24 | 26.12 | 12.05 | 549.16 | 2.48 | 3 | |
| Fujian | 149.11 | 1007.97 | 898.18 | 403.40 | 237.64 | 158.71 | 2855.01 | 2.34 | 2 | |
| Production-Sales Balance Areas | Qinghai | 9.06 | 0.00 | 1386.68 | 37.26 | 9.03 | 6.36 | 1448.39 | 15.26 | 30 |
| Shanxi | 113.57 | 0.64 | 894.66 | 859.49 | 570.86 | 79.35 | 2518.57 | 5.28 | 27 | |
| Ningxia | 31.76 | 14.96 | 344.45 | 175.20 | 80.29 | 22.04 | 668.69 | 5.18 | 26 | |
| Gansu | 129.77 | 1.07 | 1548.28 | 553.01 | 151.12 | 44.69 | 2427.95 | 4.92 | 24 | |
| Guangxi | 213.87 | 1960.53 | 2546.08 | 327.93 | 638.39 | 443.69 | 6130.49 | 4.88 | 23 | |
| Guizhou | 92.59 | 145.70 | 1979.87 | 401.58 | 66.48 | 81.60 | 2767.82 | 4.78 | 22 | |
| Yunnan | 188.25 | 189.64 | 2960.96 | 343.41 | 635.15 | 147.11 | 4464.51 | 4.27 | 20 | |
| Xinjiang | 202.95 | 22.03 | 1895.41 | 915.93 | 170.09 | 71.96 | 3278.36 | 3.87 | 16 | |
| Chong Qing | 81.04 | 399.99 | 906.25 | 378.79 | 189.22 | 56.24 | 2011.53 | 3.33 | 13 | |
| Shaanxi | 164.70 | 46.25 | 1041.92 | 438.66 | 326.52 | 128.35 | 2146.39 | 3.09 | 11 | |
| Major Grain Producing Areas | 302.97 | 1423.33 | 2729.50 | 872.62 | 1418.13 | 255.03 | 7001.58 | 3.94 | ||
| Major Grain Sales Areas | 93.86 | 711.09 | 684.60 | 449.51 | 263.62 | 97.42 | 2300.10 | 2.74 | ||
| Production-Sales Balance Areas | 122.76 | 278.08 | 1550.46 | 443.12 | 283.72 | 108.14 | 2786.27 | 5.49 | ||
| Whole Nation | 194.11 | 875.39 | 1859.34 | 630.73 | 770.61 | 169.29 | 4499.47 | 4.18 | ||
Note: The rank is ranking based on the carbon intensity of agriculture. The carbon intensity of agriculture is defined as the ration of agricultural carbon emission to the output of agriculture, forestry, animal husbandry, and fishery. Price variables are deflated at we have used 2005 as the base period.
Publisher’s Note: MDPI stays neutral with regard to jurisdictional claims in published maps and institutional affiliations. |
© 2022 by the authors. Licensee MDPI, Basel, Switzerland. This article is an open access article distributed under the terms and conditions of the Creative Commons Attribution (CC BY) license (https://creativecommons.org/licenses/by/4.0/).
Share and Cite
MDPI and ACS Style
Wen, S.; Hu, Y.; Liu, H. Measurement and Spatial–Temporal Characteristics of Agricultural Carbon Emission in China: An Internal Structural Perspective. Agriculture 2022, 12, 1749. https://doi.org/10.3390/agriculture12111749
AMA Style
Wen S, Hu Y, Liu H. Measurement and Spatial–Temporal Characteristics of Agricultural Carbon Emission in China: An Internal Structural Perspective. Agriculture. 2022; 12(11):1749. https://doi.org/10.3390/agriculture12111749
Chicago/Turabian StyleWen, Shibin, Yuxiang Hu, and Hongman Liu. 2022. "Measurement and Spatial–Temporal Characteristics of Agricultural Carbon Emission in China: An Internal Structural Perspective" Agriculture 12, no. 11: 1749. https://doi.org/10.3390/agriculture12111749
Note that from the first issue of 2016, this journal uses article numbers instead of page numbers. See further details here.