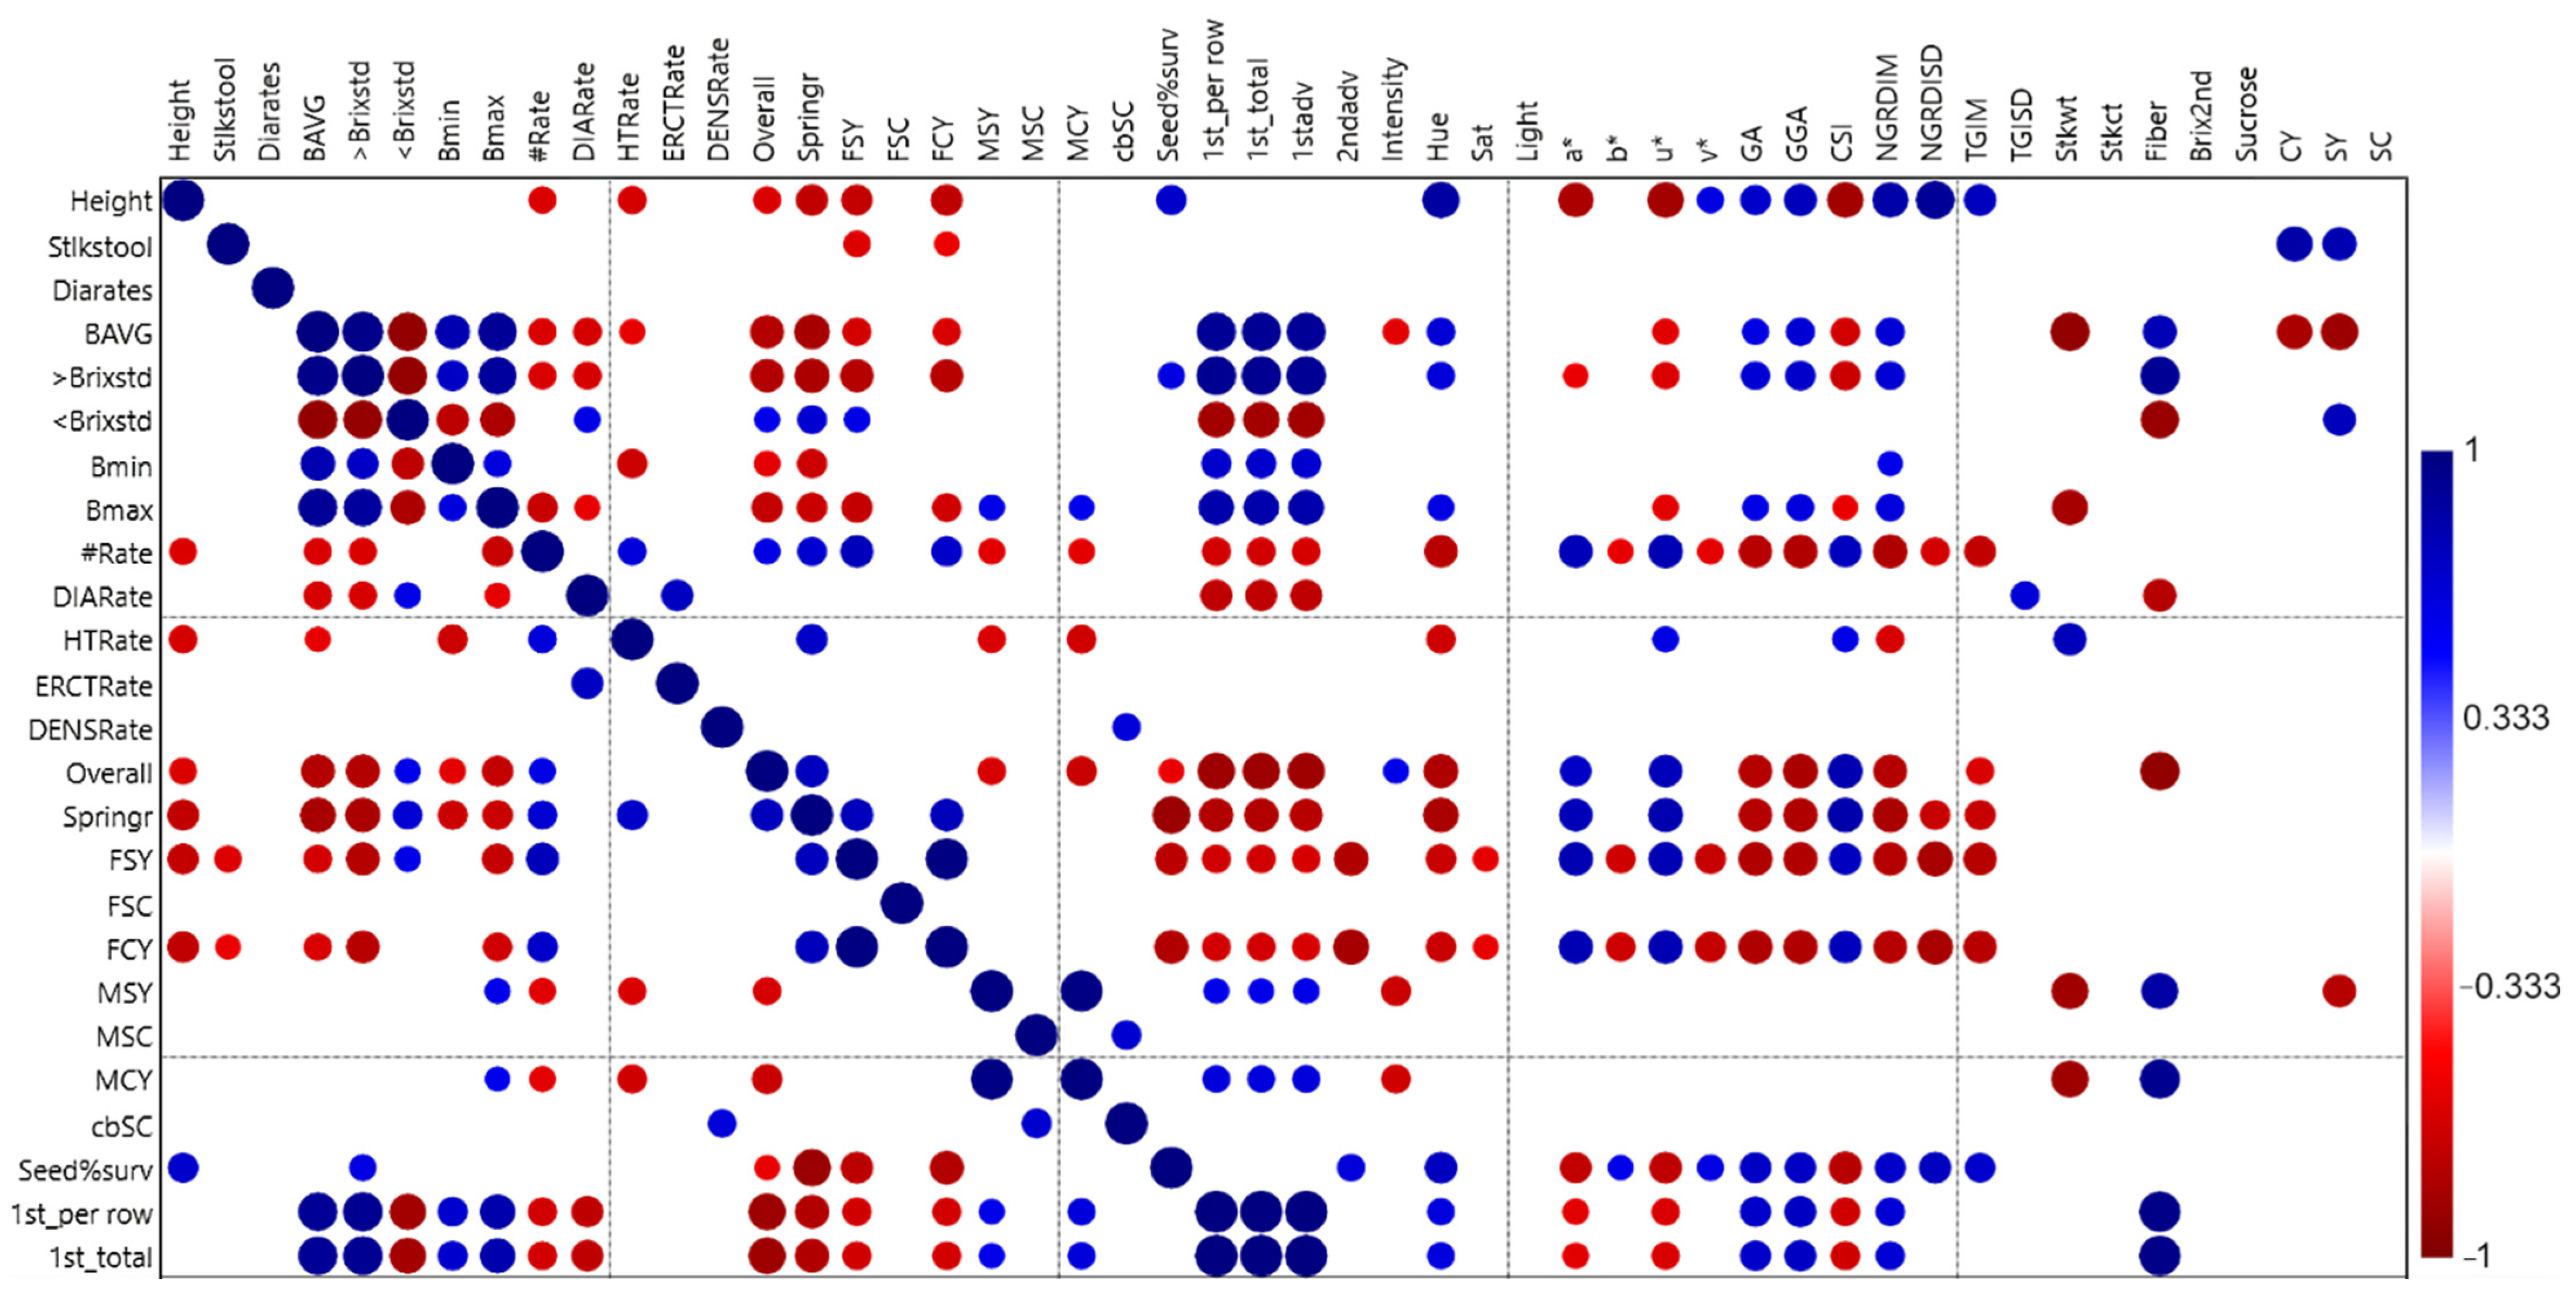
Article

Identification of Selection Preferences and Predicting Yield Related Traits in Sugarcane Seedling Families Using RGB Spectral Indices

Sugarcane Research Unit, USDA-ARS, 5883 USDA Rd., Houma, LA 70360, USA
*
Author to whom correspondence should be addressed.
Agriculture 2022, 12(9), 1313; https://doi.org/10.3390/agriculture12091313
Submission received: 18 July 2022 / Revised: 22 August 2022 / Accepted: 25 August 2022 / Published: 26 August 2022
(This article belongs to the Section Crop Production)

Abstract

:
The early stages of the United States Department of Agriculture (USDA) Louisiana commercial sugarcane breeding program involve planting large numbers of genetically unique seedlings that require time and resources to evaluate. Selection is made quickly, is subjective, and related to the appearance of yield and vigor. Remote sensing techniques have been used to predict yield of several crops over large areas using areal images. To understand selection preferences better and if remote sensing techniques could be used to increase efficiency, twelve sugarcane seedling families each having approximately 263 seedlings were planted in two replications at the USDA-ARS Ardoyne farm. Stalk height, number and diameter ratings were taken on 50 stools of each replication of each family. Red-Green-Blue images were taken of the seedling field in plant cane and first ratoon before selection. Spectral indices were derived from the images for each plot. Height had the largest influence on visual selections of the field measurements evaluated. Several spectral indices such as the Green Area (GA) correlated highly with important traits including Height (>0.80), selection rates (>0.70), and Brix (>0.60). The results show the potential for seedling evaluation by remote sensing methods.

1. Introduction

The sugar industry is an important contributor to the Louisiana economy with an overall economic value of 3 billion dollars [1]. The development of new sugarcane cultivars is important to the continued viability of the sugarcane crop. However, the breeding process is expensive, time consuming and labor intensive. For this reason, new methods are being sought to streamline the process and make it more cost-effective.
The early stages of the USDA Louisiana commercial sugarcane breeding program involve planting large numbers of genetically unique seedlings. These were germinated from true seed from biparental crosses with each cross being referred to as a family. Due to their large numbers (>50,000), seedling evaluations are done quickly by walking through and visually making selections. Other sugarcane breeding programs utilize family selection instead of selecting individuals from every family [2]. Family selection was found to be useful in selecting for traits with low heritability [2]. Family selection involves the selection of a whole population of seedlings based on information gathered from the family [2]. This typically requires weighing the total sugarcane harvested from field plots [2], but Todd and Johnson [3] showed the potential of using remote sensing to predict family performance.
Spectral imaging is one method that may help to reduce labor and inputs by scanning large areas rapidly and identifying spectral indices that can be linked to traits for selection [4]. Spectral imaging could provide breeders with a method to estimate traits without expensive additional labor and intensive field measurements. To facilitate the rapid acquisition of aerial image data, researchers have utilized both airplanes and drones equipped with specialized cameras or sensors. The acquired images are then analyzed to calculate various spectral indices that can be correlated to desired traits [4]. One common type of imagery that is produced by standard digital cameras is true-color or Red-Green-Blue (RGB) images that can be used to predict yield traits [5,6]. The Hue–Intensity–Saturation (HIS), International Commission on Illumination L*a*b* (CIELab), and L*u*v* (CIELuv) cylindrical coordinate representations of colors model can be used to derive indices from RBG images including GA, GGA and CSI [7,8,9,10]. These indices can predict crop yield and sometimes have higher prediction accuracies than NDVI [9,11,12]. Other RGB indices added to this study include, NGRDI (NGRDIM and NGRDISD) [13] and TGI (TGIM and TGISD) [14] which correlate with vegetation coverage and chlorophyll continent respectively. Todd et al. [3] used CIELab indices to predict the cane yield of seedlings for family selection. They developed a regression model based on CIELab indices to predict family cane yield and found that several indices taken in the first year’s crop (plant cane) correlated significantly with yield in the third year’s crop (second ratoon).
Since remote sensing techniques have been used to predict yield in sugarcane and sugarcane and other crops, remote sensing techniques should be useful in identifying the best crosses for family selection. The objective of this experiment was to study the relationship between, the calculated CIELab indices obtained using a camera on an aerial drone and the measured traits height and stalk number and selection rates in standard seedling plots and then to determine if these indices could be used for selection purposes.

2. Materials and Methods

2.1. Field Planting and Plant Measurements

Crosses were made at the USDA-ARS, Sugarcane Field Station, in Canal Point, Florida, USA, in 2016 and 2017. Elite families of various genetic backgrounds were selected from the crosses for the experiment. In April 2018, 12 families with approximately 263 seedlings in each were planted in two replications at the USDA-ARS Ardoyne Farm in Schriever, LA (29°38′09″ N 90°50′32″ W; elevation 2 m) in a Cancienne silt loam (Fine-silty, mixed, superactive, nonacid, hyperthermic Fluvaquentic Epiaquepts) soil. Each replication consisted of two adjacent rows with individual seedlings planted at an interval of 40 cm along 1.8-m-wide raised beds [15]. In each of the replications, families were planted as typical of the USDA ARS program with plots of uneven sizes because once the planter reached the end of the row the remainder of the family was planted on the adjacent two rows. The number of seedlings in each replication varied, with an overall average of 263 seedlings with a 7.77 sd (Table 1). Seedlings were ratooned in fall 2018.
In 2019, physical measurements including stalks per stool and height were taken once on every third or fourth stool for a total of 25 stools per row and 50 stools per replication per family. Visual diameter ratings were taken on each of these stools that ranged from 1 being the best to 9 the worst. Visual ratings were also made for each replication of each cross for stalk number, diameter, stalk height, stalk erectness, and stalk density. For selection purposes individual clones were chosen based on criteria such as the appearance of stalk number, diameter, and height from seedling plots. Clones were also evaluated for Brix content using a hand punch and refractometer [16]. Those clone that possessed a Brix value equivalent or exceeding check cultivars (17.5) were retained and planted in the field. Brix was recorded from a sample of 20 clones selected from each replication. If 70% of the clones are found above the Brix standard, then the remainder of the cross was selected. Otherwise, the remaining clones in the cross would continue to be evaluated and selected if they were above the Brix standard. Clones were also not selected if they had a disease or insect issue, or adverse harvestability trait such as lodging or stalk brittleness.
For clones that were selected from seedling plots two stalks approximately 1.8 m in length were cut and planted in single-row plots 1.2 m apart for the next stage of selection locally called first line trials with replications were kept separate [15]. In 2020, the first line trials were evaluated similarly to seedling trials by visual evaluation and retaining clones that exceeded the Brix of check control cultivars. For clones that were selected from first line trials for second line trials, six stalks were cut to a final stalk length of approximately 2 m and planted in single-row plots 4.0 m in length with a 0.9-m border between plots along the row [15]. In 2021, the first year of second line trials in the plant cane crop clones are visually rated again for disease and visual characteristics and the poorly rated clones are dropped. For the remaining clones harvestable stalks were counted, and a 10-stalk sample with the leaves and top with immature internodes removed was taken from each plot to estimate stalk weight. Cane yield was estimated as the product of stalk number and stalk weight. The samples were then shredded, and the juice was pressed from a 1-kg sample utilizing a core press at 211 kg cm−1 pressure. To calculate fiber the remaining fibrous residue was weighed then dried at 66 °C for 72 h. Brix and pol were measured utilizing a refractometer and polarimeter, respectively [15]. Fiber, Brix, and Pol were used to estimate sucrose and theoretical recoverable sugar content (kg Mg−1) as described by Legendre [17]. A list of traits evaluated is in Table 2.

2.2. Spectral Measurements

A Phantom 4 drone equipped with a 1/2.3” CMOS 12.5 MP camera (SZ DJI Technology Co., Ltd., Nanshan, China) flown at a vertical distance of 45.7 m (1.76 cm/px) was used to take true color, Red–Green–Blue (RGB) images on 2 July 2018, and 28 June 2019.
The Breedpix program [10] was utilized to extract color indices from the RGB (red–green–blue) images using the CIELab color space model [18]. This study utilized several indices including the green area (GA), which is the proportion of green pixels in an image [10] and the similar greener area (GGA) that excludes yellow pixels that correlate with senescent leaves [10]. These two indices correlate with green biomass. The Crop Senescence Index (CSI) that correlates with leaf senescence is the scaled ratio between yellow and green vegetation pixels and calculated using the GA and GGA in the following formula: CSI = (GA − GGA)/GA × 100 [8]. The Normalized Green–Red Difference Index (NGRDI) was developed to estimate the vegetation fraction, or the area covered with vegetation [13]. The Triangular Greenness Index (TGI) is only affected by leaf chlorophyll content and can be used to estimate plant N requirements [14]. Family plots were manually segmented into multiple images according to plot using the GIMP image editor [19]. Multiple images were required for one family because of plantings across multiple rows and irregularities in the field. Images were processed through the Breedpix Maize scanner plugin [10] within the ImageJ program [20].

2.3. Parental Yield

Historical parental yield including cane yield (Mg/hectare), sucrose content (kg/Mg), and sugar yield (Mg/hectare) of the female and male are used to make cross parental decisions in the breeding program. This information is an overall average of data collected from the entire breeding program compared to the check cultivar L 01-299 in the field and represented as a percentage.

2.4. Statistical Analysis

Broad sense heritabilities of replication means were calculated for measured traits using GGE Biplot software [21] by treating data as a Randomized Complete Block Design. Least square means were calculated using SAS Proc Mixed [22] with each trait as the dependent variable, family as a fixed variable and replication as a random variable. To calculate significant differences between families for traits measured at the stool level including height, stool number, and diameter rating, family was treated as a fixed variable and replication and stool were treated as random variables. To average multiple stool measurements by replication such as height, each trait was used as the dependent variable and family, replication within cross, and replication were treated as fixed variables, and stool was treated as random. Brix least square means were calculated using similar models, but stool was not included as a variable. The PDMixed macro was used to calculate mean separations at p = 0.05 [23].
The family least square means of each variable were then entered into PAST (PAleontological STatistics) software version 4.10, Øyvind Hammer, Oslow, Norway [24] for Pearson correlations. The descriptive statistics standard deviation, coefficient of variation, and range were calculated using Proc Univariate in SAS [22]. To create a prediction model of physical traits using spectral data. SAS Proc GLMSELECT [22] was used to identify the best multiple regression model for each trait’s estimation using stepwise regression with Schwartz’s Bayesian Criterion (SBC) selection and an adjusted R2 as a stopping criterion. Replication was kept in each model. Models were verified in Proc GLM and factors with Variance Inflation Tolerances less than 0.1 being eliminated [22]. Variance Inflation Tolerances less than 0.1 is an indicator that multicollinearity is high [22]. Levene’s test and Welch’s ANOVA were performed using SAS Proc GLM [22]. Differences between Brix samples above and below check standards were compared between replications using binary data and was compared using Fisher’s exact test in SAS Proc Freq using the Chi-Square option [22].

3. Results

3.1. Correlations

Height had the highest positive and negative correlations (0.82–0.90) with plant cane Hue, a*, u*, CSI, NGRDIM and NGRDI SD in plant cane (Figure 1) and NGRDIM, TGIM, a*, b*, u*, v*, GA, and GGA in first ratoon (0.74–0.84) (Figure 2). Stalks per stool had low non-significant absolute correlations with spectral indices in plant cane (0.46–0.11) and first ratoon (0.39–0.01). Diameter ratings also had low non-significant correlations with the only significant correlation being TGI SD in plant cane. Selection rates had good significant correlations with most spectral indices in plant cane (Figure 3) with 2ndadv having higher, significant correlations in first ratoon (Figure 2). Brix average had several moderate (~0.60) significant correlations including u*, GA, GGA, CSI, NGRDI mean, and Intensity. The number of seedlings that fell below the check cultivars’ Brix standard had weak correlations with spectral indices and so did the lowest Brix measurements. Those selected above the Brix standard and highest Brix measurements had higher correlations.
Spectral indices from plant cane and first ratoon did not correlate well with stalk count, fiber, Brix, or sucrose content measurements taken in second line trials (Figure 2 and Figure 3). However, second line trial cane yield, and sugar yield correlated with plant cane CSI, hue, intensity, lightness, and first ratoon NGRDIM.
Brix average was significantly correlated to 1stadv, which was a direct selection criterion, but was not significantly correlated to 2ndadv. The closest measured trait to correlate significantly with 2ndadv was height (p = 0.06). Seedling height did not correlate significantly with most yield traits in seedlings trials. (Figure 1). Seedling height correlated with height ratings and stalk number ratings. Seedling height did not correlate with second line yield traits, but height rating was inversely correlated with second line stalk weight (Figure 1). The correlation was positive, but the rating is inverse (1 best and 9 worst) indicating the higher the height rating (shorter cane) the lower the stalk weight. The height rating also correlated negatively with seedling Brix average, indicating a positive relationship with sugar accumulation. Seedling stool stalk diameter ratings were not significantly correlated with other yield traits or cross stalk diameter ratings (DIARate), but the cross stalk diameter ratings was negatively correlated (indicating a positive response) with Brix average, 1stadv and second ratoon fiber (Figure 1). Seedling stalks per stool had strong significant positive correlations with second line CY and SY. Seedling stalks per stool did not significantly correlate with stalks per stool ratings. This was most likely due to the way crosses are perceived as a whole ignoring tall poorly performing stools. The stalks per stool ratings showed significant negative correlations with measured height, brix average, and advancement to first line trials. The overall rating correlated with seedling selection rates indicating that the best rated families were the best selected. It is interesting that the overall rating also correlates to Brix the other important selection criterion at this stage. The overall rating correlated with height as well as several spectral indices including NGRDIM, u*, GA, GGA and CSI in plant cane and first ratoon (Figure 1 and Figure 2). The overall rating is one of the few ratings that correlates strongly with second line fiber, and it indicates that the better the rating the higher the fiber and that the higher rated families with higher selection rates had higher fiber in this study. Seedling Brix average was correlated positively with fiber and negatively with CY and SY. Selection rates also had negative, not significant correlations with CY and SY.
Parental yield correlated with selection rates and seedling and second line traits. Female sugar yield and cane yield correlated negatively with selection rates from seedlings and first lines; whereas, male cane yield correlated positively with seedling selection. The female had higher negative correlations with traits measured in seedlings and the male had higher negative correlations with traits measured in second line. For female yield, sucrose per hectare and tons per hectare had negative correlations with seedling height, brix average, and selection rates. For males, MSY negatively correlated with second line stalk weight (Stkwt), and SY and positively with fiber.
Most spectral indices correlated significantly between plant cane and first ratoon measurements. Intensity, lightness, CSI, and NGRDI SD were not significantly correlated between years. The remainder of the indices had high correlations (>0.80) apart from hue and TGI SD (Table 3).

3.2. Field Measurements

Descriptive statistics of traits measured on individual stools in plant-cane are listed in Table 4. Brix was the most consistent of all the traits measured on multiple stools for families between replication (Table 4). Only two families had significantly different replications (561 and 1739). In contrast, stalk diameter was the least consistent where every family had significantly different values between replications. Stalk height had four families significantly different and stalks per stool had 7 families not in agreement. For some traits and families, the standard deviation, CV, and range varied within family by replication. However, Levene’s test was not significant for different variances for Brix but was significant for stalk per stool for crosses 515, 691, and 798. Height showed different variance for crosses 92, 691, 1739, and 1847. Stalk diameter ratings variance were different for crosses 92, 516, 561, 722, and 1739. These unequal variances did not affect significant differences because the Welch’s ANOVA was still significant for each replication that showed Levene’s test significant differences and had an unequal variance. The Welch’s ANOVA test does not have the assumption of homogeneity of variance.
To determine if Brix varied sufficiently between replication to affect selection rates the clones above and below the Brix standard were compared in a contingency table for replication of each cross. There was not a significant difference between the replications for the number of plants that were selected because they were above the Brix standard between replications using a two-sided Fisher’s exact test (p = 0.05). Cross 523 had a p value of 0.07, but this cross had 4 missing observations in the second replication. The standard deviations of the traits did not correlate significantly with the NGRDI SD but height SD and stalk per stool SD correlated with TGI SD (−0.63 and −0.58 respectively) that might indicate that the variance of the traits affects the variance of TGI. Height SD also correlated strongly with other standard deviations including stalks per stool (0.64), stool weight (0.69) and with spectral indices Intensity (0.71), and Lightness (0.66). The height SD correlated negatively with height (−0.53) and positively with diameter (0.71). There were no significant correlations between the trait standard deviations and selection rates.
Most field measurements had significant differences by family. For height the means separated into 4 groups with 92, 516 and 798 the tallest and 515 and 722 the shortest (Table 5). The heritability was moderately high indicating that the trait is consistent between reps for each family in most of the cases. The two shortest families 515, and 722 were dropped in first line selection along with 691 which was in the third shortest group. The cross 1739 which was also a member of the third shortest group was dropped in plant cane second line trials. The overall model for stalk diameter ratings was not significant but the means could be divided into two groups significantly different from each other by least significant difference with the families 523 and 722 having the narrowest rated diameters and 515, 516, 1196 and 1739 the widest with the remaining not significantly different than the highest or lowest (Table 5). The heritability was zero, which would indicate that this trait was strongly influenced by the individual making the rating, since different individuals rated the different replications. Significant differences were observed between families for seedling stalks per stool (Table 5.) with the highest family being 561 and the lowest 516, 691, 798, and 1048. Two of the lowest families, 516 and 691 were dropped from the program. This trait also had low heritability and is not highly repeatable between replications. Brix average had four groupings and the family 798 had the highest brix average and 516, 722, 515 and 691 the lowest (Table 5).
The first line selection rates (Table 5) showed significant overlap between groups. Crosses 515, 691, and 722 were the least selected, and 1847, 1048, and 798 being the most selected. The heritability was high for selection rates between replication selection consistency. The overall rating resulted in two groups that were significantly different than each other with 515 being the worst and 798, 1048 and 1847 the best. The overall ratings showed similarities to selection rates for a few families in the extremes where there were defined groups. The heritability of overall ratings was low indicating that the perception of variety performance was inconsistent between replications.

3.3. Multiple Regression

Many of the spectral traits were correlated with each other (Figure 2 and Figure 3) and because of this multicollinearity became an issue in factor selection. However, not all factors were correlated; for instance, NGRDIM and GA did not correlate significantly with lightness in plant cane and first ratoon.
Multiple regression between yield traits and spectral indices were predictive but the models and the fit of the models were variable by crop. Results indicated that first ratoon height can be best predicted by plant cane spectral traits (R2 = 0.81). This exceeds the prediction of height using the first ratoon image (R2 = 0.60) (Table 6). Different indices were selected for each yield trait or selection rate. In plant cane the best model for height had NGRDISD, Hue and Saturation; however, in first ratoon, GGA was the best model. The standard deviations of NGRDI and TGI were important predictors for many traits in plant cane while less so in first ratoon. Selection rates and Brix could be predicted using plant cane image indices better than first ratoon image numbers and far better selection predictions could be made using spectral images than field measurements (Table 7). Height was the only selected predictor of selection rates and Brix from the field measurements.

4. Discussion

4.1. Spectral Correlations

Spectral indices show potential for early selection because image indices taken in plant cane seedlings in 2018 were highly correlated with height and the seedling and first line selection rates of 2019 and 2020. The selections from first line were made in a different field and year, indicating close correlations with genetic traits. Selection rates had higher correlations with many of the spectral indices than any of the field measurements or any other trait, except for maternal cane and sugar yield performance or spring ratings.
Traditional seedling selections are based on visual assessments. The family traits with the highest correlations with seedling selection included, stalk number rating, diameter rating and overall rating. However, family stalk number rating did not significantly correlate with individual stool counts, and family diameter ratings did not significantly correlate with stool diameter ratings. This discrepancy may be related to an unconscious bias that selectors only considering large desirable stools into ratings not random stools like those used in measurements. Height rating significantly correlated with measured plant height and seedling Brix average but not selection rates. The stalk number rating did not correlate with stalk per stool but correlated with height. The overall ratings, which are highly correlated with selection rates and reflect the selectors overall opinion of the cross, was also correlated with height and Brix. Ratings are not always representative of their predicted trait but are still useful in making selections. Sandhu et al. [25] found a 0.88 correlation between cane yield ratings and cane yield. Height appears be the trait that is the most related to selection rates and had the best correlations of the measured seedling traits with advancement rates, but these were not significant. The crosses with the shortest cane were selected at lower percentages and eventually dropped from the program. Since visual selection is based on perceived stalk number, diameter, height, and disease resistance, this selection may actually be for plant vigor (which is a combination of plant size, growth rate and health). Spring ratings are primarily ratings of vigor in the spring, and these are correlated with selection rates. Higher vigor results in better vegetation coverage which may explain the selection correlation with NGRDI and may be the result of greater photosynthesis and explain why GGA, which focuses on the greener photosynthetically functional portion of the vegetation [10], correlated with height, Brix, and selection rates. Spectral indices could replace visual ratings and identify which crosses should be prioritized for selection in the future since they do not have human bias and correlate with selection rates and Brix. They would also be a convenient way to evaluate test crosses where a small amount of seedling is planted to see how a family will perform before planting large areas of it.
After visual selection clones are selected based on Brix with only clones that are higher than the check being selected based on a 20-clone sample. If the majority of crosses in the sample exceed the check standard, then the remainder of the cross is kept and if not, then the remainder is Brixed and compared to the check. There were only five times the number of clones less than the check exceeded 50% cross 515 and 722 in first rep, cross 516 in the second rep, and cross 691 in the first and second replication. The first replication of 516 could be included with this group having a slightly higher percentage of exactly 50% of its clones eliminated. These families also represented the highest percentage of elimination due to Brix. However, from only two of these of these groups was the full 20 clone sample selected indicating poor selection rates for these low Brix crosses before Brix selection. When correlated with selection rates the crosses that clustered at the bottom were 515, 516, 691, and 722. These crosses had low Brix averages too. The majority of samples from each family however were above the Brix standard. To see if Brix had a correlation with selection rates before Brix selection the total number selected was correlated with Brix averages and there was still a correlation (0.79, p = 0.002) with selection rates and Brix before clones were eliminated for Brix, but this is approximate because some clones may have been eliminated but not recorded in cross 691 in the first replication during Brix selection. These results indicate that the poorly selected crosses had poor Brix before Brix elimination. If those crosses were eliminated the Brix selection rate correlation was still positive (0.54, p = 0.17) but not significant. Seedling Brix selection does explain why the correlation with seedling selection rate is so high. This indicates a positive relationship between field selection and Brix, but this is probably not the case in all populations. Brix also correlated with most of the spectral indices too and the number of stools with higher than Brix standard and the maximum Brix was more predictable than the number of lower Brix stools. It is interesting that Brix average did not correlate with second line sucrose content. This could be because the genetic Brix difference between families no longer exists in second line trials because of heavy selection for Brix during seedling and first line trials.
Seedling Brix had a significant negative correlation with second line CY and selection rates had non-significant negative correlation with second line CY. This could be because we are selecting heavily for Brix and dropping more from families that have greater cane yield (CY). Several spectral indices including plant cane hue, Intensity, lightness, and CSI and first ratoon NGRDIM had high correlations with second line SY and CY; therefore, these indices could be useful in finding families with high CY. Only plant cane hue and first ratoon NGRDM correlated with seedling height indicating that the other indices correlate with other CY related traits. Family selection in the Louisiana USDA program must account for the selection for early ripening in the first stage. Families cannot be selected for CY alone without regard for sugar because if more, high CY low SC seedling families are planted then more resources are used in the program. However, if high SC low CY clones are planted there are higher selection rates, but CY will suffer. It is best to continue to develop parents that have both high CY and SC. These traits must be kept in balance during cross selection.

4.2. Environmental and Population Effects

The spectral indices that did not correlate between years could be affected by environmental conditions such as temperature or precipitation rates or other temporal factors that could make these indices less reliable in making predictions. However, the variables that did not correlate between years include some of the best predictors of yield such as NGRDI SD. These indices could also relate to sugarcane growth development in plant cane that affects its growth in first ratoon or possibly an environmental factor. Planted sugarcane seedlings are becoming established and were only planted three months prior to being imaged while ratoon grows from an established root system. It is possible that the images were identifying crosses with vigorous clones that established quickly that affected ratoon growth. UAV RGB indices were used by Wang et al. [26] to estimate green cover and plant establishment in turfgrass. They found an R2 ranging from 0.86 to 0.96 for estimating green cover of turf grasses. Physical and spectral traits particular to these populations may have affected the results. These spectral indices should be evaluated again in other populations over several years.

4.3. Standard Deviations

There were differences in the spread of the data for some families between replications, but this did not correlate to selection rates. It could be speculated that crosses with larger variances and SD would appear different and be selected differently; however, this was not case in the populations studied in these experiments. Bond [27] found in seedling trials an association between higher trait variances and higher trait means but, in this study, negative correlations were found between Brix SD (−0.27 ns) and CV (−0.45, p = 0.03) and Brix family means. Stalk height also had negative correlations with SD (−0.53, p = 0.001) and CV (−0.71, p < 0.001)
There were correlations between the standard deviations and the means of traits that were greater than the direct correlations of the traits. Height SD had a correlation of 0.71 with stalk diameter stool ratings whereas the correlation between the height and stalk diameter stool ratings means was not significant. So, a higher spread in the height readings indicates a larger stalk diameter.

4.4. Parents

Parental yield was not predictive of progeny performance based on the parental statistics evaluated. For example, seedling Brix average did not correlate with parental SC. This could be caused by several factors. First the parental percentages were from data taken at many different plots over several years. Sugarcane ripens at different times, and it is possible that the parents had high parental late sugar and produced progeny that were not fully ripened at the time of seedling sampling. Another possibility is that some of the parents were only evaluated in second line trials and were relatively new to the program having not been evaluated in as many large plot experiments as parents that have been used longer. Plants that have been evaluated longer, in many plots, have moderated yield in comparison to newer plants that may perform well in one particular small plot. It is also possible that some of the female parents selfed, producing inbred progeny with lower vigor. This hypothesis agrees with the negative correlation between female CY and seedling Brix average

4.5. Family Consistency across Replication

The heritability of stalk number in this population was low. Sousa-Vieira and Milligan [28] reported a much higher heritability for stalk number in sugarcane seedling populations planted in two locations with two plant spacings. At the smaller spacing similar to this study height heritabilities were more similar between studies (0.69 vs. 0.72), but stalk number was much lower in this evaluation (0.53 vs. 0.25). It is possible that there is an unknown environmental factor that affects stalk number between replications. However, this is unlikely as the land selected was among the best available at the location. Brix had very high heritability similar to Silva [29] that ranged from 0.74 to 0.95 at four locations in Brazil. Only two crosses were significantly different by replication. The two crosses that were significantly different did not have similar parents and it could be that the difference by replication is GXE related to these particular crosses. The number of clones selected above the Brix standard did not vary significantly between replication within family; therefore, replications may not be necessary to evaluate Brix in seedling trials evaluated on the same soil.

5. Conclusions

Sugarcane visual selection seems to favor vigorous crosses, selecting those that are tall and green, and these correlated with Brix in this study. Height and Brix were the most repeatable traits between replications and therefore the most accurate to select in small plots. However, regression models using height as a predictive variable for Brix and selection rates yielded poor results. In contrast, remote sensing CIELab indices in plant cane seedlings were well correlated with seedling and first line selections and yield in second line trials. Regression models based on these indices provided a significant improvement in the prediction of both yield traits and selection rates. These results indicate that long term positive selection could be made using remote sensing in seedling family selection.

Author Contributions

Conceptualization, J.T. and R.J.; methodology, J.T., D.V., R.J. and K.R.; formal analysis, J.T.; investigation, K.R.; writing—original draft preparation, J.T.; writing—review and editing, R.J.; All authors have read and agreed to the published version of the manuscript.

Funding

This research received no external funding.

Institutional Review Board Statement

Not Applicable.

Data Availability Statement

Not Applicable.

Acknowledgments

We would like to acknowledge the efforts of Michael Duet, Cory Landry, Clinton Randall, Jennifer Chiasson and the rest of the field crew for the help in planting the experiment and taking measurements.

Conflicts of Interest

The authors declare no conflict of interest.

References

  1. American Sugarcane League. Industry Info. 2022. Available online: https://www.amscl.org/industry-info/ (accessed on 18 July 2022).
  2. Kimbeng, C.A.; Cox, M.C. Early generation selection of sugarcane families and clones in Australia: A review. J. Am. Soc. Sugar Cane Technol. 2003, 23, 21–39. [Google Scholar]
  3. Todd, J.; Johnson, R. Prediction of Ratoon Sugarcane Family Yield and Selection Using Remote Imagery. Agronomy 2021, 11, 1273. [Google Scholar] [CrossRef]
  4. Araus, J.L.; Cairns, J.E. Field high-throughput phenotyping: The new crop breeding frontier. Trends Plant Sci. 2014, 19, 52–61. [Google Scholar] [CrossRef] [PubMed]
  5. Gracia-Romero, A.; Vergara-Díaz, O.; Thierfelder, C.; Cairns, J.E.; Kefauver, S.C.; Araus, J.L. Phenotyping conservation agriculture management effects on ground and aerial remote sensing assessments of maize hybrids performance in Zimbabwe. Remote Sens. 2018, 10, 349. [Google Scholar] [CrossRef] [PubMed]
  6. Fiorani, F.; Schurr, U. Future scenarios for plant phenotyping. Annu. Rev. Plant Biol. 2013, 64, 267–291. [Google Scholar] [CrossRef]
  7. Natarajan, S.; Basnayake, J.; Wei, X.; Lakshmanan, P. High-throughput phenotyping of indirect traits for early-stage selection in sugarcane breeding. Remote Sens. 2019, 11, 2952. [Google Scholar] [CrossRef]
  8. Buchaillot, M.; Gracia-Romero, A.; Zaman-Allah, M.A.; Tarekegne, A.; Prasanna, B.M.; Cairns, J.E.; Araus, J.L.; Kefauver, S.C. Evaluating the performance of different commercial and pre-commercial maize varieties under low nitrogen conditions using affordable phenotyping tools. Proceedings 2018, 2, 366. [Google Scholar]
  9. Kefauver, S.C.; El-Haddad, G.; Vergara-Diaz, O.; Araus, J.L. RGB Picture vegetation indexes for high-throughput phenotyping platforms (HTPPs). In Remote Sensing for Agriculture, Ecosystems, and Hydrology, XVII; International Society for Optics and Photonics: Bellingham, WA, USA, 2015; Volume 9637, p. 96370J. [Google Scholar]
  10. Casadesús, J.; Villegas, D. Conventional digital cameras as a tool for assessing leaf area index and biomass for cereal breeding. J. Integr. Plant Biol. 2014, 56, 7–14. [Google Scholar] [CrossRef]
  11. Vergara-Diaz, O.; Kefauver, S.C.; Elazab, A.; Nieto-Taladriz, M.T.; Araus, J.L. Grain yield losses in yellow-rusted durum wheat estimated using digital and conventional parameters under field conditions. Crop J. 2015, 3, 200–210. [Google Scholar] [CrossRef]
  12. Zhou, B.; Elazab, A.; Bort, J.; Vergara, O.; Serret, M.D.; Araus, J.L. Low-cost assessment of wheat resistance to yellow rust through conventional RGB images. Comput. Electron. Agric. 2015, 116, 20–29. [Google Scholar] [CrossRef]
  13. Gitelson, A.A.; Kaufman, Y.J.; Stark, R.; Rundquist, D. Novel algorithms for remote estimation of vegetation fraction. Remote Sens. Environ. 2002, 80, 76–87. [Google Scholar] [CrossRef]
  14. Hunt, E.R., Jr.; Daughtry, C.S.; Eitel, J.U.; Long, D.S. Remote sensing leaf chlorophyll content using a visible band index. Agron. J. 2011, 10, 1090–1099. [Google Scholar] [CrossRef] [Green Version]
  15. Tew, T.L.; Dufrene, E.O.; Garrison, D.D.; White, W.H.; Grisham, M.P.; Pan, Y.-B.; Richard, E.P., Jr.; Legendre, B.L.; Miller, J.D. Registration of ‘HoCP 00-950’ sugarcane. J. Plant Regist. 2009, 3, 42–50. [Google Scholar] [CrossRef]
  16. Hale, A.L.; Todd, J.R.; Gravois, K.A.; Mollov, D.; Malapi-Wight, M.; Momotaz, A.; Laborde, C.; Goenaga, R.; Kimbeng, C.; Solis, A.; et al. Sugarcane Breeding Programs in the USA. Sugar Tech 2022, 24, 97–111. [Google Scholar] [CrossRef]
  17. Legendre, B.L. The core/press method for predicting the sugar yield from cane for use in cane payment. Sugar J. 1992, 54, 2–7. [Google Scholar]
  18. Pointer, M.R. A comparison of the CIE 1976 colour spaces. Color Res. Appl. 1981, 6, 108–118. [Google Scholar] [CrossRef]
  19. Kylander, O.S.; Kylander, K. Gimp the Official Handbook with Cdrom; Coriolis Value: Scottsdale, AZ, USA, 1999. [Google Scholar]
  20. Schneider, C.A.; Rasband, W.S.; Eliceiri, K.W. NIH Image to ImageJ: 25 years of image analysis. Nat. Methods 2012, 9, 671–675. [Google Scholar] [CrossRef]
  21. Yan, W.; Kang, M.S. GGE Biplot Analysis: A Graphical Tool for Breeders, Geneticists, and Agronomists; CRC press: Boca Raton, FL, USA, 2002. [Google Scholar]
  22. SAS Institute. Base SAS 9.4 Procedures Guide; SAS Institute: Cary, NC, USA, 2015. [Google Scholar]
  23. Saxton, A.M. A Macro for Converting Mean Separation Output to Letter Groupings in Proc Mixed. In Proceedings of the 23rd SAS Users Group International, Nashville, TN, USA, 22–25 March 1998; SAS Institute: Cary, NC, USA, 1998; pp. 1243–1246. [Google Scholar]
  24. Hammer, Ø.; Harper, D.A.; Ryan, P.D. PAST: Paleontological statistics software package for education and data analysis. Palaeontol. Electron. 2001, 4, 9. [Google Scholar]
  25. Sandhu, H.S.; Gilbert, R.A.; McCray, J.M.; Perdomo, R.; Eiland, B.; Powell, G.; Montes, G. Relationships among leaf area index, visual growth rating, and sugarcane yield. J. Am. Soc. Sugar Cane Technol. 2012, 32, 1–14. [Google Scholar]
  26. Wang, T.; Chandra, A.; Jung, J.; Chang, A. UAV remote sensing based estimation of green cover during turfgrass establishment. Comput. Electron. Agric. 2022, 194, 106721. [Google Scholar] [CrossRef]
  27. Bond, R.S. The Mean Yield of Seedlings as a Guide to the Selection Potential of Sugarcane Crosses. Proc. Int. Soc. Sugar Cane Technol. 1977, 16, 101–110. [Google Scholar]
  28. De Sousa-Vieira, O.; Milligan, S.B. Intra-row spacing and family x environment effects on sugarcane family evaluation. Crop Sci. 1999, 39, 358–364. [Google Scholar]
  29. de Almeida Silva, M.; de Andrade Landell, M.G.; de Souza Gonçalves, P.; Martins, A.L. Yield components in sugarcane families at four locations in the state of São Paulo, Brazil. Crop Breed. Appl. Biotechnol. 2002, 2, 97–106. [Google Scholar] [CrossRef]
Figure 1. Corrogram of the first 25 selection, yield, and plant cane spectral traits taken on 2 July 2018. Only significant correlations are shown and the larger the circle the larger the correlation with color scale describing the correlation. Height, Stalk height (cm); stlkstool, stalks per stool; Diarates, Stalk diameter rating per stool; BAVG, Brix average from field brixing of 20 seedling stools; >Brixstd, Those selected greater than or equal to Brix standard in seedling trials; <Brixstd, Those not selected based on field Brixing less than field standard in seedling trials; Bmin, Minimum Brix of a family in seedling trials; Bmax, Maximum Brix of a family in seedling trials; #Rate, Seedling stalk number rating: 1 best and 9 worst; DIARate, Seedling diameter Rating: 1 best and 9 worst; HTRate, Seedling height Rating: 1 best and 9 worst; ERCTRate, Seedling erectness rating: 1 best and 9 worst; DENSRate, Seedling density rating: 1 best and 9 worst; Overall, Seedling overall Rating: 1 best and 9 worst; Springr, Seedling spring ratings; FSY, sugar per acre yield of female parent; FSC, sugar per ton yield of female parent; FCY, tons cane per acre yield of female parent; MSY, sugar per acre yield of male parent; MSC, sugar per ton yield of male parent; MCY, tons cane per acre yield of male parent; cbSC, Combined average of sugar per ton yield of both parents; Seed%surv, Seedling survival counts; 1st_per row, First line selections per row; 1st_total, Total first lines selected; 1stadv, Ratio of first lines selected from seedling stage; 2ndadv, Ratio of second lines selected from first line stage; Intensity, CIELab color component; Hue, hue angles in the a*b* plane of the CIELab color space and vary from 0 to 360° where 0° is red, 60° is yellow, 120° is green, and 180° is cyan; Sat, Saturation: defines the color purity from white to the corresponding primary color; Light, Lightness: represents the range from black to white with pure black having a value of zero and pure white having a value of ten; a*, The range from green to red; b*, The range from blue to yellow; u*, The scale from blue to red; v*, The scale from blue to green; GA, included the green area (GA), which is the proportion of green pixels in an image; GGA, The greener area (GGA) excludes yellow pixels that correlate with senescent leaves; CSI, the Crop Senescence Index (CSI) = (GA − GGA)/GA × 100; NGRDIM, Mean of the image the Normalized Green–Red Difference Index (Rg − Rr)/(Rg + Rr); NGRDISD, Standard Deviation of NGRDI; TGIM, Mean of the image Triangular Greenness Index −0.5[(λr − λb)(Rr − Rg) − (λr − λg)(Rr − Rb)]; TGISD, Standard Deviation of the TGI; Slkwt, Stalk weight of second line trials; Stkct, Stalk count of second line plots; Fiber, % fiber calculated from 10 stalk sample in second lines; Brix2nd, Second Line Brix; Sucrose, % Juice sucrose content; CY, Cane yield Mg ha−1; SY, Sugar yield Mg ha−1; SC, g kg−1 Theoretical recoverable sugar.
Agriculture 12 01313 g001
Figure 2. Corrogram of first ratoon spectral traits taken on 28 June 2019 with breeding and yield traits. Only significant correlations are shown and the larger the circle the larger the correlation with color scale describing the correlation. Height, Stalk height (cm); stlkstool, stalks per stool; Diarates, Stalk diameter rating per stool; BAVG, Brix average from field brixing of 20 seedling stools; >Brixstd, Those selected greater than or equal to Brix standard in seedling trials; <Brixstd, Those not selected based on field Brixing less than field standard in seedling trials; Bmin, Minimum Brix of a family in seedling trials; Bmax, Maximum Brix of a family in seedling trials; #Rate, Seedling stalk number rating: 1 best and 9 worst; DIARate, Seedling diameter Rating: 1 best and 9 worst; HTRate, Seedling height Rating: 1 best and 9 worst; ERCTRate, Seedling erectness rating: 1 best and 9 worst; DENSRate, Seedling density rating: 1 best and 9 worst; Overall, Seedling overall Rating: 1 best and 9 worst; Springr, Seedling spring ratings; FSY, sugar per acre yield of female parent; FSC, sugar per ton yield of female parent; FCY, tons cane per acre yield of female parent; MSY, sugar per acre yield of male parent; MSC, sugar per ton yield of male parent; MCY, tons cane per acre yield of male parent; cbSC, Combined average of sugar per ton yield of both parents; Seed%surv, Seedling survival counts; 1st_per row, First line selections per row; 1st_total, Total first lines selected; 1stadv, Ratio of first lines selected from seedling stage; 2ndadv, Ratio of second lines selected from first line stage; Intensity, CIELab color component; Hue, hue angles in the a*b* plane of the CIELab color space and vary from 0 to 360° where 0° is red, 60° is yellow, 120° is green, and 180° is cyan; Sat, Saturation: defines the color purity from white to the corresponding primary color; Light, Lightness: represents the range from black to white with pure black having a value of zero and pure white having a value of ten; a*, The range from green to red; b*, The range from blue to yellow; u*, The scale from blue to red; v*, The scale from blue to green; GA, included the green area (GA), which is the proportion of green pixels in an image; GGA, The greener area (GGA) excludes yellow pixels that correlate with senescent leaves; CSI, the Crop Senescence Index (CSI) = (GA − GGA)/GA × 100; NGRDIM, Mean of the image the Normalized Green–Red Difference Index (Rg − Rr)/(Rg + Rr); NGRDISD, Standard Deviation of NGRDI; TGIM, Mean of the image Triangular Greenness Index −0.5[(λr − λb)(Rr − Rg) − (λr − λg)(Rr − Rb)]; TGISD, Standard Deviation of the TGI; Slkwt, Stalk weight of second line trials; Stkct, Stalk count of second line plots; Fiber, % fiber calculated from 10 stalk sample in second lines; Brix2nd, Second Line Brix; Sucrose, % Juice sucrose content; CY, Cane yield Mg ha−1; SY, Sugar yield Mg ha−1; SC, g kg−1 Theoretical recoverable sugar.
Agriculture 12 01313 g002
Figure 3. Corrogram of the remaining 25 selection, yield, and plant cane spectral traits taken on 2 July 2018. Only significant correlations are shown and the larger the circle the larger the correlation with color scale describing the correlation. Height, Stalk height (cm); stlkstool, stalks per stool; Diarates, Stalk diameter rating per stool; BAVG, Brix average from field brixing of 20 seedling stools; >Brixstd, Those selected greater than or equal to Brix standard in seedling trials; <Brixstd, Those not selected based on field Brixing less than field standard in seedling trials; Bmin, Minimum Brix of a family in seedling trials; Bmax, Maximum Brix of a family in seedling trials; #Rate, Seedling stalk number rating: 1 best and 9 worst; DIARate, Seedling diameter Rating: 1 best and 9 worst; HTRate, Seedling height Rating: 1 best and 9 worst; ERCTRate, Seedling erectness rating: 1 best and 9 worst; DENSRate, Seedling density rating: 1 best and 9 worst; Overall, Seedling overall Rating: 1 best and 9 worst; Springr, Seedling spring ratings; FSY, sugar per acre yield of female parent; FSC, sugar per ton yield of female parent; FCY, tons cane per acre yield of female parent; MSY, sugar per acre yield of male parent; MSC, sugar per ton yield of male parent; MCY, tons cane per acre yield of male parent; cbSC, Combined average of sugar per ton yield of both parents; Seed%surv, Seedling survival counts; 1st_per row, First line selections per row; 1st_total, Total first lines selected; 1stadv, Ratio of first lines selected from seedling stage; 2ndadv, Ratio of second lines selected from first line stage; Intensity, CIELab color component; Hue, hue angles in the a*b* plane of the CIELab color space and vary from 0 to 360° where 0° is red, 60° is yellow, 120° is green, and 180° is cyan; Sat, Saturation: defines the color purity from white to the corresponding primary color; Light, Lightness: represents the range from black to white with pure black having a value of zero and pure white having a value of ten; a*, The range from green to red; b*, The range from blue to yellow; u*, The scale from blue to red; v*, The scale from blue to green; GA, included the green area (GA), which is the proportion of green pixels in an image; GGA, The greener area (GGA) excludes yellow pixels that correlate with senescent leaves; CSI, the Crop Senescence Index (CSI) = (GA − GGA)/GA × 100; NGRDIM, Mean of the image the Normalized Green–Red Difference Index (Rg − Rr)/(Rg + Rr); NGRDISD, Standard Deviation of NGRDI; TGIM, Mean of the image Triangular Greenness Index −0.5[(λr − λb)(Rr − Rg) − (λr − λg)(Rr − Rb)]; TGISD, Standard Deviation of the TGI; Slkwt, Stalk weight of second line trials; Stkct, Stalk count of second line plots; Fiber, % fiber calculated from 10 stalk sample in second lines; Brix2nd, Second Line Brix; Sucrose, % Juice sucrose content; CY, Cane yield Mg ha−1; SY, Sugar yield Mg ha−1; SC, g kg−1 Theoretical recoverable sugar.
Agriculture 12 01313 g003
Table 1. Cross number, parents, number of seedlings and percent selection in first line, second line and second line first ratoon.
Years Selected/Planted
Replication2018201920202021
ParentsNumber PlantedPercent Selected
Cross numberFemaleMaleReplicationTotal1st 2nd 2nd pc Selection
12
CP17-0092Ho12-630L01-2992742685428.060.750.5
CP17-0515HoCP16-685Ho12-6302562505062.4400
CP17-0516Ho11-532Ho12-6302702525223.810.450
CP17-0523HoCP09-804L12-2012602645246.050.860.54
CP16-0561LCP85-384Ho11-5322662705367.640.870.09
CP17-0691HoCP16-685L12-2012682645322.4500
CP17-0722HoCP16-685HoL15-9932382665043.2800
CP17-0798Ho15-964HoCP14-88526226853010.910.250.12
CP17-1048Ho13-739HoL15-50126626653212.761.651.24
CP16-1196Ho13-708Ho11-5732562705269.910.940.55
CP16-1739Ho13-708Ho07-6132622685309.320.470
CP16-1847HoCP09-804HoCP14-88526026652614.370.810.27
Percent selected for first line trials from seedlings. Percent selected of seedlings in second line trials. Percent selected of seedlings in second line plant cane for evaluation in first ratoon.
Table 2. List of traits and descriptions.
NameDescription
CrossCross number
Seedling stool Measurements and Evaluations
HeightStalk height (cm)
stlkstoolstalks per stool
DiaratesStalk diameter rating per stool
BAVGBrix average from field brixing of 20 seedling stools
>BrixstdThose selected greater than or equal to Brix standard in seedling trials
<BrixstdThose not selected based on field Brixing less than field standard in seedling trials
BminMinimum Brix of a family in seedling trials
BmaxMaximum Brix of a family in seedling trials
Family Ratings
#RateSeedling stalk number rating: 1 best and 9 worst
DIARateSeedling diameter Rating: 1 best and 9 worst
HTRateSeedling height Rating: 1 best and 9 worst
ERCTRateSeedling erectness rating: 1 best and 9 worst
DENSRateSeedling density rating: 1 best and 9 worst
OverallSeedling overall Rating: 1 best and 9 worst
SpringrSeedling spring ratings
Parental Yield Averages
FSYsugar per acre yield of female parent
FSCsugar per ton yield of female parent
FCYtons cane per acre yield of female parent
MSYsugar per acre yield of male parent
MSCsugar per ton yield of male parent
MCYtons cane per acre yield of male parent
cbSCCombined average of sugar per ton yield of both parents
Planting and Advancement Rates
Seed%survSeedling survival counts
1st_per rowFirst line selections per row
1st_totalTotal first lines selected
1stadvRatio of first lines selected from seedling stage
2ndadvRatio of second lines selected from first line stage
Spectral Indices
IntensityIntensity, CIELab color component
Huehue angles in the a* b* plane of the CIELab color space and vary from 0 to 360° where 0° is red, 60° is yellow, 120° is green, and 180° is cyan
SatSaturation: defines the color purity from white to the corresponding primary color (Sancho-Adamson et al. 2019)
LightLightness: represents the range from black to white with pure black having a value of zero and pure white having a value of ten
a*The range from green to red
b*The range from blue to yellow
u*The scale from blue to red
v*The scale from blue to green
GAincluded the green area (GA), which is the proportion of green pixels in an image
GGAThe greener area (GGA) excludes yellow pixels that correlate with senescent leaves
CSIthe Crop Senescence Index (CSI) = (GA − GGA)/GA × 100
NGRDIMMean of the image the Normalized Green–Red Difference Index (Rg − Rr)/(Rg + Rr)
NGRDISDStandard Deviation of NGRDI
TGIMMean of the image Triangular Greenness Index −0.5 [(λr − λb) (Rr − Rg) − (λr − λg) (Rr − Rb)]
TGISDStandard Deviation of the TGI
Second Line Yield Measuements
SlkwtStalk weight of second line trials
StkctStalk count of second line plots
Fiber% fiber calculated from 10 stalk sample in second lines
Brix2ndSecond Line Brix
Sucrose% Juice sucrose content
CYCane yield Mg ha−1
SYSugar yield Mg ha−1
SCg kg−1 Theoretical recoverable sugar
Table 3. Correlation of spectral traits between 2 July 2018 and 28 June 2019.
TraitCorrelationSig
Intensity0.310.32
Hue−0.640.02
Saturation0.86<0.01
Lightness0.450.14
a*0.96<0.01
b*0.87<0.01
u*0.93<0.01
v*0.87<0.01
GA0.95<0.01
GGA0.96<0.01
CSI0.500.10
NGRDIM0.92<0.01
NGRDISD0.450.15
TGIM0.94<0.01
TGISD0.690.01
Table 4. Means and significance letters (p = 0.05) of Brix, stalks per stool, Diameter ratings, and Height (cm).
CrossRepBrixLetter Group Stalks Per StoolLetter GroupDiameter Ratings Letter GroupHeight cmLetter Group
92118.87FGH9.16CDEF6.5A177.7DEF
92218.94FGH10.48BC5.1H198.07A
515116.98GHIJKL9.2CDE6C158.8I
515217.65KL7.5FGH5.3EFGH166.12GHI
516117.43JKL7.7DEFGH6.2BC181.97BCDE
516217.24IJK8.4DEFGH5.2GH191.06AB
523118.31DEFG8.3DEFGH6.3ABC175.26DEFG
523219.35GHIJ9.18CDEF5.5DE181.71BCDE
561119.56HI8.68DEFG6.5A183.29BCDE
561218.34CDEF16.04A5.3FGH182.58BCDE
691117.3L8.22DEFGH6.3ABC158.5I
691216.24IJKL7.84DEFGH5.4DEFG180.64CDE
722116.64IJK7GH6.2BC147.62J
722217.56KL9.3CD5.6D177.85DEF
798120.79A7.56EFGH6.2BC183.9BCD
798221.18AB7.82DEFGH5.5DEF189.03ABC
1048120.47CDEF6.92H6.3ABC174.14EFG
1048219.52ABC9.2CDE5.3EFGH182.98BCDE
1196118.66EFGH9.06CDEF6.4AB167.64GHI
1196219.07FGH11.74B5.1H168.5FGH
1739120.79FGH7.3GH6.3ABC161.44HI
1739218.99AB11.39B5.1H178.36DE
1874120.11BCDE8.3DEFGH6.4AB182.58BCDE
1874220.03BCD10.56BC5.2GH181.2CDE
letter grouping based on least significant difference p = 0.05. Ratings depicted as number with 1 best and 9 worst.
Table 5. Mean significant differences and F values for sugarcane seedling first ratoon height, stool diameter rating stalks per stool, Brix average, first line advancement rates and Overall family rating.
FamilyHeight cmLetterDiameter Ratings LetterStalks Per StoolLetter GroupBrix AverageLetter1stadvLetterOverall Rating Letter
92187.88A5.8AB9.82BC18.91C0.08CDE6AB
515162.46D5.7B8.35DEF17.06D0.02G7.5A
516186.51A5.7B8.05F17.34D0.04EFG6.5AB
523178.49B5.9A8.74CDEF18.9C0.06DEFG6.5AB
561182.93AB5.9AB12.36A18.95C0.08CDEF6.5AB
691169.57C5.9AB8.03F16.69D0.02G6.5AB
722162.64D5.9A8.15EF17.24D0.03FG7AB
798186.46A5.8AB7.69F20.98A0.11ABC5.5B
1048178.56B5.8AB8.06F20B0.13AB5.5B
1196168.07CD5.7B10.4B18.87C0.1BCD6AB
1739169.9C5.7B9.33BCDE19.89B0.09BCD6.5AB
1847181.89AB5.8AB9.43BCD20.07B0.14A5.5B
HPr > FHPr > FHPr > FHPr > FHPr > FHPr > F
0.72<0.00010.000.190.25<0.00010.89<0.0010.870.0010.040.45
Letters indicate significance at 0.05 based on least significant difference; H is broad sense heritability; Ratings depicted as number with 1 best and 9 worst.
Table 6. Best multiple regression models for the prediction of yield traits by RGB spectral indices.
2 July 2018
Spectral TraitsR2Coeff VarRoot MSEF ValuePr > F
Heightrep, NGRDISD, Hue, Saturation0.813.155.5520.47<0.0001
Stalks per stoolRep, lightness0.4117.601.597.22<0.01
Brix Averagerep, NGRDIM, TGISD0.654.790.9012.15<0.0001
# greater than Brix standardrep, NGRDIM, TGISD, b, CSI0.7525.193.4610.78<0.0001
# less than Brix standardrep, NGRDISD, TGISD, Intensity0.4483.613.733.710.02
Brix Minimumrep, NGRDISD, TGISD, Intensity0.418.631.353.360.03
Brix Maximumrep, NGRDIM, TGISD0.416.271.354.650.01
1stadvRep, Hue, NGRDIM, TGIStD0.8325.520.0222.52<0.0001
2ndadvRep, GGA0.4682.270.068.840.002
28 June 2019
Heightrep, GGA0.604.367.6915.80<0.0001
stalks per stoolrep0.2319.651.786.430.02
Brix Averagerep, intensity GGA0.485.791.082.210.004
# greater than Brix standardrep, lightness, GGA0.5631.834.388.340.0009
# less than Brix standardrep, Intensity, Saturation0.3389.283.983.220.04
Brix Minimumrep, GGA, NGRDISD0.259.541.502.190.12
Brix Maximumrep, Saturation, CSI0.406.341.364.420.015
1stadvrep Lightness, GGA0.4843.140.036.050.004
2ndadvRep, GGA0.4384.230.067.950.003
# represents number.
Table 7. Best multiple regression models for the prediction of selection rates and Brix by the field measurements height, diameter, stalk number and estimated weight.
Measured TraitsR2Coeff VarRoot MSEF ValuePr > F
s23advRep, height0.1354.360.041.520.24
s34advRep, height0.2199.390.072.750.09
Brix AverageRep, height0.177.141.342.190.14
Publisher’s Note: MDPI stays neutral with regard to jurisdictional claims in published maps and institutional affiliations.

