Article

Establishment of Non-Destructive Methods for the Detection of Amylose and Fat Content in Single Rice Kernels Using Near-Infrared Spectroscopy

1
Anhui Key Laboratory of Environmental Toxicology and Pollution Control Technology, Hefei Institutes of Physical Science, Chinese Academy of Sciences, Hefei 230031, China
2
Science Island Branch, Graduate School of USTC, Hefei 230026, China
3
Hainan Branch of the CAS Innovative Academy for Seed Design, Sanya 572019, China
*
Author to whom correspondence should be addressed.
Agriculture 2022, 12(8), 1258; https://doi.org/10.3390/agriculture12081258
Submission received: 10 July 2022 / Revised: 5 August 2022 / Accepted: 12 August 2022 / Published: 19 August 2022

Abstract

:
For the efficient selection of high-quality rice varieties, the near-infrared spectroscopy (NIRS) technique has been widely applied to detect constituents in single rice kernels. Compared with other constituents, amylose content (AC) and fat content (FC) are the key parameters that can affect the quality of rice. Based on two modified AC and FC trace detection methods, two NIRS methods to detect AC and FC in single rice kernels were developed. Using the proposed methods, the AC and FC in two groups of rice kernel datasets were measured. The datasets were collected on two spectrometers with different sample movement states (static and dynamic) and measurement modes (diffuse reflectance (NIRr) and diffuse transmission (NIRt)). By optimizing the pre-treatment method and spectral range, the determination coefficients of cross-validation (R2cv) and prediction (R2p) of the NIRS models under different measurement conditions were all above 0.6. The results indicated that the proposed methods were applicable to the rapid, non-destructive detection and sorting of individual rice seeds with different AC and FC, and it was shown that these methods can meet the requirements of the rough screening of rice seed varieties.

Graphical Abstract

1. Introduction

Rice is the main food crop worldwide. With the continuous increase in rice yield, the demand for breeding high-quality and nutritious rice varieties has grown extensively [1,2]. Amylose content (AC), protein content (PC), and fat content (FC) are important quality indicators in rice, and they have significant impacts on the eating quality, storage quality, and processing quality of rice [2,3]. According to the literature, high-quality rice usually possesses low PC and high FC [4,5]. In addition, due to the close correlation with rice quality, the AC of rice varieties favored by consumers in different regions worldwide varies greatly [2,6]. Therefore, the rapid detection and selection of rice seeds with specific constituents will help seed breeders select eligible varieties in the early generations of rice breeding, significantly shortening the breeding cycle and improving the breeding efficiency. Compared with traditional chemical detection methods, the near-infrared spectroscopy (NIRS) technique has the advantage of being a rapid and non-destructive method. In addition, to obtain and breed new varieties with specific traits, the NIRS based rice quality analysis should be conducted at the level of individual seeds. The analysis of the quality traits of individual seeds can help breeders understand the crop’s genetic characteristics and screen and isolate seeds with desired qualities [7]. Based on the single-kernel NIRS analysis technique, the intelligent, highly efficient detection and selection of rice seeds can be accomplished by integrating multiple quality trait analysis models, high-throughput spectral acquisition equipment, and seed-sorting accessories.
At present, the accurate obtainment of the reference value is the main limitation of single-kernel NIRS analysis. The mass of a single rice kernel is often too small to meet the minimum sample mass requirement of the reference method. Although the PC in a single rice kernel can be determined using the combustion method (each sample requires 0.004 g) [8], the minimum sample mass required when using the iodine colorimetric method (AC determination, 0.1 g) [9] and the Soxhlet extraction method (FC determination, 0.2 g) [10] still far exceeds the mass of an individual rice seed. Our previous study achieved the NIRS prediction of the PC of a single rice kernel based on the combustion method [11]. However, few studies have focused on the determination of the AC and FC of a single rice kernel based on the NIRS analysis method. More optimization strategies are required to make the NIRS analysis of these two parameters possible. In the two proposed NIRS-based methods for predicting AC and FC in a single rice kernel, two modified wet-chemical methods were applied to obtain accurate reference values.
For the accurate detection of AC in a single rice kernel, a half-grain method was introduced by Yang et al. [12]. In this method, each rice kernel was cut into two halves, and then the AC of one half without embryos was determined using the iodine colorimetric method, while the other half with embryos could be used for breeding. Wu et al. [13] used this method as the reference to achieve the NIRS prediction of AC in a single rice kernel and a single brown rice kernel. In addition, Dai et al. [14] introduced a modified iodine colorimetric method. This method reduced the sample mass required for detection to approximately 0.01 g, which could enable AC detection in a single rice kernel. Compared with the half-grain method, the mass of each sample used in the modified iodine colorimetric method is larger, which indicates that the mass deviation between samples has less potential to interfere with the results. Therefore, in the current study, the modified iodine colorimetric method was used as a reference in the NIRS analysis of AC in single rice kernels.
Few reports can be found regarding the detection of FC in a single rice kernel. Janni et al. [15] used nuclear magnetic resonance (NMR) to determine FC in single corn kernels for NIRS calibration. However, as corn kernels are larger than rice kernels and the range of FC in corn kernels varies more easily than in rice kernels, the feasibility of using NMR to detect FC in single rice kernels needs to be verified further. Armstrong et al. [16] achieved NIRS predictions of constituents in single corn kernels and single soybean kernels by using bulk reference values and mean spectra. A similar strategy was used in our study when analyzing the FC in single rice kernels.
The ultimate goal of single-kernel NIRS analysis is automatic high-throughput seed sorting, while seed sorting requires the samples to be measured and analyzed at a certain speed. Therefore, in this study, the proposed method was verified on two instruments with different sample movement states (static (ST) and dynamic (DY)). The ST and DY conditions simulated the movement state of samples in manual laboratory detection and automatic seed sorting. In addition, the samples were also measured using these instruments with different measurement modes (diffuse reflectance (NIRr) and diffuse transmission (NIRt)). The purpose of this study was: (i) to verify the effectiveness of the proposed methods by comparing the prediction results under various conditions and (ii) to explore the optimal measurement conditions for the NIRS analysis of AC and FC in single rice kernels.

2. Materials and Methods

2.1. Sample Collection and Preparation

One hundred and fifty-two rice varieties with a gradient distribution of AC were screened from the rice mutant library constructed in our laboratory to constitute the rice AC dataset. The mutant library was composed of the mutant offspring of rice varieties ‘9311’ and ‘Wuyunjing 7’, which were irradiated with low-energy heavy ions and cultivated for multiple generations. For each rice variety, one full and intact seed was used for analysis. Thirty-nine rice varieties with a gradient distribution of FC were selected from the rice fat germplasm repository [3] that was shared by Professor Yuqing He from Huazhong Agricultural University. These varieties were collected after one generation of cultivation to constitute the FC dataset. For each rice variety, 15 full and intact seeds were selected for analysis.

2.2. Near-Infrared Spectroscopy

Before spectral acquisition, the rice samples were placed in an incubator at an ambient temperature of 25 °C and relative humidity (r.h.) of 50% for 24 h. NIRr and NIRt spectra were obtained using a MPA Fourier transform near-infrared spectrometer (Bruker, Ettlingen, Germany) under ST conditions, while NIRr spectra were obtained using a Luminar 3076 SeedMeister AOTF-NIR Analyzer (Brimrose, Baltimore, MD, USA) under DY conditions. The schematic diagrams of the three types of spectral acquisitions are shown in Figure 1.

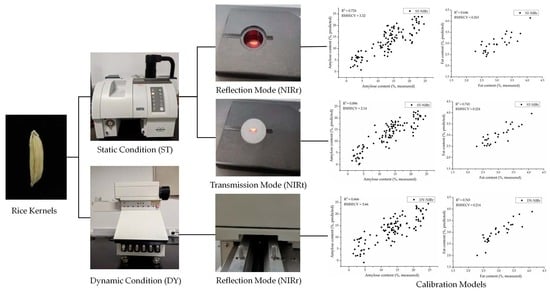
2.2.1. Spectral Acquisition of Single Rice Kernels under Static Conditions

The MPA spectrometer was used for the spectral acquisition of single rice kernels under ST conditions. It included two measurement modes: diffuse reflection and diffuse transmission. For the measurement of the spectrum of each rice kernel under ST and NIRt conditions (ST-NIRt spectrum), first, a circular aluminum sheet with a 2 mm-diameter hole in the middle was fixed in the detection window; thereafter, the rice kernel was placed horizontally in the middle of the aluminum sheet, as shown in Figure 1a; finally, the ST-NIRt spectrum was obtained by scanning both sides of the kernel in the diffuse transmission mode once and taking the average values. The ST-NIRt spectra were acquired in the range of 5793–12,489 cm−1 (800.7–1726.2 nm) with a resolution of 16 cm−1 and 64 repeat scans. After each rice kernel was placed on the detection window, the spectrum of the rice kernel under ST and NIRr conditions (ST-NIRr spectrum) was obtained by scanning the front and back of the rice kernel in the diffuse reflection mode once and taking the average values, as shown in Figure 1b. The ST-NIRr spectra were acquired in the range of 4000–12,000 cm−1 (833.3–2500 nm) with a resolution of 16 cm−1 and 32 repeat scans.

2.2.2. Spectral Acquisition of Single Rice Kernels under Dynamic Conditions

The AOTF spectrometer was used for the spectral acquisition of single rice kernels under DY conditions. It was equipped with a grain counter, a conveyor belt, six sorting channels, and the SNAP! 2.03 spectral acquisition software (Brimrose, Baltimore, MD, USA). The rice kernels were sequentially arranged on the conveyor belt using the grain counter and passed through the detection window with the conveyor belt at a speed of 0.308 cm/s, as shown in Figure 1c,d. The light source was emitted from the top down to the detection window, and the reflected signals of the sample were received by the detector above. The spectral range was from 1100 to 2300 nm with a resolution of 1 nm, and the gate parameter was set to retain the spectrum with a transmission ratio > 0.43 at 1800 nm. As the original spectra of each sample were collected continuously, the function of the gate parameter was to filter out the unqualified background spectra from these original spectra. Depending on the length of the rice kernel and the movement speed of the conveyor belt, the number of consecutive original spectra collected for each rice kernel varied between 8 and 9. The faster the speed of the conveyor belt, the less raw spectral data would be collected. The first two and the last two original spectra for each sample were removed, and the remaining original spectra were averaged into one. The front side and back side of each rice kernel were collected twice, and then these four spectra were averaged into one and recorded as the DY-NIRr spectrum. The format of the DY-NIRr spectra was converted from transmittance to absorbance.

2.3. Trace Detection of Single Rice Kernels

2.3.1. Trace Detection of AC in Rice

The amylose contents in single rice kernels were detected with the modified iodine colorimetric method developed by Dai et al. [14], with some steps being slightly adjusted. The specific steps were as follows: (1) The AC of the standard samples was determined, and the standard curve was fitted. The determination procedure for the standard samples was the same as that for the test samples. The standard samples consisted of potato flours with AC values of 1.5%, 10.4%, 16.2%, and 26.5%. (2) Each rice kernel was manually dehusked, ground in a mortar, and passed through a 100-mesh sieve (0.150 mm sieve) to obtain brown rice flour. The flours were then dried at 70 °C for 12 h. (3) Approximately 0.01 g of powder was weighed for each sample on a balance with an accuracy of 0.01 mg (Mettler Toledo, Greifensee, Switzerland) and placed in a 2 mL centrifuge tube. After 100 μL of anhydrous ethanol and 900 μL of 1 mol/L NaOH were added to each tube, the tubes were heated in a water bath at 100 °C for 20 min. Then, 40 mL of water was added to each tube after the tubes were cooled. (4) Subsequently, 40 μL of liquid from each centrifuge tube was transferred into a new 5-mL centrifuge tube, and then 860 μL of water, 40 μL of 1 mol/L HAc, 60 μL of 0.2% I2-KI solution, and 3 mL of water were added into the tube. After standing for 10 min, the absorbance of the mixture in each tube was measured using an ultraviolet–visible spectrophotometer (PerkinElmer, Singapore) at 620 nm. The absorbances of each sample were measured twice and averaged. (5) The AC of each test sample (Wac) was calculated according to the standard curve, which was fitted based on the AC and the absorbance of the standard samples:
W ac = 10 C n m n × 100 %
where mn (mg) is the mass of the test sample and Cn is the AC of the test sample calculated according to the standard curve.

2.3.2. Trace Detection of FC in Rice

A modified Soxhlet extraction method was used for the trace detection of rice FC. Fifteen rice kernels were dehusked and ground to obtain rice flour and then dried at 70 °C for 12 h. All the rice flour for each sample was weighed, and its mass was recorded as m0. Each rice flour sample was transferred into a food-grade filter bag and sealed with a PFS-200 impulse sealer (Kayshark, Wenzhou, China), and then the filter bag was transferred to a handmade paper tube and sealed. The paper tube was put into the Soxhlet extractor for fat extraction [10]. After the extraction, each rice flour sample was dried, removed from the paper tube and the filter bag, and weighed. The mass of the rice flour after extraction was recorded as m1. The fat content WFC was calculated using the following equation:
W FC = m 0 m 1 m 0 × 100 %

2.4. Multivariate Data Analysis

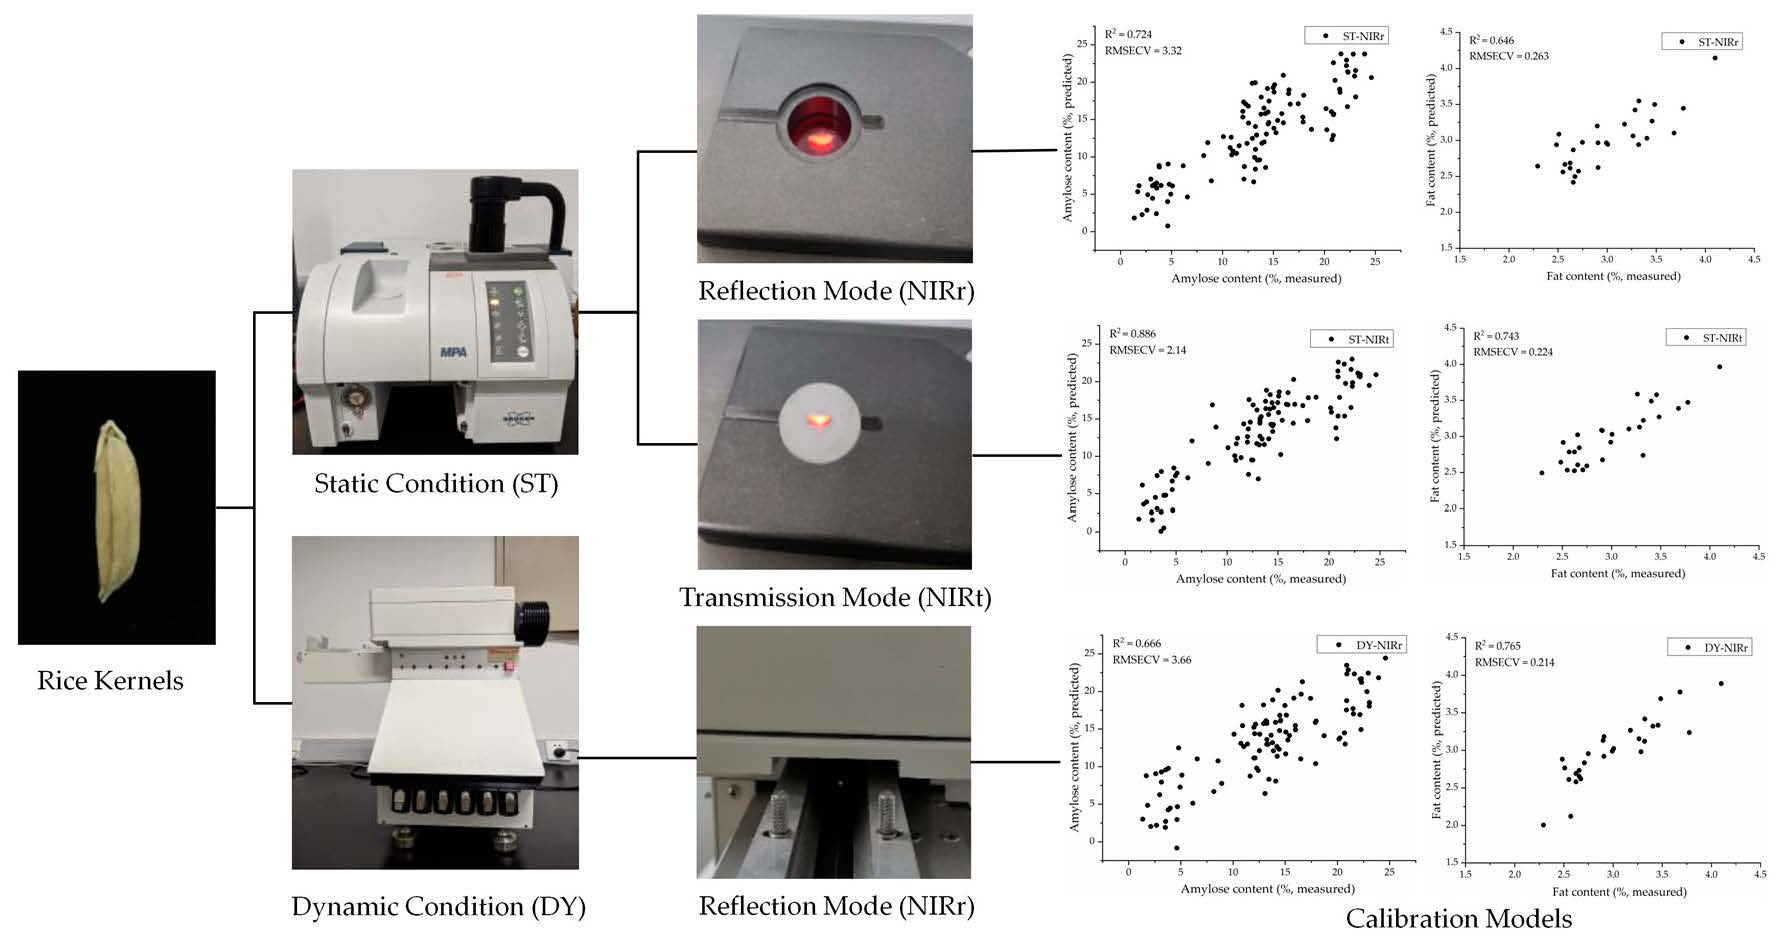
2.4.1. NIRS-Based Method for Detecting AC and FC in Single Rice Kernels

For the detection of AC in single rice kernels, first, one rice kernel was selected for each sample for spectral acquisition; thereafter, the AC reference value of each rice kernel was detected using the modified iodine colorimetric method; finally, the regression model between the spectra and the AC reference values was established using multivariate calibration methods. For the detection of FC in single rice kernels, first, fifteen rice kernels were selected for each sample (with a mass of approximately 0.3 g), and the mean spectrum was calculated based on the spectra of these rice kernels; thereafter, the fifteen spectra were averaged into one; then, the FC reference values were detected using the modified Soxhlet extraction method; and finally, the regression model between the mean spectra and FC reference values was established. The step flow chart of the two methods is shown in Figure 2.

2.4.2. Multivariate Calibration

Based on the Kennard–Stone algorithm [17], 70% of each dataset (i.e., 107 in the AC dataset and 28 in the FC dataset) was classified as the calibration set, and the remaining 30% of samples (i.e., 45 in the AC dataset and 11 in the FC dataset) were used as the validation set. The Kennard–Stone algorithm was performed using MATLAB software version 2015 (The Mathworks, Natick, MA, USA).
The optimization function of the OPUS 7.0 software (Bruker, Ettlingen, Germany) was used for the optimization and prediction of the models. This function was based on the principle of the siPLS algorithm [18], in which the pre-processed spectra were divided into ten segments of equal size, and one to six segments were randomly combined for modeling. The spectral pre-treatment methods used included first-order derivatives (1 der, with 17-point smoothing by default), multivariate scattering correction (MSC), standard normal variational transform (SNV), 1der + MSC, 1der + SNV, and the elimination of constant offset (ECO). In particular, the 1 der combined with the SNV method was commonly used to eliminate particle shape interference and baseline drift. The MSC method was used to correct the effects of spectral scattering, and the ECO method was also commonly used to eliminate the baseline drift. In general, the spectral data pre-processing methods need to be compared or combined with each other, and the partial least square (PLS) model was constructed under the combined conditions that consist of each pre-treatment method and spectral range, and the predictive performance of the models was tested using the validation set. The model with the lowest root mean square error of cross-validation (RMSECV) and the highest coefficient of determination of cross-validation (R2cv) was used as the optimum. The root mean square error of prediction and the correlation coefficient were expressed as RMSEP and R2p. Statistical analysis and graphing were implemented with OriginPro software (OriginLab Corp., Northampton, MA, USA).

3. Results and Discussion

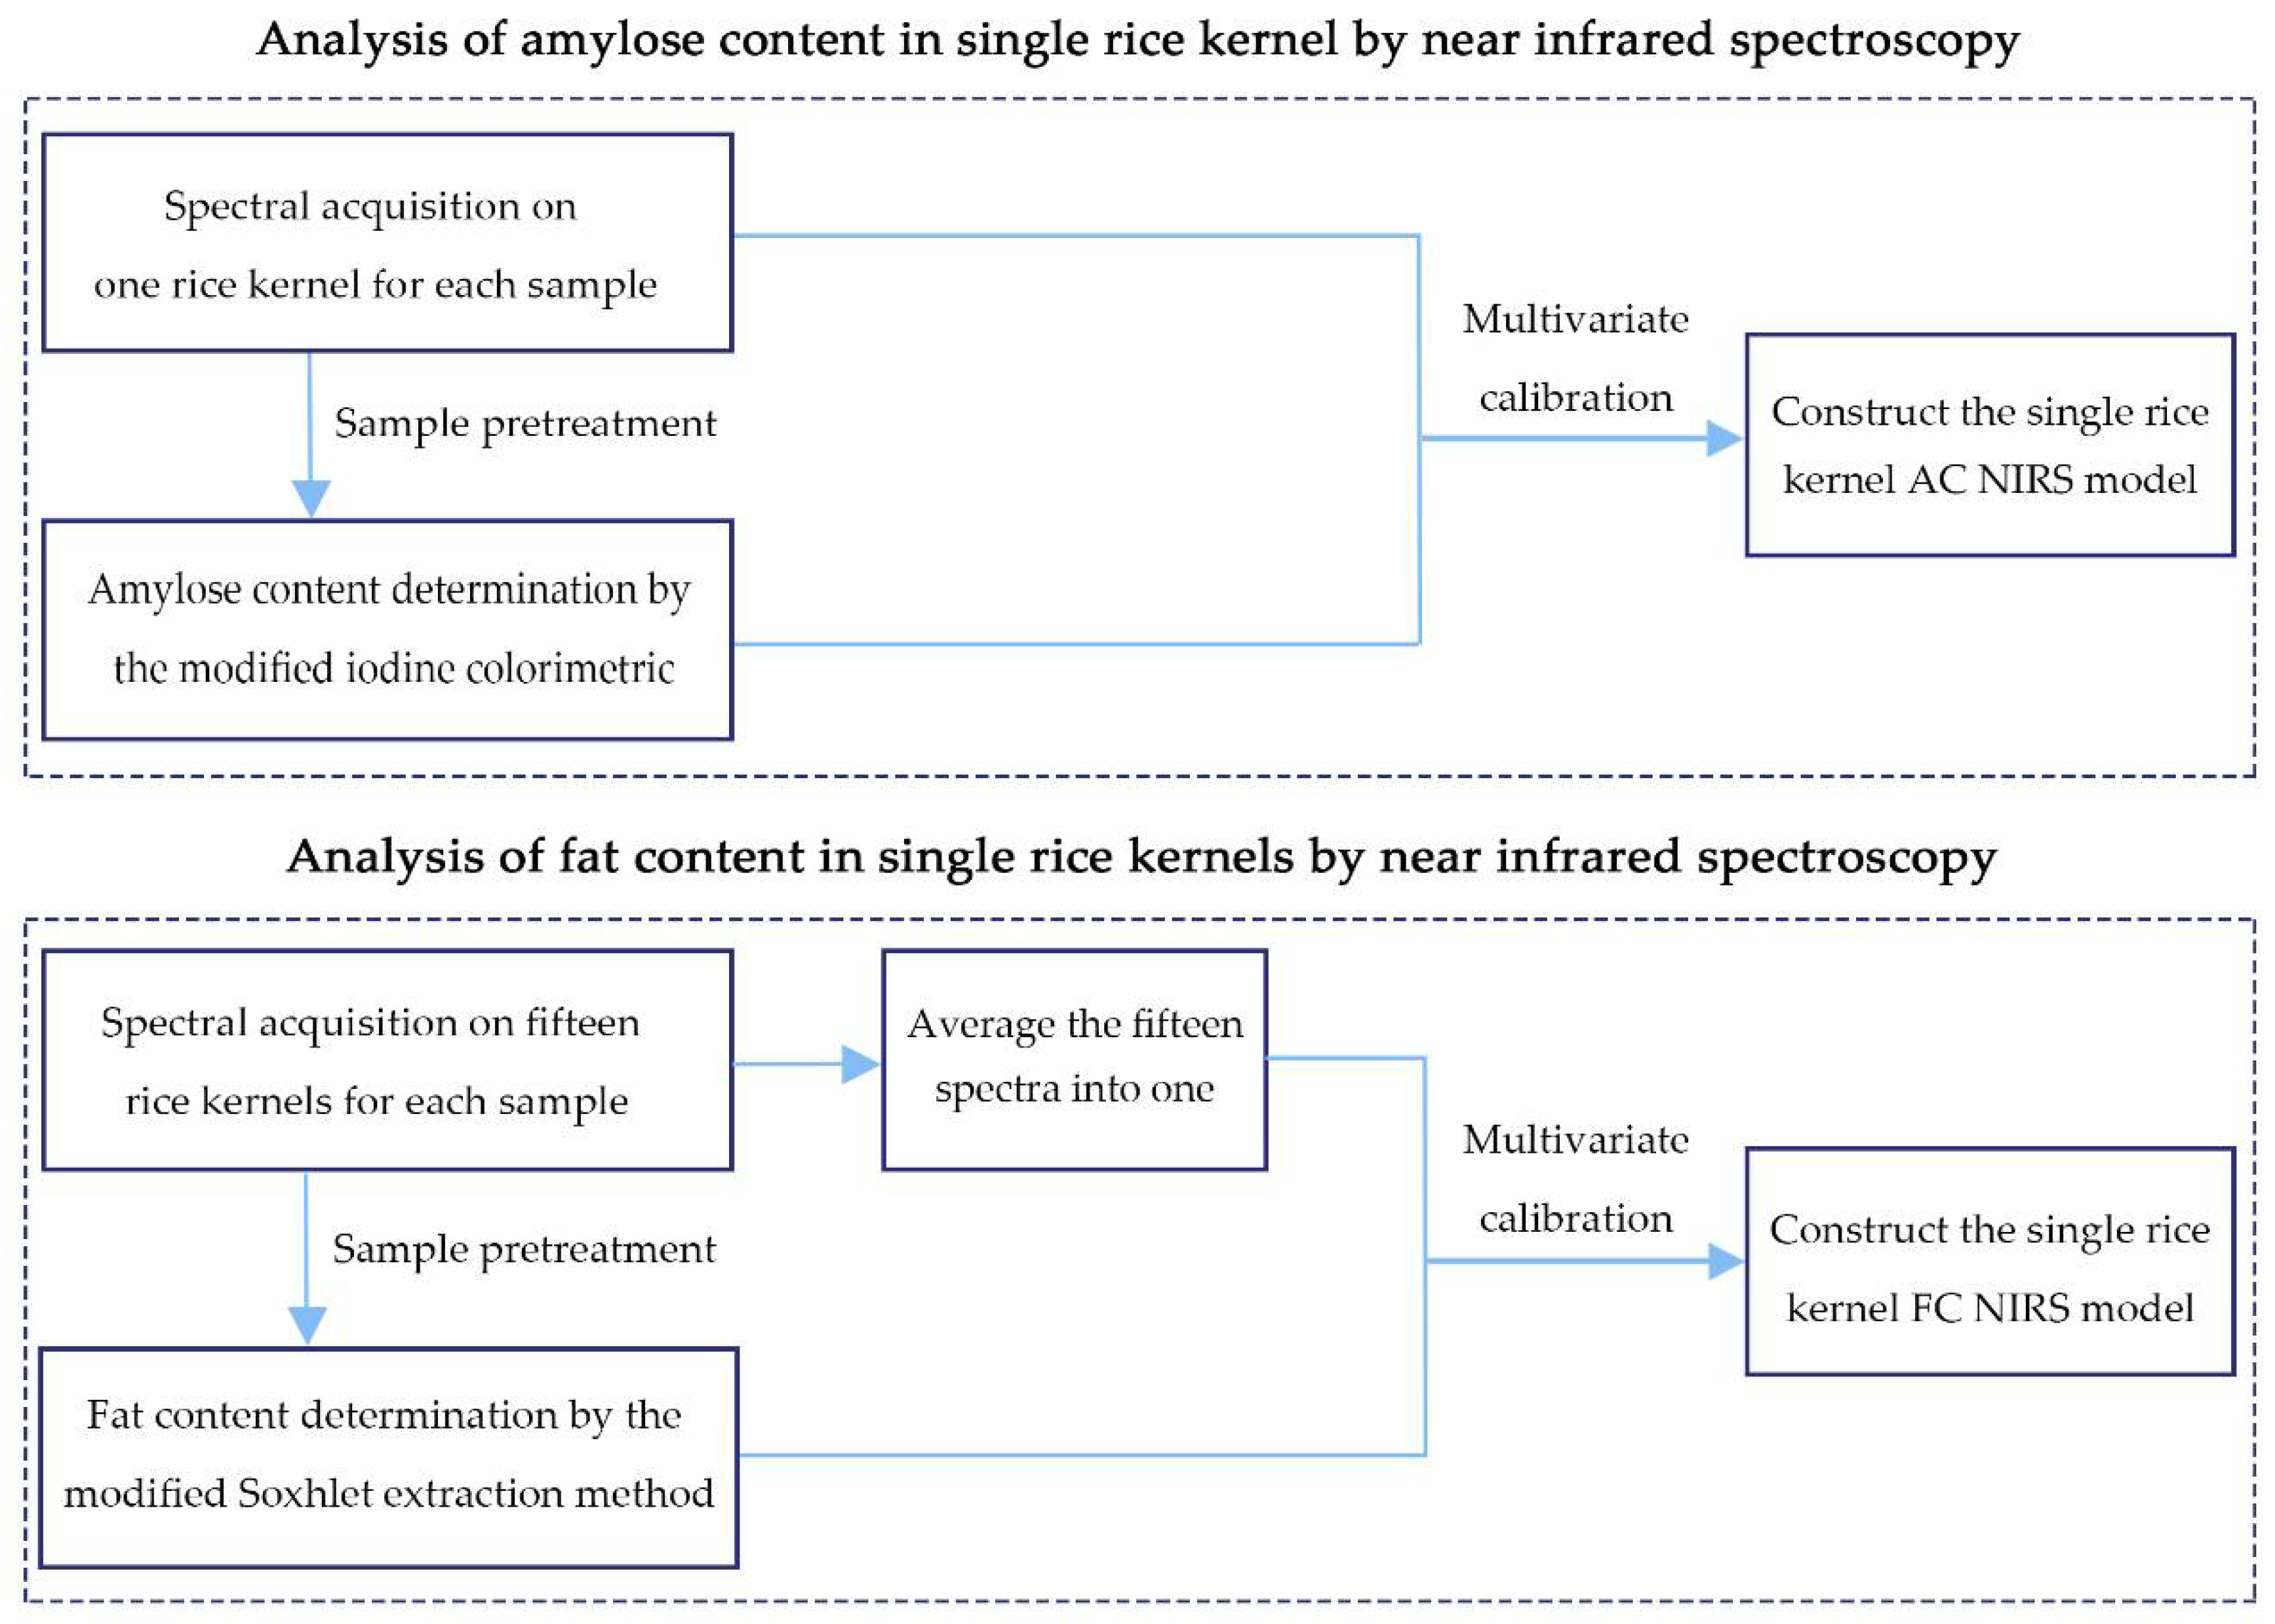
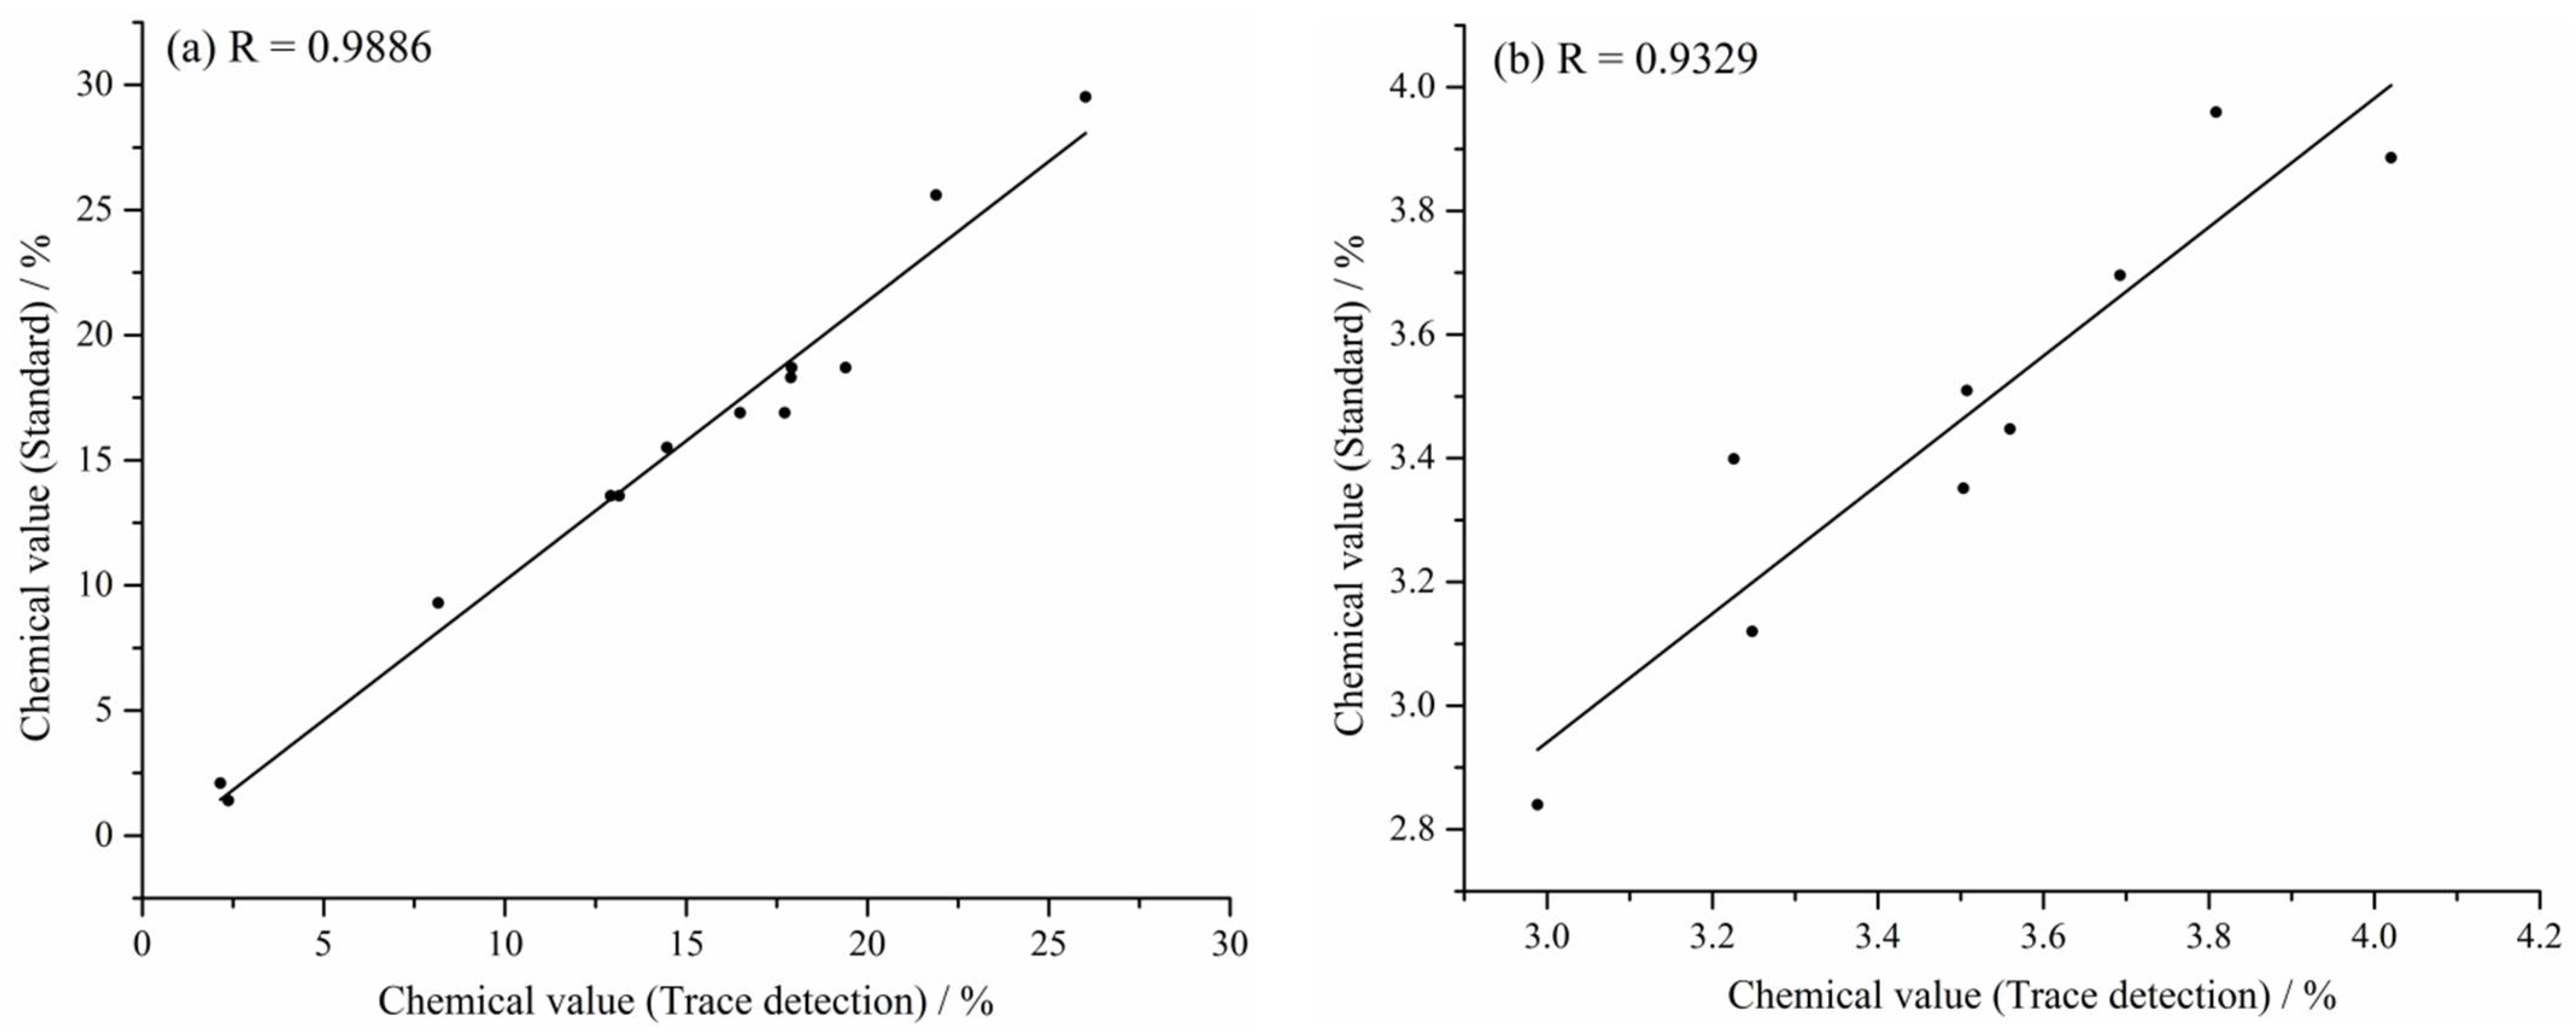
3.1. Comparison of AC and FC Trace Detection Methods with the Traditional Method

To compare the results of the two modified methods with those of the traditional methods, 14 rice samples were assessed using the modified iodine colorimetric method and the traditional iodine colorimetric method [9]. The masses of each sample taken using these two methods were 0.01 g and 0.1 g. Nine rice samples were determined using the modified Soxhlet extraction method and the traditional Soxhlet extraction method [10]. The masses of each sample taken using these two methods were 0.3 g and 2 g. The materials, procedures, and results used are shown in Supplementary Data S1. The scatter plots of the AC values determined using the traditional and modified iodine colorimetric methods are shown in Figure 3a. The correlation coefficient of the results determined using the two methods was 0.9886, and the |T| value of the paired t-test was 1.832 with a p-value of 0.092 (p > 0.05). The scatter plots of the FC values determined using the traditional and modified Soxhlet extraction methods are shown in Figure 3b. The correlation coefficient of the results determined using the two methods was 0.9329, and the paired t-test |T| value was 0.898 with a p-value of 0.395 (p > 0.05). This indicates that the results measured using the modified methods and the traditional methods correlated well, and the difference between these results was not significant.

3.2. Trace Detection Results of AC and FC in Single Rice Kernels

The statistical results of the AC and FC in single rice kernels determined using the two modified trace detection methods are shown in Table 1. The distribution of AC and FC in the calibration set ranged from 1.35% to 24.61% and 2.29% to 4.10%. These two ranges completely covered those of the corresponding validation set. The mean values, standard errors (SE), and standard deviations (SD) of the calibration set and validation set were similar. These results indicate that the calibration sets were representative of the validation sets.

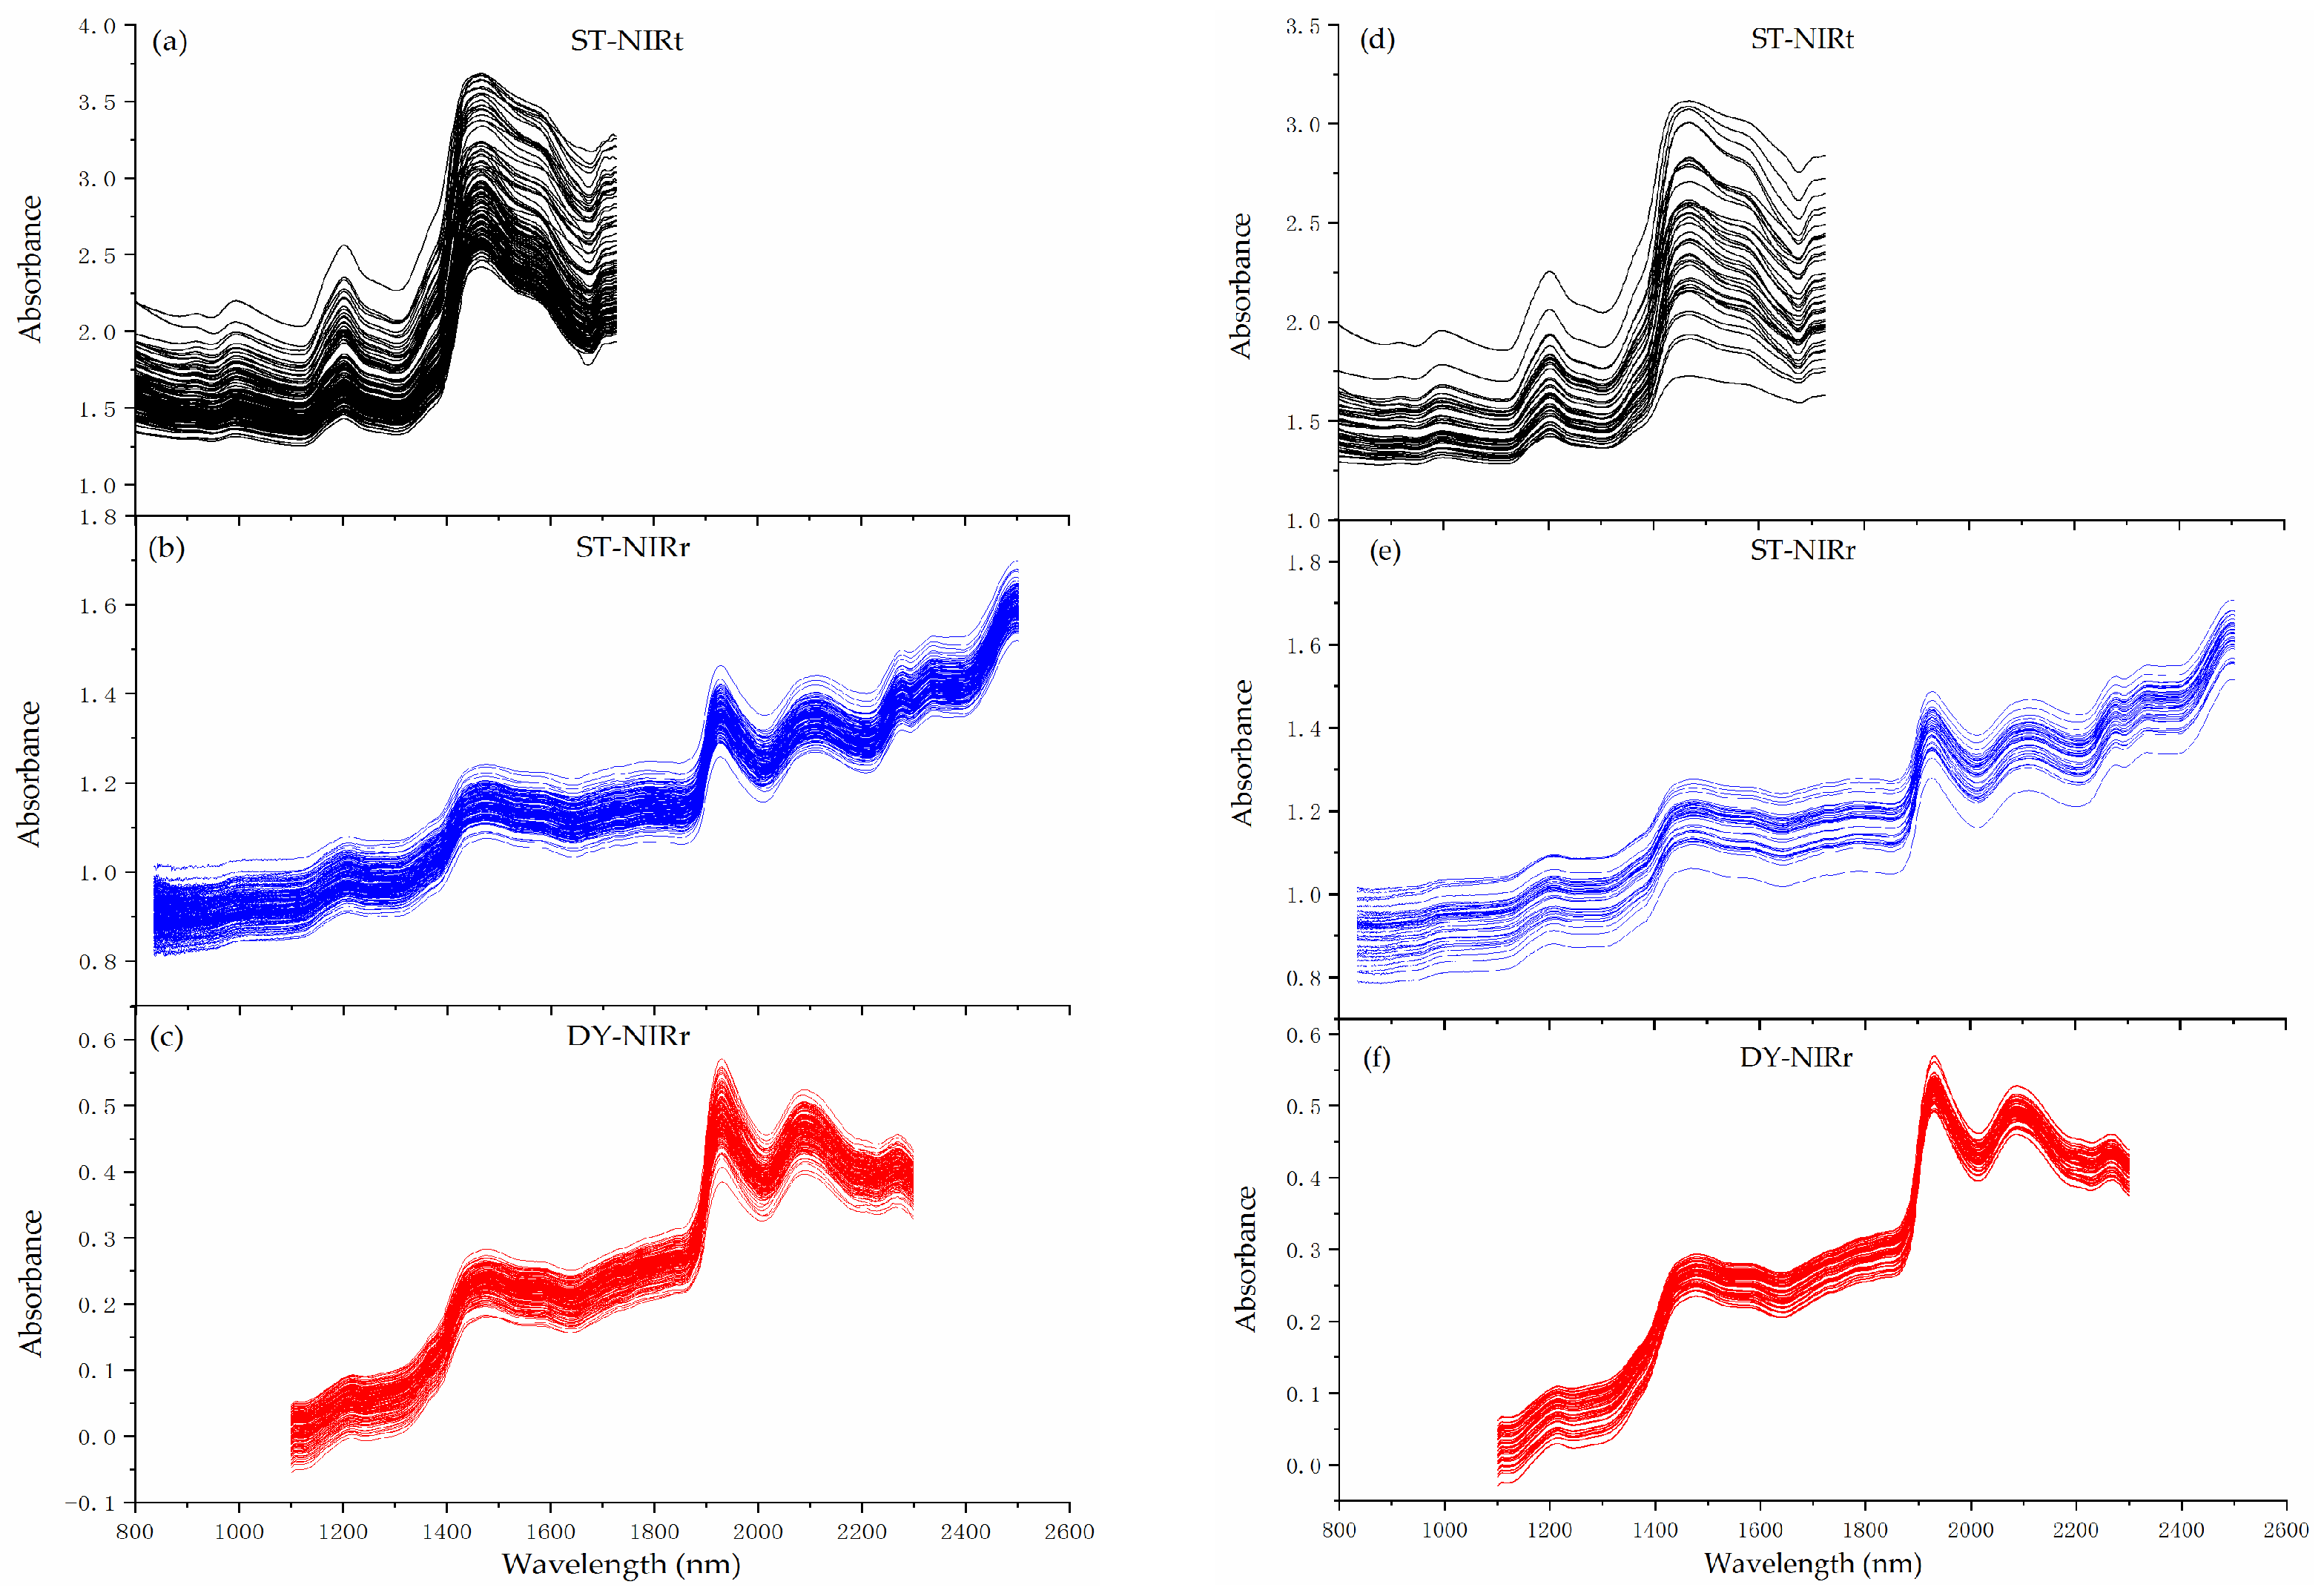
3.3. Spectra of Single Rice Kernels under Different Measurement Conditions

The spectra acquired under different measurement conditions are shown in Figure 4 (original data are listed as Supplementary Data S2). All spectra in the figure are displayed in wavelength format.
As shown in Figure 4, the spectra under ST-NIRt conditions had the highest absorbance and the largest baseline drift among all three types of spectra, which reflected the difference in optical distance that occurred when the transmission light penetrates rice kernels with different thicknesses. Although the absorbance and range of all three types of spectra were different, the positions of the AC- and FC-related absorption peaks [19] presented in these spectra (e.g., those near 1200, 1464, and 1920 nm) were the same, which indicates that the necessary composition information was included in these spectra.

3.4. Calibration and Validation Results of the Optimized Models

In order to construct the optimum models, spectral pre-treatment and spectral range screening were needed. The models with the lowest RMSECV and the highest R2cv were screened under different optimization conditions. The calibration and validation results of the models are shown in Table 2. In the table, the optimized AC and FC models are included in the AC group and FC group, while those models that used classic spectral range combinations and pre-treatment methods are included in the control group of AC and FC (ACc and FCc).
Table 2 shows that in the ACc and FCc groups, the predicted results achieved with the classic spectral ranges and different pretreatment were not good, except for those of the control model for AC under ST–NIRt conditions (R2cv of 0.834 and R2p of 0.818). This indicates that the classic spectral ranges contained the characteristic bands, but they contained more interference in the unrelated ranges. After the optimization of various pre-treatment methods and wavelength selection methods, all the models achieved better results than the control groups. The R2cv and R2p of all the models in the AC and FC groups were above 0.6.
For the AC of single rice kernels, the ST-NIRt-AC model achieved the best calibration and validation results with the R2cv of 0.886, RMSECV of 2.14, R2p of 0.832, and RMSEP of 2.86. The results of the ST–NIRr–AC model were the second best, with the R2cv of 0.724, RMSECV of 3.32, R2p of 0.737, and RMSEP of 3.57. The results of these two models were better than those reported by Wu et al. [13], in which the R2 of calibration was 0.76, the SEC (square error of calibration) was 3.44, the R2p was 0.64, and the SEP (square error of prediction) was 4.54. The model in the DY condition (the DY-NIRr-AC model) was slightly worse than the two models in the ST condition, which had the R2cv of 0.666, RMSECV of 3.66, R2p of 0.724, and RMSEP of 3.66.
For the FC of single rice kernels, the model under DY conditions (DY-NIRr-FC model) had the best predictive performance, with the R2cv of 0.765, RMSECV of 0.214, R2p of 0.655, and RMSEP of 0.262. Compared with the DY-NIRr-FC model, the model under ST and NIRt conditions (ST-NIRt-FC model) was slightly inferior, with the R2cv of 0.743, RMSECV of 0.224, R2p of 0.644, and RMSEP of 0.266. The results of these two models were close to the NIRS prediction results for bulk brown rice reported by Wang et al. [20], in which the R2cv of 0.73, RMSECV of 0.17, R2p of 0.62, and RMSEP of 0.25 were reported. The model under ST and NIRr conditions (ST-NIRr-FC model) has the worst prediction performance; the R2cv was 0.646, the RMSECV was 0.263, R2p was 0.624, and the RMSEP was 0.283.
The comparison of the results under different conditions shows that in terms of AC in single rice kernels, the analysis results under ST conditions were better than those under DY conditions, while in terms of FC in single rice kernels, the results were the opposite. The reason for this phenomenon may be related to the averaging process of the spectra of multiple rice kernels when analyzing the FC. Under the ST condition, the position of the sample and the number of scans were relatively consistent, which was more likely to create stable spectral signals, while the spectrum under DY conditions was inclined to change with the morphology of the rice kernel. Under the DY condition, the shorter the rice kernel and the faster the sample moves, the fewer the number of original spectra can be collected; moreover, the thicker the rice kernel, the shorter the distance of the light that was reflected (as the detector collected signals from top to bottom). Therefore, the method of averaging the spectra of multiple rice kernels should be helpful in correcting the physical morphological interference of rice kernels under DY conditions, thereby improving the predictive performance.

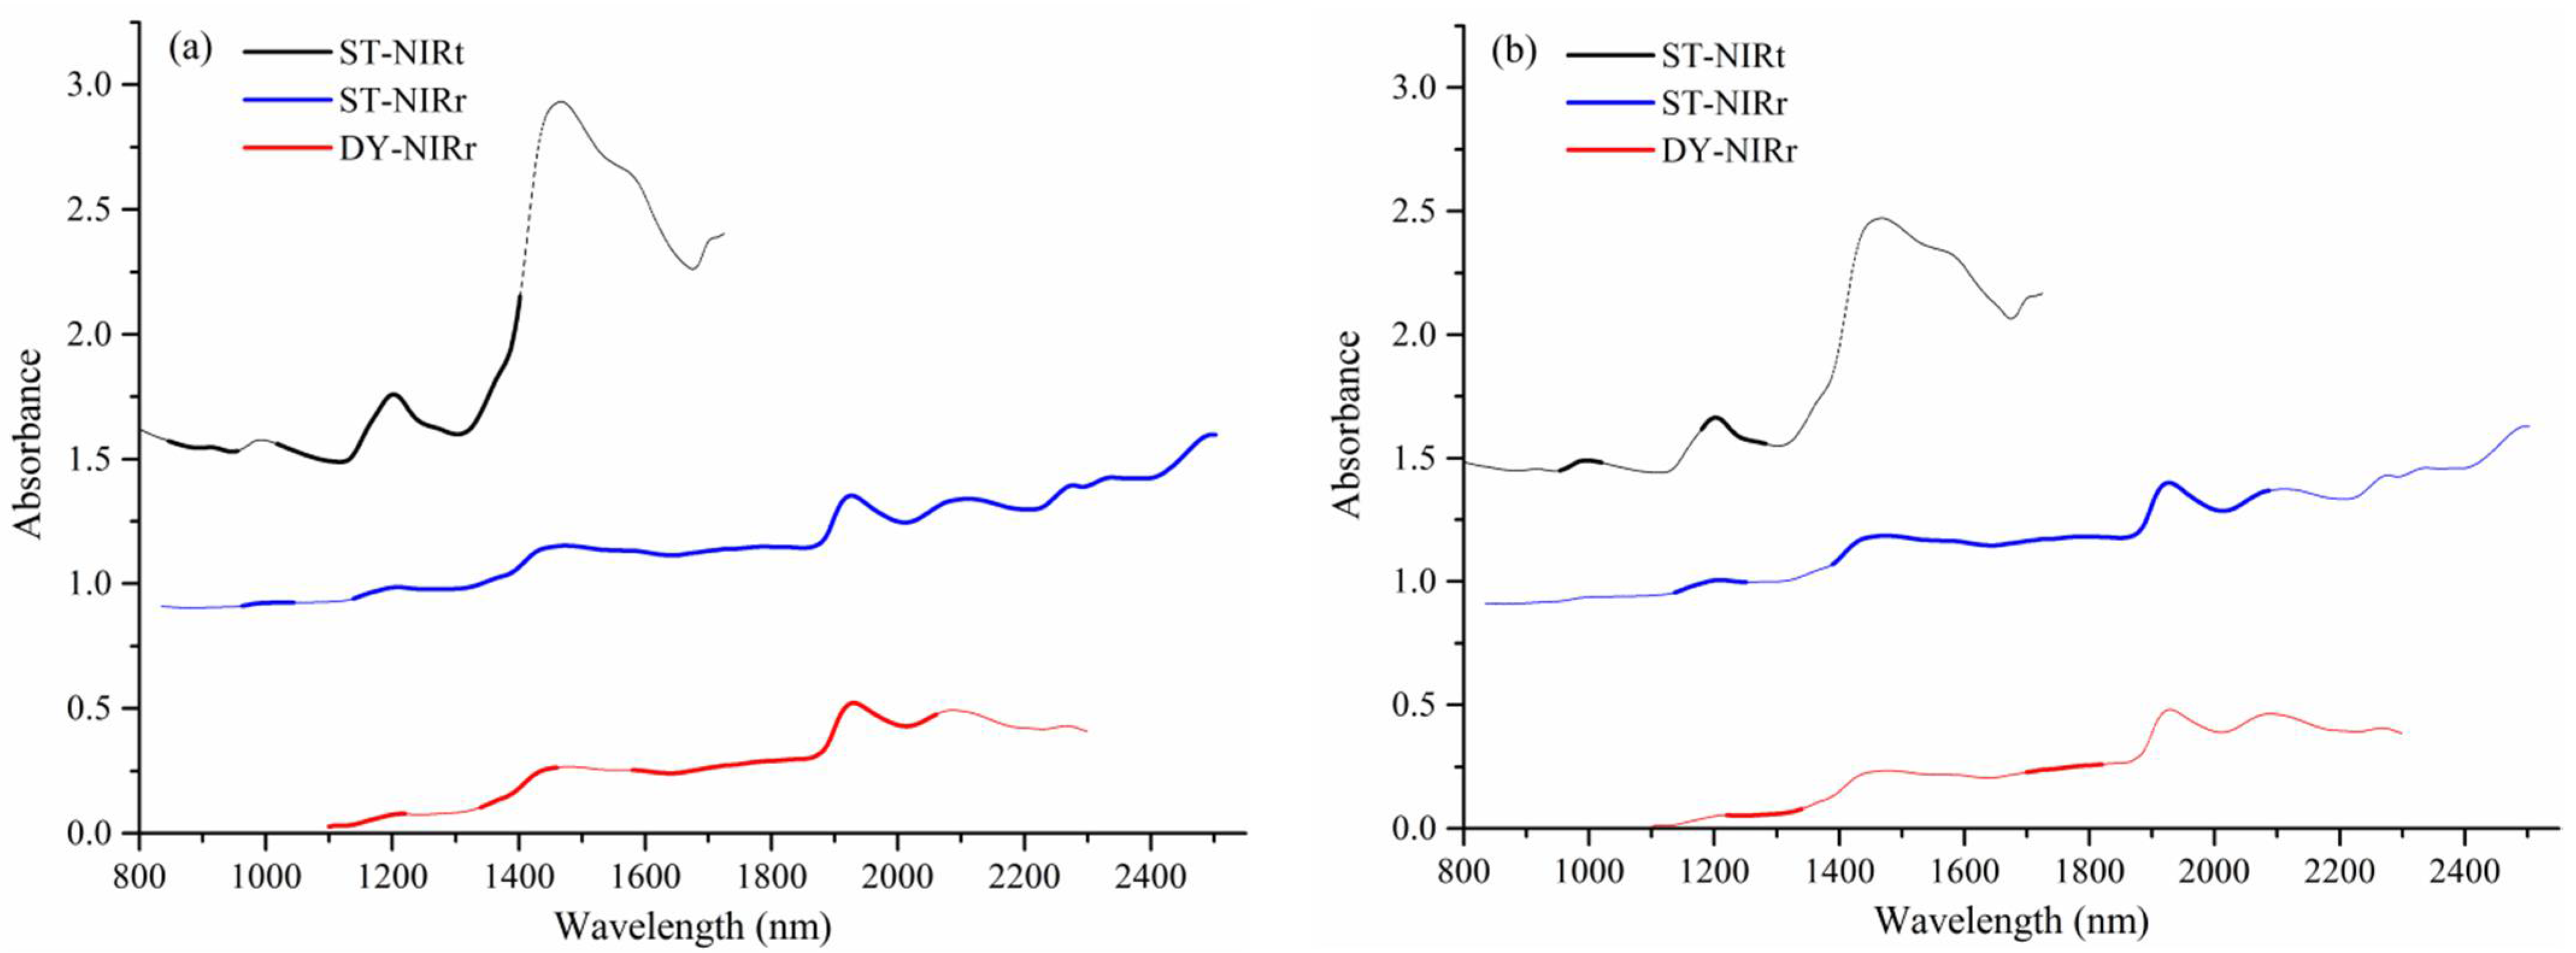
3.5. Characteristic Bands of Single Rice Kernel AC and FC

The characteristic bands used for the optimal single rice kernel AC and FC models are shown in Figure 5a,b. The black, blue, and red dashed lines in the figure are the average spectra of single rice kernels in the ST-NIRt, ST-NIRr, and DY-NIRr conditions, while the solid lines of corresponding colors represent the spectral ranges used in the ST-NIRt, ST-NIRr, and DY-NIRr models.
Figure 5a shows that the starch-related absorption peaks [19] near 1204 nm and 1464 nm are included in the ranges used in the three groups of single rice kernel AC models (the ST-NIRt-AC, ST-NIRr-AC and DY-NIRr-AC models). Another absorption peak for starch is at 1932 nm [19], which is also included in the range used by the two NIRr models. The ranges used in these three models are close to the characteristic bands reported by Sampaio et al. [21] in their analysis of rice flour AC, which are 8941–8194 cm−1 (1118–1220 nm), 5592–5045 cm−1 (1788–1982 nm), and 4683–4335 cm−1 (2135–2307 nm). The ranges determined in this study also overlap with the ranges used in the rice flour AC models determined by Mishra et al. [22], which are 6966 cm−1 (1436 nm), 6997 cm−1 (1429 nm), 7005 cm−1 (1428 nm), and 8100 cm−1 (1235 nm).
Figure 5b shows that parts of the bands used in the three groups of models for single rice kernel FC (ST-NIRt-FC, ST-NIRr-FC, and DY-NIRr-FC) are close to the fat characteristic absorption peaks at 1210 nm and 1760 nm [19]. These ranges are also close to the ranges (1207, 1726, and 1763 nm) reported by Wimonsiri et al. [23] in the analysis of FC in rice cookies. Moreover, compared with other AC and FC detection methods (Table 3), the methods applied in this study possess acceptable detection accuracy [21,24].
In summary, the bands used for modeling in this study are closely related to the absorption of amylose or fat molecules, indicating that the models we selected are reasonable.

4. Conclusions

In this study, two NIRS-based methods used to determine AC and FC in single rice kernels were proposed. Two modified wet-chemical methods were applied as the reference. The accuracy of these reference methods was proven to be close to that of traditional wet-chemical methods, and the differences were negligible. The prediction efficiency of the models was significantly improved under the optimal conditions of various pre-treatment methods and spectral ranges. The validity of the proposed methods was verified under different measurement conditions. The R2cv and R2p values of the AC and FC in single rice kernels based on the NIR models were all above 0.6. The results indicated that the proposed methods were applicable to the rapid and non-destructive detection and sorting of rice seeds, and it was shown that their accuracy can meet the requirements for the rough screening of rice seed varieties.
By comparing the predicted results under different measurement conditions, the optimal conditions for rice seed detection and seed sorting using the proposed methods were explored. The results show that the accuracy of the NIRS analysis results was related to the target constituents and the measurement modes. For the AC in a single rice kernel, the prediction results of the NIRS models under ST and NIRt conditions were the best, while for the FC in a single rice kernel, the results under DY and NIRr conditions were the best. The averaging of multiple spectra of single rice kernels may be an effective means to improve the accuracy of NIRS models fog single rice kernels. The comparison results also showed that for the detection of constituents of single rice kernels under ST conditions, the accuracy was better when using diffuse-transmission NIRS. However, as the AOTF spectrometer only has a reflection mode, the feasibility of using diffuse-transmission NIRS under DY conditions for single-rice-kernel constituent analysis needs to be verified further. In addition, the moving speed of the sample under DY conditions was low. Therefore, to meet the requirements of high-throughput detection and sorting of crop seeds more effectively, the proposed method should be further verified and optimized based on equipment with more efficient spectral acquisition and analysis functions.

Supplementary Materials

The following supporting information can be downloaded at: https://www.mdpi.com/article/10.3390/agriculture12081258/s1. Supplementary Data S1: The materials, procedures and results of the standard and modified trace detection methods for amylose and fat content detection in rice. Supplementary Data S2: Spectral data and chemical parameters.

Author Contributions

Conceptualization, S.F. and Z.X.; methodology, S.F.; investigation, S.F., Z.X. and W.C.; data curation, S.F., W.C., J.G. and P.Z.; writing—original draft preparation, S.F. and Z.X.; writing—review and editing, J.G., Y.Y. and P.Z.; supervision, Q.W. and Y.W.; funding acquisition, Q.W. and Y.W. All authors have read and agreed to the published version of the manuscript.

Funding

This research was funded by National Natural Science Foundation of China (32070399, 32171962), The 2021 Research Program of Sanya Yazhou Bay Science and Technology City (SKJC-2021-02-002), Anhui Science and Technology Major Project (202103a06020014), The HFIPS Director’s Fund (YZJJKX202201), and Hefei Science and Technology Project (2021GJ065).

Institutional Review Board Statement

Not applicable.

Informed Consent Statement

Not applicable.

Data Availability Statement

Not applicable.

Acknowledgments

Thanks to Yuqing He from Huazhong Agricultural University for sharing the rice experimental materials.

Conflicts of Interest

The authors declare no conflict of interest.

References

  1. Wang, S.; Wu, K.; Yuan, Q.; Liu, X.; Liu, Z.; Lin, X.; Zeng, R.; Zhu, H.; Dong, G.; Qian, Q. Control of grain size, shape and quality by OsSPL16 in rice. Nat. Genet. 2012, 44, 950–954. [Google Scholar] [CrossRef] [PubMed]
  2. Zhou, H.; Xia, D.; He, Y. Rice grain quality—Traditional traits for high quality rice and health-plus substances. Mol. Breed. 2020, 40, 1. [Google Scholar] [CrossRef]
  3. Zhou, H.; Xia, D.; Li, P.; Ao, Y.; Xu, X.; Wan, S.; Li, Y.; Wu, B.; Shi, H.; Wang, K. Genetic architecture and key genes controlling the diversity of oil composition in rice grains. Mol. Plant 2021, 14, 456–469. [Google Scholar] [CrossRef] [PubMed]
  4. Morrison, W.R.; Milligan, T.P.; Azudin, M. A relationship between the amylose and lipid contents of starches from diploid cereals. J. Cereal Sci. 1984, 2, 257–271. [Google Scholar] [CrossRef]
  5. Khatun, A.; Waters, D.L.; Liu, L. The impact of rice protein on in vitro rice starch digestibility. Food Hydrocoll. 2020, 109, 106072. [Google Scholar] [CrossRef]
  6. Zhu, D.; Fang, C.; Qian, Z.; Guo, B.; Huo, Z. Differences in starch structure, physicochemical properties and texture characteristics in superior and inferior grains of rice varieties with different amylose contents. Food Hydrocoll. 2021, 110, 106170. [Google Scholar] [CrossRef]
  7. Agelet, L.E.; Hurburgh, C.R., Jr. Limitations and current applications of Near Infrared Spectroscopy for single seed analysis. Talanta 2014, 121, 288–299. [Google Scholar] [CrossRef]
  8. Esteve Agelet, L.; Armstrong, P.R.; Romagosa Clariana, I.; Hurburgh, C.R. Measurement of single soybean seed attributes by near-infrared technologies. A comparative study. J. Agric. Food Chem. 2012, 60, 8314–8322. [Google Scholar] [CrossRef]
  9. ISO 6647–2:2015; Rice—Determination of Amylose Content—Part 2: Routine Method. ISO: Geneva, Switzerland, 2015.
  10. Thiex, N.J.; Anderson, S.; Gildemeister, B. Crude fat, diethyl ether extraction, in feed, cereal grain, and forage (Randall/Soxtec/submersion method): Collaborative study. J. AOAC Int. 2003, 86, 888–898. [Google Scholar] [CrossRef]
  11. Xu, Z.; Fan, S.; Liu, J.; Liu, B.; Tao, L.; Wu, J.; Hu, S.; Zhao, L.; Wang, Q.; Wu, Y. A calibration transfer optimized single kernel near-infrared spectroscopic method. Spectrochim. Acta Part A Mol. Biomol. Spectrosc. 2019, 220, 117098. [Google Scholar] [CrossRef]
  12. Yang, J. Study on test methodology of amylose content of single (half) seed of rice. Crop Var. Res. 1992, 1, 33–35. [Google Scholar]
  13. Wu, J.; Shi, C. Prediction of grain weight, brown rice weight and amylose content in single rice grains using near-infrared reflectance spectroscopy. Field Crops Res. 2004, 87, 13–21. [Google Scholar] [CrossRef]
  14. Dai, J.; Zhang, H.; Zhu, Y.; Xu, H. A high–throughput method for determination of apparent amylase content in rice. Acta Agric. Zhejiangensis 2014, 26, 1421–1424. [Google Scholar]
  15. Janni, J.; Weinstock, B.R.; Hagen, L.; Wright, S. Novel near-infrared sampling apparatus for single kernel analysis of oil content in maize. Appl. Spectrosc. 2008, 62, 423–426. [Google Scholar] [CrossRef] [PubMed]
  16. Armstrong, P.R.; Tallada, J.G.; Hurburgh, C.; Hildebrand, D.F.; Specht, J.E. Development of single-seed near-infrared spectroscopic predictions of corn and soybean constituents using bulk reference values and mean spectra. Trans. ASABE 2011, 54, 1529–1535. [Google Scholar] [CrossRef]
  17. Wu, W.; Walczak, B.; Massart, D.; Heuerding, S.; Erni, F.; Last, I.; Prebble, K. Artificial neural networks in classification of NIR spectral data: Design of the training set. Chemom. Intell. Lab. Syst. 1996, 33, 35–46. [Google Scholar] [CrossRef]
  18. Jiang, H.; Liu, G.; Mei, C.; Yu, S.; Xiao, X.; Ding, Y. Measurement of process variables in solid-state fermentation of wheat straw using FT-NIR spectroscopy and synergy interval PLS algorithm. Spectrochim. Acta Part A Mol. Biomol. Spectrosc. 2012, 97, 277–283. [Google Scholar] [CrossRef]
  19. McClure, W.F.; Stanfield, D.L. Near-infrared spectroscopy of biomaterials. In Handbook of Vibrational Spectroscopy; John Wiley & Sons, Ltd.: Hoboken, NJ, USA, 2006. [Google Scholar]
  20. Wang, H.; Wan, X.; Bi, J.; Wang, J.K.; Jiang, L.; Chen, L.; Zhai, H.; Wan, J. Quantitative Analysis of Fat Content in Rice by Near-Infrared Spectroscopy Technique. Cereal Chem. 2006, 83, 402–406. [Google Scholar] [CrossRef]
  21. Sampaio, P.S.; Soares, A.; Castanho, A.; Almeida, A.S.; Oliveira, J.; Brites, C. Optimization of rice amylose determination by NIR-spectroscopy using PLS chemometrics algorithms. Food Chem. 2018, 242, 196–204. [Google Scholar] [CrossRef]
  22. Mishra, P.; Woltering, E.J. Identifying key wavenumbers that improve prediction of amylose in rice samples utilizing advanced wavenumber selection techniques. Talanta 2021, 224, 121908. [Google Scholar] [CrossRef]
  23. Wimonsiri, L.; Ritthiruangdej, P.; Kasemsumran, S.; Therdthai, N.; Chanput, W.; Ozaki, Y. Rapid analysis of chemical composition in intact and milled rice cookies using near infrared spectroscopy. J. Near Infrared Spectrosc. 2017, 25, 330–337. [Google Scholar] [CrossRef]
  24. Xu, Z.; Cheng, W.; Fan, S.; Liu, J.; Wang, H.; Li, X.; Liu, B.; Wu, Y.; Zhang, P.; Wang, Q. Data fusion of near-infrared diffuse reflectance spectra and transmittance spectra for the accurate determination of rice flour constituents. Anal. Chim. Acta 2022, 1193, 339384. [Google Scholar] [CrossRef] [PubMed]
Figure 1. Schematic diagram of diffuse transmission (a) and diffuse reflection (b) spectral acquisition under static conditions and diffuse reflection (c) spectral acquisition under dynamic conditions, and the schematic diagram of rice kernels moving on the conveyor belt (d). (Note: In c,d, each rice kernel moved horizontally with the conveyor belt. The original spectra were collected continuously when the rice kernels passed through the detection window.).
Agriculture 12 01258 g001
Figure 2. Flow chart of AC and FC detection in single rice kernels based on NIRS.
Agriculture 12 01258 g002
Figure 3. Scatter plots of rice AC (a) determined using the two iodine colorimetric methods and rice FC (b) determined using the two Soxhlet extraction methods.
Agriculture 12 01258 g003
Figure 4. Spectra of single rice kernel AC (ac) and FC (df) datasets under different measurement conditions. (Note: the black, blue, and red curves in the figures represent the spectra measured on the conditions of ST-NIRt, ST-NIRr, and DY-NIRr).
Agriculture 12 01258 g004
Figure 5. Characteristic bands used by the single rice kernel AC (a) and FC (b) NIRS models. (Note: In a,b, the black, blue, and red dashed lines in the figure are the average spectra of single rice kernels under ST-NIRt, ST-NIRr, and DY-NIRr conditions, while the solid lines of corresponding colors represent the bands used in the ST-NIRt, ST-NIRr, and DY-NIRr models.).
Agriculture 12 01258 g005
Table 1. AC and FC of samples measured using trace detection methods.
AnalytesCalibration SamplesValidation Samples
NRangeMeanSESDNRangeMeanSESD
AC%1071.35–24.6113.200.6156.36451.63–24.4513.151.0517.05
FC%282.29–4.103.000.0850.45112.44–3.823.070.1420.47
Note: N: sample size; AC: amylose content; FC: fat content; SE: standard errors; SD: standard deviations.
Table 2. The calibration and validation results of the PLS models for AC and FC in single rice kernels.
GroupMovement ConditionMeasurement ModeR2cvRMSECV (%)R2pRMSEP (%)Pretreatment MethodLVSpectral Ranges (nm)
ACSTNIRt0.8862.140.8322.861 der + MSC12845.6–954.6, 1018.3–1401.5
STNIRr0.7243.320.7373.57ECO8963.1–1043.7, 1138.1–2502.5
DYNIRr0.6663.660.7243.66MSC101100–1220, 1340–1460, 1580–2060
ACcSTNIRt0.8342.580.8183.021 der + MSC91099.5–1300.2
STNIRt0.8042.80.6513.41 der + MSC111099.5–1500.3
STNIRr0.663.690.6854.02None81099.5–1500.3, 1797.9–2200.8
STNIRr0.6383.810.6734.04ECO81099.5–1500.3, 1797.9–2400.6
DYNIRr0.6443.780.7183.76MSC81100–1500, 1800–2000
DYNIRr0.5674.160.6564.11der + MSC81100–1500, 1800–2200
FCSTNIRt0.7430.2240.6440.2661 der + SNV2953.9–1019.9, 1179.5–1282.2
STNIRr0.6460.2630.6240.2831 der + SNV111137.1–1251.2, 1389.4–2087.4
DYNIRr0.7650.2140.6550.262MSC81220–1340, 1700–1820
FCcSTNIRt0.5460.2980.6240.2741der + MSC61099.5–1500.3
STNIRt0.430.3340.5950.2841der + MSC51099.5–1300.2, 1498.6–1726.1
STNIRr0.5720.2890.430.435None101099.5–1500.3, 1698.9–1900.7
STNIRr0.5240.3050.5290.365SNV91099.5–1500.3, 1698.9–1900.7,
2298.4–2521.4
DYNIRr0.5360.3010.6320.2711der + SNV61100–1300, 1700–1900
DYNIRr0.4970.3130.5960.283ECO61100–1300
Notes: R2cv: determination correlation of cross-validation; RMSECV: root mean squares of cross-validation; R2p: determination correlation of prediction; RMSEP: root mean squares of prediction; ECO: eliminate constant offset; LV: latent variables; AC: amylose content; FC: fat content; ACc: classic spectral ranges for amylose content; FCc: classic spectral ranges for fat content; ST: static; DY: dynamic; NIRr: near-infrared reflectance; NIRt: near-infrared transmittance.
Table 3. Comparison of different AC and FC detection methods by using rice kernels and rice flour as the model.
InstrumentContentSampleMotion StateResolutionResultsRef.
MPA–reflectionamylose contentrice kernelsstatic conditions16 cm−1RMSECV (%) = 3.32, RMSEP (%) = 3.57This study
fat contentRMSECV (%) = 0.263, RMSEP (%) = 0.283This study
MPA–transmissionamylose contentrice kernelsstatic conditions16 cm−1RMSECV (%) = 2.14, RMSEP (%) = 2.86This study
fat contentRMSECV (%) = 0.224, RMSEP (%) = 0.266This study
AOTFamylose contentrice kernelsdynamic
conditions
1 nmRMSECV (%) = 3.66, RMSEP (%) = 3.66This study
fat contentRMSECV (%) = 0.214, RMSEP (%) = 0.262This study
MPA–reflectionamylose contentrice flourstatic conditions16 cm−1RMSECV (%) = 1.92, RMSEP (%) = 1.938[21]
MPA–reflection & transmissionfat contentrice flourstatic conditions16 cm−1RMSECV (%) = 0.12, RMSEP (%) = 0.165[24]
Publisher’s Note: MDPI stays neutral with regard to jurisdictional claims in published maps and institutional affiliations.

