Article

Grassland Management Impact on Soil Degradation and Herbage Nutritional Value in a Temperate Humid Environment

1
Department of General Agronomy, University of Zagreb Faculty of Agriculture, Svetosimunska cesta 25, 10000 Zagreb, Croatia
2
Department of Animal Nutrition, University of Zagreb Faculty of Agriculture, Svetosimunska cesta 25, 10000 Zagreb, Croatia
3
Department of Forest Ecology, Faculty of Forestry, University of Banja Luka, Stepe Stepanovića 75A, 78000 Banja Luka, Bosnia and Herzegovina
4
Environmental Management Laboratory, Mykolas Romeris University, LT-08303 Vilnius, Lithuania
*
Author to whom correspondence should be addressed.
Agriculture 2022, 12(7), 921; https://doi.org/10.3390/agriculture12070921
Submission received: 27 May 2022 / Revised: 22 June 2022 / Accepted: 22 June 2022 / Published: 24 June 2022
(This article belongs to the Section Ecosystem, Environment and Climate Change in Agriculture)

Abstract

:
Understanding the importance of grassland management is crucial for predicting the effects on forage production, pasture and ecosystem stability. Studies about the impact of grassland management in temperate humid environments on soil, erosion and aboveground biomass properties are lacking. This study investigates the effect of different grassland managements—no grazing, moderate grazing and heavy grazing—on soil properties, hydrological responses and herbage quality in an organic farm located in Croatia. The results showed that heavy grazing significantly increased soil compaction, structural deterioration, erosion and nutrient transport compared with no grazing. Heavily grazed plots had significantly higher soil organic matter and nutrient concentrations compared with no-grazing plots. Moderately grazed plots had the highest biomass production and the herbage with higher quality compared with other treatments. Significantly higher ash contents on heavily and moderately grazed plots were due to cow trampling. Cow grazing behaviour was a more important factor for plant regrowth and herbage quality than soil properties. Moderate grazing did not induce serious soil erosion problems or reduce soil productivity. Soil conservation measures should focus only on the heavily grazed areas and include the introduction of rotational grazing in combination with various strategies: excluding grazing, reseeding and increasing the diversity of resting areas.

1. Introduction

Grasslands cover more than 40% of the Earth’s surface and are an irreplaceable land-use type for food supply [1] and for achieving the United Nations Sustainable Development Goals (SDGs), particularly SDG2 (zero hunger). Grasslands provide a range of ecological goods and services: they conserve 15% of global organic carbon, control soil erosion, influence the hydrological cycle, and provide habitats for biodiverse vegetation [2]. However, the coupled effect of population growth and use of diets richer in animal-based products is increasing the demand for fodder and grassland-based livestock products, resulting in more than 1500 million pigs, 800 million sheep, 660 million goats and 575 million cattle [3]. This increases pressure on natural and semi-natural grasslands, which is detrimental to the environment.
The sustainability of grasslands depends on management intensity, which is influenced by mowing frequency, fertilisation and grazing pressure [4]. The humidity of vegetation season and fertilisation increase mowing frequency, indicating higher tractor frequency and its negative impact on soil structure and soil and water losses [5]. On the other hand, grazing involves plant—animal interactions in terms of defoliation and livestock grazing behaviour, while impacts on the soil include treading, trampling and deposition of faeces and urine [6]. Furthermore, overgrazing is a global problem that threatens the achievement of several of the United Nations’ SDGs [7]. Previous studies have reported the impact of livestock on soil compaction [8], soil structure [9], carbon and nitrogen concentrations or stocks [10], water infiltration [11], soil water content [12], runoff and soil loss [3,8], nutrient losses [13], plant cover [14,15] and biomass nutritive properties [16]. Overgrazing distorts soil structure, especially during excessively wet or dry periods [17]. Increased compaction modifies pore size [18] and increases soil and water losses in clay [19], sandy [8], loamy [20] and silty [8] grassland soils. In several environments, overgrazing has been identified as a cause of soil degradation in 6.9 million km2 [21]. To properly understand the type, extent and severity of grazing-induced degradation, several factors should be considered: soil characteristics, topography, climate and socioeconomic conditions [22].
Grassland management in terms of defoliation regime affects biomass production and plant biodiversity [23,24], with grazing promoting the dominance of grasses and mowing promoting the dominance of non-leguminous forbs [25]. Although changes in plant biodiversity imply changes in chemical composition, the nutritional value of herbage in grazed and mowed grasslands has not often been compared in previous studies. Other factors such as the frequency of defoliation and fertilisation affect the nutritional value of herbage regardless of the defoliation regime. Longer regrowth intervals are associated with lower crude protein and higher fibre contents due to increased stem development and lower leaf-to-stem ratio, while fertilisation improves biomass production but is associated with a decrease in crude protein content [26,27,28]. Another effect on grazed grasslands is grazing intensity; Pavlů et al. [29] showed that intensive continuous grazing resulted in herbage of higher crude protein content, lower crude fibre content, and higher organic matter digestibility than moderate continuous grazing. Although overgrazing implies a reduction in nutritional value, the changes in the plant community, the regrowth of new plant tissue and the high nitrogen input from livestock compensate for the herbage crude protein and digestibility [16,30].
Many studies focus on soil quality, conservation or herbage properties under different grassland management. The present study includes all these aspects—a complete survey of grassland management impacts on soil properties, hydrological response and herbage nutritional value, which is a missing subject in the semi-humid grassland environments at the international level. Although Central European ecosystems have similarities in natural environment and landscapes with other continents, there are also remarkable differences in economic and institutional frameworks [31,32,33]. Despite its relevance, the conflict between ecological (e.g., grassland sustainability) and economic outcomes (e.g., profit in intensive grazing systems) in grassland environments is still a challenge to overcome. Soil conservation is crucial to preserving productivity, soil health and sustainability of agroecosystems to enable the achievement of the United Nations’ SDGs, SDG 15.3 (land degradation neutrality) in particular, and in improving the quality of services provided by grassland ecosystems [34,35]. The conflicts between livestock production, plant community changes, biomass production (herbage quality) and soil conservation in grassland environments raise new questions. Multidisciplinary studies focused on solutions to identify the best grassland management practices and decrease their impacts on soil (e.g., structural deformation and organic matter depletion), hydrological response (e.g., sediment concentration, and sediment and nutrient losses), and on aboveground biomass and its nutritional quality (e.g., chemical composition and digestibility), are key to optimising grazing environments. The European Commission has set the target for 75% of all European soils to be healthy by 2030 [36]. The present study can help achieve this target, and outcomes obtained from the study will help managers find a balance between ecosystem sustainability and profit, and provide guidelines for implementing sustainable grassland management measures. Therefore, this study aimed to identify the impact of grassland management on soil properties, hydrological response, and aboveground biomass quality in three different treatments (machinery mowing—no-grazing, moderate-grazing and heavy-grazing grasslands).

2. Materials and Methods
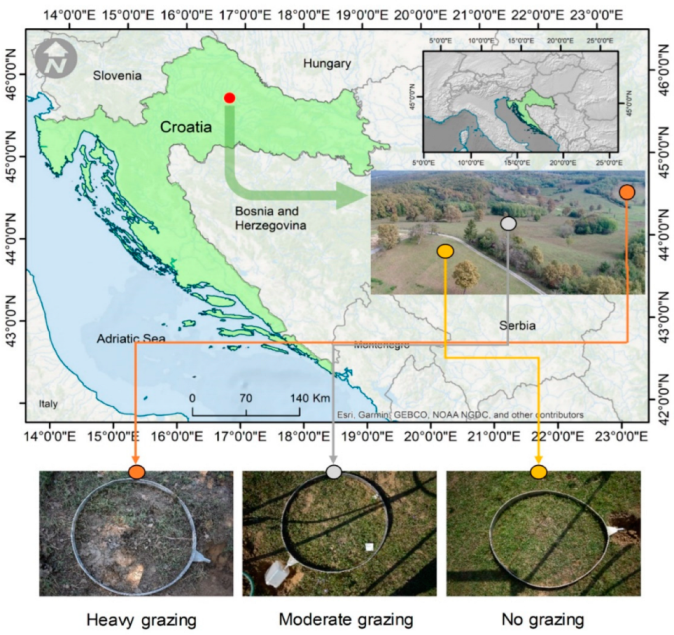
2.1. Study Site

The experimental farm is located in the central part of Croatia, near Mala Jasenovača (45°45′ N 17°11′ E, 192 m a.s.l.; Figure 1). The total area of the experimental farm is about 221 ha, of which 179 ha are used as pasture and 42 ha as mown grassland for hay production. The slope aspect is W–E with 11% inclination. The research area has a temperate humid climate with warm summer (Cfb) according to the Köppen classification [37]. The mean annual rainfall is 794 mm (from 1981 to 2018), with a wet season from May to October and a pronounced hot period in summer. Mean annual air temperatures range from 9.8 to 12.9 °C (from 1981 to 2018), with average maximum and minimum values reaching 22 °C in July and 0.3 °C in January, respectively. The main soil type is Luvisol [38]. The soil mainly has a sandy clay loam texture (clay: 21.7%, silt: 27.3% and sand: 51.0%), strong acidic reaction (pH 5.51) and low content of nutrients (15 mg P2O5 kg−1; 22 mg K2O kg−1) and medium content of organic matter (2.87%).
In 2014, the grassland on the experimental site was cleared of bushes, ploughed and sown with a mixture containing 28% of perennial ryegrass (Lolium perenne), 14% of timothy (Pheleum pretense), 28% of meadow fescue (Festuca pratensis) and 30% of white clover (Trifolium repens). The pasture was mulched each year in late spring and early autumn to remove refused sward and prevent seed formation of the dock (Rumex spp.), thistle (Cirsium spp.) and nettle (Urtica spp.). Mowed grasslands were mechanically mowed two—three times per year with light tractors (<4-ton axle load). The experimental site’s grazed and mowed grasslands were organically fertilised—in the pastures through dung and urine of grazing animals and in mowed grassland once a year by the manure of cattle kept in stables.
Three parts of the experimental site were selected for research according to their different grazing intensities, histories and animal behaviour. The pasture was divided into two paddocks that differed in the stocking density of grazing animals (Angus beef cows). The paddock identified as moderate-grazing grassland included continuous grazing with moderate stocking density (0.76 LU ha−1), while the paddock identified as heavy-grazing grassland included continuous grazing with high stocking density (1.26 LU ha−1). Vegetation cover was 5–54% and 71–89% at heavy and moderate-grazing treatments, respectively. In these two treatments, cows were kept with access to drinking water during the grazing period, and during the winter period, they were fed ad libitum in the barn with meadow hay and a lick block of mineral—vitamin premix for cows (Schauman Agri International GmbH, Pinneberg, Germany). Mowed grassland was identified as the no-grazing grassland, where cattle had been excluded since 2014 and vegetation cover was in the 90–99% range.

2.2. Soil and Vegetation Sampling and Rainfall Simulation Experiments

The sampling design was based on the different grazing intensity and cow behaviour (Figure 1). Each treatment included 8 randomly selected sampling points (24 in total) where sampling and rainfall simulation experiments were carried out by using calibrated pressurized rainfall simulator (UGT Rainmaker, Müncheberg, Germany). The use of rainfall simulations has the advantage of showing the hydrological response of the soil to the intensity and duration of precipitation. This technique was used because long-term studies with permanent fenced plots under cows are impractical. The distance between plots established for rainfall simulation experiments was approximately 4 m. The field research was conducted in July 2019.
Disturbed and undisturbed soil samples (0–10 cm) were collected at each sampling point before conducting the rainfall simulation experiments. Soil samples were collected in the vicinity of the rainfall catchment plot. To avoid contamination with soil during rainfall simulation, the herbage samples were also collected close to the rainfall catchment plot; the collection area was the same as that of the catchment plot. The herbage samples were collected by cutting sward 4–5 cm to the soil level. Prior to rainfall simulation, the slope of the catchment plot was measured to ensure uniformity of treatments, and the plot was photographed to obtain the percentage of vegetation cover (VC) by comparing the relation of pixels to the vegetation in addition to the plot area using ArcGIS 10.2 software (ESRI, Redlands, CA, USA). The simulator used is of the pressurised type (UGT Rainmaker, Müncheberg, Germany). Detailed characteristics of the rainfall simulation experiment are described previously by Bogunovic et al. [39]. The plots were circular with an area of 0.785 m2 (metal ring with a diameter of 100 cm). The simulations were carried out in a duration of 30 min at an intensity of 58 mm h−1, after being calibrated with the plastic vessel in the dimensions of the plot size. This intensity was chosen because similar heavy rain events usually occur in spring, with a recurrence rate of seven years [40]. The faucet on the metal ring (plot) was directed downward and connected to a plastic container where the runoff was collected. During each simulation, the time to ponding (PT) and time to runoff generation (RT) were measured with a chronometer.

2.3. Laboratory Analysis

Soil water content (SWC), water-holding capacity (WHC) and bulk density (BD) were measured using soil cores samples. To achieve this, weighing was carried out before and after capillary wetting and drying at 105 °C for 48 h [41], using the following equations:
BD = dry sample/soil volume
WHC = ((capillary wetted sample − dry sample)/soil volume) ∗ 100
SWC = ((sample with field water content − dry sample)/soil volume) ∗ 100
To measure soil structure, undisturbed samples were collected following Le Bissonnais [42]. Mean weight diameter (MWD) and the percentage of water-stable aggregates (WSA) were determined by dry and wet sieving according to Kemper and Rosenau [43]. Soil chemical properties were determined in the <2 mm fraction after sieving: soil pH was determined by electrometric method at ratio 1:2.5 (w/v) in KCl suspension using a Beckman pH meter Φ72; soil organic matter (SOM) was determined by the digestion method [44]; total nitrogen (TN) in soil was determined by the dry combustion method using a Vario MACRO CHNS analyser; P2O5 was determined by the ammonium lactate method [45].
The overland flow was weighed and filtered to obtain the sediment loss (SL) after air-drying at room temperature (20 °C) and weighing the filter paper. Runoff (Run) was calculated as the difference between the mass of overland flow and the sediment content. Sediment concentration (SC) was calculated by dividing the mass of SL by the mass of the Run. Dry combustion and ammonium lactate methods were used to determine C, N and P concentrations in sediments. Phosphorus loss (P loss), nitrogen loss (N loss) and carbon loss (C loss) was calculated by multiplying their concentrations in the sediments with SL data.
The herbage mass was expressed on a dry matter basis after moisture content was determined by oven-drying at 103 °C for 24 h in a portion of the total mass. After drying at 60 °C, the remaining mass was ground to pass a 1 mm sieve and analysed for ash, crude protein (CP), neutral and acid detergent fibre (NDF and ADF, respectively) and in vitro digestibility analyses. Ash was determined according to the method ISO 5984 [46]. The Kjeldahl method was used to determine N content in the samples, and CP was calculated by multiplying with factor 6.25. NDF and ADF were determined according to the methods ISO 16472 [47] and ISO 13906 [48], respectively; the calculated NDF and ADF contents do not include residual ash.
In vitro digestibility analyses involved incubation of herbage samples for 30 h in DAISYII incubator (ANKOM Technology Corp., Macedon, NY, USA) according to the method provided by the manufacturer [49]. Samples were weighted in Ankom F57 bags (0.5 g) in quadruplicate while rumen fluid was collected using an oesophageal probe from three cows grazing the same pasture where samples were collected. Rumen collection was performed following Croatian directives (Animal Protection Act, OG 102/17, and Regulation on the Protection of Animals Used for Scientific Purposes, OG 55/13), corresponding to the European guidelines for the care and use of animals used for scientific purposes. The Bioethics Committee approved the animal procedures used in this study for the protection and welfare of animals at the University of Zagreb Faculty of Agriculture (KLASA 114-01/20-03/07, URBROJ 251-71-29-02/19-20-2). Rumen fluid was handled under constant flushing with CO2 and mixed with buffer solutions A (10 g of KH2PO4, 0.5 g of MgSO4 × 7H2O, 0.5 g of NaCl, 0.1 g of CaCl2 × H2O, and 0.5 g of urea in 1 L of deionised water) and B (15 g of Na2CO3 and 1 g of Na2S × 9H2O in 100 mL of deionised water) just prior to digestion run. After incubation, the bags were washed with cold water and dried at 60 °C for 24 h. All bags were weighted, and in vitro dry matter digestibility (IVDMD) was calculated using the equation provided by the manufacturer. Two bags per sample were ashed according to the method ISO 5984 [46] to determine in vitro organic matter digestibility (IVOMD); the undigested ash was corrected for the ash content of the F57 bags. The other two bags per sample were used to determine undigested NDF according to ISO 16472 [47] and calculate in vitro NDF digestibility (IVNDFD).

2.4. Statistical Analysis

Data were checked for normality before the statistical analysis using the Kolmogorov—Smirnoff test (p > 0.05). WHC, SC, SL, P loss, N loss, C loss, SOM, TN, P2O5, NSC, CSC, ash and CP did not follow the normal distribution. A Box—Cox transformation was applied for WHC, SC, SL, N loss, C loss, NSC, CSC, Ash, CP and log transformation for P loss to meet normality requirements. One-way analysis of variance was carried out to identify differences among treatments. If significant differences were identified at p < 0.05, a Tukey HSD post hoc test was applied. The data presented in Table 1, Table 2, Table 3, Table 4 and Table 5 correspond to the original values. A principal component analysis (PCA) was performed based on the correlation matrix to identify the association between the studied variables. The matrix was rotated using the varimax normalised method. PCA was performed using the Box—Cox transformed data. All statistical tests were carried out using Statistica 12.0 for Windows (StatSoft, Tulsa, OK, USA), while Plotly software (Plotly 4.9.2) was used to generate graphs.

3. Results

3.1. Soil Properties

Table 1 represents the slope characteristics of treatments and grassland management effects on soil physical properties. Heavily grazed treatment had a significantly higher BD than the moderate and no-grazing treatments. BD was as follows: no grazing (1.47 g cm−3) = moderate grazing (1.47 g cm−3) < heavy grazing (1.56 g cm−3). WHC values in the heavy-grazing plots (35.7%) were significantly lower than at the no-grazing plots (41.9%). No significant differences were found in SWC, which varied from 17.3% in the heavy-grazing treatment to 19.5% in the moderate-grazing treatment. MWD and WSA values ranged from 2.80 mm (heavy grazing) to 3.45 mm (moderate grazing) and from 78.4% (heavy grazing) to 92.0% (moderate grazing), respectively. The heavy-grazing treatment had significantly lower MWD than the moderate- and no-grazing treatments. Soil WSA was significantly different among all treatments.
Table 1. The effects of grassland management on soil physical properties.
Treatmentf(x)Slope
°
BD
g cm−3
WHC
% vol
SWC
% vol
MWD
mm
WSA
%
Heavy grazingMean7.6 a1.56 a35.7 b17.3 a2.80 b78.4 c
Min4.01.523.512.32.376.3
Max13.01.640.722.93.381.6
SD3.50.15.53.70.31.9
Moderate grazingMean7.9 a1.47 b39.4 ab19.5 a3.45 a92.0 a
Min5.01.335.917.43.186.8
Max11.01.646.027.43.797.2
SD2.20.13.43.30.23.1
No grazingMean8.0 a1.47 b41.9 a17.8 a3.28 a86.0 b
Min7.01.439.914.43.183.3
Max10.01.643.921.63.789.2
SD1.40.11.42.20.21.9
pns***ns******
*** Statistical significance at p < 0.001. ** Statistical significance at p < 0.01. * Statistical significance at p < 0.05. ns—not significant at p < 0.05. Different letters in the column represent differences in treatment effects at p < 0.05. BD—bulk density; WHC—water-holding capacity; SWC—soil water content; MWD—mean weight diameter; WSA—water-stable aggregates.
Soil chemical properties for the different grassland managements are summarised in Table 2. Soil pH, SOM, TN and P2O5 were significantly affected by grazing treatments. Soil pH was significantly different among all treatments in the following order: no grazing (4.78) < moderate grazing (5.23) < heavy grazing (6.51). SOM and TN were significantly different between heavy grazing and no-grazing treatments as follows: heavy grazing (4.83% SOM; 0.25% TN) ≥ moderate grazing (3.35% SOM; 0.18% TN) ≥ no grazing (2.38% SOM; 0.13% TN). Soil P2O5 ranged from 9.6 at no grazing to 55.0 mg kg−1 in the heavy-grazing treatment. P2O5 values were also significantly different among the heavy grazing and no-grazing treatments.
Table 2. The effects of grassland management on soil chemical properties.
Treatmentf(x)pHSOM
%
TN
%
P2O5
mg kg−1
Heavy grazingMean6.51 a4.83 a0.25 a55.0 a
Min6.104.640.2535.4
Max6.895.030.2765.2
SD0.300.120.019.9
Moderate grazingMean5.23 b3.35 ab0.18 ab20.6 ab
Min4.943.200.1719.7
Max5.413.550.1921.3
SD0.190.110.010.5
No grazingMean4.78 c2.38 b0.13 b9.6 b
Min4.502.250.128.0
max4.992.470.1312.8
SD0.190.070.011.6
p************
*** Statistical significance at p < 0.001. Different letters in the column represent differences in treatment effects at p < 0.05. SOM—soil organic matter; TN—total nitrogen.

3.2. Soil Hydrological Response

The effects of grassland management on hydrological response are shown in Table 3 and Table 4. No significant difference was detected in the PT, RT and Run between treatments, while SC and SL showed different behaviour. Significantly higher values were detected in heavily grazed plots than in moderately grazed or no-grazing plots. The SL values ranged from 8.5 to 58.7 g m−2 in the heavy-grazing plots, from 0.5 to 14.6 g m−2 in the moderate-grazing plots and from 0.6 to 4.7 g m−2 in the no-grazing plots. Carbon, N and P loss were significantly higher in heavily grazed plots than in moderately and ungrazed plots (Table 4). Sediment nutrient concentrations showed a significant difference between all treatments (Table 4). The CSC, NSC and PSC significantly differed among treatments as follows: heavy grazing > moderate grazing > no grazing.
Table 3. The effects of grassland management on overland flow properties.
Treatmentf(x)PT
s
RT
s
Run
L m−2
SC
g L−1
SL
g m−2
Heavy grazingMean360 a577.5 a11.3 a2.94 a32.8 a
Min 300.0420.07.90.968.5
Max 420.0780.014.95.3758.7
SD55.5128.02.31.7018.7
Moderate grazingMean382.5 a570 a10.9 a0.49 b5.9 b
Min 180.0240.05.40.090.5
Max 540.0780.014.51.1214.6
SD119.7187.02.80.405.4
No grazingMean337.5 a435 a11.9 a0.17 b2.3 b
Min 180.0300.07.30.050.6
Max 540.0600.016.60.374.7
SD110.8114.52.60.101.3
pnsnsns******
*** Statistical significance at p < 0.001. ns, not significant at p < 0.05. Different letters in the column represent differences in treatment effects at p < 0.05. PT—time to ponding; RT—time to runoff; Run—runoff; SC—sediment concentration; SL—sediment loss.
Table 4. The effects of grassland management on nutrient losses and sediment chemical properties.
Treatmentf(x)C Loss
g m−2
N Loss
g m−2
P Loss
g m−2
CSC
g kg−1
NSC
g kg−1
PSC
g kg−1
Heavy grazingMean3.87 a0.42 a0.031 a122.0 a13.4 a0.96 a
Min1.160.130.00870.57.20.80
Max6.760.740.057149.517.21.14
SD2.170.240.01826.43.30.12
Moderate grazingMean0.40 b0.04 b0.002 b69.9 b7.8 b0.33 c
Min0.040.000.00053.46.30.08
Max1.190.130.00686.19.40.55
SD0.390.040.00211.81.40.16
No grazingMean0.10 b0.01 b0.001 b43.2 c5.3 c0.50 b
Min0.020.000.00039.34.60.42
Max0.240.030.00351.76.60.56
SD0.070.010.0014.30.70.04
p******************
*** Statistical significance at p < 0.001. Different letters in the column represent differences in treatment effects at p < 0.05. C loss—carbon loss; N loss—nitrogen loss; P loss—phosphorus loss; CSC—carbon sediment concentration; NSC—nitrogen sediment concentration; PSC—phosphorus sediment concentration.

3.3. Biomass Properties and Nutrition

The VC was significantly lower at the heavy-grazing plots than in the no-grazing plots. Herbage biomass production was similar (p > 0.05) among treatments. However, regardless of observed similarity, treatments differed in herbage chemical composition (Table 5). Moderate-grazing herbage had significantly the lowest DM content, which was 65 g kg−1 lower than in no-grazing herbage and 87 g kg−1 in heavy-grazing herbage. The ash content was significantly different between moderate-grazing and no-grazing treatments, while the heavy-grazing treatment was in the middle of their range. The CP and NDF content showed an opposite pattern between treatments. The moderate-grazing herbage had the highest CP (164.0 g kg−1) and the lowest NDF content (405.2 g kg−1), which were opposite in the heavy-grazing and no-grazing treatments (on average 142.6 and 478.7 g kg−1, respectively). Unlike NDF, the ADF content was significantly different between all treatments, with the lowest value in moderate-grazing (267.7 g kg−1) and the highest in the heavy-grazing treatments (377.3 g kg−1). Consistent with differences in herbage chemical composition, treatments differed in IVDMD, IVOMD and IVNDFD (Table 5). Heavy-grazing and moderate-grazing treatments significantly differed in IVDMD and IVOMD, and moderate-grazing herbage had on average 214.1 and 222.2 g kg−1 more digestible DM and organic matter than heavy-grazing herbage, respectively. The IVNDFD was lowest in heavy-grazing treatment (202.1 g kg−1), while moderate-grazing and no-grazing treatments had on average 287.7 g kg−1 more digestible NDF.
Table 5. The effects of grassland management on vegetation cover, biomass production, and herbage chemical composition and digestibility.
Treatmentf(x)VC
%
Biomass
g m−2
DM
g kg−1
AshCPNDFADFIVDMDIVOMDIVNDFD
g kg−1 DMg kg−1
Heavy grazingMean23.9 b126.6 a370.3 a146.5 ab143.5 b473.7 a377.3 a461.0 b412.4 b202.1 b
Min 5.06.4303.0106.6132.2416.2330.9442.0389.1151.7
Max 54.0401.3424.0174.7160.8521.6405.7506.9450.1317.4
SD19.9128.441.321.68.140.827.322.622.250.7
Moderate grazingMean81.9 ab219.0 a282.9 b168.3 a164.0 a405.2 b267.7 c675.1 a634.6 a502.8 a
Min 71.0159.2265.0159.7138.5370.1233.3657.9605.8443.6
Max 89.0350.3313.0174.8184.1421.7294.6705.7667.9557.9
SD6.465.915.34.917.519.422.018.722.233.4
No grazingMean94.9 a175.2 a348.1 a126.5 b141.6 b483.7 a299.7 b612.2 ab576.9 ab476.7 a
Min 90.076.4308.097.6121.1458.0285.6569.7544.8444.6
Max 99.0363.1392.0185.1171.4526.1322.7652.9613.6541.7
SD3.388.332.728.214.523.114.025.222.629.9
p***ns*********************
*** Statistical significance at p < 0.001. ** Statistical significance at p < 0.01. ns—not significant at p < 0.05. Different letters in the column represent differences in treatment effects at p < 0.05. VC—vegetation cover; DM—dry matter; CP—crude protein; NDF—neutral detergent fibre; ADF—acid detergent fibre; IVDMD—in vitro digestibility of dry matter; IVOMD—in vitro digestibility of organic matter; IVNDFD—in vitro digestibility of neutral detergent fibre.

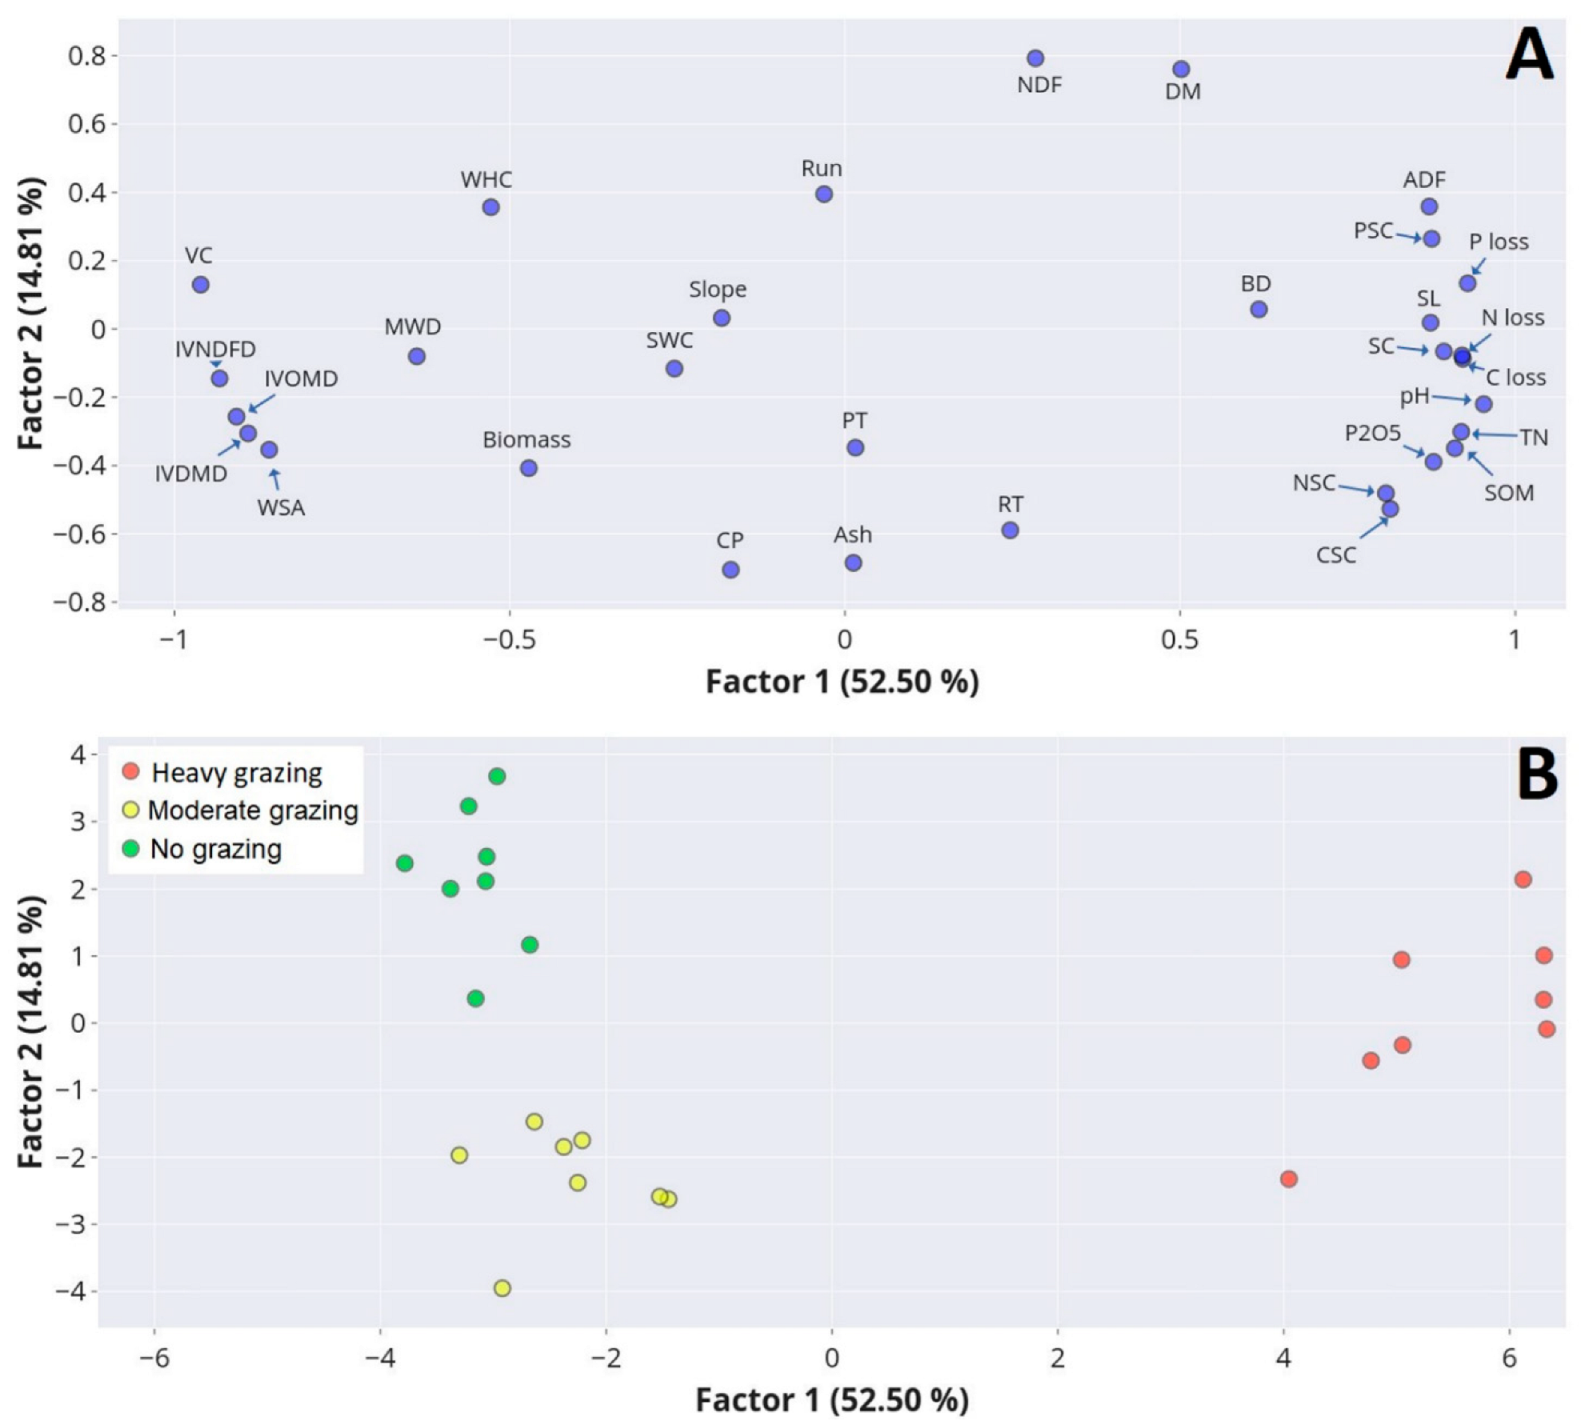
3.4. Principal Component Analysis

The PCA identified four major factors that explained 85.75% of the total variance. Factor 1 explained 52.50%, while Factor 2, Factor 3, Factor 4 and Factor 5 explained 14.81%, 7.95%, 6.12% and 4.37% of the total variance, respectively (Table 6). More than 60% of the variables were explained by factor 1 (Table 7). Factor 1 had high positive loadings in BD, pH, SOM, TN, P2O5, CSC, NSC, PSC, SC, SL, C loss, N loss, P loss and ADF, and high negative for VC, MWD, WSA, IVDMD, IVOMD and IVNDFD (Table 7). Factor 2 had high positive loadings for Run, DM and NDF and high negative loadings for RT, Ash and CP. Factor 3 had high positive loadings in PT, while Factor 4 had positive loadings in slope and WHC and negative in SWC. Finally, Factor 5 had high positive loadings in biomass.
The relationship between Factor 1 and Factor 2 is shown in Figure 2A. The pH, SOM, TN, P2O5, BD, SC, CSC, NSC, PSC, SL, P loss, N loss, C loss and ADF were strongly associated. On the other hand, these variables exhibited the opposite behaviour of WSA, MWD, WHC, VC, IVOMD, IVDMD and IVNDFD. The grassland management showed different effects on investigated properties in all treatments. The impact is visibly different between the heavy grazing and the two remaining treatments (moderate and no grazing). Through higher variability, a higher animal impact on the heavy-grazing treatment compared with moderate- and no-grazing treatments is visible in Figure 2B.

4. Discussion

4.1. Soil Properties

The impact of grazing on soil properties has been studied and it is well known [8,9,10,11,12]. However, the interesting outcome of the present study was the absence of a significant difference between moderately grazed and no-grazing soils in BD, WHC and MWD. Soil physical properties were better in no-grazing and moderate-grazing plots than in heavy-grazing plots. WHC and MWD were higher and BD lower in the no-grazing treatment than in heavy-grazing treatment, which was attributed to a number of processes, including trampling in the heavy-grazing plots and machinery traffic in the no-grazing plots. Moreover, grazing-induced soil compaction on moderate-grazing plots is more widespread and dispersed than the machinery-induced soil compaction caused by tractor traffic in no-grazing plots [50]. This could be a possible reason for the lack of significant differences in WHC, BD and MWD between moderately grazed and no-grazing plots. In addition, the mowing on no-grazing plots was carried out up to three times per year with light tractors. Likely, this frequency and grassland management during the vegetation period (mostly dry period of the year) did not significantly affect topsoil compaction. On the other hand, besides SWC and terrain slope, physical deterioration by cows also depends on the trampling intensity and plant cover [5]. In heavy-grazing plots, trampling intensity was high. At the same time, plant cover was low, showing a high degree of structural degradation due to cows’ pressure, as they have a large hoof surface (between 264 and 460 cm2) and produce pressure between 98 and 192 MPa [51]. Such forces break soil aggregates and reduce MWD. Soil homogenisation by breaking up soil aggregates as a result of grazing leads to SOM losses from the aggregates [52] and is a possible reason for the low WSA at heavily grazed plots.
Grassland management had significant implications on soil chemical status. Such results are expected knowing the fact that livestock modifies chemical fluxes and pH in soil by ingesting nutrients and returning them through excreta. Significantly higher pH, SOM and soil nutrients were observed in heavy-grazing plots compared with no-grazing plots. Previous studies also showed an impact of grazing intensity on many soil properties, such as pH, SOM [53] and nutrient concentrations [54,55]. Soil acidity was higher in no-grazing soils, probably due to (1) a higher return of base nutrients through plant residues and microbial decomposition [56] and (2) an altered balance between the generation and consumption of hydrogen ions in soils during the nutrient cycling process [57]. Results of the present study are consistent with other studies [53,58]. The SOM, TN and P2O5 results agree with Paz-Kagan et al. [54], where all were significantly higher in heavy-grazing plots than under moderate- or no-grazing treatment. Higher stocking density under heavy-grazing treatment was the main reason for the significantly high levels of nutrients and SOM; cows excrete urea and faeces, a source of nitrogen, organic matter and other nutrients, which is higher in areas with higher stocking density. In addition, high SOM in the heavy-grazing treatment was also one reason for the increased pH in this treatment, as observed by Smet and Ward [59].

4.2. Hydrological Response

PT, RT and Run had a similar pattern. All variables showed no significant variation between treatments. Although soil structure [11] and VC [8,60] were key to overland flow behaviour, the absence of significant differences in PT, RT and Run between the treatments in the present study was because the soil on heavy-grazing plots was more covered with faeces compared with other treatments. This increases water retention on sandy [61], sandy loam [62], silty loam [63] or clay loam soil [64]. Moreover, the lack of difference between moderate-grazing and no-grazing plots was due to a similar VC in both treatments. Under conditions where VC was >80%, surface runoff was reduced, and its variability decreased [65]. Besides, both treatments had no difference in most soil physical properties (Table 2), indicating a similar structural condition of the soil and similar infiltration compared to the heavily grazed treatment.
Sediment concentration, SL, C loss, N loss and P loss behaved similarly. They were all significantly higher in the heavy grazing than other treatments, indicating that intensive grazing increases land degradation [54,66]. Heavy grazing resulted in higher losses of sediments and nutrients than moderate and ungrazed plots, which may be attributed to the fact that overgrazing reduces vegetation cover and increases soil compaction, disaggregation and sediment availability for transport [5,15]. Moreover, the soil in the present study was highly susceptible to compaction and erosion [67], resulting in a large difference in SC and SL between heavy-grazing plots with low VC and vegetated moderate and no-grazing plots. Vegetation protects the soil from raindrop impacts, reducing the effects of splash erosion [68]. Previous works also observed a high amount of sediment transported in the heavily grazed plots compared with the less-grazed plots [69,70]. Nutrient losses were consistent with the concentrations in soil between grazing treatments and were reflected in hydrological responses. This was due to the contribution of cattle faeces following the LU/area ratio, while in the no grazed treatment, nutrient concentrations were associated with changes in soil physical properties and thus surface runoff processes [71].

4.3. Herbage Biomass Properties

The grassland management in the present study caused similar production of herbage biomass but different in chemical composition and digestibility. The observed similarity between treatments in herbage biomass production was not expected due to high grazing intensity and low VC in heavily grazed plots. In addition, Dumont et al. [72] showed that, in natural pasture in the upland area of central France, herbage biomass production was higher in moderate-grazing plots than in high-grazing-intensity plots in July, the month when the present study was conducted. Grassland management treatments in the present study showed a wide range of biomass production, and high variability of plots within each treatment was the cause of similarity among treatments. Despite the absence of significant differences, the average value of herbage biomass production was twice as high for moderately grazed plots than for heavily grazed plots.
The observed high variability in chemical composition and digestibility (Table 5) is the main characteristic of grasslands due to herbage community composition, season, soil composition, fertilisation level, growth stage and grassland management [23,28,73]. The average nutrient contents and digestibilities are within the range of values reported in the INRA dataset [74] for permanent lowland pastures in July. Moderate-grazing plots distinguished from heavy- and no-grazing plots in most chemical properties determined. The higher CP and lower fibre contents are associated with the higher nutritional value of herbage, and thus, moderate-grazing treatment resulted in herbage of higher quality than the heavy- or no-grazing treatments [29]. Lower DM, NDF and ADF and higher CP in herbage from moderate-grazing plots resulted from the regrowth of new plant tissue after grazing, as previously reported by Turner et al. [75]. This effect of plant regrowth was not observed in heavily and ungrazed plots. In heavily grazed plots, there was a greater reduction in the proportion of edible herbage and a higher proportion of less palatable plants [30], and in ungrazed plots, due to longer regrowth intervals [26]. The CP decreases while fibre content, both in terms of NDF and ADF, increases with plant maturity, as shown by Elgersma and Søegaard [27] for individual grass and legume species.
In contrast to DM and fibre content, the current study showed a higher ash content in moderate-grazing than in no-grazing plots. Since less mature plants have lower ash content [76], as in no-grazing plots in the present study, contamination with soil particles could be the reason for higher content in moderate-grazing plots. Soil particles adhere to leaves and stems of vegetation cover [77]. In addition, soil contamination from cow trampling and reduction in herbage biomass [77] was a possible reason for increased ash content in heavily grazed plots.
Besides chemical composition, digestibility is an essential aspect of the herbage nutritional value. It indicates the proportion of the total nutrient content available for absorption by the animal after digestion. Previous studies have shown that the defoliation regime has no effect on DM or organic matter digestibility of herbage [26,78], and observed similarity between moderate-grazing and no-grazing plots in the present study is consistent with these previous findings. Furthermore, the difference between the heavy and moderate-grazing treatments was likely due to a difference in chemical composition—IVDMD and IVOMD decreased with the increasing NDF content [27,79]. The younger herbage has a higher leaf-to-stem ratio associated with higher digestibility [27], consistent with the regrowth of new plant tissue after grazing in moderate-grazing plots. The highest ADF supported the lower leaf-to-stem ratio in heavily grazed plots among treatments; higher ADF implies higher lignin content, which is negatively correlated with IVNDFD [80].

4.4. Association between Properties

The PCA (Figure 2A) revealed that pH, SOM, TN, P2O5, BD, SC, CSC, NSC, PSC, SL, P loss, N loss, C loss, and ADF were strongly associated and showed the opposite behaviour of WSA, MWD, WHC, VC, IVOMD, IVDMD, IVNDFD, biomass and SWC. This is partially consistent with other findings since high SOM concentration in soils increases WSA and MWD, positively affecting the WHC [62,63]. The present study showed the opposite, which is most likely due to the high organic matter content on heavy-grazing plots due to cow faeces (Table 1) at the moment of rainfall simulation experiments. SOM is known to act as a major source of nutrients [81], and it is positively associated with TN, P2O5, NSC, PSC and CSC. As confirmed in this study, highly compacted grasslands are recognised as more susceptible to soil loss and lose more soil nutrients [70,82]. High BD modifies the pore system, decreases the medium-sized pores that retain soil water, and explains the negative relationships between BD, WHC and SWC. On the other hand, VC was negatively related to BD and positively related to WHC, MWD, WSA and biomass. High VC increases root development, soil biological activity and structure, increasing MWD and WSA [1,42]. High SC and SL are attributed to overgrazing that generally reduces the VC and the size of MWD and WSA [51,82] and increases the susceptibility of soil detachment by raindrops. This is particularly evident in soils with low VC [83], as observed in heavy-grazing plots. The SC and nutrients concertation in sediments were strongly associated with the content of the same nutrients in the soil as observed elsewhere [69]. Overall, grassland management is crucial in controlling erosion and nutrient losses. PCA-obtained relationship between Factor 1 and Factor 2 also showed interrelations between soil properties and herbage nutritional value. ADF was positively associated with BD and negatively with VC, most likely due to the older vegetation composition of less palatable plants on more compacted, heavily grazed plots. High BD had a negative effect on vegetation growth, which was expected since soil compaction reduces root growth and the capacity of roots to uptake water and nutrients. Vegetation on compacted soils regrows slowly [5], so the remaining species (most of which were not palatable for consumption by cows) were older than in moderate-grazing and no-grazing plots and could be a reason for the highest ADF content among treatments.
IVNDFD, IVOMD and IVDMD were positively related to biomass, VC, MWD and WSA and negatively related to BD, pH and SOM. The nature of these interrelations was complex and not studied before. Structured soils on no-grazing and moderate-grazing plots improved the vegetation cover and biomass production while trimming and moderate-grazing positively supported regrowth of new plant tissue that is more digestible and therefore had higher IVNDFD, IVOMD and IVDMD [84]. Regrowth of new plant tissue or even young plants are almost absent in the structurally deteriorated heavy-grazing treatment, so IVNDFD, IVOMD and IVDMD values were lower than in no-grazing or moderate-grazing plots. On the other hand, cow behaviour was probably the reason for the negative relationships between IVNDFD, IVOMD, IVDMD, biomass and VC on one side and BD, pH, TN and P2O5 on the other. As mentioned earlier, cow trampling in heavy-grazing treatment overturned the usually positive effect of nutrient-rich soils in increasing vegetation cover and biomass production. Instead, such soils were compacted, with low vegetation cover and covered mostly with older plants that were not palatable to the cows, possibly explaining the negative relationship of BD, pH, TN and P2O5 with IVNDFD, IVOMD and IVDMD values.

4.5. Uncertainties and Limitations of the Study

The present study results clearly show the effects of grassland management on soil properties and hydrological response, as well as on herbage nutritional value. Furthermore, the study provides valuable insight into relationships between soil properties and herbage nutritional value under different grassland management systems. However, several uncertainties and limitations of the research should be presented and discussed. Uncertainties and limitations in the experimental setup, in situ measurements and herbage sampling are recognised as disputable points in the present paper. The experimental setup limitation is related to the mechanically managed grassland (no-grazing treatment). The selection of the area presenting the no-grazing treatment was driven by proximity to the grazing area [1], so grassland without access to livestock was selected. The Croatian environment lacks natural grasslands because they are dominantly under the forest biome. Therefore, grassland management is usually carried out with machinery to obtain fodder and reduce the afforestation process, which occurs rapidly in semi-humid conditions [85]. Although the influence of tractors is usually associated with their axle load and frequency [5], this study showed that the negative effect of tractor circulation in no-grazing plots was lower than grazing in heavy- and moderate-grazing plots.
Other uncertainties were related to the in situ measurements. Rainfall simulations are widely used in soil and hydrological sciences. However, standardising this tool at the international level is crucial to ensure proper comparability of results extrapolated at scales greater than 1 m2 [86]. Installing permanent plots and measuring annual erosion rates using the USLE standard was not feasible due to the heterogeneity of the terrain, so the use of rainfall simulators to measure potential erodibility was desirable. In contrast, the installation of permanent plots on multiple sites could introduce further uncertainty regarding topographical conditions, which are desirable to be similar for this type of work. Secondly, the sampling of vegetation biomass was conducted close to the rainfall simulation plots to avoid contamination of herbage samples with soil particles. Although the most representative herbage sample would be collected in the same plot, this could only be achieved after the rainfall simulation. Otherwise, removal of the biomass would affect the VC and hydrological response of the plot during rainfall simulation measurements. However, herbage sampling after rainfall simulations would not ensure uncontaminated samples because raindrops affect the topsoil and detached particles contaminate biomass [87], which could significantly increase the ash values during herbage analysis.

4.6. Implications for Land Management

The different grassland management approaches indicated future management directions under current pedological, environmental and management conditions. The study results support that the current system with moderate grazing intensity was not harmful to the environment. Moreover, actual losses in the moderately grazed plots were entirely sustainable since soil tolerance level and rainstorm returning ratio [68] did not exceed the rate higher than 59 kg ha−1 (min 5 kg ha−1, max 146 kg ha−1) when extrapolated on the hectare level. However, better management is needed to decrease erosion and runoff in heavily grazed areas. In heavily grazed plots, high concentrations of nutrients and organic matter did not override the negative effect of cow grazing on vegetation regrowth, biomass production or nutritional value of herbage. Such a condition is ecologically unsustainable, and the adoption of rotational grazing management is a desirable alternative. In general, rotational grazing in different environments reduces compaction and increases SOM and biomass production [1] in comparison with continuous grazing. Moreover, future restoration strategies on degraded areas could be a mixture of measures such as seeding grasses on bare heavily grazed areas, increasing the diversity of resting places, or occasionally fencing (grazing exclusion) the endangered areas to allow natural vegetation to recover.

5. Conclusions

Heavy grazing increases soil compaction, structural deterioration, soil erosion and nutrient losses compared with moderate grazing and no grazing. The moderate-grazing treatment had a higher herbage quality than the no-grazing and heavy-grazing treatments. However, this depends more on cow grazing behaviour and regrowth of new plant tissue than on soil physical and chemical properties. Different grassland managements affect herbage chemical composition. Increased ash content in the vegetation of heavily and moderately grazed plots showed that cow trampling and biomass reduction increased herbage ash content through contamination with soil particles. This study demonstrates that a moderate-grazing system does not cause severe soil erosion and does not reduce land productivity. In conclusion, switching to different grazing management and adopting environmental protection measures on heavily grazed areas could ensure grassland sustainability by reducing soil and nutrient losses and increasing vegetation cover, biomass production, and the herbage nutritional value.

Author Contributions

Conceptualization, I.B. and K.K.; methodology, K.K.; validation, P.P., L.J.T. and K.K.; formal analysis, I.B.; investigation, K.K.; writing—original draft preparation, I.B. and K.K.; writing—review and editing, P.P., I.K., I.D., D.G., M.D. and M.K.S.; visualization, L.J.T.; supervision, I.B.; project administration, I.B.; funding acquisition, I.B. All authors have read and agreed to the published version of the manuscript.

Funding

This work was supported by the Croatian Science Foundation through the project “Soil erosion and degradation in Croatia” (UIP-2017-05-7834) (SEDCRO). The publication was supported by the Open Access Publication Fund of the University of Zagreb Faculty of Agriculture.

Institutional Review Board Statement

The study was conducted according to the Croatian directives which correspond to the European guidelines for the care and use of animals used for scientific purposes and approved by the Bioethics Committee for the protection and welfare of animals at the University of Zagreb Faculty of Agriculture (KLASA 114-01/20-03/07, URBROJ 251-71-29-02/19-20-2).

Informed Consent Statement

Not applicable.

Data Availability Statement

Data are available on request.

Acknowledgments

Aleksandra Percin, is acknowledged for her cooperation during the laboratory work, and Antun Kostelić, for rumen sampling. The authors are grateful for the support of Family farm Nataša Vujec from Mala Jasenovača.

Conflicts of Interest

The authors declare no conflict of interest.

References

  1. Byrnes, R.C.; Eastburn, D.J.; Tate, K.W.; Roche, L.M. A global meta-analysis of grazing impacts on soil health indicators. J. Environ. Qual. 2018, 47, 758–765. [Google Scholar] [CrossRef] [PubMed] [Green Version]
  2. Estel, S.; Mader, S.; Levers, C.; Verburg, P.H.; Baumann, M.; Kuemmerle, T. Combining satellite data and agricultural statistics to map grassland management intensity in Europe. Environ. Res. Lett. 2018, 13, 074020. [Google Scholar] [CrossRef]
  3. Pulido, M.; Barrena-González, J.; Badgery, W.; Rodrigo-Comino, J.; Cerdà, A. Sustainable grazing. Curr. Opin. Environ. Sci. Health. 2018, 5, 42–46. [Google Scholar] [CrossRef]
  4. Allan, E.; Bossdorf, O.; Dormann, C.F.; Prati, D.; Gossner, M.M.; Tscharntke, T.; Blüthgen, N.; Bellach, M.; Birkhofer, K.; Boch, S.; et al. Interannual variation in land-use intensity enhances grassland multidiversity. Proc. Natl. Acad. Sci. USA 2014, 111, 308–313. [Google Scholar] [CrossRef] [Green Version]
  5. Nawaz, M.F.; Bourrie, G.; Trolard, F. Soil compaction impact and modelling. A review. Agron. Sustain. Dev. 2013, 33, 291–309. [Google Scholar] [CrossRef] [Green Version]
  6. Mayel, S.; Jarrah, M.; Kuka, K. How does grassland management affect physical and biochemical properties of temperate grassland soils? A review study. Grass Forage Sci. 2021, 76, 215–244. [Google Scholar] [CrossRef]
  7. McElwee, P.; Calvin, K.; Campbell, D.; Cherubini, F.; Grassi, G.; Korotkov, V.; Hoang, A.L.; Lwasa, S.; Nkem, J.; Nkonya, E.; et al. The impact of interventions in the global land and agri-food sectors on Nature’s Contributions to People and the UN Sustainable Development Goals. Glob. Chang. Biol. 2020, 26, 4691–4721. [Google Scholar] [CrossRef]
  8. Mayerhofer, C.; Meißl, G.; Klebinder, K.; Kohl, B.; Markart, G. Comparison of the results of a small-plot and a large-plot rainfall simulator—Effects of land use and land cover on surface runoff in Alpine catchments. Catena 2017, 156, 184–196. [Google Scholar] [CrossRef]
  9. Negrón, M.; López, I.; Dörner, J. Consequences of intensive grazing by dairy cows of contrasting live weights on volcanic ash topsoil structure and pasture dynamics. Soil Till. Res. 2019, 189, 88–97. [Google Scholar] [CrossRef]
  10. Dlamini, P.; Chivenge, P.; Chaplot, V. Overgrazing decreases soil organic carbon stocks the most under dry climates and low soil pH: A meta-analysis shows. Agric. Ecosyst. Environ. 2016, 221, 258–269. [Google Scholar] [CrossRef]
  11. Litt, G.F.; Ogden, F.L.; Mojica, A.; Hendrickx, J.M.; Kempema, E.W.; Gardner, C.B.; Bretfeld, M.; Regina, J.A.; Harrison, J.B.J.; Cheng, Y.; et al. Land cover effects on soil infiltration capacity measured using plot scale rainfall simulation in steep tropical lowlands of Central Panama. Hydrol. Process. 2020, 34, 878–897. [Google Scholar] [CrossRef]
  12. Gan, L.; Peng, X.; Peth, S.; Horn, R. Effects of grazing intensity on soil thermal properties and heat flux under Leymus chinensis and Stipa grandis vegetation in Inner Mongolia, China. Soil Till. Res. 2012, 118, 147–158. [Google Scholar] [CrossRef]
  13. Roth, C.H. A framework relating soil surface condition to infiltration and sediment and nutrient mobilisation in grazed rangelands of northeastern Queensland, Australia. Aust. Earth Surf. Process Landf. 2004, 29, 1093–1104. [Google Scholar] [CrossRef]
  14. Cipriotti, P.A.; Aguiar, M.R.; Wiegand, T.; Paruelo, J.M. Combined effects of grazing management and climate on semi-arid steppes: Hysteresis dynamics prevent recovery of degraded rangelands. J. Appl. Ecol. 2019, 56, 2155–2165. [Google Scholar] [CrossRef]
  15. Pulido, M.; Schnabel, S.; Lavado Contador, J.F.; Lozano-Parra, J.; González, F. The impact of heavy grazing on soil quality and pasture production in rangelands of SW Spain. Land Degrad. Dev. 2018, 29, 219–230. [Google Scholar] [CrossRef]
  16. Henkin, Z.; Ungar, E.D.; Dvash, L.; Perevolotsky, A.; Yehuda, Y.; Sternberg, M.; Voet, H.; Landau, S.Y. Effects of cattle grazing on herbage quality in a herbaceous Mediterranean rangeland. Grass Forage Sci. 2011, 66, 516–525. [Google Scholar] [CrossRef]
  17. Reszkowska, A.; Krümmelbein, J.; Peth, S.; Horn, R.; Zhao, Y.; Gan, L. Influence of grazing on hydraulic and mechanical properties of semiarid steppe soils under different vegetation type in Inner Mongolia, China. Plant Soil 2011, 340, 59–72. [Google Scholar] [CrossRef]
  18. Kotzé, E.; Sandhage-Hofmann, A.; Meinel, J.A.; Du Preez, C.C.; Amelung, W. Rangeland management impacts on the properties of clayey soils along grazing gradients in the semi-arid grassland biome of South Africa. J. Arid Environ. 2013, 97, 220–229. [Google Scholar] [CrossRef]
  19. Morgan, R.P.C.; McIntyre, K.; Vickers, A.W.; Quinton, J.N.; Rickson, R.J. A rainfall simulation study of soil erosion on rangeland in Swaziland. Soil Technol. 1997, 11, 291–299. [Google Scholar] [CrossRef]
  20. Sadeghi, S.H.R.; Vangah, B.G.; Safaeeian, N.A. Comparison between effects of open grazing and manual harvesting of cultivated summer rangelands of northern Iran on infiltration, runoff and sediment yield. Land Degrad. Dev. 2007, 18, 608–620. [Google Scholar] [CrossRef]
  21. Oldeman, L.R. The global extent of soil degradation. In Soil Resilience and Sustainable Land Use; Greenland, D.J., Szabolcs, I., Eds.; CAB International: Wallingford, UK, 1994; pp. 19–36. [Google Scholar]
  22. Abu Hammad, A.; Tumeizi, A. Land degradation: Socioeconomic and environmental causes and consequences in the eastern Mediterranean. Land Degrad. Dev. 2012, 23, 216–226. [Google Scholar] [CrossRef]
  23. Grace, C.; Boland, T.M.; Sheridan, H.; Brennan, E.; Fritch, R.; Lynch, M.B. The effect of grazing versus cutting on dry matter production of multispecies and perennial ryegrass-only swards. Grass Forage Sci. 2019, 74, 437–449. [Google Scholar] [CrossRef]
  24. Tälle, M.; Deák, B.; Poschlod, P.; Valkó, O.; Westerberg, L.; Milberg, P. Grazing vs. mowing: A meta-analysis of biodiversity benefits for grassland management. Agric. Ecosyst. Environ. 2016, 222, 200–212. [Google Scholar] [CrossRef]
  25. Mládková, P.; Mládek, J.; Hejduk, S.; Hejcman, M.; Cruz, P.; Jouany, C.; Pakeman, R.J. High-nature-value grasslands have the capacity to cope with nutrient impoverishment induced by mowing and livestock grazing. J. Appl. Ecol. 2015, 52, 1073–1081. [Google Scholar] [CrossRef]
  26. Bryant, R.H.; Edwards, P.; Kay, J.; Clement, A.; Thomas, C. Change in herbage nutritive value of mown and standing pasture under rotational grazing. N. Z. J. Anim. Sci. Prod. 2019, 79, 103–107. [Google Scholar]
  27. Elgersma, A.; Søegaard, K. Changes in nutritive value and herbage yield during extended growth intervals in grass—Legume mixtures: Effects of species, maturity at harvest, and relationships between productivity and components of feed quality. Grass Forage Sci. 2018, 73, 78–93. [Google Scholar] [CrossRef]
  28. Pontes, L.D.S.; Carrère, P.; Andueza, D.; Louault, F.; Soussana, J.F. Seasonal productivity and nutritive value of temperate grasses found in semi-natural pastures in Europe: Responses to cutting frequency and N supply. Grass Forage Sci. 2007, 62, 485–496. [Google Scholar] [CrossRef]
  29. Pavlů, V.; Hejcman, M.; Pavlů, L.; Gaisler, J.; Nežerková, P. Effect of continuous grazing on forage quality, quantity and animal performance. Agric. Ecosyst. Environ. 2006, 113, 349–355. [Google Scholar] [CrossRef]
  30. Xiao, X.; Zhang, T.; Peter Angerer, J.; Hou, F. Grazing seasons and stocking rates affects the relationship between herbage traits of alpine meadow and grazing behaviors of Tibetan Sheep in the Qinghai—Tibetan Plateau. Animals 2020, 10, 488. [Google Scholar] [CrossRef] [Green Version]
  31. Biró, M.; Molnár, Z.; Babai, D.; Dénes, A.; Fehér, A.; Barta, S.; Sáfián, L.; Szabados, K.; Kiš, A.; Demeter, L.; et al. Reviewing historical traditional knowledge for innovative conservation management: A re-evaluation of wetland grazing. Sci. Total Environ. 2019, 666, 1114–1125. [Google Scholar] [CrossRef] [Green Version]
  32. Ivanković, A.; Štoković, I.; Barać, Z. Adjustment of cattle and sheep production in Croatia to the economic and market environment. In Cattle Husbandry in Eastern Europe and China: Structure, Development Paths and Optimisation; Kuipers, A., Rozstalnyy, A., Keane, G., Eds.; Wageningen Academic Publishers: Wageningen, The Netherlands, 2014; pp. 213–221. [Google Scholar]
  33. Varga, A.; Molnár, Z.; Biró, M.; Demeter, L.; Gellény, K.; Miókovics, E.; Molnár, A.; Molnár, K.; Ujházy, N.; Ulicsni, V.; et al. Changing year-round habitat use of extensively grazing cattle, sheep and pigs in East-Central Europe between 1940 and 2014: Consequences for conservation and policy. Agric. Ecosyst. Environ. 2016, 234, 142–153. [Google Scholar] [CrossRef] [Green Version]
  34. Lal, R. Eco-intensification through soil carbon sequestration: Harnessing ecosystem services and advancing sustainable development goals. J. Soil Water Conserv. 2019, 74, 55A–61A. [Google Scholar] [CrossRef] [Green Version]
  35. Sollenberger, L.E.; Kohmann, M.M.; Dubeux, J.C., Jr.; Silveira, M.L. Grassland management affects delivery of regulating and supporting ecosystem services. Crop Sci. 2019, 59, 441–459. [Google Scholar] [CrossRef]
  36. Veerman, C.; Pinto Correia, T.; Bastioli, C.; Biro, B.; Bouma, J.; Cienciela, E. Caring for Soil is Caring for Life; Publications Office of the European Union: Luxembourg, 2020. [Google Scholar]
  37. Beck, H.E.; Zimmermann, N.E.; McVicar, T.R.; Vergopolan, N.; Berg, A.; Wood, E.F. Present and future Köppen-Geiger climate classification maps at 1-km resolution. Sci. Data 2018, 5, 180214. [Google Scholar] [CrossRef] [PubMed] [Green Version]
  38. IUSS-WRB. World Reference Base for Soil Resources 2014, Update 2015: International Soil Classification System for Naming Soils and Creating Legends for Soil Maps; World Soil Resources Reports No. 106; Food and Agriculture Organization of the United Nations: Rome, Italy, 2015. [Google Scholar]
  39. Bogunovic, I.; Telak, L.J.; Pereira, P. Experimental comparison of runoff generation and initial soil erosion between vineyards and croplands of Eastern Croatia: A case study. Air Soil Water Res. 2020, 13, 1178622120928323. [Google Scholar] [CrossRef]
  40. Croatian Meteorological and Hydrological Service. 2021. Available online: https://meteo.hr/proizvodi_e.php?section=proizvodi_usluge&param=services (accessed on 10 May 2021).
  41. Dane, J.H.; Topp, C.G. Methods of Soil Analysis, Part 4: Physical Methods; John Wiley & Sons: Hoboken, NJ, USA, 2020; Volume 20. [Google Scholar]
  42. Le Bissonnais, Y.L. Aggregate stability and assessment of soil crustability and erodibility: I. Theory and methodology. Eur. J. Soil Sci. 1996, 47, 425–437. [Google Scholar] [CrossRef]
  43. Kemper, W.D.; Rosenau, R.C. Aggregate stability and size distribution. Methods Soil Anal. Part 1 Phys. Mineral. Methods 1986, 5, 425–442. [Google Scholar] [CrossRef]
  44. Walkley, A.; Black, I.A. An examination of the Degtjareff method for determining soil organic matter, and a proposed modification of the chromic acid titration method. Soil Sci. 1934, 37, 29–38. [Google Scholar] [CrossRef]
  45. Egnér, H.; Riehm, H.; Domingo, W.R. Untersuchungen über die chemische Bodenanalyse als Grundlage für die Beurteilung des Nährstoffzustandes der Böden. II. Chemische Extraktionsmethoden zur Phosphor-und Kaliumbestimmung. Lantbr. Ann. 1960, 26, 199–215. [Google Scholar]
  46. ISO 5984; Animal Feeding Stuffs—Determination of Crude Ash. International Organization for Standardization: Geneva, Switzerland, 2002.
  47. ISO 16472; Animal Feeding Stuffs—Determination of Amylase-Treated Neutral Detergent Fibre Content (aNDF). International Organization for Standardization: Geneva, Switzerland, 2006.
  48. ISO 13906; Animal Feeding Stuffs—Determination of Acid Detergent Fibre (ADF) and Acid Detergent Lignin (ADL) Contents. International Organization for Standardization: Geneva, Switzerland, 2008.
  49. ANKOM Technology. In Vitro True Digestibility Using the DAISY Incubator. 2017. Available online: https://www.ankom.com/sites/default/files/document-files/Method_3_Invitro_D200_D200I.pdf (accessed on 6 April 2020).
  50. Sigua, G.C.; Coleman, S.W. Long-term effect of cow congregation zone on soil penetrometer resistance: Implications for soils and forage quality. Agron. Sustain. Dev. 2009, 29, 517–523. [Google Scholar] [CrossRef] [Green Version]
  51. Greenwood, K.; McKenzie, B.M. Grazing effects on soil physical properties and the consequences for pastures: A review. Aust. J. Exp. Agric. 2001, 41, 1231–1250. [Google Scholar] [CrossRef]
  52. Lu, X.; Kelsey, K.C.; Yan, Y.; Sun, J.; Wang, X.; Cheng, G.; Neff, J.C. Effects of grazing on ecosystem structure and function of alpine grasslands in Qinghai—Tibetan Plateau: A synthesis. Ecosphere 2017, 8, e01656. [Google Scholar] [CrossRef]
  53. Hong, J.; Xu, X.; Pang, B.; Ma, X.; Wang, X. Significant soil acidification caused by grazing exclusion across China’s grassland areas. Land Degrad. Dev. 2021, 32, 535–545. [Google Scholar] [CrossRef]
  54. Paz-Kagan, T.; Ohana-Levi, N.; Herrmann, I.; Zaady, E.; Henkin, Z.; Karnieli, A. Grazing intensity effects on soil quality: A spatial analysis of a Mediterranean grassland. Catena 2016, 146, 100–110. [Google Scholar] [CrossRef]
  55. Perkins, J.S.; Thomas, D.S.G. Spreading deserts or spatially confined environmental impacts? Land degradation and cattle ranching in the Kalahari desert of Botswana. Land Degrad. Dev. 1993, 4, 179–194. [Google Scholar] [CrossRef]
  56. McLaughlin, M.J.; Baker, T.G.; James, T.R.; Rundle, J.A. Distribution and forms of phosphorus and aluminum in acidic topsoils under pastures in south-eastern Australia. Soil Res. 1990, 28, 371–385. [Google Scholar] [CrossRef]
  57. Rukshana, F.; Butterly, C.R.; Xu, J.M.; Baldock, J.A.; Tang, C. Organic anion-to-acid ratio influences pH change of soils differing in initial pH. J. Soils Sediments 2014, 14, 407–414. [Google Scholar] [CrossRef]
  58. Martins, A.P.; de Andrade Costa, S.E.V.; Anghinoni, I.; Kunrath, T.R.; Balerini, F.; Cecagno, D.; Carvalho, P.C.D.F. Soil acidification and basic cation use efficiency in an integrated no-till crop—Livestock system under different grazing intensities. Agric. Ecosyst. Environ. 2014, 195, 18–28. [Google Scholar] [CrossRef]
  59. Smet, M.; Ward, D. Soil quality gradients around water-points under different management systems in a semi-arid savanna, South Africa. J. Arid Environ. 2006, 64, 251–269. [Google Scholar] [CrossRef]
  60. Elwell, H.A.; Stocking, M.A. Vegetal cover to estimate soil erosion hazard in Rhodesia. Geoderma 1976, 15, 61–70. [Google Scholar] [CrossRef]
  61. Nyamangara, J.; Gotosa, J.; Mpofu, S.E. Cattle manure effects on structural stability and water retention capacity of a granitic sandy soil in Zimbabwe. Soil Till. Res. 2001, 62, 157–162. [Google Scholar] [CrossRef]
  62. Blanco-Canqui, H.; Hergert, G.W.; Nielsen, R.A. Cattle manure application reduces soil compactibility and increases water retention after 71 years. Soil Sci. Soc. Am. J. 2015, 79, 212–223. [Google Scholar] [CrossRef]
  63. Arriaga, F.J.; Lowery, B. Soil physical properties and crop productivity of an eroded soil amended with cattle manure. Soil Sci. 2003, 168, 888–899. [Google Scholar] [CrossRef] [Green Version]
  64. Miller, J.J.; Sweetland, N.J.; Chang, C. Hydrological properties of a clay loam soil after long-term cattle manure application. J. Environ. Qual. 2002, 31, 989–996. [Google Scholar] [CrossRef] [PubMed]
  65. Cerda, A. Parent material and vegetation affect soil erosion in eastern Spain. Soil Sci. Soc. Am. J. 1999, 63, 362–368. [Google Scholar] [CrossRef]
  66. Adimassu, Z.; Tamene, L.; Degefie, D.T. The influence of grazing and cultivation on runoff, soil erosion, and soil nutrient export in the central highlands of Ethiopia. Ecol. Process. 2020, 9, 23. [Google Scholar] [CrossRef]
  67. Bogunovic, I.; Pereira, P.; Kisic, I.; Sajko, K.; Sraka, M. Tillage management impacts on soil compaction, erosion and crop yield in Stagnosols (Croatia). Catena 2018, 160, 376–384. [Google Scholar] [CrossRef]
  68. Panagos, P.; Borrelli, P.; Poesen, J.; Ballabio, C.; Lugato, E.; Meusburger, K.; Montanarella, L.; Alewell, C. The new assessment of soil loss by water erosion in Europe. Environ. Sci. Policy 2015, 54, 438–447. [Google Scholar] [CrossRef]
  69. Elliott, A.H.; Carlson, W.T. Effects of sheep grazing episodes on sediment and nutrient loss in overland flow. Soil Res. 2004, 42, 213–220. [Google Scholar] [CrossRef]
  70. Kairis, O.; Karavitis, C.; Salvati, L.; Kounalaki, A.; Kosmas, K. Exploring the impact of overgrazing on soil erosion and land degradation in a dry Mediterranean agro-forest landscape (Crete, Greece). Arid Land Res. Manag. 2015, 29, 360–374. [Google Scholar] [CrossRef]
  71. Cournane, F.C.; McDowell, R.; Littlejohn, R.; Condron, L. Effects of cattle, sheep and deer grazing on soil physical quality and losses of phosphorus and suspended sediment losses in surface runoff. Agric. Ecosyst. Environ. 2011, 140, 264–272. [Google Scholar] [CrossRef]
  72. Dumont, B.; Garel, J.P.; Ginane, C.; Decuq, F.; Farruggia, A.; Pradel, P.; Rigolot, C.; Petit, M. Effect of cattle grazing a species-rich mountain pasture under different stocking rates on the dynamics of diet selection and sward structure. Animal 2007, 1, 1042–1052. [Google Scholar] [CrossRef] [PubMed] [Green Version]
  73. Shakhane, L.M.; Mulcahy, C.; Scott, J.M.; Hinch, G.N.; Donald, G.E.; Mackay, D.F. Pasture herbage mass, quality and growth in response to three whole-farmlet management systems. Anim. Prod. Sci. 2013, 53, 685–698. [Google Scholar] [CrossRef] [Green Version]
  74. INRA. INRA Feeding System for Ruminants, 2nd ed.; Wageningen Academic Publishers: Wageningen, The Netherlands, 2019. [Google Scholar]
  75. Turner, L.R.; Donaghy, D.J.; Lane, P.A.; Rawnsley, R.P. Effect of defoliation management, based on leaf stage, on perennial ryegrass (Lolium perenne L.), prairie grass (Bromus willdenowii Kunth.) and cocksfoot (Dactylis glomerata L.) under dryland conditions. 1. Regrowth, tillering and water-soluble carbohydrate concentration. Grass Forage Sci. 2006, 61, 164–174. [Google Scholar] [CrossRef]
  76. Elgersma, A.; Søegaard, K. Effects of species diversity on seasonal variation in herbage yield and nutritive value of seven binary grass-legume mixtures and pure grass under cutting. Eur. J. Agron. 2016, 78, 73–83. [Google Scholar] [CrossRef]
  77. Collas, C.; Mahieu, M.; Badot, P.M.; Crini, N.; Rychen, G.; Feidt, C.; Jurjanz, S. Dynamics of soil ingestion by growing bulls during grazing on a high sward height in the French West Indies. Sci. Rep. 2020, 10, 17231. [Google Scholar] [CrossRef]
  78. Cashman, P.A.; McEvoy, M.; Gilliland, T.J.; O’Donovan, M. A comparison between cutting and animal grazing for dry-matter yield, quality and tiller density of perennial ryegrass cultivars. Grass Forage Sci. 2016, 71, 112–122. [Google Scholar] [CrossRef]
  79. Roukos, C.; Papanikolaou, K.; Karalazos, A.; Chatzipanagiotou, A.; Mountousis, I.; Mygdalia, A. Changes in nutritional quality of herbage botanical components on a mountain side grassland in North-West Greece. Anim. Feed Sci. Technol. 2011, 169, 24–34. [Google Scholar] [CrossRef]
  80. Raffrenato, E.; Fievisohn, R.; Cotanch, K.W.; Grant, R.J.; Chase, L.E.; Van Amburgh, M.E. Effect of lignin linkages with other plant cell wall components on in vitro and in vivo neutral detergent fiber digestibility and rate of digestion of grass forages. J. Dairy Sci. 2017, 100, 8119–8131. [Google Scholar] [CrossRef] [Green Version]
  81. Bot, A.; Benites, J. The Importance of Soil Organic Matter: Key to Drought-Resistant Soil and Sustained Food Production; No. 80; Food and Agriculture Organization of the United Nations: Rome, Italy, 2015. [Google Scholar]
  82. Bilotta, G.S.; Brazier, R.E.; Haygarth, P.M. The impacts of grazing animals on the quality of soils, vegetation, and surface waters in intensively managed grasslands. Adv. Agron. 2007, 94, 237–280. [Google Scholar] [CrossRef]
  83. Liu, J.X.; Liu, G.B.; Flanagan, D.C.; Wang, B.; Wang, Z.Y.; Xiao, J. Effects of soil-incorporated plant litter morphological characteristics on the soil detachment process in grassland on the Loess Plateau of China. Sci. Total Environ. 2020, 705, 134651. [Google Scholar] [CrossRef] [PubMed]
  84. Chapman, D.F.; Tharmaraj, J.; Agnusdei, M.; Hill, J. Regrowth dynamics and grazing decision rules: Further analysis for dairy production systems based on perennial ryegrass (Lolium perenne L.) pastures. Grass Forage Sci. 2012, 67, 77–95. [Google Scholar] [CrossRef]
  85. Bašić, F. The Soils of Croatia; Springer: Dordrecht, The Netherlands; Heidelberg, Germany; New York, NY, USA; London, UK, 2013. [Google Scholar]
  86. Telak, L.J.; Dugan, I.; Bogunovic, I. Soil management and slope impacts on soil properties, hydrological response, and erosion in hazelnut orchard. Soil Syst. 2021, 5, 5. [Google Scholar] [CrossRef]
  87. Hinton, T.G.; Stoll, J.M.; Tobler, L. Soil contamination of plant surfaces from grazing and rainfall interactions. J. Environ. Radioact. 1995, 29, 11–26. [Google Scholar] [CrossRef]
Figure 1. Study area and rainfall simulation experimental plots.
Agriculture 12 00921 g001
Figure 2. Interaction between Factors 1 and 2 for variables (A) and cases (B) considering different grassland management. Abbreviations: VC—vegetation cover; SOM—soil organic matter; TN—total nitrogen; P2O5—available phosphorous; BD—bulk density; WHC—water-holding capacity; SWC—soil water content; MWD—mean weight diameter; WSA—water-stable aggregates; TP—time to ponding; TR—time to runoff; Run—runoff; SC—sediment concentration; SL—sediment loss; N loss—nitrogen loss—C loss; carbon loss; P loss—phosphorus loss; CSC—carbon sediment concentration; NSC—nitrogen sediment concentration; PSC—phosphorus sediment concentration; DM—dry matter; CP—crude protein; NDF—neutral detergent fibre; ADF—acid detergent fibre; IVDMD—in vitro digestibility of dry matter; IVOMD—in vitro digestibility of organic matter; IVNDFD—in vitro digestibility of neutral detergent fibre.
Agriculture 12 00921 g002
Table 6. Principal component analysis (PCA): eigenvalues of the correlation matrix and related statistics.
FactorsEigenvalue% TotalCumulativeCumulative
116.2755052.5016016.2755052.5016
24.5916514.8117820.8671567.3134
32.466977.9579823.3341275.2714
41.899336.1268625.2334581.3982
51.356194.3748226.5896485.7730
60.890632.8730027.4802788.6460
70.784712.5313328.2649991.1774
80.601471.9402228.8664593.1176
90.537991.7354629.4044594.8531
100.413201.3329229.8176596.1860
110.286300.9235630.1039597.1095
120.255660.8247130.3596197.9342
130.200280.6460530.5598998.5803
140.150020.4839530.7099199.0642
150.121480.3918630.8313999.4561
160.046470.1499230.8778699.6060
170.045550.1469430.9234299.7530
180.024260.0782630.9476899.8312
190.020240.0653030.9679299.8965
200.017950.0579030.9858799.9544
210.008070.0260230.9939499.9804
220.005010.0161730.9989599.9966
230.001050.0033931.00000100.0000
Bold values represent the factors that explain at least one variable.
Table 7. PCA: factor weight of the variables.
VariableFactor 1Factor 2Factor 3Factor 4Factor 5
Slope (°)−0.1837590.032073−0.2142860.6635640.324816
VC (%)−0.9610150.1296300.012466−0.0085470.114473
BD (g cm−3)0.6176390.057457−0.042061−0.3439100.039515
WHC (% vol)−0.5280640.3564540.0680390.600091−0.084749
SWC (% vol)−0.254294−0.116006−0.423325−0.616309−0.350686
MWD (mm)−0.638579−0.080164−0.4405690.361168−0.140333
WSA (%)−0.858883−0.353635−0.2307970.0858080.023776
pH0.953004−0.220063−0.0121020.031722−0.046014
SOM (%)0.909988−0.349247−0.042062−0.001616−0.000434
TN (%)0.919469−0.300987−0.0251320.0239000.002939
P2O5 (mg kg−1)0.878189−0.389188−0.0421000.0788340.021319
PT (sec)0.015776−0.3475350.6229390.402547−0.410930
RT (sec)0.246695−0.5891140.6325770.158676−0.058854
Run (L m−2)−0.0309790.395014−0.5872460.1122380.284968
SC (g L−1)0.893559−0.065884−0.3104750.167852−0.040668
SL (g m−2)0.8737260.018496−0.3772150.173405−0.025723
CSC (g kg−1)0.813553−0.526616−0.000448−0.0375540.017502
NSC (g kg−1)0.807193−0.4809700.031671−0.0951510.056135
PSC (g kg−1)0.8753970.2642420.0469790.0001170.111611
C loss (g m−2)0.921717−0.087232−0.3000820.130282−0.015013
N loss (g m−2)0.920666−0.077394−0.3033100.122562−0.007143
P loss (g m−2)0.9291400.133749−0.2683300.1149380.007901
Biomass (g m−2)−0.471516−0.4075090.278880−0.0442770.654176
DM (g kg−1 DM)0.5018030.7607070.180183−0.085565−0.132941
Ash (g kg−1 DM)0.012669−0.684581−0.2188700.302757−0.346448
CP (g kg−1 DM)−0.170207−0.705055−0.036165−0.1271010.406272
NDF (g kg−1 DM)0.2843860.7926130.2055500.135080−0.000821
ADF (g kg−1 DM)0.8718040.3584750.187814−0.038619−0.075313
IVDMD (g kg−1)−0.890311−0.305665−0.208680−0.035865−0.189955
IVOMD (g kg−1)−0.907558−0.256672−0.221250−0.057043−0.143371
IVNDFD (g kg−1)−0.932813−0.144867−0.158518−0.003038−0.133803
VC—vegetation cover; BD—bulk density; WHC—water-holding capacity; SWC—soil water content; MWD—mean weight diameter; WSA—water-stable aggregates; SOM—soil organic matter; TN—total nitrogen; P2O5—available phosphorous; PT—time to ponding; RT—time to runoff; Run—runoff; SC—sediment concentration; SL—sediment loss; CSC—carbon sediment concentration; NSC—nitrogen sediment concentration; PSC—phosphorus sediment concentration; N loss—nitrogen loss; C loss—carbon loss; P loss—phosphorous loss; DM—dry matter; CP—crude protein; NDF—neutral detergent fibre; ADF—acid detergent fibre; IVDMD—in vitro digestibility of dry matter; IVOMD—in vitro digestibility of organic matter; IVNDFD—in vitro digestibility of neutral detergent fibre. Bold values represent the variables explained by each factor.
Publisher’s Note: MDPI stays neutral with regard to jurisdictional claims in published maps and institutional affiliations.

