Article

Feasibility of Near-Infrared Spectroscopy for Rapid Detection of Available Nitrogen in Vermiculite Substrates in Desert Facility Agriculture

1
College of Mechanicaland Electrical Engineering, Tarim University, Alar 843300, China
2
Agricultural Engineering Key Laboratory, Universities of Education Department of Xinjiang Uygur Autonomous Region, Tarim University, Alar 843300, China
3
College of Engineering, China Agricultural University, Beijing 100083, China
*
Author to whom correspondence should be addressed.
These authors contributed equally to this work.
Agriculture 2022, 12(3), 411; https://doi.org/10.3390/agriculture12030411
Submission received: 4 March 2022 / Accepted: 9 March 2022 / Published: 15 March 2022
(This article belongs to the Special Issue Soil Erosion Modeling and Monitoring)

Abstract

:
Fast and precise estimation of the available nitrogen content in vermiculite substrates promotes prescription fertilization in desert facility agriculture. This study explored near-infrared spectroscopy for rapid detection of the available nitrogen content in vermiculite substrates in desert facility agriculture. The spectra of vermiculite matrices with different available nitrogen contents were collected through a self-assembled near-infrared spectrometer. Partial least squares expression (PLSR) established the available nitrogen spectrum prediction model optimized using different pretreatments. After pretreatment, the prediction model of the available nitrogen spectrum was simplified by adopting three feature extraction methods. A comprehensive comparison of the results of each prediction model showed that the prediction model combining the first derivative with SG smoothing pretreatment was the best. The correlation coefficients of the corresponding calibration and prediction sets were 0.9972 and 0.9968, respectively. The root mean square errors of the calibration and prediction sets were 149.98 and 159.65 mg/kg, respectively, with 12.57 RPD. These results provide a feasible method for rapidly detecting the available nitrogen content of vermiculite substrates in desert facility agriculture.

1. Introduction

Combining information technology with modern agricultural operation and management systems is a new agricultural practice for positioning, timing, and quantification. The rapid development of precision agriculture in facility farming demands rapid and accurate detection technology for the precise control and management of desert facilities [1,2]. Precision agriculture is a new system in desert facility agriculture. The desert characteristics of massive evaporation and minimal agricultural materials birthed the development of facility agriculture which combines and precisely controls low-cost substrates with high water and fertilizer conservation [3]. Natural, inorganic, and non-toxic vermiculite ore expansion produces vermiculite substrate, which provides the nutrients and water necessary for long-term plant growth and effectively promotes crop root growth and stable seedling development. Vermiculite substrate is an alternative cultivation substrate in desert facility agriculture [4,5].
Notably, available nitrogen is easily absorbed and utilized by plants and is often used for short-term rapid nitrogen fertilizer supplementation to promote crop growth and ensure crop yield [6,7,8]. However, facility agriculture lacks the relevant technology and equipment to quickly detect the available nitrogen content of cultivation substrates. Thus, excessive application is generally adopted to ensure sufficient supplies, causing fertilizer overuse, serious waste, and agricultural pollution [9]. Presently, the detection of nitrogen in cultivation substrates mainly involves conventional chemical measurement of soil available nitrogen content, a time- and labor-intensive technique that pollutes the environment [10,11]. Therefore, methods for rapidly detecting the available nitrogen content in vermiculite substrates and determining in a timely manner the available nitrogen content in the cultivation environment are crucial for precise fertilization in desert facility agriculture and reducing agricultural pollution. Moreover, rapid and pollution-free methods for detecting nitrogen fertilizer levels in vermiculite substrates are urgently required.
The near-infrared (NIR) spectrum detection technique, widely used in food, medicine, agriculture, the chemical industry, and other fields, is suggested. The NIR technique is simple, rapid, nondestructive, and pollution-free [12]. The absorption bands in the NIR spectrum are all related to hydrogen groups (such as C-H, N-H, and O-H) and can analyze specific structures of chemical components. NIR spectroscopy has been widely used for detecting soil composition [13]. Many studies have shown that the NIR spectrum rapidly and non-destructively detects soil available nitrogen, phosphorus, and potassium [14,15,16]. This study adopted the NIR spectroscopy to evaluate the available nitrogen content of vermiculite substrates in crop cultivation.
Despite the research progress in detecting available nitrogen content, most reports have focused on detection from soil, with only a few reports on detection in soil-less cultivation substrates. Vermiculite is an agricultural mineral matrix used in desert facilities. Therefore, rapid and accurate detection of available nitrogen content can facilitate the improvement of available nitrogen and water usage, further promoting and popularizing desert agricultural facilities. However, a systematic technical system for detecting the available nitrogen content of vermiculite is still lacking. Therefore, this study explored the possibility of using near-infrared spectroscopy to detect the available nitrogen content of vermiculite matrices rapidly. The research provides technical support for the agricultural application of vermiculite, specifically, a NIR spectral prediction model for rapidly detecting available nitrogen content in cultivation environments, thus promoting the modernization of desert agricultural facilities.
This study aimed at: (1) a vermiculite available nitrogen NIR spectroscopy system with a 940–1660 nm wavelength range; (2) establishing a prediction model of full spectral data using the partial least squares regression (PLSR) of different spectral pretreatments for detecting the nitrogen content of vermiculite substrate; (3) using the successive projections algorithm (SPA), competitive adaptive reweighted sampling (CARS), and synergy interval partial least squares (Si-PLS) to screen the characteristic NIR spectroscopic wavelengths of vermiculite available nitrogen; (4) analyzing and comparing quantitative prediction models of the spectral data, available nitrogen, and the prediction results of different feature extraction methods. The best NIR spectroscopic model for predicting the available nitrogen content of vermiculite substrates was selected by comparing the modeling results of characteristic variables and the full spectral data.

2. Materials and Methods

2.1. Experimental Materials

White vermiculite from the Qeganbulak Vermiculite mine in the northeast corner of the Taklimakan Desert, Xinjiang Uygur Autonomous Region (China) was used as the vermiculite substrate material. Before the experiment, the vermiculite substrates were immersed in a container of deionized water for 24 h, then filtered with gauze to remove impurities, and the substrates were dried naturally. Then, 10 g was weighed from each dried substrate using an analytical balance with a 0.001 g sensing accuracy and successively added to an aluminum box (40 mm diameter). The reference concentration gradient was the range of available nitrogen content in the actual cultivation environment. Then, different concentrations of nitrogen fertilizer solutions were artificially and successively added to the aluminum box in a way that simulated fertilization. The available nitrogen content of the substrate in the aluminum box was similar to the actual cultivation environment. The numbers were marked and recorded. Vermiculite substrate samples containing nitrogen fertilizer solutions were placed in a closed environment for 24 h to ensure that vermiculite substrates fully absorbed the nitrogen fertilizer. Next, the vermiculite samples were placed in a 105 °C thermostatic drying oven to eliminate moisture that might influence the spectral data. Dried vermiculite substrate samples were crushed successively by a crusher and screened through a 0.25 mm screen to form vermiculite substrate powder with uniform particle size. Before each grinding, the crusher was cleaned, and each screened sample of vermiculite substrate was weighed and added into a clean aluminum box of 40 mm diameter. Weighed samples were compacted with 500 g calibration weights to eliminate the influence of particle size heterogeneity on spectral data collection.

2.2. NIR Spectrum Measurement System and Spectral Data Acquisition

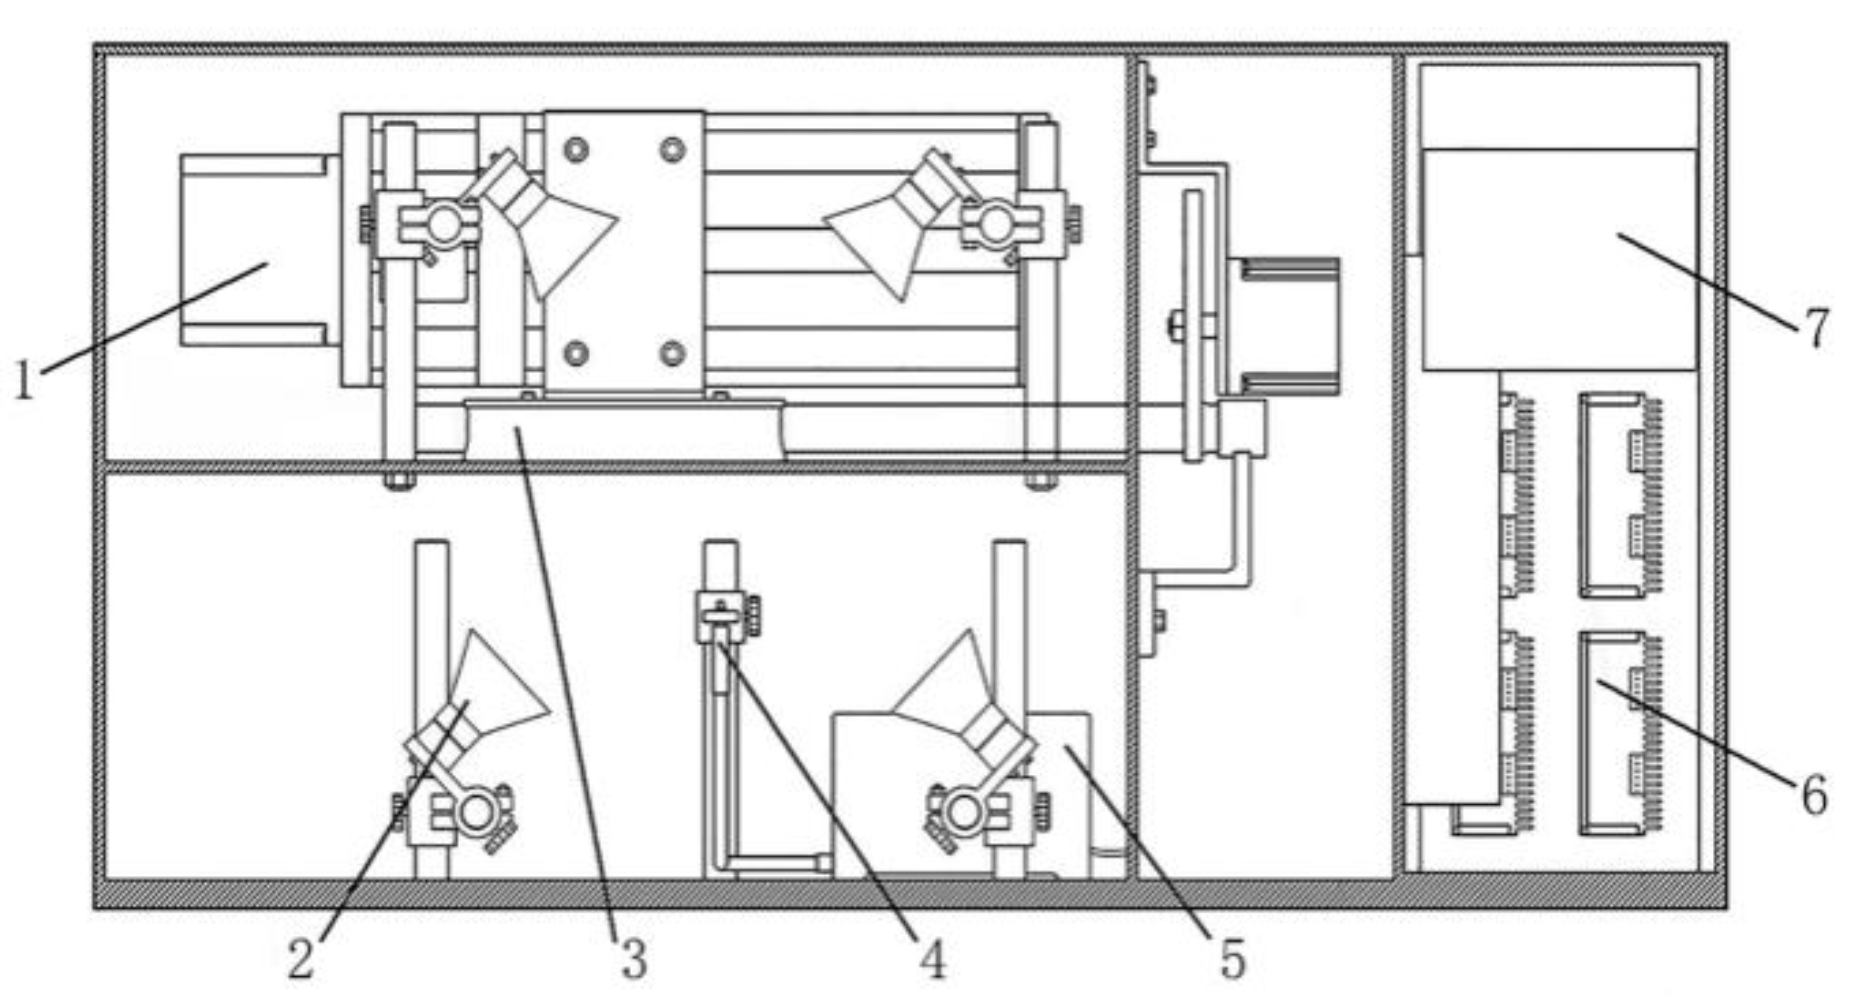
A locally prepared reflectance NIR spectroscopy collection system determined the reflectance spectral data of the vermiculite substrate samples (Figure 1). The local NIR spectrum collection system is composed of a Flame NIR spectrometer (FLAME-NIR-INTSMA25, Ocean Optics Co., Ltd., Dunedin, FL, USA), four 35 W halogen tungsten lamps (Philips halogen 12V, Shanghai Philips Co., Ltd., Shanghai, China), an optical fiber with a fiber probe, a ball screw, a sample chamber, and a computer control unit and display.
The wavelength range of the collected spectral data was 940–1660 nm, with a 5.8 nm sampling wavelength interval and 6000:1 signal-to-noise ratio. The tungsten halogen light source was preheated for 30 min before acquiring spectral data using the self-made detection system. In addition, the vermiculite substrate spectral data was acquired at 386 ms, 3 nm, 3 ms integration time, smoothness (average sliding width), and average scanning time, respectively. The optical fiber probe and sample surface were 20 mm apart. All spectral acquisition and testing were completed by the Oceanview windows launcher 2.0.7, a professional testing software package provided by Ocean Optics Co., Ltd., Dunedin, FL, USA. After pre-warming, a standard Teflon whiteboard generated the white reference to circumvent external environmental influence on the spectral data.
While obtaining the black reference spectral data, the halogen tungsten light source was wrapped in a black shield to form a dark environment and reduce interference from the unstable light source. Collecting the spectral data of vermiculite samples requires an equal distance between the surface of each sample and the optical fiber probe. Moreover, the position and brightness of the light source should remain constant to reduce measurement errors.

2.3. Laboratory Chemical Measurements

Based on the Chinese forestry standard LY/T1229-1999, the available nitrogen of vermiculite was determined by the alkali hydrolysis diffusion method with proper adjustments. The 144 test samples were prepared by weighing 1 g of dried vermiculite substrate powder through a 0.25 mm sieve and spreading it evenly in an extracellular chamber of a Conway dish. Simultaneously, three blank vermiculite-free tests were set up, and 3 mL of 20 g/L boric acid indicator solutions were added to the intracellular chamber of the Conway dish. The boric indicator solution was composed of 100 mL of 20 g/L boric acid (AR, Beijing Chemical Plant, Beijing, China), 2 mL of 0.1 g methyl red (IND, Tianjin Guangxia Fine Chemical Institute, Tianjin, China), and 0.5 g bromocresol green (IND, Tianjin Guangxia Fine Chemical Institute, China). The constituents were dissolved in methyl red–bromocresol green indicator with 100 mL of 95% ethanol (AR, Tianjin Beilian Fine Chemicals Development Co., Ltd., Tianjin, China) and adjusted to pH 4.5. An alkaline gel was evenly smeared on the external edge of the Conway dish and covered with frosted glass. After sealing, 10 mL of 1.2 mol/L NaOH solution from the frosted glass edge was added to the extracellular chamber of the Conway dish. The frosted glass cover was bound to the Conway dish using a rubber band to form a cross bundling and a closed space inside the Conway dish. The bound Conway dish was placed in a thermostatic incubator at 40 °C for 24 h of alkaline hydrolysis diffusion reaction. After that, the mixture absorption solution of boric acid and indicator in the intracellular chamber was titrated with 0.01 mol/L standard hydrochloric acid solution (Xiamen Science and Technology Co., Ltd., Xiamen, China). The titration was terminated when the absorption solution changed from blue-green to purplish-red. The content of available nitrogen in the vermiculite substrate was calculated following the titration consumption volume of the standard 0.01 mol/L hydrochloric acid solution. The calculation is as shown in Equation (1).
W N = ( V V 0 ) × C × 14 k × m × 100
where WN is sample available nitrogen content, mg/100 g; V is the consumption of standard titration acid solution of the test sample, mL; V0 is the consumption of standard titration acid solution of the blank sample, mL; C is the concentration of the standard titration acid solution, mol/L; m is the weight of the sample, g; k is the water reduction coefficient of the air-dried sample.

2.4. Spectral Preprocessing

The acquired NIR data had interference in the inform of background noise and scattering [17], which could negatively influence the prediction accuracy of the model. Therefore, the first- and second-order derivatives, Savitzky–Golay smoothing (SG), multiplicative scatter correction (MSC), standard normal variable transformation (SNV), and derivative-integrated SG smoothing were used to preprocess the spectral data and reduce the noise and scattering interference. The first- and second-order derivatives reduced background interference, enhancing spectral characteristics. Savitzky–Golay smoothing eliminated high-frequency noise, smoothened the spectral data, increased the signal-to-noise ratio, and retained important information. The window size and degree of the polynomial were 12 and 2, respectively [18]. The MSC eliminated the spectral differences caused by different scattering levels, enhancing the correlation between spectra and data [19]. However, SNV eliminated the influence of solid particle differences and information about the measured substances [20]. Finally, the derivative combined with the SG smoothing method eliminates the influence of solid particle difference and the content information of the measured substance, thus performing spectral data pretreatment.

2.5. Establishment and Evaluation of the Spectral Prediction Model

The absorption bands in the NIR spectral region were all related to hydrogen-containing groups. Therefore, the spectra of the available nitrogen content of the vermiculite substrate and wavelength were irrelevant for detecting the available nitrogen content. Moreover, the spectral data corresponding to these wavelengths significantly interfered with the available nitrogen content detection [21]. In this study, the characteristic variables closely related to available nitrogen content detection were selected to reduce the interference of irrelevant variables and enhance the prediction accuracy of the model.
The data was preprocessed using SPA, CARS, and SI-PLS to simplify the model and enhance its detection accuracy for the characteristic variables of the spectral data for the available nitrogen content of vermiculite substrate. The SPA method screened the characteristic variables via a forward loop. This technique (SPA) minimizes collinearity in the vector space of the spectral data and reduces spectral substrate redundancy [22]. The CARS method, however, uses Monte Carlo sampling and partial least squares (PLS) regression coefficients to significantly reduce the amount of data and establish the optimal combination of variables [
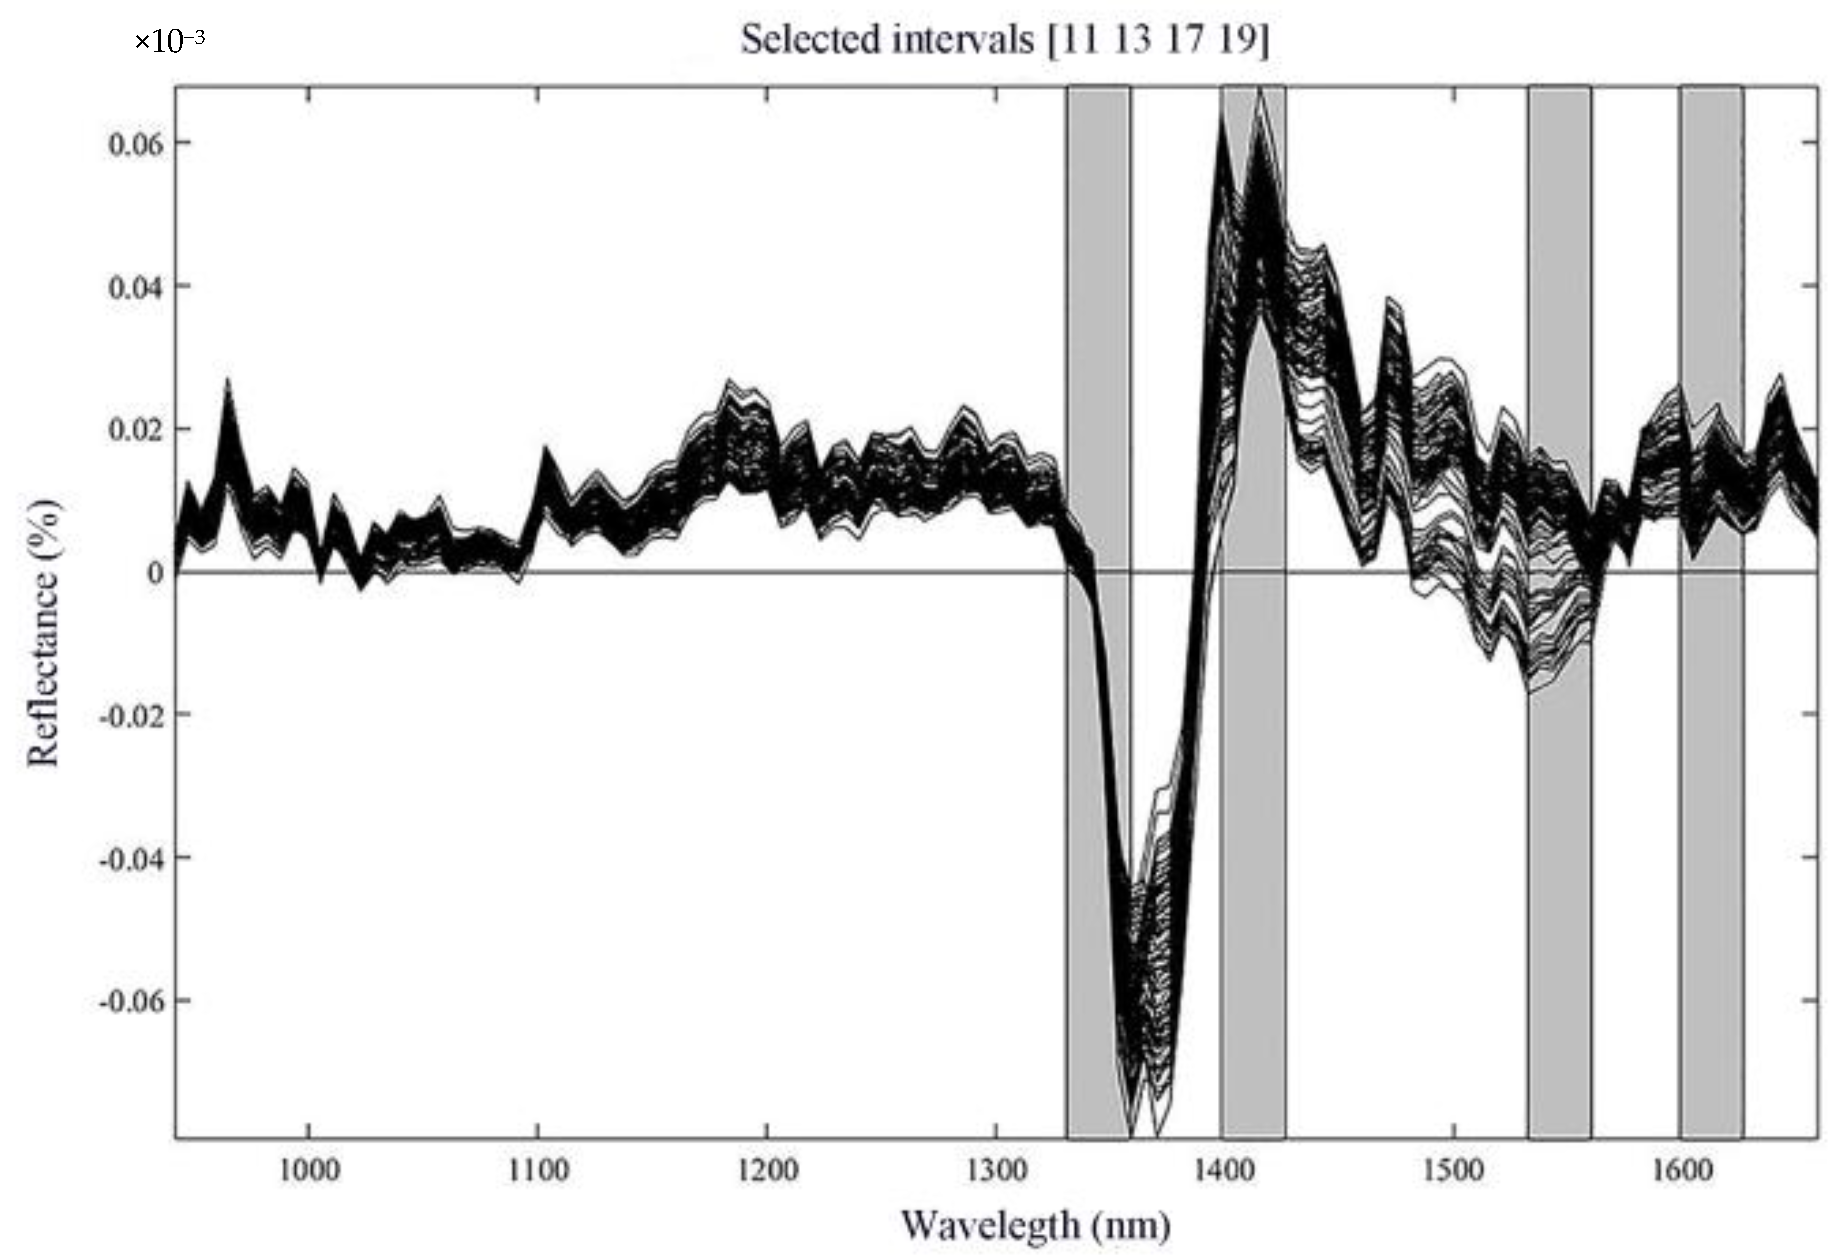
23]. However, both SPA and CARS are univariate screening methods, and the selected wavelength variables are a subset of individually relevant variables. The Si-PLS algorithm considers the root mean square error of the synergy model as the accuracy measurement standard of each model [22]. The algorithm selects the lowest root mean square error combination and the corresponding sub-interval combination as the best combination.
The change in peak values of the spectral curve is the change of the available nitrogen content of vermiculite substrates. A linear relationship model between the spectral data of vermiculite substrates and the measured available nitrogen content was established using the PLSR to rapidly and quantitatively detect the available nitrogen content of vermiculite substrates [24]. The PLSR is an effective linear modeling method with the advantages of principal components, canonical correlation, and multiple linear regression analyses. PLSR is especially suitable for establishing the prediction model when the number of NIR spectral variables is larger than the number of samples. Therefore, the PLSR algorithm is useful for establishing the spectral prediction model of the available nitrogen content of vermiculite. All modeling was performed in MATLAB R2018b (Mathworks Inc., MA, USA).
The following indicators: calibration set correlation coefficient (RC), prediction set correlation coefficient (RP), the calibration set root mean square error (RMSEC), prediction set root mean square error (RMSEP), and the ratio of prediction to deviation (RPD) were applied to estimate the model performance. The root mean square error of the calibration set had the best prediction performance when the correlation coefficient and root mean square error of the calibration and the prediction sets of the prediction model were similar. Formulas (2)–(4) show the calculation methods for these evaluation indicators. When Rc and Rp are maximum, while RMSEC and RMSEP are minimum, RPD represents the accuracy level of the prediction model. The model was inapplicable for accurate quantitative prediction because RPD < 3; 3 ≤ RPD < 4 implied better prediction performance. An RPD ≥ 4 implied outstanding performance of the detection model [25,26].
R = 1 i = 1 n ( y i , actuual y i , predicted ) 2 i = 1 n ( y i , actuual y average ) 2
RMSE = i = 1 n ( y i , actuual y i , predicted ) 2 n
RPD = SD RMSEP
where R is the correlation coefficient, n is the number of samples; yi,actuual is the measured reference of the available nitrogen content of the ith sample; yi,predicted is the spectra-predicted available nitrogen content of the ith sample; yaverage is the average of the average available nitrogen content of the reference sample; RMSE is the root mean square error; RPD is the ratio of prediction-to-deviation; RMSEP is the root mean square error of the prediction set; and SD is the standard deviation of the prediction set.

3. Results and Discussion

3.1. Grouping Statistics of the Available Nitrogen Content of Vermiculite

Using NIR spectroscopy, the available nitrogen content in 144 samples was determined to establish a stable and reliable model for predicting the available nitrogen in vermiculite. The spectral data of 144 vermiculite substrate samples were sorted in descending order following the chemical measurements of available nitrogen content. The samples collected at equal concentration intervals were divided into two groups, and 25% of the 144 samples were selected as the prediction set. Table 1 shows the content range and distribution of available nitrogen in the calibration and prediction sets.
Table 1 showed that sample available nitrogen chemical measurement value of calibration set covered the whole range of the sample set and had strong representativeness, and the sample distribution of the two sets was similar. The classification of the two sets met the requirements of spectral data grouping for establishing a model with better stability and robustness.

3.2. Analysis of the Spectral Data of Vermiculite

A self-made NIR spectroscopy system collected the reflectance spectral data of vermiculite samples. The reflectance spectral data of 144 vermiculite substrate samples was collected with a 940–1660 nm wavelength range. In Figure 2, below, the x-axis represents the wavelength and the y-axis the reflectance.
As shown in Figure 2, the basic variation trend of sample spectral curves is consistent. The difference between sample spectrum curves of vermiculite substrates shows the reflectivity of the absorption peak amplitude. The spectral curve showed no significant change, implying the similar composition and chemical structure of the samples. The absorption peak reflectance amplitude difference is due to the content differences of the same substance in different samples.
The spectral curve showed three obvious absorption peaks near 1390, 1460, and 1570 nm. The absorption peak near 1390 nm signals the first frequency doubling of the stretching vibration of the silanol O-H group in vermiculite, reflecting the characteristics of vermiculite. The absorption peaks near 1460 and 1570 nm are related to the first frequency doubling vibration absorption of the N-H group and the change of available nitrogen content of vermiculite substrates [27,28,29]. The characteristic peak at approximately 1120 nm was related to the vibration absorption of secondary frequency doubling and combination frequency in C-H (CH2, CH3). In addition, that characteristic peak represented the vibration absorption of methylene CH in the secondary frequency doubling region [30]. Therefore, most of the characteristic peaks reflecting the available nitrogen content were weak absorption peaks.

3.3. NIR Spectroscopy of Available Nitrogen Content Based on All-Band Spectral Data of Vermiculite Substrates

The PLSR algorithm established the prediction model of available nitrogen content in vermiculite substrates using full spectral data. The original spectral data of vermiculite substrates were pretreated with different algorithms to improve further the performance of the model for the available nitrogen content of vermiculite substrates. In this article, vermiculite matrix samples were arranged according to the different concentrations of available nitrogen content by taking four samples as one group. Next, 25% and 75% values of each group were extracted and combined into different sample intervals. Finally, the correction set models of the different sample intervals were established using the PLSR algorithm. The values of RC, RP, RMSEC, RMSEP, and RPD were used to select the optimal number of principal components, where RC > RP, RMSEC < RMSEP, and RMSEP < 2RMSEC. Finally, the optimal principal component score was used to calculate the PLSR prediction model and the RPD value. Table 2 shows the prediction results.
As shown in Table 2, different spectral pretreatment methods significantly affected the PLSR model of vermiculite available nitrogen. All other pretreatments improved the prediction accuracy of the model except MSC and SNV pretreatments. The MSC and SNV pretreatments are generally used to eliminate the solid particle size difference and the impact of the sample surface scattering. All vermiculite substrate samples in this study were compacted after crushing and screening. The vermiculite sample particle size and surface scattering effect were indifferent. Thus, MSC and SNV pretreatments instead introduced irrelevant information, reducing model prediction accuracy. Combining the second derivative pretreatment with SG smoothing had the best effect and significantly improved the prediction effect of the model. The correlation coefficients of the calibration and the prediction sets of the optimal model were 0.9982 and 0.9977, respectively. The RPD was 12.14, indicating that the model had the best prediction performance.

3.4. Spectroscopic Measurement and Analysis of the Available Nitrogen Content of the Vermiculite Substrate Based on SPA-Screened Characteristic Wavelengths

The characteristic variables of the original and various preprocessed spectral data were SPA-screened to eliminate the influence of multicollinearity in NIR spectroscopy, reduce the number of variables involved in spectral modeling, and enhance modeling effectiveness. Moreover, PLSR established the prediction model for the nitrogen content of vermiculite substrates using the spectral data after SPA feature extraction. The modeling results are listed in Table 3.
As shown in Table 3, the SPA screening of spectral data of characteristic variables greatly reduces multicollinearity and improves the prediction accuracy of the model. In the original spectrum, the first derivative and the second derivative had the largest data elimination, but the RPD of the prediction model was low. The modeling effect of SG smoothing alone and combining the derivative with SG smoothing performed better than other pretreatments. After combining the first derivative with SG smoothing, the best model had the optimal data prediction accuracy in PLSR modeling. The modeling variables were reduced from 128 to 54, and the correlation coefficients of the calibration and prediction sets of the optimal model were 0.9969 and 0.9966, respectively. The RPD was 10.99, indicating that the prediction performance of the model was excellent. Figure 3 shows the results of variable screening after using SPA to screen characteristic variables of the first derivative combined with SG smoothing pretreatment for spectral data.
The screened characteristic variables were distributed near the 1390 and 1500 nm absorption peaks in the spectral band, as shown in Figure 3. The absorption peak near 1390 nm is related to the stretching vibration of the silanol O-H group in vermiculite, reflecting the characteristics of vermiculite substrates. The absorption peak near 1500 nm is related to the first frequency doubling vibration of the N-H group, closely related to the change in the available nitrogen content of vermiculite substrates.

3.5. Spectroscopic Measurement and Analysis of the Available Nitrogen Content of the Vermiculite Substrate Based on CARS-Screened Characteristic Wavelengths

The CARS algorithm screened the original and pretreated spectral data to reduce the number of variables for spectral modeling and obtained the main characteristic variables reflecting the change of available nitrogen content in vermiculite substrates. Subsequently, PLSR established a prediction model of the nitrogen content in vermiculite substrates based on the spectral data after CARS feature extraction and the results are listed in Table 4.
As shown in Table 4, the CARS screening algorithm greatly reduces modeling redundancy and improves the prediction accuracy of the model. In PLSR modeling, CARS screening showed optimal prediction accuracy after combining the first derivative with SG smoothing. The modeling variables were reduced from 128 to 31. The amount of data was reduced by approximately 75%. The correlation coefficients of the calibration and prediction sets of the optimal model were 0.9972 and 0.9968, respectively. The root mean square errors (RMSE) of the calibration and prediction sets were 149.98 and 159.65 mg/kg, respectively. However, the RPD was 12.57. The prediction performance of the model was good. The CARS algorithm uses interactive verification to find the optimal combination of variables. Thus, CARS greatly reduces the multicollinearity of vermiculite substrate spectral data and the irrelevant variables of available nitrogen content spectral detection. However, CARS accurately screens out the spectral data by directly reflecting the available nitrogen content of vermiculite substrates and improving modeling efficiency.

3.6. Spectroscopic Measurement and Analysis of the Available Nitrogen Content of the Vermiculite Substrate Based on Si-PLS-Screened Characteristic Wavelengths

The chemical composition content information in NIR spectral data might be a wavelength region with a specific bandwidth. Therefore, the Si-PLS algorithm was adopted to screen the original and pretreated spectral data. All the 128 detection wavelength variables were approximately divided into 20 sub-intervals. The best four groups of intervals were selected to establish the prediction model and reduce the involvement of irrelevant spectral data in detecting available nitrogen content. The main characteristic variable regions reflecting the change of available nitrogen content of vermiculite substrates were obtained. Subsequently, PLSR was used to establish a prediction model of nitrogen content in vermiculite substrates based on the spectral data after Si-PLS feature extraction. The modeling results are listed in Table 5.
As displayed in Table 5, the Si-PLS algorithm effectively reduces irrelevant information variables for detecting available nitrogen in vermiculite substrates. The input variables of the model were reduced from 128 to 28 and 24, respectively, while the amount of data was reduced by approximately 78%. The RPD values of the prediction models were all lower than the original spectral modeling because the Si-PLS interval introduces irrelevant information as compared to the univariate screening method, resulting in reduced modeling accuracy. However, PLSR modeling had the best effect on the spectral data, combining the first derivative with SG smoothing. The correlation coefficients of the calibration and prediction sets were 0.9964 and 0.9899, respectively, and the RPD was 6.40. Figure 4 shows the results where CARS were used to screen characteristic variables combining the first derivative with SG smoothing.
The four synergistic sub-intervals screened out by the CARS optimization model are 1330.9–1359.1, 1398.4–1426.5, 1532.4–1560.1, and 1598.8–1626.3 nm, respectively, including the N-H bond characteristic band, as shown in Figure 4. Therefore, Si-PLS can find the optimal band region, greatly reducing the multicollinearity of vermiculite substrate spectral data and accurately screening the spectral data that directly reflects the available nitrogen content of vermiculite substrates. Thus, PLSR modeling can establish an excellent prediction model.

3.7. Prediction Model Performance for the Available Nitrogen Content of Vermiculite Substrates Based on All-Band Spectral Data and Characteristic Variables

The prediction performance of the optimal model was established by the full spectral data and the spectral data after screening and comparing three characteristic variables (Table 6). The purpose was to achieve high precision and rapid detection of the available nitrogen content in vermiculite substrates and simplify the complexity of the model. Screening spectral data using SPA, CARS, and Si-PLS reduces the influence of multicollinearity and irrelevant information variables and improves the calculation speed of the prediction model.
Investigated from Table 6, the prediction model based on full and variable screening spectral data realized a rapid, nondestructive, quantitative detection model of the available nitrogen content in vermiculite substrate. The second derivative combined with the SG smoothing method was used to pretreat the spectral data. The optimal prediction model of the available nitrogen content of vermiculite substrates was established for the all-band spectral data. After combining the first derivative with the SG smoothing method, the optimal prediction model for the available nitrogen content of vermiculite substrates was established using SPA, CARS, and Si-PLS feature extractions. All three feature variable screening methods can effectively eliminate the redundant information in the spectral data. However, SPA had a poor simplification effect on the model, but CARS and Si-PLS greatly simplified model complexity. The Si-PLS algorithm had the best elimination effect. The input variable of the model was reduced from 128 to 24, while the amount of spectral data decreased by approximately 81%.
The three screening methods contained all the optimal characteristic variables extracted within 1500 nm spectral data. Hence, the established prediction model of the available nitrogen content in vermiculite substrates is closely related to that characteristic band. The model was reliable and credible. Unlike the optimal prediction model based on full spectral data, except for CARS screening the accuracy of the model established using PLSR after feature extraction decreased to some extent, and the Si-PLS screening method had the lowest accuracy. The correlation coefficient of the calibration set decreased from 0.9982 to 0.9972, while that of the prediction set decreased from 0.9977 to 0.9968. The RPD of the model decreased from 12.14 to 7.64, with nearly 40% decreasing amplitude. This trend is related to introducing irrelevant information variables and block division in the characteristic Si-PLS selected region. However, the RPD of the PLSR prediction model was >3 after Si-PLS screening of the first derivative and SG smoothing of pretreated data, which still had reliable prediction performance. After feature extraction, the best effect was from the PLSR-established prediction model after CARS screening of the combined first derivative and SG smoothing pretreated data. There were 31 variables for modeling. The 97 pieces of irrelevant information about the available nitrogen content of vermiculite substrates were removed. The RPD of the model was 12.57, indicating a significant prediction effect. In summary, these results could reduce the gap in research into technology designed for the rapid detection of the available nitrogen content of various cultivation substrates. The results also provide references and a theoretical basis for developing detection equipment for the available nitrogen content of facility substrates.
The best model, with 12.57 RPD, was selected by comparing various preprocessing and feature extraction algorithms with prediction models constructed using PLSR methods. The selected model is better than those previously reported. For example, in 2008, Bambangh et al., collected 210 soil samples with 3.75 and 112.5 mm depths from seven field pastures in Taupo and Rotoru, New Zealand. The contents of soil total carbon and total nitrogen were detected with a LECO analyzer. After SG filtering and smoothing of the original spectrum and first derivative pretreatment, the prediction model of soil total nitrogen was established by PLSR [31]. In 2013, Kodaira et al. established partial least squares regression models for ammonium nitrogen (NH4), nitrate nitrogen (NN), hydrolyzed nitrogen (HN), and total nitrogen (TN) in soils sampled from Shisheng plain, Jiangjianchuan District, Hokkaido. The determination coefficient, R2, of the total nitrogen (TN) prediction model was >0.89, the relative analysis error RPD was >2.0, and the prediction accuracy reached class A, with a good prediction effect [32]. In addition, Shao and He used near-infrared spectroscopy to detect the spectrum of soil nitrogen, phosphorus, and potassium [33]. However, this study assayed vermiculite matrix with relatively simple properties as compared to soil; thus, it had less spectral collection interference and higher prediction accuracy.

4. Conclusions

This work built an NIR spectroscopy system of vermiculite substrate operating at a 940–1660 nm wavelength. Combining the NIR spectroscopy technology and stoichiometry, the correlation between the available nitrogen content of vermiculite substrates and NIR spectral curves was quantitatively analyzed. The results indicated that different spectral data preprocessing methods differentially influenced spectroscopic detection of the water content of vermiculite substrates. The combined prediction model using the second derivative with SG smoothing pretreatment had the best effect in band spectral modeling. The corresponding correlation coefficients of the calibration and prediction sets were 0.9982 and 0.9976, respectively, while the RPD was 12.14. After these results were obtained, SPA, CARS, and Si-PLS were used to optimize the characteristic variables of the spectral data. In contrast, PLSR was used to establish a predictive model for the available nitrogen content of the vermiculite substrate. The prediction accuracy of the models reached the optimum using the combination of SG smoothing and the first derivative pretreatment method. The CARS feature extraction methods were relatively optimal after optimizing the characteristic variables. Moreover, the corresponding correlation coefficients of the calibration and prediction sets of the best prediction model were 0.9972 and 0.9968, respectively. The root mean square errors of the calibration and prediction sets were 149.98 and 159.65 mg/kg, respectively, and the RPD was 12.57. This model detected the available nitrogen content of vermiculite substrates with high accuracy. Nonetheless, the samples used in this experiment were synthetic; hence, in situ desert agriculture samples should be used to update this model.

Author Contributions

Resources, W.G.; data curation, L.W.; writing—original draft preparation, P.Z. and J.X.; writing—review and editing, X.W.; visualization, X.H.; supervision, Z.X.; project administration, C.H. All authors have read and agreed to the published version of the manuscript.

Funding

This work was supported by the Support Plan for Innovation and Development of Key Industries in South Xinjiang of the Xinjiang Production and Construction Corps, grant number 2019DB001, an Innovation research team project funded by the president of Tarim University, grant number TDZKCX202103 and President fund of Tarim University, grant number TDZKSS202113.

Institutional Review Board Statement

Not applicable.

Informed Consent Statement

Not applicable.

Data Availability Statement

The data presented in this study are available on request from the corresponding author.

Acknowledgments

We thank Bing Lu, Zhaohui Liu, and others for their help. This work was supported by the Support Plan for Innovation and Development of Key Industries in South Xinjiang of the Xinjiang Production and Construction Corps (Project No. 2019DB001) and an Innovation research team project funded by the president of Tarim University (Project No. TDZKCX202103). The authors are grateful to anonymous reviewers for their comments.

Conflicts of Interest

The authors declare no conflict of interest.

References

  1. Yin, H.Y.; Cao, Y.T.; Marelli, B.; Zeng, X.Q.; Mason, A.J.; Cao, C.Y. Smart agriculture systems: Soil sensors and plant wearables for smart and precision agriculture. Adv. Mater. 2021, 33, 2170156. [Google Scholar] [CrossRef]
  2. Linaza, M.; Posada, J.; Bund, J.; Eisert, P.; Quartulli, M.; Döllner, J.; Pagani, A.; Olaizola, I.G.; Barriguinha, A.; Moysiadis, T.; et al. Data-driven artificial intelligence applications for sustainable precision agriculture. Agronomy 2021, 11, 1227. [Google Scholar] [CrossRef]
  3. Shinzato, M.C.; Wu, L.; Mariano, T.O.; Freitas, J.G.; Martins, T.S. Mineral sorbents for ammonium recycling from industry to agriculture. Environ. Sci. Pollut. R 2020, 27, 13599–13616. [Google Scholar] [CrossRef]
  4. Tang, Q.W.; Lin, J.M.; Wu, J.H.; Xu, Y.W.; Zhang, C.J. Preparation and water absorbency of a novel poly (acrylate-co-acrylamide)/vermiculite superabsorbent composite. J. Appl. Polym. Sci. 2007, 104, 735–739. [Google Scholar] [CrossRef]
  5. Chen, S.Y.; Han, J.G.; Wang, Y.W.; Li, S.T.; Chang, S.J. Effects of matriconditioning with vermiculite on germination and germination speed of zoysia grass seed samples. Acta Agrestia Sin. 2007, 3, 254–258. [Google Scholar]
  6. Yang, L.L.; Yao, Q.F.; Liang, Q.; Lu, X.M. Research progress on soil nitrogen internal cycling response to ecological cover change. Chin. J. Econ. Agric. 2020, 28, 1543–1550. [Google Scholar] [CrossRef]
  7. Xie, X.L.; Li, A.B. Identification of soil profile classes using depth-weighted visible near-infrared spectral reflectance. Geoderma 2018, 325, 90–101. [Google Scholar] [CrossRef]
  8. Lin, L.X.; Xue, F.C.; Wang, Y.J.; Liu, K.Q. Photography measured-value magnification improves local correlation maximization-complementary superiority method of hyperspectral analysis of soil total nitrogen. Catena 2018, 165, 106–114. [Google Scholar] [CrossRef]
  9. Picouet, A.P.; Gou, P.; Hyypio, R.; Castellari, M. Implementation of NIR technology for at-line rapid detection of sunflower oil adulterated with mineral oil. J. Food. Eng. 2018, 230, 18–27. [Google Scholar] [CrossRef]
  10. Verstraeten, M.; Van, H.D.; Hellings, M.; Hermans, M.; Geens, J.; Vervaet, C.; Nopens, I.; Beer, D.T. Model-based NIR spectroscopy implementation for in-line assay monitoring during a pharmaceutical suspension manufacturing process. Int. J. Pharm. 2018, 546, 247–254. [Google Scholar] [CrossRef]
  11. Altieri, G.; Genovese, F.; Tauriello, A.; Di, R.G.C. Models to improve the nondestructive analysis of persimmon fruit properties by VIS/NIR spectrometry. J. Sci. Food. Agric. 2017, 97, 5302–5310. [Google Scholar] [CrossRef]
  12. Jiang, Q.H.; Li, Q.X.; Wang, X.G.; Wu, Y.; Yang, X.L.; Liu, F. Estimation of soil organic carbon and total nitrogen in different soil layers using VNIR spectroscopy: Effects of spiking on model applicability. Geoderma 2017, 293, 54–63. [Google Scholar] [CrossRef]
  13. Lu, B.; Wang, X.F.; Liu, N.H.; He, K.; Wu, K.; Li, H.L.; Tang, X.Y. Feasibility of NIR spectroscopy detection of moisture content in cocopeat substrate based on the optimization characteristic variables. Spectrochim. Acta A 2020, 239, 118455. [Google Scholar] [CrossRef]
  14. Zhang, H.L.; Luo, W.; Liu, X.M.; He, Y. Measurement of soil organic matter with near infrared spectroscopy combined with genetic algorithm and successive projection algorithm. Spectrosc. Spect. Anal. 2017, 37, 584–587. [Google Scholar]
  15. Wang, L.S.; Wang, R.J.; Lu, C.P.; Wang, J.; Huang, W.; Jian, Q.; Wang, Y.B.; Lin, L.Z.; Song, L.T. Quantitative Analysis of Total Nitrogen Content in Monoammonium Phosphate Fertilizer Using Visible-Near Infrared Spectroscopy and Least Squares Support Vector Machine. J. Appl. Spectrosc. 2019, 86, 465–569. [Google Scholar] [CrossRef]
  16. Liu, S.S.; Shen, H.H.; Chen, S.C.; Zhao, X.; Biswas, A.; Jia, X.L.; Shi, Z.; Fang, J.Y. Estimating forest soil organic carbon content using vis-NIR spectroscopy: Implications for large-scale soil carbon spectroscopic assessment. Geoderma 2019, 348, 37–44. [Google Scholar] [CrossRef]
  17. Liu, J.B.; Xie, J.C.; Han, J.C.; Wang, H.Y.; Sun, J.H.; Li, R.; Li, S.X. Visible and near-infrared spectroscopy with chemometrics are able to predict soil physical and chemical properties. J. Soil. Sediment. 2020, 20, 2749–2760. [Google Scholar] [CrossRef]
  18. Lu, B.; Liu, N.H.; Li, H.L.; Yang, K.F.; Hu, C.; Wang, X.F.; Li, Z.X.; Shen, Z.X.; Tang, X.Y. Quantitative determination and characteristic wavelength selection of available nitrogen in coco-peat by NIR spectroscopy. Soil. Till. Res. 2019, 191, 266–274. [Google Scholar] [CrossRef]
  19. Dalias, P.; Christou, A.; Neocleous, D. Adjustment of Irrigation Schedules as a Strategy to Mitigate Climate Change Impacts on Agriculture in Cyprus. Agriculture 2018, 9, 4. [Google Scholar] [CrossRef] [Green Version]
  20. Puneet, M.; Santosh, L. Improved prediction of protein content in wheat kernels with a fusion of scatter correction methods in NIR data modelling. Biosyst. Eng. 2021, 203, 93–97. [Google Scholar] [CrossRef]
  21. Xu, X.B.; Ren, M.Y.; Cao, J.F.; Wu, Q.Y.; Liu, P.Y.; Lv, J.S. Spectroscopic diagnosis of zinc contaminated soils based on competitive adaptive reweighted sampling algorithm and an improved support vector machine. Spectros. Lett. 2019, 53, 86–99. [Google Scholar] [CrossRef]
  22. Bi, Y.M.; Yuan, K.L.; Xiao, J.Z.; Wu, J.Z.; Shi, C.Y.; Xie, J.; Chu, G.H.; Zhang, G.X.; Zhou, G.J. A local pre-processing method for near-infrared spectra, combined with spectral segmentation and standard normal variate transformation. Anal. Chim. Acta 2016, 909, 30–40. [Google Scholar] [CrossRef] [PubMed]
  23. Nie, L.X.; Dai, Z.; Ma, S.C. Enhanced accuracy of near-infrared spectroscopy for traditional chinese medicine with competitive adaptive reweighted sampling. Anal. Lett. 2016, 49, 2259–2267. [Google Scholar] [CrossRef]
  24. Liu, E.; Liu, J.; Yu, K.Y.; Wang, Y.J.; He, P. A hybrid model for predicting spatial distribution of soil organic matter in a bamboo forest based on general regression neural network and interative algorithm. J. For. Res. 2020, 31, 1673–1680. [Google Scholar] [CrossRef]
  25. Hobimiarantsoa, R.; Kensuke, K.; Yasuhiro, T.; ToTomohiro, N.; Herintsitohaina, R.; Bruce Haja, A.; Andry, A. Prediction of Soil Oxalate Phosphorus using Visible and Near-Infrared Spectroscopy in Natural and Cultivated System Soils of Madagascar. Agriculture 2020, 10, 177. [Google Scholar] [CrossRef]
  26. Li, Z.X.; Tang, X.Y.; Shen, Z.X.; Yang, K.F.; Zhao, L.J.; Li, Y.L. Comprehensive comparison of multiple quantitative near-infrared spectroscopy models for aspergillus flavus contamination detection in peanut. J. Sci. Food Agric. 2019, 99, 5671–5679. [Google Scholar] [CrossRef] [PubMed]
  27. Zhang, Y.; Li, M.Z.; Zheng, L.H.; Zhao, Y.; Pei, X.S. Soil nitrogen content forecasting based on real-time NIR spectroscopy. Comput. Electron. Agric. 2016, 124, 29–36. [Google Scholar] [CrossRef]
  28. Morra, M.J.; Hall, M.H.; Freeborn, L.L. Carbon and nitrogen analysis of soil fractions using near-infrared reflectance spectroscopy. Soil. Sci. Soc. Am. J. 1991, 55, 288–291. [Google Scholar] [CrossRef]
  29. Riikka, R.; Asumund, R. Application of near infrared reflectance (NIR) and fluorescence spectroscopy to analysis of microbiological and chemical properties of arctic soil. Soil Biol. Biochem. 2007, 39, 1664–1673. [Google Scholar] [CrossRef]
  30. Chu, X.L. Molecular Spectroscopy Analytical Technology Combined with Chemometrics and Its Applications; Chemical Industry Press: Beijing, China, 2011. (In Chinese) [Google Scholar]
  31. Bambang, H.K.; Hedley, C.B.; Hedley, M.J.; Hueni, A.; Tuohy, M.P.; Arnold, G.C. The use of diffuse reflectance spectroscopy for in situ carbon and nitrogen analysis of pastoral. Soil Res. 2008, 46, 623–635. [Google Scholar] [CrossRef]
  32. Kodaira, M.; Shibusawa, S. Using a mobile real-time soil visible infrared sensor for high resolution soil property. Geoderma 2013, 199, 54–63. [Google Scholar] [CrossRef]
  33. Shao, Y.N.; He, Y. Nitrogen, phosphorus, and potassium prediction in soils, using infrared spectroscopy. Soil Res. 2010, 49, 166–172. [Google Scholar] [CrossRef]
Figure 1. Equipment for visible and near-infrared spectral measurements. 1. Ball screw. 2. Tungsten halogen lamp. 3. Sample room. 4. Optical fiber. 5. NIR spectrometer. 6. The computer control unit. 7. Monitor.
Agriculture 12 00411 g001
Figure 2. Original spectra showing the available nitrogen content of vermiculite substrates.
Agriculture 12 00411 g002
Figure 3. Feature extraction of successive projection algorithm in the available nitrogen content spectra.
Agriculture 12 00411 g003
Figure 4. Feature extraction processing of the synergy interval partial least squares for the matrix available nitrogen content spectra.
Agriculture 12 00411 g004
Table 1. Available nitrogen content distribution of vermiculite matrix samples.
SubsetsSample NumberRange of Available Nitrogen Content (mg/kg)Mean (mg/kg)Standard Deviation (mg/kg)
Calibration set10811.2–753.21232.29202.886
Prediction set3611.2–699.16228.18200.289
Total samples14411.2–753.21231.26200.848
Table 2. The partial least squares method under different pretreatment methods for predicting the available nitrogen content of vermiculite matrix.
Pre-Processing MethodsNumber of Principal ComponentsRcRMSECRpRMSEVRPD
Original80.9901283.820.9835399.565.28
1st Der90.9955191.690.9861334.566.00
2nd Der70.9957187.630.9827368.985.31
SG80.9945211.030.9942239.918.54
MSC70.9841358.890.9747501.614.27
SNV80.9859337.570.9751515.514.21
1st Der + SG80.9978133.150.9967169.1011.78
2nd Der + SG80.9982120.350.9977141.7812.14
Table 3. Comparing PLSR results after extracting spectral features by successive projection algorithm.
Pre-Processing MethodsNumber of Characteristic VariablesRcRMSECRpRMSEVRPD
Original50.9783419.840.9809395.195.21
1st Der100.9852346.670.9867330.066.18
2nd Der90.9666521.190.9757484.994.36
SG310.9943214.920.9941244.878.49
MSC160.9773427.440.9713503.214.21
SNV270.9812389.420.9699518.454.10
1st Der + SG540.9969160.030.9966186.4510.99
2nd Der + SG550.9967164.450.9950198.759.96
Table 4. Comparing PLSR results after extracting spectral features by a competitive adaptive reweighted sampling algorithm.
Pre-Processing MethodsNumber of Characteristic VariablesRcRMSECRpRMSEVRPD
Original130.9843357.390.9838375.205.57
1st Der260.9938225.210.9878312.606.48
2nd Der250.9920254.700.9896285.087.04
SG290.9926246.050.9914268.367.53
MSC390.9864331.350.9794459.424.72
SNV430.9859337.990.9824420.055.12
1st Der + SG310.9972149.980.9968159.6512.57
2nd Der + SG250.9951199.110.9933228.798.77
Table 5. Comparing PLSR results after extracting spectral features by synergy interval partial least squares.
Pre-Processing MethodsRcRMSECRpRMSEVRPD
Original0.9869325.330.9708570.833.51
1st Der0.9929241.640.9868354.385.65
2nd Der0.9919256.080.9879402.564.98
SG0.9942218.020.9784461.114.34
MSC0.9870324.430.95861164.921.72
SNV0.9870324.470.95991130.791.77
1st Der + SG0.9964172.070.9899313.116.40
2nd Der + SG0.9952198.060.9879402.564.98
Table 6. Comprehensive comparison of the best prediction models from different algorithms for determining the available nitrogen content of a vermiculite matrix.
Pre-Processing MethodsNumber of Characteristic VariablesModeling MethodsRcRMSECRpRMSEVRPD
2nd Der + SG128PLSR0.9982120.350.9977141.7812.14
1st Der + SG54SPA + PLSR0.9969160.030.9966186.4510.99
1st Der + SG31CARS + PLSR0.9972149.980.9968159.6512.57
1st Der + SG24Si-PLS + PLSR0.9964172.070.9899313.116.40
Publisher’s Note: MDPI stays neutral with regard to jurisdictional claims in published maps and institutional affiliations.

