Article

Effect of Organic Matter Removal by Hydrogen Peroxide on the Determination of Soil Particle Size Distribution Using the Dynamometer Method

by
Krzysztof Papuga
1,*,
Jarosław Kaszubkiewicz
1,
Dorota Kawałko
1 and
Maria Kreimeyer
2
1
Institute of Soil Science and Environment Protection, Wrocław University of Environmental and Life Sciences, 25 Norwida St., 50-375 Wrocław, Poland
2
Agrolab Agrar und Umwelt GmbH, Breslauer Str. 60, 31157 Sarstedt, Germany
*
Author to whom correspondence should be addressed.
Agriculture 2022, 12(2), 226; https://doi.org/10.3390/agriculture12020226
Submission received: 15 January 2022 / Revised: 30 January 2022 / Accepted: 2 February 2022 / Published: 4 February 2022
(This article belongs to the Section Agricultural Soils)

Abstract

:
The dynamometer method of determining particle size distribution was developed several years ago. The principles of sample preparation for this method are based on those used in other sedimentation methods. With improvements in these procedures, an investigation of the effect on obtained particle size distribution results by removing organic matter using hydrogen peroxide was proposed. For this purpose, the particle size distributions were determined in 50 soil samples with varying organic matter content, before and after organic matter removal. A comparative analysis of the results, including calculation of the Euclidean distance, was performed on both groups. It was found that differences in the particle size distributions of the soils after the application of hydrogen peroxide were difficult to predict, and irregular in both magnitude and direction. However, in light soils, the process of organic matter removal caused an increase in the clay fraction at the expense of the silt fraction, which decreased. In soils with a higher initial clay fraction, there were decreases in the clay and sand fractions, while the silt fraction increased.

1. Introduction

The particle size distribution is the most important property of soil. Over the past 100 years, several different sedimentation methods have been developed to determine soil particle size distributions [1,2]. These methods include the pipette, hydrometer, Atterberg and photo-sedimentation methods, and the sedimentation balance and centrifugation. The first two are the most commonly used, with the pipette method being considered to be the reference technique [3,4,5]. Sedimentation methods use the Stokes equation, which describes the dependence of the falling velocity of a spherical body on its diameter and density in relation to the dynamic viscosity and density of the fluid it is falling through [6,7,8]. The direct use of Stokes equation in the natural sciences requires certain assumptions to be made that do not fully represent the actual process of particle sedimentation. The Stokes equation concerns the settling of particles in a fluid that fulfil the following conditions: the falling particle has a perfectly spherical shape; the particle falls with uniform motion; the particle is smooth and inelastic; the Reynolds number is <2; the falling particle is not in contact with other particles; and the particle falls in a vessel with a diameter many times the diameter of the particle [9,10,11,12]. When using the Stokes equation in the pipette and hydrometer methods, it is assumed that the soil particle fulfils the assumptions described above. Furthermore, at the beginning of any sedimentation experiment, the soil sample suspension is completely homogenised (i.e., all particles are evenly distributed throughout the medium they are suspended in). In addition, it is only possible to determine fractions consisting of particles of measurable size using the pipette and hydrometer methods. The upper limit is a diameter of 0.1–0.3 mm, as particles with a larger diameter fall off too quickly [13,14,15]. The smallest diameter of the determinable particles is 0.002 mm, below which free fall is significantly affected by Brownian motion [13,16]. It is also assumed that there is no return flow phenomenon affecting the settling velocity of soil particles [17].
Soil does not only consist of mineral grains, which are the subject of the above considerations on the determination of particle size distributions. Soil also contains soil organic matter (SOM), carbonates, salts, and other organic and inorganic compounds. Therefore, the determination of particle size distributions using sedimentation methods requires the appropriate preparation of the soil samples. For each method, there is a different sample preparation procedure; however, practically each method includes the removal of SOM. This is due to two facts. Firstly, it has a specific density of 1.0–1.5 g·cm−3, which significantly differs from the density of the mineral fractions. Secondly, the organic matter causes soil particles to stick together in microaggregates, making full dispersion of the soil sample impossible [18].
Hydrogen peroxide is the most common chemical used to remove SOM, and must be added in appropriate amounts [9,19,20,21]. Then, excess hydrogen peroxide is removed from the sample by heating until no CO2 is released or a much lighter coloured suspension is obtained. Heating the sample also allows the organic matter to decompose more intensively. The process of removing organic matter is time-consuming, thus significantly increasing the sample preparation time. The addition of hydrogen peroxide also strongly influences the properties of the tested soil. Inorganic substances are decomposed and new minerals are formed. It increases the content of Al2O3 and Fe2O3, and affects the particle size distribution of the soil [22,23,24].
Other methods that use the sedimentation process are currently under development that minimise the disadvantages of the methods developed so far [25,26]. In particular, there is a focus on automating the entire process and minimising human involvement [27,28,29]. One of the automated sedimentation methods is the dynamometer method, developed several years ago by the authors. The dynamometer method is based on the measurement of changes in the apparent weight of a float immersed in a sediment soil suspension. The apparent weight of the float is measured using a dynamometer, and a cumulative particle size distribution curve is calculated using the Stokes formula. The advantages of the method are strong compliance with the results of the reference sedimentation method, the ability to analyse multiple fractions, recording results in digital form, and shortening the analysis time in relation to other sedimentation methods. Still a disadvantage of the method is the need for manual sample preparation, as in other sedimentation methods. A detailed description of the method is provided in Kaszubkiewicz et al. [30,31] and Papuga et al. [32]. The developed method requires checking the influence of organic matter removal on the obtained results of particle size distribution. Consequently, the authors attempted to determine the extent to which the organic matter removal process affects the results obtained using the dynamometer method. Moreover, it was checked whether the dynamometer method differed from the other sedimentation methods in this respect, and whether the amount of organic matter in soil samples significantly affects the results of the analysis of particle size distribution using the dynamometer method.

2. Materials and Methods

The 50 samples used in this study were taken from the surface horizon (0–30 cm depth) of agriculturally cultivated soils in the Lower Silesian area (Poland). The soils varied in particle size distribution and soil organic carbon (SOC) content. The samples were air-dried, crushed in mortar, and sifted through a 2 mm sieve. Analyses of the following parameters that influence the sedimentation of soil particles were performed: the SOC content (measured by gas chromatography); the calcium carbonate content (analysed using the volumetric method and a Scheibler apparatus); and the pH in 1:1 soil:water mixture by weight of one part to one part distilled water (by potentiometric pH meter).
The particle size distribution in the samples was then determined using the dynamometer method, with and without SOM removal. The soil suspension was prepared according to the dynamometer method described in Kaszubkiewicz et.al. [31]. An aliquot of 60 g of the sieved soil were weighed and transferred to a glass beaker, to which 25 cm3 of dispersant (sodium hexametaphosphate) and 700 cm3 of distilled water were added (for samples with the organic matter removed, a weight of >60 g was used, in proportion to the SOC content of each soil sample, in order to obtain 60 g of dry soil after organic matter removal). The contents of the beaker were stirred in a laboratory stirrer for 15 min, and then transferred to a measuring cylinder with a capacity of 1000 cm3. The suspension was filled to a volume of 1000 cm3 with distilled water, which was at ambient laboratory temperature. Measurements were taken at a depth of 120 mm. The particle size distribution of the soil samples was determined using the dynamometer method with an automatic sample changer. A detailed description of the method is presented in Kaszubkiewicz et al. [31]. The fractions with equivalent diameters of <0.063, <0.05 and <0.002 mm were measured. The granulometric groups were determined according to the US Department of Agriculture’s classification [33].
The results were verified by comparing the <0.063 fraction content obtained by the dynamometer method with the results obtained by the sieve method. The 2.0–0.063 mm fraction was determined by wet sieving over a sieve with a mesh diameter of 0.063 mm. After rinsing, the soil residue on the sieve was dried, weighed and then the <0.063 mm fraction was calculated (the weight of the dried soil remaining on the sieve was subtracted from the individual weight of soil sample). Comparisons were made for all samples, both those with and without organic matter.
The organic matter was removed according to a procedure reported in the literature, appropriately modified to accommodate the soil weights used (which were heavier than those used in other sedimentation methods) [3,10,34]. To the air-dried soil, 50 mL of distilled water was added, and then 50 mL of 30% hydrogen peroxide. After 24 h, another 50 mL of hydrogen peroxide was added. Then, after another 24 h, the samples were transferred to a heating plate where they were heated to 90 °C until the remaining hydrogen peroxide was completely removed (i.e., until there were no gas bubbles in the suspension).
The results were used to determine the magnitude of the differences between the different fractions of samples subjected to SOM removal and those in which the organic matter was retained. For this purpose, a reduced main axis (RMA) analysis is suggested, instead of simple regression when both variables (in this study, the two variables are the contents of a specific fraction in samples with and without SOM) are affected by measurement errors [35,36]. The regression line is determined in such a way that the sum of the areas of right-angled triangles formed between the measurement points and the line (triangle sum of squares (TSS)) is the smallest. Changes in all three fractions (<0.063, <0.05, and <0.002 mm) were also analysed by determining the Euclidean distance between points. Points are the contents of each fraction measured in samples with and without SOM [37]. The distribution of the Euclidean distances, and the selected statistical parameters that characterised them, were determined (mean, median, range, and Pearson correlation coefficient).

3. Results

3.1. pH, Carbonates and Soil Organic Matter Content

The pH values of the analysed samples ranged from 3.4 to 7.2. Only three samples were classed as strongly acidic and six as acidic. The remaining samples were slightly acid (21) and neutral (20). Classification determined according to the US Department of Agriculture’s classification [33]. The calcium carbonate content in the investigated soils ranged from 0 to 3.8%. In 24 samples, the calcium carbonate content was below detection level (i.e., less than 0.1%). Moreover, a calcium carbonate content in the range of 0.1 to 1% was found in 19 samples. For the remaining seven samples, this value exceeded 1%. The mean calcium carbonate content for all samples was 0.4%, with the median being only 0.1%. Based on the results, it was found that there was no need to remove the calcium carbonate before proceeding with analysis of the particle size distribution. The samples differed in their SOC contents, which ranged from 0.88 to 4.5%. Eighteen samples were from soils containing up to 1.4% organic carbon. The organic carbon content in 21 samples ranged from 1.5 to 2.4%. The remaining 11 samples contained more than 2.4% organic carbon. The mean SOC content was 1.9% and the median was 1.6%. Details of these properties are included in Table 1.

3.2. Particle Size Distribution with and without Soil Organic Matter Removal

Based on determinations of particle size distribution in samples without the SOM removed, the following granulometric groups were distinguished: sandy loam, 18 samples; silt loam, 10; loamy sand, 12; loam, 8; sand, 1; and clay loam, 1. After SOM removal, the classes were: sandy loam, 22 samples; silt loam, 14; loamy sand, 7; loam, 6; and sand, 1. There was no tendency towards a change in category in any particular direction after SOM removal. For example, a sample containing SOM, classed as a clay loam, met the guidelines for loam after removal of the SOM. In four cases, samples that were identified as loam changed the category to silt loam after SOM removal. In five samples, the category changed from loamy sand to sandy loam after removal of the SOM. The classes for each sample are shown in Table 2.
The clay fraction (<0.002 mm) in all the samples with SOM ranged from 0.8 to 27.3%, the mean content being 11.1%, and the median 9.4%. After SOM removal, the range in clay content was from 4.6 to 24.3%, while the mean content (11.6%) changed minimally, and the median increased to 11.4%.
For the silt (0.05–0.002 mm) and sand (2–0.05 mm) fractions, the range was much greater. The silt fraction in all the samples with SOM ranged from 2.1 to 63.2%, the mean content being 31.7%, and the median 28.9%. After SOM removal, the range in silt content was from 5.3% to 65.0%, while the mean silt content (33.5%) was almost identical. The median increased to 30.7%.
The sand fraction in all the samples with SOM ranged from 22.0 to 89.5%, the mean content being 57.2%, and the median 58.1%. After SOM removal, the range in sand content was from 18.9 to 89.2%, while the mean content (54.8%) decreased, and the median decreased to 57.7%. The three fractions in the different samples are shown in Table 3.

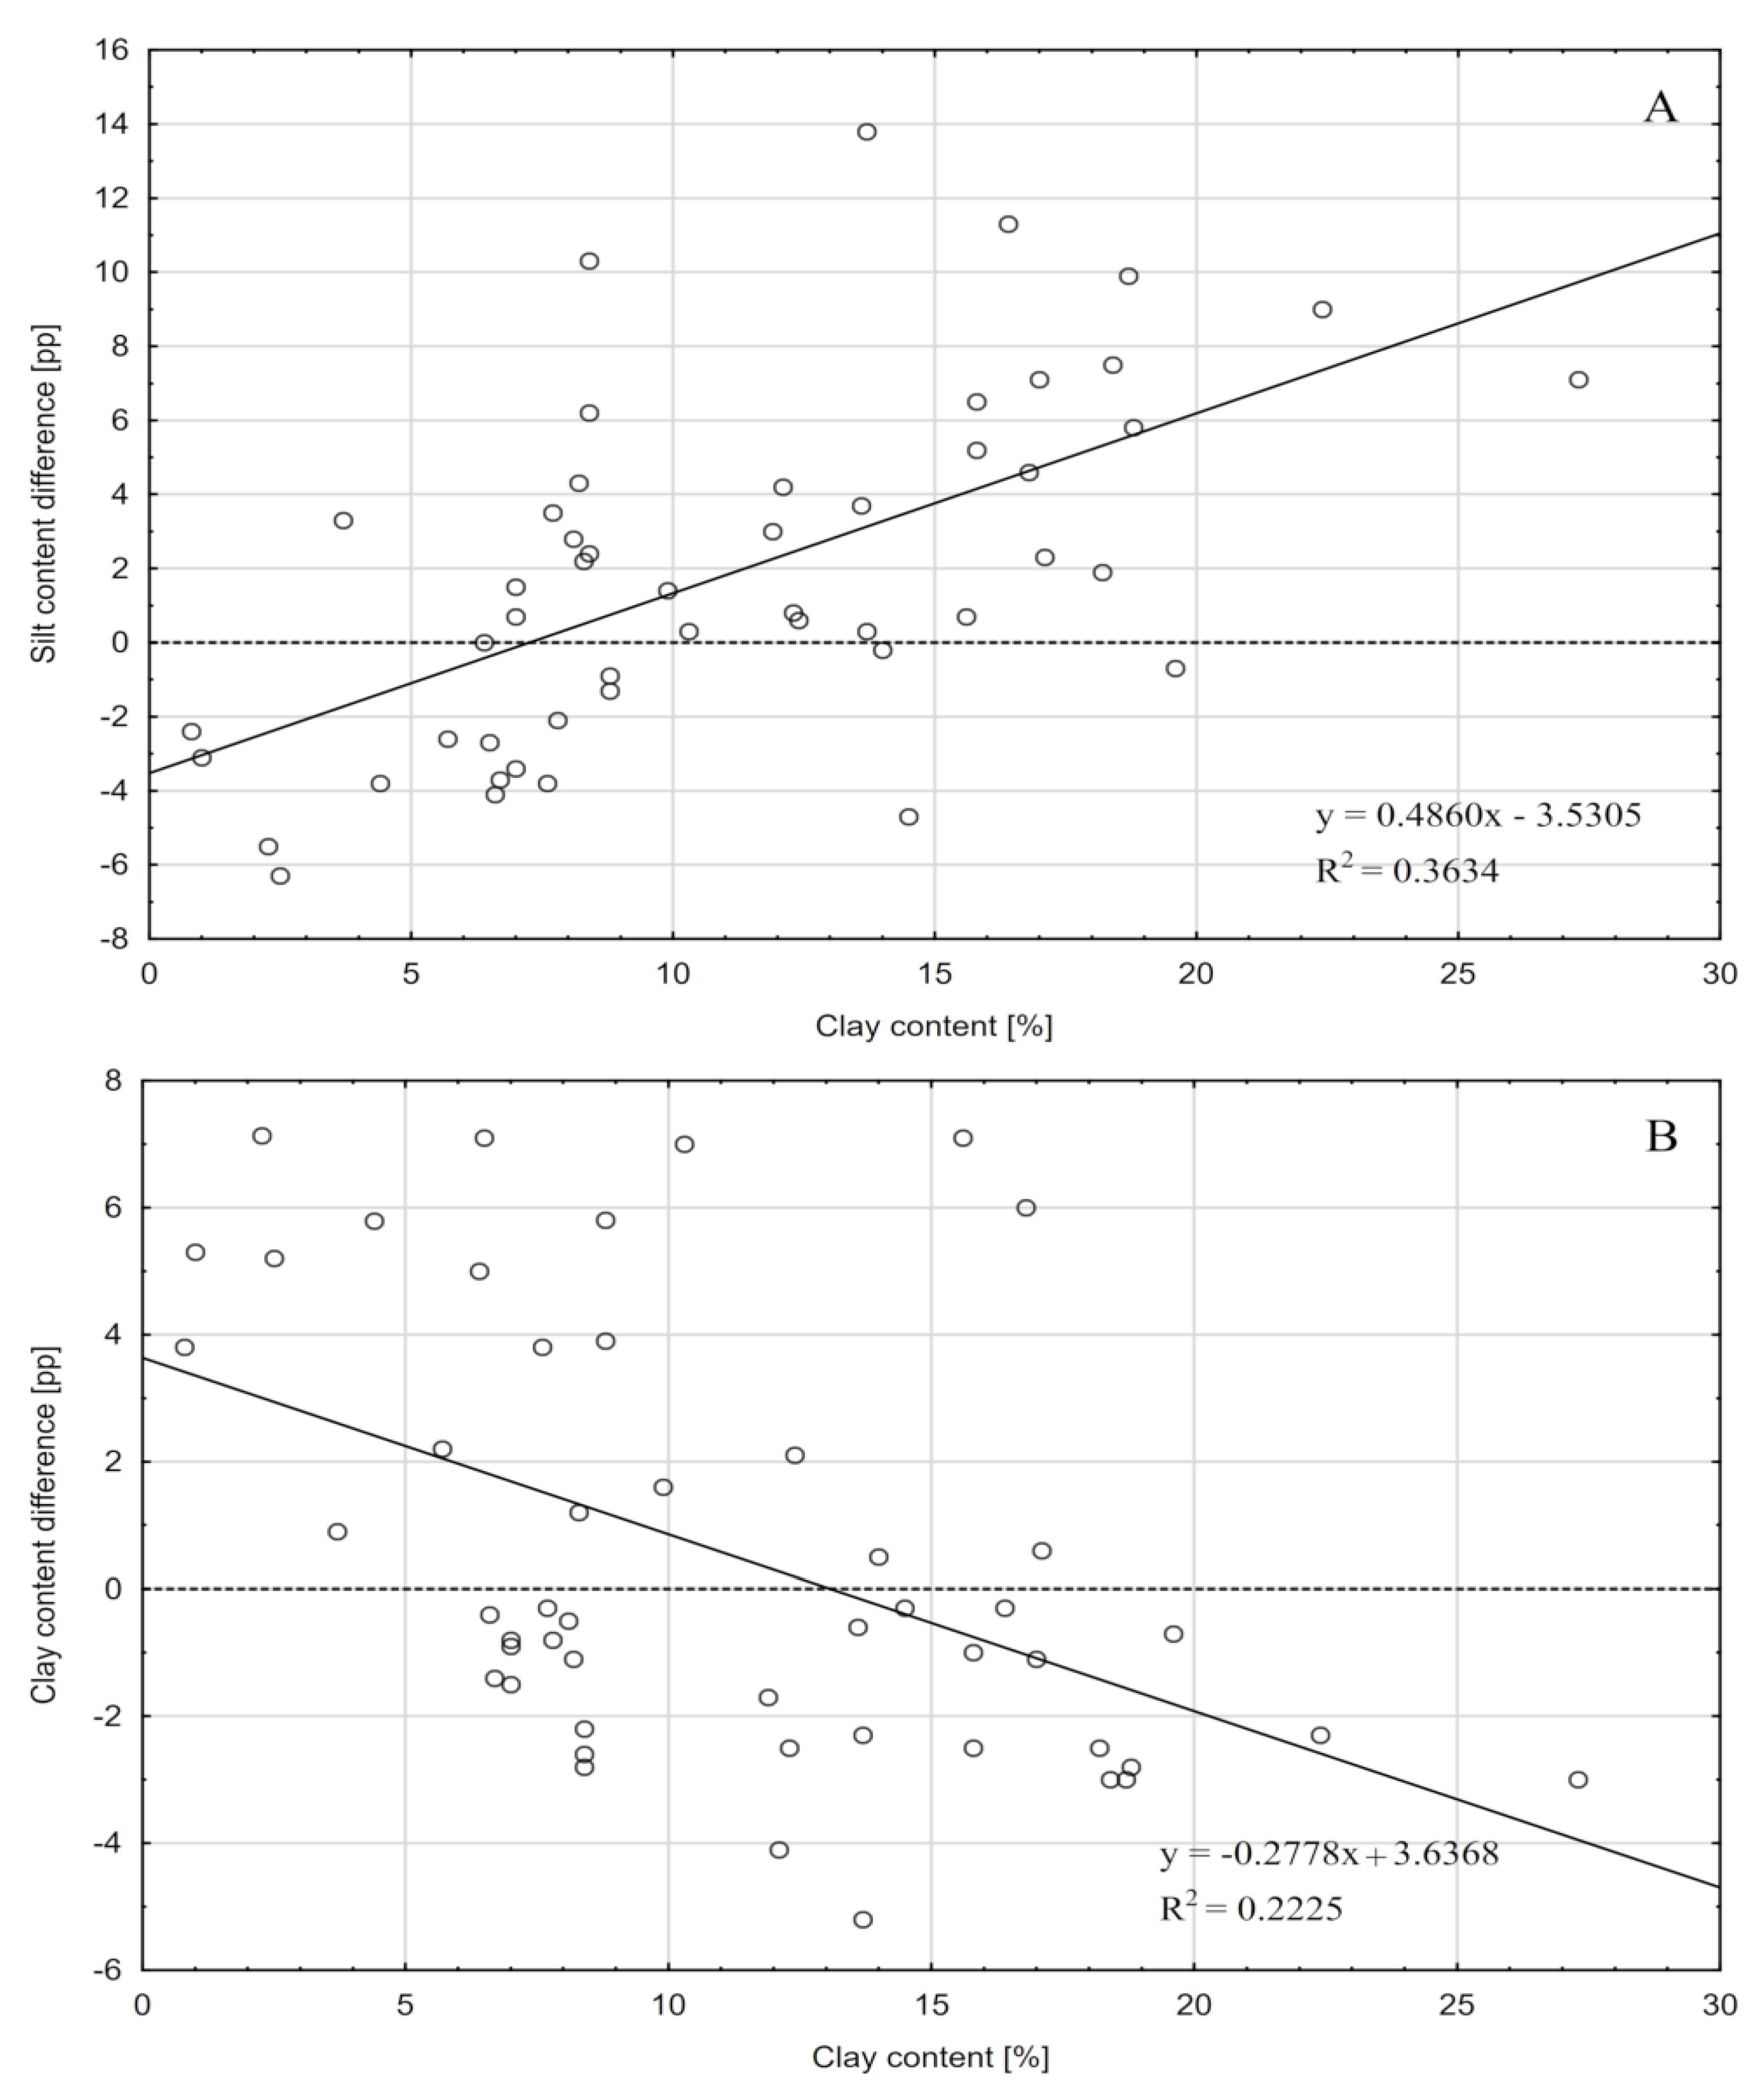
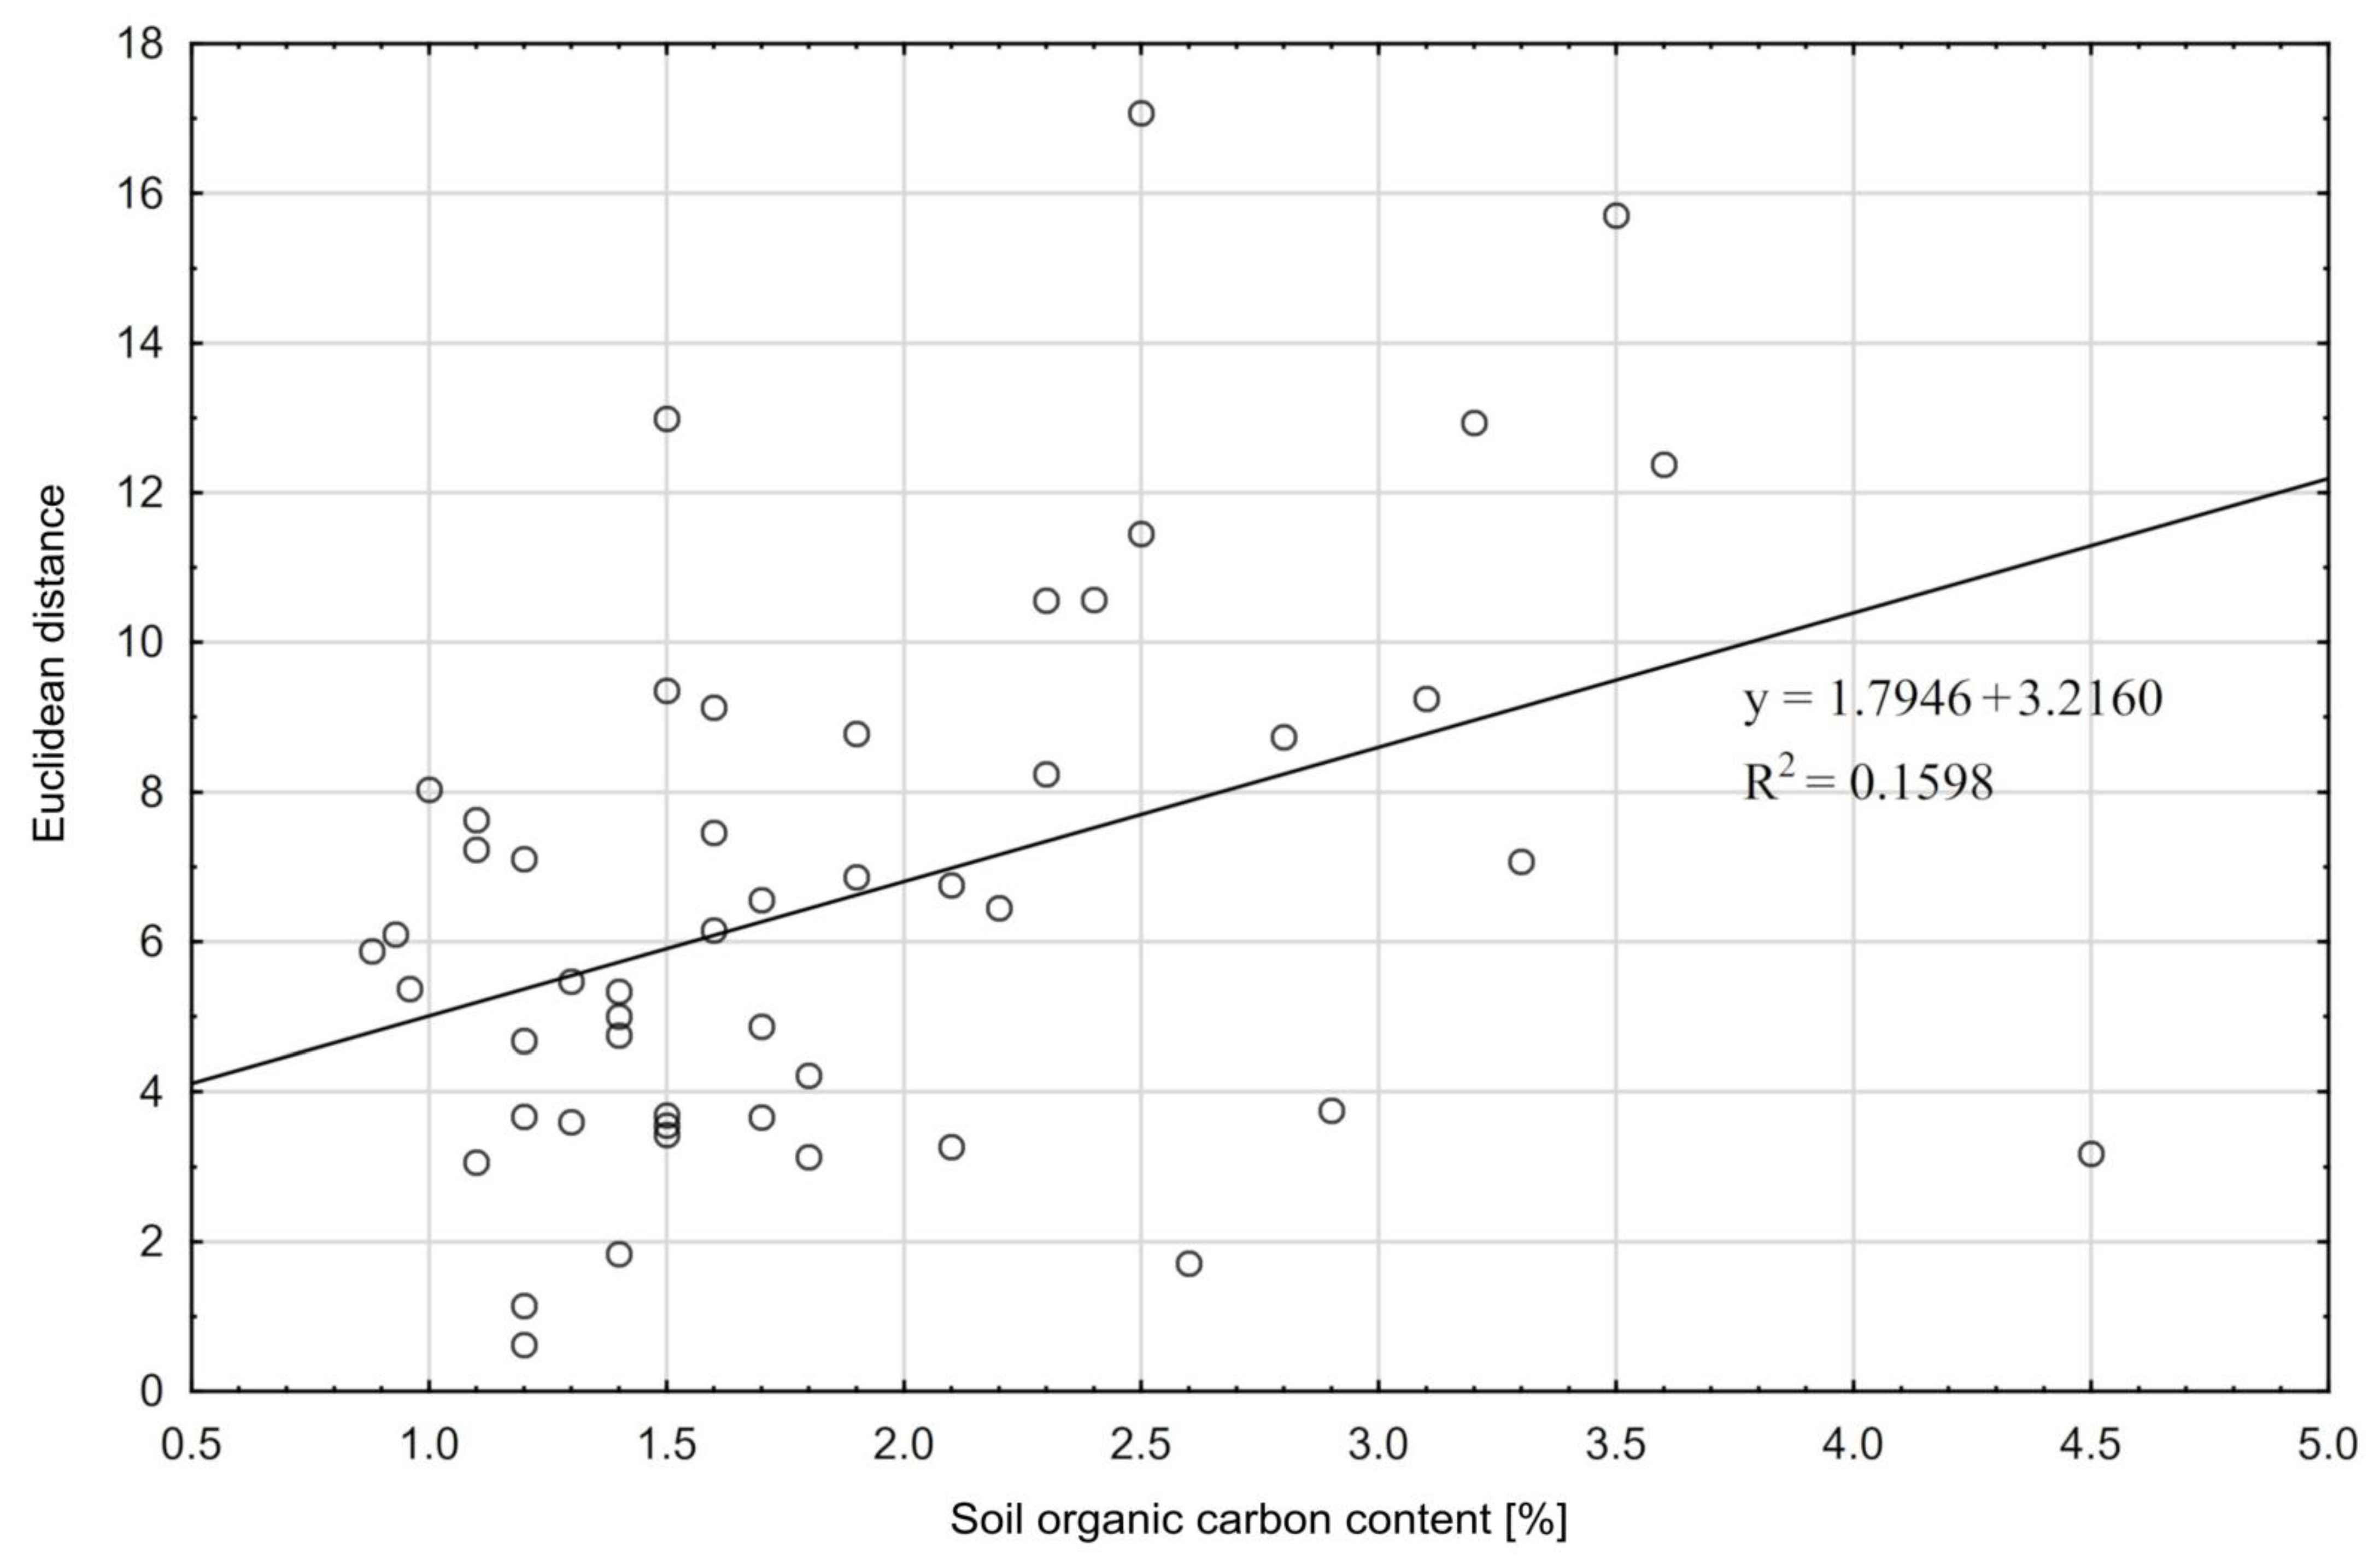
3.3. Differences in the Particle Size Distributions in Samples with and without SOM

Of the 50 samples tested, the granulometric categories of 13 samples after SOM removal were changed. In 11 of these, there was a decrease in sand content after SOM removal. Only in one sample was there an increase in the sand fraction, with a simultaneous decrease in the silt and clay fractions. In one sample, the sand fraction increased, whilst the clay fraction also increased. These re-categorised samples were characterised by at least one fraction being close to the category limit for a particular granulometric group.
The effect of SOM removal on the different fractions showed that the mean sand fraction in the different samples decreased as a result of the SOM removal process by −2.41 percentage points (pps) (minimum −11.0 pps, maximum 5.1 pps). At the same time, the mean silt fraction increased by 1.86 pps (minimum −6.3 pps, maximum 13.8 pps), and the mean clay fraction increased by 0.56 pps (minimum −5.2 pps, maximum 7.1 pps). However, when considering the changes relative to the initial fraction (in samples with SOM) for each sample, the relative changes were much greater for the clay fraction. The mean difference in the clay fraction of different samples was as high as 36.5% (minimum −38.0%, maximum 530.0%). This is due to the fact that the finest fraction was the least abundant, so every 1 pp difference translated into a large relative difference. For the silt fraction, this value was 9.6% (minimum −39.0%, maximum 295.0%). Such a large maximum difference occurred in sample 13, which contained only 2.1% silt in the variant with SOM. For sand, this value was −6.3% (minimum −34.9%, maximum 8.9%). The average sand and silt fractions were much more abundant than the clay fractions.
The change (value after SOM removal—value before SOM removal) in the sand fraction as a result of SOM removal was positively correlated with its initial content and negatively correlated with the initial contents of silt and clay. These correlations were statistically significant at p < 0.05. The change in silt content was, in turn, negatively correlated with the initial sand content and positively correlated with the initial silt and clay contents. These correlations were statistically significant at p < 0.05. For the change in silt content and initial clay content, the correlation coefficient was 0.6029 and the linear regression equation had the form y = 0.4860x − 3.5305 (increasing trend). Furthermore, the change in clay content due to SOM removal was negatively correlated with initial clay content. These correlations were statistically significant at p < 0.05. The correlation coefficient for these two quantities was 0.4717, and the linear regression equation had the form y = −0.2778x + 3.6368 (decreasing trend). Thus, in light soils (sandy, containing <10% clay fraction), the process of SOM removal caused an increase in the clay fraction at the same time as a decrease in the silt fraction. On the other hand, in soils with a higher initial clay fraction (medium and heavy soils, containing >10% clay), the SOM removal process caused a decrease in the clay and sandy fractions, while the silt fraction increased (Figure 1). A correlation between changes in the three fractions as a result of SOM removal and the initial SOC content of the soil samples was also tested. It was found that there was a negative, statistically significant correlation for the sand fraction (r = –0.3718, p = 0.008) and a positive correlation for the silt fraction (r = 0.3171, p = 0.025).
The Euclidean distance was used to provide an overall assessment of the influence of the SOM removal process on the results of the dynamometer method. In this study, the distance was between points in a three-dimensional space describing the particle size distribution through three parameters (the sand, silt, and clay fractions). The points represented the differences between these fractions in samples with and without SOM. The Euclidean distance thus calculated for the 50 samples ranged from 0.6 to 17.1%, with a mean value of 6.6% and a standard deviation of 3.6%. The Euclidean distance between the means of the different fractions calculated before and after SOM removal was also determined, and found to be 3.1%, with the ratio of the two values being 2.13 (2.13 = 6.6%/3.1%). Thus, it can be concluded that, while the individual sample results sometimes changed significantly during the SOM removal process, the change in the means of the different fractions was much smaller. In other words, the changes in the different fractions were irregular and did not show an overall trend. The Euclidean distance was found to be correlated with the organic matter content of the samples. These correlations were statistically significant (r = 0.3998 and p = 0.004) (Figure 2).

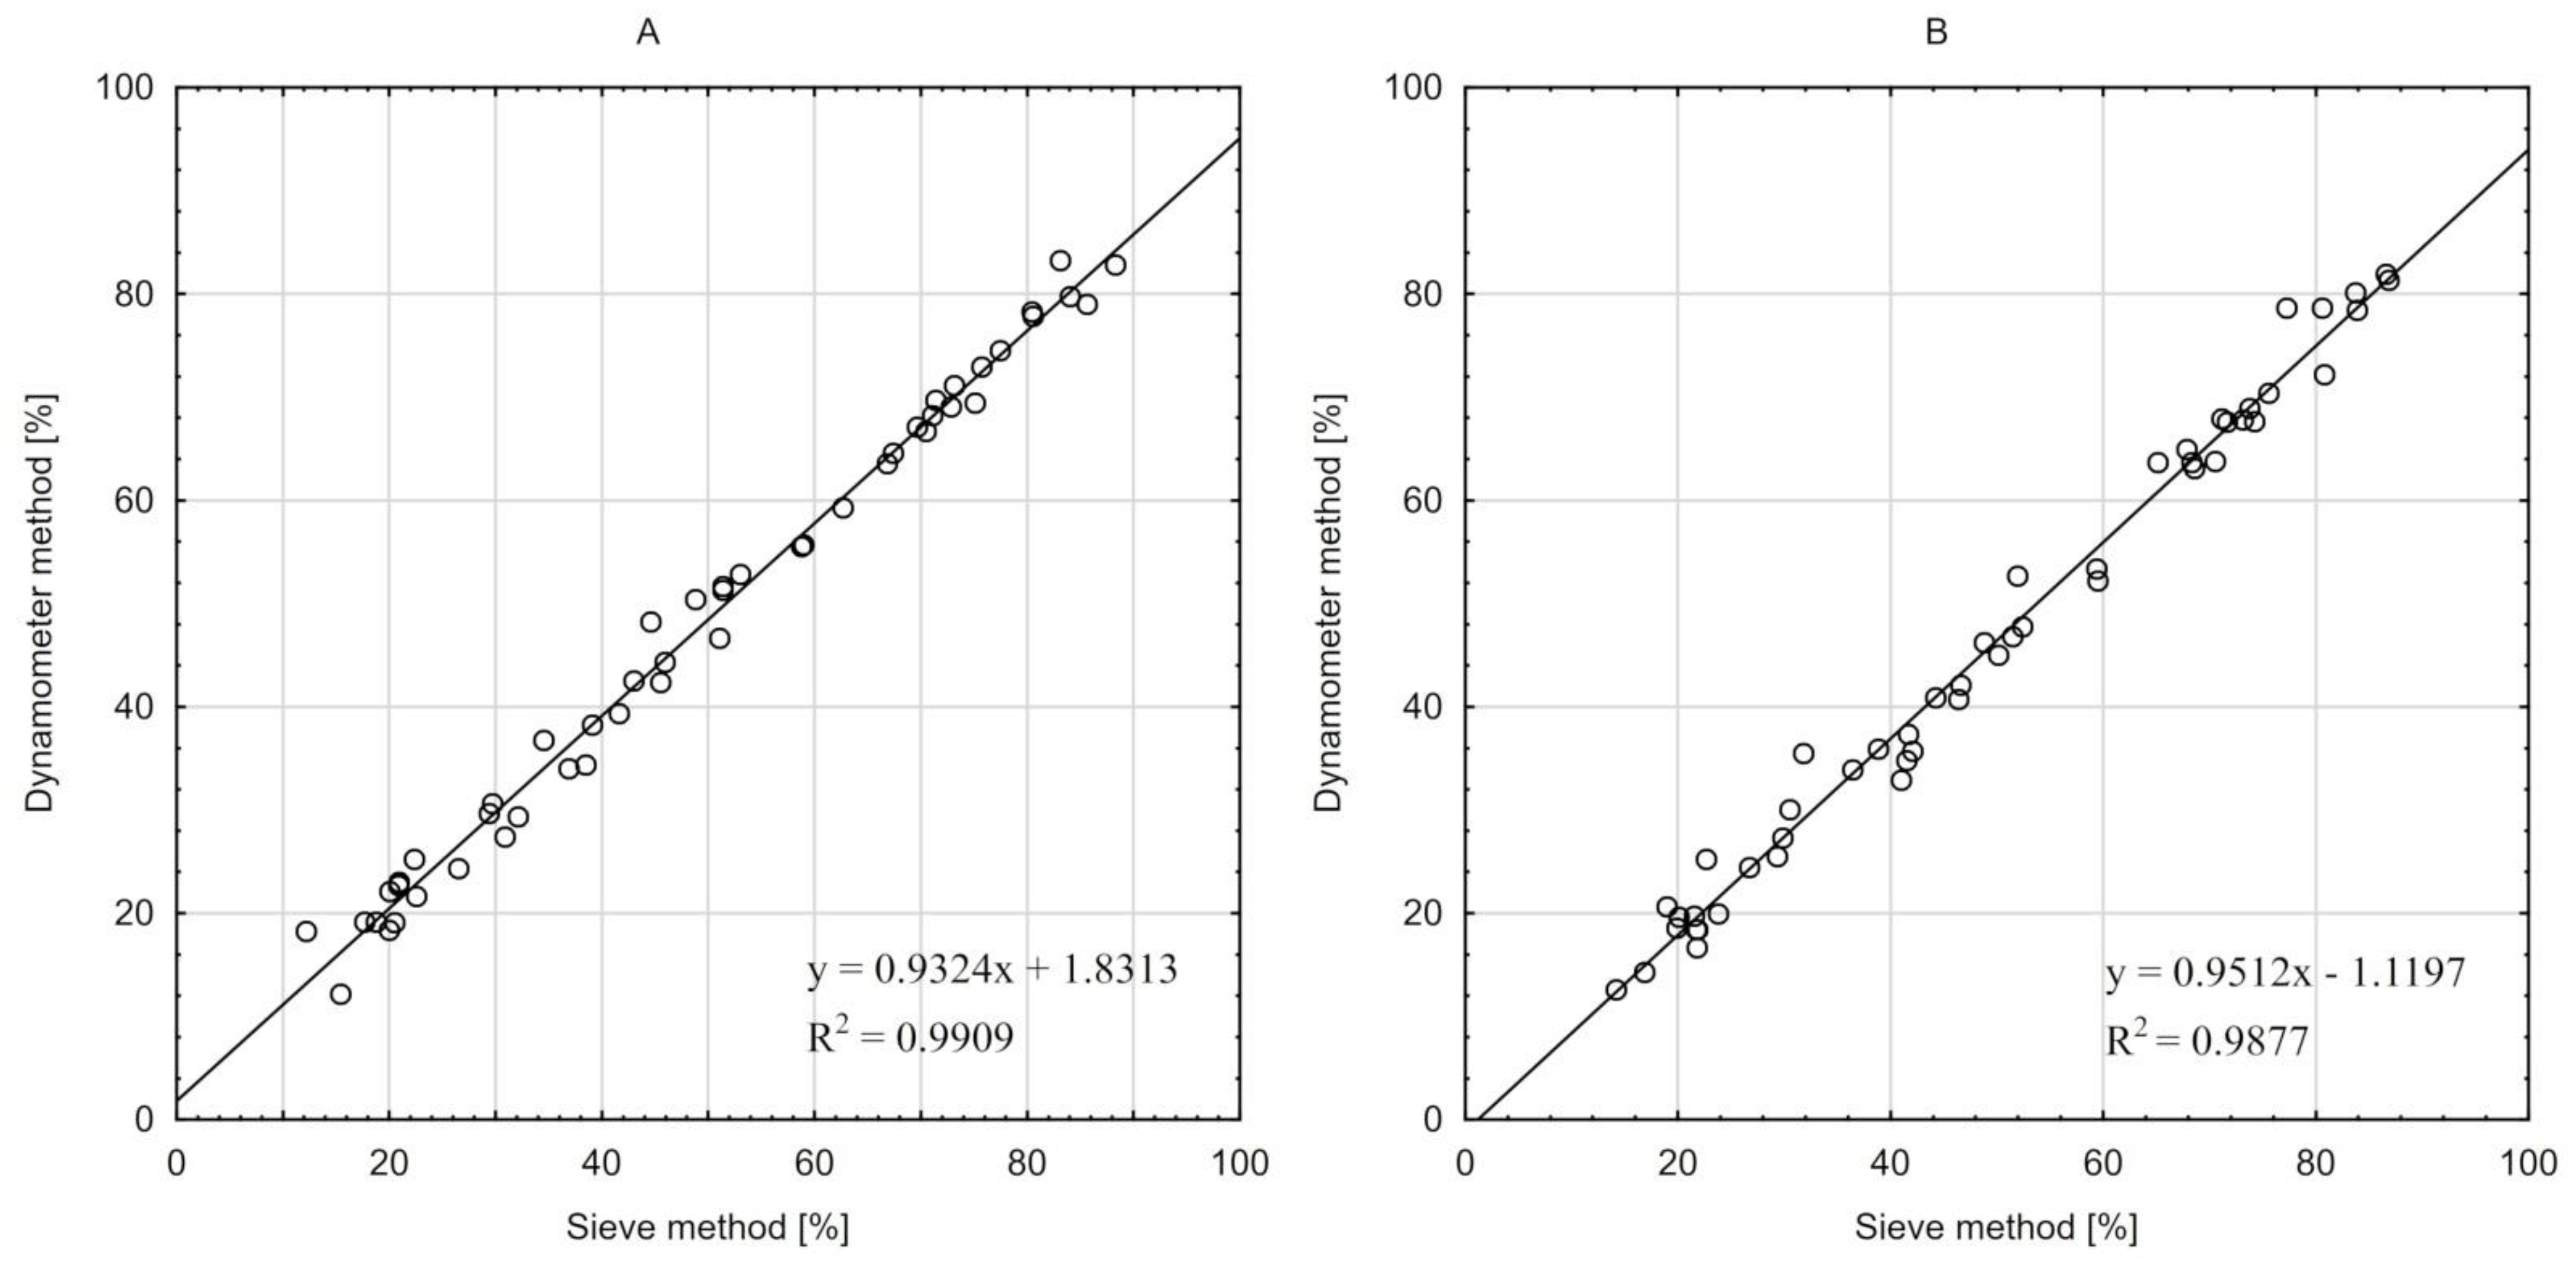
3.4. Fractions <0.063 mm Obtained by the Dynamometer and Sieve Methods

To control the quality of the results of the particle size analysis using the dynamometer method, a comparison was made between data from the <0.063 mm fraction determined by dynamometer and those of the same fraction determined by wet sieving. For samples with SOM, the fraction determined using both methods correlated at r = 0.9954, and the trend line for their mutual relation had the form y = 0.9324x + 1.8313 (where x is the <0.063 fraction measured by wet sieving, and y is the same fraction measured by dynamometer. A similar correlation was occurred for the two methods after SOM removal, with r = 0.9938 and the trend line being y = 0.9512x + 1.1197 (Figure 3).
Using this regression model [35,36], for the samples with SOM, the equation y = 0.9367x + 1.6203 was obtained (determinations as above), and the TSS value was 111.6. The average for one measurement was 2.232. For the samples after SOM removal, the regression line determined by the RMA method was described by the equation y = 0.9571x − 1.4117, and the TSS value was 158.7. The average TSS for one measurement was 3.175. In both cases, agreement between the sieve and dynamometer determinations was high, with similar values, and only slightly affected by the SOM removal process.

4. Discussion

When considering SOM, in terms of its influence on the results of the sedimentary analysis of particle size distribution, it is important to note that it occurs in particulate organic matter (POM) and mineral-associated organic matter (MAOM) forms. Additionally, dissolved organic matter is present, but its proportion is small in relation to total organic matter [38]. MAOM and POM differ in density and particle size. MAOM is associated with silt and clay fractions and its particles are smaller than 0.057 mm. POM is composed of organic matter particles with sizes in the range 0.0057–2.0 mm and is not bound in microaggregates [39,40,41]. These differ in their properties, including in their influence on the results of particle size analysis by sedimentation methods [42]. The different properties of these fractions strongly complicate the effect of SOM removal on the results of soil particle size distribution using sedimentation methods. The authors consider that the changes in the different fractions resulting from SOM removal were caused by two factors.
The first factor is the mineralisation of organic matter with the removal of its decomposition products. In the measurement process of samples containing SOM, its particles were determined as mineral grains. Their lower density value caused the organic particles and organic-mineral complexes to fall with velocities lower than their equivalent diameters would suggest. Therefore, they were interpreted as small particles, while in reality, they are particles with larger diameters. The results of the tests only partially confirmed this observation because, although the average sum of the <0.063 mm fractions measured by dynamometer method and the >0.063 mm fractions measured by sieving was higher for samples with SOM (98.51%) than for those after SOM removal (96.33%), both indicated numbers below 100%.
The Stokes [43] equation shows that particles with densities ρ s 1 and ρ s 2 have equal falling velocities when their diameters, D1 and D2, satisfy the equation:
D 1   D 2 = ( ρ s 2 ρ w ) ( ρ s 1 ρ w )
where ρ w is the water density.
Therefore, SOM particles with diameters slightly larger than 0.063 mm are shown as <0.063 mm in the sedimentation analysis and simultaneously as >0.063 mm in the sieve analysis. As a result, the sum of the <0.063 mm fraction measured by sedimentation dynamometer and the >0.063 mm fraction measured by sieve analysis should be greater than 100%. However, this is not confirmed by the results obtained. Two explanations are possible. The first is that SOM particles are generally smaller in diameter than 0.063 mm, so they would appear only once during the analysis. This is consistent with data from the literature. Barthès et al. [44] reported that SOM particle diameters are mostly smaller than 0.02 mm. A second explanation is that the dynamometer method underestimated the fractions. It is highly likely that both effects might occur simultaneously, and the absence of SOM particles with dimensions not much larger than 0.063 mm.
The second factor is the effect of the SOM removal process on the mineral particles associated with organic matter. SOM particles are found in soil in a form associated with different granulometric fractions which affects the interpretation of their equivalent diameters in sedimentation measurements [45]. Some SOM (especially that which is less than 6 years of age) may be responsible for the ability of soil particles and aggregates to stick together [46]. The simple peptisation process does not significantly affect their stability. The process of SOM oxidation using H2O2 can break it down, causing the mineral particles (actually aggregates) to break down into smaller fragments, thus changing the sedimentation velocity of the associated mineral particles [47]. Organic-mineral complexes containing MAOM have a lower average density than mineral soil particles. Mineralisation of their organic fraction causes an increase in density, and thus an increase in sedimentation velocity in aqueous suspension. Such particles can therefore be interpreted in the sedimentation analysis as being larger than they originally were, despite the loss of some mass. The results of the sedimentation analysis may also have been influenced by the heating of the suspension and the contact time with the aqueous peptiser solution, which was longer than in the samples from which SOM was not removed. The preparation of the samples may not have disintegrated all the aggregates, which disintegrated later in the organic matter removal process. Moreover, the interpretation of results may be hindered by the shape of clay grains, which may significantly deviate from the spherical shape (which is one of the conditions for the application of the Stokes equation). Despite the existence of a modified Stokes equation [12], the currently used algorithms of the dynamometer method do not contain equations correcting the deviation of clay particles from the spherical shape.
Removal of the SOM therefore resulted in a relative increase in the mineral fractions and a decrease in the content of grains with dimensions corresponding to the diameters of substitute grains of POM and MAOM. The results of these processes are complex, depending not only on the SOM content, but also on the diameters of its substitute grains, their association with different mineral fractions, and the particle size distribution of the mineral fractions. Obviously, this effect should have had a decreasing significance as the initial SOM content decreased. Beuselinck et al. [48] found that the process of SOC removal from samples containing <1% SOC (SOC equivalent to 1.7% SOM) did not significantly affect the results of their study; the results of the present study at least partly support that finding. In samples containing up to 0.9% SOC, the application of hydrogen peroxide did not affect the results of the particle size distribution analysis. An even higher value was reported by Jensen et al. [49], who concluded that the organic carbon limit above which organic matter should be removed was 2%. They also found that, above this content, there was a large increase in the underestimation of the silt and clay fractions in samples that the organic matter had not been removed from. Similar conclusions were reached by Hereter et al. [50]. SOM should be removed if the SOM content is greater than 2% and the sample has a <0.002 mm fraction greater than 25%. Such sample properties result in an underestimation of the clay fraction in samples that have not been pre-treated. However, our results did not confirm this observation. On the other hand, Zimmermann and Horn [24] reported significant differences in the different fractions in their study, with the removal of SOM causing an increase in the clay fraction and a decrease in the silt and sand fractions.

5. Conclusions

Changes in the particle size distribution of soils due to the removal of SOM using 30% hydrogen peroxide were irregular in both magnitude and direction. Only in light soils (containing an initial <10% clay fraction) was it found that the SOM removal process caused an increase in the clay fraction and a decrease in the silt fraction. In soils with a higher initial clay fraction (>10%), the SOM removal process caused a decrease in the clay and sand fractions, with a simultaneous increase in the silt fraction.
It was observed that there was a negative, statistically significant correlation between the initial SOM content and the change in the sand fraction, and a positive correlation between the initial SOM content and the change in the silt fraction. This suggests that the SOM particles in the soil had diameters smaller than 0.063 mm in most cases.
The mechanisms responsible for changes in the particle size distributions resulting from the removal of SOM are complex, with their orientation resulting from the SOM content and properties, and the nature of the links between SOM and the soil mineral fraction. Potentially important influences on the results may include the breakdown of microaggregates bound by young SOM, a change in the average density of mineral organic particles in the mineralisation of their organic parts, or a relative increase in some soil fractions. All this indicates that, in soils with different origins, compositions and content of different types of organic matter, the effect of SOM removal may be difficult to predict. Therefore, there was no rationale for removing SOM in samples containing less than 2% SOM. The effect of organic matter removal on the results obtained by the dynamometer method is consistent with that presented in work on other sedimentation methods.

Author Contributions

Conceptualization, K.P. and J.K.; methodology, K.P. and J.K.; validation, K.P. and J.K.; formal analysis, K.P.; investigation, K.P. and M.K.; resources, K.P.; data curation, J.K.; writing—original draft preparation, K.P.; writing—review and editing, K.P. and J.K.; visualization, K.P.; supervision, J.K. and D.K.; project administration, J.K. All authors have read and agreed to the published version of the manuscript.

Funding

This research received no external funding.

Institutional Review Board Statement

Not applicable.

Informed Consent Statement

Not applicable.

Data Availability Statement

Not applicable.

Acknowledgments

We would like to thank Michał Staś for valuable assistance in the data collection. The APC is co-financed by Wroclaw University of Environmental and Life Sciences.

Conflicts of Interest

The authors declare no conflict of interest. The funders had no role in the design of the study; in the collection, analyses, or interpretation of data; in the writing of the manuscript, or in the decision to publish the results.

References

  1. Ryżak, M.; Walczak, R.T.; Niewczas, J. Comparison of particle size distribution in soils from laser diffraction and sedimentation methods. Acta Agrophys. 2004, 4, 509–518. [Google Scholar]
  2. Dipova, N. Determining the grain size distribution of granular soils using image analysis. Acta Geotech. Slov. 2017, 1, 29–37. [Google Scholar]
  3. Ryżak, M.; Bartmiński, P.; Bieganowski, A. Methods for determination of particle size distribution of mineral soils. Acta Agrophys. 2009, 175, 5–84. [Google Scholar]
  4. Taubner, H.; Roth, B.; Tippkötter, R. Determination of Soil Texture: Comparison of the Sedimentation Method and the Laser-Diffraction Analysis. J. Plant Nutr. Soil Sci. 2009, 172, 161–171. [Google Scholar] [CrossRef]
  5. Elfaki, J.T.; Gafer, M.A.; Sulieman, M.M.; Ali, M.E. Hydrometer method against pipette method for estimating soil particle size distribution in some soil types selected from Central Sudan. Int. J. Eng. Res. 2016, 2, 25–41. [Google Scholar]
  6. McCave, I.N.; Syvitski, J.P.M. Principles and Methods of Geological Particle Size Analysis. In Principles, Methods and Application of Particle Size Analysis; Syvitski, J.P.M., Ed.; Cambridge University Press: Cambridge, UK, 1991; pp. 3–21. ISBN 978-0-521-36472-0. [Google Scholar]
  7. Buchan, G.; Grewal, K.; Claydon, J.; Mcpherson, R. A Comparison of Sedigraph and Pipette Methods for Soil Particle-Size Analysis. Soil Res. 1993, 31, 407. [Google Scholar] [CrossRef]
  8. Stokes, G.G. Mathematical and Physical Papers; Cambridge University Press: Cambridge, UK, 2009; ISBN 978-0-511-70226-6. [Google Scholar]
  9. McKenzie, N.; Coughlan, K.; Cresswell, H. Soil Physical Measurement and Interpretation for Land Evaluation; CSIRO Publishing: Clayton, Australia, 2002; ISBN 978-0-643-06987-9. [Google Scholar]
  10. Di Stefano, C.; Ferro, V.; Mirabile, S. Comparison between Grain-Size Analyses Using Laser Diffraction and Sedimentation Methods. Biosyst. Eng. 2010, 106, 205–215. [Google Scholar] [CrossRef]
  11. Sochan, A.; Bieganowski, A.; Bartmiński, P.; Ryżak, M.; Brzezińska, M.; Dębicki, R.; Stuczyński, T.; Polakowski, C. Use of the Laser Diffraction Method for Assessment of the Pipette Method. Soil Sci. Soc. Am. J. 2015, 79, 37–42. [Google Scholar] [CrossRef]
  12. Faroughi, S.A.; Huber, C.A. Theoretical Hydrodynamic Modification on the Soil Texture Analyses Obtained from the Hydrometer Test. Géotechnique 2016, 66, 378–385. [Google Scholar] [CrossRef]
  13. Allen, T. Particle Size, Shape and Distribution. In Particle Size Measurement; Springer: Dordrecht, The Netherlands, 1990; pp. 124–191. ISBN 978-94-010-6673-0. [Google Scholar]
  14. Van Rijn, L. Principles of Sediment Transport in Rivers, Estuaries and Coastal Seas; Aqua Publications: Amsterdam, The Netherlands, 1993; ISBN 9080035629. [Google Scholar]
  15. Jillavenkatesa, A.; Dapkunas, S.J.; Lum, L.S.H. NIST Recommended Practice Guide—Particle Size Characterization; National Institute of Standards and Technology: Washington, DC, USA, 2001. [Google Scholar]
  16. Shein, E.V. The Particle-Size Distribution in Soils: Problems of the Methods of Study, Interpretation of the Results, and Classification. Eurasian Soil Sci. 2009, 42, 284–291. [Google Scholar] [CrossRef]
  17. Papuga, K.; Kaszubkiewicz, J.; Kawałko, D. Do We Have to Use Suspensions with Low Concentrations in Determination of Particle Size Distribution by Sedimentation Methods? Powder Technol. 2021, 389, 507–521. [Google Scholar] [CrossRef]
  18. Hassink, J.; Whitmore, A.P.; Kubat, J. Size and density fractionation of soil organic matter and the physical capacity of soils to protect organic matter. Eur. J. Agron. 1997, 7, 189–199. [Google Scholar] [CrossRef]
  19. Van Reeuwijk, L.P. Procedures for Soil Analysis, 6th ed.; ISRIC: Wageningen, The Netherlands, 2002. [Google Scholar]
  20. Blott, S.J.; Croft, D.J.; Pye, K.; Saye, S.E.; Wilson, H.E. Particle Size Analysis by Laser Diffraction. Geol. Soc. Lond. Spec. Publ. 2004, 232, 63–73. [Google Scholar] [CrossRef]
  21. Vdovic, N.; Pikelj, K.; Jurina, I.; Ivanic, M.; Dunato, N. The Implications of Sample Preparation on the Particle Size Distribution of Soil. J. Plant Nutr. Soil Sci. 2019, 9, 277–285. [Google Scholar] [CrossRef]
  22. Sasaki, S. Hydrogen peroxide treatment on typical Hokkaido soils. Soil Sci. Plant Nutr. 1961, 6, 106–113. [Google Scholar] [CrossRef]
  23. Mikutta, R.; Kleber, M.; Kaiser, K.; Jahn, R. Review: Organic Matter Removal from Soils Using Hydrogen Peroxide, Sodium Hypochlorite, and Disodium Peroxodisulfate. Soil Sci. Soc. Am. J. 2005, 69, 16. [Google Scholar] [CrossRef]
  24. Zimmermann, I.; Horn, R. Impact of Sample Pretreatment on the Results of Texture Analysis in Different Soils. Geoderma 2020, 371, 114379. [Google Scholar] [CrossRef]
  25. Durner, W.; Iden, S.C.; von Unold, G. The Integral Suspension Pressure Method (ISP) for Precise Particle-Size Analysis by Gravitational Sedimentation: ISP Method for Particle-Size Analysis. Water Resour. Res. 2017, 53, 33–48. [Google Scholar] [CrossRef]
  26. Ghasemy, A.; Rahimi, E.; Malekzadeh, A. Introduction of a New Method for Determining the Particle-Size Distribution of Fine-Grained Soils. Measurement 2019, 132, 79–86. [Google Scholar] [CrossRef]
  27. Turlej, T. Automation of Sedimentation Test. Water Sci. Technol. 2018, 77, 1960–1966. [Google Scholar] [CrossRef]
  28. Murad, M.O.F.; Jones, E.J.; Minasny, B. Automated Soil Particle-size Analysis Using Time of Flight Distance Ranging Sensor. Soil Sci. Soc. Am. J. 2020, 84, 690–699. [Google Scholar] [CrossRef]
  29. Orhan, U.; Kılınç, E. Estimating Soil Texture with Laser-Guided Bouyoucos. Automatika 2020, 61, 1–10. [Google Scholar] [CrossRef]
  30. Kaszubkiewicz, J.; Wilczewski, W.; Novák, T.J.; Woźniczka, P.; Faliński, K.; Belowski, J.; Kawałko, D. Determination of Soil Grain Size Composition by Measuring Apparent Weight of Float Submerged in Suspension. Int. Agrophys. 2017, 31, 61–72. [Google Scholar] [CrossRef] [Green Version]
  31. Kaszubkiewicz, J.; Papuga, K.; Kawałko, D.; Woźniczka, P. Particle Size Analysis by an Automated Dynamometer Method Integrated with an X-y Sample Changer. Measurement 2020, 157, 107680. [Google Scholar] [CrossRef]
  32. Papuga, K.; Kaszubkiewicz, J.; Wilczewski, W.; Staś, M.; Belowski, J.; Kawałko, D. Soil Grain Size Analysis by the Dynamometer Method—A Comparison to the Pipette and Hydrometer Method. Soil Sci. Annu. 2018, 69, 17–27. [Google Scholar] [CrossRef]
  33. Soil Survey Division Staff. Soil Survey Manual: Soil Conservation Service, U.S. Department of Agriculture Handbook 18; U.S. Department of Agriculture: Washington, DC, USA, 1993.
  34. Coates, G.F.; Hulse, C.A. A Comparison of Four Methods of Size Analysis of Fine-Grained Sediments. N. Z. J. Geol. Geophys. 1985, 28, 369–380. [Google Scholar] [CrossRef]
  35. Smith, R.J. Use and misuse of the reduced major axis for line-fitting. Am. J. Biol. Anthropol. 2009, 140, 476–486. [Google Scholar] [CrossRef]
  36. Harper, W.V. Reduced Major Axis Regression: Teaching Alternatives to Least Squares. In Proceedings of the Ninth International Conference on Teaching Statistics (ICOTS9), Flagstaff, AZ, USA, 13–18 July 2014. [Google Scholar]
  37. Iglesias, F.; Kastner, W. Analysis of Similarity Measures in Times Series Clustering for the Discovery of Building Energy Patterns. Energies 2013, 6, 579–597. [Google Scholar] [CrossRef] [Green Version]
  38. Bolan, N.S.; Adriano, D.C.; Kunhikrishnan, A.; James, T.; McDowell, R.; Senesi, N. Dissolved Organic Matter. In Advances in Agronomy; Elsevier: Amsterdam, The Netherlands, 2011; Volume 110, pp. 1–75. ISBN 978-0-12-385531-2. [Google Scholar]
  39. Six, J.; Conant, R.T.; Paul, E.A.; Paustian, K. Stabilization mechanisms of soil organic matter: Implications for C-saturation of soils. Plant Soil 2002, 241, 155–176. [Google Scholar] [CrossRef]
  40. Totsche, K.U.; Amelung, W.; Gerzabek, M.H.; Guggenberger, G.; Klumpp, E.; Knief, C.; Lehndorff, E.; Mikutta, R.; Peth, S.; Prechtel, A.; et al. Microaggregates in Soils. J. Plant Nutr. Soil Sci. 2018, 181, 104–136. [Google Scholar] [CrossRef] [Green Version]
  41. Cotrufo, M.F.; Ranalli, M.G.; Haddix, M.L.; Six, J.; Lugato, E. Soil Carbon Storage Informed by Particulate and Mineral-Associated Organic Matter. Nat. Geosci. 2019, 12, 989–994. [Google Scholar] [CrossRef]
  42. Lavallee, J.M.; Soong, J.L.; Cotrufo, M.F. Conceptualizing Soil Organic Matter into Particulate and Mineral-associated Forms to Address Global Change in the 21st Century. Glob. Change Biol. 2020, 26, 261–273. [Google Scholar] [CrossRef] [PubMed] [Green Version]
  43. Stokes, G.G. On the effect of the internal friction of fluids on the motion of pendulums. Trans. Camb. Philos. Soc. 1850, 9, 8–106. [Google Scholar]
  44. Barthès, B.G.; Brunet, D.; Hien, E.; Enjalric, F.; Conche, S.; Freschet, G.T.; d’Annunzio, R.; Toucet-Louri, J. Determining the Distributions of Soil Carbon and Nitrogen in Particle Size Fractions Using Near-Infrared Reflectance Spectrum of Bulk Soil Samples. Soil Biol. Biochem. 2008, 40, 1533–1537. [Google Scholar] [CrossRef]
  45. Yang, X.M.; Drury, C.F.; Reynolds, W.D.; MacTavish, D.C. Use of Sonication to Determine the Size Distributions of Soil Particles and Organic Matter. Can. J. Soil Sci. 2009, 89, 413–419. [Google Scholar] [CrossRef]
  46. Puget, P.; Chenu, C.; Balesdent, J. Dynamics of Soil Organic Matter Associated with Particle-Size Fractions of Water-Stable Aggregates: Dynamics of Soil Organic Matter in Water-Stable Aggregates. Eur. J. Soil Sci. 2000, 51, 595–605. [Google Scholar] [CrossRef]
  47. Schmidt, M.W.I.; Rumpel, C.; Kögel-Knabner, I. Particle Size Fractionation of Soil Containing Coal and Combusted Particles. Eur. J. Soil Sci. 1999, 50, 515–522. [Google Scholar] [CrossRef]
  48. Beuselinck, L.; Govers, G.; Poesen, J.; Degraer, G.; Froyen, L. Grain-Size Analysis by Laser Diffractometry: Comparison with the Sieve-Pipette Method. CATENA 1998, 32, 193–208. [Google Scholar] [CrossRef]
  49. Jensen, J.L.; Schjønning, P.; Watts, C.W.; Christensen, B.T.; Munkholm, L.J. Soil Texture Analysis Revisited: Removal of Organic Matter Matters More than Ever. PLoS ONE 2017, 12, e0178039. [Google Scholar] [CrossRef] [Green Version]
  50. Hereter, A.; Josa, R.; Candela, X. Changes in Particle-Size Distribution Influenced by Organic Matter and Mechanical or Ultrasonic Dispersion Techniques. Commun. Soil Sci. Plant Anal. 2002, 33, 1351–1362. [Google Scholar] [CrossRef]
Figure 1. Difference in the silt (A) and clay (B) fractions between samples with SOM and after SOM removal relative to the clay fraction in the different soils.
Agriculture 12 00226 g001
Figure 2. Euclidean distance between the points representing particle size distribution with SOM and after SOM removal, relative to initial soil organic carbon content.
Agriculture 12 00226 g002
Figure 3. Comparison between the <0.063 mm fractions determined by the dynamometer and sieve methods for all samples: with SOM (A), and after SOM removal (B).
Agriculture 12 00226 g003
Table 1. pH, soil organic carbon (SOC) and calcium carbonate content of the investigated soils.
No.
Sample
pHSOC
(%)
CaCO3
(%)
No.
Sample
pHSOC
(%)
CaCO3
(%)
15.74.50.0267.00.90.5
26.72.81.6276.33.30.2
36.63.60.1284.21.60.0
46.73.21.7296.61.40.0
57.03.10.2306.71.10.2
66.31.50.0316.31.53.8
77.21.21.2325.62.20.0
86.81.70.6336.20.90.0
96.22.10.3344.61.60.0
105.91.80.1354.51.10.0
116.61.90.3365.91.60.0
126.22.50.0377.01.40.5
133.61.10.0386.61.20.2
145.51.00.0396.82.30.4
156.71.70.0404.41.70.2
166.02.10.0416.00.90.0
176.11.50.0426.61.90.0
186.41.20.0436.41.40.3
195.81.30.0446.72.31.2
206.41.40.0456.72.40.2
215.41.50.0465.51.50.0
226.01.20.2476.22.60.0
236.41.20.2487.02.51.9
246.31.30.7497.13.51.9
255.51.80.0506.92.90.4
Table 2. Granulometric groups of the investigated soils with SOM and after SOM removal.
No. SampleGranulometric Group with SOMGranulometric Group without SOMNo.
Sample
Granulometric Group with SOMGranulometric Group without SOM
13SandLoamy Sand29Sandy LoamSandy Loam
20Loamy SandLoamy Sand30Sandy LoamSandy Loam
23Loamy SandLoamy Sand35Sandy LoamSandy Loam
32Loamy SandLoamy Sand36Sandy LoamSandy Loam
33Loamy SandLoamy Sand37Sandy LoamSandy Loam
38Loamy SandLoamy Sand42Sandy LoamLoam
40Loamy SandLoamy Sand3LoamLoam
27Loamy SandSandy Loam4LoamLoam
28Loamy SandSandy Loam25LoamLoam
39Loamy SandSandy Loam50LoamLoam
41Loamy SandSandy Loam5LoamSilt Loam
15Loamy SandSandy Loam8LoamSilt Loam
34Loamy SandSand9LoamSilt Loam
1Sandy LoamSandy Loam31LoamSilt Loam
6Sandy LoamSandy Loam7Silt LoamSilt Loam
10Sandy LoamSandy Loam17Silt LoamSilt Loam
11Sandy LoamSandy Loam18Silt LoamSilt Loam
12Sandy LoamSandy Loam43Silt LoamSilt Loam
14Sandy LoamSandy Loam44Silt LoamSilt Loam
16Sandy LoamSandy Loam45Silt LoamSilt Loam
19Sandy LoamSandy Loam46Silt LoamSilt Loam
21Sandy LoamSandy Loam47Silt LoamSilt Loam
22Sandy LoamSandy Loam48Silt LoamSilt Loam
24Sandy LoamSandy Loam49Silt LoamSilt Loam
26Sandy LoamSandy Loam2Clay LoamLoam
Table 3. Content of the three fractions in the samples with SOM, and after SOM removal.
No. SampleSand Content
(%)
Silt Content (%)Clay Content
(%)
Sand Content
(%)
Silt Content (%)Clay Content (%)
Samples with SOMSamples after SOM Removal
152.529.318.253.131.215.7
235.836.927.331.744.024.3
343.038.318.736.148.215.7
446.037.216.835.441.822.8
536.045.618.431.553.115.4
661.027.111.959.730.110.2
722.059.218.819.065.016.0
840.046.413.636.950.113.0
935.049.215.830.854.414.8
1062.025.712.363.726.59.8
1156.029.514.561.024.814.2
1273.512.813.764.926.68.5
1389.52.18.485.98.35.8
1459.524.715.855.531.213.3
1578.713.28.176.416.07.6
1667.524.18.467.326.56.2
1724.463.212.421.763.814.5
1834.651.414.034.351.214.5
1963.226.99.960.228.311.5
2082.410.67.081.712.16.2
2165.828.55.766.225.97.9
2267.925.17.068.125.86.1
2379.712.57.882.610.47.0
2471.120.78.267.925.07.1
2551.440.38.348.042.59.5
2673.514.412.173.418.68.0
2784.69.06.479.69.011.4
2879.911.38.875.410.014.6
2956.635.77.753.439.27.4
3053.732.613.755.732.911.4
3143.548.18.436.058.45.6
3279.913.46.785.09.75.3
3379.114.36.683.610.26.2
3484.38.77.089.25.35.5
3573.921.74.471.917.910.2
3655.542.22.353.936.79.4
3770.925.43.766.728.74.6
3884.914.30.883.511.94.6
3976.221.32.577.315.07.7
4084.414.61.082.211.56.3
4180.312.17.680.38.311.4
4251.542.06.547.139.313.6
4340.251.08.837.250.112.7
4437.052.710.329.753.017.3
4526.757.715.618.958.422.7
4626.356.717.020.363.815.9
4725.954.519.627.353.818.9
4827.250.422.420.559.420.1
4931.552.116.420.563.416.1
5035.847.117.132.949.417.7
Publisher’s Note: MDPI stays neutral with regard to jurisdictional claims in published maps and institutional affiliations.

