
The Response of Soil pH and Exchangeable Al to Alum and Lime Amendments †


1
Department of Entomology and Plant Pathology, North Carolina State University, Raleigh, NC 27695, USA
2
Department of Plant and Soil Sciences, Oklahoma State University, Stillwater, OK 74078, USA
*
Author to whom correspondence should be addressed.
†
This paper is a part of the MS Thesis of Christopher Jorelle Gillespie, presented at Oklahoma State University (United States of America).
Agriculture 2021, 11(6), 547; https://doi.org/10.3390/agriculture11060547
Submission received: 4 May 2021
/
Revised: 9 June 2021
/
Accepted: 11 June 2021
/
Published: 15 June 2021
(This article belongs to the Section Agricultural Soils)
Abstract
:Intensive cultivation and unprecedented utilization of ammoniacal fertilizer has accelerated soil acidification in the southern Great Plains and many other parts of the world. During a two-year study that evaluated the impact of soil pH and aluminum (Al) toxicity on winter wheat yield potential, we observed a variance in the edaphic responses of the two study sites (Stillwater and Chickasha) to two soil amendments, Alum [Al2(SO4)3] and lime [Ca(OH)2]. We found that AlKCl values at Stillwater were 223% and 150% higher than Chickasha during Year 1 and Year 2, respectively, with similar soil pH. Additionally, Alsat values at Stillwater were 30.6% and 24.9% higher than Chickasha during Year 1 and Year 2, respectively. Surprisingly, when treated as a bivariate of Alsat, soil buffer indices differed in graphical structure. While Chickasha was identified with a cubic polynomial (p < 0.0001), Stillwater was characterized by linear regression (p < 0.0001). We have reason to believe that this divergence in edaphic response might be attributed to the organically bound Al, dissolved organic carbon (DOC), spatio-temporal variance, and adsorption reactions regulated by the solubility of Al(OH)+2 species in acidic soils.
1. Introduction
Aluminum (Al) represents 8.1% and is the third most plentiful element in the earth’s crust following oxygen and silicon [1,2]. For many crops, initiation of toxicity symptoms necessitates that Al+3 be present in concentrations of around 2 to 3 mg kg−1 [3]. Interestingly, it difficult to achieve exchangeable Al concentrations of this level without perturbation via acidifying fertilizers [4]. The critical pH for most plant species grown within an acidic edaphic environment is <5.5 [5]. The value at which crop production is adversely impacted or the point at which the incidence of Al+3 becomes toxic is denoted as critical pH [6]. While critical soil pH varies between crops and cultivars of crops (i.e., winter wheat), most crops will endure damage below their critical pH level. Alarmingly, reports indicate that approximately 50% of the world’s suitable farmland is deemed acidic [5].
The amelioration of acidity is paramount to agronomic production in acidic soils. Presently, there are numerous strategies farmers use to address soil acidity and improve a soil’s agronomic affinity. These methods include limestone application (i.e., calcium carbonate), in-furrow application of phosphorus (banding), employing acid-soil tolerant cultivars, and applying fresh plant biomass [2]. While liming is arguably the most valuable, robust, and long term-measure against soil acidity, it is not always a feasible relay towards amelioration of acidity. For example, around 39% of the U.S. farmland is chartered by farmers or impending changes in proprietorship [7]. Most of the farmland that is leased is heavily dedicated to cash grains such as wheat. Although a considerable amount of wheat cultivars is relatively tolerant to soil acidity, high acidity, and Al saturation (>30%) have been shown to decimate wheat forage yields [6,8]. According to Lollato et al., (2013), the benefits of lime investments are not fiscally defensible in the first year of application [9]. With a few exceptions [10], most lime requirement recommendations focus on soil pH and do not consider exchangeable aluminum (AlKCl) concentrations. However, since Alsat is the driving force of Al toxicity, adoption of an Alsat -based standard may increase liming efficacy and prove more affordable for farmers. However, this would require that Alsat be characterized across a myriad of soils and cropping systems. Moreover, as a few years are required for the maturation of the lime effect, producers are understandably hesitant to invest in limestone applications. Consequently, it is common practice to address acidic soil conditions through the inexpensive, yet less effective, method of banding phosphorus (P) fertilizer [11,12]. However, the effectiveness of banded phosphorus is exhausted within a few months following the application and requires seasonal application [11]. Thus, similar to the application of organic residues which are ephemeral and greatly influenced by the initial pH of the soil [13], banding phosphorus is only a temporary counter-measure against soil acidity [12]. Finally, although acid-soil tolerant cultivars mitigate the truncating effects of Al toxicity, Gillespie et al. (2020) reported that the benefit of acid-soil winter wheat cultivars varies spatiotemporally and are influenced by environmental parameters that may be plainly, subtly-, or even unconnected to genetic effects [8]. Thus, this study provides an interesting insight into an environment with edaphic characteristics that seemingly act as natural gatekeepers against soil acidity. We believe that documentation and expounding upon the contrasting responses of the aforementioned soils to Al toxicity and soil acidity-inducing amendments is important to the continued management of acidic agroecosystems.
Identification of which Al species are present at certain soil pH levels is crucial to our understanding of our findings. For example, the susceptibility of wheat roots to Al species are ranked as follows: AlF2+ < AlF2+ < Al+3 < Al13 [14]. Notwithstanding, the toxicity of Al13 to wheat roots, it exists as a highly unstable, polynuclear complex [15]. Thus, the majority of Al toxicity exploration is concentrated on the mononuclear form, Al+3. As pH decreases, the amount of Al oxides hydrolyzed and the quantity of positively charged Al species increases. As the soil pH nears a value of 6.0, small amounts of Al+3 appear in the soil. However, the occurrence of Al+3 is chemically inconsequential in many soils until the pH falls beneath 5.5. Thus, most soils experience a notable increase in reactive Al as the soil pH drops below pH 5.0 [6,16]. As a result, base cations on the soil surface are replaced by Al+3. Interestingly, in comparison to other soil acidifying reactions, this process has a more gradual impact on soil pH. Regardless, the conversion from insoluble Al compound to a solution available form (Al+3) can ultimately be disastrous to plants.
Moreover, the pH is lowered even further by the nitrification of NH4+, which leads to further hydrolysis of Al oxides. The summation of the processes results in the dominance of soil cation exchange sites by Al+3. Additionally, iron (Fe) oxides within extremely acidic soil environments might also negatively impact plants. Augmentation of soluble Fe species through acidification can compromise the bioavailability of other elements such as phosphorus and potassium. Although iron oxides are generally less soluble than Al oxides, soluble iron, as well as manganese, present concerns in acidic agroecosystems across the world [17]. Thus, there are motivations for exploration surrounding the occurrence of metal oxides and their effects on Oklahoma’s acid soils.
While iron dynamics in acidic soils are outside of the scope of this study, the novelty of our study involves the heterologous responses at both experimental locations to soil pH adjusting amendments. In this paper, we will explore, and even verify, established agronomic principles and phenomena (i.e., Al toxicity-Soil pH relationship) to explore the heterologic nature of these study sites. The objectives of this study are to seek to explain the variance in the response of two experimentally explored soils to soil treatments and provide a baseline for future research involving analogous edaphic responses to acidifying practices. Thus, we will utilize characterized relationships, equations, and environmental information from closely related studies to conjecture drivers for these differences (i.e., soil organic matter, spatio-temporal variance, adsorption, the solubility of aluminum species in acidic soils).
2. Materials and Methods
2.1. Study Sites and Experimental Design
The field experiments were conducted during the 2017–18 and 2018–19 growing seasons at two locations to evaluate the responses of eight closely related wheat cultivars to a gradient of soil acidity and Al concentrations. The experimental design and wheat performance as affected by soil pH and Al saturation have been reported in Gillespie et al. (2020) [8]. This paper is aimed to report the effects of amendments on soil properties. The first location was within the Efaw Research Site near Stillwater, OK (36°8′4 ″N, 97°6′1 ″W), an Easpur loam (Fine-loamy, mixed, superactive, thermic Fluventic Haplustolls). The other location was located at the South-Central Research Station in Chickasha, OK (35°2′46 ″N, 97°54′40 ″W), a Dale silt loam (Fine-silty, mixed, superactive, thermic Pachic Haplustolls). The experimental design was synonymous with that outlined in Gillespie et al. (2020) [8]. Most importantly to our analysis, the main plots (6 m × 6 m) at both locations were comprised of six targeted soil pH values (4.0, 4.5, 5.0, 5.5, 6.0, 7.0). Ancillary to this report, each main plot was comprised of eight subplots, where each subplot possessed one of eight randomized wheat cultivars.
2.2. Soil Management
Adjustment of soil pH was accomplished using Alum (UNIVAR Manufacturing, New Wilmington, PA, USA) and calcium hydroxide (Peteline & Son, Rapid City, SD, USA). Site-specific amendment response curves were developed for both locations during a laboratory experiment in 2009, these curves were used to calculate the appropriate application rate for each target soil pH within each main plot (Gillespie et al., 2020) [8].
2.3. Soil Analysis
Soil samples were excavated from main plots at a depth of 15 cm and consisted of 12 to 15 soil cores. These samples were analyzed to determine the soil pH, buffering index (BI), phosphorus, basic cations, and exchangeable aluminum (AlKCl) of each main plot. Soil pH was determined through the use of ion-selective (H+) glass electrodes on a soil/water mixture with a ratio of 1:1 [18]. Buffer index was used to determine the lime requirement—or rather, estimate the soil capacity for storing basic elements [19]. For our study, the buffer index serves as a metric to contrast the changes in buffering capacity within each soil environment, spatio-temporally along with amendment applications, by serving as a bivariate of aluminum concentration. The buffer index was determined by measuring the soil pH of the soil/water mixture with a ratio of 1:1, adding Sikora buffer solution to the sample, and then measuring the pH again. For interpretation purposes, our analyses consider the Sikora buffer index to be parallel to the Shoemaker, McLean, and Pratt (SMP) buffer index. The SMP buffer contained a reagent comprised of two hazardous chemicals, potassium chromate, and P-nitrophenol. For this reason, the chemicals were experimentally replaced by less biotically and environmentally hazardous reagents, which resulted in the creation and widespread adoption of the Sikora buffer [19]. Mehlich III (M3) solution was utilized to extricate plant-available phosphorus (P), potassium (K), calcium (Ca), and magnesium (Mg) [20] with a soil to solution mass ratio of 1:10 [21]. The soil elemental constituents (P, K Ca, and Mg) of the Mehlich III extract were measured by inductively coupled plasma atomic emission spectroscopy (ICP-AES) (SPECTRO Analytical Instruments, Kleve, Germany).
2.4. Determination of Aluminum Concentrations and Effective Cation Exchange Capacity
Soil samples were processed using the aforementioned methodologies, with the addition of extractable Al and Alsat analysis. Exchangeable aluminum (AlKCl) was extracted using soil to potassium chloride (1.0 M KCl) ratio of 1:10 and analyzed using ICP spectrometry. To calculate Al saturation (Alsat), first, the Al extraction methodology proposed by Sumner and Miller (1996) was employed to ascertain the effective cation exchange capacity (ECEC) [22]. For each sample, 2 g of soil sample were placed into a disposable 60 mL vessel. Next, 20 mL of 1.0 M KCl (74 g KCl in 1 L DI water) was added to each vessel. The vessels were then oscillated on a reciprocal shaker for 30 min. Using Whatman #1 filter paper, extract from samples were percolated into a 103 mL plastic cup. Finally, the total of Al extracted with 1 M KCl was measured using an ICP.
Using protocols ascribed to Sumner and Miller (1996), the following equation was used to calculate the ECEC of each ICP-analyzed soil extract [22]:
For each sample, the concentrations for basic cations (Ca+2, Mg+2, K+) acquired through M3 extraction were used to populate the equation. The meq weights were calculated by dividing the atomic mass of the element by its valence charge (e.g., Ca ≥> 40 ÷ 2 = 20 mg/meq; Al ≥> 30 ÷ 3 = 10 mg/meq). The concentration of Na+ was considered inconsequential, as sodium concentrations are considered negligible in non-saline, productive agricultural soils in the region.
Calculations for Alsat were conducted using the following equation:
2.5. Statistical Analysis
Data were explored using PC SAS Version 9.4/JMP Pro 13 [23]. Locations were not combined due to disparities in the aluminum concentration of soil environments. Levene’s test was performed for “year” within each “location” to assess the homoscedasticity of variance. Due to homoscedasticity of variance, study years within each location were combined. Models were considered admissible only when all parameters, including model and equation predictors, were significant at least at α = 0.05. Exponential models were used to characterize bivariate relationships between soil pH and both Alsat and reactive Al. Statistical deviance from this exponential model at Chickasha was explored using multivariate regression, where Alsat was analyzed as a dependent variable to assess the influence of independent soil elements (Ca, K, Mg, etc.) on Alsat at each location. While analyzing the buffer index, Alsat was implemented as a continuous predictor variable (p < 0.0001).
3. Results
3.1. Site-Specific Variance in Edaphic Response to Soil pH Gradients
During Year 1, Chickasha soil pH ranged from 5 to 7.1, yet AlKCl and Alsat were low, varying between 0 to 57 mg kg−1 and from 0 to 8.1%, respectively (Table 1). In Year 2, despite increasing the estimated amendment rate of target main plots with low pH (4 and 4.5) by twofold, only minor changes in soil acidity were noted with the soil pH gradient ranging from 4.9 to 6.7 (Table 1).
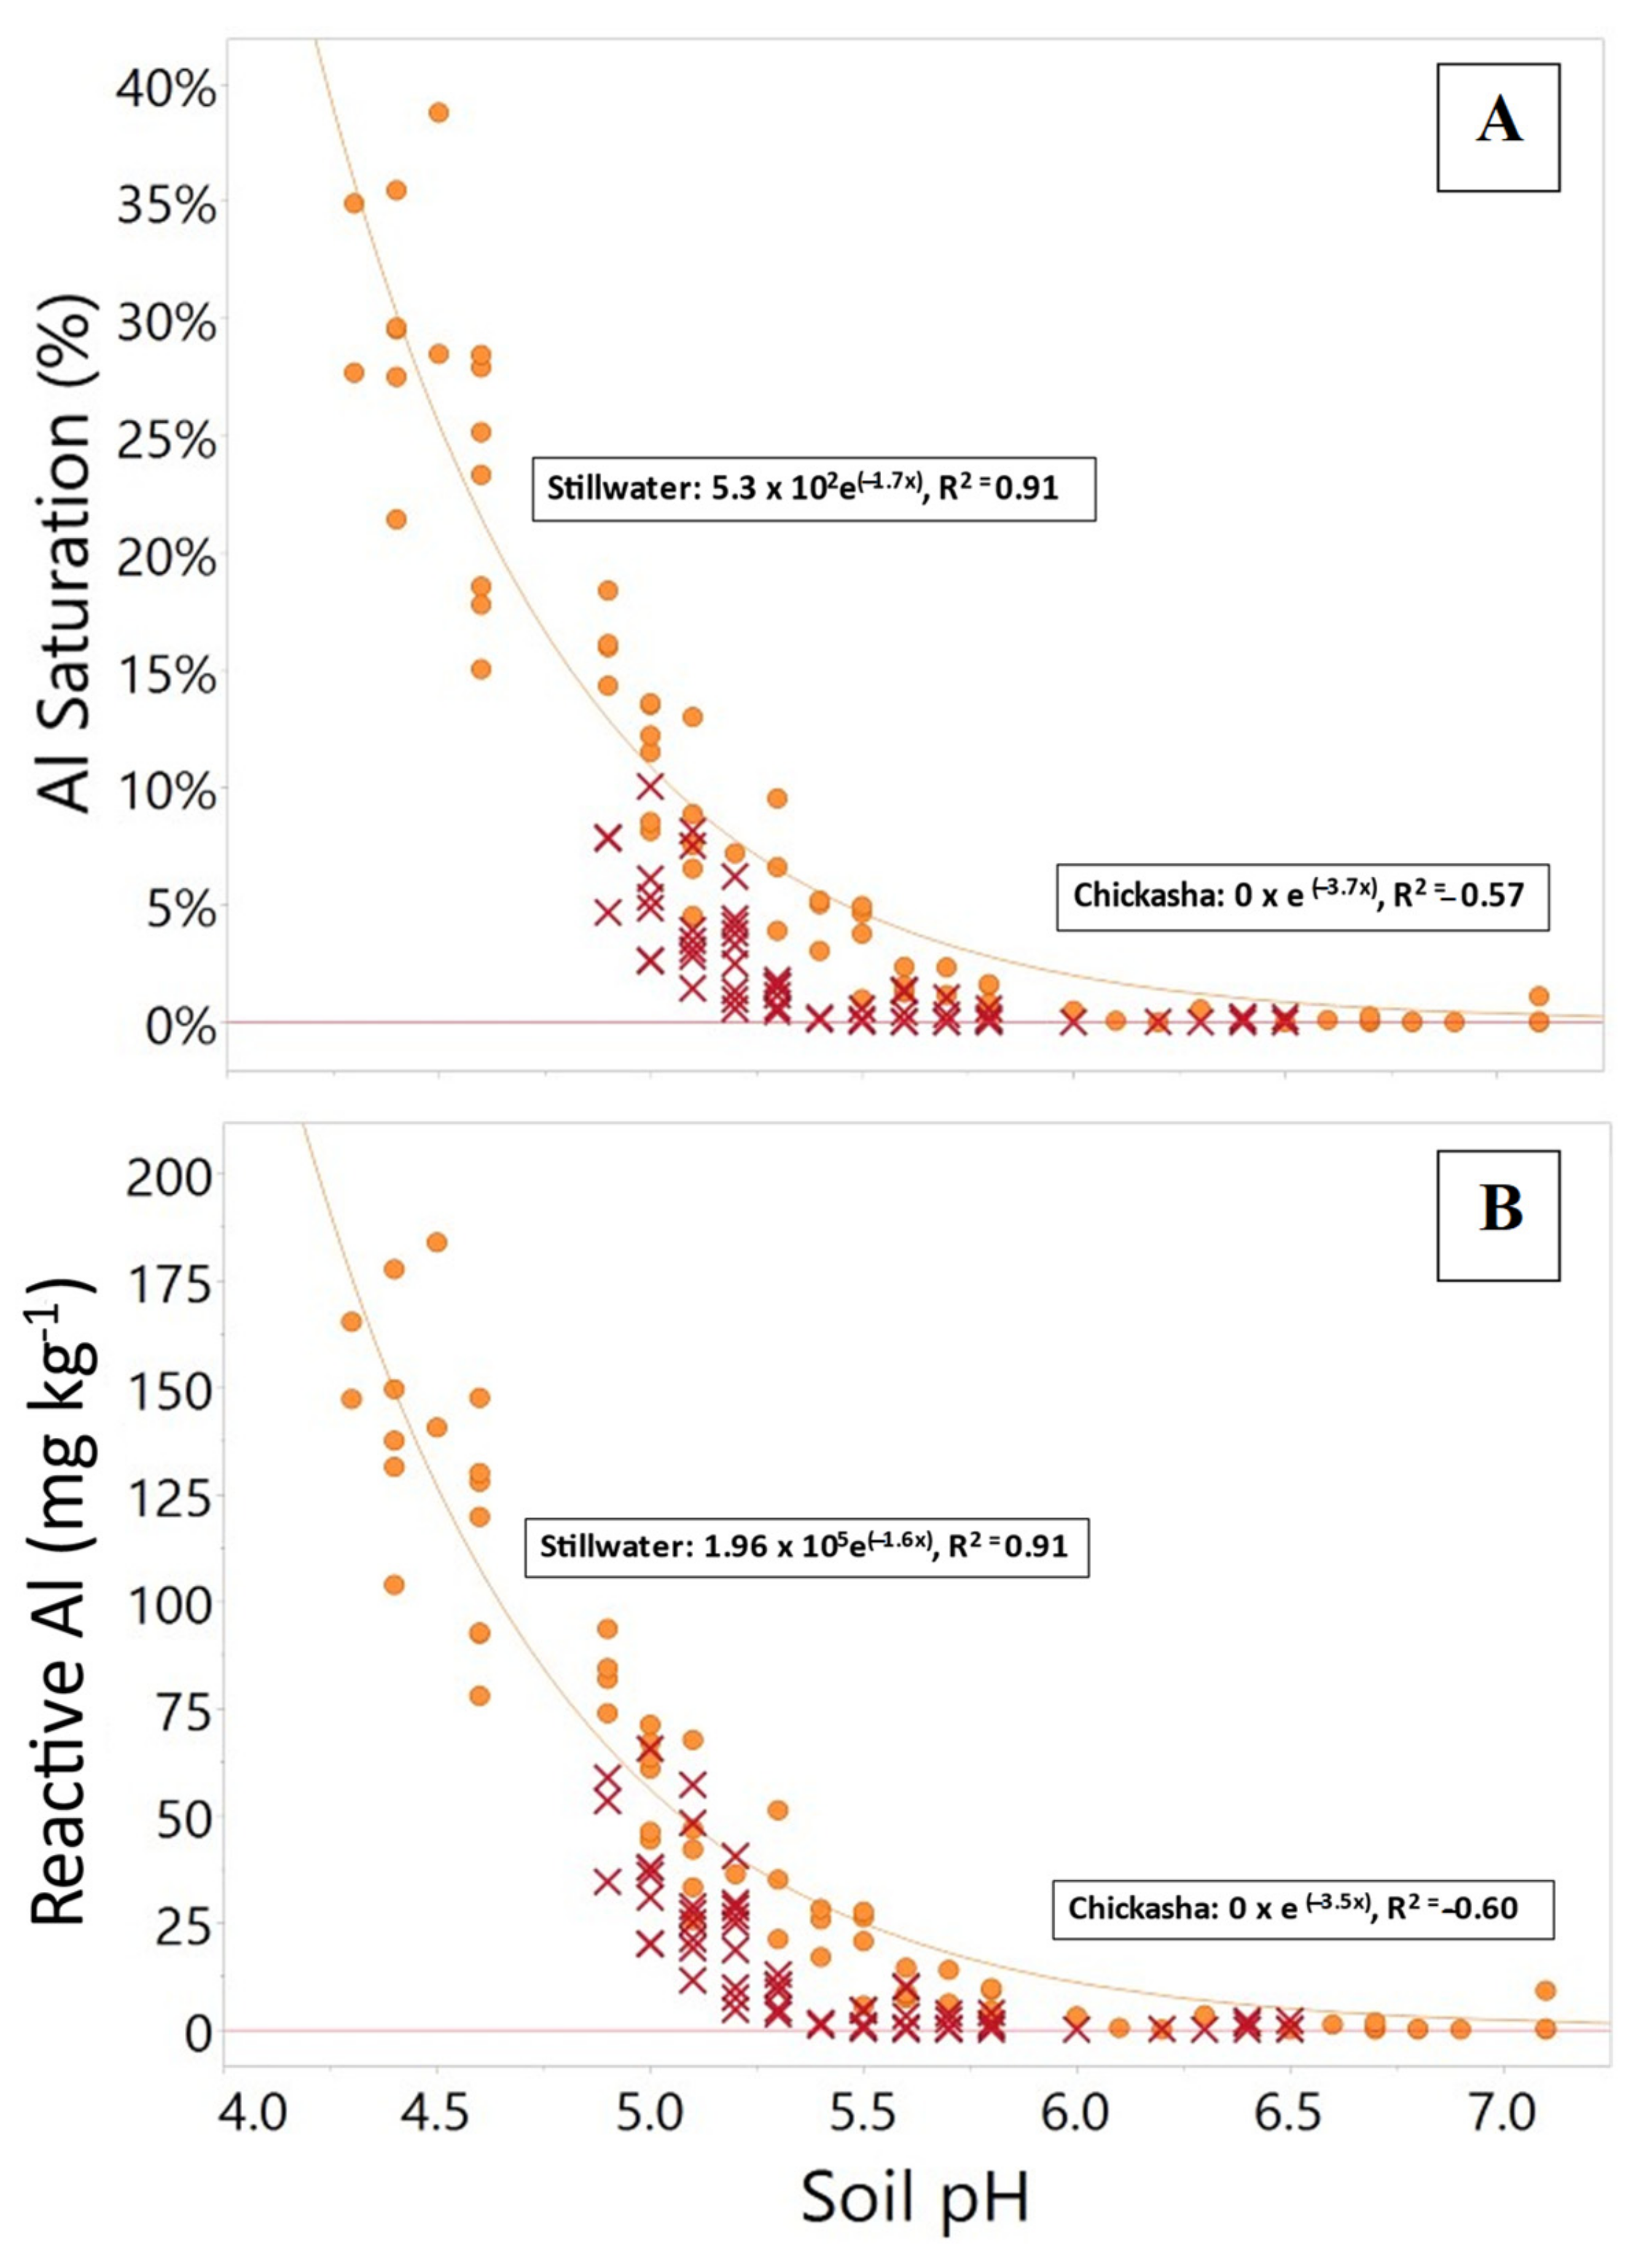
Likewise, AlKCl and Alsat were still lower at Chickasha, fluctuating between 0 to 66 mg kg−1 and from 0 to 10.1%, respectively (Table 1); thus, unlike Stillwater (Figure 1), a significant relationship did not exist among soil pH and Alsat at Chickasha (Figure 1).
However, trend response at Chickasha showed slight similarity with Stillwater, that is, small changes in soil pH < 5.5 were collaborated by sizable increases in Alsat (Table 2 and Table 3) [6,8].
Contrarily, Lollato et al. (2019) at the same location reported a significant relationship between soil pH and Alsat where small changes in soil pH < 5 were denoted by large increases in Alsat [16]. Additionally, Lollato et al. (2019) found that AlKCl and Alsat ranged from 0 to 64 mg kg−1 and 0 to 7.8%, respectively [16]. We propose two possible reasons for this discrepancy: (1) variations in reserve acidity and base saturation (BS), and (2) spatio-temporal discrepancy.
3.2. Characterization and Exploration of Edaphic Properties
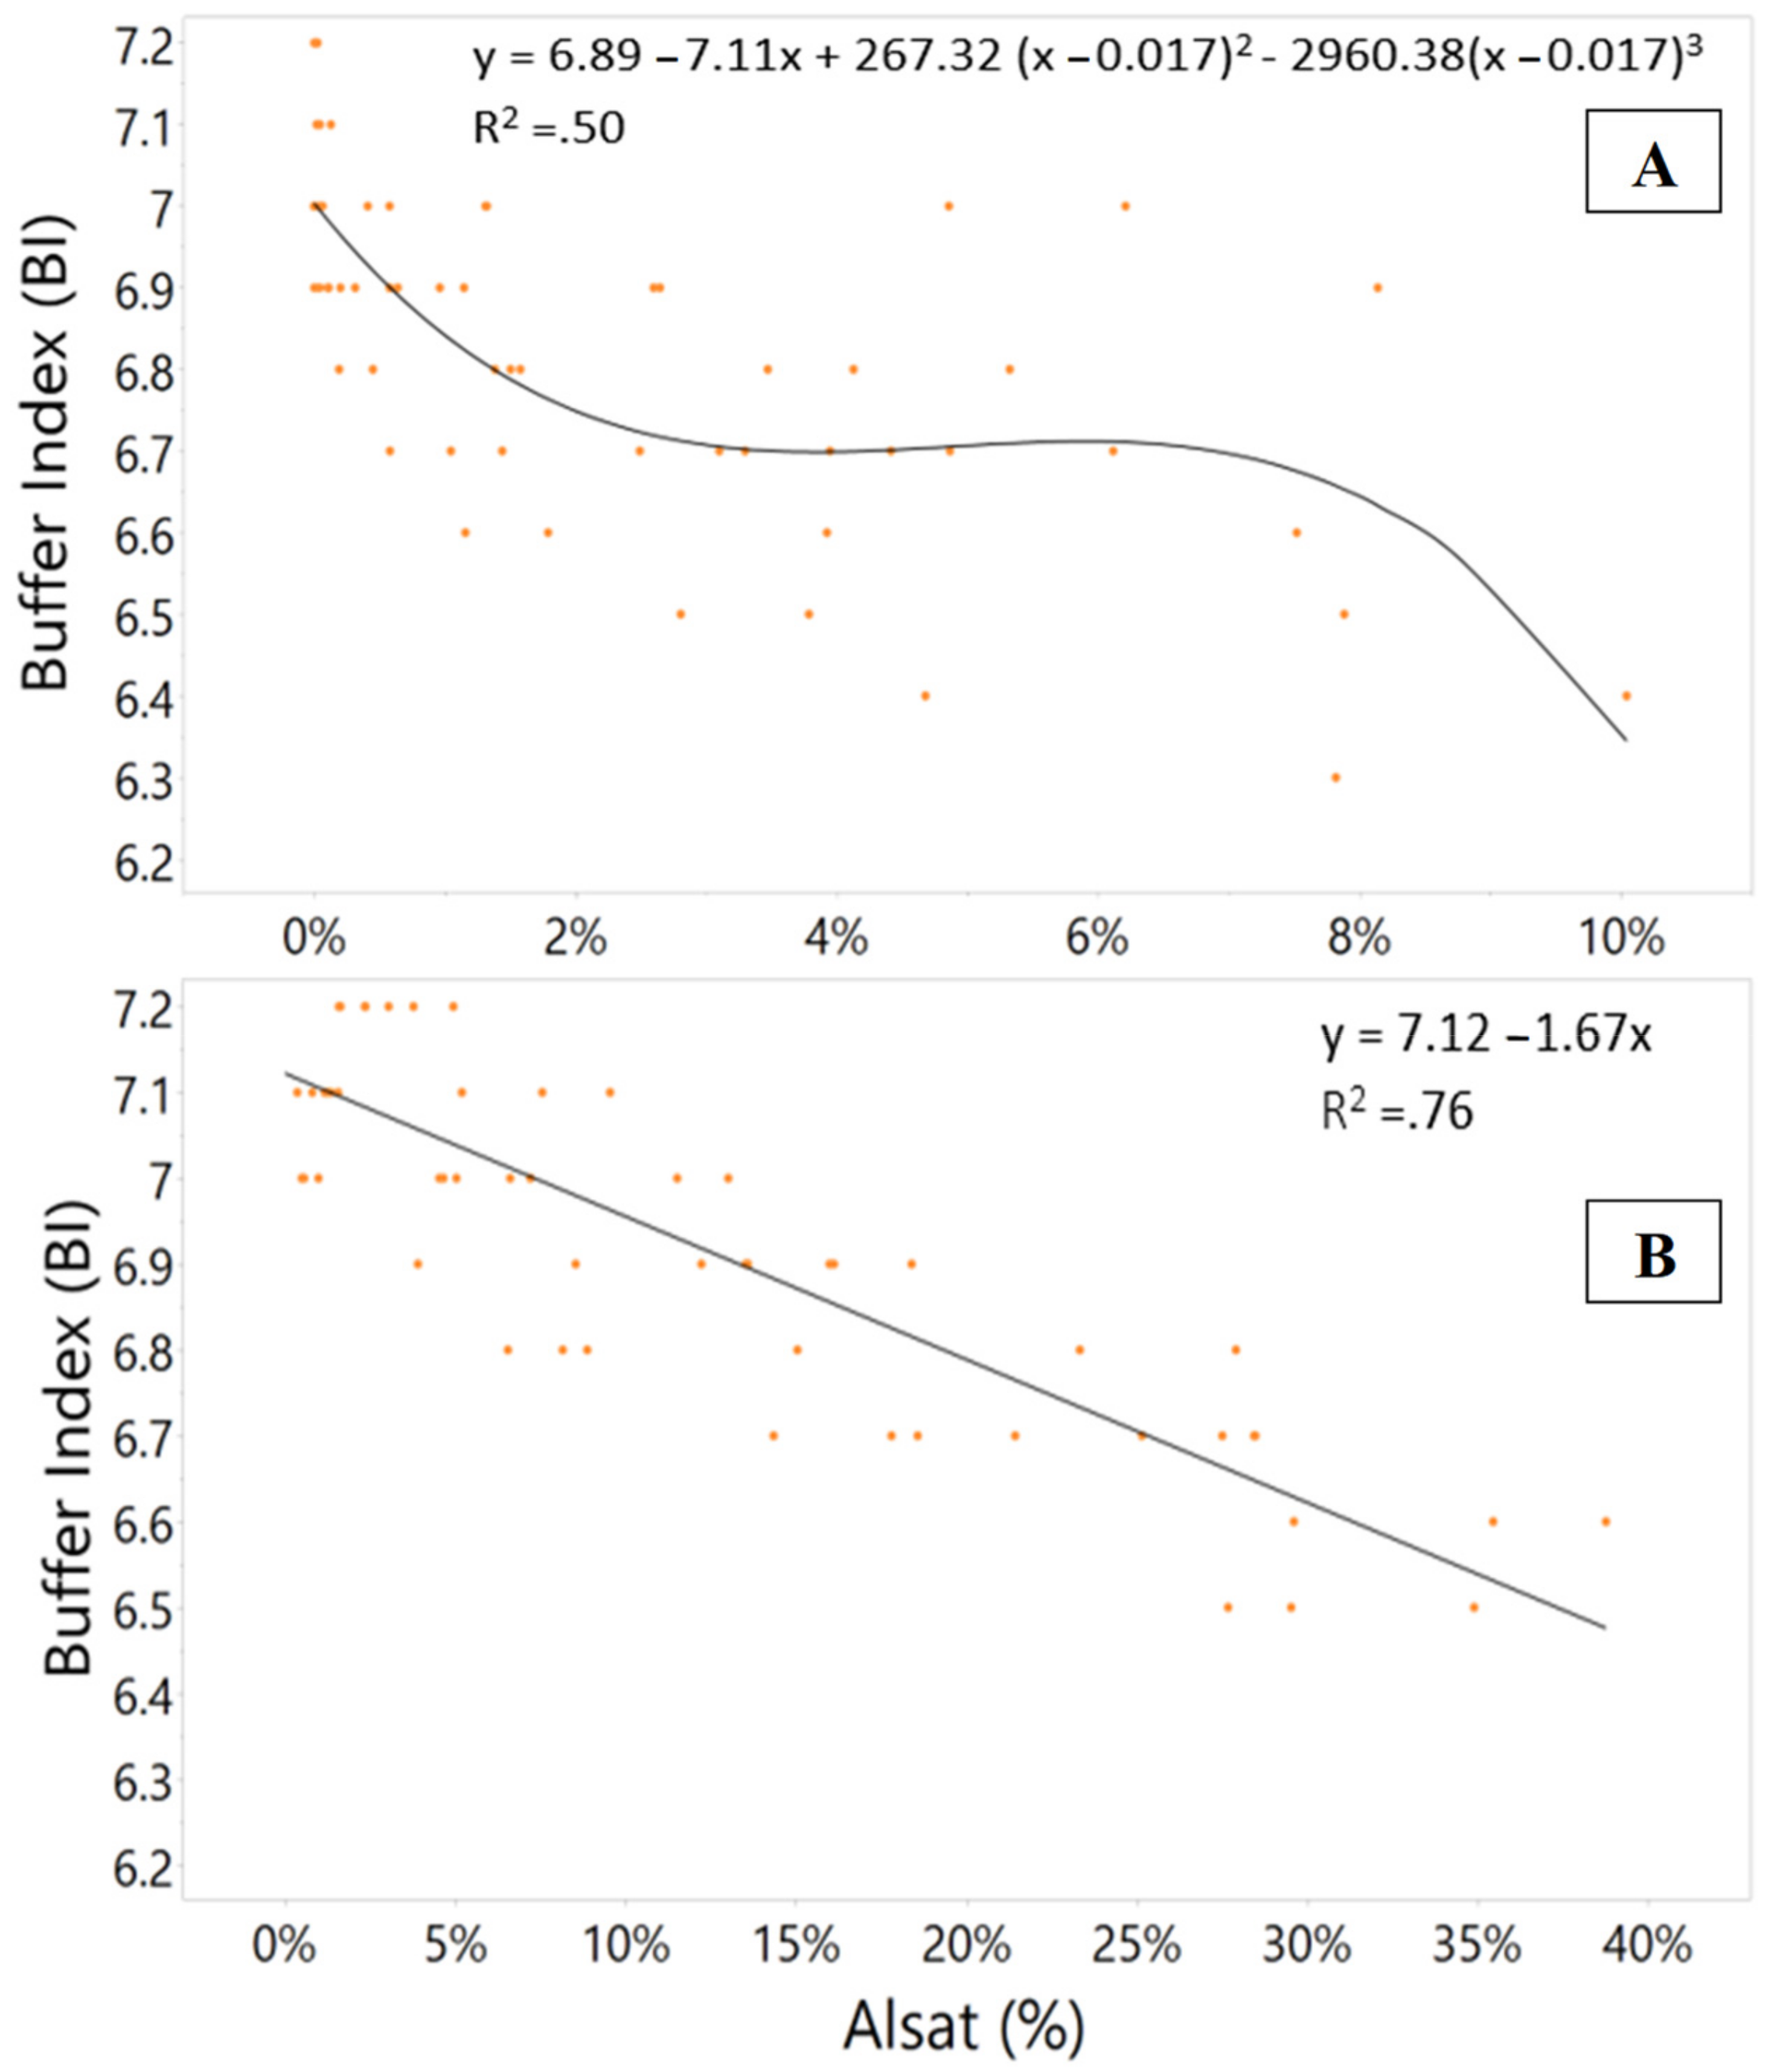
Intrinsic variations between edaphic environments can markedly affect the amount of exchangeable Al that is present at comparable soil pH [24]. Chickasha is characterized by a Dale soil series; hence it possesses a neutral Ap horizon (0 to 18 cm), with slightly acid to moderately alkaline reactions [25]; thus, considering the likelihood for leaching and eluviation, long-term applications of acidic cations could, in theory, produce a slightly acidic sampling depth, similar to the Easpur and Konawa soil series at Stillwater [6]. On average, phosphorus (P) values were 218% higher at Stillwater, however, potassium (K), calcium (Ca), and magnesium (Mg) values were 180%, 117%, and 238% higher at Chickasha, respectively (data not shown). Multivariate elemental analysis showed that, unlike the Konawa and Easpur soil series, the growth rate parameter ([y = a × ekt], where the growth rate is equal to k) associated with Al concentrations and soil pH, the Dale series at Chickasha did not possess the exchangeable Al concentrations required to support the scale parameter ([y = a × ekt], where the scale is equal to a]) of the exponential model. For example, at 0 ≤ Alsat ≤ 10%, Chickasha revealed a smaller negative correlation between soil pH and Alsat (r = −0.68, α = 0.05) than Stillwater (r = −0.79, α = 0.05). While Stillwater only exhibited a significant negative correlation between Alsat and Ca, surprisingly, Alsat in Chickasha showed a significant positive correlation with P, and significantly negative correlations with K, Ca, and Mg. Moreover, while a linear relationship was noted between soil buffer index (BI) and Alsat at Stillwater (p < 0.0001), Chickasha exhibited a cubic relationship (p < 0.0001); thus, a BI of 6.5 corresponded with 38% Alsat at Stillwater, while at Chickasha that same BI corresponded with 9% Alsat (Figure 2).
According to the USDA Soil Survey, the Dales series has A horizon (2.3%) that is 10 inches thicker and contains more soil organic matter (SOM) by percentage than the Easpur series (2%). As not to exaggerate any differences, we referred to the RV (representative value) when comparing SOM content between Chickasha and Stillwater. While exhaustive tests have yet to be conducted, these factors likely denote an increased affinity to SOM and organic components at Chickasha.
3.3. Spatio-Temporal Discrepancy
In this study, observations were collected over two years, opposed to Lollato et al. (2019) who collected observations over three years. Thus, it is possible that this temporal discrepancy could have impacted the growth and scale parameters of the exponential model [16]. While, the aforementioned observation, along with contrasting Al concentrations, supported the decisions of Gillespie et al. (2020) to defer primarily to Stillwater in answering their research question, we find the spatio-temporal discrepancies in edaphic response at Chickasha to be intriguing [8]. Using the same estimation curve [8,16] reported that they were able to obtain a soil pH gradient of 4.4 to 7.6 during the second and third years of their study. However, during this study, even after doubling the recommendation rate, Chickasha did not achieve a soil pH below 5 (Table 4 and Table 5). Similarly, unlike Stillwater which responded favorably to liming applications, the Dale series at Chickasha was less amenable (Table 5).
4. Discussion
It is mostly like the significant positive correlation between P and Alsat observed at Chickasha is attributed to intrinsically low levels of P relative to Stillwater. Nevertheless, the high concentration of basic cations at Chickasha further supports the notion that Al concentrations at Chickasha were simply insufficient for the adoption of the exponential Alsat–Soil pH model. Additionally, the coefficient of determination of R2 for the Alsat–Soil pH model was calculated to be positive at Stillwater, and a negative at Chickasha (Figure 1). We reported these values to accentuate the inappropriateness of the Alsat–Soil pH model for observations at Chickasha. In statistics, R2 is only a squared number when operating under linear regression. Specifically, it would be the square of the Pearson correlation. Since this analysis was not approached using linear modeling, there existed no squaring of the Pearson correlation. In fact, mathematically our models did not “square” a number to obtain “R-squared”. Simply stated, R2 outside of linear regression is merely calculated by taking the data variability and subtracting the model variability [26]. Thus, if the model is utterly unfit for the data, it will have more variability than the data and the difference will be negative. In this manner, negative R2 values at Chickasha served as an indicator for lack of model fit, and as a means to further exemplify the differing edaphic environments at Stillwater and Chickasha.
Aside from dissimilarities in soil texture and heterogeneity of parent material, the distinctive differences in soil buffering between these locations could be associated with contrasting operational fractions of Al, and higher organically bound Al and dissolved organic carbon (DOC). Researchers have reported findings that support the ability of dissolved organic constituents to effectively decrease the AlKCl fraction in soil pH < 5.93 [27,28]. Unfortunately, SOM data is unavailable as this analysis was not directly measured during the allotted study period. However, our analysis leads us to believe that qualitative variables (i.e., SOM and DOC) are integral in driving the nonconformity and edaphically incongruous responses of Stillwater and Chickasha to soil amendments. For example, when compared to the linear model, the cubic model presented the best fit for Chickasha. To rationalize our use of the cubic model, cubic parameters were tested on the Stillwater data which exhibited a notable linear fit. Interestingly, we found the 1st degree and 2nd-degree parameters of the cubic model were not significant at Stillwater. However, we found that cubic parameters were significant predictors at all degrees at Chickasha. Considering polynomial regression to be linear in terms of statistical estimation, the convergence of Chickasha data to the cubic model provides evidence for the existence of innate qualitative variables, or baseline covariates [29]. These qualitative variables might function to explain the differences between major experimental variables (soil pH, AlKCl, and Alsat) at Stillwater and Chickasha. While the interpretation of such a fit is complicated, we believe that these results inform upon the qualitative variables associated with observed edaphic variance. Thus, providing additional support towards our notion that further investigation and research should be conducted to validate our SOM/DOC theory.
While spatio-temporal discrepancies could be attributed to dynamics between hydrological processes (Gillespie et al., 2020) and organically bound Al and DOC, it worth noting that Chickasha received an in-furrow fertilizer application of diammonium phosphate (DAP) at 56 kg ha−1 during Year 2 of our study. Studies have shown that DAP can influence forage at the expense of grain yields in soils with low soil pH; that is when applied at 73 to 151 kg ha−1 [30]. Additionally, at similar application rates, DAP has been shown to influence forage and grain yields in low pH soils. Since a forage yield increase was observed at Chickasha during Year 2 [8], it could be surmised that the buffering of soil pH observed at Chickasha might have been a derivative of fertilizer application. However, this is unlikely as yields at Chickasha were above 25% higher in Year 2 for both forage and grain. Likewise, at a soil pH between 5 and 6.5, we would expect the systems to be dominated by Al(OH)+2. A reaction between orthophosphates and Al(OH)+2 has been shown to propel hydrolysis of Al+3 ions, consequently increasing the soil acidity [30]. Therefore, assuming that the concentrations of hydrolyzed aluminum ions at Chickasha were mediated by the solubility product of Al(OH)+2 and acknowledging that Al concentrations at Chickasha were 50% higher on average in Year 2, it can be surmised that the addition DAP most likely did not act as a buffer against acidity. It is likely that under the experimental conditions, higher organically bound Al and DOC acted as an additional resin, or exchange medium, in the Dale series at Chickasha. Therefore, increasing the buffering capacity and potential adsorption reactions of a system dominated by Al(OH)+2 species [17,27,28,31]. In fact, our multivariate analysis revealed that all basic cations, with the exception of P, were between 1.17 and 2.38 times higher at Chickasha. Similarly, pre-season soil test results revealed that the average soil-P at Chickasha was 41 kg ha−1, about 6 kg ha−1 lower than winter wheat requirement for 67.25 kg ha−1 grain yields (hence, the reason DAP was applied at 56 kg ha−1 during Year 2). Since more than half of the main plots at Chickasha received an alum application in Year 1 (Table 2), it is more likely that phosphorus limitations would be attributed to Al complexation. However, despite lower pH values and high Al concentrations, Stillwater pre-season soil tests reported an average soil-P of 72 kg ha−1. Although SOM data was not collected at the time of the study, these observations, along with the innately higher SOM matter and thicker A horizon compared to Stillwater, leads us to further conjecture the role of SOM/DOC in the complexation and fixation of Al species at Chickasha.
Furthermore, over a century of superfluous ammoniacal fertilizer use across the Southern Great Plains has greatly contributed to the acidification of Oklahoma soils. Thus, there are number of agronomic soils with varying levels of soil acidity already in existence. Readers might question why our study not only failed to take advantage of these soils but decided to utilize a soil pH gradient instead. While utilizing a variety of agronomic soils that are acidic may seem ideal, such an experimental structure would pose three possible issues: (1) soil pH is influenced by a myriad of factors and thus, is highly variable across small areas of landmass. It would be difficult to reconcile the vast degree of experimental error associated with adopting greater spatial nuance (i.e., a different field for each soil pH vs. one field with different soil pH values), and confident evaluation of treatment responses (crop, soil, etc.) would be challenging; (2) the creation of a soil pH gradient ensures a robust and statistically-characterized design structure (i.e., randomized and complete blocking design [RCBD]), the elasticity of soil pH values and aluminous elements, and reproducibility; and (3) alum and lime amendments would most likely be required to maintain the soil pH values of these agronomic soils. Notwithstanding the reluctance of producers to willfully permit the further acidification of their cropland, it would be more environmentally favorable to limit the amount of arable land sacrificed through the creation of an isolated and reusable soil pH gradient.
Likewise, readers may question if the addition of large amounts of alum jeopardize our findings by increasing Al(sat) and AlKCl) to improbable values. It is important to note that similar to lime amendments, the mechanism of alum in soil functions influences which element controls the overall soil buffering reaction (CaCO3 or Al2(SO4)3). Thus, while we introduced large amounts of Alum into the soil system, the dissociation of Al is governed by the cation exchange capacity, base saturation, and soil pH. The KCl extraction Sumner and Miller (1996) method functioned to remove Al+3 bounded to the surface of soil colloids. If a stronger extraction method had been elected (i.e., acid digestion, sequential extraction, etc.), overestimation of Al concentration would be a more valid concern. Moreover, a minimum of two months was required between amendment application and soil sampling. Thus, overestimation of Al concentration was further prevented by providing a generous amount of time for edaphic homeostasis to occur through natural processes (precipitation, translocation, etc.) and environment-specific reactions (adsorption, hydrolysis, clay fixation, etc.,).
We believe that further investigation and analysis should be conducted to more accurately define and characterize this edaphic contrast in SOM. Moreover, we propose that in soils such as the aforementioned, spatio-temporal variance between years, and even experimental studies, may directly impact the proliferation and habitability of these edaphic systems by plants.
5. Conclusions
In conclusion, Chickasha was highly resistant to changes in soil pH to applications of both Alum and lime. Despite doubling the estimated application rate in selected main plots (soil pH 4 and soil pH 5), only slight increases in soil acidity occurred. Analysis of the buffering indices of Stillwater and Chickasha, while treating Alsat as a continuous predictor variable, revealed heterologous graphical relationships. At a similar buffer index (BI) of about 6.5, Alsat at Stillwater was 4 times as high as Chickasha. We conclude that edaphic differences such as higher organically bound Al and dissolved organic carbon (DOC), and spatio-temporal variance help to mitigate dissolution of Al+3. We propose that this mechanism could be partially driven by adsorption reactions governed by the solubility of Al(OH)+2 species, evident by the resistance of the soil pH to decrease below 5. While conclusions by Gillespie et al. (2020) regarding Al tolerance were derived wholly from observations at Stillwater, notable discrepancies in the inherent soil characteristics of the Dale (Chickasha) and Easpur (Stillwater) soil series promote a research question involving the implications of Al fractionation and distribution within partially-analogous soil taxonomic series on cropping systems with acidic soils [8]. Thus, there is provision for future exploration involving the identification of ancillary factors that influence the buffering capacity of acidic soils across a multitude of edaphic environments. Moreover, it is important to note that the nature of varying spatial-temporal conditions in edaphic environments will ultimately influence the agronomic aptitude of cultivated inhabitants [8].
Author Contributions
C.J.G. contributed to conceptualization, formal analysis, manuscript writing, illustrations, tables. H.Z. provided resources and supervision. J.A.A. and H.Z. contributed to editing, validation, and project administration. All authors have read and agreed to the published version of the manuscript.
Funding
This research received no external funding.
Institutional Review Board Statement
Not applicable.
Informed Consent Statement
Not applicable.
Acknowledgments
We extend a special thanks to Nicholas Kaukis and Matteo Cleary for their statistical advisement and guidance.
Conflicts of Interest
The authors declare no conflict of interest. The funders had no role in the design of the study; in the collection, analyses, or interpretation of data; in the writing of the manuscript, or in the decision to publish the results.
References
- Lukiw, W.J. Evidence supporting a biological role for aluminum in chromatin compaction and epigenetics. J. Inorg. Biochem. 2010, 104, 1010–1012. [Google Scholar] [CrossRef] [PubMed]
- Aggarwal, A.; Ezaki, B.; Munjal, A.; Tripathi, B.N. Physiology and Biochemistry of Aluminum Toxicity and Tolerance in Crops. In Stress Responses in Plants; Springer: Berlin/Heidelberg, Germany, 2015; pp. 35–57. [Google Scholar]
- Påhlsson, A.-M.B. Influence of aluminium on biomass, nutrients, soluble carbohydrates and phenols in beech (Fagus sylvatica). Physiol. Plant. 1990, 78, 79–84. [Google Scholar] [CrossRef]
- Bear, F.E. Toxic Elements in Soils. In Yearbook of Agriculture 1957, Soils, A. Stefferud; United States Government Printing Office: Washington, DC, USA, 1957; pp. 165–171. [Google Scholar]
- Kochian, L.V.; Piñeros, M.A.; Hoekenga, O.A. The Physiology, Genetics and Molecular Biology of Plant Aluminum Resistance and Toxicity. Plant Soil 2005, 274, 175–195. [Google Scholar] [CrossRef]
- Kariuki, S.K.; Zhang, H.; Schroder, J.L.; Edwards, J.; Payton, M.; Carver, B.F.; Raun, W.; Krenzer, E.G. Hard Red Winter Wheat Cultivar Responses to a pH and Aluminum Concentration Gradient. Agron. J. 2007, 99, 88–98. [Google Scholar] [CrossRef]
- U.S. Department of Agriculture. Farmland Ownership and Tenure; United States Department of Agriculture, Economic Research Service: 2020. Available online: https://www.ers.usda.gov/topics/farm-economy/land-use-land-value-tenure/farmland-ownership-and-tenure/ (accessed on 14 February 2020).
- Gillespie, C.J.; Marburger, D.A.; Carver, B.F.; Zhang, H. Closely Related Winter Wheat Cultivar Performance in US Great Plains Acid Soils. Agron. J. 2020, 112, 3704–3717. [Google Scholar] [CrossRef]
- Lollato, R.; Edwards, J.T.; Zhang, H. Effect of Alternative Soil Acidity Amelioration Strategies on Soil pH Distribution and Wheat Agronomic Response. Soil Sci. Soc. Am. J. 2013, 77, 1831–1841. [Google Scholar] [CrossRef]
- Fageria, N.K.; Nascente, A.S. Management of Soil Acidity of South American Soils for Sustainable Crop Production. Adv. Agron. 2014, 128, 221–275. [Google Scholar] [CrossRef]
- Zhang, H.; Raun, W.R.; Warren, J.; Arnall, D.B.; Penn, C.; Bushong, J.; Abit, J. Oklahoma Soil Fertility Handbook; Oklahoma Cooperative Extension Service Publication; Handbook E-1039; Oklahoma State University, Department of Plant and Soil Sciences: Stillwater, OK, USA, 2017; p. 188. [Google Scholar]
- Boman, R.; Westerman, R.; Johnson, G.; Jojola, M. Phosphorus Fertilization Effects on Winter Wheat Production in Acid Soils. Effic. Use Fertil. Agron. 1992, 92, 1. [Google Scholar]
- Xiao, K.; Yu, L.; Xu, J.; Brookes, P.C. pH, nitrogen mineralization, and KCl-extractable aluminum as affected by initial soil pH and rate of vetch residue application: Results from a laboratory study. J. Soils Sediments 2014, 14, 1513–1525. [Google Scholar] [CrossRef]
- Mossor-Pietraszewska, T. Effect of aluminium on plant growth and metabolism. Acta Biochim. Pol. 2001, 48, 673–686. [Google Scholar] [CrossRef]
- Ramgareeb, S.; Cooke, J.A.; Watt, M. Responses of meristematic callus cells of two Cynodon dactylon genotypes to aluminium. J. Plant Physiol. 2004, 161, 1245–1258. [Google Scholar] [CrossRef]
- Lollato, R.P.; Ochsner, T.E.; Arnall, D.B.; Griffin, T.W.; Edwards, J.T. From Field Experiments to Regional Forecasts: Upscaling Wheat Grain and Forage Yield Response to Acidic Soils. Agron. J. 2019, 111, 287–302. [Google Scholar] [CrossRef] [Green Version]
- Ifansyah, H. Soil PH and Solubility of Aluminum, Iron, and Phosphorus in Ultisols: The Roles of Humic Acid. J. Trop. Soils 2014, 18, 203–208. [Google Scholar] [CrossRef]
- Miller, R.O.; Kissel, D.E. Comparison of Soil pH Methods on Soils of North America. Soil Sci. Soc. Am. J. 2010, 74, 310–316. [Google Scholar] [CrossRef]
- Sikora, F.J. A Buffer that Mimics the SMP Buffer for Determining Lime Requirement of Soil. Soil Sci. Soc. Am. J. 2006, 70, 474–486. [Google Scholar] [CrossRef]
- Mehlich, A. Mehlich 3 soil test extractant: A modification of Mehlich 2 extractant. Commun. Soil Sci. Plant Anal. 1984, 15, 1409–1416. [Google Scholar] [CrossRef]
- Pittman, J.J.; Zhang, H.; Schroder, J.L.; Payton, M.E. Differences of Phosphorus in Mehlich 3 Extracts Determined by Colorimetric and Spectroscopic Methods. Commun. Soil Sci. Plant Anal. 2005, 36, 1641–1659. [Google Scholar] [CrossRef]
- Sumner, M.E.; Miller, W.P. Cation Exchange Capacity and Exchange Coefficients. In Methods of Soil Analysis, Part 3. Chemical Methods; Sparks, D.L., Ed.; American Society of Agronomy: Madison, WI, USA, 1996; Volume 5, pp. 1201–1229. [Google Scholar]
- SAS Institute. The JMP System for Windows; SAS Institute: Cary, NC, USA, 2017. [Google Scholar]
- Sutradhar, A.; Lollato, R.; Butchee, K.; Arnall, D.B. Determining Critical Soil pH for Sunflower Production. Int. J. Agron. 2014, 2014, 1–13. [Google Scholar] [CrossRef] [Green Version]
- NRCS; USDA. Web Soil Survey. Available online: http://www.websoilsurvey.ncsc.usda.gov/app/ (accessed on 1 May 2019).
- Cornell, J.A.; Berger, R.D. Factors that influence the value of the coefficient of determination in simple linear and nonline-ar regression models. Phytopathology 1987, 77, 63–70. [Google Scholar] [CrossRef]
- Wang, S.; Wang, P.; Fan, C.Q. Distribution of Aluminum Fractionation in the Acidic Rhizosphere Soils of Masson Pine (Pinus massonianaLamb). Commun. Soil Sci. Plant Anal. 2015, 46, 2033–2050. [Google Scholar] [CrossRef]
- Antonangelo, J.; Neto, J.F.; Crusciol, C.A.C.; Alleoni, L.R.F. Lime and calcium-magnesium silicate in the ionic speciation of an Oxisol. Sci. Agric. 2017, 74, 317–333. [Google Scholar] [CrossRef] [Green Version]
- Chang, Y.-W.; Hsieh, C.-J.; Chang, K.-W.; Ringgaard, M.; Lin, C.-J. Training and Testing Low-Degree Polynomial Data Mappings via Linear SVM. J. Mach. Learn. Res. 2010, 11, 1471–1490. [Google Scholar]
- Kaitibie, S.; Epplin, F.M.; Krenzer, E.G.; Zhang, H. Economics of Lime and Phosphorus Application for Dual-Purpose Winter Wheat Production in Low-pH Soils. Agron. J. 2002, 94, 1139–1145. [Google Scholar] [CrossRef]
- Hsu, P.H.; Rennie, D.A. Reactions of phosphate in aluminum systems: II. Precipitation of phosphate by exchangeable alumi-num on a cation exchange resin. Can. J. Soil Sci. 1962, 42, 210–221. [Google Scholar] [CrossRef] [Green Version]
Figure 1.
The Easpur loam soil at Stillwater indicated a significant relationship involving soil pH and Al concentrations. However, Chickasha did not exhibit the significant exponential relationship between soil pH and Alsat/AlKCl that would be expected in aluminous acidic soils. (A) Relationship between soil pH and Al saturation (Alsat) at Stillwater (circles) (p < 0.0001) and Chickasha (marks); (B) relationship between soil pH and exchangeable Al (reactive Al) at Stillwater (circles) (p < 0.0001) and Chickasha (marks). Year 1 and Year 2 combined for each figure (Levene’s test, p > 0.05). Negative R2 values at Chickasha serve as an indicator of lack of model fit and failure of the model to statistically converge. Stillwater curves redacted from “Closely related winter wheat cultivar performance in U.S. Great Plains acid soils,” by Gillespie et al., 2020, Agronomy Journal, 112(5), 3704–3717. Copyright (2020) by Wiley Periodicals LLC.

Figure 2.
(A) Cubic trend among buffer index (BI) and Al saturation (Alsat) at Chickasha, OK (pooled for Year 1 and Year 2); p < 0.0001. (B) The linear trend among buffer index (BI) and Al saturation (Alsat) at Stillwater, OK (pooled Year 1 and Year 2); p < 0.0001.
Figure 2.
(A) Cubic trend among buffer index (BI) and Al saturation (Alsat) at Chickasha, OK (pooled for Year 1 and Year 2); p < 0.0001. (B) The linear trend among buffer index (BI) and Al saturation (Alsat) at Stillwater, OK (pooled Year 1 and Year 2); p < 0.0001.


Table 1.
Soil pH, aluminum saturation (Alsat), and exchangeable aluminum (AlKCl) range for Stillwater and Chickasha during Year 1 and Year 2.
Table 1.
Soil pH, aluminum saturation (Alsat), and exchangeable aluminum (AlKCl) range for Stillwater and Chickasha during Year 1 and Year 2.
| Location | Year | Soil pH | Al Saturation (Alsat) | AlKCl (mg kg−1) |
|---|---|---|---|---|
| Stillwater | 1 | 4.5–7.1 | 38.8–0% | 184–0 |
| 2 | 4.3–6.5 | 34.9–0% | 165–0 | |
| Chickasha | 1 | 5.0–7.1 | 8.14–0% | 57.0–0 |
| 2 | 4.9–6.7 | 10.1–0% | 66.0–0 |
Table 2.
Continuous monitoring for 2 winter wheat cropping seasons regarding exchangeable Al (AlKCl) and Al saturation (Alsat) for each main plot at Stillwater.
Table 2.
Continuous monitoring for 2 winter wheat cropping seasons regarding exchangeable Al (AlKCl) and Al saturation (Alsat) for each main plot at Stillwater.
| Target pH | Main Plot | AlKCl, mg kg−1 (MSY1) | Alsat, % (MSY1) | AlKCl, mg kg−1 (BOY2) | Alsat, % (BOY2) | AlKCl, mg kg−1 (MSY2) | Alsat, % (MSY2) |
|---|---|---|---|---|---|---|---|
| 4 | 105 | 148 | 28 | 141 | 28 | 147 | 28 |
| 205 | 120 | 23 | 128 | 25 | 150 | 30 | |
| 301 | 130 | 28 | 178 | 35 | 131 | 28 | |
| 401 | 184 | 39 | 138 | 30 | 165 | 35 | |
| 4.5 | 106 | 51 | 10 | 67 | 14 | 93 | 18 |
| 203 | 63 | 12 | 84 | 16 | 92 | 19 | |
| 304 | 68 | 13 | 82 | 16 | 74 | 14 | |
| 402 | 71 | 14 | 94 | 16 | 104 | 14 | |
| 5 | 101 | 14 | 2 | 26 | 5 | 78 | 15 |
| 202 | 42 | 8 | 46 | 9 | 44 | 8 | |
| 303 | 28 | 5 | 35 | 7 | 47 | 9 | |
| 403 | 28 | 5 | 36 | 7 | 61 | 12 | |
| 5.5 | 103 | 14 | 2 | 8 | 1 | 6 | 1 |
| 201 | 0 | 0 | 0 | 0 | 26 | 5 | |
| 302 | 9 | 2 | 9 | 2 | 33 | 7 | |
| 404 | 17 | 3 | 6 | 1 | 26 | 5 | |
| 6 | 102 | 0 | 0 | 0 | 0 | 3 | 0 |
| 204 | 21 | 4 | 2 | 0 | 21 | 4 | |
| 306 | 0 | 0 | 0 | 0 | 4 | 1 | |
| 405 | 10 | 2 | 7 | 1 | 4 | 1 | |
| 7 | 104 | 0 | 0 | 10 | 1 | 0 | 0 |
| 206 | 0 | 0 | 0 | 0 | 3 | 1 | |
| 305 | 0 | 0 | 0 | 0 | 0 | 0 | |
| 406 | 0 | 0 | 0 | 0 | 0 | 0 |
MSY1—mid-season of year 1; BOY2—beginning of year 2 (end of season 1); MSY2—mid-season of year 2; Beginning of year 1 (BOY1) Al measurements were not collected.
Table 3.
Continuous monitoring for 2 winter wheat cropping seasons regarding soil pH, target soil pH, and aluminum sulfate (Alum) and calcium hydroxide (Lime) amendment rates for each main plot at Stillwater.
Table 3.
Continuous monitoring for 2 winter wheat cropping seasons regarding soil pH, target soil pH, and aluminum sulfate (Alum) and calcium hydroxide (Lime) amendment rates for each main plot at Stillwater.
| Target pH | Main Plot | Soil pH (BOY1) | Amendment Rate (kg ha−1) | Soil pH (MSY1) | Soil pH (BOY2) | Amendment Rate (kg ha−1) | Soil pH (MSY2) |
|---|---|---|---|---|---|---|---|
| 4 | 105 | 4.3 | 888 (Alum) | 4.6 | 4.5 | 2180 (Alum) | 4.3 |
| 205 | 4.4 | 1157 (Alum) | 4.6 | 4.6 | 2637 (Alum) | 4.4 | |
| 301 | 4.4 | 1157 (Alum) | 4.6 | 4.4 | 1749 (Alum) | 4.4 | |
| 401 | 4.1 | 296 (Alum) | 4.5 | 4.4 | 1749 (Alum) | 4.3 | |
| 4.5 | 106 | 4.6 | 296 (Alum) | 5.3 | 5 | 2180 (Alum) | 4.6 |
| 203 | 4.4 | 188 (Lime) | 5 | 4.9 | 1749 (Alum) | 4.6 | |
| 304 | 4.6 | 296(Alum) | 5.1 | 4.9 | 1749 (Alum) | 4.9 | |
| 402 | 4.9 | 1157 (Alum) | 5 | 4.9 | 1749 (Alum) | 4.4 | |
| 5 | 101 | 4.8 | 376 (Lime) | 5.7 | 5.5 | 2180 (Alum) | 4.6 |
| 202 | 5.2 | 592 (Alum) | 5.1 | 5 | *** | 5 | |
| 303 | 4.7 | 538 (Lime) | 5.4 | 5.3 | *** | 5.3 | |
| 403 | 4.6 | 727 (Lime) | 5.5 | 5.2 | *** | 5.5 | |
| 5.5 | 103 | 5.4 | 188 (Lime) | 5.6 | 5.6 | *** | 5.6 |
| 201 | 4.9 | 1103 (Lime) | 6.1 | 6.2 | 3040 (Alum) | 5.1 | |
| 302 | 5 | 915 (Lime) | 5.8 | 5.6 | *** | 5.6 | |
| 404 | 5 | 915 (Lime) | 5.4 | 5.7 | *** | 5.5 | |
| 6 | 102 | 5.4 | 1103 (Lime) | 6.2 | 6.2 | *** | 6.2 |
| 204 | 5.8 | 377 (Lime) | 5.5 | 5.8 | *** | 5.8 | |
| 306 | 5.3 | 1292 (Lime) | 6.5 | 6.5 | 2180 (Alum) | 5.8 | |
| 405 | 4.9 | 2018 (Lime) | 5.8 | 5.6 | 727 (Lime) | 5.8 | |
| 7 | 104 | 6.1 | 1642 (Lime) | 6.7 | 7.1 | *** | 7.1 |
| 206 | 6.4 | 1103 (Lime) | 6.8 | 6.8 | *** | 6.8 | |
| 305 | 6.5 | 915 (Lime) | 7.1 | 6.9 | *** | 6.9 | |
| 406 | 6 | 915 (Lime) | 7.1 | 6.8 | *** | 6.8 |
*** No amendment was applied. Amendment rates for year two were 1.5× the soil curve estimation or all soil pH targets. MSY1—mid-season of year 1; BOY2—beginning of year 2 (end of season 1); MSY2—mid-season of year 2; Beginning of year 1 (BOY1) Al measurements were not collected.
Table 4.
Continuous monitoring for 2 winter wheat cropping seasons regarding exchangeable Al (AlKCl) and Al saturation (Alsat) for each main plot at Chickasha.
Table 4.
Continuous monitoring for 2 winter wheat cropping seasons regarding exchangeable Al (AlKCl) and Al saturation (Alsat) for each main plot at Chickasha.
| Target pH | Main Plot | AlKCl, mg kg−1 (MSY1) | Alsat, % (MSY1) | AlKCl, mg kg−1 (BOY2) | Alsat, % (BOY2) | AlKCl, mg kg−1 (MSY2) | Alsat, % (MSY2) |
|---|---|---|---|---|---|---|---|
| 4 | 105 | 4.62 | 1 | 1.58 | 0 | 11.45 | 1 |
| 204 | 37.70 | 5 | 28.752 | 2 | 58.80 | 8 | |
| 306 | 20.10 | 3 | 18.54 | 1 | 34.50 | 5 | |
| 401 | 36.15 | 5 | 24.00 | 2 | 53.35 | 8 | |
| 4.5 | 103 | 7.41 | 1 | 3.55 | 0 | 27.20 | 4 |
| 201 | 19.89 | 3 | 21.12 | 2 | 19.00 | 3 | |
| 302 | 9.79 | 1 | 10.54 | 1 | 26. | 4 | |
| 402 | 57.14 | 8 | 30.83 | 2 | 65.55 | 10 | |
| 5 | 102 | 28.4 | 4 | 24.81 | 2 | 29.55 | 4 |
| 205 | 4.62 | 1 | 0.87 | 0 | 8.90 | 1 | |
| 304 | 0.36 | 0 | 0.34 | 0 | 4.35 | 1 | |
| 403 | 40.47 | 6 | 37.90 | 3 | 48.20 | 8 | |
| 5.5 | 104 | 8.91 | 1 | 4.74 | 0 | 12.85 | 2 |
| 206 | 0.15 | 0 | 0.33 | 0 | 3.75 | 1 | |
| 301 | 1.00 | 0 | 0 | 0 | 3.85 | 1 | |
| 404 | 9.81 | 10 | 10.33 | 10 | 10.10 | 10 | |
| 6 | 101 | 0.52 | 0 | 0 | 0 | 2.30 | 0 |
| 203 | 3.15 | 0 | 0 | 0 | 1.50 | 0 | |
| 305 | 0 | 0 | 0.37 | 0 | 0.80 | 0 | |
| 405 | 0.21 | 0 | 0 | 0 | 0 | 0 | |
| 7 | 106 | 0.06 | 0 | 0 | 0 | 2.05 | 0 |
| 202 | 0 | 0 | 0 | 0 | 1.30 | 0 | |
| 303 | 0.11 | 0 | 0.19 | 0 | 2.10 | 0 | |
| 406 | 0.12 | 0 | 0 | 0 | 0 | 0 |
MSY1—mid-season of year 1; BOY2—beginning of year 2 (end of season 1); MSY2—mid-season of year 2; Beginning of year 1 (BOY1) Al measurements were not collected.
Table 5.
Continuous monitoring for 2 winter wheat cropping seasons regarding soil pH, target soil pH, and aluminum sulfate (Alum) and calcium hydroxide (Lime) amendment rates for each main plot at Chickasha.
Table 5.
Continuous monitoring for 2 winter wheat cropping seasons regarding soil pH, target soil pH, and aluminum sulfate (Alum) and calcium hydroxide (Lime) amendment rates for each main plot at Chickasha.
| Target pH | Main Plot | Soil pH (BOY1) | Amendment Rate (kg ha−1) | Soil pH (MSY1) | Soil pH (BOY2) | Amendment Rate (kg ha−1) | Soil pH (MSY2) |
|---|---|---|---|---|---|---|---|
| 4 | 105 | 5.4 | 2260 (Alum) | 5.2 | 5.4 | 3337 (Alum) | 5.1 |
| 204 | 5 | 1614.6 (Alum) | 5 | 5.1 | 2610 (Alum) | 4.9 | |
| 306 | 5.5 | 2422 (Alum) | 5 | 5.2 | 2852 (Alum) | 4.9 | |
| 401 | 5.4 | 2260 (Alum) | 5 | 5.1 | 2610 (Alum) | 4.9 | |
| 4.5 | 103 | 5.3 | 1292 (Alum) | 5.2 | 5.3 | 1911 (Alum) | 5.1 |
| 201 | 5.6 | 1776 (Alum) | 5 | 5.1 | 1426 (Alum) | 5.1 | |
| 302 | 5.4 | 1453 (Alum) | 5.2 | 5.3 | 1911 (Alum) | 5.2 | |
| 402 | 5.2 | 1130 (Alum) | 5.1 | 5 | 1184 (Alum) | 5 | |
| 5 | 102 | 5.2 | 323 (Alum) | 5.2 | 5.2 | *** | 5.2 |
| 205 | 5.3 | 484(Alum) | 5.5 | 5.4 | 484.38 (Alum) | 5.3 | |
| 304 | 5.4 | 646(Alum) | 5.7 | 5.7 | 834 (Alum) | 5.5 | |
| 403 | 4.9 | 81 (Lime) | 5.2 | 5 | *** | 5 | |
| 5.5 | 104 | 5.8 | 484 (Alum) | 5.3 | 5.3 | *** | 5.3 |
| 206 | 6.4 | 1453 (Alum) | 5.5 | 5.5 | *** | 5.5 | |
| 301 | 6 | 807 (Alum) | 5.5 | 5.6 | *** | 5.6 | |
| 404 | 5.4 | 81 (Lime) | 5.6 | 5.3 | *** | 5.3 | |
| 6 | 101 | 5.9 | 81 (Lime) | 5.6 | 5.6 | 312 (Lime) | 5.7 |
| 203 | 5.3 | 538 (Lime) | 5.6 | 5.7 | 242 (Lime) | 5.8 | |
| 305 | 5.7 | 242 (Lime) | 5.8 | 5.6 | 323 (Lime) | 5.8 | |
| 405 | 5.6 | 323 (Lime) | 5.7 | 5.7 | 242 (Lime) | 6 | |
| 7 | 106 | 6.4 | 457 (Lime) | 6.4 | 6.3 | 457 (Lime) | 6.5 |
| 202 | 6.2 | 619 (Lime) | 6.4 | 6.5 | 378 (Lime) | 6.4 | |
| 303 | 5.7 | 1023 (Lime) | 6.2 | 6.5 | 378 (Lime) | 6.4 | |
| 406 | 5.9 | 861 (Lime) | 6.3 | 6.4 | 457 (Lime) | 6.5 |
*** No amendment was applied. Amendment rates for year two were 2.0× the soil curve estimation for 4.0 and 4.5 soil pH targets. BOY 1—beginning of year 1; MSY1- mid-season of year 1; BOY2—beginning of year 2 (end of season 1); MSY2—mid-season of year 2.
Publisher’s Note: MDPI stays neutral with regard to jurisdictional claims in published maps and institutional affiliations. |
© 2021 by the authors. Licensee MDPI, Basel, Switzerland. This article is an open access article distributed under the terms and conditions of the Creative Commons Attribution (CC BY) license (https://creativecommons.org/licenses/by/4.0/).
Share and Cite
MDPI and ACS Style
Gillespie, C.J.; Antonangelo, J.A.; Zhang, H. The Response of Soil pH and Exchangeable Al to Alum and Lime Amendments. Agriculture 2021, 11, 547. https://doi.org/10.3390/agriculture11060547
AMA Style
Gillespie CJ, Antonangelo JA, Zhang H. The Response of Soil pH and Exchangeable Al to Alum and Lime Amendments. Agriculture. 2021; 11(6):547. https://doi.org/10.3390/agriculture11060547
Chicago/Turabian StyleGillespie, Christopher Jorelle, João Arthur Antonangelo, and Hailin Zhang. 2021. "The Response of Soil pH and Exchangeable Al to Alum and Lime Amendments" Agriculture 11, no. 6: 547. https://doi.org/10.3390/agriculture11060547
Note that from the first issue of 2016, this journal uses article numbers instead of page numbers. See further details here.