Article

Prediction of Soil Oxalate Phosphorus using Visible and Near-Infrared Spectroscopy in Natural and Cultivated System Soils of Madagascar

by
Hobimiarantsoa Rakotonindrina
1,
Kensuke Kawamura
2,
Yasuhiro Tsujimoto
2,
Tomohiro Nishigaki
2,
Herintsitohaina Razakamanarivo
1,
Bruce Haja Andrianary
1 and
Andry Andriamananjara
1,*
1
Laboratoire des RadioIsotopes, Université d’Antananarivo, BP 3383, Route d’Andraisoro, 101 Antananarivo, Madagascar
2
Japan International Research Center for Agricultural Sciences (JIRCAS), 1-1 Ohwashi, Tsukuba, Ibaraki 305-8686, Japan
*
Author to whom correspondence should be addressed.
Agriculture 2020, 10(5), 177; https://doi.org/10.3390/agriculture10050177
Submission received: 23 March 2020 / Revised: 14 May 2020 / Accepted: 15 May 2020 / Published: 16 May 2020
(This article belongs to the Section Agricultural Soils)

Abstract

:
Phosphorus is among the main limiting nutrients for plant growth and productivity in both agricultural and natural ecosystems in the tropics, which are characterized by weathered soil. Soil bioavailable P measurement is necessary to predict the potential growth of plant biomass in these ecosystems. Visible and near-infrared reflectance spectroscopy (Vis-NIRS) is widely used to predict soil chemical and biological parameters as an alternative to time-consuming conventional laboratory analyses. However, quantitative spectroscopic prediction of soil P remains a challenge owing to the difficulty of direct detection of orthophosphate. This study tested the performance of Vis-NIRS with partial least square regression to predict oxalate-extractable P (Pox) content, representing available P for plants in natural (forest and non-forest including fallows and degraded land) and cultivated (upland and flooded rice fields) soils in Madagascar. Model predictive accuracy was assessed based on the coefficient of determination (R2), the root mean squared error of cross-validation (RMSECV), and the residual predictive deviation (RPD). The results demonstrated successful Pox prediction accuracy in natural (n = 74, R² = 0.90, RMSECV = 2.39, and RPD = 3.22), and cultivated systems (n = 142, R² = 0.90, RMSECV = 48.57, and RPD = 3.15) and moderate usefulness at the regional scale incorporating both system types (R² = 0.70, RMSECV = 71.87 and RPD = 1.81). These results were also confirmed with modified bootstrap procedures (N = 10,000 times) using selected wavebands on iterative stepwise elimination–partial least square (ISE–PLS) models. The wavebands relevant to soil organic matter content and Fe content were identified as important components for the prediction of soil Pox. This predictive accuracy for the cultivated system was related to the variability of some samples with high Pox values. However, the use of “pseudo-independent” validation can overestimate the prediction accuracy when applied at site scale suggesting the use of larger and dispersed geographical cover sample sets to build a robust model. Our study offers new opportunities for P quantification in a wide range of ecosystems in the tropics.

1. Introduction

Phosphorus is an essential plant nutrient. The low P availability of strongly weathered soil can seriously affect plant growth and limit crop yields [1] while soil P limitation can cause a decline in climax ecosystems by decreasing biomass productivity [2]. The limitation of net primary production in terrestrial ecosystems with low soil P, such as tropical forests, leads to a carbon balance that tends to increase CO2 release [3]. Ferralsols are characterized by very low available soil P, mainly due to sorption on and in Fe and Al oxyhydroxides [4,5]. The availability of P for plants has been evaluated from soil P tests and calibrated with field and pot experiments [6,7]. Oxalate-extractable P (Pox) is reported to accurately predict the availability of P in highly weathered soil [8] because of oxalate’s potential to extract the active reductant-soluble P fraction [9]. The quantification of Pox is based on P extraction with ammonium oxalate and oxalic acid [10]. Acidified ammonium oxalate extractant dissolves amorphous, poorly crystalline oxides, and hydroxides of Fe and Al, and consequently released P [4,9,11]. Oxalate P is highly correlated with rice plant P uptake in lowland and upland fields [4,12]. It also extracts more P than other chemical methods [13,14]. Pox is thus the best indicator of P availability for both fertilizer management in agricultural systems and natural ecosystem management.
There is a need for more reliable, rapid, and accurate soil P assessment as an alternative to time-consuming conventional laboratory analyses. The more rapid, cost-effective alternative approaches of spectrometry analysis and chemometric techniques have been widely used to estimate soil and plant compositions [15,16,17]. Spectrometry in visible and near infra-red (Vis-NIR) is based on the absorption of radiation at a specific wavelength by certain molecular bonds in the near-infrared (NIR) region [18]. Spectral data are calibrated using the specific soil properties of samples, determined by conventional methods. The Vis-NIR region (400–2500 nm) is dominated by weaker and broader signals from vibration overtones and combination bands [19]. The absorption coefficients are much lower, which allows for better penetration of light into the material [20]. The Vis-NIRS approach has been successfully applied to predict soil chemical and biological parameters [21,22,23].
Challenges, however, still remain. P is not spectrally active in the Vis-NIR region, and thus, it can only be detected indirectly, in an organically bound form [24]. However, previous studies have shown the potential of this approach to predict soil P, such as that of Kawamura et al. [25], who reported that Vis-NIRS coupled with partial least square (PLS) regression can predict soil Pox in Malagasy lowland and upland rice fields with moderate accuracy (R² = 0.78). These authors also suggested that the performance of PLS models could be improved through wavelength selection. However, the PLS models were developed only for rice fields, with a dataset (106 samples) obtained in central Madagascar, and their applicability to non-farm soils is still unknown. Thus, further analysis using a larger number of datasets including other land uses is needed. In Madagascar, almost 45% of the cultivated area is occupied by rice fields, as rice is the staple food crop for Malagasy people and is cultivated by 85% of farmers [26,27]. Moreover, the so-called “natural system”, as found in eastern Madagascar, was characterized by traditional farming practices in which forest and fallow land are subject to slash and burn agriculture. Land-use change affects soil properties [28] and assessment of these is in turn required to inform land management practices. Therefore, the present study evaluated the potential of the PLS model to predict Pox across different Malagasy land-use systems, including those where the natural system has been converted into a cultivated system.
This study aimed to investigate the usefulness of the Vis-NIRS approach with PLS modeling in predicting soil Pox in cultivated and natural systems and its applicability as a rapid method to assess soil properties at the ecosystem scale. To improve its predictive accuracy, we applied wavelength selection in the PLS procedures and compared its performance against standard full-spectrum PLS (FS-PLS) in cultivated and natural systems.

2. Materials and Methods

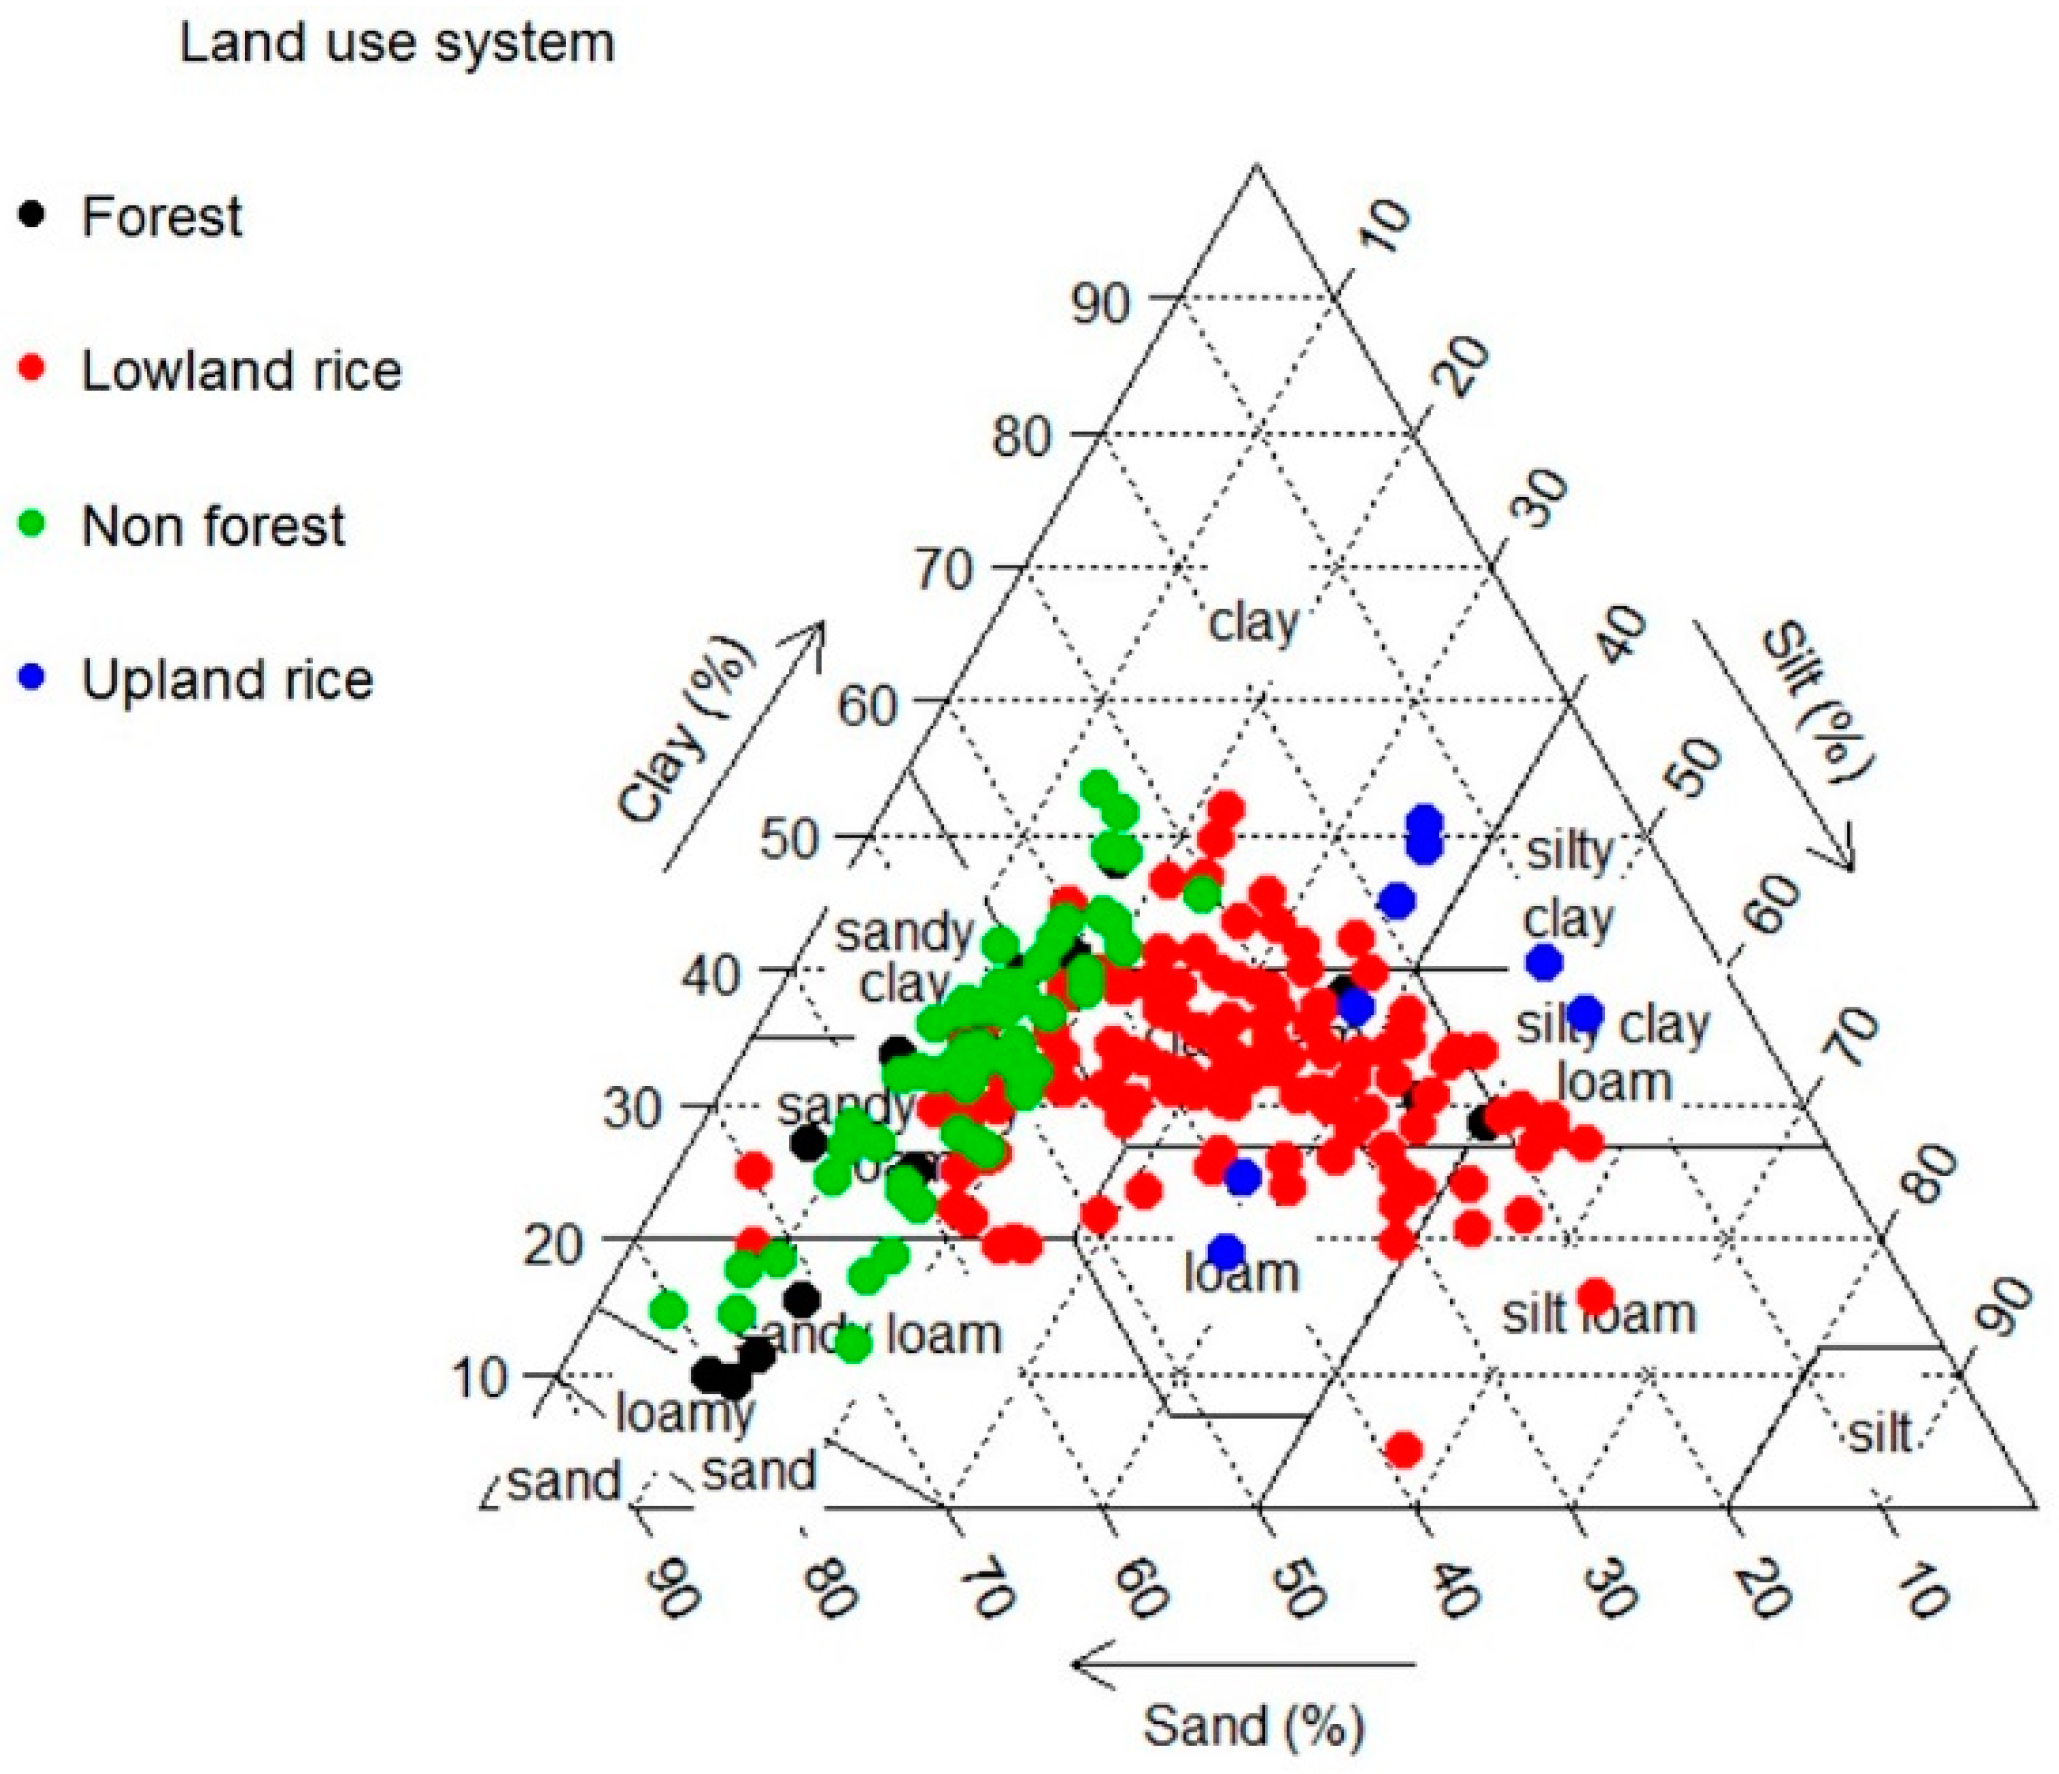
2.1. Study Area and Soil Sample Dataset

The soil samples used for this study were collected from areas of central and eastern Madagascar (Figure 1). The central sites, located in the Vakinankaratra region, were characterized by a humid climate with an annual mean precipitation of 1381 mm and a mean annual temperature of 16.9 °C. They are dominated by ferritic soils (FAO soil classification) which are generally acid with low available phosphorus [29,30]. The Vakinankaratra region is also among the rice-growing areas of Madagascar. The eastern sites are characterized by perhumid and humid climates with a mean annual rainfall of 2500 mm and a mean annual temperature of 18–24 °C [31,32]. This region is characterized by red and yellow ferralsols [33].
In the Vakinankaratra area, soil sampling at 15 cm depth was conducted in 142 farmer field plots under irrigated and upland rice systems during 2018 and 2019 (Table 1). In eastern Madagascar, soil samples were collected similarly during 2014 and 2015 from 74 forest and non-forest plots, the latter including fallow and degraded land systems [34]. The descriptive statistics of soil parameters for each studied site are reported in Table 2.

2.2. Laboratory Analyses

Soils were air-dried, ground, and sieved through 2 mm and 0.2 mm mesh prior to chemical analysis. All soil samples were analyzed for texture and for phosphorus and organic carbon contents. Oxalate-extractable P and Fe were determined following Schwertmann [10]. Soil organic carbon was determined by wet combustion using dichromate oxidation [35]. The separation of soil fractions for the soil texture analysis was carried out with the pipetting method in which soil samples pretreated with heat and H2O2 (35%) to remove organic matter are dispersed into clay, silt and sand fractions using NaOH.

2.3. Spectral Data Acquisition Using Vis-NIRS

Spectral data were recorded in a dark room at the Laboratoire des Radioisotopes, Antananarivo University using a Vis-NIR portable spectro-radiometer with 350–2500 nm range (ASD FieldSpec 4 Hi-Res, ASD Inc., Longmont, CO, USA). The recorded spectral resolution was 3 nm between 350 nm and 1000 nm and 6 nm between 1000 nm and 2500 nm. The output data were generated at 1 nm resolution using the cubic spline interpolation function in the ASD software (RS3 for Windows; ASD). Before each measurement, the spectrometer was calibrated using a white reference spectrum [17]. Soil samples were previously spread and leveled in optical-glass Petri dishes 85 mm in diameter. Five measurements were carried out at different positions for each soil sample. For each measurement, the instrument made 25 internal scans to optimize the signal-to-noise ratio. The generated spectra were averaged into one spectrum for each sample. Further details can be found in Kawamura et al. [36].

2.4. Spectral Analyses and Modeling Approaches

Prior to the modeling of Pox using PLS regression, data pre-processing was applied. Spectral data were reduced to 400–2400 nm by removing the spectral regions of 350–399 nm and 2401–2500 nm, in order to eliminate the influence of noise [36,37,38]. The reflectance spectra (R) were transformed into apparent absorbance (A = log (1/R)). To reduce noise and enhance the signals, first derivative reflectance (FDR) using a Savitzky–Golay smoothing filter [39] was used with an order 3 polynomial. The generated Vis-NIR spectra were mean-centered. Scatter correction using a standard normal variate transform (SNV) was applied to all spectra to reduce the particle size effect.
The modeling approach consisted of testing whether these reflectance spectra could be used to predict chemical data and identifying which spectral regions contribute to the prediction [40]. The PLS model incorporated the algorithms that extract a small number of latent factors as the independent variables relating to reflectance spectra, then used these factors in regression analysis with the chemical data as the dependent variables. The PLS regression model describing the relationship between soil spectra and measured soil Pox was built from the spectroscopic modeling. Leave–one-out cross-validation was used to select the best latent variable number and to avoid over-fitting of the PLS regression model [36,38,41]. The optimum number of latent variables was chosen by minimizing both the root mean squared error (RMSE) and the number of factors or latent vectors.
Two PLS regression approaches were performed to estimate soil parameters: FS-PLS and iterative stepwise elimination regression (ISE–PLS) [36]. The FS-PLS is a standard PLS model using FDR datasets. ISE–PLS is a PLS model using a waveband elimination algorithm to remove noisy variables and to select those able to improve predictive performance.
The prediction accuracies were evaluated using the coefficient of determination (R2), the root mean squared error of cross-validation (RMSECV), and the residual predictive deviation (RPD). The RPD is the ratio of standard deviation (SD) of the measured data to the standard error of prediction [42]. The model with the larger R² and RPD, and the smaller RMSE was considered the best model to predict soil Pox. It is generally accepted that an RPD value greater than 3 indicates an excellent predictive model for agricultural applications, and values between 2 and 3 indicate good predictive ability; values between 1.5 and 2 indicate an acceptable model requiring some improvement, and those below 1.5 indicate a poor predictive model [36,40].
To assess the predictive ability and reliability of the PLS models, a modified bootstrap procedure was performed [25]; the data was divided randomly into training (70%) and test (30%) data sets with a replacement for N = 10,000 times. In each process, a PLS model was developed using the training data set. Here, FS-PLS and ISE–PLS were developed using selected wavebands, and then the models were used to predict Pox in the test data set. The robustness of the prediction models was evaluated by the mean (±SD) values of R2 and the root mean squared error of prediction (RMSEP) from 10,000 runs in the test data sets.
All data handling and statistical analysis were performed using MATLAB software (Version 9.3; The MathWorks, Sherborn, MA, USA) and R software version 3.1.3 [43] (R Core Team 2015).

3. Results and Discussion

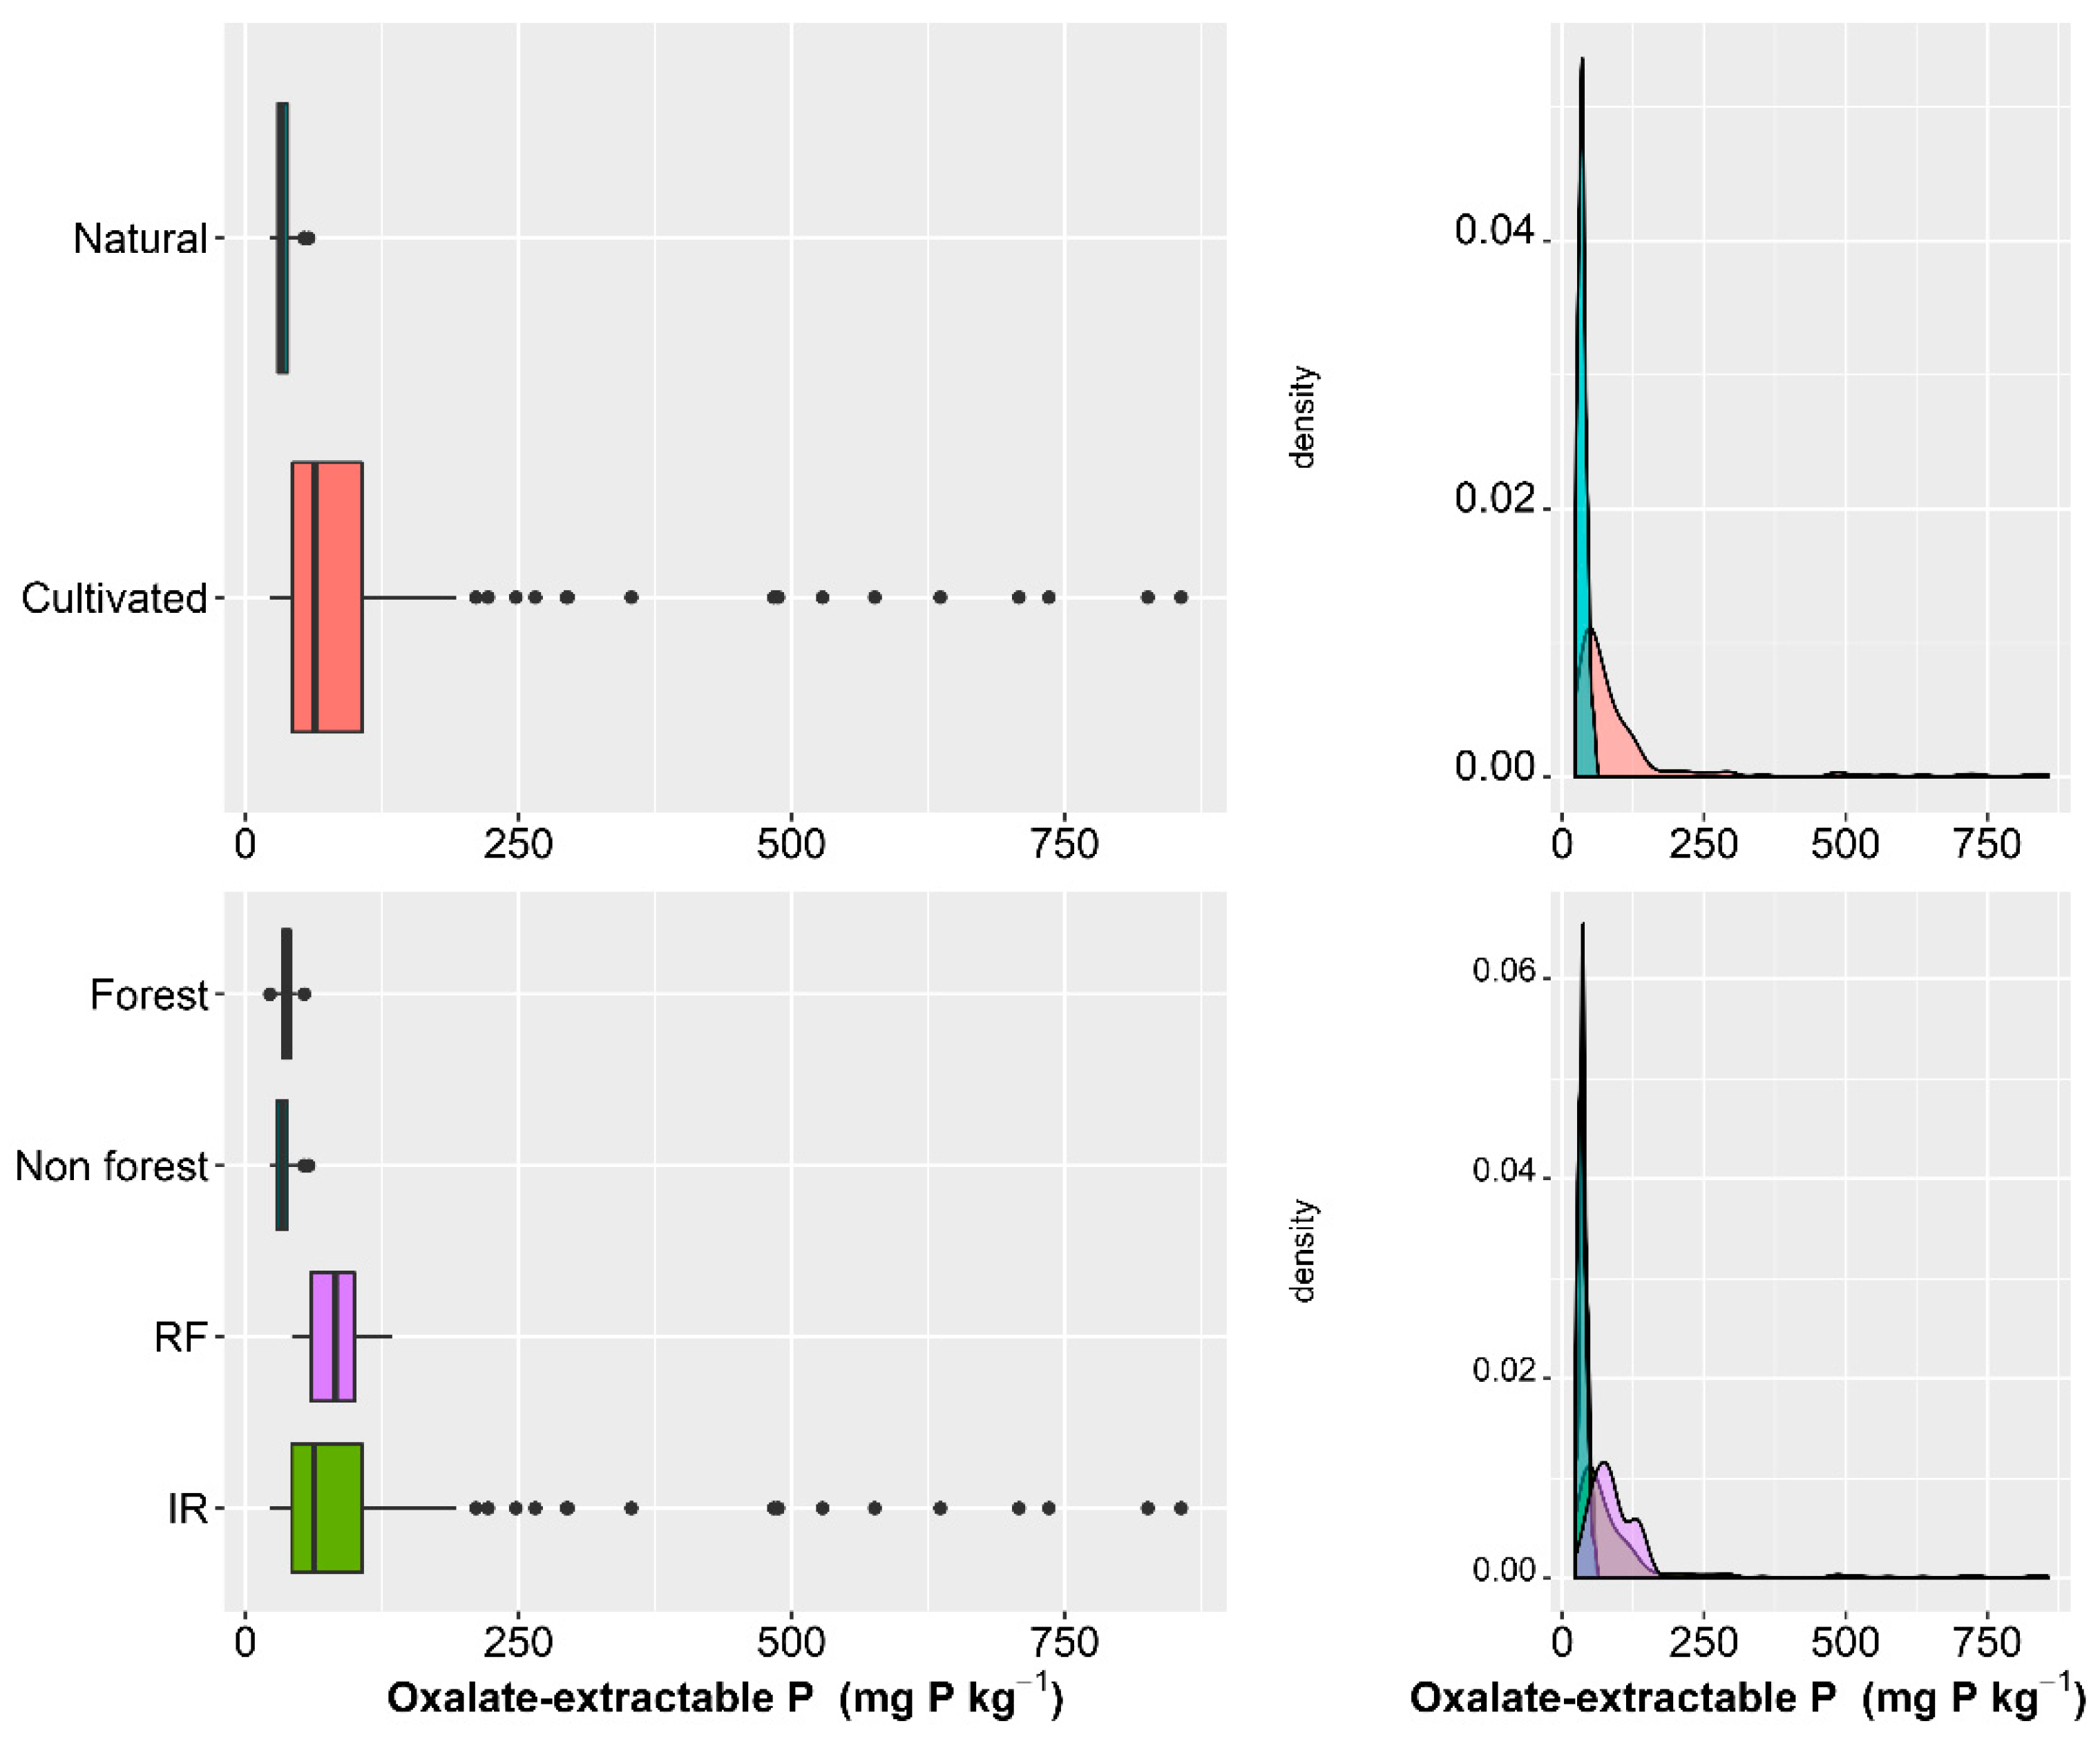
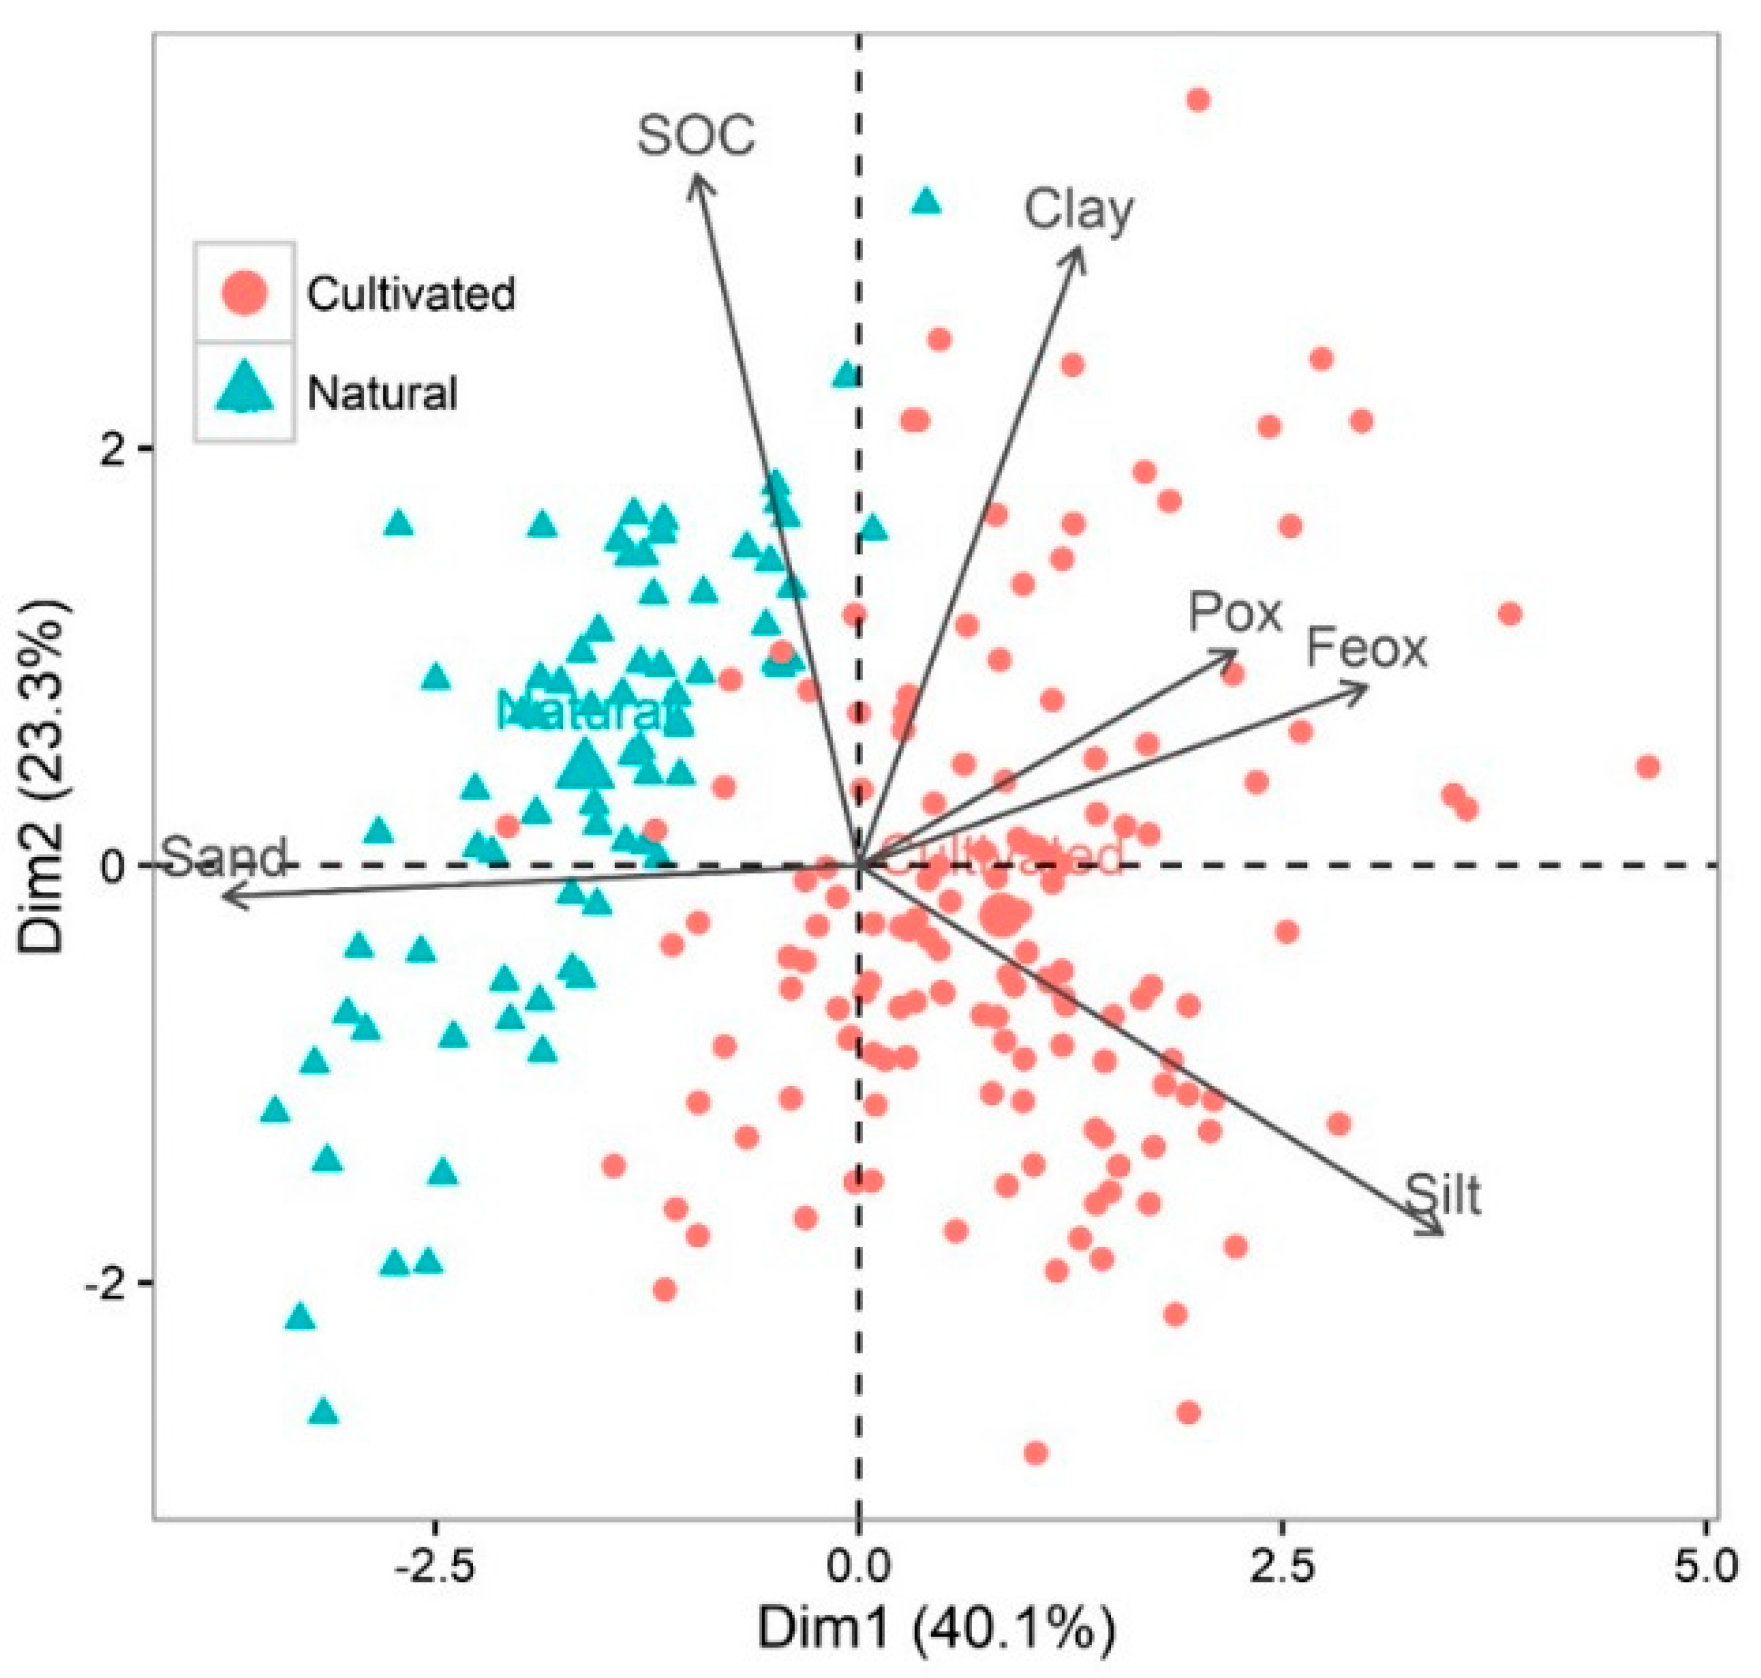
3.1. Soil Characteristics by Chemical Analysis

The descriptive statistics for soil Pox as measured by chemical analysis for all data and by the system are summarized in Table 3. The coefficient of variation (CV) for Pox when all data were combined data indicated large Pox variability (148.57%) with a heterogeneous distribution. The Pox content averaged 87.66 mg·kg−1 across all data, ranging from 21.89 to 856.84 mg·kg−1. As illustrated in Figure 2, the Pox level varied markedly within the cultivated rice systems, much more so than in the natural systems. Indeed, the highest Pox value recorded from natural systems was 57.93 mg·kg−1 with a CV of 22.23%, in contrast to that of the cultivated system, which was 856.84 mg·kg−1 with a CV of 133.56%. The third quartile cutoff, containing 75% of the data was 38.73 mg·kg−1 for all the natural systems and 106.62 mg·kg−1 for all the cultivated systems. The variation in P level seen in the substantial dispersion of the cultivated system data probably results from the different levels of fertilizer application to farmers’ plots. Based on the study by Dardenne et al. [44], such wide variation (CV > 50%) is recommended to achieve good NIRS calibration accuracy, indicating that our soil data were suitable for developing the spectroscopy model.
The difference in soil characteristics, including soil texture and the level of Pox in each system, can explain the high accuracy of prediction for each specific model. The correlation matrix between the Pox, SOC, and their related soil parameters are shown in Table 4. In the ensemble of the data, no significant correlation was observed for Pox and SOC. Among the significant relationships observed, soil parameters which could affect the Pox were SOC, sand, clay, and Fe contents. In the natural system, the Pox was positively correlated with SOC, clay, and Feox while negative relations were observed between Pox and Feox with sand content suggesting a direct effect of soil organic matter and texture on Pox contents. In the cultivated system, Pox is more affected by Feox than the SOC. Principal component (Figure 3) and texture triangle (Figure 4) analyses showed the contrasting properties of cultivated and natural soils. Natural system soils with a coarse texture were marked by low Pox and Feox content compared to the cultivated soils. Cultivated soils with a clayey loam texture had high Pox and lower SOC compared to natural soils, probably due to the soil management techniques applied.
The mineral properties of soil are strongly related to their NIR-spectra absorption patterns [45]. Mouazen et al. [46] confirmed that soil texture affected the reflectance of the soil surface during NIR spectral measurement. Light scattering increased with increasing sand content due to a large amount of quartz in the sand fraction, which increases the intensity of spectral reflectance [47]. The spectral absorption related to some soil components (O-H and metal O-H, O-H in water) increased with increasing clay content [48].
Soil preparation, specifically tillage, could break up soil particles and aggregates and thereby accelerate the mineralization of soil organic matter, resulting in lower SOC compared to that of natural systems [49,50]. The level of Pox in the cultivated systems is due to fertilizer input and high mineralization rates, which released the soil nutrients (including phosphorus).

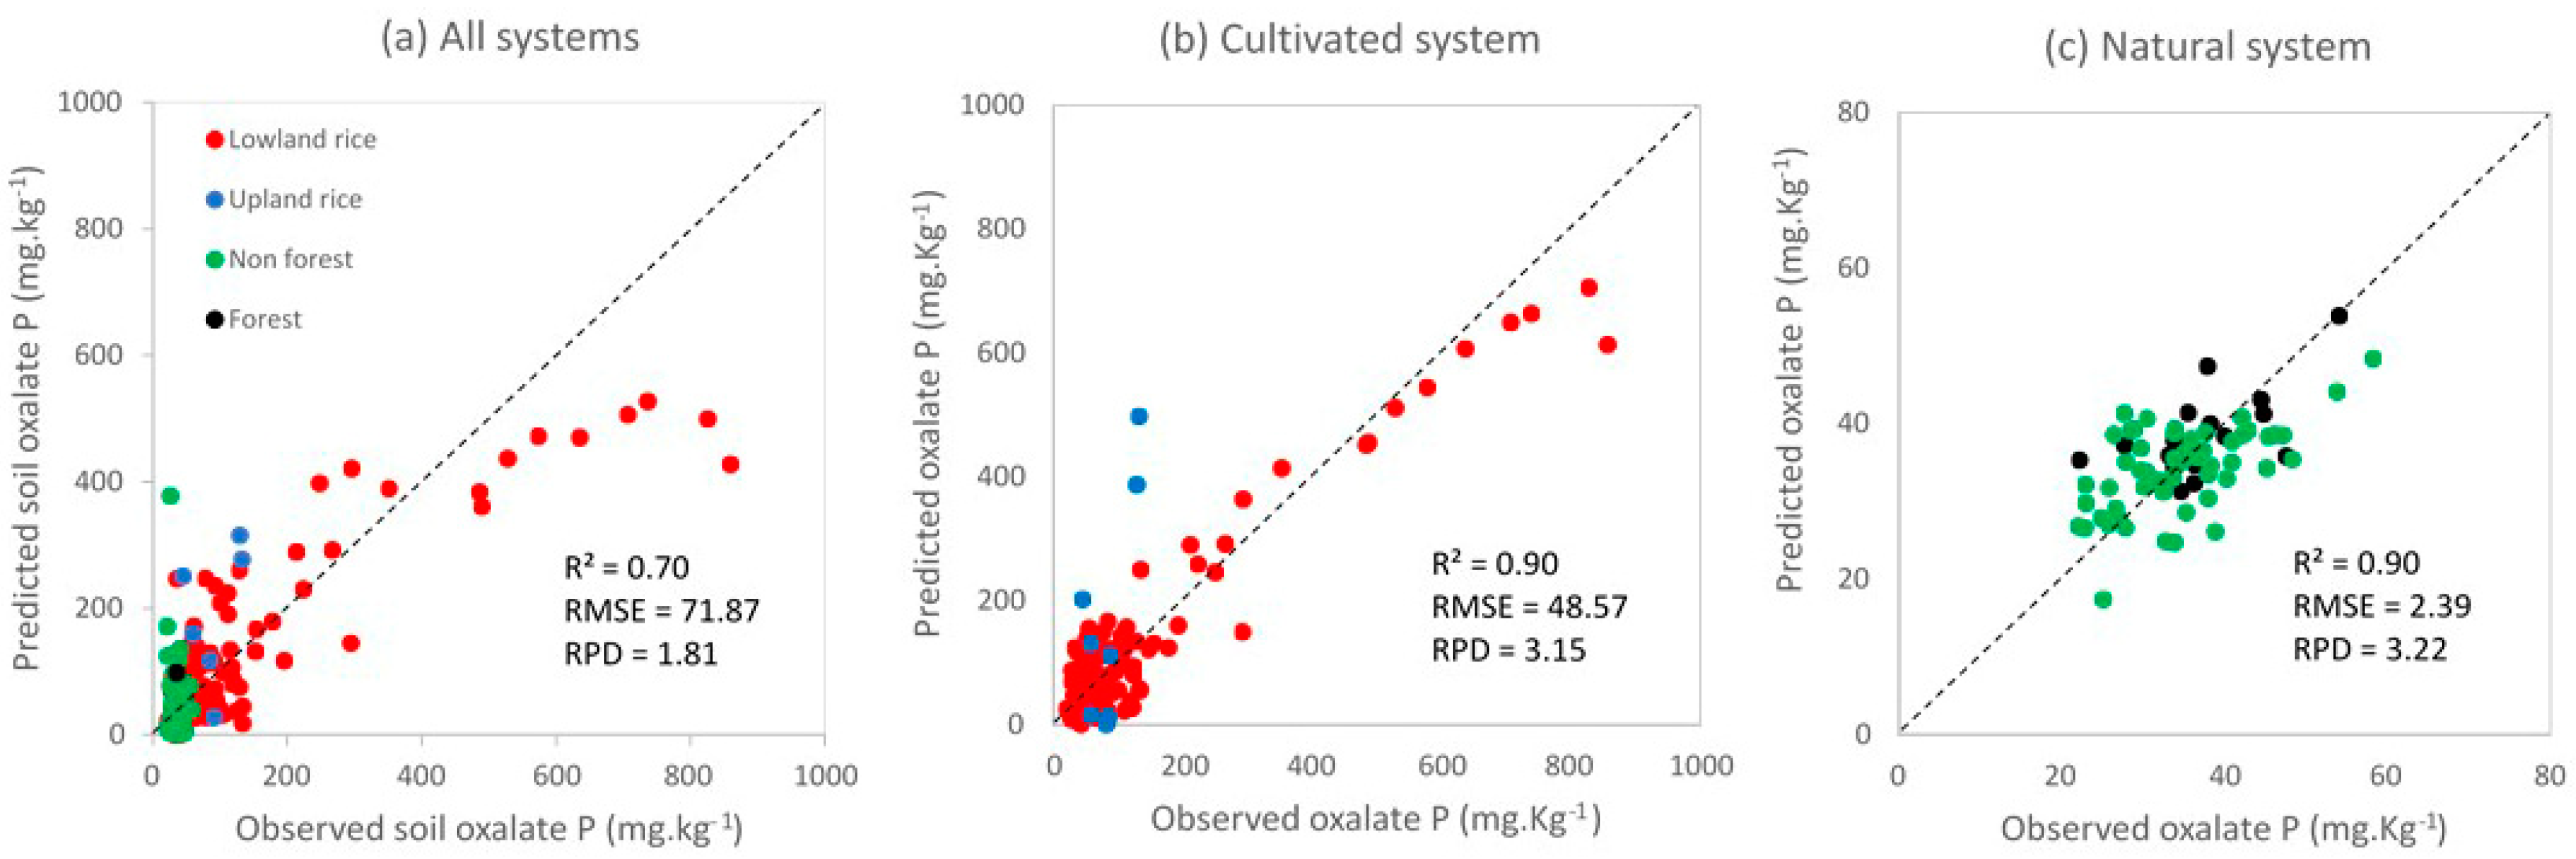
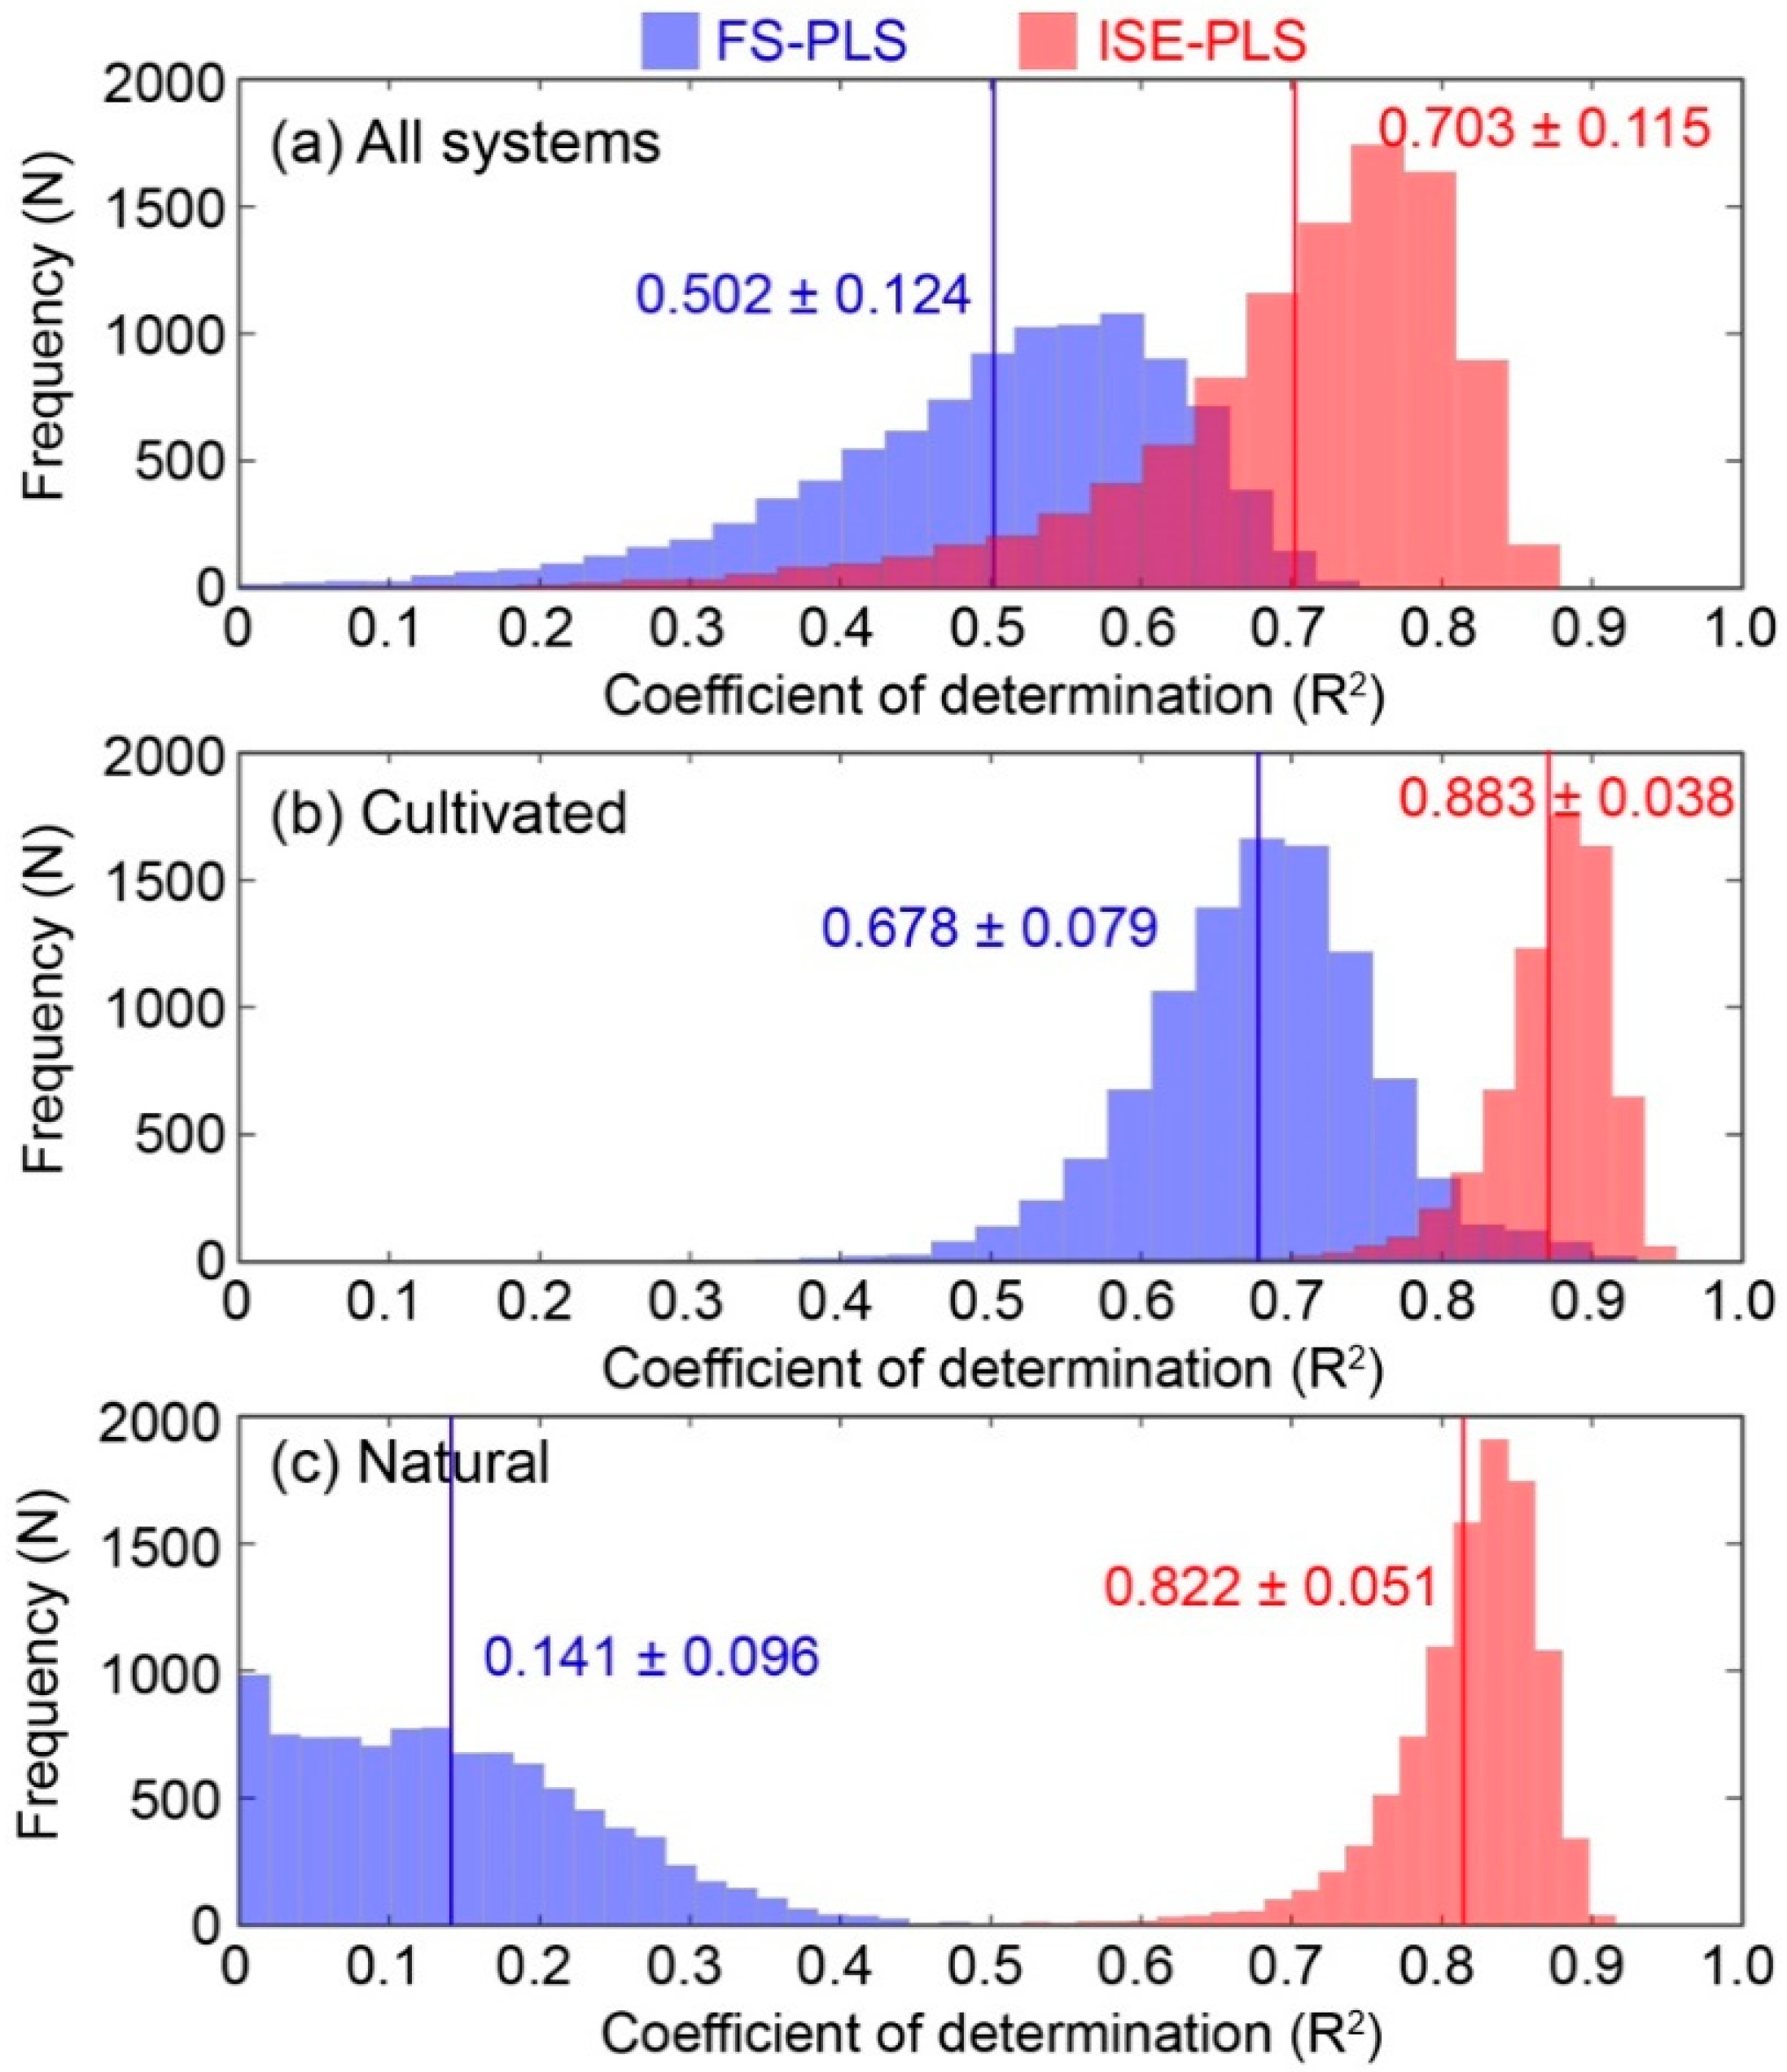
3.2. Model Prediction Accuracy for Oxalate-Extractable P under Different Land-Use Systems

Predictions of Pox content were made using standard FS-PLS and ISE–PLS regressions for all combined systems and for each system individually. The PLS regression model predictions of Pox levels are shown in Table 5 and Figure 5. ISE–PLS regression always improved Pox prediction compared to FS-PLS regardless of the land-use system.
ISE–PLS regression performed well; we attributed this to the importance of waveband selection for Pox prediction. The percentage of wavebands (NW%) used in the model was the ratio of the number of selected wavebands (NW) to the total wavebands for a full-spectrum (NW% = NW / 2001 bands × 100). The NW% results were 20.6% and 7.5% for cultivated and natural systems, respectively. In other words, fewer than 21% of available wavelengths contributed to the prediction of Pox for the cultivated system, with over 79% neither contributing to nor disturbing the predictions [51]. Selecting wavebands related to soil Pox and eliminating unusable wavebands improved the predictive ability of ISE–PLS for Pox compared to FS-PLS. This finding was in agreement with previous studies, in which fewer than 20% of wavelengths contained information relevant to the prediction of soil properties [25,36]. ISE–PLS produced excellent predictions of Pox in natural and cultivated systems, with RPD values greater than three and an R² of 0.90 (Table 5). Although the performance of model prediction is better for the cultivated system than the natural system, this prediction model accuracy seems to be associated with the large distribution of Pox values, which were characterized here by some samples with high Pox value. A high variation of the data set could affect the accuracy of NIRS calibration and predictive performance [52]. The performance of ISE–PLS models was better for individual land-use systems than for the combined data (R² = 0.70, RMSE = 71.9, RPD = 1.81). Stevens et al. [48] highlighted the importance of building local, more accurate models that are specific to a given geographical entity or soil type, suggesting that this feature is a strength, rather than a weakness, of this model.
The results of a modified bootstrap procedure were reported in Table 6 and Figure 6. Table 6 gives the mean values of R2 and RMSEP between FS-PLS and ISE–PLS models for each system in the test data set (30%). Figure 6 illustrated the distribution of R2 values in the test data set for each system. The accuracy of the model prediction with validation data showed that the ISE–PLS models predicted soil oxalate-extractable P more accurately than FS-PLS in terms of R2 and RMSEP for all systems. The ISE–PLS resolved 70% to 88% of the variation in Pox whereas total variance explained with FS-PLS was from 14% to 50%. The best mean R2 and the lowest RMSEP values were obtained from the natural system. The predictive ability and reliability of the ISE–PLS models were confirmed by this modified bootstrap procedure.

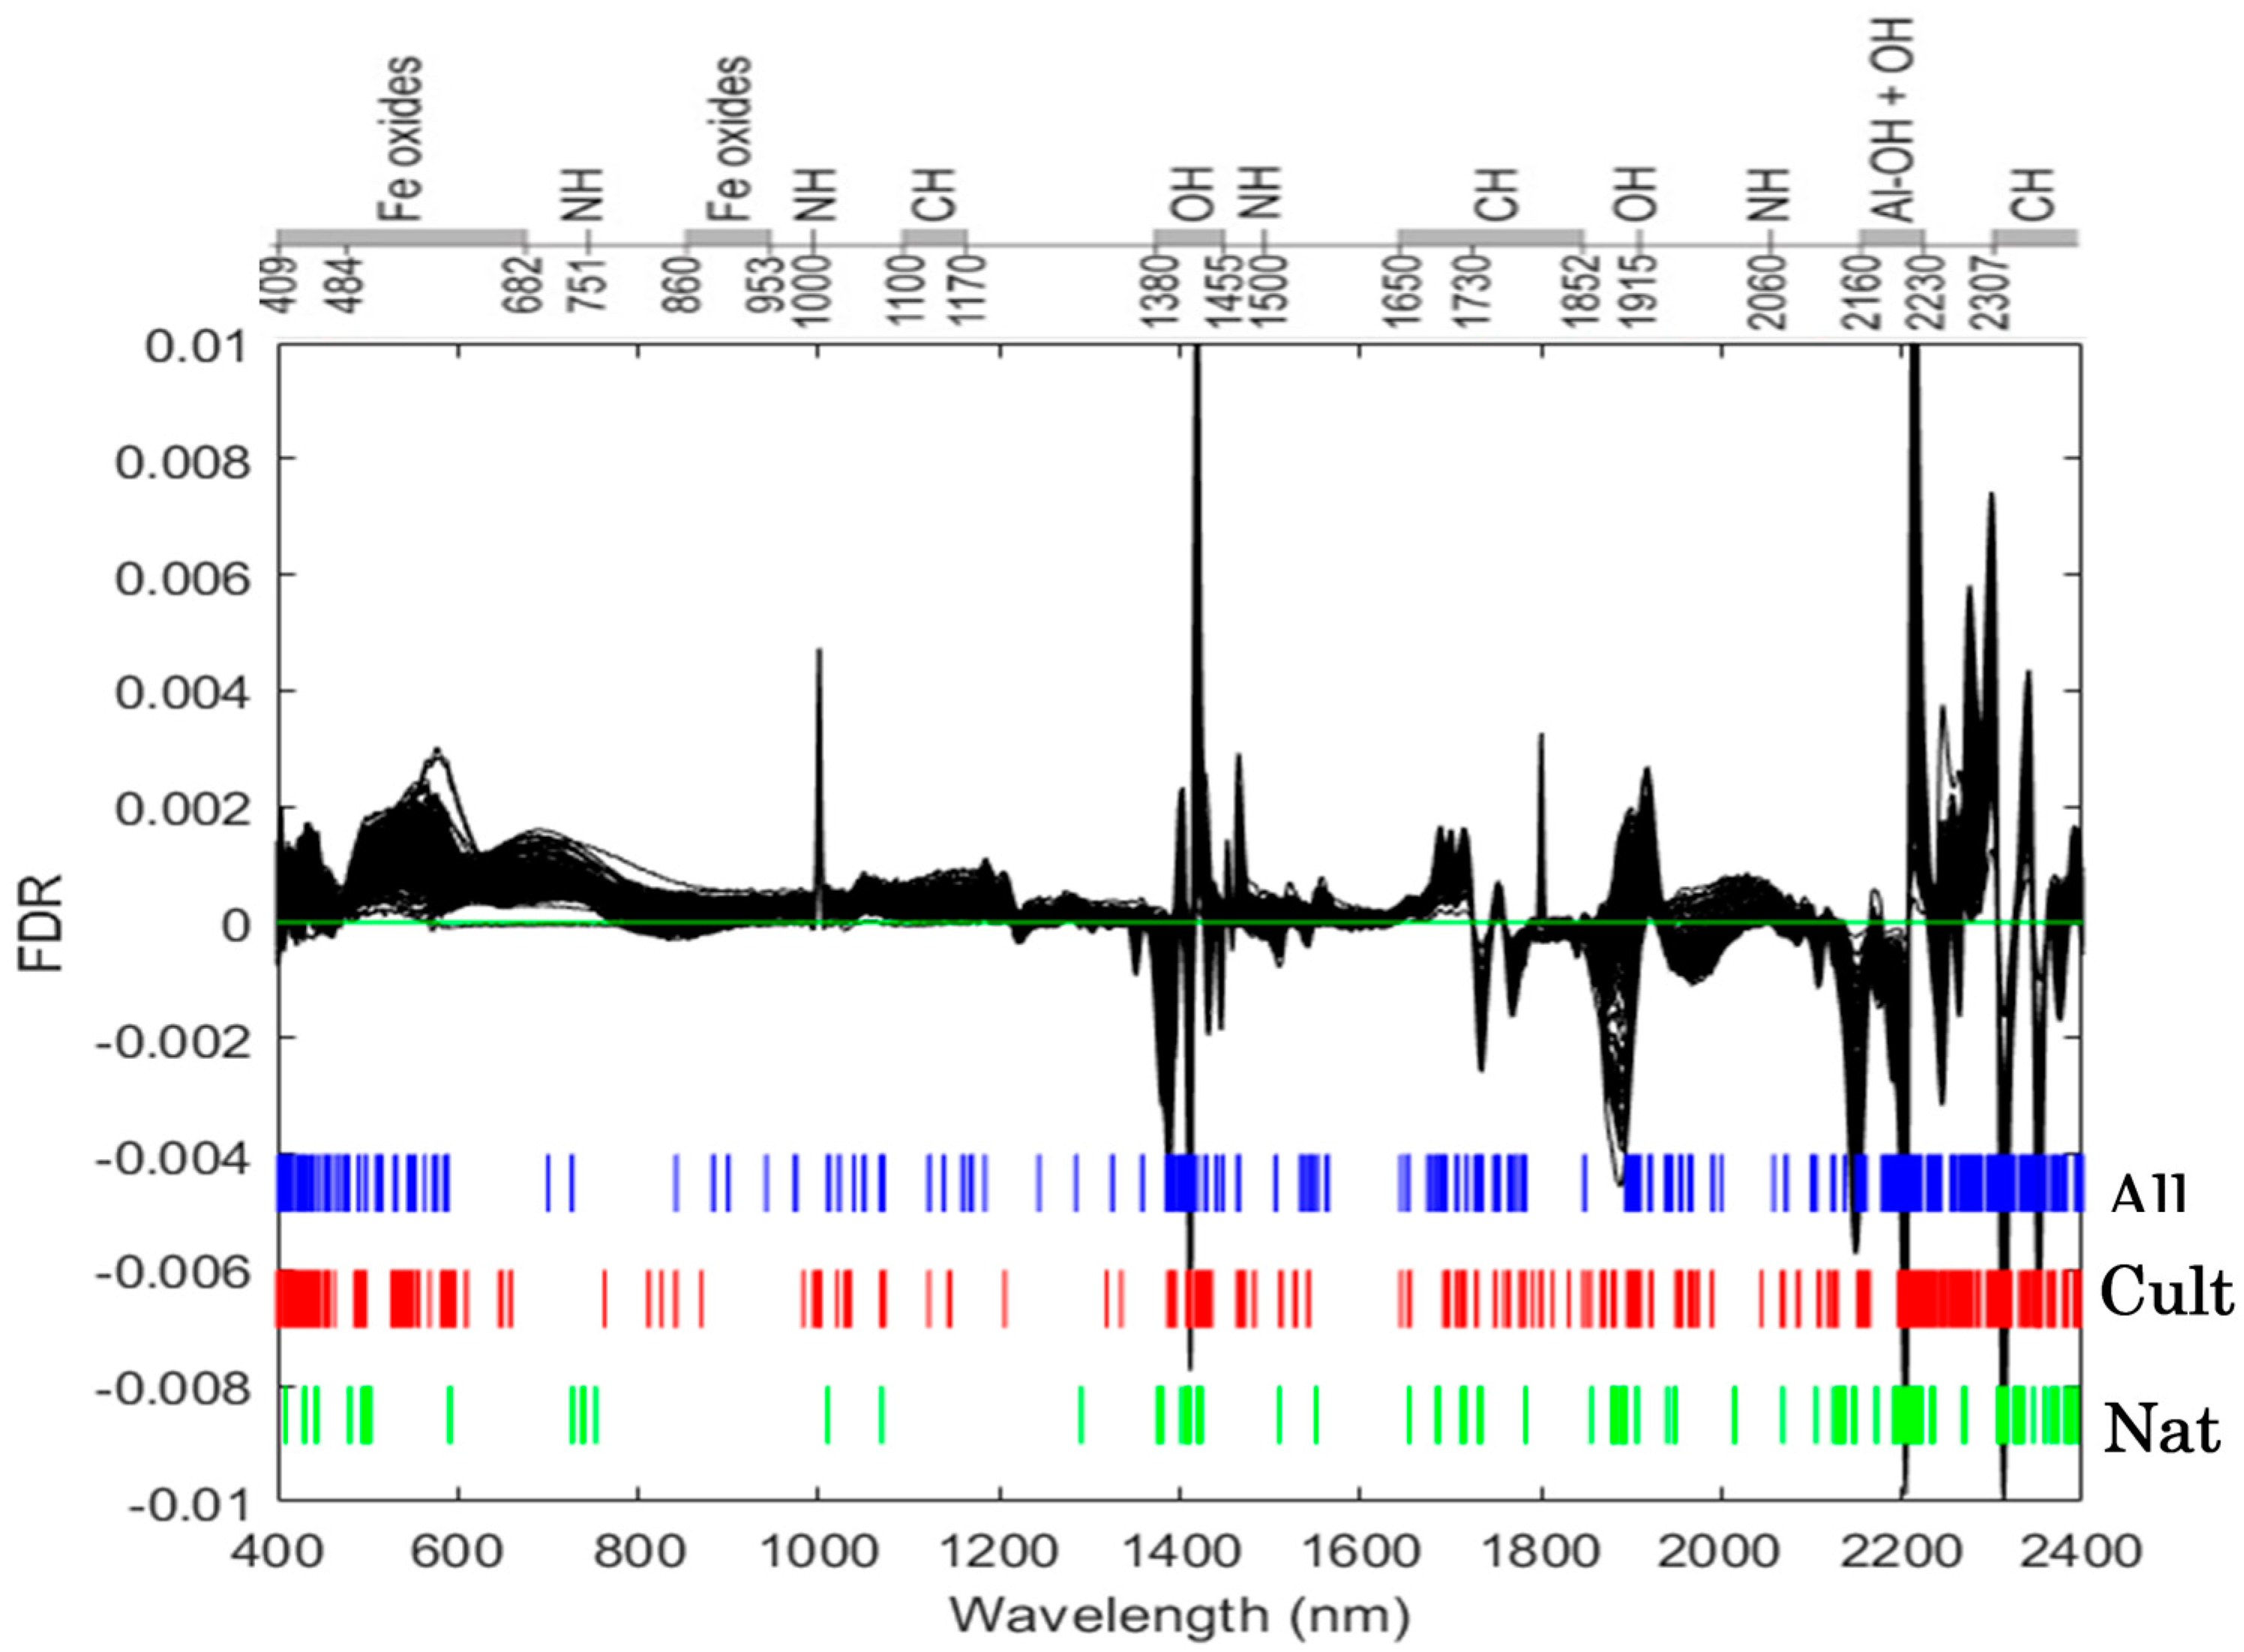
3.3. Properties of the Prediction-Relevant Wavebands

Figure 7 shows the selected wavebands used for the PLS regression modeling and prediction of Pox resulting from the preprocessing of the spectra using first derivative data. All samples showed similar spectral absorption features, characteristic of mineral and organic spectra as reported by several authors [15,53]. The most influential wavelengths in terms of the Pox prediction model were recorded in the visible light range (around 500 nm) and in the NIR range (at 1400 nm and from 2000 nm). The spectral absorption peaks in the Vis-NIRS region are related to iron oxides, clay minerals, and some functional groups of soil organic matter (SOM) [37]. In our study, the selected wavebands in the visible region common to both natural and cultivated systems (409, 430, 431, 443, 444, 591, and 592 nm) were associated with Fe-containing minerals (hematite, goethite) and dark-colored organic matter [54,55]. Residual minerals like hematite and goethite have an effect on the organic matter sorption of soil nutrients such as phosphorus [56].
The bands in the NIR range usually attributed to O-H chemical bonds at 1400 nm, to C-H stretch at 1700 nm, to water (H-O-H) at 1900 nm, and metal-OH bending and O-H stretching modes near 2000 nm, 2300 nm, and 2400 nm are often associated with clay mineral types (Table 7) [15,53,57]. The spectral bands at 1906–1907 nm, 2200–2235 nm, and 306–2400 nm, related to minerals and water [15,58], and that at 2270 nm, corresponding to gibbsite (an Al oxide mineral) [56,59], contribute to Pox prediction. The detection of the mineral and organic compounds in soils allow soil spectroscopy to predict Pox because of the potential relation between phosphorus and carbon content [22].
The number of selected wavelengths for Pox prediction is higher for cultivated systems than natural systems (Figure 7). The specific selected visible wavelengths for cultivated areas were 527–590 nm, associated with hematite and organic matter; and 763–870 nm, related to amine N-H, aromatic C-H, Fe3+, and ferric oxide [58,59,60]. The regions related to amine N-H at 1000 nm; aromatic C-H at 1100 nm; alkyl C-H at 1170 nm; O-H in water, CH2, lignin, and cellulose at 1464–1483 nm [61]; and Al- OH and kaolin at 2160–2164 nm [62] contributed to Pox prediction in the NIR regions. In contrast, the specific selected wavelengths for natural systems were 738–740 nm and 753 nm (amine N-H); and 1291 nm, related to lignin, starch, and protein [59,60,61]. These specific bands for each system demonstrated the variation in SOM and absorbents contributing to Pox prediction, which may explain the low accuracy of prediction when all data were combined.

3.4. Factors Influencing the Prediction Model Accuracy for Oxalate-Extractable P

According to our results, the main soil components which contributed to the prediction of Pox were organic matter and iron oxides, in both natural and cultivated systems. This is consistent with the study of Sørensen and Dalsgaard, which suggested that indirect relationships between soil P and organic components would be useful in soil P prediction using spectrographic methods [63], and that of Ludwig et al., in which a useful calibration of soil P, measured using the Olsen method, was found to positively correlate with SOC [22]. The present study showed that Pox is significantly correlated with SOC in natural and cultivated systems with coefficients of correlation (r) of 0.61 (P < 0.001) and 0.30 (P < 0.001), respectively, but not when all data are combined (r = 0.10, P = 0.15). Abdi et al. confirmed that successful prediction of soil total P is related to its significant correlation with soil carbon [42]. Soil P is obtainable by NIRS through covariation with other soil properties but this relation may vary between datasets [16], possibly explaining the lack of correlation between soil carbon and Pox for all combined data. The high correlation between Pox and SOC in natural systems may have resulted from the accumulation of P in the surface layer through litter input, while in the cultivated system P is lost with the harvested crops.
Phosphorus in soil was mainly fixed and in solid phase with Fe, Al in acidic soil, and Ca in alkaline soil. These elements are the main adsorbing agents for phosphate [64]. Khalid et al. [65] found that higher P availability under flooded soil was related to ammonium oxalate Fe. In our study, Pox and oxalate Fe (Feox) were significantly and positively correlated for cultivated, natural and all combined systems with correlation coefficients of 0.51 (P < 0.001), 0.45 (P < 0.001), and 0.55 (P < 0.001), respectively. In addition to the selected wavebands for Pox prediction in the Vis-NIRS regions associated with iron oxides, this result is in agreement with previous studies confirming the primary role of Fe in P sorption [7,25]. This highlights the importance of Fe to Pox prediction model development.
The high correlation between Pox, SOC, and Feox observed mainly under the natural system can be associated with the related properties of this system such as fallow without fertilization, justifying here the high accuracy of the model. As the high performance of model prediction in the cultivated system could be related to some samples with high Pox content (n = 15), a low prediction accuracy was obtained with selected samples excluding these high Pox samples (data not shown) suggesting that in the cultivated system under varying fertilization and other management practices may interfere and disturb the correlation of Pox with organic matter and iron oxides. The correlations of Pox with SOC and Feox are very weak for the selected samples (without the high Pox samples), r = 0.22, P < 0.05 and r = 0.03, P = 0.69, respectively. Application of ISE–PLS model in a large sample with a large geographical cover can help to understand the main drivers of Pox in the cultivated and the natural system in order to build more robust models.
In this study, the “pseudo-independent” approach of using a randomly selected sample (30%) for a validation in the modified bootstrap procedure or LOOCV, which provide more accurate PLS models in Pox prediction, presents a limitation. A previous study on SOC prediction using the first derivative Vis-NIRS PLS approach reports a stable model accuracy from a “pseudo-independent” validation (random selection of non-independent test samples), but the prediction models failed when applied for each site through site-hold validation (using samples from one site for validation and the samples from the remaining sites for model calibration) [66]. We attempted to perform the FS-PLS based on the site-hold cross-validation by considering the seven studied sites and found very poor results (data not shown). This may be due to the mixture of sites and land-use systems using a small number of samples. This suggests building models using a large geographical cover and relatively dispersed sample sets for a regional application.

4. Conclusions

Soil P is an important limiting nutrient for plant growth. An accurate assessment of available P is essential for effective fertilizer management in agriculture and sustainable management of ecosystems. Vis-NIRS is a simple and nondestructive method that can be used to predict several soil properties. This study demonstrates that Vis-NIRS models, in combination with ISE–PLS regression, can successfully predict soil oxalate-extractable phosphorus (Pox) in soil samples from natural and cultivated systems in Madagascar. Together, these methods were able to estimate soil Pox in both systems with high accuracy (R² = 0.90, RPD > 3) using fewer than 21% of wavelengths in the Vis-NIRS region. ISE–PLS regression outperformed FS-PLS regression. However, model accuracy for cultivated systems was affected by some samples with high Pox value. The effective wavebands for the two land-use systems were associated with Fe and Al oxides, and organic components. The accuracy of Pox prediction was related to its significant correlation with soil organic carbon and iron content. The use of “pseudo-independent” validation in the current study can also overestimate the prediction accuracy when applied at site scale suggesting the use of larger and dispersed geographical cover sample sets to build a robust model in the future. The Vis-NIRS approach has potential as a tool for rapid soil P evaluation and may be useful for soil management. Further investigations using large numbers of soil samples for external validation of the Vis-NIRS approach are required to enable application at regional and national scales.

Author Contributions

Conceptualization, K.K, Y.T., H.R. (Hobimiarantsoa Rakotonindrina), and A.A.; methodology, H.R. (Hobimiarantsoa Rakotonindrina), K.K., and A.A.; software, K.K.; validation, A.A., K.K. and Y.T.; formal analysis, A.A.; investigation, H.R. (Hobimiarantsoa Rakotonindrina) and B.H.A.; resources, A.A., K.K., and H.R. (Herintsitohaina Razakamanarivo); data curation, H.R. (Hobimiarantsoa Rakotonindrina); writing—original draft preparation, H.R. (Hobimiarantsoa Rakotonindrina) and A.A.; writing—review and editing, K.K., Y.T., T.N., H.R. (Herintsitohaina Razakamanarivo), and A.A.; visualization, K.K.; supervision, A.A. and H.R. (Herintsitohaina Razakamanarivo); project administration, Y.T.; funding acquisition, Y.T. All authors have read and agreed to the published version of the manuscript.

Funding

This research was supported by the Science and Technology Research Partnership for Sustainable Development (SATREPS), Japan Science and Technology Agency (JST)/Japan International Cooperation Agency (JICA) (Grant No. JPMJSA1608).

Acknowledgments

This work is financed by FY VARY Project. We acknowledge the project team and all staff of Laboratoire des Radioisotopes (LRI) including DFID-ESPA p4GES program for help with fieldwork and lab analyses.

Conflicts of Interest

The authors declare no conflict of interest.

References

  1. Andriamananjara, A.; Rakotoson, T.; Razafimbelo, T.; Rabeharisoa, L.; Razafimanantsoa, M.P.; Masse, D. Farmyard manure improves phosphorus use efficiency in weathered P deficient soil. Nutr. Cycl. Agroecosyst. 2019, 115, 407–427. [Google Scholar] [CrossRef]
  2. Turner, B.L.; Engelbrecht, B. Soil organic phosphorus in lowland tropical rain forests. Biogeochemistry 2011, 103, 297–315. [Google Scholar] [CrossRef]
  3. Liu, X.; Meng, W.; Liang, G.; Li, K.; Xu, W.; Huang, L.; Yan, J. Available phosphorus in forest soil increases with soil nitrogen but not total phosphorus: Evidence from subtropical forests and a pot experiment. PLoS ONE 2014, 9, e88070. [Google Scholar] [CrossRef]
  4. Rabeharisoa, L.; Razanakoto, O.R.; Razafimanantsoa, M.P.; Rakotoson, T.; Amery, F.; Smolders, E. Larger bioavailability of soil phosphorus for irrigated rice compared with rainfed rice in Madagascar: Results from a soil and plant survey. Soil Use Manag. 2012, 28, 448–456. [Google Scholar] [CrossRef]
  5. Bollyn, J.; Castelein, L.; Smolder, E. Fate and bioavailability of phosphorus loaded to iron oxyhydroxide nanoparticles added to weathered soils. Plant Soil 2019, 438, 297. [Google Scholar] [CrossRef]
  6. Nawara, S.; Van Dael, T.; Merckx, R.; Amery, F.; Elsen, A.; Odeurs, W.; Vandendriessche, H.; Mcgrath, S.; Roisin, C.; Jouany, C.; et al. A comparison of soil tests for available phosphorus in long-term field experiments in Europe. Eur. J. Soil Sci. 2017, 68, 873–885. [Google Scholar] [CrossRef]
  7. Nishigaki, T.; Tsujimoto, Y.; Rinasoa, S.; Rakotoson, T.; Andriamananjara, A.; Razafimbelo, T. Phosphorus uptake of rice plants is affected by phosphorus forms and physicochemical properties of tropical weathered soils. Plant Soil 2019, 435, 27–38. [Google Scholar] [CrossRef] [Green Version]
  8. Guo, F.; Yost, R.S. Quantifying the available soil phosphorus pool with the acid ammonium oxalate method. Soil Sci. Soc. Am. J. 1999, 63, 651–656. [Google Scholar] [CrossRef]
  9. Shahandeh, H.; Hossner, L.R.; Turner, F.T. Phosphorus Relationships in Flooded Rice Soils with Low Extractable Phosphorus. Soil Sci. Soc. Am. J. 1994, 58, 1184–1189. [Google Scholar] [CrossRef]
  10. Schwertmann, U. The differentiation of iron oxides in soils by extraction with ammonium oxalate solution. Z. Pflanz. Bodenkd. 1964, 105, 194–202. [Google Scholar] [CrossRef]
  11. Schwertmann, U. Use of oxalate for Fe extraction from soils. Can. J. Soil Sci. 1973, 53, 244–246. [Google Scholar] [CrossRef]
  12. Narteh, L.T.; Sahrawat, K.L. Oxalate and EDTA extractable soil phosphorus and iron in relation to P availability in lowland rice soils of West Africa. Ghana J. Agric. Sci. 1999, 32, 189–198. [Google Scholar] [CrossRef]
  13. Six, L.; Smolders, E.; Merckx, R. The performance of DGT versus conventional soil phosphorus tests in tropical soils—Maize and rice responses to P application. Plant Soil 2013, 366, 49–66. [Google Scholar] [CrossRef]
  14. Neyroud, J.A.; Lischer, P. Do different methods used to estimate soil phosphorus availability across Europe give comparable results? J. Soil Sci. Plant Nutr. 2003, 166, 422–431. [Google Scholar] [CrossRef]
  15. Viscarra Rossel, R.V.; Walvoort, D.J.J.; McBratney, A.B.; Janik, L.J.; Skjemstad, J.O. Visible, near infrared, mid infrared or combined diffuse reflectance spectroscopy for simultaneous assessment of various soil properties. Geoderma 2006, 131, 59–75. [Google Scholar] [CrossRef]
  16. Stenberg, B.; Viscarra Rossel, R.A.; Mouazen, A.M.; Wetterlind, J. Visible and near infrared spectroscopy in soil science. Adv. Agron. 2010, 107, 163–215. [Google Scholar]
  17. Nawar, S.; Buddenbaum, H.; Hill, J.; Kozak, J.; Mouazen, A.M. Estimating the soil clay content and organic matter by means of different calibration methods of vis-NIR diffuse reflectance spectroscopy. Soil Tillage Res. 2016, 155, 510–522. [Google Scholar] [CrossRef] [Green Version]
  18. Recena, R.; Fernández-Cabanás, V.M.; Delgado, A. Soil fertility assessment by Vis-NIR spectroscopy: Predicting soil functioning rather than availability indices. Geoderma 2019, 337, 368–374. [Google Scholar] [CrossRef]
  19. McCarty, G.W.; Reeves, J.B., III. Comparison of near infrared and mid infrared diffuse reflectance spectroscopy for field-scale measurement of soil fertility parameters. Soil Sci. 2006, 171, 94–102. [Google Scholar] [CrossRef] [Green Version]
  20. Bellon-Maurel, V.; McBratney, A. Near-infrared (NIR) and mid-infrared (MIR) spectroscopic techniques for assessing the amount of carbon stock in soils—Critical review and research perspectives. Soil Biol. Biochem. 2011, 43, 1398–1410. [Google Scholar] [CrossRef]
  21. Chang, C.-W.; Laird, D.A.; Mausbach, M.J.; Hurburgh, C.R. Near- infrared reflectance spectroscopy—Principal components regression analyses of soil properties. Soil Sci. Soc. Am. J. 2001, 65, 480–490. [Google Scholar] [CrossRef] [Green Version]
  22. Ludwig, B.; Khanna, P.K.; Bauhus, J.; Hopmans, P. Near infrared spectroscopy of forest soils to determine chemical and biological properties related to soil sustainability. For. Ecol. Manag. 2002, 171, 121–132. [Google Scholar] [CrossRef]
  23. Zornoza, R.; Guerrero, C.; Mataix-Solera, J.; Scow, K.M.; Arcenegui, V.; Mataix-Beneyto, J. Near infrared spectroscopy for determination of various physical, chemical and biochemical properties in Mediterranean soils. Soil Biol. Biochem. 2008, 40, 1923–1930. [Google Scholar] [CrossRef] [Green Version]
  24. Kruse, J.; Abraham, M.; Amelung, W.; Baum, C.; Bol, R.; Kühn, O.; Lewandowski, H.; Niederberger, J.; Oelmann, Y.; Rüger, C.; et al. Innovative methods in soil phosphorus research: A review. J. Plant Nutr. Soil Sci. 2015, 178, 43–88. [Google Scholar] [CrossRef] [PubMed] [Green Version]
  25. Kawamura, K.; Tsujimoto, Y.; Nishigaki, T.; Andriamanajara, A.; Rabenarivo, M.; Asai, H.; Rakotoson, T.; Razafimbelo, T. Laboratory visible and near-infrared spectroscopy with genetic algorithm-based partial least squares regression for assessing the soil phosphorus content of upland and lowland rice fields in Madagascar. Remote Sens. 2019, 11, 506. [Google Scholar] [CrossRef] [Green Version]
  26. Badjeck, B.; Ibrahima, N.C.; Slaviero, F. Evaluation de la Sécurité Alimentaire à Madagascar; FAO: Rome, Italy, 2013. [Google Scholar]
  27. Penot, E.; Domas, R.; Paulin, H.; Durand, C. Rôle et Place du Riz Pluvial Dans les Exploitations Agricoles à Madagascar. Le Cas du Lac Alaotra et du Vakinankaratral; Conference paper; Académie d’Agriculture: Antananarivo, Madagascar, 2011. [Google Scholar]
  28. Lal, R. Soil carbon sequestration to mitigate climate change. Geoderma 2004, 123, 1–22. [Google Scholar] [CrossRef]
  29. Andriamaniraka, H. Le Phosphore et la Fertilisation Phosphatée Dans les Sols Ferrallitiques à Madagascar: Amélioration de la fertilité des sols. In Mémoire D’habilitation à Diriger des Recherches; Université d’Antananarivo: Antananarivo, Madagascar, 2016. [Google Scholar]
  30. Nishigaki, T.; Ikazaki, K.; Tsujimoto, Y.; Andriamananjara, A.; Rakotoson, T.; Razafimbelo, T. Soil survey of the east coast and the central highlands indicates need to update Madagascar soil map. Soil Sci. Plant Nutr. 2020. Accepted. [Google Scholar] [CrossRef]
  31. Cornet, A. Essai de Cartographie Bioclimatique à Madagascar; Notice Explicative No. 55; ORSTOM: Paris, France, 1974. [Google Scholar]
  32. Schatz, G.E. Endemism in the Malagasy tree flora. In Diversity and Endemism in Madagascar; Lourenço, W.R., Goodman, S.M., Eds.; Mémoires de la Société de Biogéographie: Paris, France, 2000; pp. 1–9. [Google Scholar]
  33. Andriamananjara, A.; Hewson, J.; Razakamanarivo, H.; Andrisoa, R.H.; Ranaivoson, N.; Ramboatiana, N.; Razafindrakoto, M.; Ramifehiarivo, N.; Razafimanantsoa, M.P.; Rabeharisoa, L.; et al. Land cover impacts on aboveground and soil carbon stocks in Malagasy rainforest. Agric. Ecosyst. Environ. 2016, 233, 1–15. [Google Scholar] [CrossRef]
  34. Andriamananjara, A.; Ranaivoson, N.; Razafimbelo, T.; Hewson, J.; Ramifehiarivo, N.; Rasolohery, A.; Andrisoa, R.H.; Razafindrakoto, M.A.; Razafimanantsoa, M.-P.; Rabetokotany, N.; et al. Towards a better understanding of soil organic carbon variation in Madagascar. Eur. J. Soil Sci. 2017, 68, 6. [Google Scholar] [CrossRef]
  35. Walkley, A.; Black, I.A. An examination of the Degtjareff method for determining soil organic matter, and a proposed modification of the chromic acid titration method. Soil Sci. 1934, 37, 29–38. [Google Scholar] [CrossRef]
  36. Kawamura, K.; Tsujimoto, Y.; Rabenarivo, M.; Asai, H.; Andriamananjara, A.; Rakotoson, T. Vis-NIR spectroscopy and PLS regression with waveband selection for estimating the total C and N of paddy soils in Madagascar. Remote Sens. 2017, 9, 1081. [Google Scholar] [CrossRef] [Green Version]
  37. Pätzold, S.; Leenen, M.; Frizen, P.; Heggemann, T.; Wagner, P.; Rodionov, A. Predicting plant available phosphorus using infrared spectroscopy with consideration for future mobile sensing applications in precision farming. Prec. Agric. 2019, 1–25. [Google Scholar] [CrossRef] [Green Version]
  38. Xu, D.; Ma, W.; Chen, S.; Jiang, Q.; He, K.; Shi, Z. Assessment of important soil properties related to Chinese Soil Taxonomy based on vis–NIR reflectance spectroscopy. Comput. Electron. Agric. 2018, 144, 1–8. [Google Scholar] [CrossRef]
  39. Savitzky, A.; Golay, E.J.M. Smoothing and difference of data by simplified least squares procedures. Anal. Chem. 1964, 36, 1627–1639. [Google Scholar] [CrossRef]
  40. Summers, D.; Lewis, M.; Ostendorf, B.; Chittleborough, D. Visible near-infrared reflectance spectroscopy as a predictive indicator of soil properties. Ecol. Indic. 2011, 11, 123–131. [Google Scholar] [CrossRef]
  41. Viscarra Rossel, R.A.; Fouad, Y.; Walter, C. Using a digital camera to measure soil organic carbon and iron contents. Biosyst. Eng. 2008, 100, 149–159. [Google Scholar] [CrossRef]
  42. Abdi, D.; Tremblay, G.F.; Ziadi, N.; Bélanger, G.; Parent, L.É. Predicting soil phosphorus-related properties using reflectance spectroscopy. Soil Sci. Soc. Am. J. 2012, 76, 2318–2326. [Google Scholar] [CrossRef]
  43. R Core Team. R: A Language and Environment for Statistical Computing; R Foundation for Statistical Computing: Vienna, Austria, 2015. [Google Scholar]
  44. Dardenne, P.; Sinnaeve, G.; Baeten, V. Multivariate calibration and chemometrics for near infrared spectroscopy: Which method? J. Near Infrared Spectrosc. 2000, 8, 229–237. [Google Scholar] [CrossRef]
  45. Mohamed, E.S.; Saleh, A.M.; Belal, A.B.; Abd-Allah, G. Application of near-infrared reflectance for quantitative assessment of soil properties. Egypt. J. Remote Sens. Space Sci. 2018, 21, 1–14. [Google Scholar] [CrossRef]
  46. Mouazen, A.M.; Karoui, R.; De Baerdemaeker, J.; Ramon, H. Classification of soil texture classes by using soil visual near infrared spectroscopy and factorial discriminant analysis techniques. J. Near Infrared Spectrosc. 2005, 13, 231–240. [Google Scholar] [CrossRef]
  47. Conforti, M.; Matteucci, G.; Buttafuoco, G. Using laboratory Vis-NIR spectroscopy for monitoring some forest soil properties. J. Soils Sediments 2018, 18, 1009–1019. [Google Scholar] [CrossRef]
  48. Stevens, A.; Nocita, M.; Toth, G.; Montanarella, L.; van Wesemael, B. Prediction of soil organic carbon at the European scale by visible and near infrared reflectance spectroscopy. PLoS ONE 2013, 8, e66409. [Google Scholar] [CrossRef] [PubMed]
  49. Segda, Z.; Bonzi, M.; Gnankambary, Z.; Lompo, F.; Sedogo, M.P. Influence of soil fertility management on organic carbon mineralization in irrigated rice. J. Agric. Crop Res. 2014, 2, 32–43. [Google Scholar]
  50. Balesdent, J.; Chenu, C.; Balabane, M. Relationship of soil organic matter dynamics to physical protection and tillage. Soil Tillage Res. 2000, 53, 215–230. [Google Scholar] [CrossRef]
  51. Wang, Z.; Kawamura, K.; Sakuno, Y.; Fan, X.; Gong, Z.; Lim, J. Retrieval of chlorophyll-a and total suspended solids using iterative stepwise elimination partial least squares (ISE-PLS) regression based on field hyperspectral measurements in irrigation ponds in Higashi hiroshima, Japan. Remote Sens. 2017, 9, 264. [Google Scholar] [CrossRef] [Green Version]
  52. Nduwamungu, C.; Ziadi, N.; Tremblay, G.F.; Parent, L.-É. Near- infrared reflectance spectroscopy prediction of soil properties: Effects of sample cups and preparation. Soil Sci. Soc. Am. J. 2009, 73, 1896–1903. [Google Scholar] [CrossRef]
  53. Liu, Y.; Boss, E.; Chase, A.P.; Xi, H.; Zhang, X.; Röttgers, R.; Pan, Y.; Bracher, A. Spectral particulate absorption coefficients and their standard deviation derived from underway AC-S measurements during POLARSTERN cruise PS99.2. PANGAEA 2019. [Google Scholar] [CrossRef]
  54. Sherman, D.M.; Waite, D.T. Electronic spectra of Fe3+ oxides and oxide hydroxides in the near IR to near UV. Am. Mineral. 1985, 70, 1262–1269. [Google Scholar]
  55. Mortimore, J.L.; Marshall, L.J.R.; Almond, M.J.; Hollins, P.; Matthews, W. Analysis of red and yellow ochre samples from Clearwell Caves and Catalhoyuk by vibrational spectroscopy and other techniques. Spectrochim. Acta A Mol. Biomol. Spectrosc. 2004, 60, 1179–1188. [Google Scholar] [CrossRef]
  56. Ramaroson, V.H.; Becquer, T.; Sá, S.O.; Razafimahatratra, H.; Delarivière, J.L.; Blavet, D.; Vendrame, P.R.S.; Rabeharisoa, L.; Rakotondrazafy, A.F.M. Mineralogical analysis of ferralitic soils in Madagascar using NIR spectroscopy. Catena 2018, 168, 102–109. [Google Scholar] [CrossRef]
  57. Blaschek, M.; Roudier, P.; Poggio, M.; Hedley, C.B. Prediction of soil available water-holding capacity from visible near-infrared reflectance spectra. Sci. Rep. 2019, 9, 12833. [Google Scholar] [CrossRef] [PubMed] [Green Version]
  58. Hunt, G.R. Spectral signatures of particulate minerals in visible and near-infrared. Trans. Am. Geophys. Union 1977, 58, 553. [Google Scholar] [CrossRef] [Green Version]
  59. Clark, R.N.; King, T.V.V.; Klejwa, M.; Swayze, G.A.; Vergo, N. High spectral resolution reflectance spectroscopy of minerals. J. Geophys. Res. 1990, 95, 12653–12680. [Google Scholar] [CrossRef] [Green Version]
  60. Clark, R.N. Spectroscopy of rocks and minerals and principles of spectroscopy. In Remote Sensing for the Earth Sciences: Manual of Remote Sensing; Rencz, A.N., Ed.; John Wiley & Sons: Chichester, UK, 1999; pp. 3–58. [Google Scholar]
  61. Ben-Dor, E.; Inbar, Y.; Chen, Y. The reflectance spectra of organic matter in the visible near-infrared and short wave infrared region (400–2500 nm) during a control decomposition process. Remote Sens. Environ. 1997, 61, 1–15. [Google Scholar] [CrossRef]
  62. Knadel, M.; Viscarra Rossel, R.A.; Deng, F.; Thomsen, A.; Greve, M.H. Visible–near infrared spectra as a proxy for topsoil texture and Glacial boundaries. Soil Sci. Soc. Am. J. 2013, 77, 568. [Google Scholar] [CrossRef]
  63. Sørensen, L.K.; Dalsgaard, S. Determination of clay and other soil properties by near infrared spectroscopy. Soil Sci. Soc. Am. J. 2005, 69, 159–167. [Google Scholar] [CrossRef]
  64. Jiang, X.; Bol, R.; Willbold, S.; Vereecken, H.; Klumpp, E. Speciation and distribution of P associated with Fe and Al oxides in aggregate-sized fraction of an arable soil. Biogeosciences 2015, 12, 6443–6452. [Google Scholar] [CrossRef] [Green Version]
  65. Khalid, R.A.; Patrick, W.H.; Delaune, R.D. Phosphorus sorption characteristics of flooded soils. Soil Sci. Soc. Am. Proc. 1977, 41, 305–310. [Google Scholar] [CrossRef]
  66. Brown, D.J.; Bricklemyer, R.S.; Miller, P.R. Validation requirements for diffuse reflectance soil characterization models with a case study of VNIR soil C prediction in Montana. Geoderma 2005, 129, 251–267. [Google Scholar] [CrossRef]
Figure 1. Spatial distribution of site for sampling. Cultivated system samples were from the Vakinankaratra region and natural system samples were from eastern Madagascar.
Agriculture 10 00177 g001
Figure 2. Distribution (left side) and kernel density plots (right side) for oxalate-extractable P content by the land-use system. RF: Upland rice field, IR: Lowland rice field.
Agriculture 10 00177 g002
Figure 3. Principal component analysis incorporating measured variables by soil system. Pox, oxalate-extractable P; Feox, oxalate Fe; SOC, soil organic carbon.
Agriculture 10 00177 g003
Figure 4. Soil texture triangle for different land-use systems based on the USDA classification.
Agriculture 10 00177 g004
Figure 5. Relationships between observed and predicted values of soil oxalate-extractable P contents using ISE–PLS (iterative stepwise elimination–partial least square) regression with first derivative reflectance data for (a) natural systems (n = 74), (b) cultivated systems (n = 142), and (c) all systems combined (n = 216). RMSE, root mean square error; RPD, residual predictive deviation.
Agriculture 10 00177 g005
Figure 6. Comparisons of the frequency distributions of R2 values in the test data for each system: (a) all systems; (b) cultivated; (c) natural using FS-PLS and ISE–PLS models, with mean (red and blue line) ± standard deviation (SD) values.
Agriculture 10 00177 g006
Figure 7. Wavebands used in the ISE–PLS analysis for all combined data (blue bars, All), cultivated systems (red bars, Cult), and natural systems (green bars, Nat) using the first derivative reflectance (FDR) dataset to estimate oxalate-extractable phosphorus. Specific absorption wavebands for the different bonds present in soil are specified on the top x-axis (modified from Kawamura et al. [25]).
Agriculture 10 00177 g007
Table 1. Spatial characterization of the soil sample used for the study.
RegionsSystemLand UsesAltitude (m)MAT (°C)MAP (mm)Sampling YearNumber of Samples
Central (Vakinankaratra)Cultivated systemsUpland rice1247–148116.913812017–20188
Lowland rice1237–14812017–2018134
EasternNatural systemsForest134–120018–2425002014–201516
Non-Forest94–11012014–201558
MAT, Mean annual temperature (°C), MAP, Mean annual precipitation (mm).
Table 2. Soil parameters description of the study sites. The values in parentheses show the range.
Soil ParametersCultivated System AreaNatural System Area
Sand (%)34.6 [10.4–72.5]53.6 [30.8–80.6 ]
Silt (%)32.8 [7.92–63.7]14.4 [4.72–23.6]
Clay (%)32.6 [4.30–52.0]32.0 [9.45–53.6]
SOC (mg kg−1)25.5 [9.47–94.9]37.9 [7.29–75.4]
Feox (g kg−1)7.44 [1.03–19.1]2.38 [0.32–9.45]
Pox (mg kg−1)115.1 [22.3–856.8]35.1 [21.9–57.9]
SOC—Soil organic carbon, Feox—oxalate-extractable Fe, Pox—oxalate-extractable P.
Table 3. Summary statistics for soil oxalate-extractable P content (mg P kg−1 soil) obtained by chemical analysis by system.
SystemnMinMaxMeanSDCV (%)
All systems21621.89856.8487.66130.23148.57
Cultivated system14222.25856.84115.07153.69133.56
Natural system 7421.8957.9335.057.7922.23
n, number of samples; SD, standard deviation; CV, coefficient of variation (SD/mean × 100%).
Table 4. Pearson correlation coefficients between soil properties for each system.
PoxSOCSandSiltClayFeox
All Systems
Pox1.000.10−0.200.23−0.000.55
SOC 1.000.15−0.320.24−0.06
Sand 1.00−0.82−0.49−0.41
Silt 1.00−0.090.35
Clay 1.000.18
Feox 1.00
Natural
Pox1.000.61−0.29−0.060.370.45
SOC 1.00−0.44−0.000.530.32
Sand 1.00−0.67−0.96−0.48
Silt 1.000.450.22
Clay 1.000.50
Feox 1.00
Cultivated
Pox1.000.30−0.030.05−0.030.51
SOC 1.00−0.05−0.050.150.33
Sand 1.00−0.79−0.320.06
Silt 1.00−0.33−0.15
Clay 1.000.14
Feox 1.00
Values in bold are significant at P < 0.05.
Table 5. Comparison of different soil oxalate-extractable P prediction models for all land-use systems.
ProcessingSystemsnNLVR2RMSECVRPD
FS-PLSAll systems216130.4896.581.34
Cultivated142150.7083.721.82
Natural7420.187.101.08
ISE–PLSAll systems216130.7071.871.81
Cultivated142150.9048.573.15
Natural74140.902.393.22
n, number of samples, NLV, number of latent variables; FS-PLS, full-spectrum partial least square regression; ISE–PLS, iterative stepwise elimination–partial least square regression.
Table 6. Mean and standard deviation (SD) values of R2 and RMSEP from N = 10,000 evaluations with FS-PLS and ISE–PLS in test data sets (30%).
ProcessingSystemsnR2RMSEP
FS-PLSAll systems640.502 ± 0.12489.01 ± 9.21
Cultivated420.678 ± 0.07979.13 ± 8.30
Natural220.141 ± 0.0967.15 ± 1.62
ISE–PLSAll systems640.703 ± 0.11560.48 ± 5.94
Cultivated420.883 ± 0.03857.42 ± 5.57
Natural220.822 ± 0.0513.26 ± 0.59
Table 7. Selected visible and near infra-red (NIR) wavelengths related to soil components and functional groups as reported in the literature, and common and specific selected wavelengths observed in our study.
Spectra Regions (nm)Common Selected Wavelength (nm)Specific Wavelength (nm)
for Cultivated
Specific Wavelength (nm)
for Natural
Functional GroupsReferences
Visible
400–700409, 430, 431, 443, 444,591, 592527–590 Associated to mineral with Fe (hematite, goethite)
SOM: chromophores and darkness of OM
[54,55]
550 550–557 Chromophore FeOOH in goethite[55]
Near Infra-Red (NIR)
751, 825 763, 826738–740, 753Amine C-H, aromatic C-H[59]
860 870 Ferric oxide, Fe3+[58]
1000 1000 Amine N-H[59]
1100 1122–1144 Aromatic C-H[59]
1170 1170 Alkyl asymmetric-symmetric doublet (C-H)[59,60]
1260 1291Lignin, starch, protein,[61]
1465, 1470 1464–1483 OH in water, CH2, cellulose, lignin, starch, pectin[61]
2160 2160–2164 Al-OH, Kaolin[62]
2200–23002200–2270 Metal-OH, O-H[15]
2300, 2350 2302–23062350–2355 C-H stretch fundamentals[59,60]
23352330–2334 Carbonates[58]
850, 1200, 1400, 1900 1950–1956 H2O[15,58]
2200, 23002200–2270 Al-OH, O-H[59]
19001906–1907 H-O-H[59]
Visible-NIR
450, 900453–457 Fe+3[54]

