
Numerical Validation of a Pyroshock Test System and Application to Qualification Tests


Department of Aerospace Engineering, Middle East Technical University, 06800 Ankara, Turkey
*
Author to whom correspondence should be addressed.
Aerospace 2022, 9(8), 400; https://doi.org/10.3390/aerospace9080400
Submission received: 10 May 2022
/
Revised: 17 July 2022
/
Accepted: 22 July 2022
/
Published: 26 July 2022
(This article belongs to the Section Astronautics & Space Science)
Abstract
:Spacecraft are exposed to severe mechanical loads, i.e., shock loads, during their journey to orbit. Such loads usually develop due to a separation event through the activation of pyrotechnic devices. They might be transmitted throughout the entire structure and strongly influence the service performance of electronic components. Therefore, it is crucial to study whether the instruments can resist such a harsh environment. However, due to the vulnerability and high cost of the equipment, experimental setups are required to be designed and calibrated with dummy equipment, which takes considerable time and effort as well. In this context, the current study aims to investigate the potential of explicit FE solution techniques to mimic the calibration tests. In order to realize this, various experiments are conducted in a metal-to-metal impact pyroshock test bench and the obtained Shock Response Spectrum (SRS) responses are fitted to the explicit finite element simulations, which shows good agreement after a sensitivity analysis. Then, the simulations are repeated with the dummy device using the fitted parameters, and the potential of the numerical approach to predict a realistic response is discussed.
1. Introduction
Pyrotechnic devices, which contain separate energy sources such as explosives, have been used commonly in the aerospace industry for quite a long time. They have been utilized substantially on aerospace vehicles to carry out a great number of work functions, such as cutting, separation, pressurization, valving, electrical switching, personnel ejection as well as emergency and lifesaving applications. The usage of pyrotechnics is advantageous compared to the other release devices based on non-explosive release actuators due to the low volume–weight relationship, high reliability, instantaneous operation with simultaneity, long-term storage capability and low cost. For detailed overviews on such devices, one can refer to earlier NASA reports (see, e.g., [1,2]).
Although pyrotechnic devices have various advantages, the induced pyroshocks might result in catastrophic failure of the nearby optical and electrical components, which are sensitive to high-frequency energy. This is a crucial concern and it might eventually result in the failure of the flight. According to the report of Moening on the cause of failure in space programs between 1960 and 1982, of the 85 observed failures, 84% were directly or potentially related to pyroshock-induced failures [3]. Pyroshock is defined as the transient response of the structures, components and systems due to the loading induced by the pyrotechnic devices attached to the structures [4]. In general, pyroshock moves in terms of linear elastic waves to the adjacent structures without plastic deformation, except when in the vicinity of the pyrotechnic devices.
Due to their high potential to cause fatal problems, pyroshocks have been studied in the literature by many researchers. For the detailed analysis of the generation and propagation of shock waves, both experimental and numerical analyses have been conducted in the literature (see [5] for a review). The studies have mostly focused on experimental approaches where the pyroshock is simulated on test structures and the propagated pyroshock is measured. Among these studies, the use of pyrotechnic devices is quite expensive and involves a high safety risk (see, e.g., [6,7,8]). Therefore, different pyroshock simulators involving mechanical excitations have been proposed as well. However, in these setups, it is not easy to arrange the frequency and magnitude of the pyroshock excitation. For near-field pyroshock analysis, the explosive excitations are advised where high acceleration and high frequency can be obtained to verify structural integrity issues (see, e.g., [4,5,9]). On the other hand, for the simulation of the mid- and far-field environments, mechanical excitations can be used through metal-to-metal impact, pneumatic impact or an electrodynamic shaker (see, e.g., [4,5,7,10,11]). While electrodynamic shakers are limited to far-field pyroshock environments, metal-to-metal impact and pneumatic impact systems can simulate mid-field effects. They mostly consist of resonant structures such as a resonant beam or plate and they are utilized to test sub-systems or components. Some portable devices are studied in the literature as well to perform system-level tests, such as the work of Hwang et al. [12]. Although it has not been widely employed in pyroshock analysis yet, another potential excitation method would be laser one, where a laser pulse would produce transient localized heating, which would lead to the development of hermoso-elastic stresses and strains acting as a source of shock waves [5,13].
It is not trivial to mimic the real transient acceleration field of pyroshock loadings with an experimental setup as they are highly chaotic and oscillatory and often impossible to replicate with a test bench. In order to overcome this problem, the effect of the pyroshock environment is not considered in the time domain but rather in the frequency domain. Therefore, both the shock history that a space instrument needs to withstand and the shock history that is applied to the instrument on a test setup mimicking the shock environment are described in the form of Shock Response Spectrum (SRS) curves. These curves are composed of the peak acceleration response of the real system as if it is a single degree of freedom (SDOF) setup that has a resonant frequency all over the frequency bands that are to be considered. Using SRS curves provides a convenient method to compare the severity levels of different shock loadings, and it is preferred in a number of different works in the literature (see, e.g., [6,7,8,9,10,11,12,13,14,15,16,17,18]).
Metal-to-metal impact or pyrotechnic types of pyroshock simulators are not always capable of simulating the intended SRS curve precisely. These types of pyroshock simulators are without control loops, and mostly it is a trial-and-error process to simulate the correct level of shock (see, e.g., [15,16,19]). Over-testing may happen, and acceleration levels may be much lower than necessary qualification levels. Discrepancies can occur in the total level of accelerations or local differences in different frequency bands, which cause qualification tests not to be performed properly.
In addition to experimental studies, numerical analysis techniques have also been employed to either test the instrument numerically for the desired shock levels or to investigate the necessary input parameters to perform an experiment with the correct shock levels. In this regard, experimental approaches can be replaced with numerical tools, which would reduce the time and the cost of the study. The most widely used numerical approach is the finite element method (see, e.g., [6,9,15,16,20]). Among the studies based on FEM analysis, the study of García-Pérez et al. offers an overview of shock analysis methods based on implicit FEM [18]. The authors mention that the FE method can be adequate to analyze small structures such as space instruments subjected not to near- or mid- but a far-field shock load, because its response is mainly dominated by the modal behavior. Other main approaches in the literature are the statistical energy analysis (SEA) method (see, e.g., [21,22]), and the hydrocode modeling of the system (see, e.g., [8,10,13,23]). Hydrocodes can predict the behavior in the near-, mid- and far-field through time domain analysis; however, they are considered not to be satisfying in terms of accuracy and require high computation times. Additionally, for a better prediction through numerical methods, hybrid approaches could be used, as shown in the work of Zhao et al. [24].
In the current work, experimental and numerical pyroshock test results of a metal-to-metal impact system that can mimic far-field and mid-field pyroshock applications are presented with a focus on a correlation process of the experimental results with explicit FE simulations. Several tests are performed with a pneumatically excited ringing plate-type test system, where the effects of different configurations, such as speed of projectile and measurement location, are considered as well. In the experiments, the speed of projectile in the pneumatic excitation system as well as the acceleration from different locations are measured. The former is used as an input for the numerical simulations, while the latter is converted into SRS curves and compared with the results of FE simulations. The correlation process and the influence of different parameters in simulations are discussed in detail, as well as the performance of the explicit FE method in predicting SRS curves within different frequency ranges and acceleration levels, which is missing in the open literature. Although FE simulations are considered to have low accuracy for pyroshock problems (see, e.g., [5]), it is shown in the current study that their performance could be substantially increased after the careful analysis of each model parameter. Furthermore, a pyroshock test with a dummy instrument mounted on the system is considered as a case study, and the performance of the FE simulations is evaluated in detail. Overall, the paper presents a unique study combining both experiments and explicit FE simulations for predicting the influence of pyroshocks.
The paper is organized as follows. The experimental setup and the performed measurements are presented in Section 2. Then, in Section 3, the FE models, the influence of different damping and non-linear contact parameters as well as the acceleration and the SRS results are presented. Moreover, the comparison of numerical and experimental studies, the differences in SRS results and the performance of the explicit FE method are discussed. A case study for a pyroshock test with a dummy instrument is presented in Section 4, and the conclusions are presented in Section 5.
2. Shock Test System and Experiments
2.1. Ringing Plate Test System
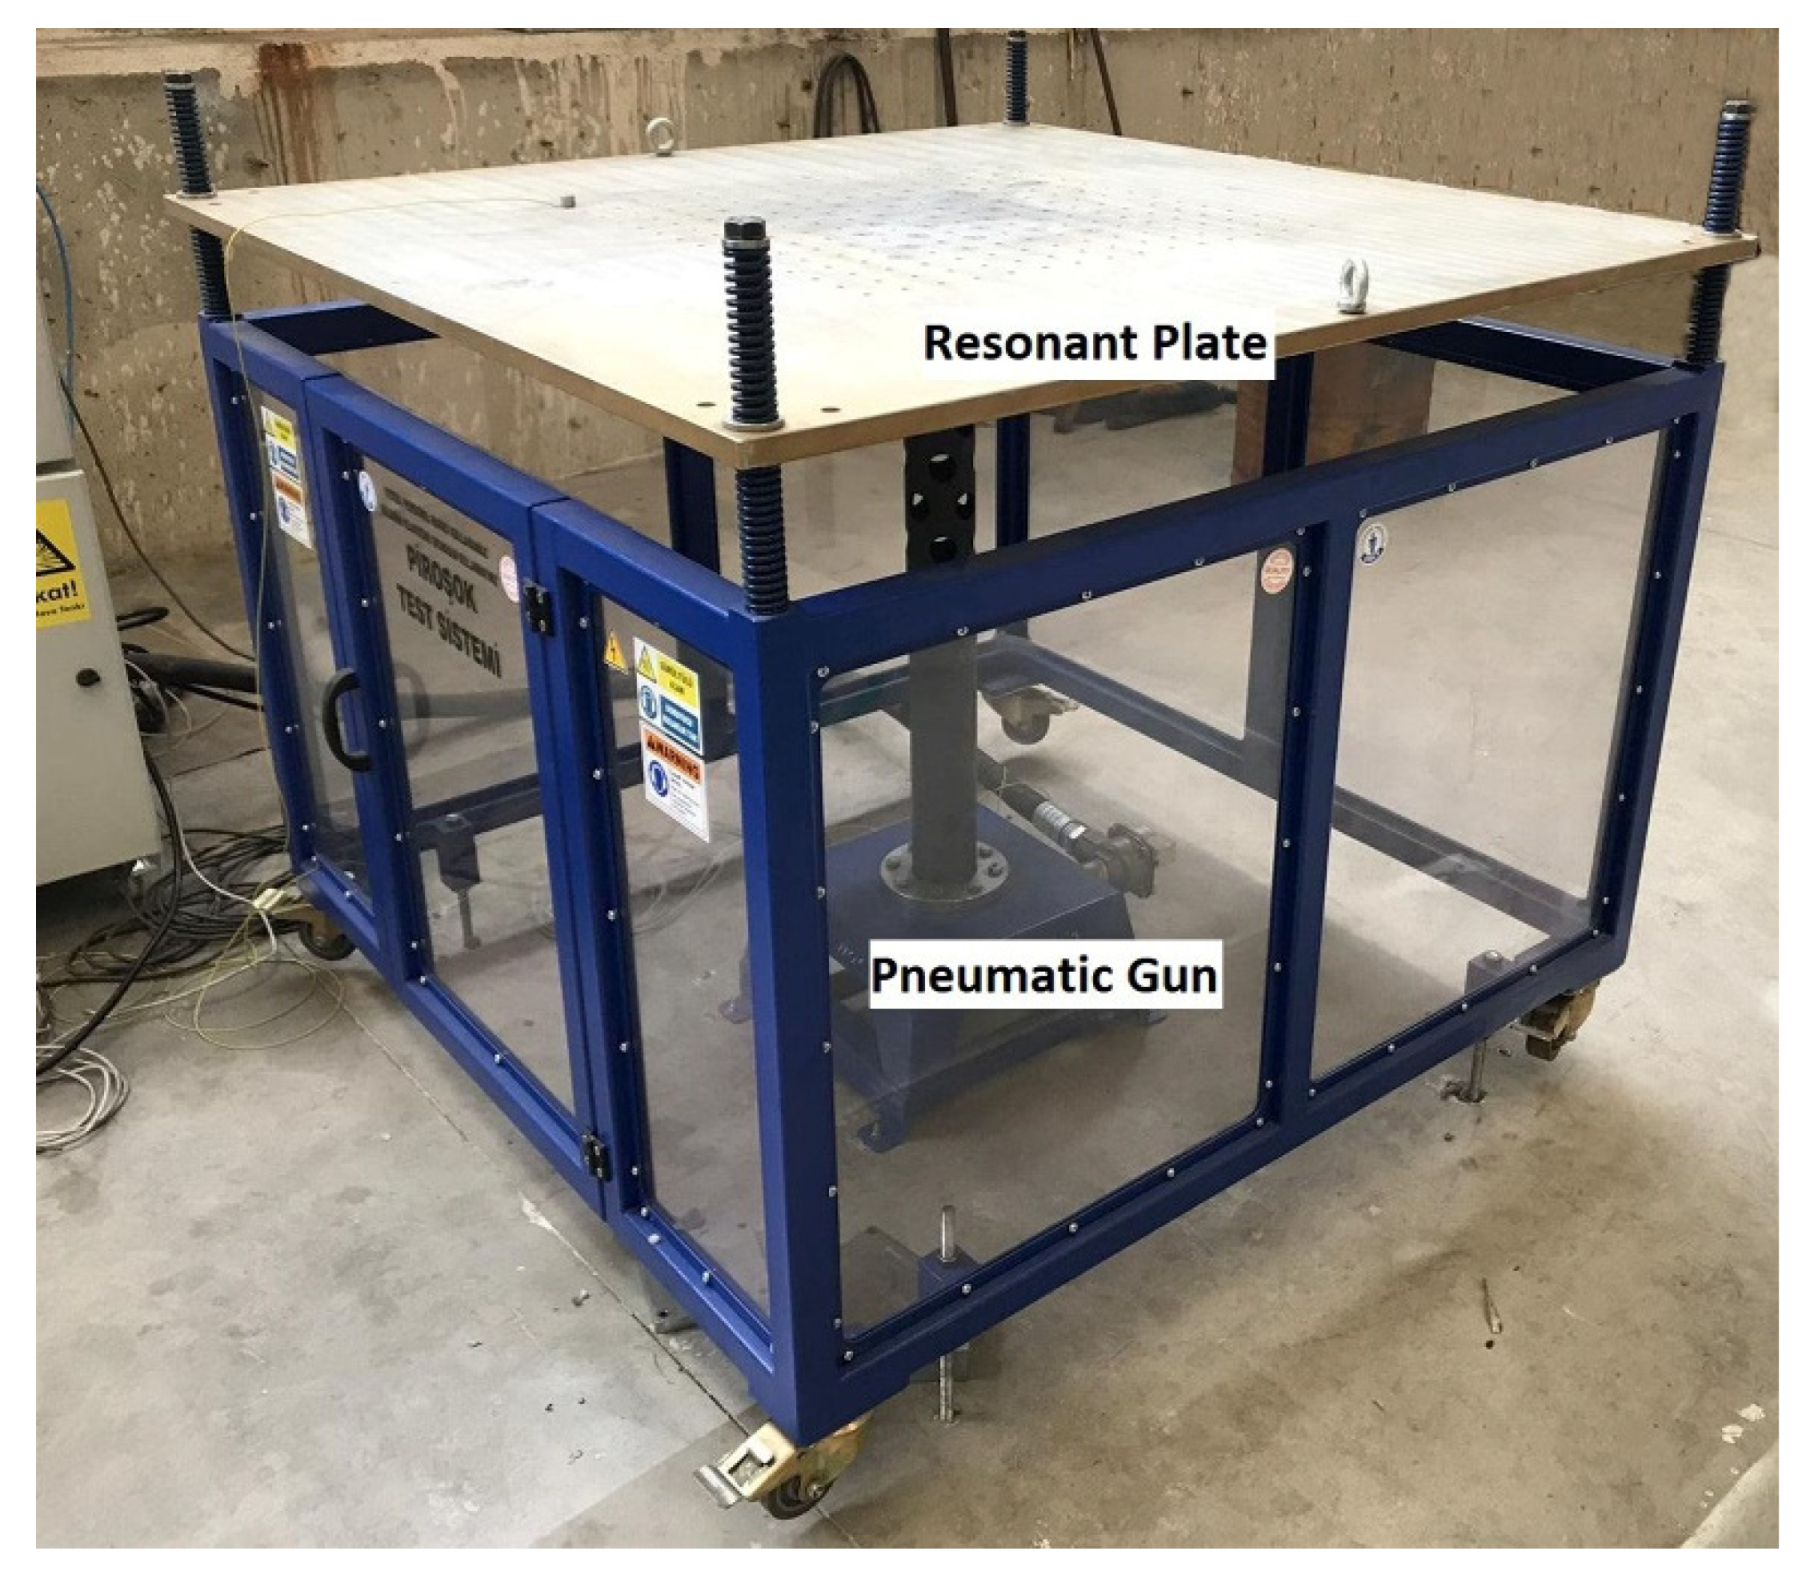
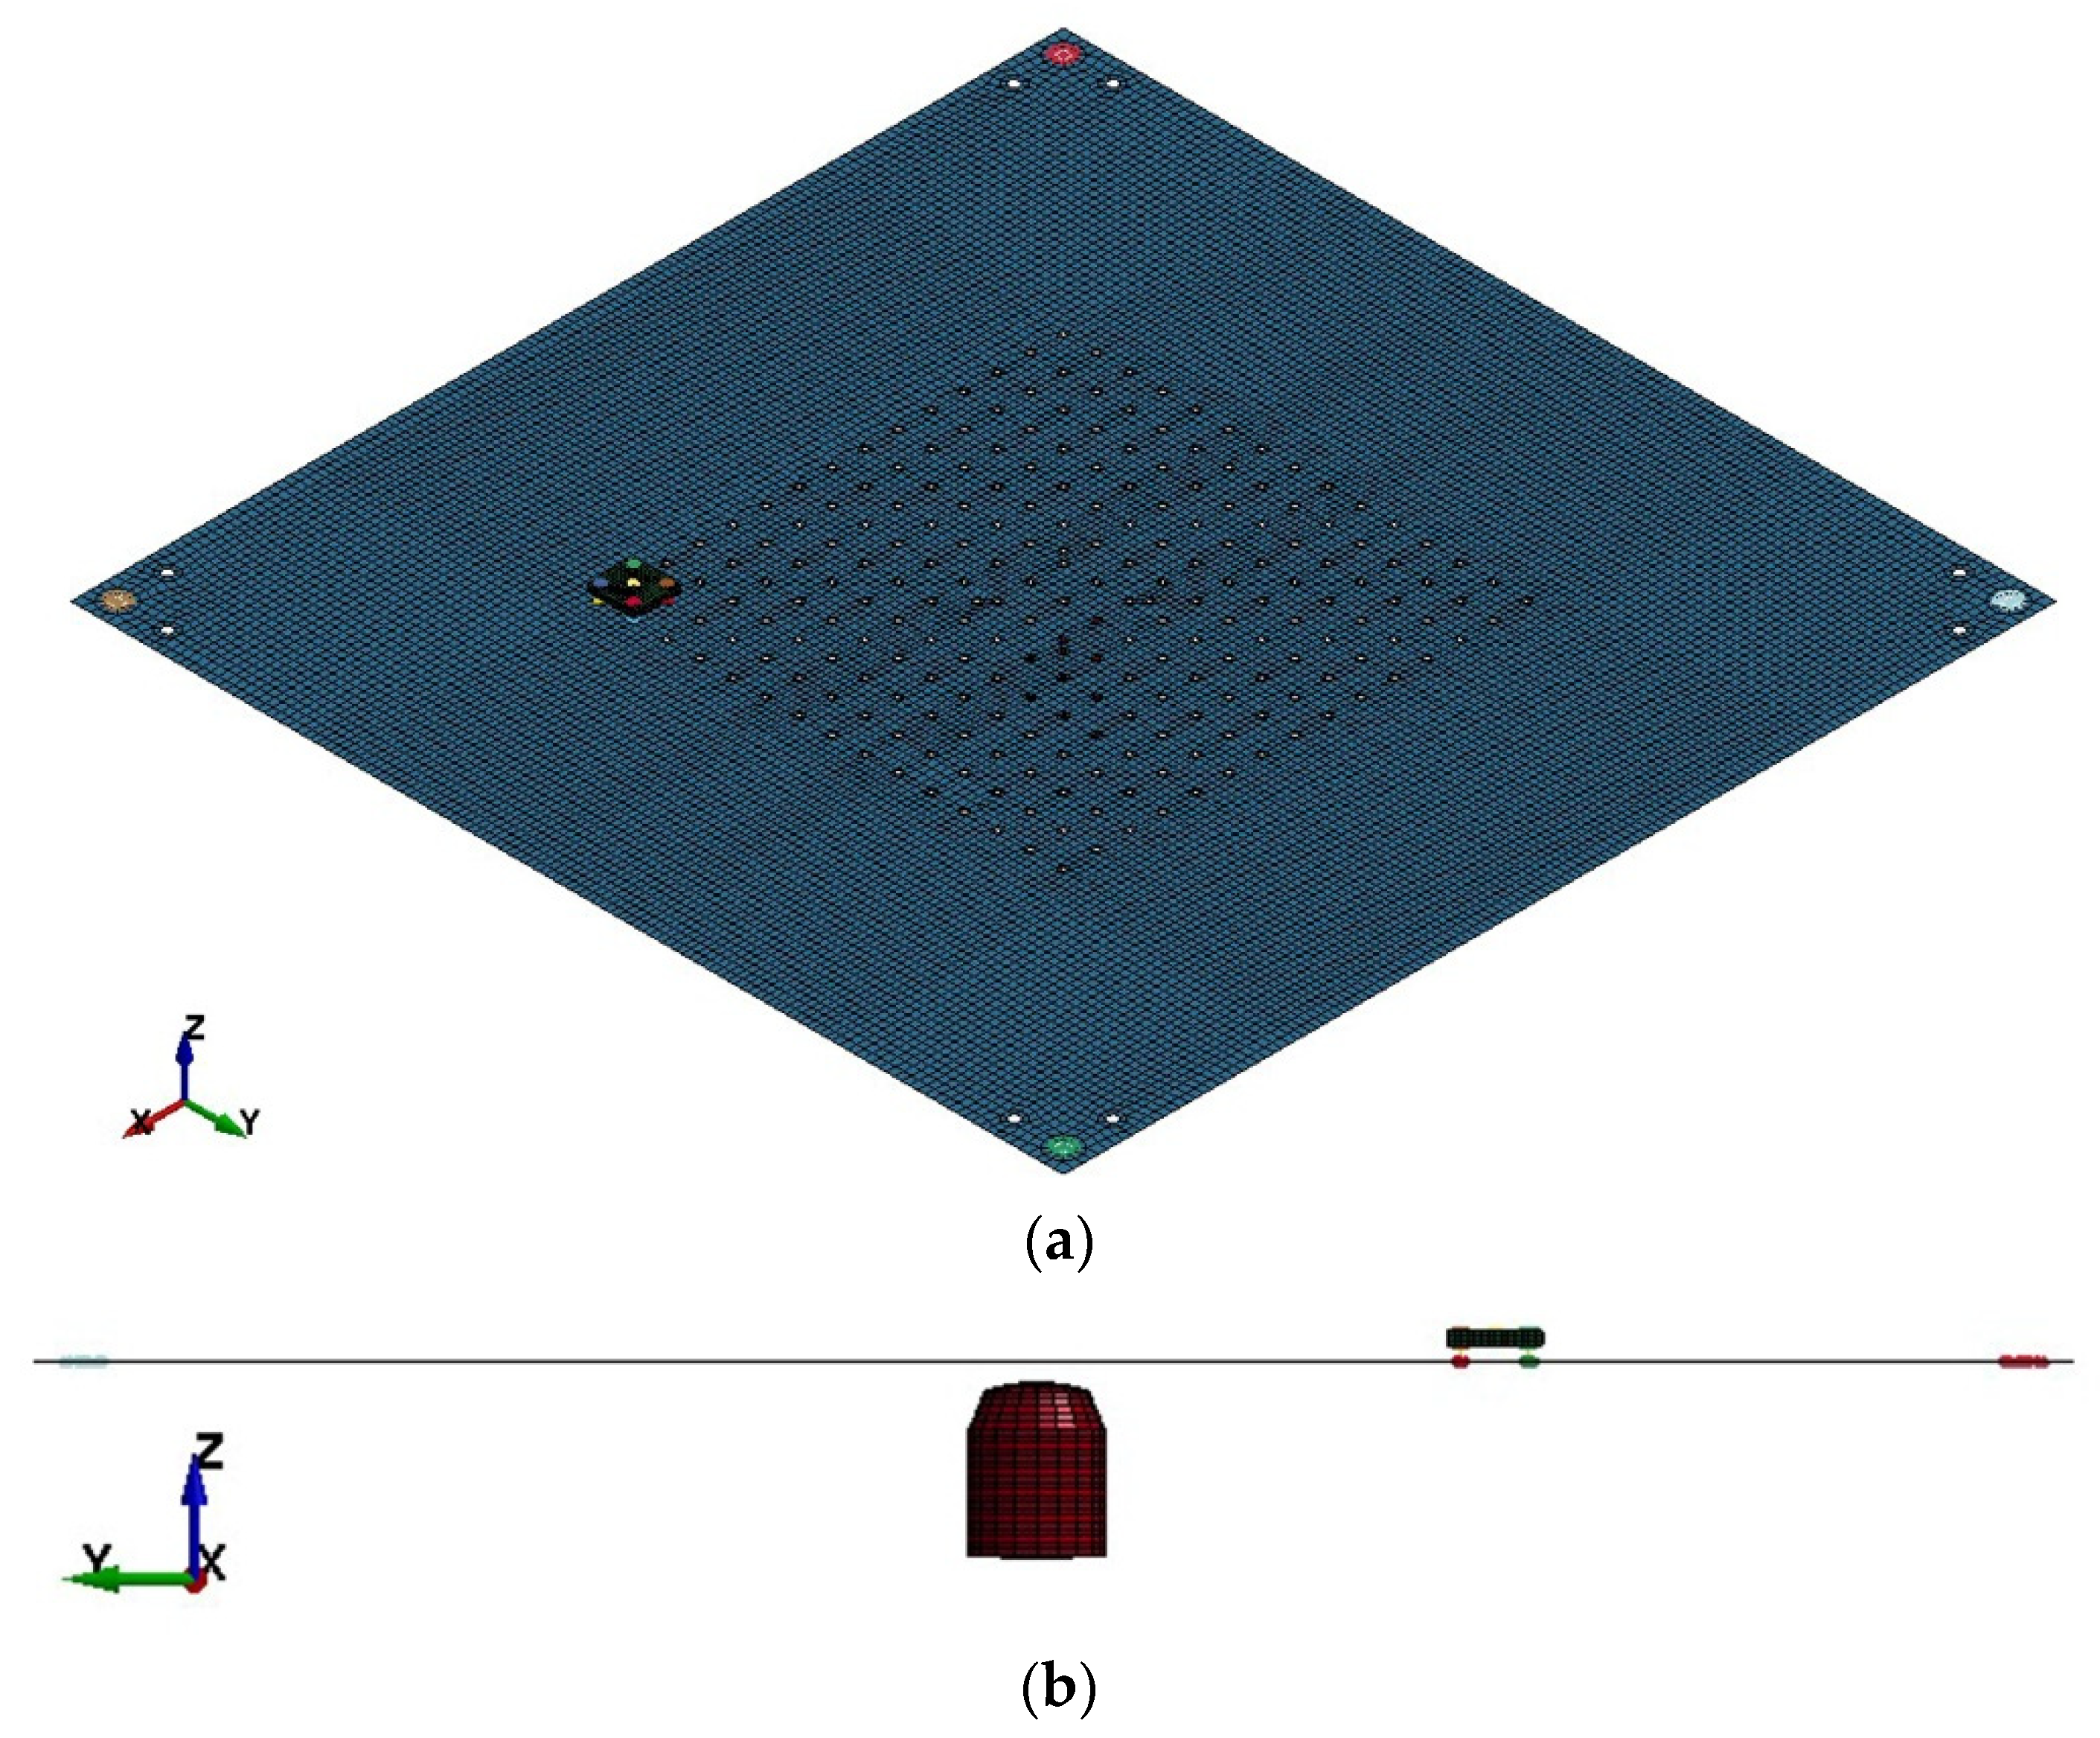
Pyroshock experiments are performed using a pneumatically excited ringing plate test bench, which is composed of a square resonant plate that is positioned horizontally on springs, a stationary pneumatic gun, a pressurized air tank and a PCL control system, as shown in Figure 1. The pneumatic gun is placed under the resonant plate and aligned at the center point. There is no direct mechanical connection between the gun and the resonant plate in order to eliminate any possible force and acceleration transmission to the plate. The desired pyroshock is obtained with metal-to-metal impact between the resonant plate and the accelerated projectile due to pressurized air in the tank. Collision occurs under the resonant plate, where an anvil plate is placed in order to prevent local plastic deformation. However, in order to decrease the complexity of the system, an anvil plate is not used in the experiments presented in the current paper.
As a natural outcome of the current design, the system works only in the vertical direction and the instrument to be tested is assembled at the top surface of the resonant plate aligned with the center or placed at any other position depending on the pyroshock requirements. In order to conduct experiments in the other directions, the instrument should be rotated and needs to be fixed to the plate with an L- or U-shaped adaptor plate.
A particular level of pyroshock is obtained through different tuning parameters, which include the thickness and the material of the anvil plate, the thickness and the material of the resonant plate, the velocity and the weight of the impactor, the position of the instrument and the thickness, size and material of the instrument adaptor plate. A calibration phase is vital to ensure that the necessary pyroshock loading is applied to the instrument to be tested. Thus, a representative dummy model of the instrument is used for the calibration process to secure the shock levels and to prevent possible damage to the real instrument.
2.2. Pyroshock Tests
The primary purpose of performing tests directly on the resonant plate without a device is to generate experimental pyroshock data to be used for the development of correlated explicit FE models. Later on, such models could be utilized in the calibration phase, instead of performing the physical test with a dummy instrument model, which would be cheaper and easier; however, it is beyond the scope of this paper.
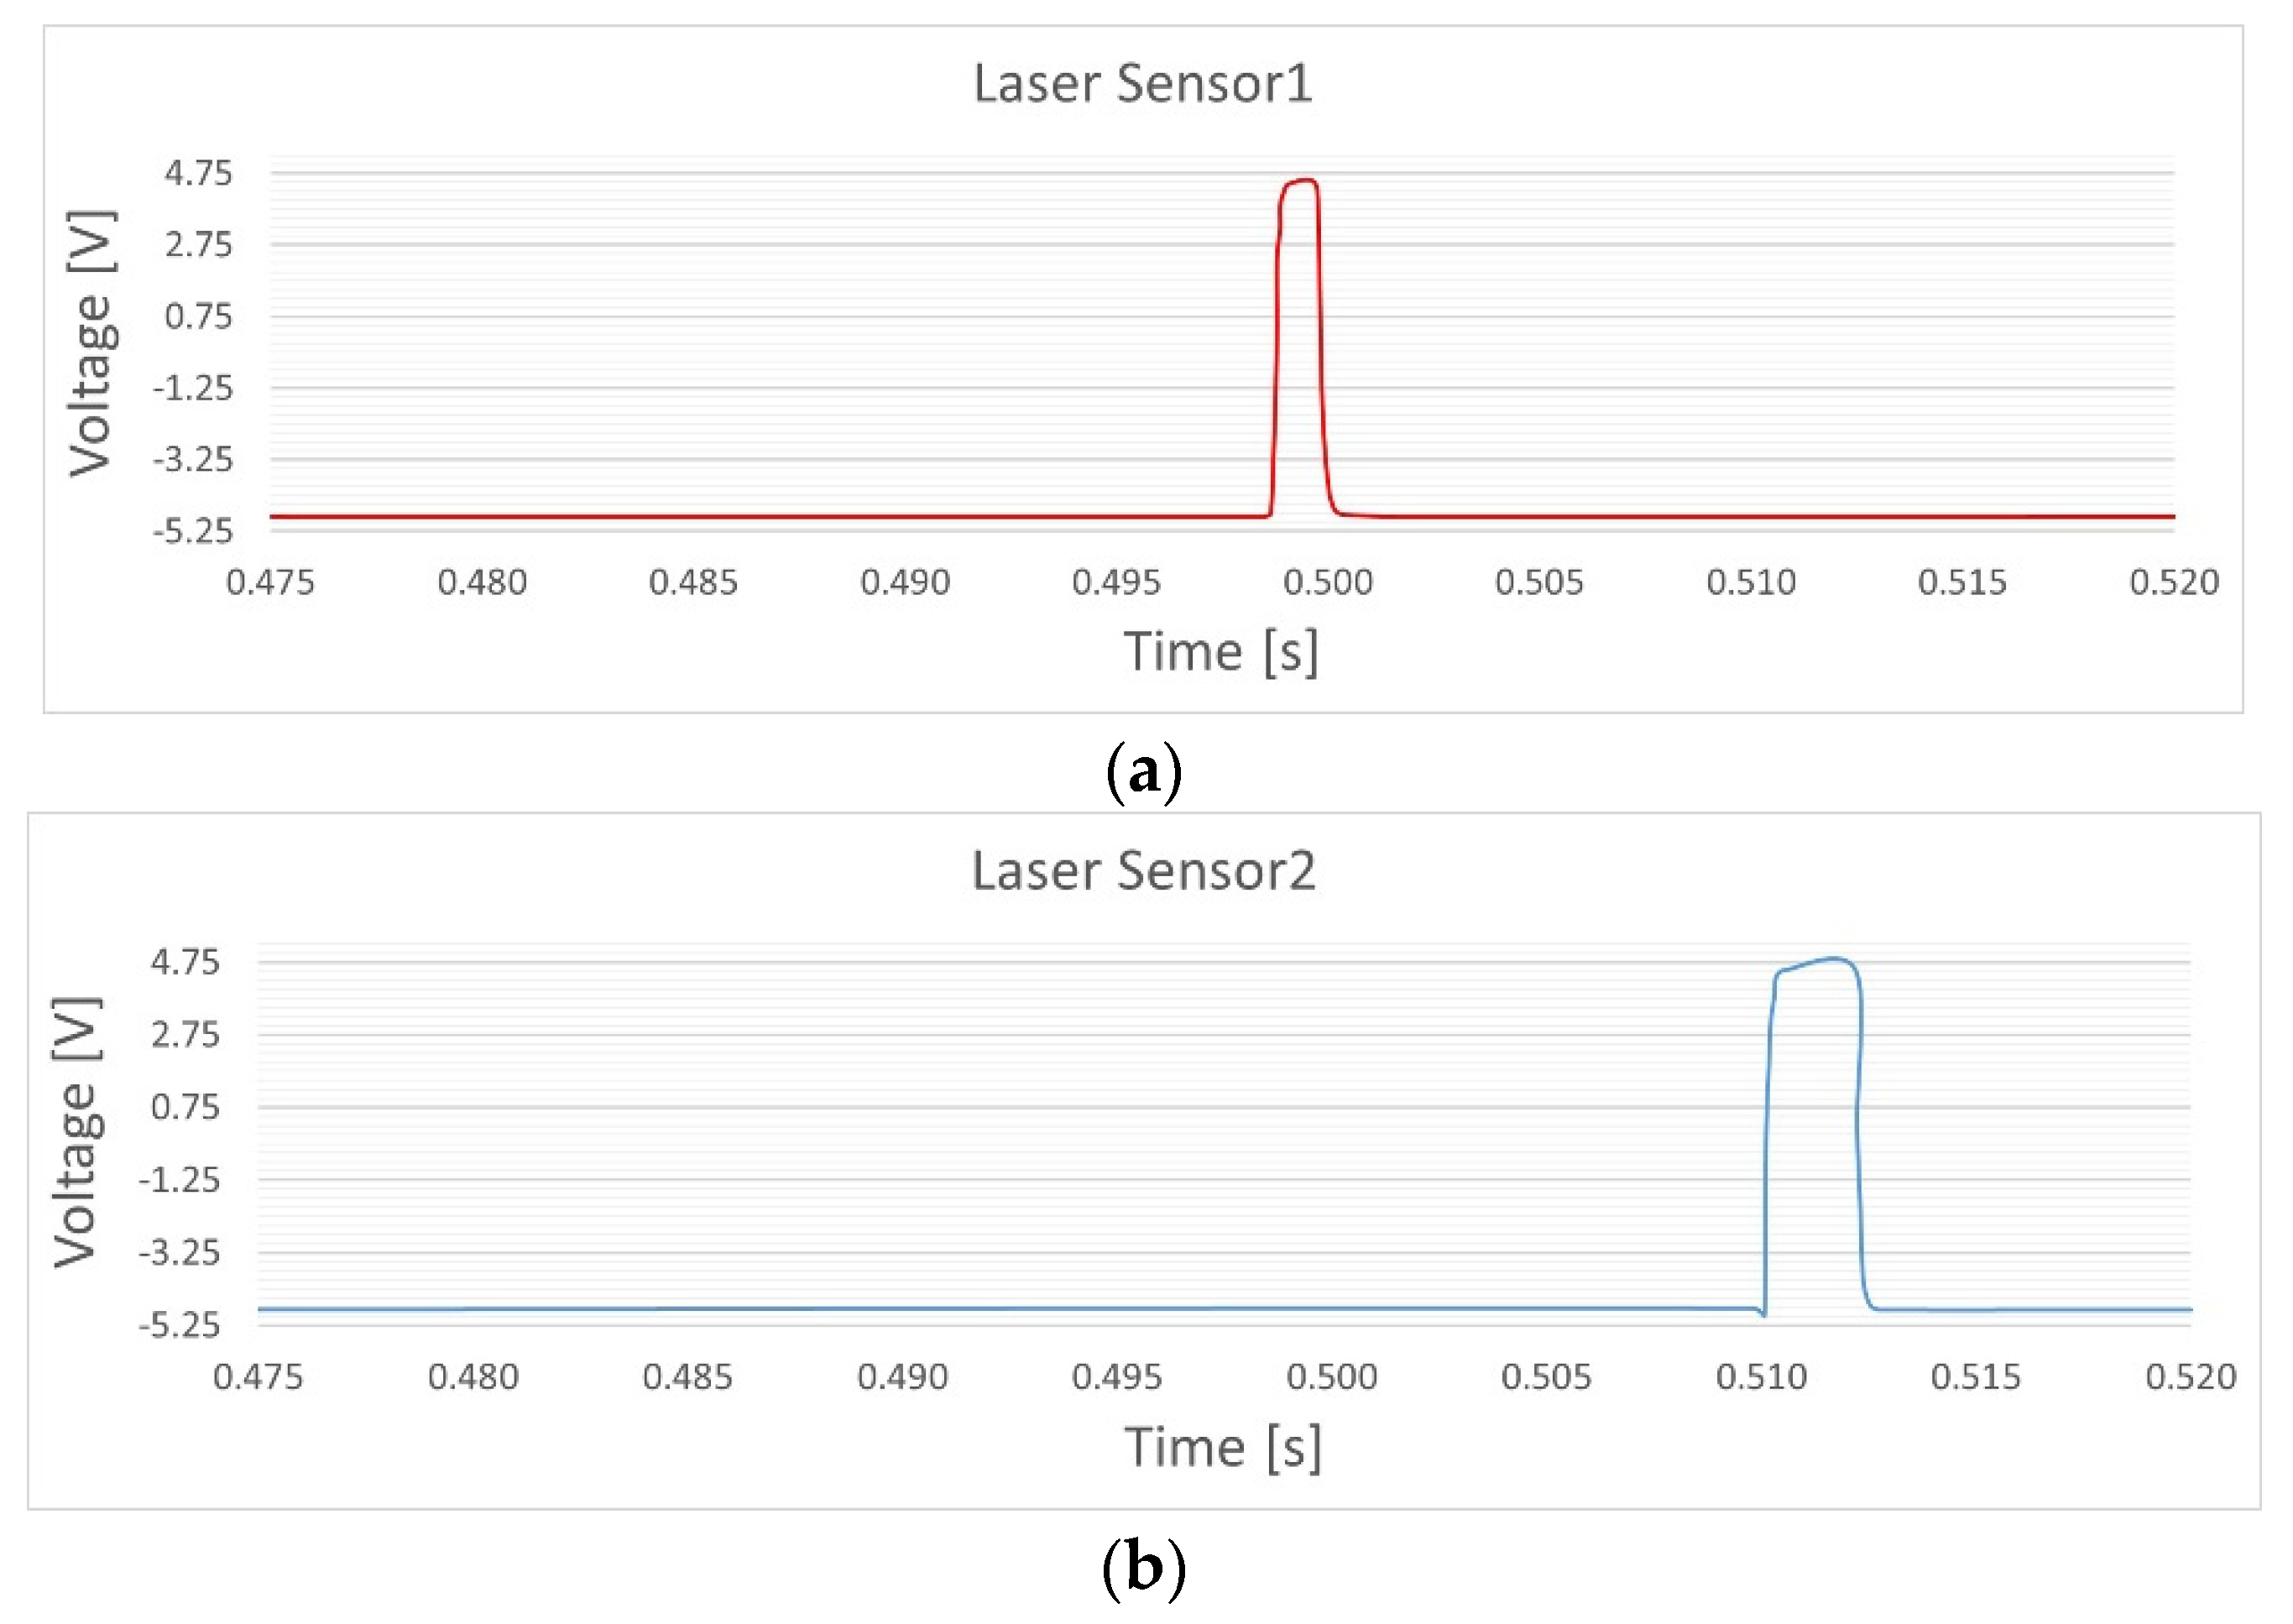
Two sets of experiments are performed in order to create the necessary experimental data. In the first set, the velocity of the impactor is measured shortly before the collision with the resonant plate. The pressure of the pneumatic system can be tuned as a parameter that would lead to the adjustment of the impact velocity and, as a direct outcome, the amplitude of the pyroshock. However, since the pneumatic system is not modeled in the FE procedure, for the sake of simplicity, it creates an essential need to know the velocity of the projectile in order to include it as an initial condition for all FE simulations. Therefore, the velocity of the projectile is measured by two laser sensors that are placed in the same vertical direction, aligned with the pneumatic gun and positioned as close as possible to the collision point, with a distance of 35 mm between them. The signals from both sensors are gathered and evaluated by considering the time lag between signals and the physical distance of the sensors. A sample of signal data is presented in Figure 2.
A total of 8 tests are performed with various pressures. In order to check the consistency of the pneumatic system and the PLC control unit, every pressure is tested twice and the velocity values are compared. Certain scatter occurs in the results but it is within a reasonable range, and the system shows consistency to obtain the same velocity for the same pressure values, as shown in Table 1.
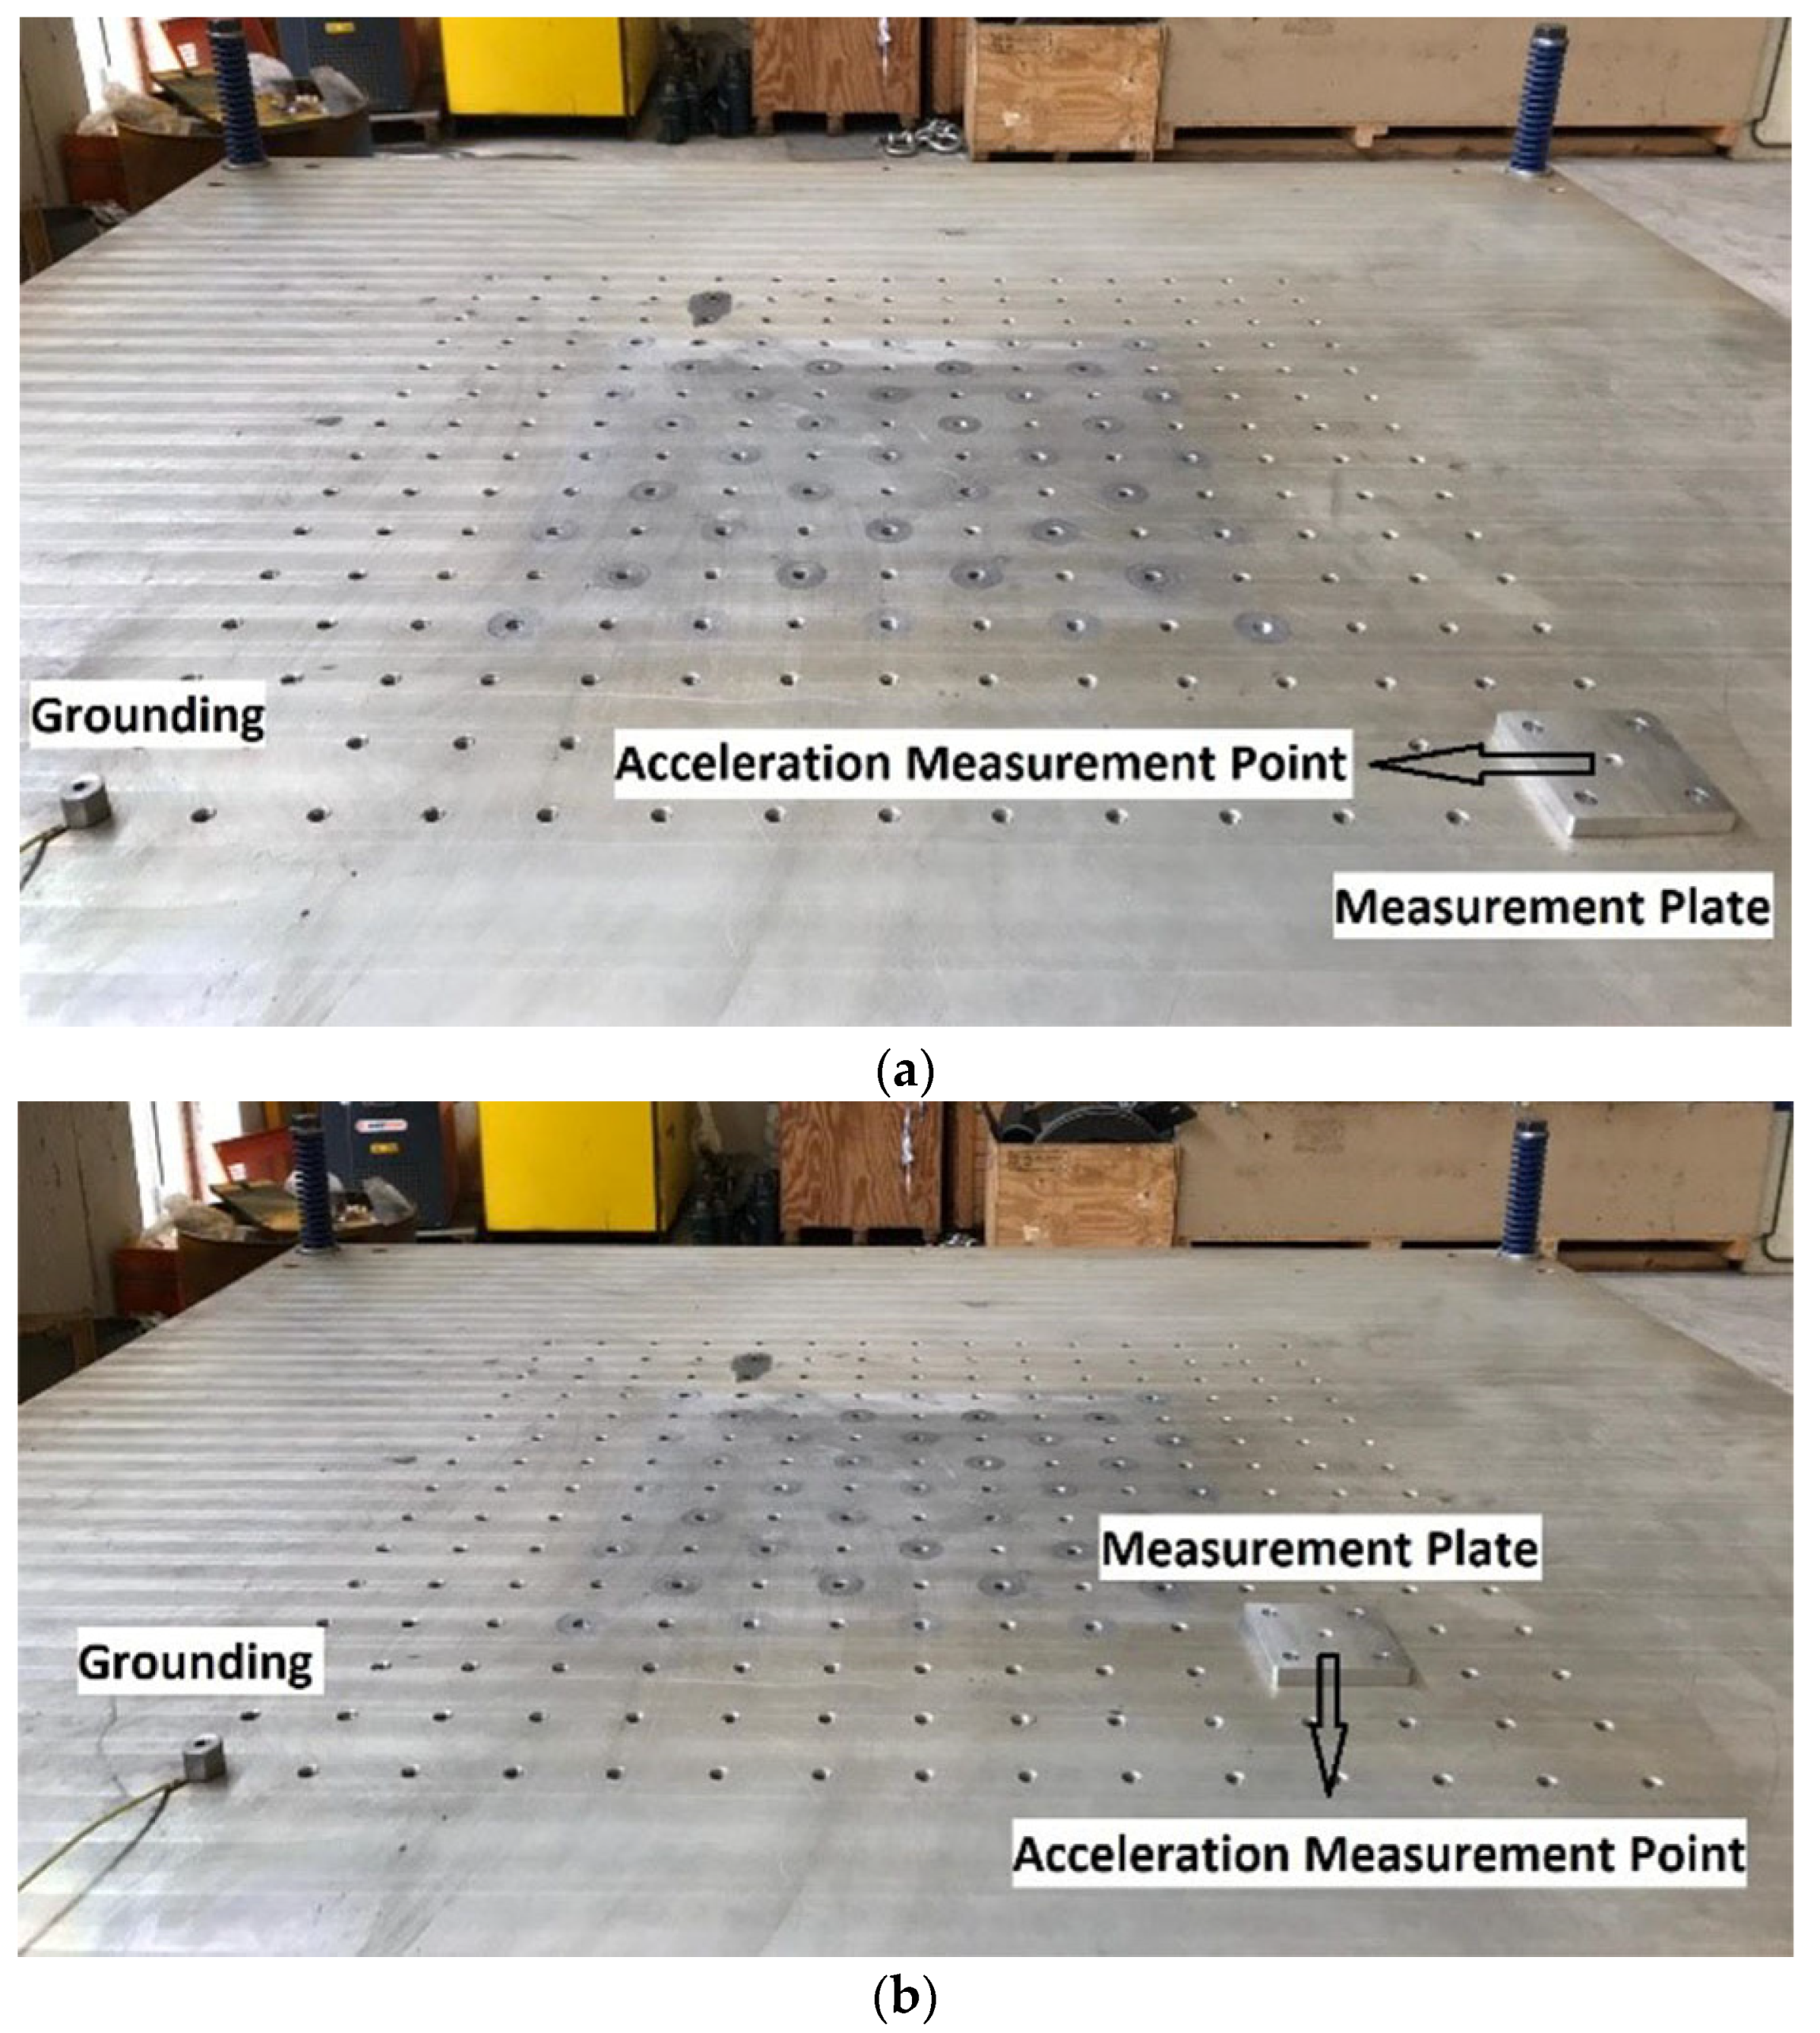
The second set of experiments is performed to gather the necessary acceleration–time data for the correlation and calibration of FE models. A piezo-resistive type of single-axis shock accelerometer is placed on the resonant plate with a simple rectangular adaptor plate and 4 × M8 steel bolts. Acceleration–time data are recorded for six different scenarios with three different velocities on two different locations, as presented in Figure 3. The anvil plate is removed to make the system simpler and to identify the effects of different parameters in the FE simulations. As a result of this, even though the system is capable of testing the mid-frequency pyroshocks and works with pressure up to 6 bar, the pressure is limited to 1.20 bar and remains within the level of far-field pyroshock to ensure that the resonant plate does not undergo plastic deformation. Test conditions are illustrated in Table 2.
A total of 18 tests are performed. Acceleration–time data are collected with a 1 MHz sampling rate, and they are converted to Shock Response Spectrum (SRS) curves and evaluated in this form due to the difficulty of interpretation of transient acceleration data for pyroshock loading owing to its chaotic nature. The test system is designed to simulate mid-field and far-field pyroshocks; thus, it is reasonable to analyze the SRS curves within a frequency range between 100 Hz and 10 kHz [5].
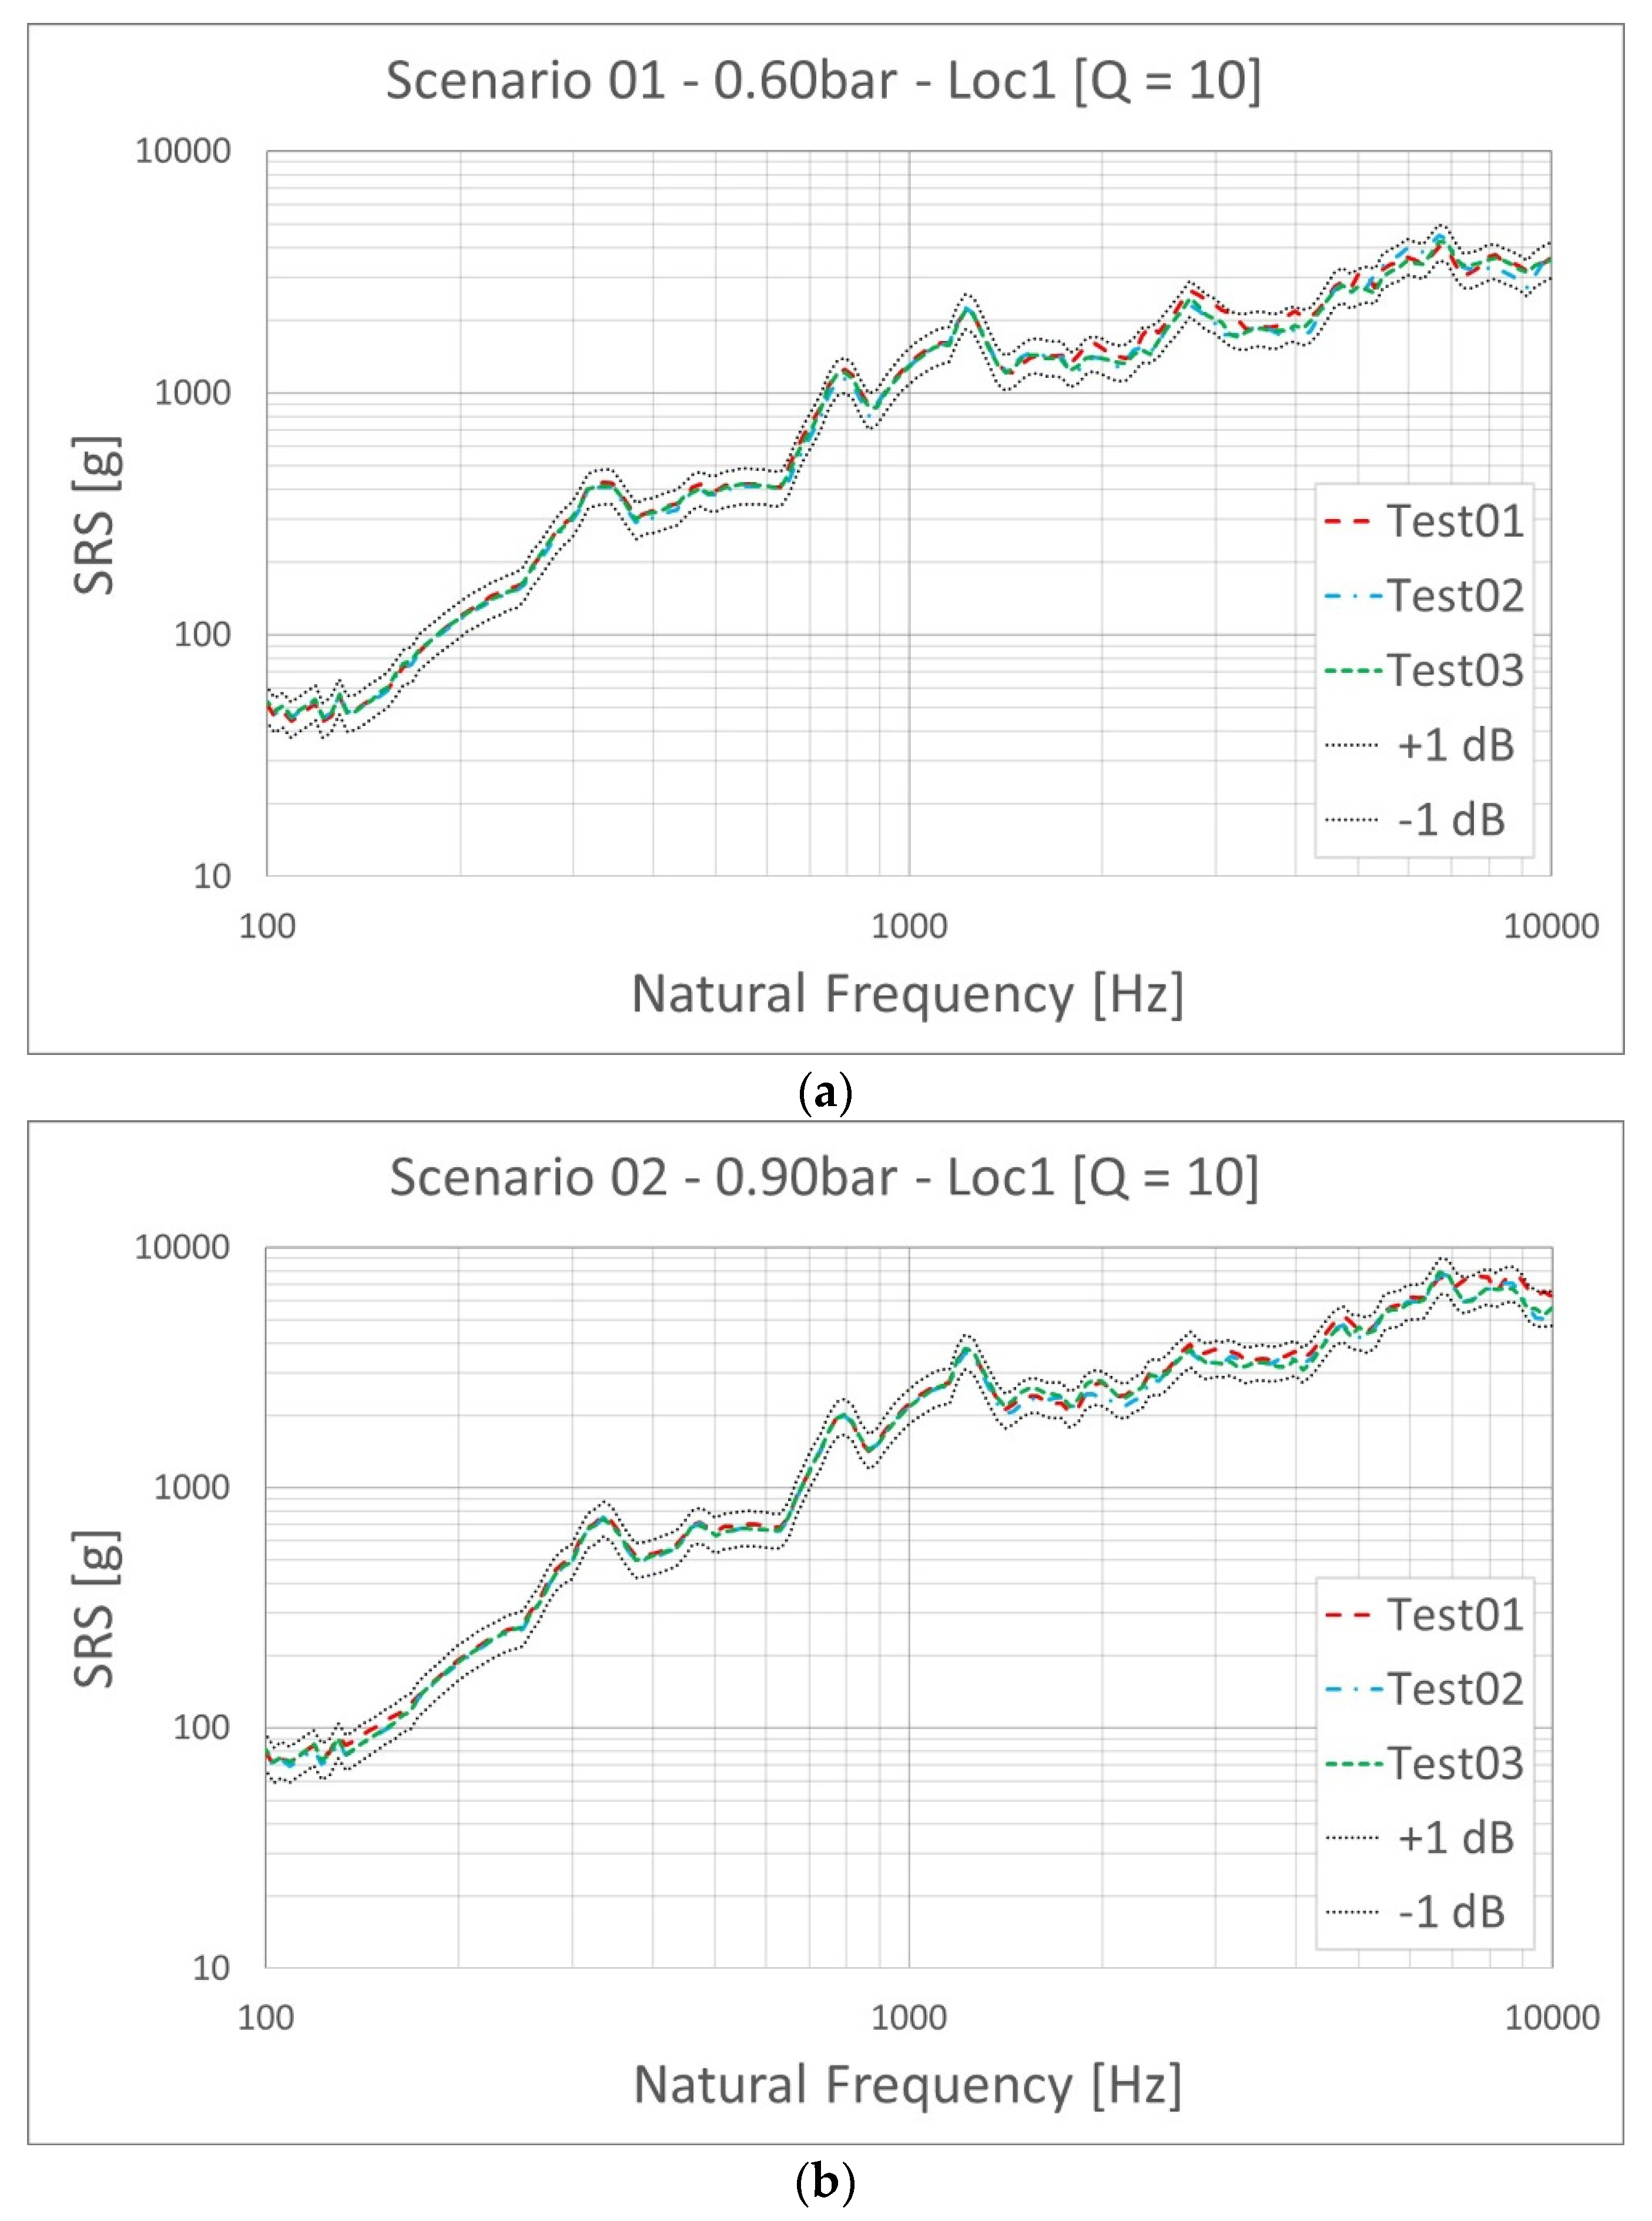
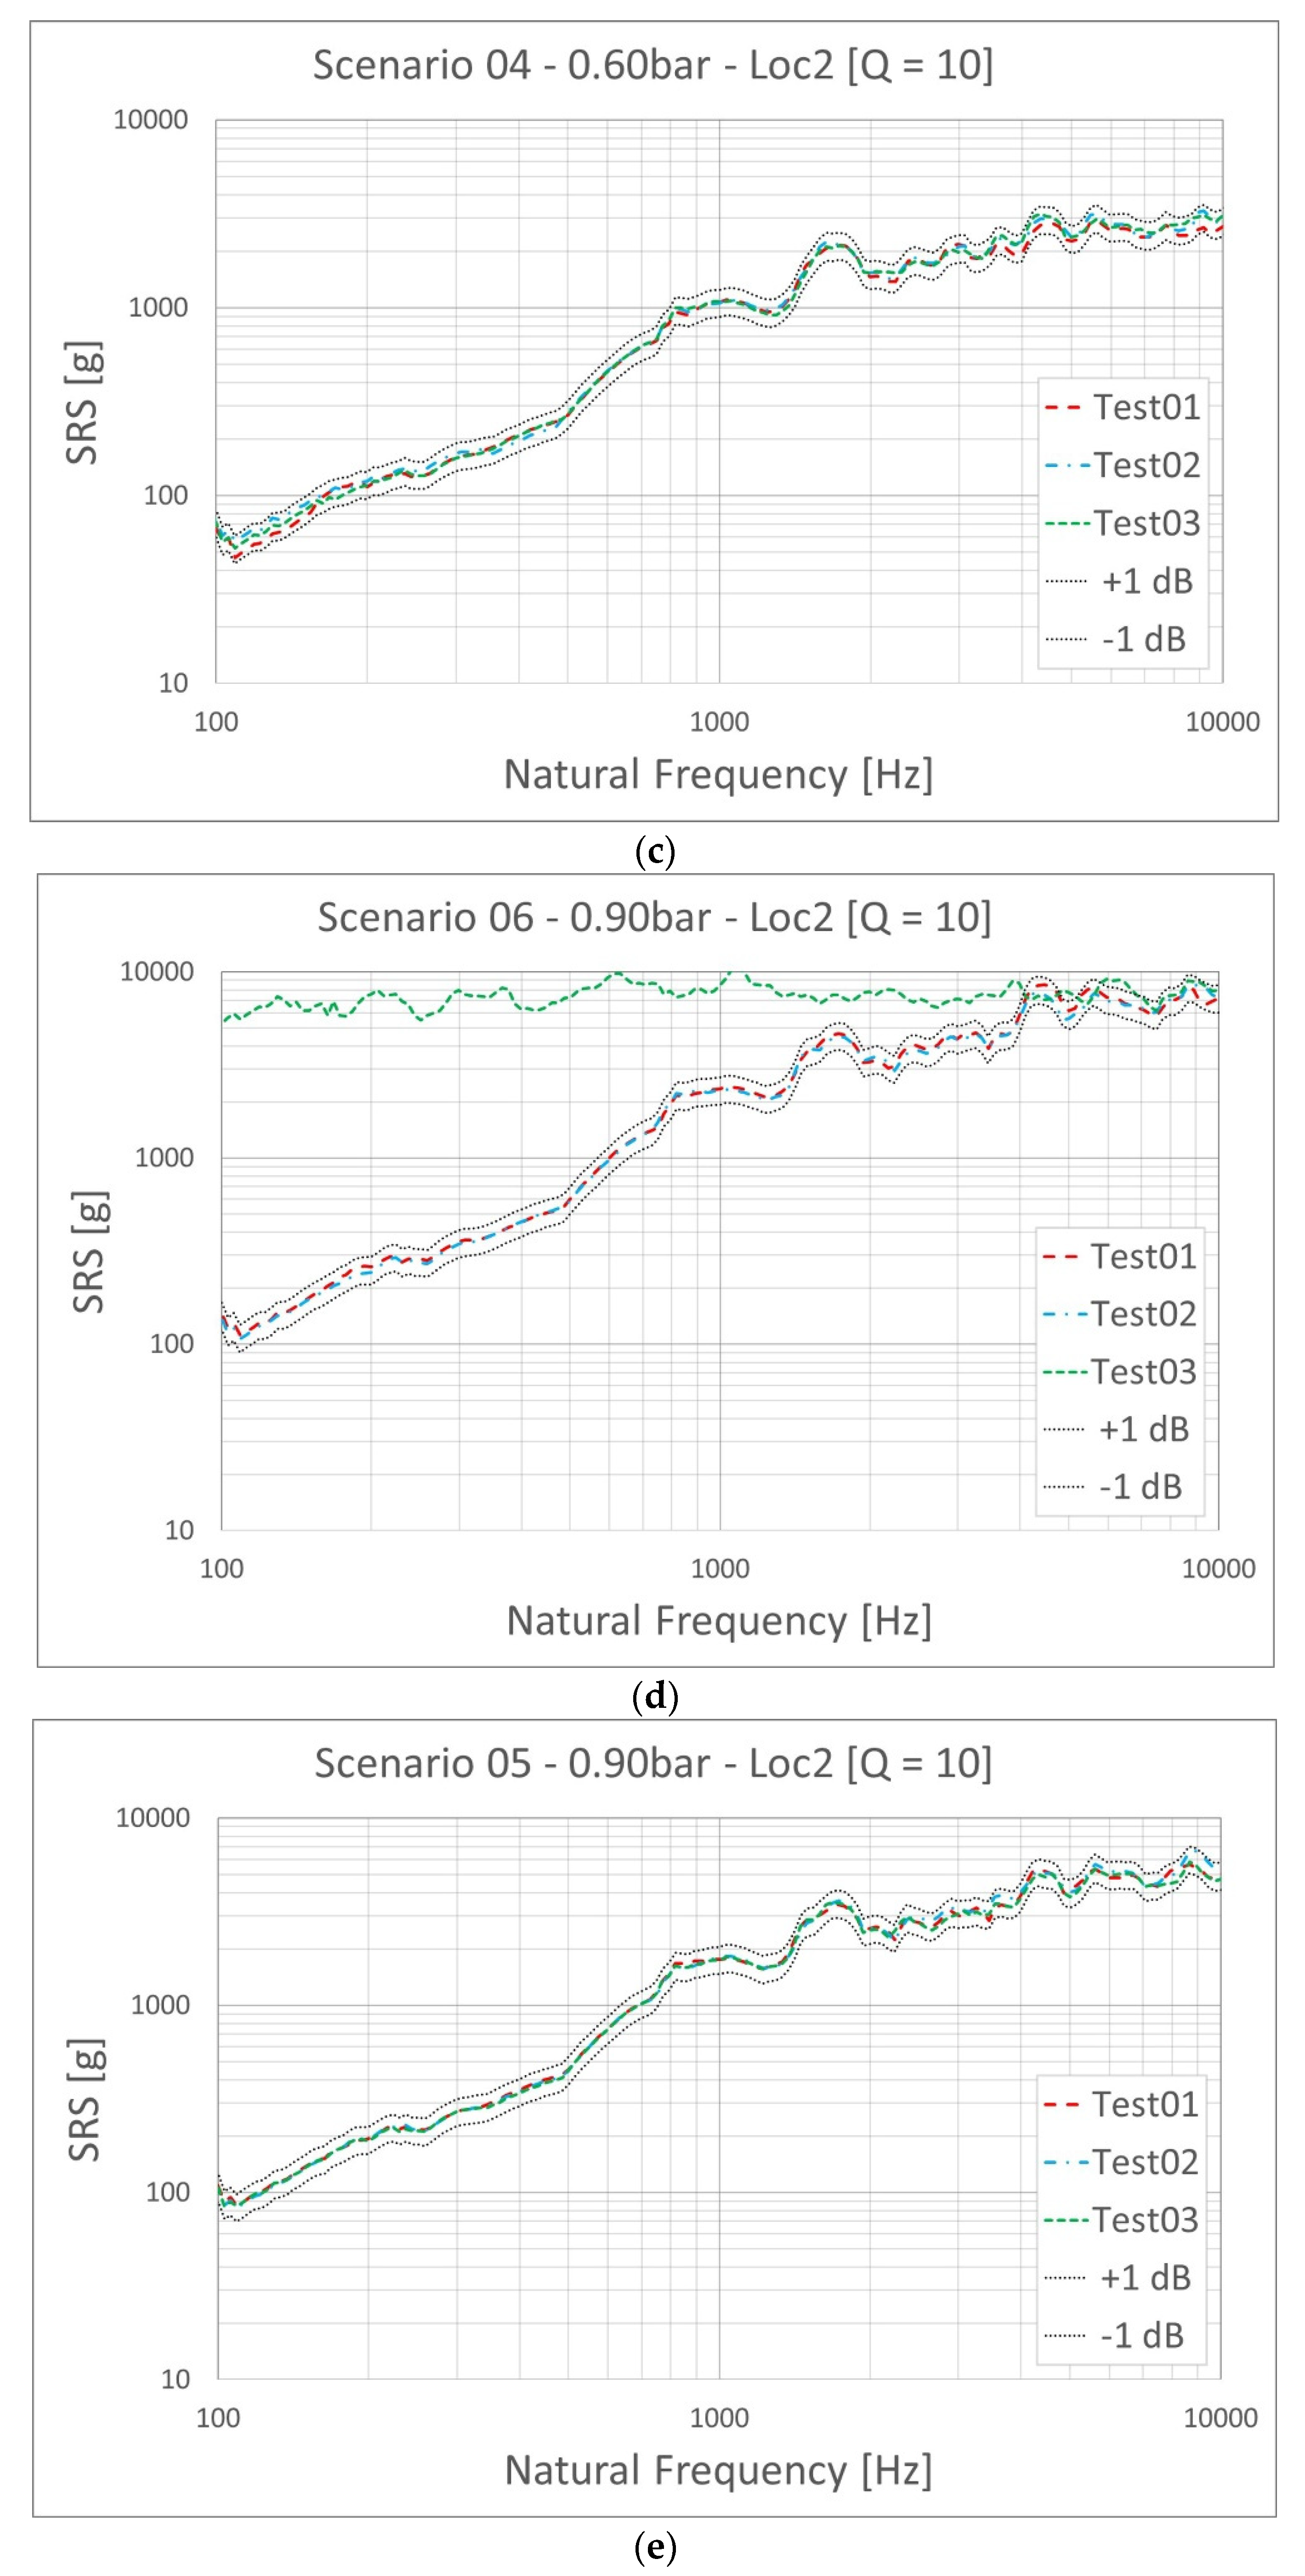
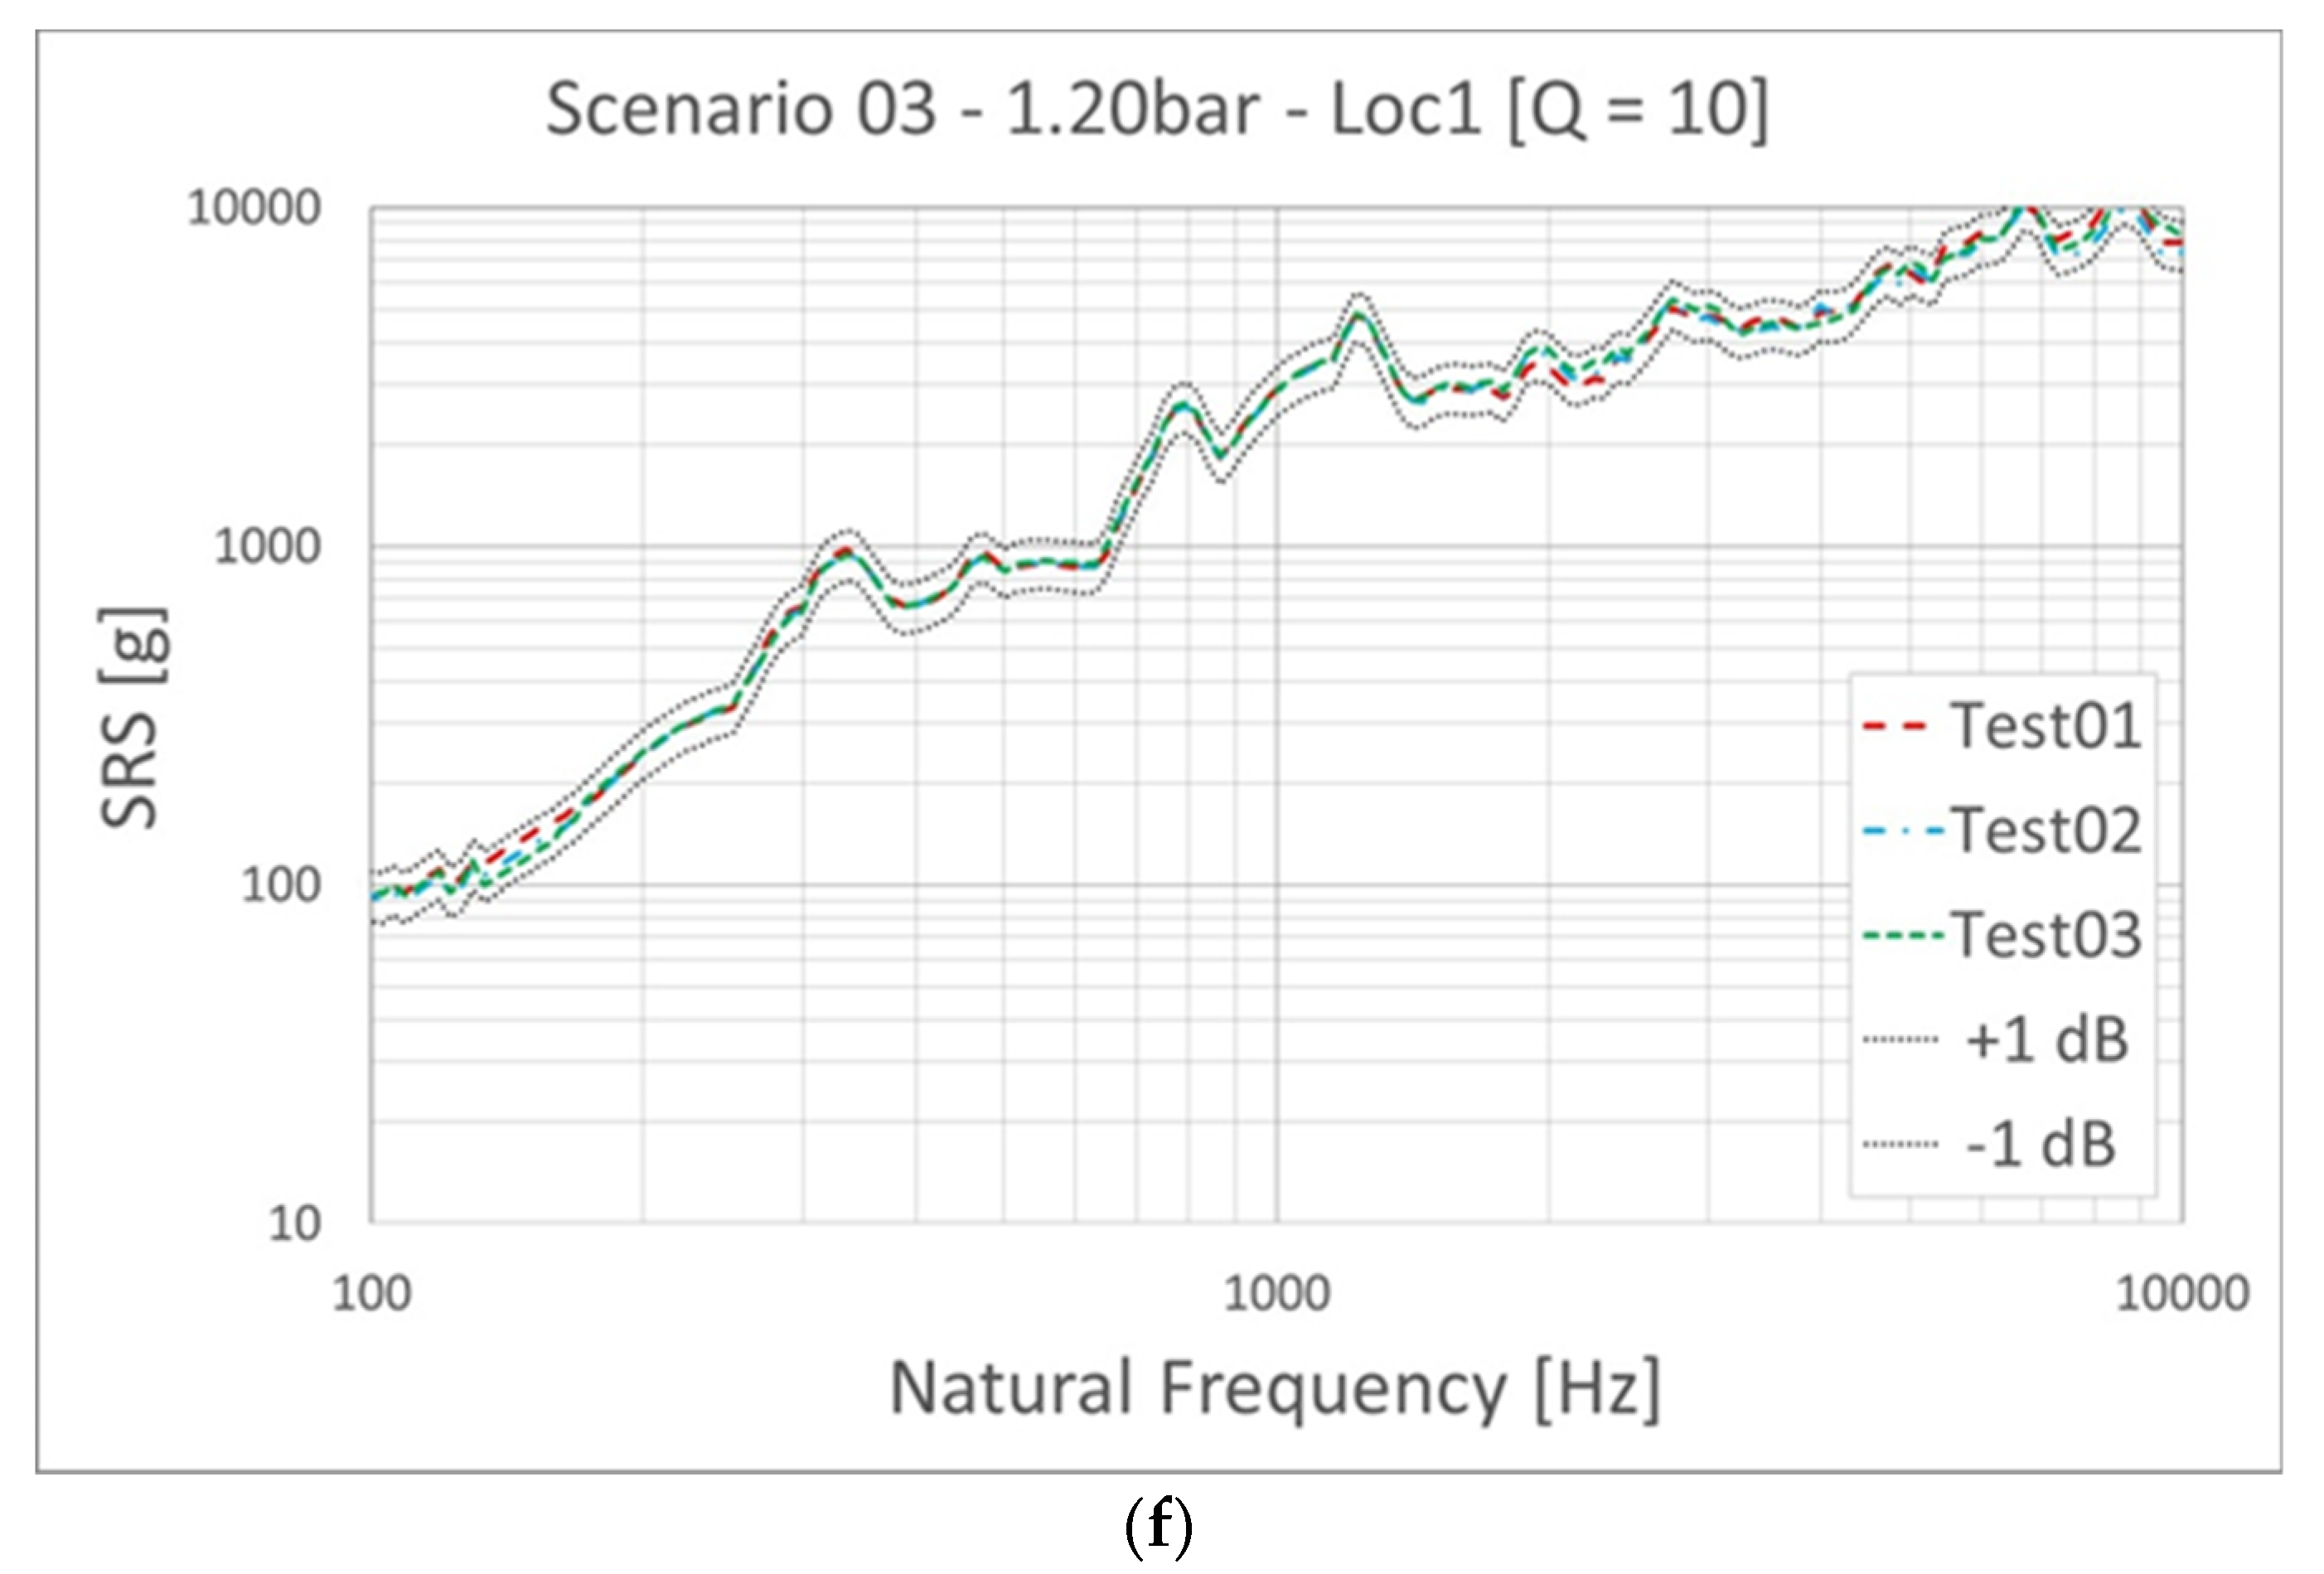
In order to ensure the repeatability of the shocks, we implement 3 successive tests with the same test parameters to create a Shock Response Spectrum curve for the measured out-of-plane acceleration within a +/− 1 dB tolerance band throughout the whole frequency range. It is observed that the system has the desired repeatability in general, according to the SRS curves presented in Figure 4. However, Scenario 06 is an exception, where 2 successive tests agree with each other while the third one is far from agreement, with an unrealistic SRS curve. Thus, the third case for Scenario 06 is disregarded for the FE simulation–experiment correlation study. A detailed survey on the accelerometer after that test reveals that it is short-circuited and does not give the correct acceleration results for the very last test. This situation shows the importance of the repeatability check of SRS curves ones more. Apart from the third test of Scenario 06, small deviations occur for one of the third tests of both Scenario 02 and 05 in the range of 7–10 kHz, but they are still within the tolerance band. These aspects are taken into consideration in the correlation work presented in the following sections.
3. Explicit Finite Element Simulations
As a numerical analysis tool, an explicit finite element solver, LSTC LS-DYNA, is preferred here. Explicit solvers are superior to implicit ones if highly non-linear loadings and complex non-linear contacts are present in the model, as in the case of the pyroshock test system (see, e.g., [25]). However, the results of the explicit finite element analyses should be evaluated carefully since they are conditionally stable and converge if the respective CFL condition is satisfied. Moreover, they present a result indicating whether it is reasonable or not, contrary to implicit non-linear solutions. Therefore, the results should be correlated with the experiments before they are taken into consideration, as done in the current work.
The finite element model of the experimental system includes the resonant plate, the projectile and the measurement adaptor plate used to place the accelerometer, as shown in Figure 5. The model mainly consists of reduced integration 2D shell and 3D brick elements. M8 bolts, which connect the measurement plate to the resonant plate, are modeled with the CNRB (Rigid Connection)—Beam Element—CNRB technique. The pneumatic gun and other system elements are not modeled at all for the sake of simplicity. Thus, the projectile is modeled at the very moment of collision. An initial velocity is imposed to the projectile with the *INITIAL VELOCITY GENERATION card of LS-DYNA, according to the values measured from the first set of experiments that are presented in Section 2.
The corner spring that supports the resonant plate is not included in the FE model and no constraint is imposed on the connection points due to the fact that, in the real system, the resonant plate is loosely connected to the supporting bolt–spring system for in-plane directions. It is supported by the springs in the vertical direction but this effect is not modeled either, since it is concluded that they are not relevant to the acceleration results of the points of interest.
The mass of the accelerometer and its stiffness contribution to the system are negligible compared to the other elements; therefore, it is not modeled physically. However, a rigid element is added to the hole, which is screwed in the experiments, and the acceleration data are extracted from the midpoint of this rigid connection element. In this way, it is possible to average the acceleration of several nodes on the hole surface and to prevent a local unphysical acceleration peak that might arise due to the consideration of only a single node.
Element size differs throughout the model, from 15 mm for the projectile to 10 mm for the resonant plate and 5 mm for the measurement plate. For the parts where the wave propagation is critical, namely the resonant plate and the measurement plate, the mesh is fine enough to have at least 10 elements per wave length for the maximum frequency under consideration, as recommended in the literature (see, e.g., [26]). All materials are modeled as linear elastic since no plastic deformation is expected to occur in the simulations presented in the paper, which is valid for the performed experiments as well.
3.1. Parameter Sensitivity Simulations
The ringing plate-type pyroshock test systems are well studied in the literature, both experimentally and numerically; thus, the effects of the test system performance parameters such as projectile weight, resonant plate size and thickness, impact velocity, etc., are well known. However, the specifications that have importance for a successful explicit simulation, such as contact and damping parameters, are not well studied and their practical effects in a pyroshock FE simulation–experiment correlation process are not clearly known. Therefore, it is necessary to conduct sensitivity simulations and evaluate the influence of these parameters on the SRS curves prior to the correlation process.
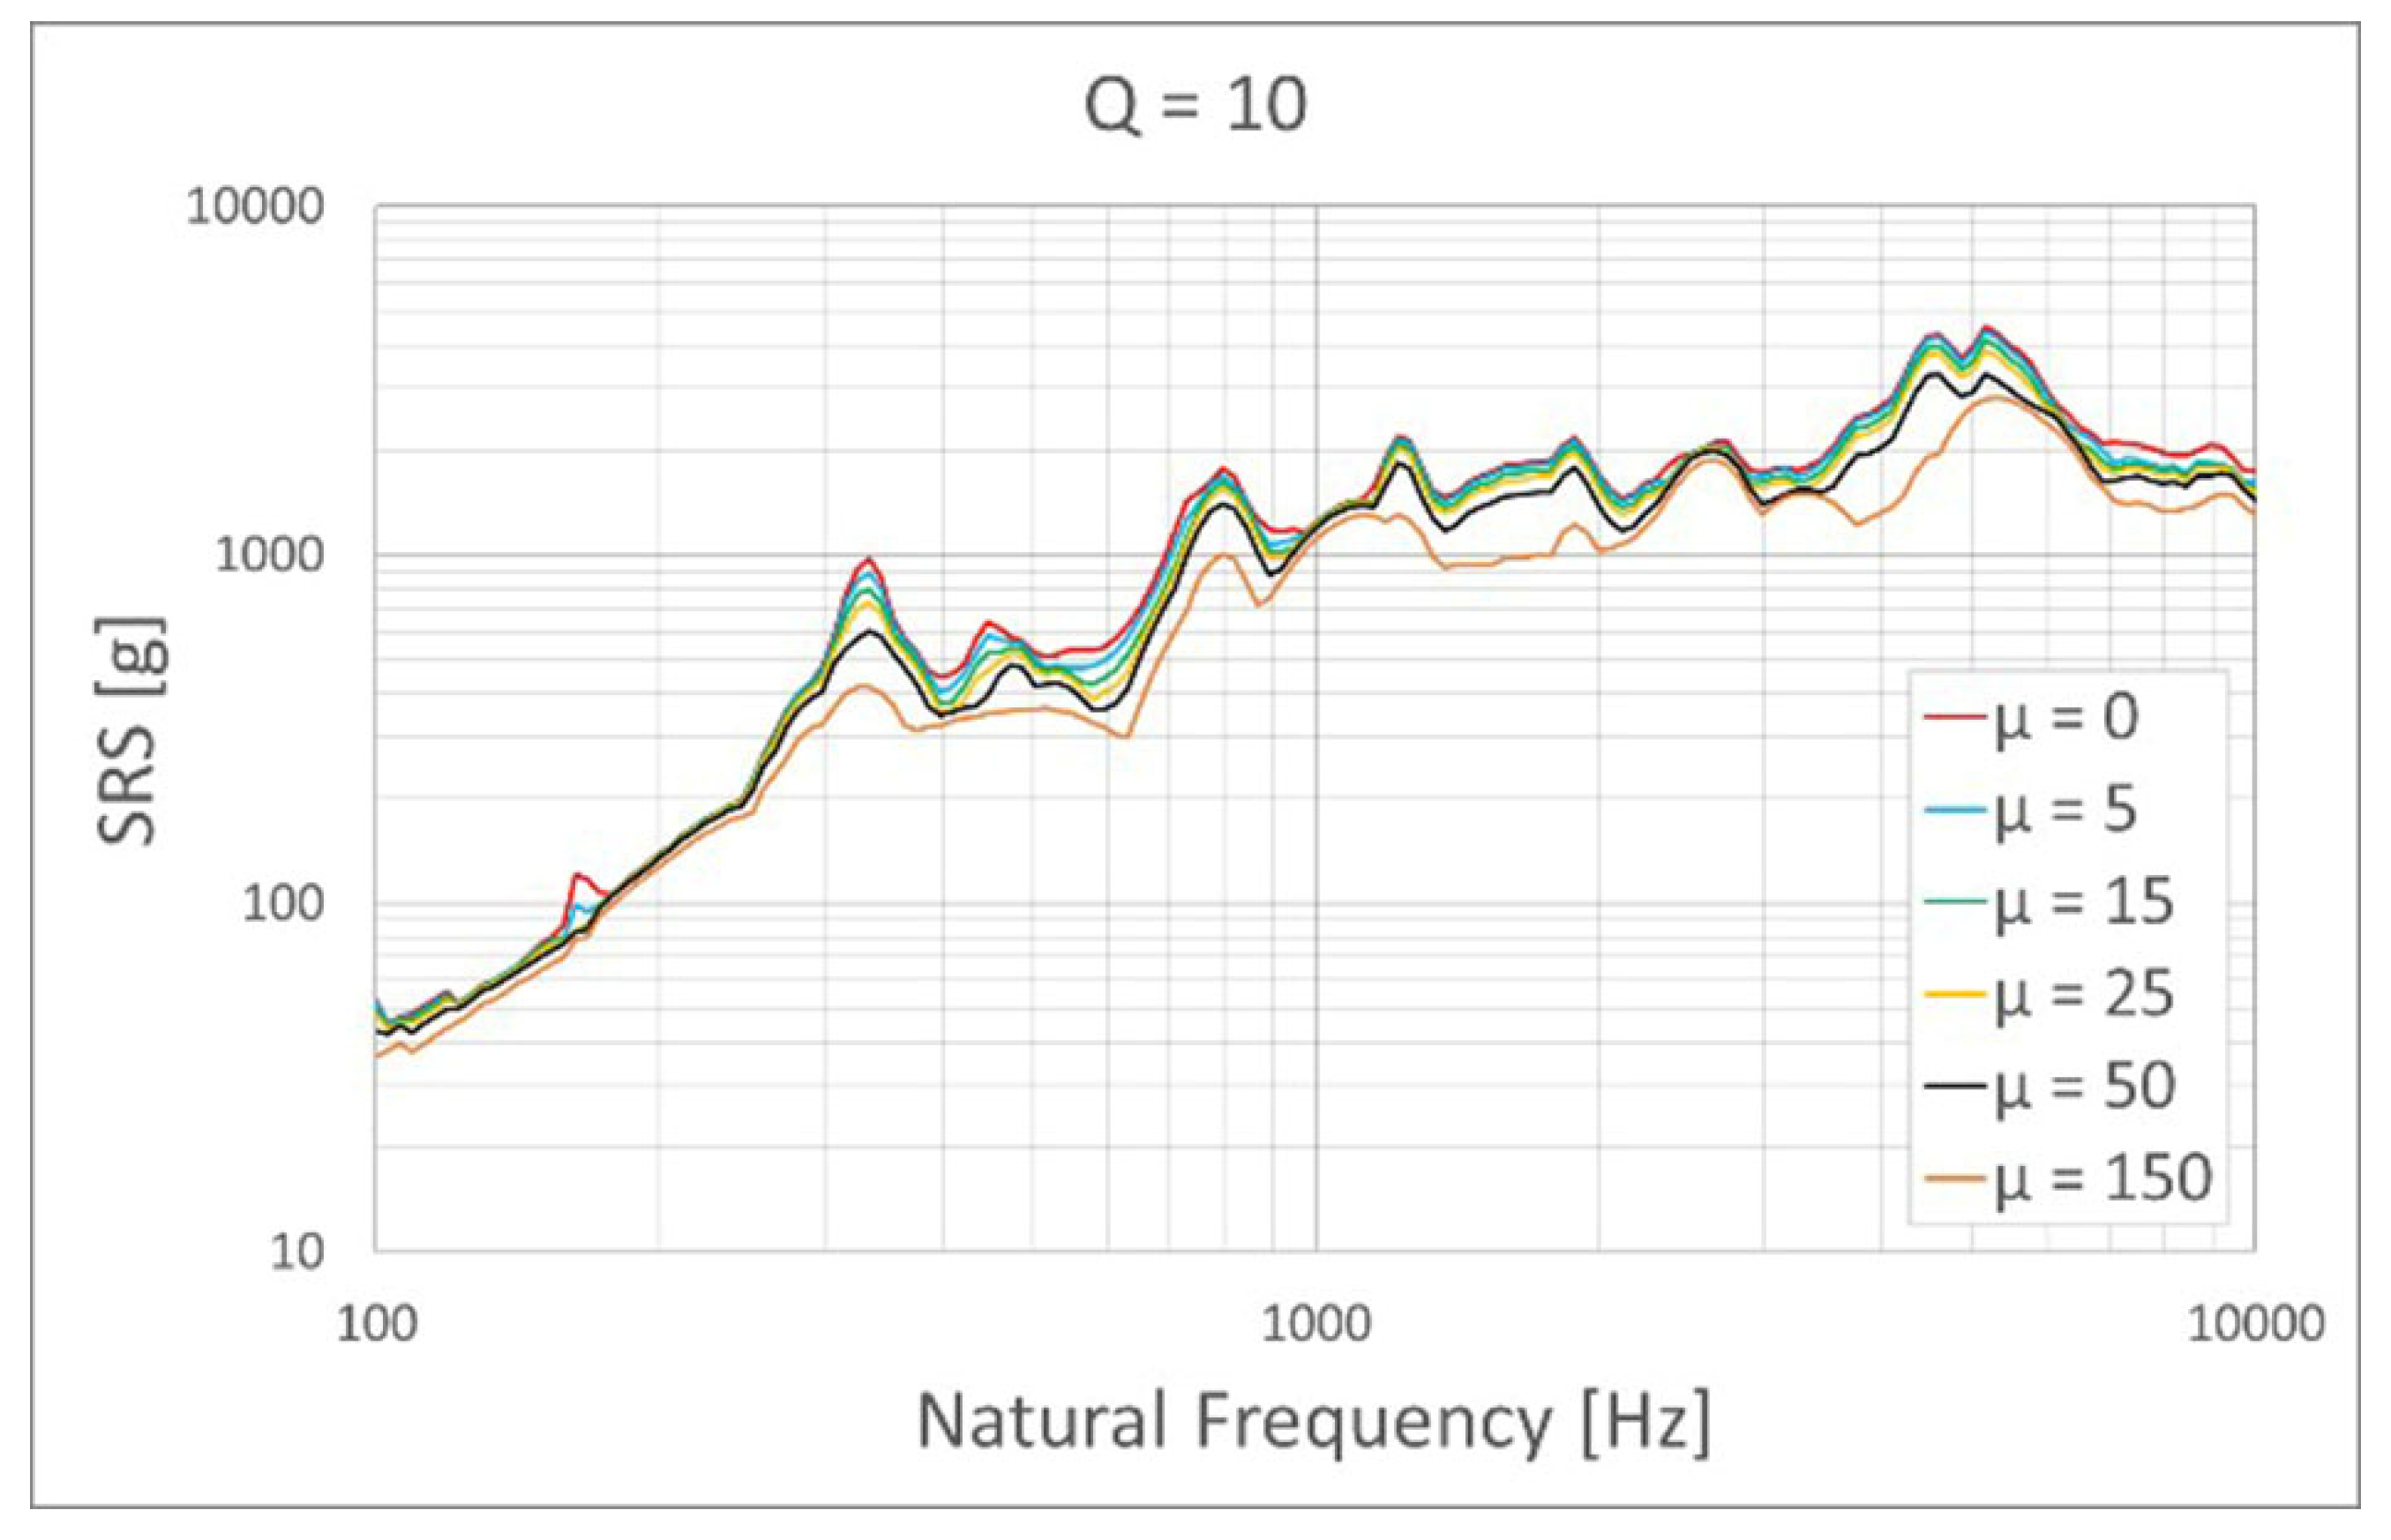
Firstly, the damping parameters are studied thoroughly since they seem to be critical so as not to overestimate the amplitudes in an SRS curve. Although there are different damping alternatives that a user can activate, originally, LS-DYNA solves an undamped dynamic transient system. One of these options is the classical Rayleigh damping, which is based on the stiffness and the mass of the system. It uses a system damping matrix C defined as:
where µ is the mass proportional Rayleigh damping coefficient, M is the system structural mass matrix, λ is the stiffness proportional Rayleigh damping coefficient, K is the system structural stiffness matrix.
Rayleigh damping is utilized with the *DAMPING STIFFNESS and *DAMPING GLOBAL card sets in LS-DYNA. Two sets of analyses are performed with different mass and stiffness matrix ratios while keeping all other parameters constant in order to isolate the effect of the specific damping parameters. The results are evaluated and compared in the form of SRS curves extracted from location 1.
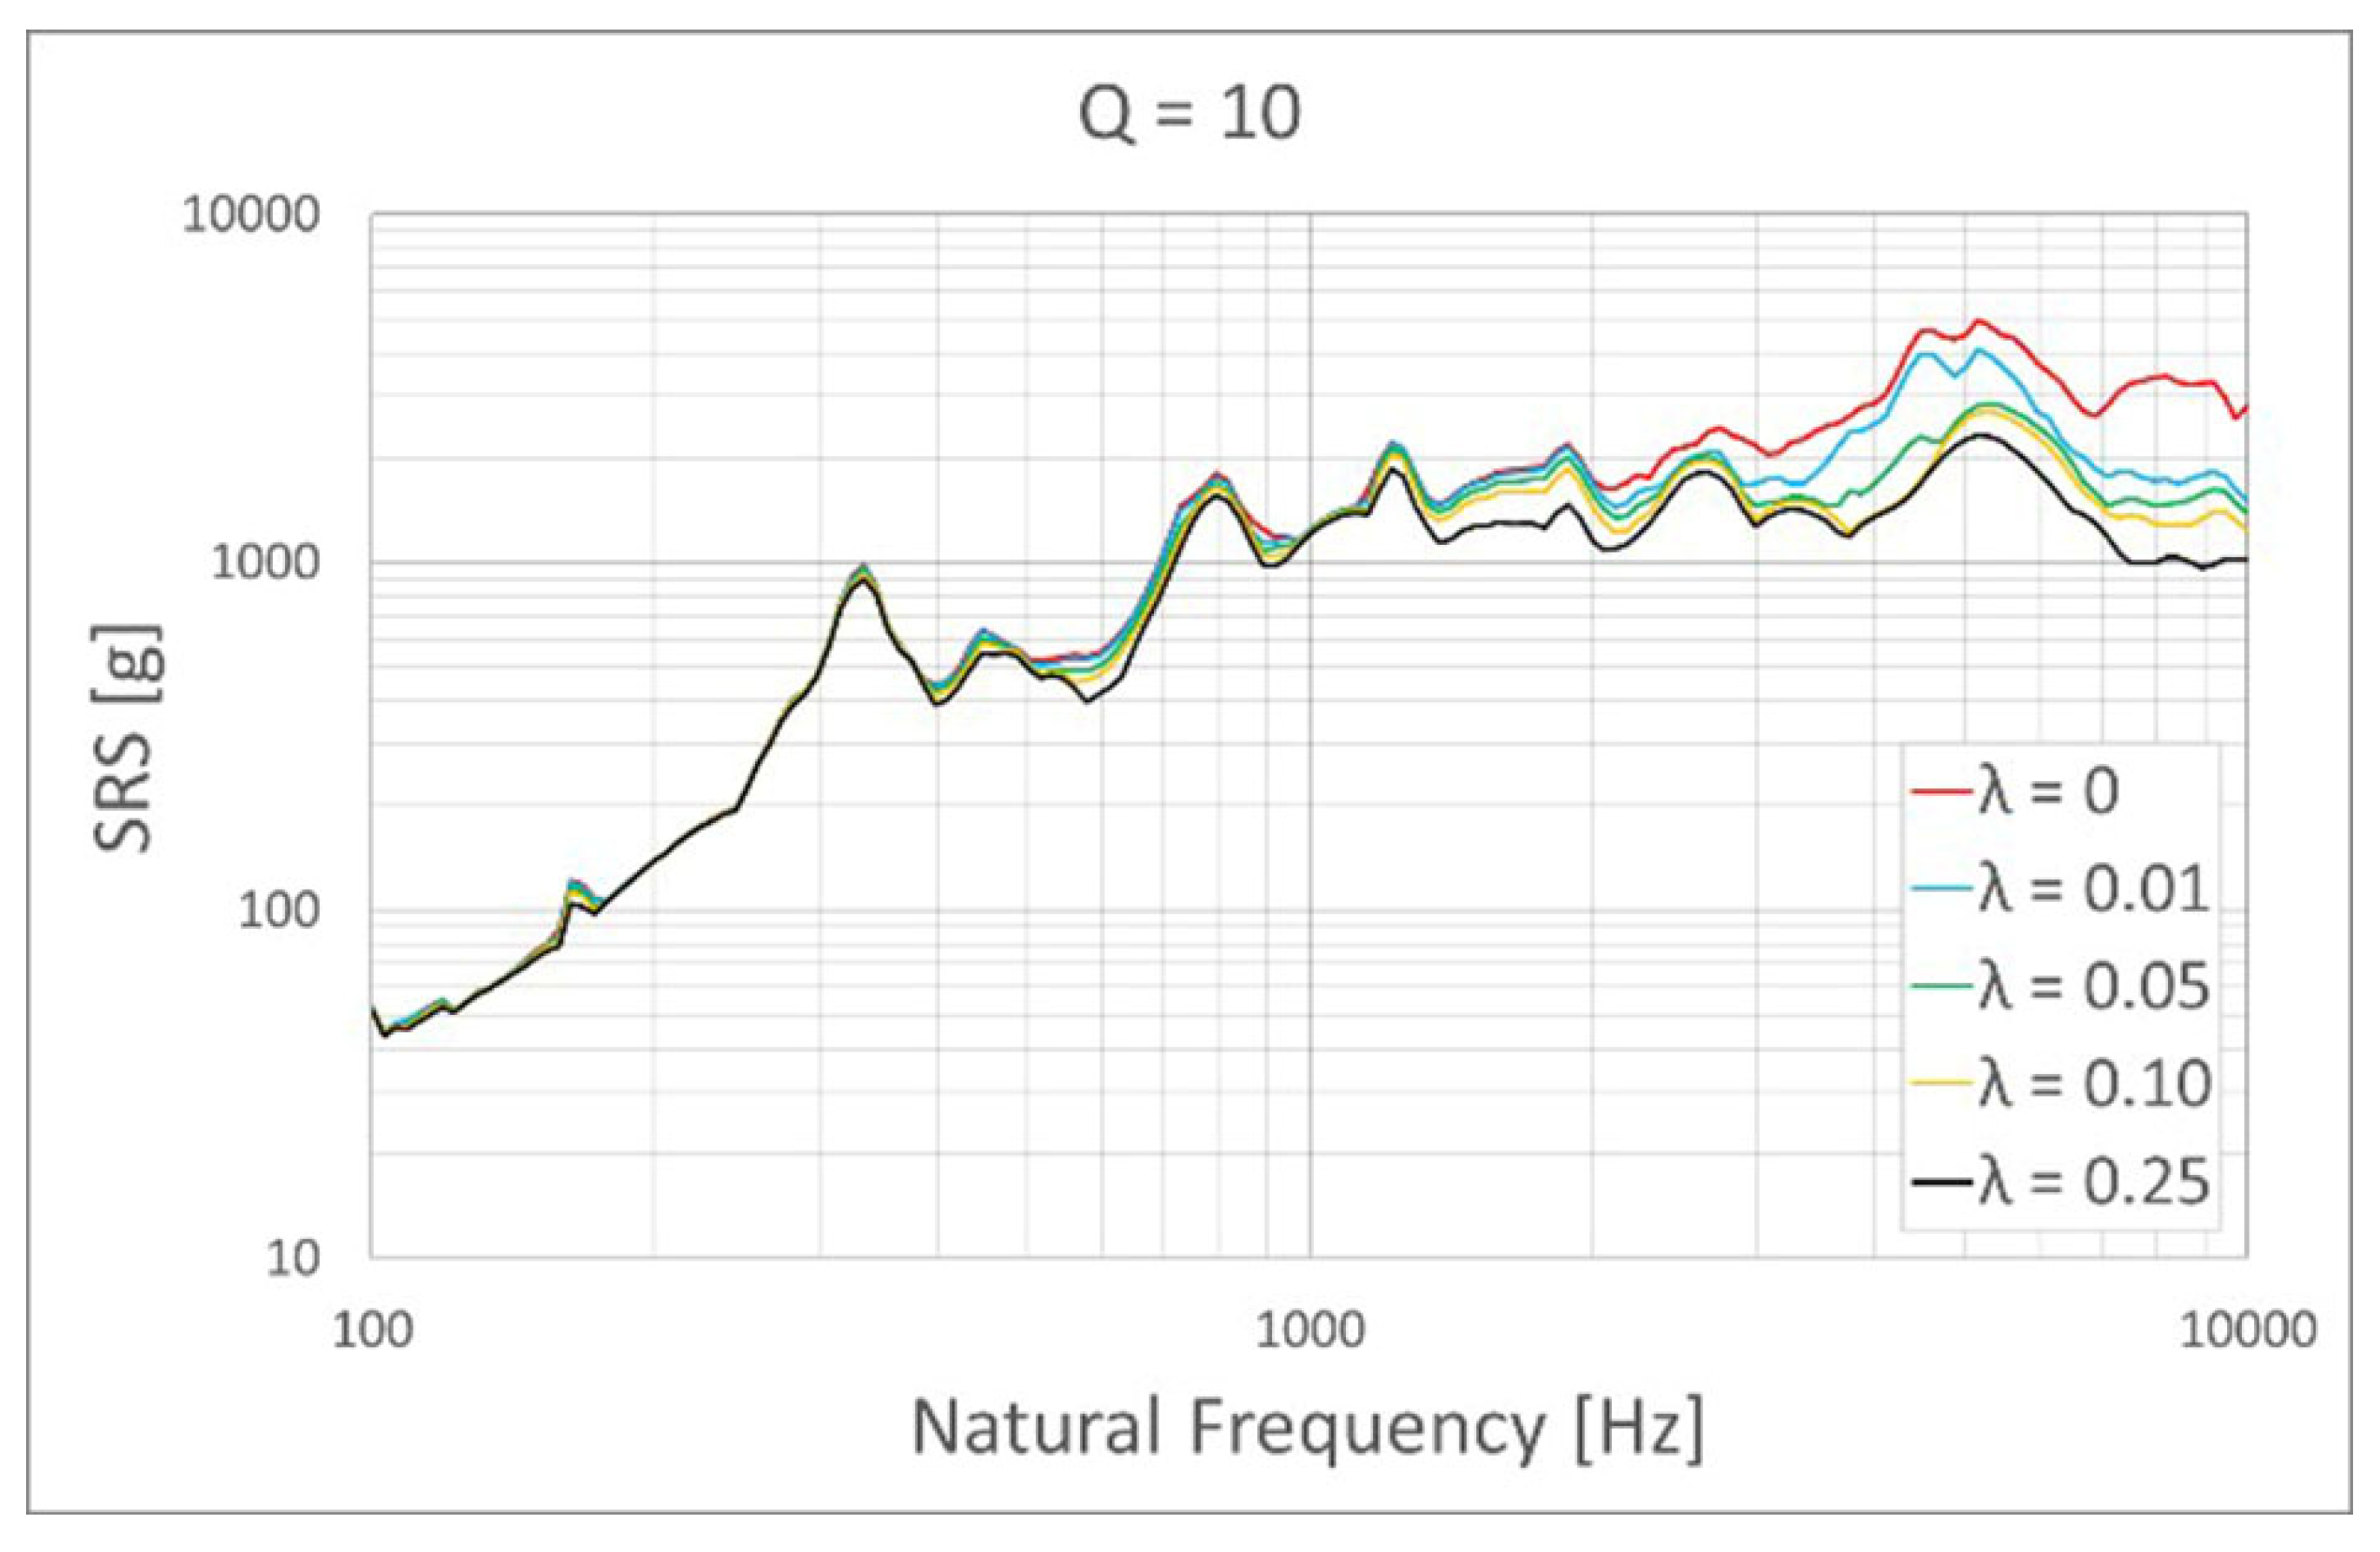
Different values of mass proportional damping are simulated and compared in Figure 6. It is obvious that mass damping decreases the acceleration levels throughout the whole frequency region, and it softens the peaks in the SRS curve, caused by the natural frequencies of the system. It also causes a shift in the frequency of several peak accelerations, but this effect is significant only for high damping levels, as it is only seen in the µ = 150 damping level.
Various values of stiffness proportional damping are utilized within another simulation set. Contrary to mass proportional damping, the effect of stiffness damping depends on the frequency level and it mostly affects the relatively higher-frequency domains, as shown in Figure 7. Up to the knee frequency, which is roughly 1 kHz for this test setup, there is minimal influence on the SRS curves. Only the amplitudes on some of the troughs decrease in this frequency range. However, it has a gradual effect after the knee frequency in the form of decreasing the amplitude and smoothing over the peaks. At the high damping levels, it even causes the data to plateau and all its characteristics are lost from the value of λ = 0.25 at frequencies higher than 7.5 kHz.
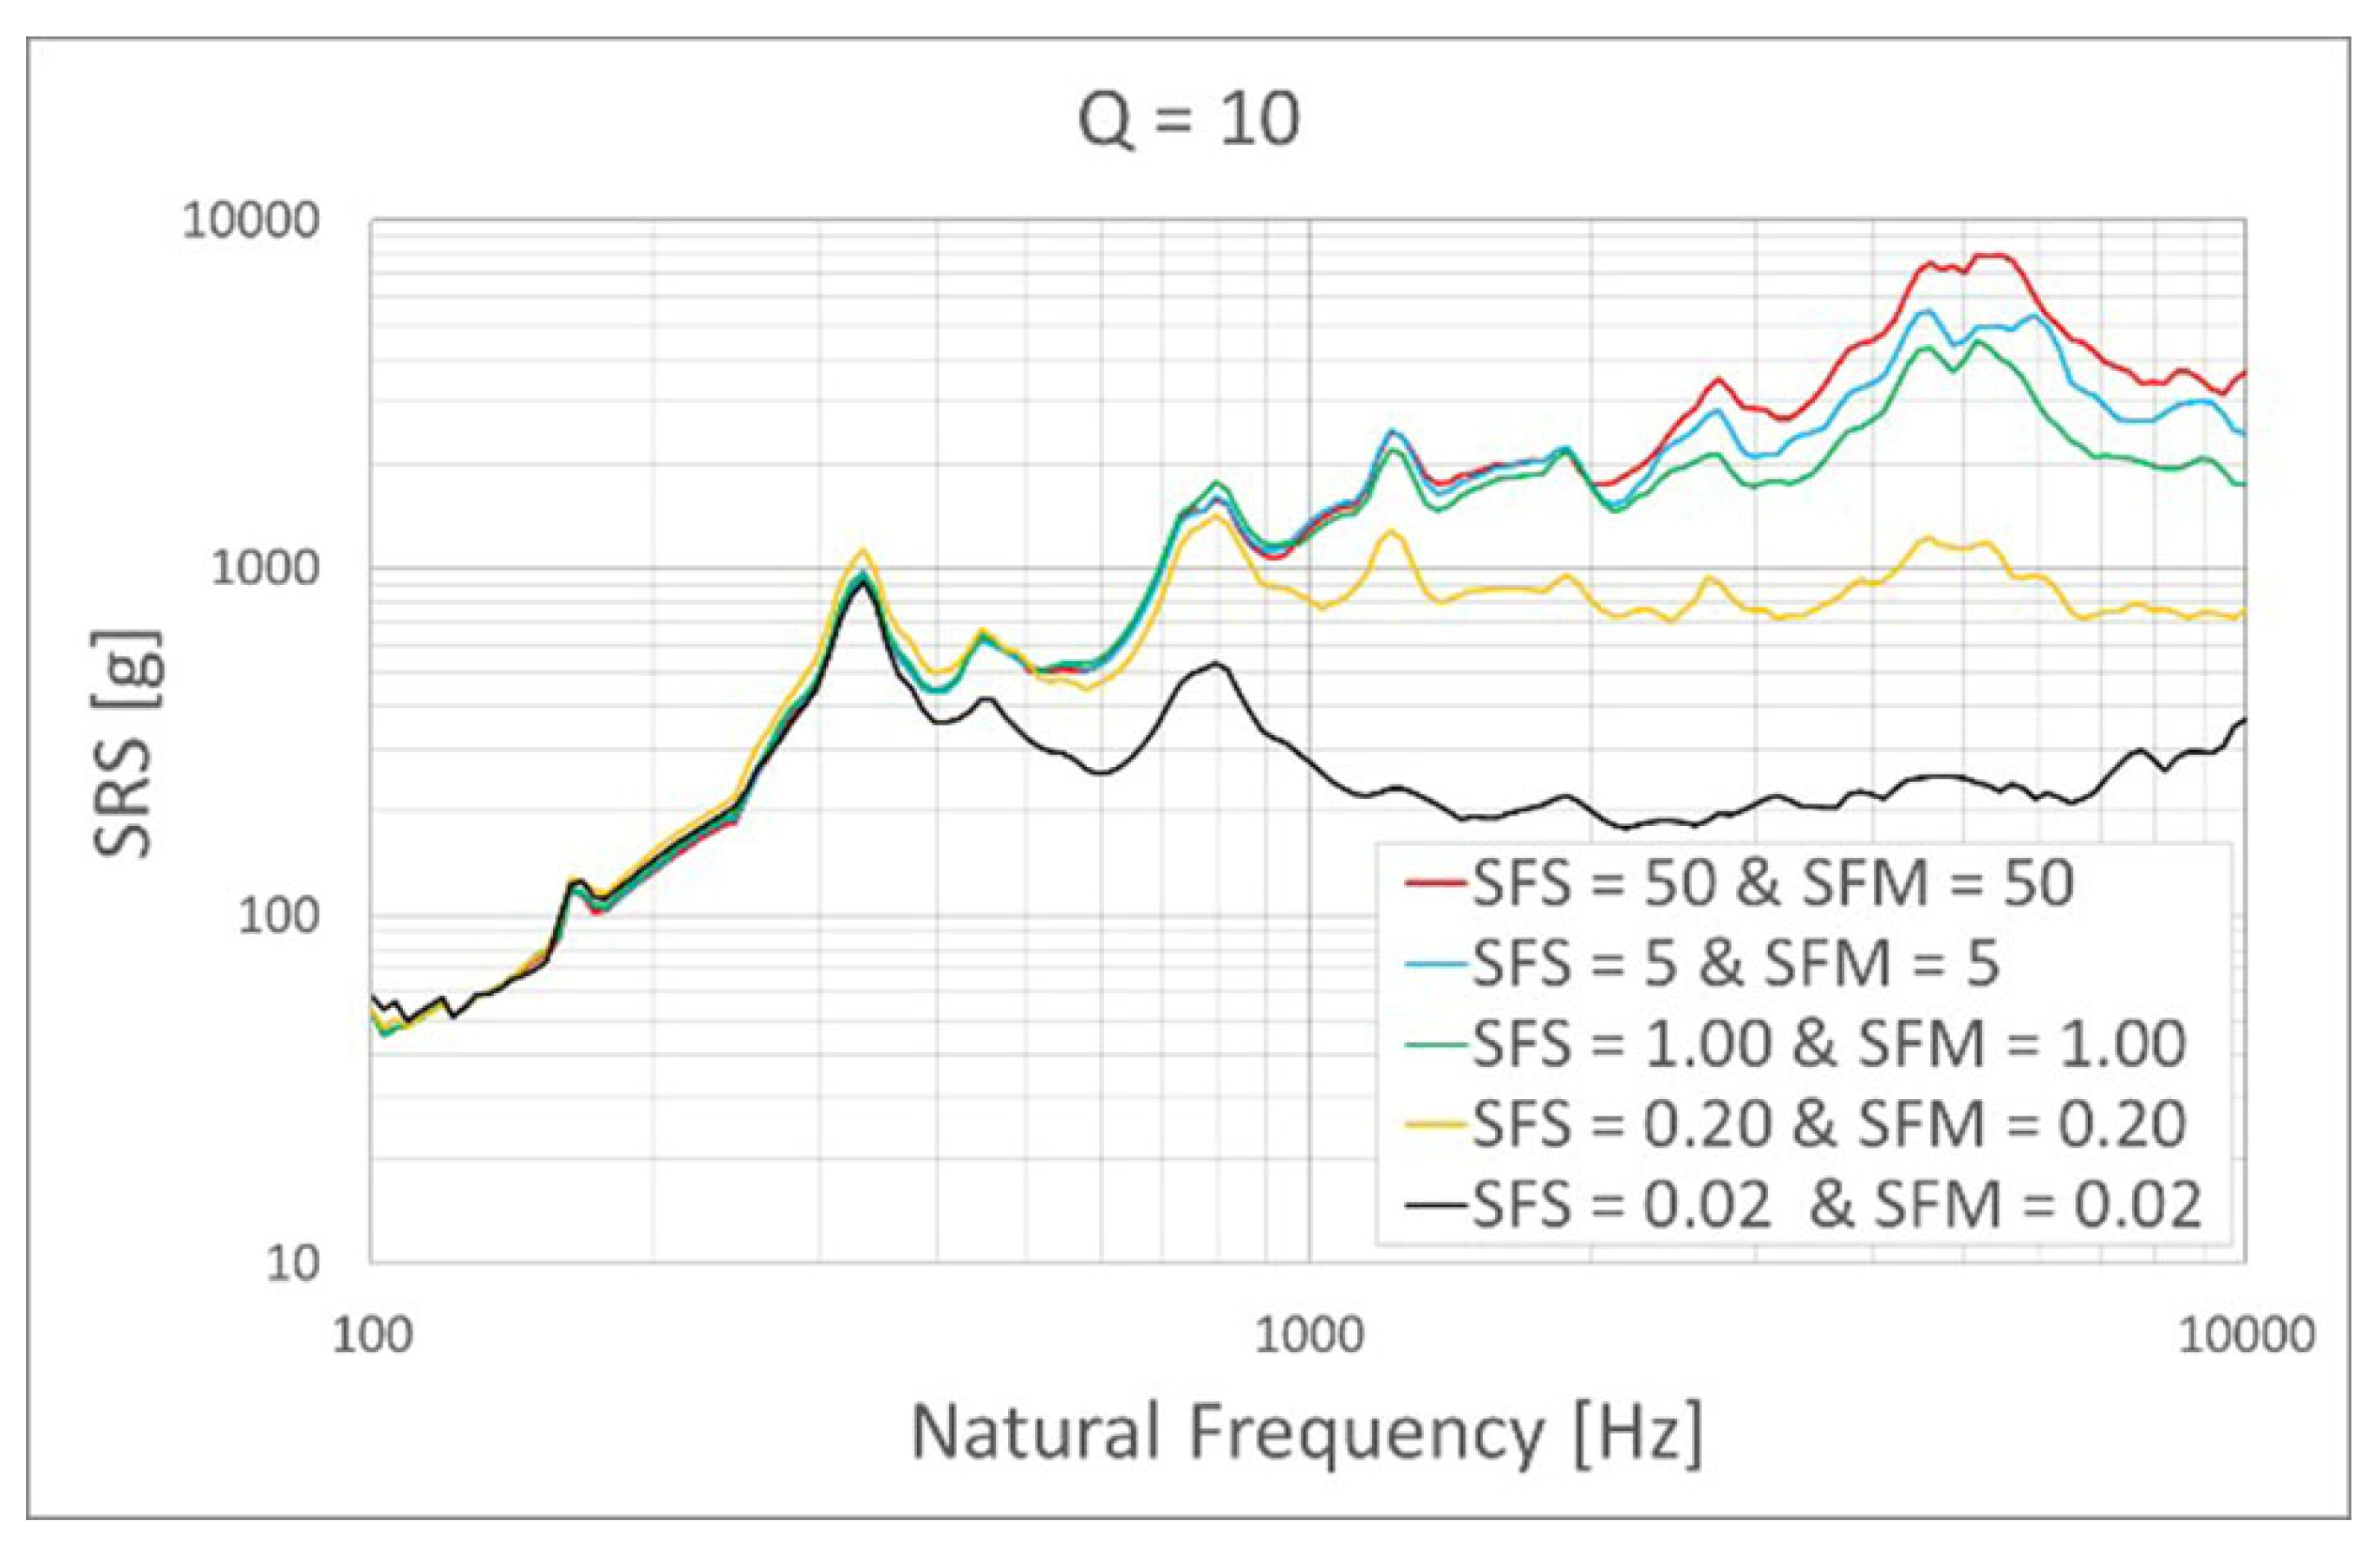
In the FE computations of pyroshock systems, the load transfer issue requires special attention, i.e., transferring the load between the plates only via fasteners does not reflect the reality. It is vital to ensure surface-to-surface contact for all touching surfaces. It is observed in the experimental analysis that the different assembly configurations, such as assembling the measurement plate with three bolts instead of four or assembling it by placing additional bushes to prevent the contact between the plates, result in different SRS curves. For the simulation model presented in this section, there are two interfaces, i.e., the ones between the projectile and the resonant plate and between the resonant plate and the measurement plate. A penalty-based contact algorithm, the *CONTACT AUTOMATIC SURFACE TO SURFACE card, is utilized for both contact regions. It is based on a logic where springs are placed between the penetrating node and the penetrated surface so that the spring creates a force that pushes the node out of the penetrated surface. Since the stiffness of the spring directly affects the amplitude and the frequency content of the transmitted force from one surface to the other, it is critical to have the correct stiffness values for them. Different contact stiffness values are studied through SFS and SFM parameters, which directly scale the default contact stiffness calculated by LS-DYNA.
Simulations for the contact stiffness scale factor of 5, 50, 0.2 and 0.02 are performed and compared with the default value, which is the no scaling case in Figure 8. The parameters are changed for both contact interfaces equally.
The contact stiffness changes the resulting SRS curve dramatically, as presented in Figure 8. At the low-frequency range, between 100 and 250 Hz, the change has a negligible effect, while, for the higher values, the overall amplitude increases with the increasing contact stiffness. The effect is more dramatic for the high-frequency region. However, the contact stiffness and the amplitude are not directly proportional and the dependence is quite complicated. It is different for every frequency band and every scaling level. For instance, multiplying with 0.20 still maintains the general trend of default stiffness with lower amplitude, but multiplying with 0.02 creates an increasing trend between 7 and 10 kHz, even though overall amplitudes are much lower than the rest. The outcome of the sensitivity simulations and the values of the discussed numerical parameters and their effects are taken into consideration for the explicit FE simulations of the pyroshock experiments, which are presented in the next sub-section.
3.2. FE Simulation of Pyroshock Experiments
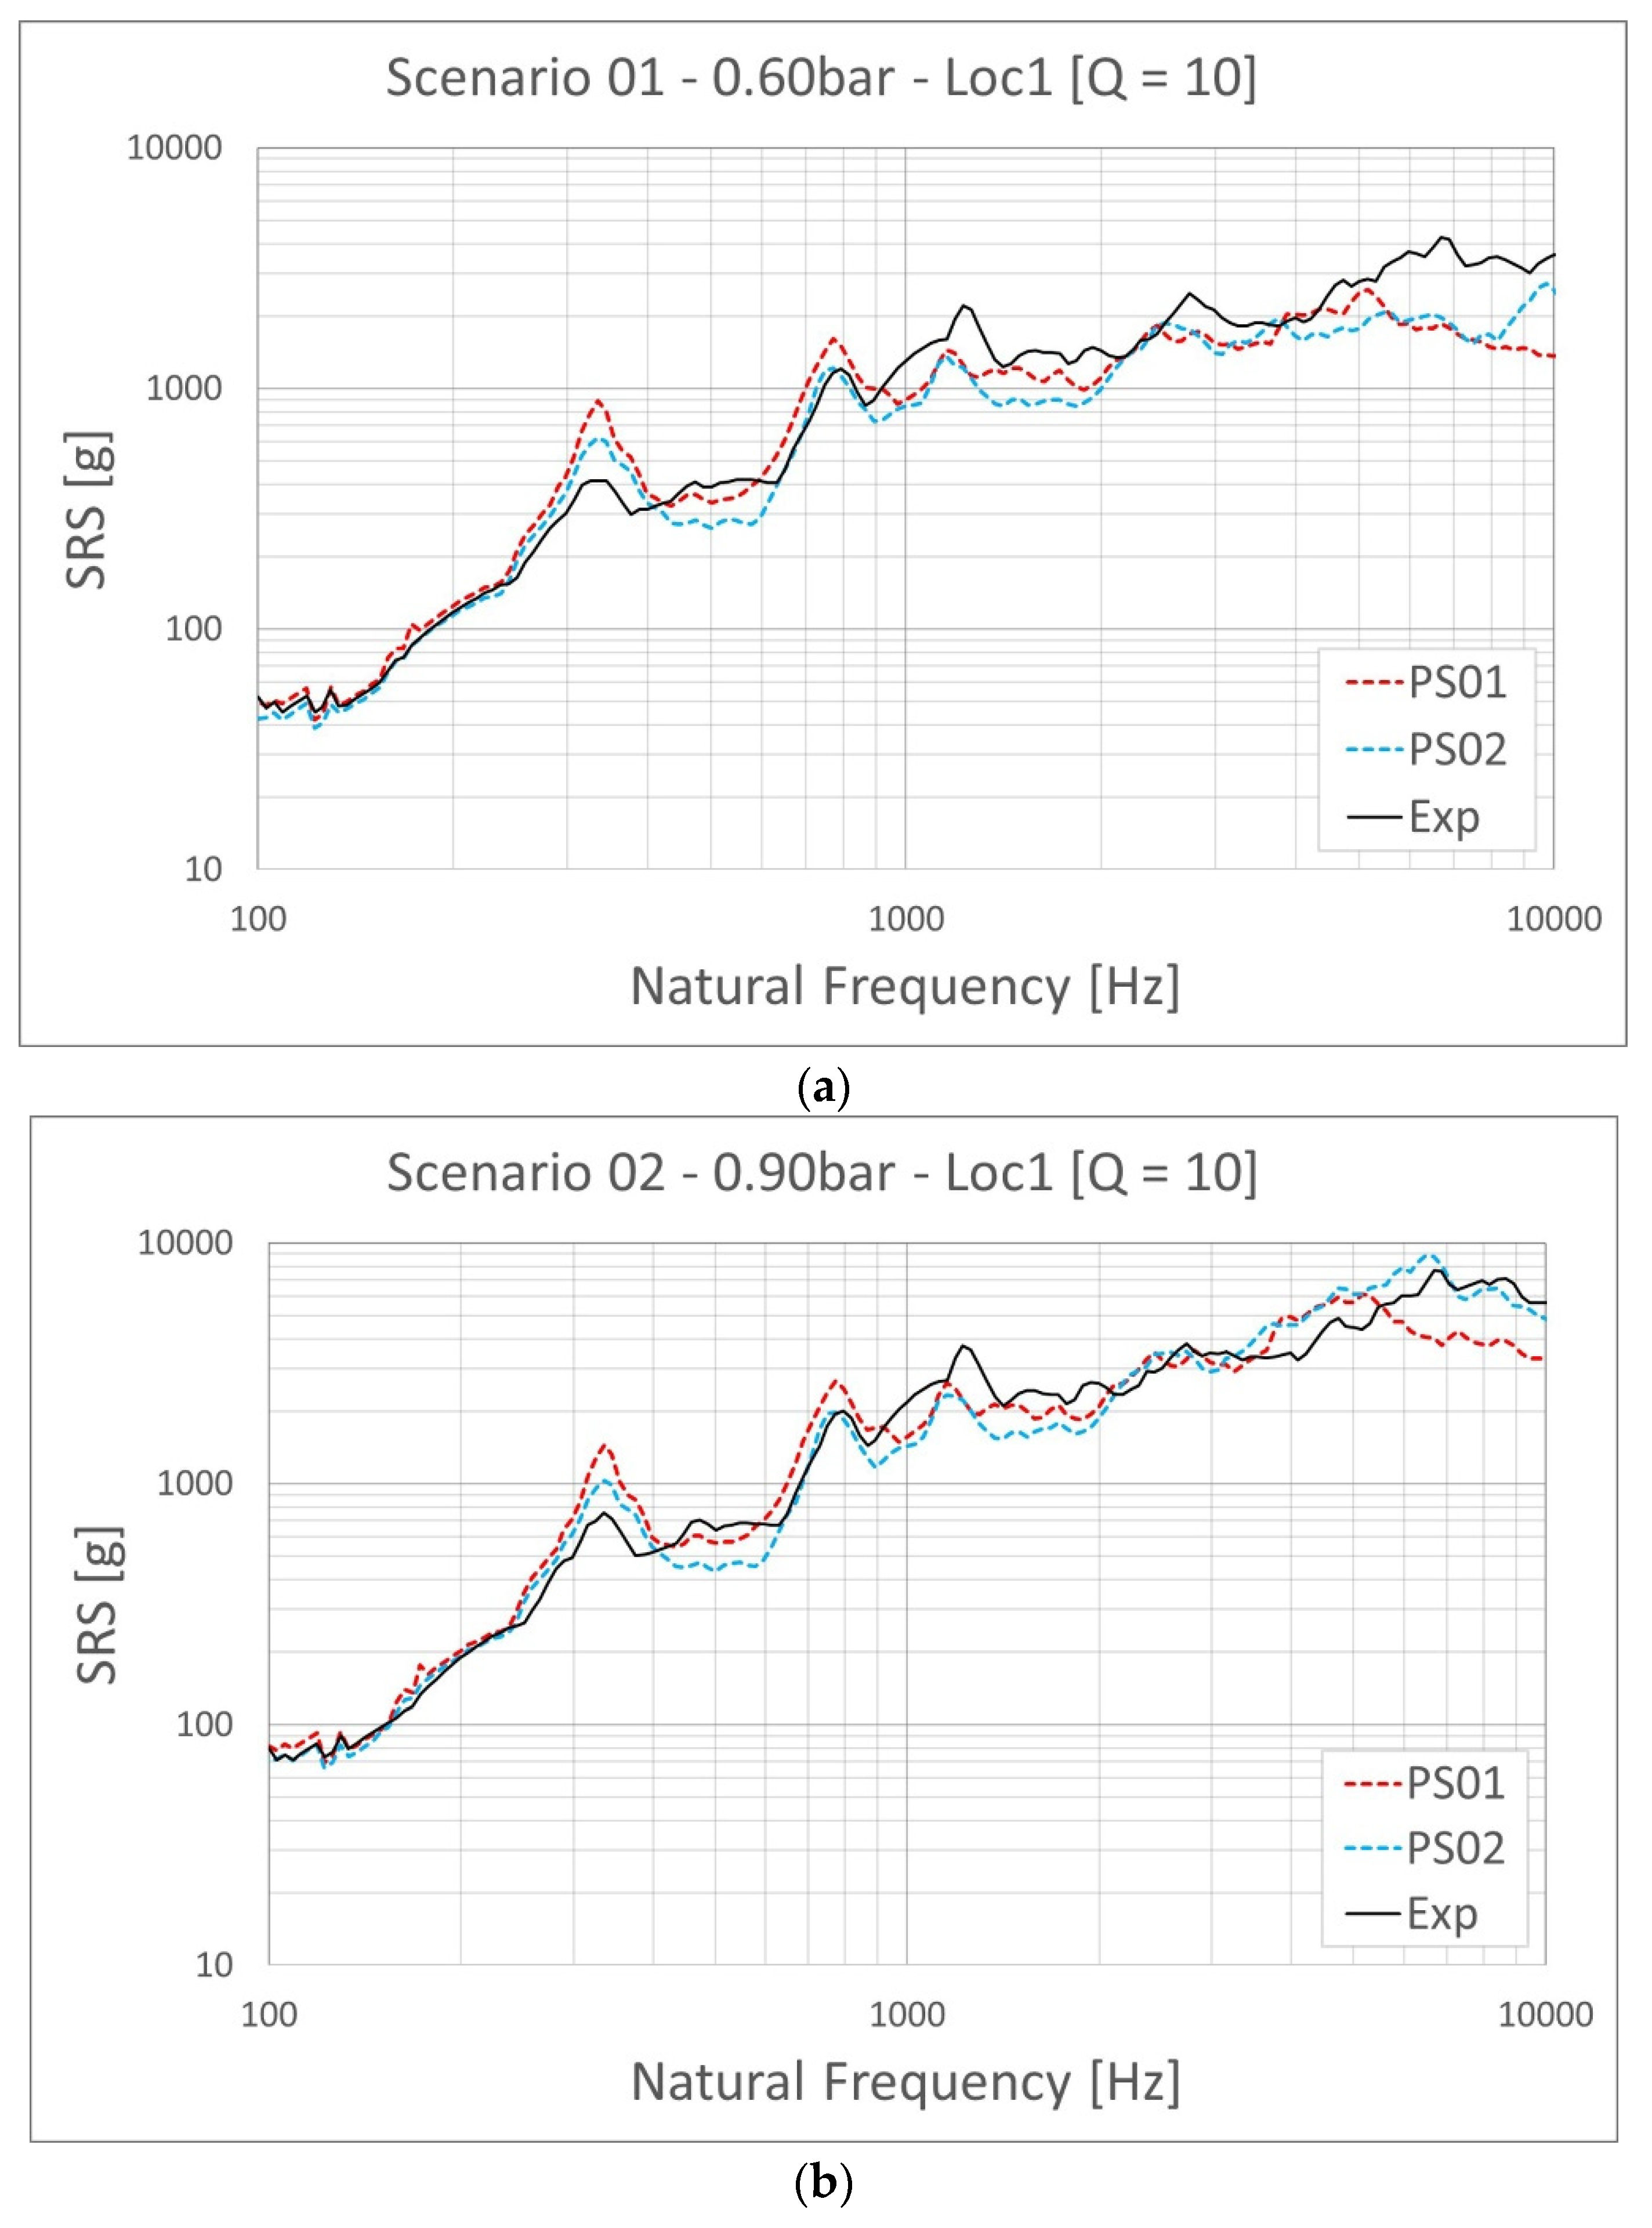
Several explicit FE simulations are performed for each test scenario presented previously in Section 2.2 to obtain a numerical framework representing the real test case with acceptable errors. As a starting point, the simulations for all six scenarios are performed with Parameter Set 01, which contains the default contact parameters and no damping at all. These simulations are labelled as PS01 and the results are presented in Figure 9 for different scenarios. A short evaluation reveals that the results show fair similarity with the experiments. However, for the lower frequency, even though the peaks coming from the natural frequencies of the resonant and the measurement plate seem to be captured, the amplitudes at these points are slightly different due to the damping existing in the real test system. For the high-frequency regime, the amplitudes are different for not only the peak points but also in the overall amplitude of the SRS curve. Moreover, while the trends of the SRS curves in the simulations are decreasing, the ones in the experiments are not. Considering the fact that there is no damping existing in the FE models with PS01, it is concluded that the two contact interfaces numerically damp the high-frequency content of the transmitted force. As mentioned in Section 3, a penalty base contact algorithm has no physical background for the force transmission; it creates fictional springs to represent the applied force of the touching surface.
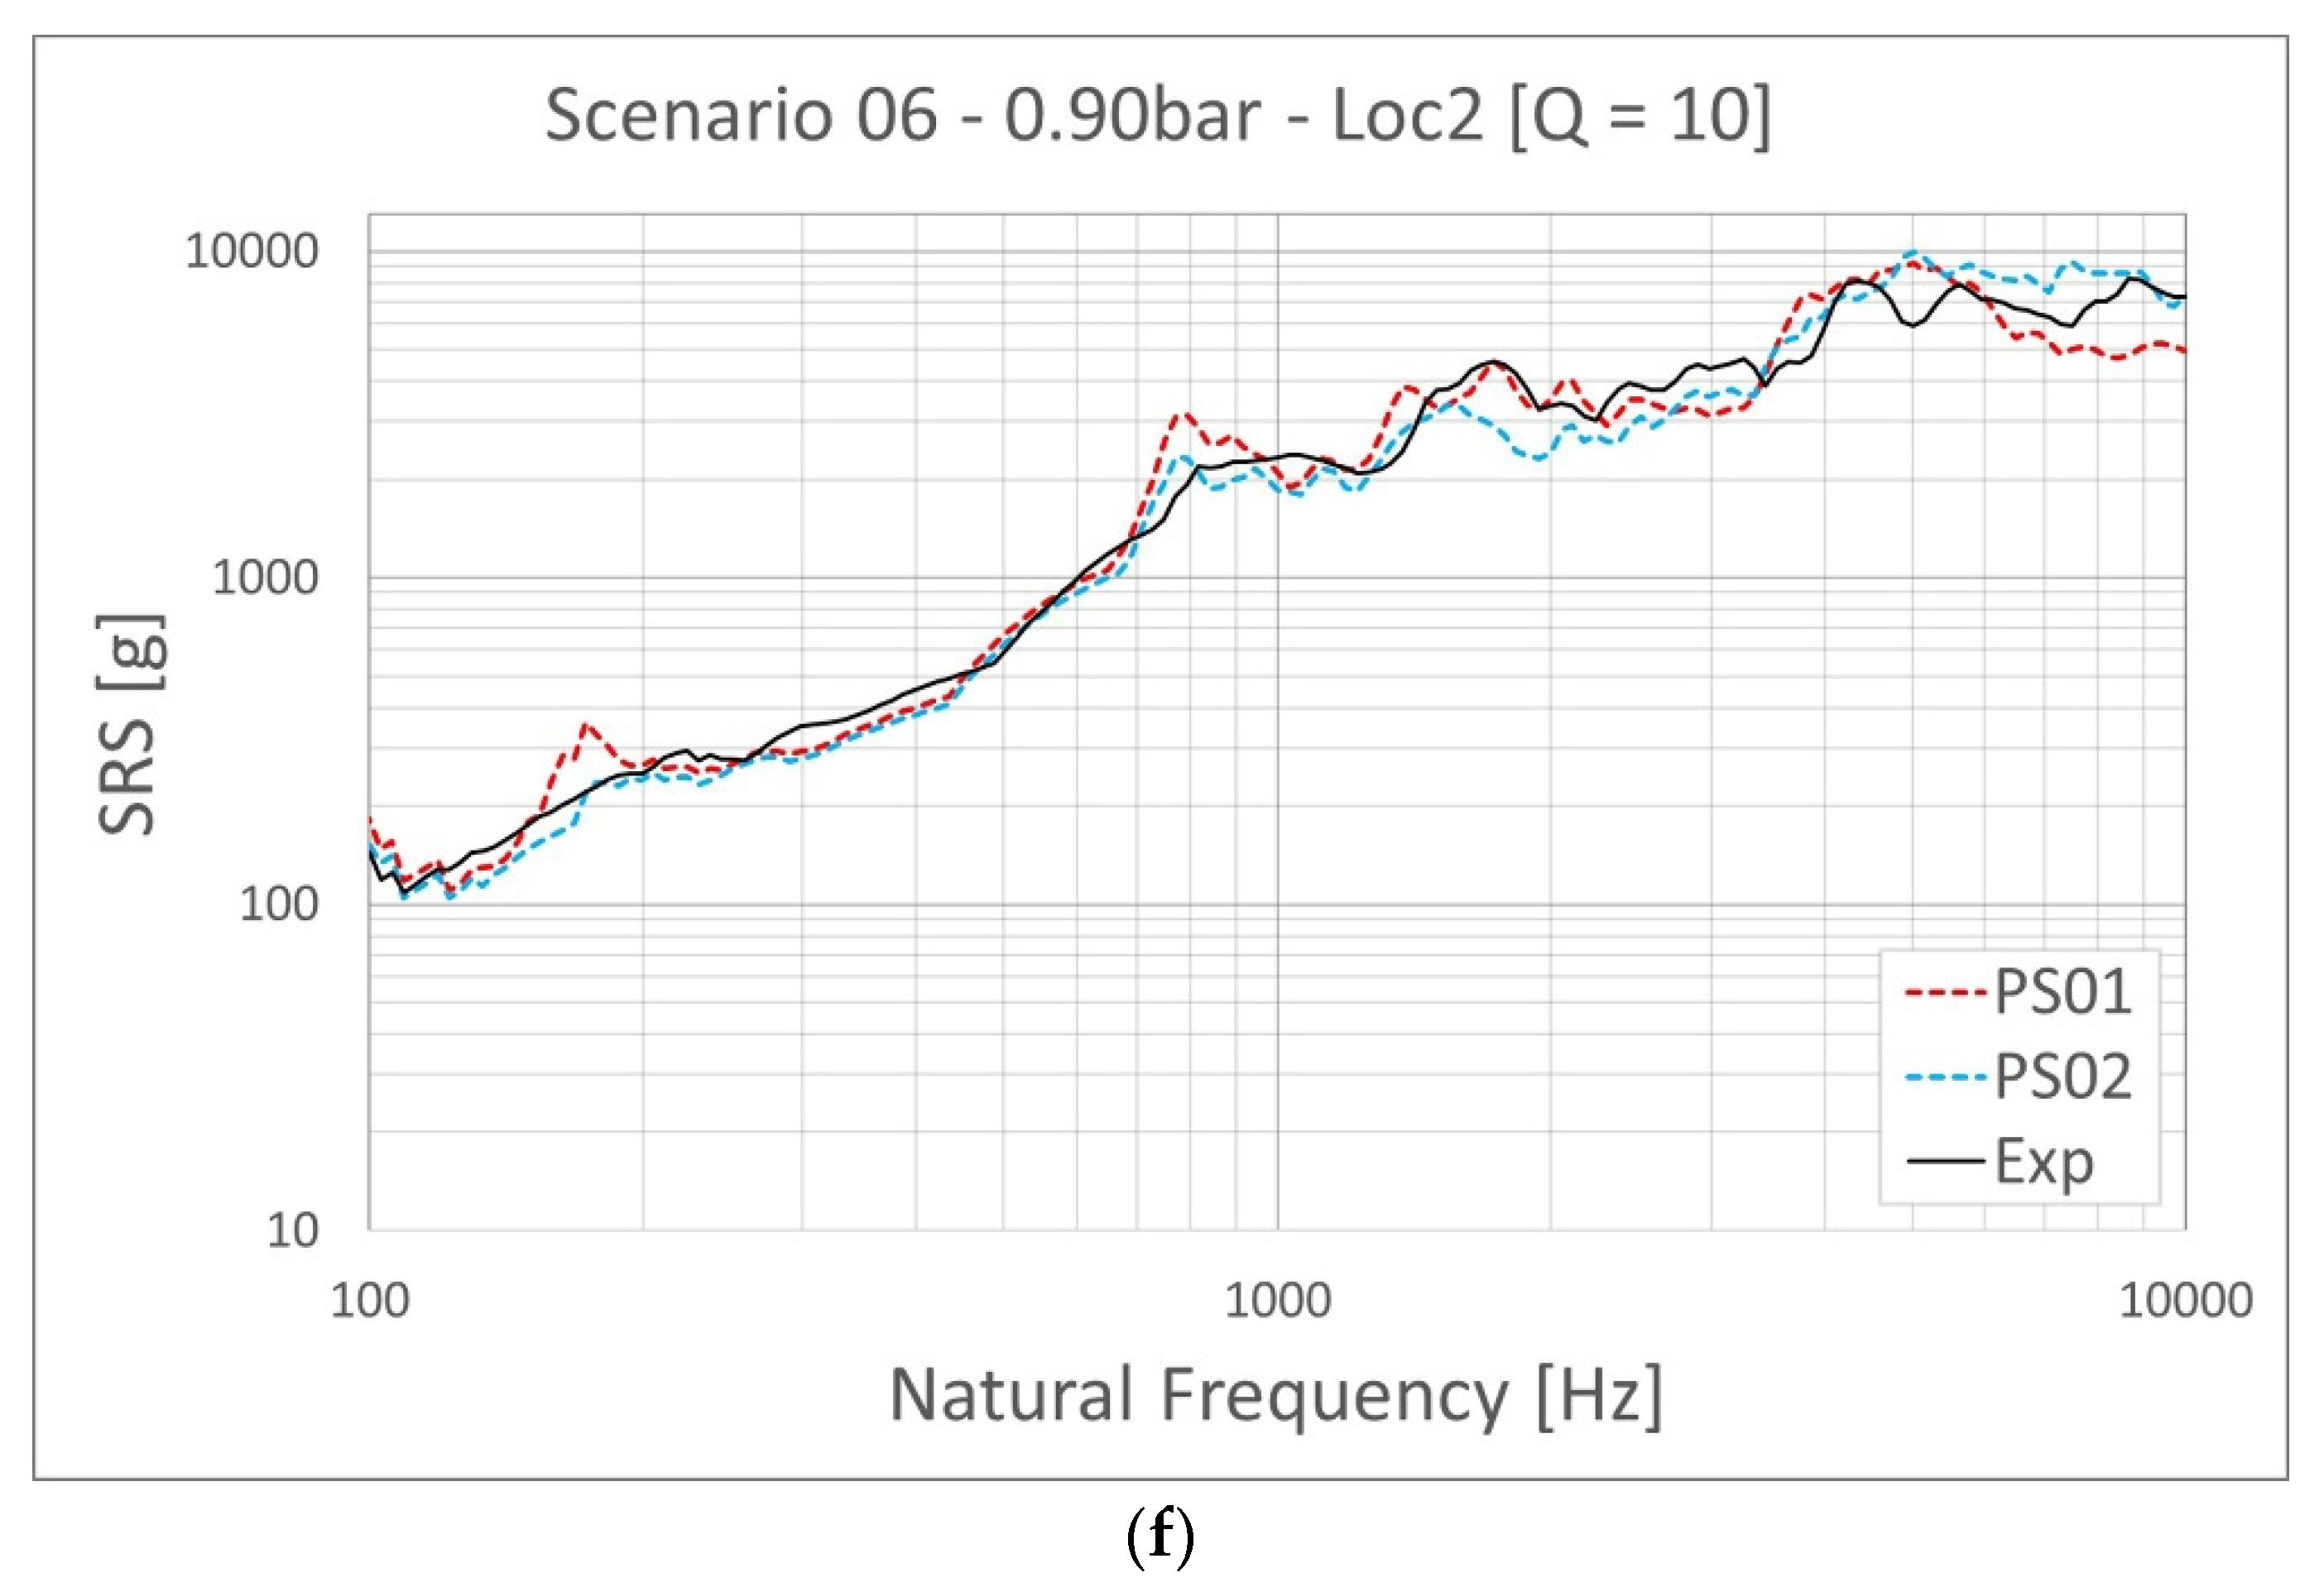
Since the main purpose of this study is to show and to evaluate the modeling potential of explicit FE simulations for a ringing plate pyroshock test system, the optimal parameter sets for the damping and contact algorithm are obtained through a parameter identification procedure, and the related results are labeled as PS02 and presented in Table 3. The simulations for all six scenarios are performed again and the comparison is presented in Figure 9.
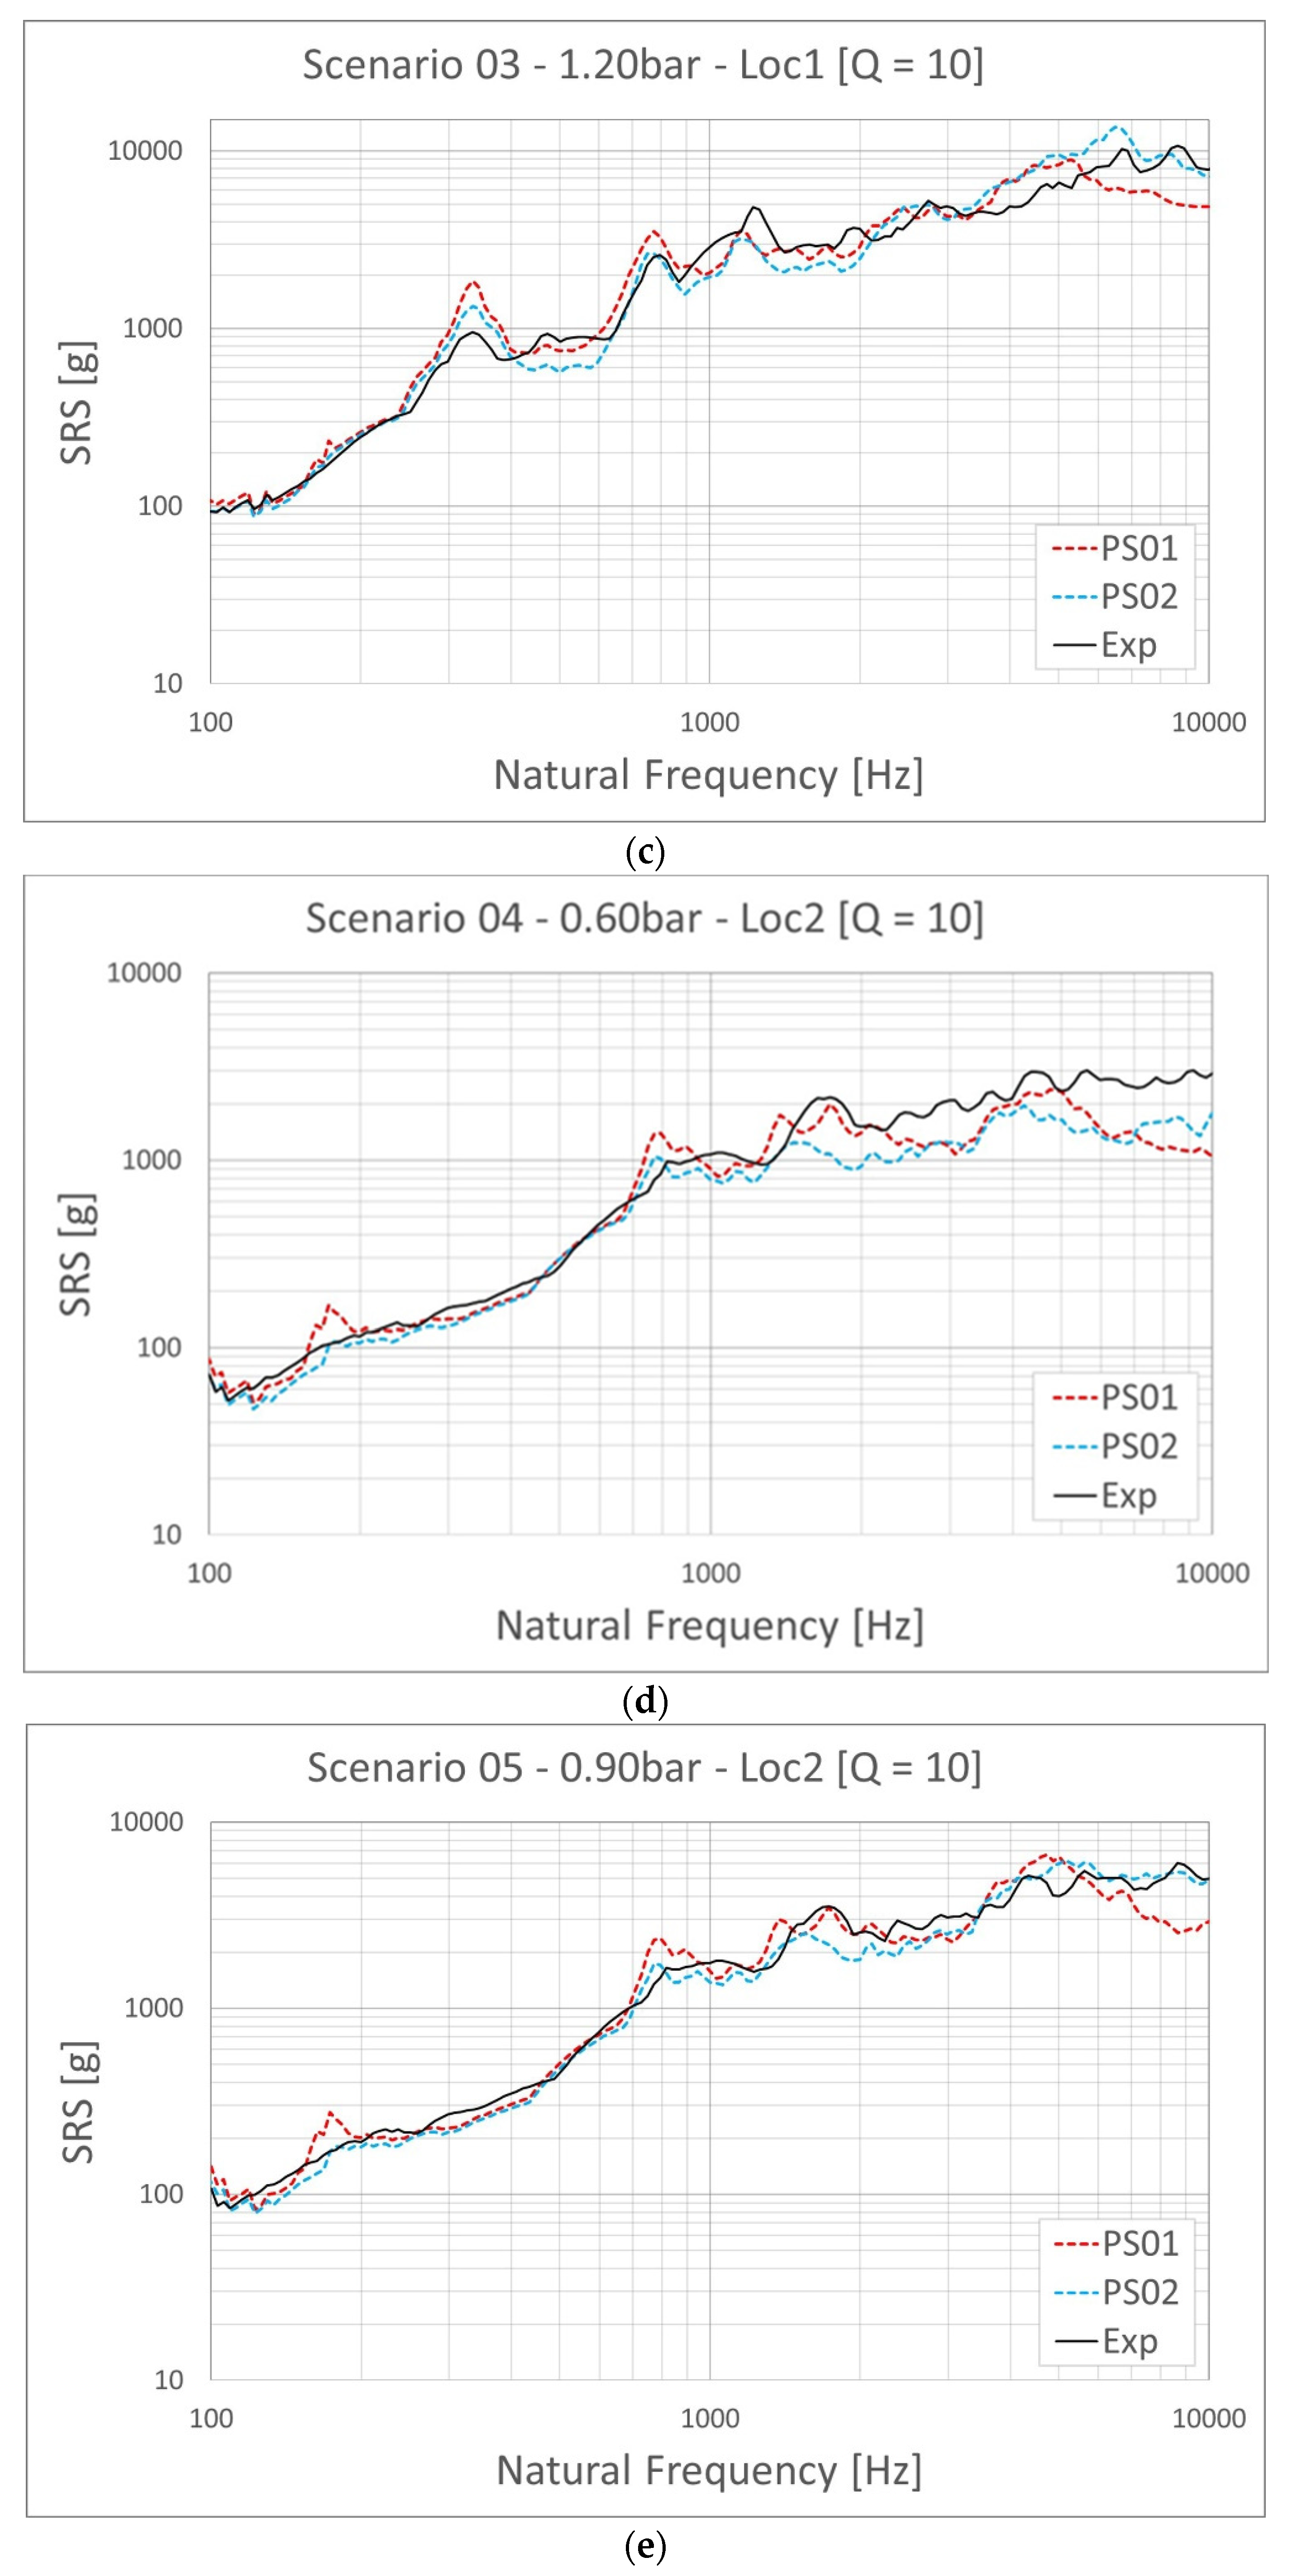
The simulations with the PS02 parameter set show significant differences from the ones performed with default parameters. First of all, the peaks that indicate the natural frequencies of the system up to 900 Hz decrease and become closer or even identical to the experimental results. For location 1 (Scenario 01-02-03), there are two significant peaks, which are around 330 Hz and 650 Hz. The new set of simulations captures the peak values exactly for the latter, and although there still is a gap between the simulation and the experiment, it reveals a closer value for the former. As an unexpected outcome, it decreases the amplitude of the SRS curve between 300 and 500 Hz and it is debatable that the new damping parameters shift the modal density in this range. For location 2 (Scenario 03-04-05), both peaks, which are around 180 Hz and 800 Hz, are eliminated and the results overlap almost perfectly. There is no unexpected decrease for this location. After the knee frequency, there is a remarkable difference between 5 and 10 kHz for all scenarios between PS01 and the experimental results. Apart from this, there are some small discrepancies throughout 900 Hz to 5 kHz, which are more apparent for the 0.60 bar cases (Scenario 01 and 04). The PS02 results show that the simulation–experiment curves match much better for the 5–10 kHz region, with some overshoot for the 0.90 bar and 1.20 bar cases (Scenario 02-03-05-06). However, for 0.60 bar (Scenarios 01 and 04), although the amplitude of the curves increases between 7 and 10 kHz, they are still well below the experimental results.
It is concluded that increasing the contact stiffness enhances the transmission of the high-frequency content of the impact force but this effect diminishes with decreasing impactor velocities. Thus, further increase in the contact stiffness parameters will work better for these cases, but it also increases the level of accelerations for the 0.90 bar and 1.20 bar simulations, which would lead to a mismatch with the experimental results. Although it is not considered here, a variable contact stiffness parameter with respect to impact velocity could lead to better results.
4. Validation of the Modeling Framework Using a Dummy Instrument
Throughout Section 2 and Section 3, the experimental and the numerical studies are presented with a focus on the FE computations–experiment correlation of a ringing plate test system. For the sake of simplicity and to illustrate the effects of different parameters, the study is conducted without an instrument mounted on the test bench. The performance of the explicit FE computations and possible improvements in the default parameters are evaluated. In this section, the outcomes from previous sections are applied to a real pyroshock test case that includes a dummy instrument mounted on the test bench. With the main purpose of this study in mind, it is critical to evaluate the performance of explicit FE simulations for a test case with an instrument mounted.
4.1. Dummy Instrument
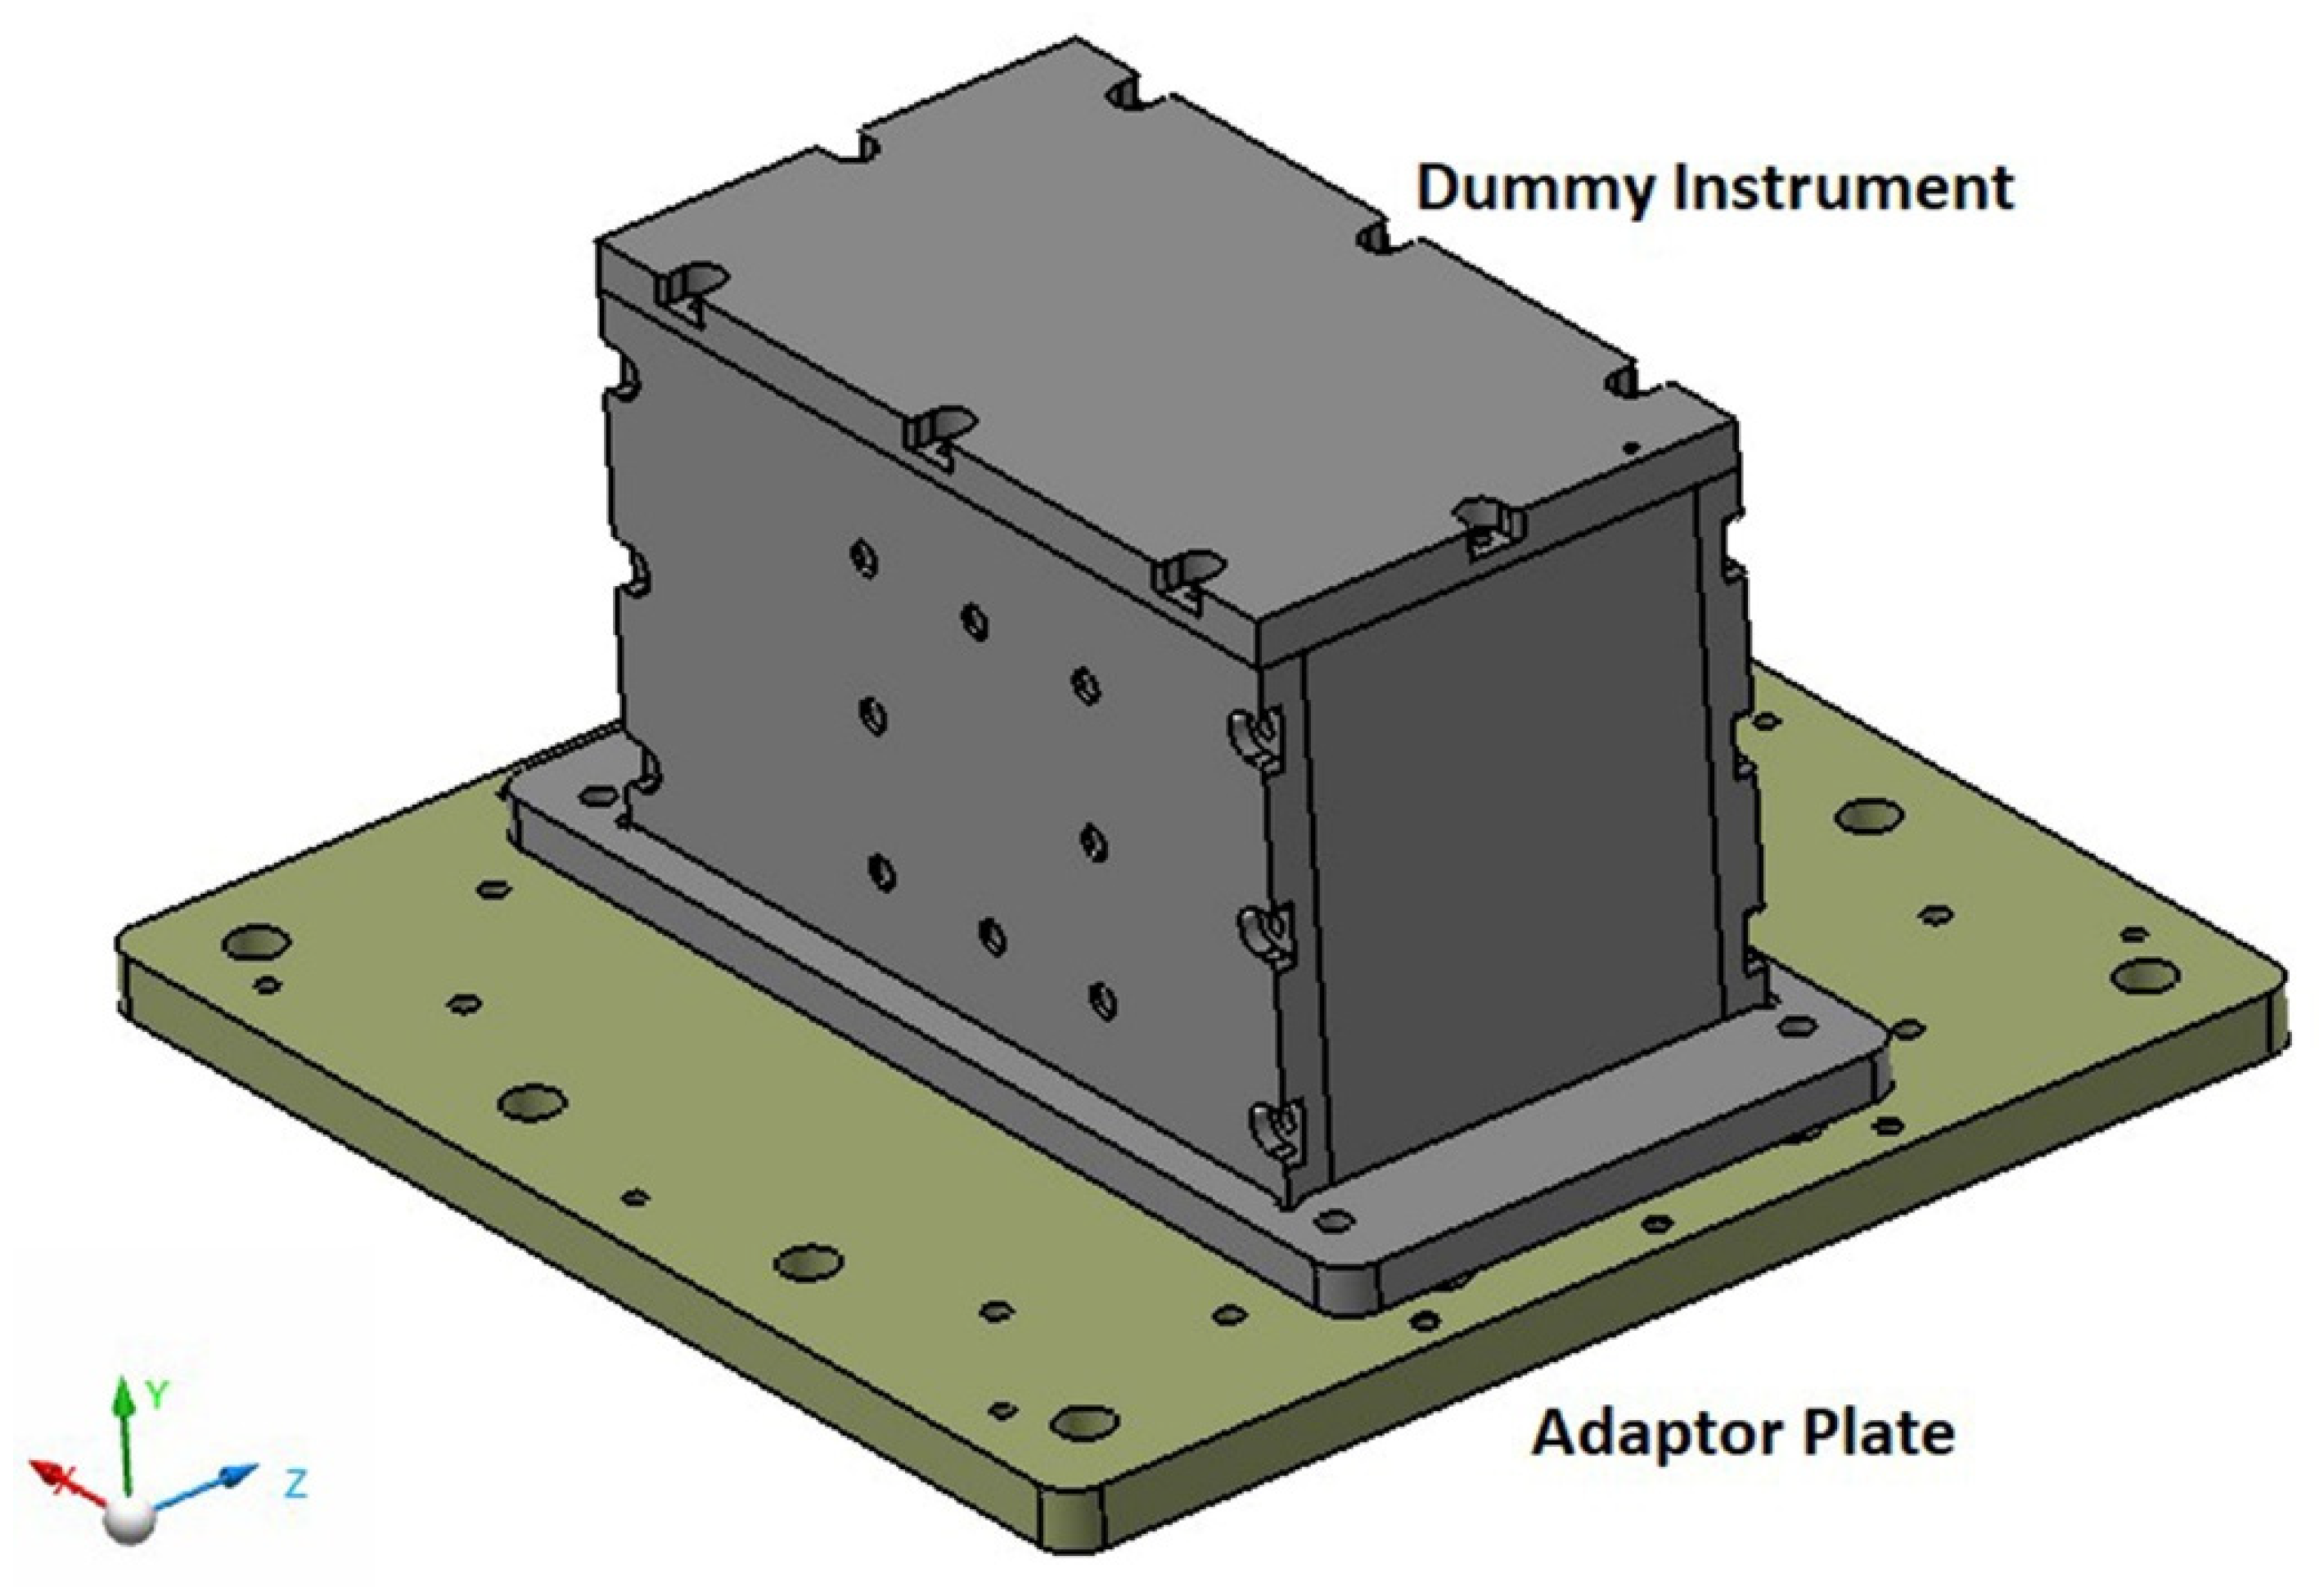
Metal-to-metal impact-type pyroshock test setups are able to mimic a real pyroshock loading to an instrument, but they require special attention (see, e.g., [2]), since the test systems are quite sensitive to all kinds of inputs, including not only the pneumatic gun pressure, mass and geometrical properties of the resonant plate and impactor but also the assembly type of the instrument, the torque levels applied to the fasteners and the error in the flatness of the adaptor plate. Thus, metal-to-metal impact-type test setups require considerable trial-and-error effort using a dummy test item to achieve the specified SRS for the excitation into the instrument mounted [19,21]. In order to prevent the overtesting of the real instruments through the error-and-trial process, the pyroshock test is therefore performed initially with such representative dummy instruments, which is a common application to ensure that the real instrument is exposed only to the necessary shock levels. The dummy instrument should have the same interface as the resonant plate, the same center of gravity and a similar moment of inertia, as well as a similar structure to the real instrument. In this study, it is a rectangular-shaped instrument and is connected to the resonant plate via a thick adaptor plate with the help of M6 bolts. An overview of the design of the dummy instrument is presented in Figure 10.
4.2. Test—FE Simulation Comparison
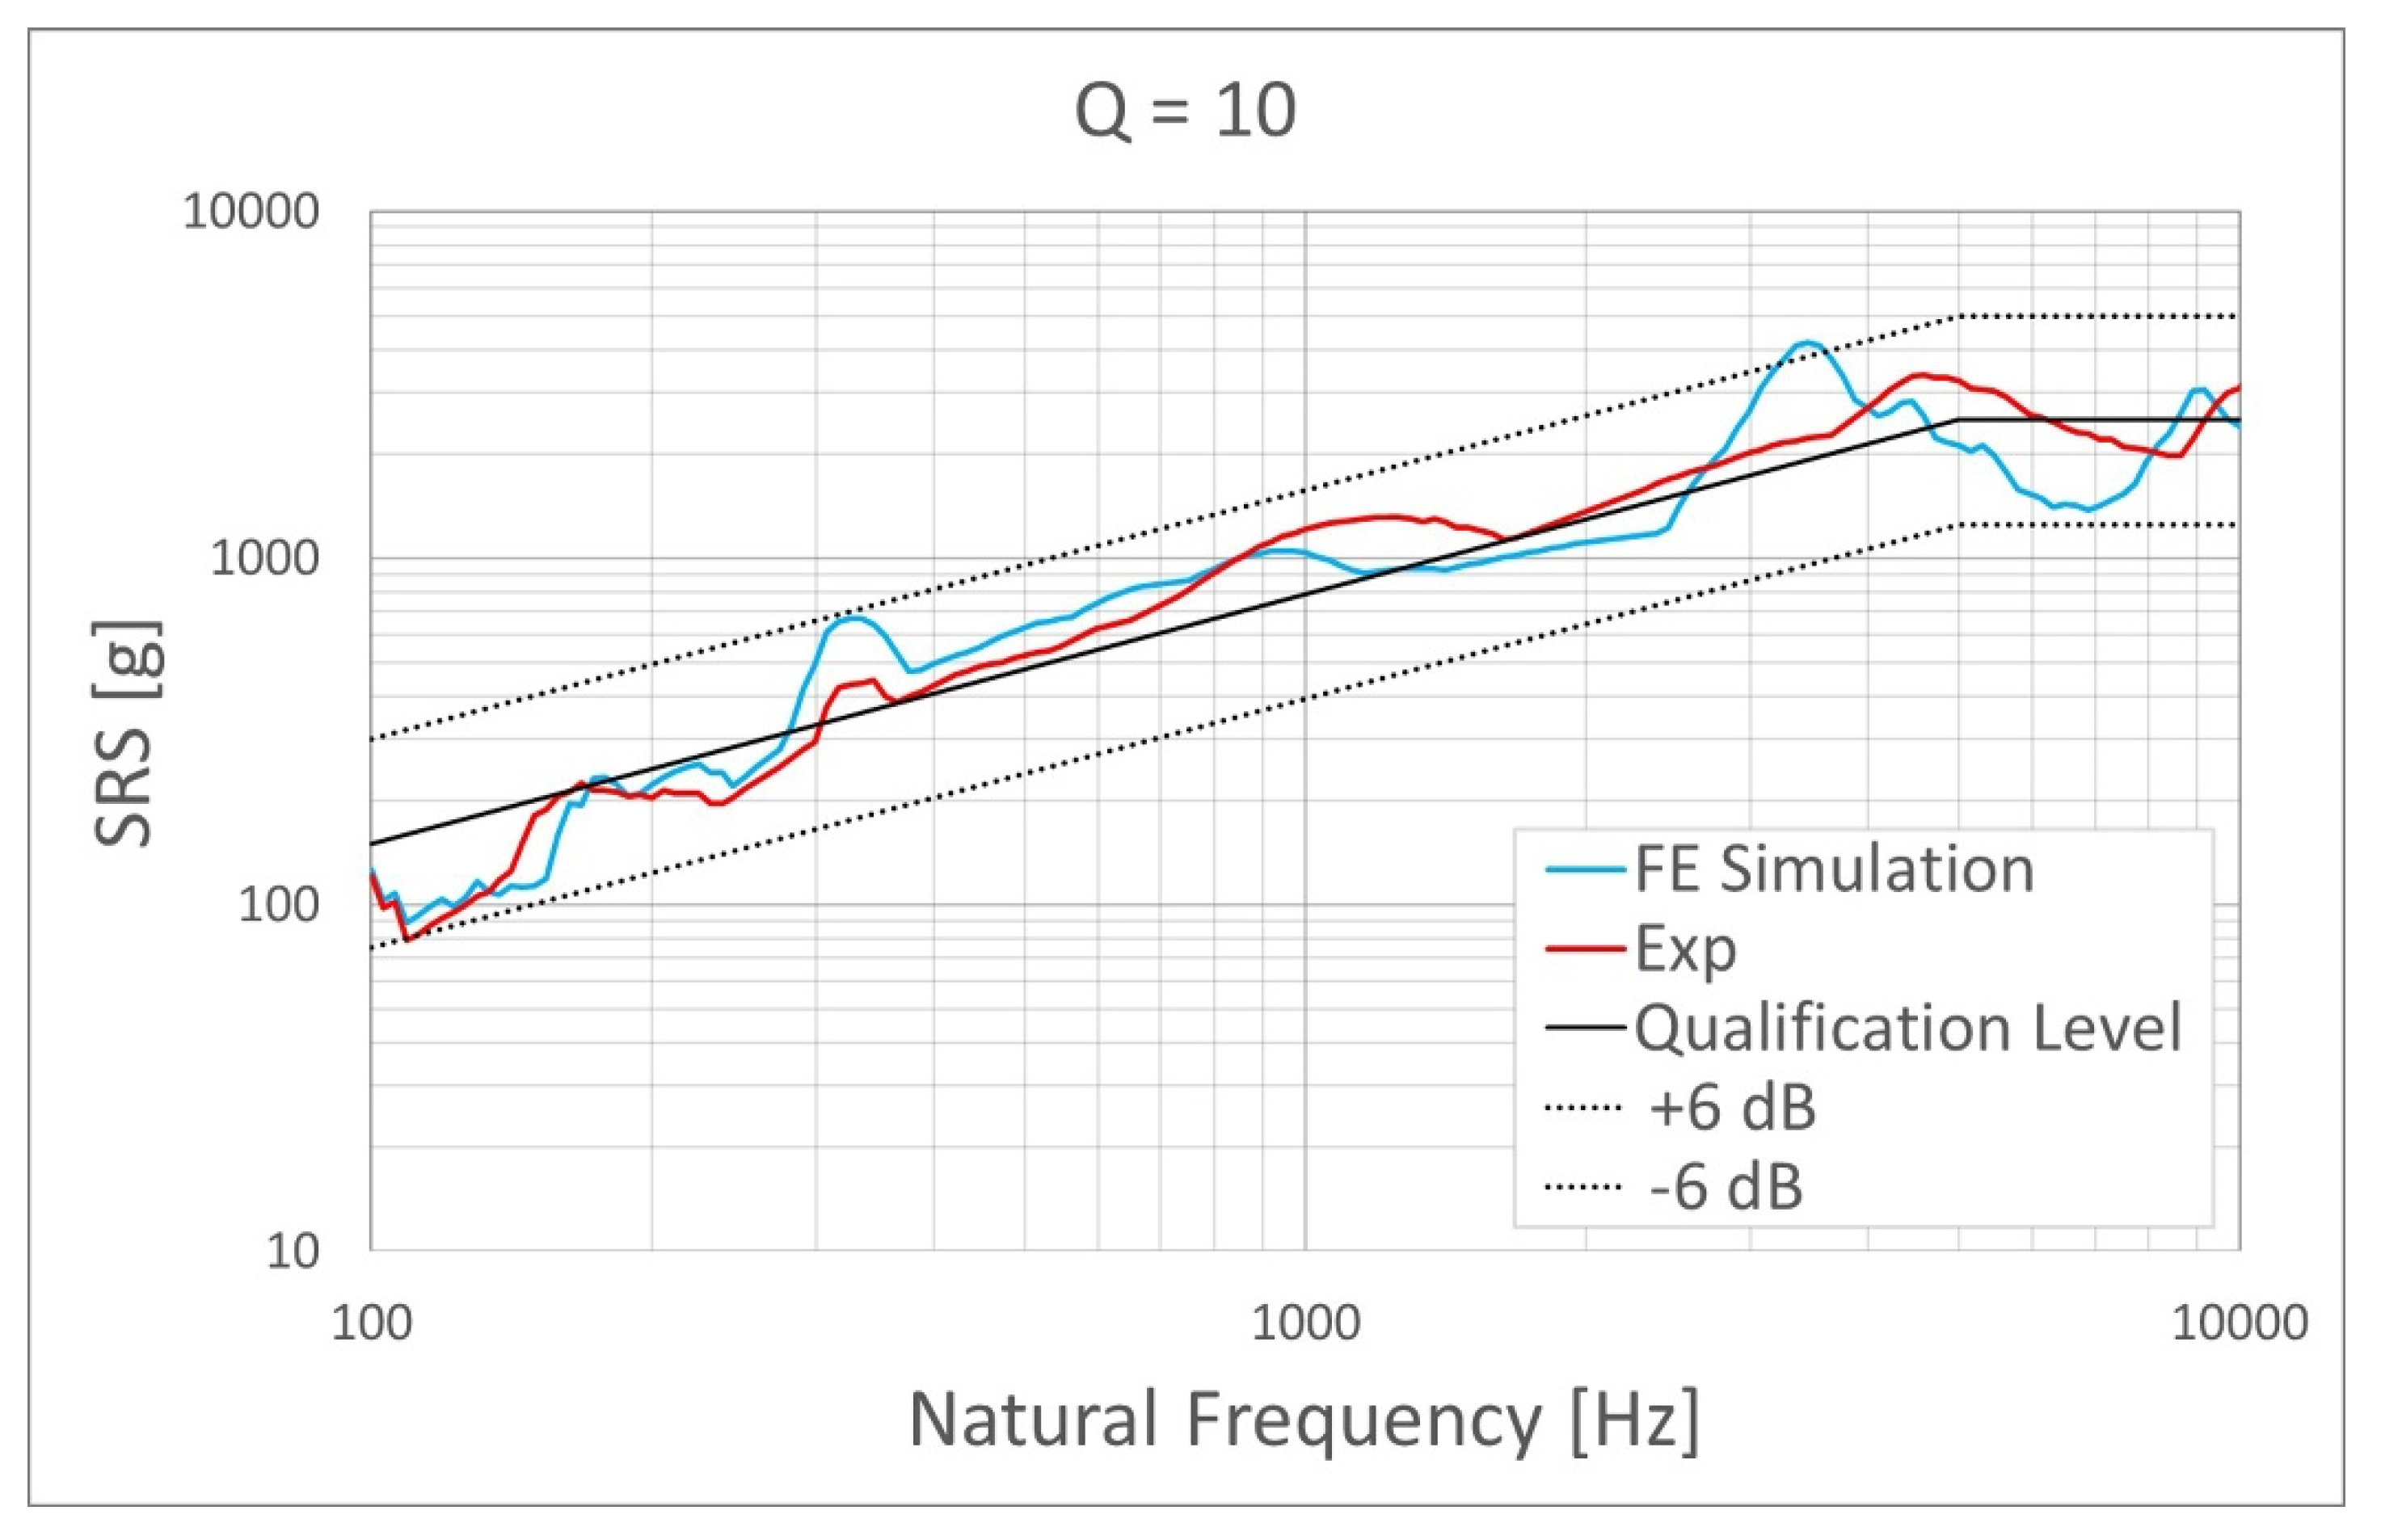
The pyroshock test presented in this section is one of the trial-and-error tests with the dummy instrument. It is performed to check whether the qualification level pyroshock loading can be simulated. The qualification level test is defined as the test that is performed on a hardware item that will not be flown, but manufactured using the same drawing, materials, tooling, processes, inspection methods and personnel competency as used for the flight hardware. The purpose of a qualification test is to verify the design integrity of the flight hardware with a specific margin [4], and it is well known that the design of the equipment and of the S/C (spacecraft) must retain a qualification load scenario that is higher than the operative one [16]. The test is performed with a 15 kg impactor at a pressure level of 1.80 bar. The whole dummy instrument–adaptor plate assembly is mounted on nuts via bolt connection points in order to prevent direct contact between the adaptor plate and the resonant plate. With this assembly technique, the modal coupling is prevented to a certain extent and the modal density is decreased mostly for the high-frequency region in order to remain within the band of tolerance levels of the desired pyroshock loading. This is a version of multiple resonant plate application named bi-plate and has several examples in the literature (see, e.g., [27]).
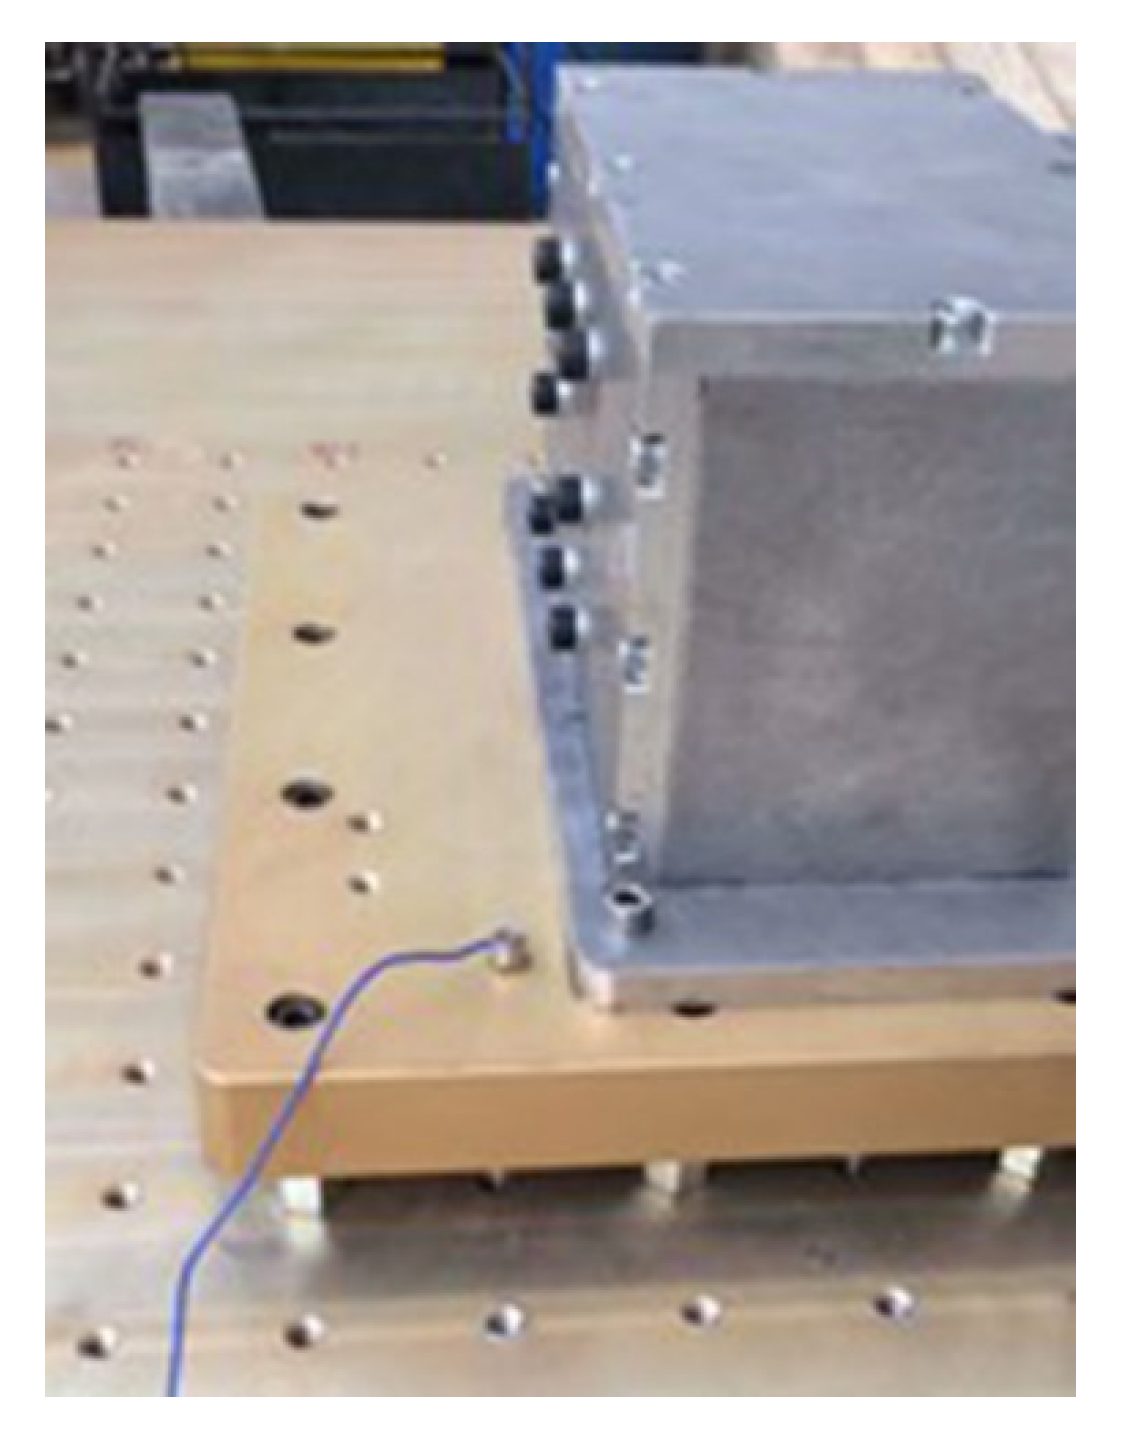
Acceleration–time data are measured by a piezo-resistive-type single-axis shock accelerometer, as in the previous experiments. It is mounted on the adaptor plate at a very close point to the one of the four bolt connections of the dummy instrument, as shown in Figure 11. Measured data are converted into an SRS curve and are shown in Figure 12 together with the qualification shock level. A tolerance limit of +6 dB / −6 dB is established for the desired shock level [21]. The repeatability of the system has been checked previously; therefore, the analysis is conducted here through a single experiment.
The experimental SRS curve does not exactly match with the described qualification shock level but it is within the tolerance levels. The only discrepancy is around 8.5 kHz, at which the experimental SRS levels drops slightly beyond the lower band of tolerance.
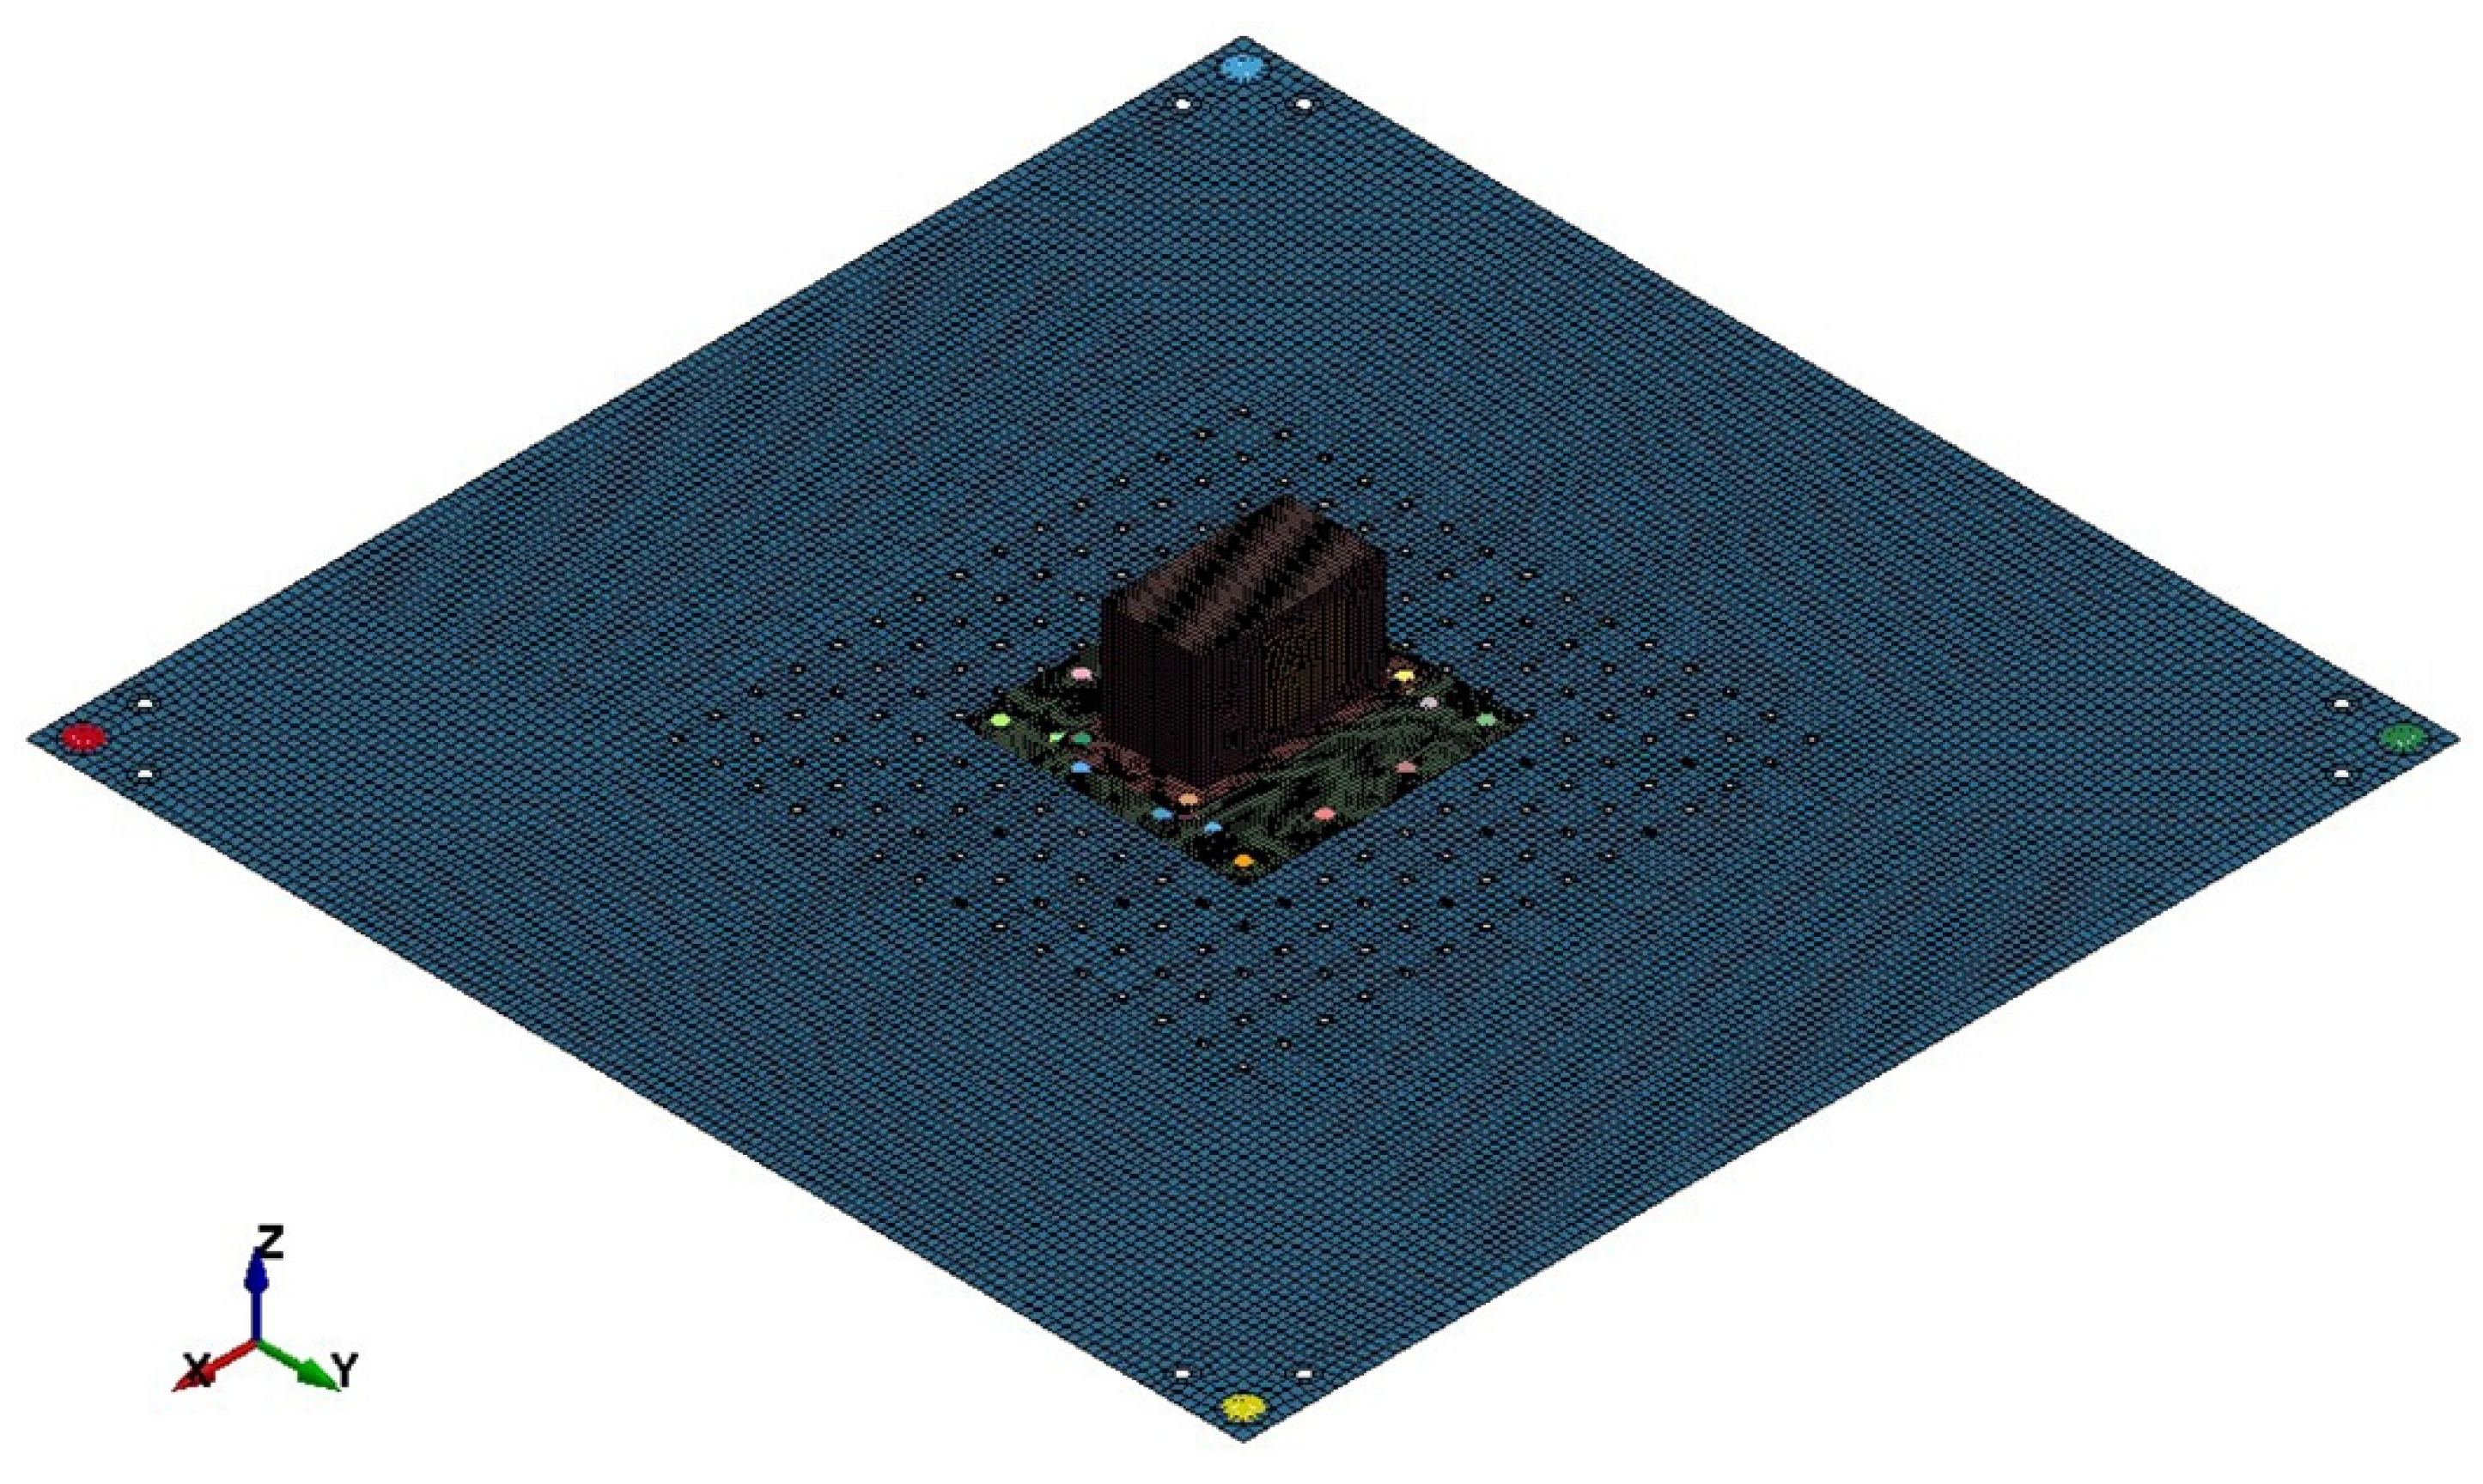
The finite element model is developed as in the previous case without a dummy instrument, where 2D shell and 3D brick reduced integration elements with linear elastic material definitions are used, as illustrated in Figure 13. All fastener connections except the ones within the dummy instrument are modeled with the CNRB (Rigid Connection)—Beam Element—CNRB technique. The mesh size for the dummy instrument and the adaptor plate is 5 mm. In the FE simulation, the improved parameter set, PS02, is utilized for damping and contact parameters. The results of the simulation are presented in Figure 12 in comparison to experimental data.
As depicted in Figure 12, the general trends of the SRS curves of experimental and numerical results are in agreement. With a closer look at the low- to mid-frequency region, there are two peaks around 180 Hz and 320 Hz within both the experimental and numerical results. The numerical results capture the amplitude of the first peak but not at the correct frequency; there is a shift towards a lower frequency. For the second one, it is the opposite: the peak is captured at the correct frequency but the amplitude is much higher for the experimental result. In the mid-field frequency region, the knee frequency is captured with approximately 10% error. It is at 1 kHz for the experimental result but 900 Hz for the FE result. It could be concluded that the FE simulation results agree with the experimental results in general. With the exception of some frequency shifts and an amplitude overestimated at around 320 Hz, the trend and all peaks and troughs of the experimental SRS curve in the low- and mid-frequency ranges are captured.
In the high-frequency region, the trends agree with each other but there is a certain frequency shift for the sinusoidal-like behavior of the curve between 4 and 10 kHz, and the amplitude around the beginning of the sinusoidal-like shape is overestimated by the numerical results. It shows a lower amplitude between 4 and 8 kHz and captures the amplitude after 8 kHz. Recalling the main purpose of this work, contrary to the differences between the numerical and experimental results, the SRS curves agree with each other to an extent that can give confidence to users to conduct solely numerical simulations to obtain an estimate of the behavior without extended experimental studies. The experimental setup and production errors of the dummy instrument might be the causes of the differences, as well as the limitations of the numerical simulation itself. It is observed that even small variations in the applied torque levels to the M6 fasteners at the interface of the dummy instrument lead to certain differences in the experimental SRS curves.
Note that in solid mechanics computations and dynamical analysis, certain uncertainties exist due to the microstructure, defects, loading and boundary conditions. The phenomenological modeling techniques at the macro scale come with their own assumptions and simplifications. In order to include such uncertainties, multiscale, physics-based approaches can always be employed for more realistic calculations; see, e.g., [28,29,30,31]. Moreover, different approaches are proposed in the literature to study these effects; see, e.g., [32]. However, such an approach is outside the scope of this work and the uncertainties have not been included here.
5. Conclusions
The main objective of this work is to illustrate and evaluate the potential of explicit finite element computations to simulate the pyroshock tests performed with a ringing plate-type test system. The study is conducted within a Master’s thesis [33]. FE simulations are performed with the default and improved parameter sets and compared to the experimental results. All correlation processes, including parameter sensitivity simulations and simulations of the performed experiments with different parameter sets, are studied without any instrument to be tested for the sake of simplicity. After the agreement is obtained between the numerical and the experimental SRS curves, the performance of the explicit FE simulation is evaluated for a dummy mounted real trial-and-error test case. The main outcomes of this study could be summarized as follows:
- The explicit FE method has valuable potential to predict shock levels on a ringing plate-type pyroshock test bench.
- In the literature, the implicit FE method has been shown to predict the shock response, showing good SRS predictions compared to the test-measured SRS at low frequencies. The current study shows that the explicit approach is in good agreement with the test results for a frequency range greater than 5 kHz.
- The explicit FE method could be a powerful tool for shock level calibration tests with a dummy instrument before the pyroshock test of the real instrument. It could lower the necessary test number from hundreds to tens or even less.
Considering the importance of the instrument and the system level pyroshock tests for space programs, it is vital for the structures and systems to withstand the qualification level pyroshocks throughout the mission, to prevent possible system failures. The instrument-level ringing plate pyroshock tests could be more effective in terms of time and labor with a powerful tool in hand to predict testing parameters to achieve the desired qualification shock level.
Author Contributions
Conceptualization, T.Y. and B.G.; methodology, T.Y. and B.G.; software, B.G.; validation, T.Y. and B.G.; formal analysis, T.Y. and B.G.; investigation, T.Y. and B.G.; resources, B.G.; data curation, T.Y. and B.G.; writing—original draft preparation, T.Y. and B.G.; writing—review and editing, T.Y.; visualization, T.Y. and B.G.; supervision, T.Y. All authors have read and agreed to the published version of the manuscript.
Funding
This research received no external funding.
Institutional Review Board Statement
Not applicable.
Informed Consent Statement
Not applicable.
Data Availability Statement
Not applicable.
Acknowledgments
The authors acknowledge greatly the support of BIAS Engineering, where most of the computational and experimental studies were conducted using their facilities.
Conflicts of Interest
The authors declare no conflict of interest.
References
- Lake, E.R.; Thompson, S.J.; Drexelius, V.W. Study of the Role of Pyrotechnic Systems on the Space Shuttle Program; NASA Contract Reports; National Aeronautics and Space Administration: Washington, DC, USA, 1973.
- Bement, L.J.; Schimmel, M.L. A Manual Pyrotechnic Design, Development and Qualification; NASA Tech. Reports; National Aeronautics and Space Administration, Langley Research Centre: Hampton, Virginia, 1995.
- Moening, C.J. Pyrotechnic shock flight failures, Proceedings of Institute of environmental sciences pyrotechnic shock tutorial program. In Proceeding of the 31st Annual Technical Meeting of the Institute of Environmental Sciences (IES), Las Vegas, NV, USA, 29 April–2 May 1985; p. 4e5. [Google Scholar]
- NASA. Pyroshock Test Criteria; Report Number: NASA-STD-7003A; National Aeronautics and Space Administration: Washington, DC, USA, 2011.
- Lee, J.R.; Chia, C.C.; Kong, C.W. Review of pyroshock wave measurement and simulation for space systems. Measurement 2012, 45, 631–642. [Google Scholar] [CrossRef]
- Lee, J.; Hwang, D.-H.; Han, J.-H. Study on pyroshock propagation through plates with joints and washers. Aerosp. Sci. Technol. 2018, 79, 441–458. [Google Scholar] [CrossRef]
- Park, H.-S.; Hwang, D.-H.; Han, J.-H.; Yang, J. Development of shock-absorbing insert for honeycomb sandwich panel. Aerosp. Sci. Technol. 2020, 104, 105930. [Google Scholar] [CrossRef]
- Cui, D.; Zhao, J.; Yan, S.; Guo, X.; Li, J. Analysis of parameter sensitivity on dynamics of satellite separation. Acta Astronaut. 2015, 114, 22–33. [Google Scholar] [CrossRef]
- Zhao, H.; Hao, Z.; Liu, W.; Ding, J.; Sun, Y.; Zhang, Q.; Liu, Y. The shock environment prediction of satellite in the process of satellite-rocket separation. Acta Astronaut. 2019, 159, 112–122. [Google Scholar] [CrossRef]
- García-Pérez, A.; Ravanbakhsh, A.; Sorribes-Palmer, F.; Alonso, G. Structural shock verification by numerical analysis of the EPD payload units on board Solar Orbiter spacecraft. Acta Astronaut. 2020, 168, 282–292. [Google Scholar] [CrossRef]
- García-Pérez, A.; Sorribes-Palmer, F.; Alonso, G.; Ravanbakhsh, A. FEM simulation of space instruments subjected to shock tests by mechanical impact. Int. J. Impact Eng. 2018, 126, 11–26. [Google Scholar] [CrossRef]
- Hwang, D.-H.; Park, H.-S.; Han, J.-H. Development of a miniature point source pyroshock simulator. J. Sound Vib. 2020, 481, 115438. [Google Scholar] [CrossRef]
- Yan, H.; Qin, Z.; Zhang, W.; Ming, A.; Wang, X.; Chu, F. Dynamic analysis of laser shock response: Experimental and numerical studies. Aerosp. Sci. Technol. 2019, 94, 105430. [Google Scholar] [CrossRef]
- Zhao, H.; Liu, W.; Ding, J.; Sun, Y.; Li, X.; Liu, Y. Numerical study on separation shock characteristics of pyrotechnic separation nuts. Acta Astronaut. 2018, 151, 893–903. [Google Scholar] [CrossRef]
- Stewart, L.; Durant, B.; Wolfson, J.; Hegemier, G. Experimentally generated high-g shock loads using Hydraulic Blast Simulator. Int. J. Impact Eng. 2014, 69, 86–94. [Google Scholar] [CrossRef]
- Monti, R.; Gasbarri, P. Dynamic load synthesis for shock numerical simulation in space structure design. Acta Astronaut. 2017, 137, 222–231. [Google Scholar] [CrossRef]
- Wang, X.; Qin, Z.; Ding, J.; Chu, F. Finite element modeling and pyroshock response analysis of separation nuts. Aerosp. Sci. Technol. 2017, 68, 380–390. [Google Scholar] [CrossRef]
- García-Pérez, A.; Sorribes-Palmer, F.; Alonso, G.; Ravanbakhsh, A. Overview and application of FEM methods for shock analysis in space instruments. Aerosp. Sci. Technol. 2018, 80, 572–586. [Google Scholar] [CrossRef]
- Piersol, A.G.; Paez, T.L. Harris’ Shock and Vibration Handbook, 6th ed.; McGraw-Hill Professional Publishing: New York, NY, USA, 2010. [Google Scholar]
- de Benedetti, M.; Garofalo, G.; Zumpano, M.; Barboni, R. On the damping effect due to bolted junctions in space structures subjected to pyro-shock. Acta Astronaut. 2007, 60, 947–956. [Google Scholar] [CrossRef]
- Himelblau, H.; Manning, J.; Kern, D.; Piersol, A. Dynamic Environmental Criteria; NASA Tech. Handb. NASA-HDBK-7005; National Aeronautics and Space Administration: Washington, DC, USA, 2001.
- Lee, D.-O.; Han, J.-H.; Jang, H.-W.; Woo, S.-H.; Kim, K.-W. Shock Response Prediction of a Low Altitude Earth Observation Satellite During Launch Vehicle Separation. Int. J. Aeronaut. Space Sci. 2010, 11, 49–57. [Google Scholar] [CrossRef]
- Chen, M.; Sui, Y.K.; Yang, Z.G. Numerical simulation of exploding separation for aerospace pyrotechnical actuated separation device. Initiat. Pyrotech. 2007, 5, 5–8. [Google Scholar]
- Zhao, H.; Ding, J.; Zhu, W.; Sun, Y.; Liu, Y. Shock response prediction of the typical structure in spacecraft based on the hybrid modeling techniques. Aerosp. Sci. Technol. 2019, 89, 460–467. [Google Scholar] [CrossRef]
- Zukas, J.A. Introduction to Hydrocodes; Elsevier: Oxford, UK, 2004. [Google Scholar]
- ECSS-E-HB-32-25A; Space Engineering. Mechanical Shock Design and Verification Handbook Noordwijk. ESA-ESTEC Requirements and Standards Division: Dutch, The Netherlands, 2015.
- Charvet, B.; Dilhan, D.; Palladino, M. Shock Bench Enhancements. In Proceedings of the 13th European Conference on Spacecraft Structures, Materials & Environmental Testing, Braunschweig, Germany, 1–4 April 2014. [Google Scholar]
- Yalçinkaya, T.; Güngör, G.; Çakmak, S.O.; Tekoğlu, C. A Micromechanics Based Numerical Investigation of Dual Phase Steels. Procedia Struct. Integr. 2019, 21, 61–72. [Google Scholar] [CrossRef]
- Yalçinkaya, T.; Çakmak, S.O.; Tekoğlu, C. A crystal plasticity based finite element framework for RVE calculations of two-phase materials: Void nucleation in dual-phase steels. Finite Elem. Anal. Des. 2021, 187, 103510. [Google Scholar] [CrossRef]
- Kahveci, Ö.; Gençoğlu, C.; Yalçinkaya, T. Experimental Analysis and Multiscale Modeling of the Dynamics of a Fiber-Optic Coil. Sensors 2022, 22, 582. [Google Scholar] [CrossRef] [PubMed]
- Acar, S.S.; Bulut, O.; Yalçinkaya, T. Crystal plasticity modeling of additively manufactured metallic microstructures. Procedia Struct. Integr. 2022, 35, 219–227. [Google Scholar] [CrossRef]
- Wang, L.; Li, Z.; Ni, B.; Wang, X.; Chen, W. A robust topology optimization method considering bounded field parameters with uncertainties based on the variable time step parametric level-set method. Appl. Math. Model. 2022, 107, 441–463. [Google Scholar] [CrossRef]
- Gürsoy, B. Experimental and Computational Analysis of a Ringing Plate Pyroshock Test System. Master’s Thesis, Middle East Technical University, Ankara, Turkey, 2021. [Google Scholar]
Figure 1.
Main elements of the pyroshock test system.

Figure 2.
Sample signal data from laser sensors. (a) Upper laser sensor and (b) lower laser sensor.

Figure 3.
Illustration of the locations. (a) Position of Loc1, (b) position of Loc2.

Figure 4.
Experimental SRS results obtained from the tests. (a) Scenario 01, (b) Scenario 02, (c) Scenario 03, (d) Scenario 04, (e) Scenario 05, (f) Scenario 06.
Figure 4.
Experimental SRS results obtained from the tests. (a) Scenario 01, (b) Scenario 02, (c) Scenario 03, (d) Scenario 04, (e) Scenario 05, (f) Scenario 06.


Figure 5.
Finite element model of the experimental setup. (a) Isometric view, (b) side view.

Figure 6.
The effect of mass proportional damping on the SRS curves.

Figure 7.
The effect of stiffness proportional damping on SRS curves.

Figure 8.
The effect of contact stiffness on the SRS response.

Figure 9.
Comparison of experimental and numerical SRS results. (a) Scenario 01, (b) Scenario 02, (c) Scenario 03, (d) Scenario 04, (e) Scenario 05, (f) Scenario 06.
Figure 9.
Comparison of experimental and numerical SRS results. (a) Scenario 01, (b) Scenario 02, (c) Scenario 03, (d) Scenario 04, (e) Scenario 05, (f) Scenario 06.


Figure 10.
CAD representation of dummy instrument.

Figure 11.
Accelerometer and the dummy instrument.

Figure 12.
Experimental and numerical SRS results of the test with the dummy instrument.

Figure 13.
Finite element model with the dummy instrument.


Table 1.
Velocity test results.
| Test No. | Mass of Impactor [kg] | Pressure [bar] | Measured Velocity [m/s] |
|---|---|---|---|
| 01 | 10 | 0.46 | 3.07 |
| 02 | 10 | 0.46 | 3.10 |
| 03 | 10 | 0.88 | 5.83 |
| 04 | 10 | 0.88 | 5.74 |
| 05 | 10 | 1.60 | 8.75 |
| 06 | 10 | 1.60 | 8.97 |
| 07 | 10 | 2.80 | 12.07 |
| 08 | 10 | 2.80 | 11.67 |
Table 2.
Conditions of test scenarios.
| Scenario No. | Pressure [bar] | Location |
|---|---|---|
| 01 | 0.60 | Loc1 |
| 02 | 0.90 | Loc1 |
| 03 | 1.20 | Loc1 |
| 04 | 0.60 | Loc2 |
| 05 | 0.90 | Loc2 |
| 06 | 1.20 | Loc2 |
Table 3.
Simulation parameter sets.
| Parameter Set | Mass Proportion Damping Coefficient (µ) | Stiffness Proportion Damping Coefficient (λ) | Contact Stiffness (SFS) | Contact Stiffness (SFM) |
|---|---|---|---|---|
| PS01 (Default) | 0 | 0 | 1 | 1 |
| PS02 | 25 | 0.005 | 25 | 25 |
Publisher’s Note: MDPI stays neutral with regard to jurisdictional claims in published maps and institutional affiliations. |
© 2022 by the authors. Licensee MDPI, Basel, Switzerland. This article is an open access article distributed under the terms and conditions of the Creative Commons Attribution (CC BY) license (https://creativecommons.org/licenses/by/4.0/).
Share and Cite
MDPI and ACS Style
Yalçinkaya, T.; Gürsoy, B. Numerical Validation of a Pyroshock Test System and Application to Qualification Tests. Aerospace 2022, 9, 400. https://doi.org/10.3390/aerospace9080400
AMA Style
Yalçinkaya T, Gürsoy B. Numerical Validation of a Pyroshock Test System and Application to Qualification Tests. Aerospace. 2022; 9(8):400. https://doi.org/10.3390/aerospace9080400
Chicago/Turabian StyleYalçinkaya, Tuncay, and Bahadir Gürsoy. 2022. "Numerical Validation of a Pyroshock Test System and Application to Qualification Tests" Aerospace 9, no. 8: 400. https://doi.org/10.3390/aerospace9080400
Note that from the first issue of 2016, this journal uses article numbers instead of page numbers. See further details here.