1. Introduction
Aircraft noise usually affects large areas around airports. In populated regions, a large number of people may be exposed [
1,
2], entailing, among others, restrictions for land-use planning. Besides economic consequences, it can also cause various health effects [
3,
4]. In 2017, around 3.2 million people were estimated to be highly annoyed by aircraft noise and 1.4 million suffered from sleep disturbance around the 47 major European airports. In addition, more than 1 million people were exposed to more than 50 aircraft noise events per day exceeding 70 dB in 2017—this is 60% more than in 2005 [
5].
Since aircraft noise has a large-scale impact, noise exposure cannot be assessed by measurements alone, but has to be established using model calculations. Due to their impact on land-use planning, aircraft noise calculations need to be highly accurate. Calculation uncertainties strongly depend on the modelling approach, model sophistication, traffic input data, available sound source data and airport peculiarities such as specific aircraft fleet or different flight procedures [
6,
7,
8]. Systematic comparisons of simulations with independent measurements as a validation step are therefore essential.
In the past, model validations were conducted for different models such as ANCON in the United Kingdom [
9], and FLULA2 [
7,
10] and sonAIR [
11] in Switzerland. Another study compared calculations of the maximum A-weighted sound pressure level (L
A,max) with three different scientific simulation programs (PANAM, ANOPP, CARMEN) by means of benchmark tests with a reference and a low-noise vehicle [
12]. Literature, however, does not provide any information on larger validation campaigns for AEDT. Previous research has focused on specific aspects, such as the accuracy of the AEDT noise input database, the noise power distance (NPD) curves and their potential for improvement [
13]. Studies which compare different noise models together and against measurements are not available.
The aim of this study was therefore to conduct a comparison and systematic validation of three different aircraft noise calculation programs, namely sonAIR, FLULA2 and AEDT, using a large measurement data set. The three programs are based on inherently different modelling approaches. sonAIR [
14,
15], with its detailed spectral noise emission and propagation models, was recently developed to accurately reproduce single flights as well as (new) noise abatement flight procedures [
16]. FLULA2 [
17] is an empirical time-step model and an official tool to calculate yearly aircraft noise exposure in Switzerland. AEDT [
18] is a Doc 9911 [
19] compliant and Doc 29 [
20] equivalent segmentation-based model. Both, FLULA2 and AEDT, are best practice programs, primarily developed to calculate complex scenarios such as yearly air traffic operations, which include various aircraft types and large numbers of flights. For the validation, we simulated 8785 single flights around the airports of Zurich and Geneva, Switzerland, and compared the results with corresponding measurements.
2. Materials and Methods
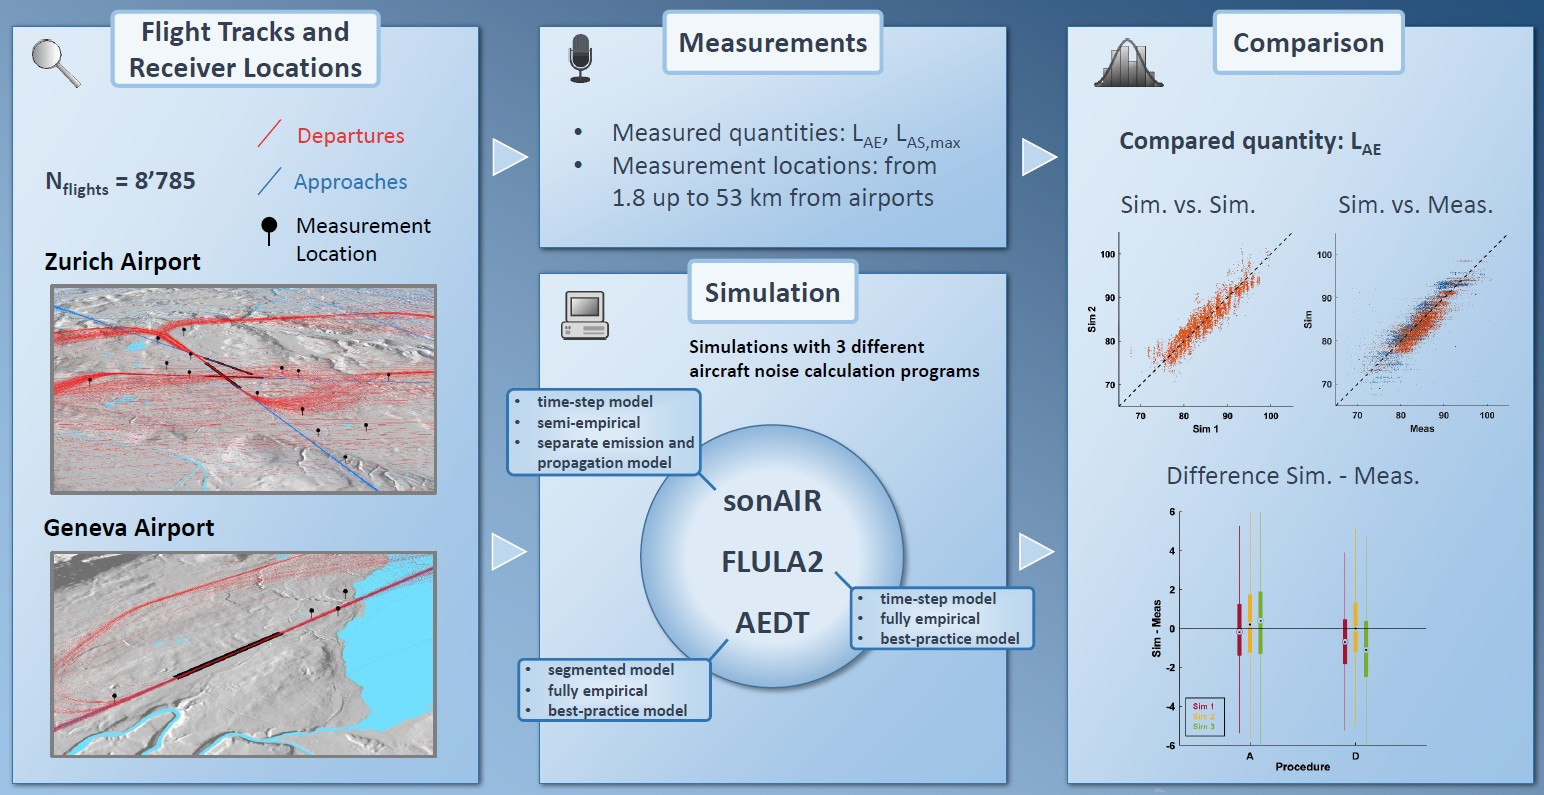
2.1. Concept Overview
We simulated approaches and departures around the airports Zurich (ZRH) and Geneva (GVA) with all three aircraft noise calculation programs and compared them with measured data at the corresponding microphone locations (cf.
Section 2.3).
The acoustic quantity used for the comparisons is the A-weighted sound exposure level L
AE (total amount of sound energy of an event (single aircraft flyby), related to the duration of 1 s, also referred to as “SEL”). Specifically, for the measurements, the L
AE,tg is used, with tg being the time period of an event with the instantaneous sound pressure level above a measurement location specific threshold (ZRH) or dynamic threshold (GVA). This quantity is used to have a sufficiently large signal-to-noise ratio to exclude measurement location specific or varying background noise. Further, the L
AE,t10 (total amount of sound energy of an event over the duration of t10) is used for the simulations with FLULA2 and sonAIR, where t10 is the 10 dB-down-time, i.e., the time period during which the sound pressure level is less than 10 dB below the L
A,max. The L
AE,10 is very similar to the L
AE,tg and was thus used for the best comparability with the L
AE,tg of the measurements. Finally, as AEDT does not yield the L
AE,t10 as output, we compare the L
AE obtained with AEDT. This is feasible since the sound exposure levels in the AEDT database (NPD curves) are based on 10 dB-down-time values (p. 28 in [
21]). In addition, the difference between L
AE,t10 and L
AE is usually small (in the range of some 0.1 dB). Thus, all three quantities, the measured L
AE,tg, the calculated L
AE,t10 (FLULA2, sonAIR) and L
AE (AEDT) are highly comparable. We only considered large civil aircraft types, since they represent the majority of movements on public airports and dominate the aircraft noise exposure in these areas. The simulated aircraft types in the present study cover the most frequently operating commercial aircraft in Switzerland.
For 2126 of the overall 8785 simulated flights, Swiss International Air Lines provided us with flight data recorder (FDR) data. Besides time and position information, FDR data include Mach number, air density and N1 (rotational speed of the low-pressure compressor), which are mandatory input data for sonAIR. sonAIR is further able to include the airplane configuration for some aircraft types [
15], in which case, the most detailed available sonAIR emission models can be applied. For flights where no FDR data were available, we used radar data, which include only time and position information. As N1 is a mandatory input parameter for sonAIR, N1 was in this case estimated based on the methodology of Schwab et al. [
22]. Further, Mach number and air density, which are also mandatory input parameters, were deduced from local meteorological profiles in this particular case. However, the airplane configuration cannot be estimated from radar data. Therefore, these calculations were performed with a set of reduced sonAIR emission models [
15] that do not require information on aircraft configuration.
We simulated three flight datasets separately. Flights with measurement data recorded close to the airport, once with and once without FDR data, and flights with measurement data recorded at greater distance to Zurich airport, for which FDR data were available.
Table 1 lists the aircraft types (ICAO designation) used for simulation and distinguishes whether full or reduced models, i.e., with or without FDR data as input, were used for calculations with sonAIR. Note that several aircraft types are listed in both categories, as flights with and without FDR data were measured and analyzed for the corresponding aircraft types. In contrast to sonAIR, FLULA2 and AEDT do not make use of the additional information of FDR data and use the same modelling approaches for both, flights with and without FDR data available.
Note that the calculations with sonAIR were taken from [
11], but had to be re-analyzed for the current purpose. The calculations with FLULA2 and AEDT were done specifically for this study.
2.2. Description of the Aircraft Noise Programs
The following subsections give an overview of the most important characteristics of the three noise calculation programs.
Table 2 provides an overview of the model properties and their settings within the calculations of the current study.
2.2.1. sonAIR
Details on sonAIR are given in [
14,
15]. In short, sonAIR is a spectral time step noise calculation program with three-dimensional sound emission, developed to accurately reproduce the sound exposure of single flights and/or noise abatement flight procedures [
14]. The emission model describes airframe and engine noise separately through multiple regression models, derived from large measurement campaigns [
15]. Separately calculated sound propagation accounts for geometric divergence, atmospheric absorption, shielding effects, ground reflection of uneven terrain and varying surface properties, foliage attenuation and meteorological effects [
14]. If desired, also buildings can be taken into account to calculate corresponding barrier effects as well as reflections [
23].
For emission calculations, sonAIR uses N1 as main parameter of the engine noise calculation. If FDR data are available, sonAIR is able to further account for airplane configuration, namely flaps, gears and speed brakes settings for certain aircraft types (cf.
Table 1). The corresponding emission models are referred to as “3D” models [
15]. If no FDR data are provided, sonAIR uses reduced emission models, which do not account for airplane configuration [
15]. These models are referred to as “3Dred” (“red” for reduced) models. The sonAIR aircraft noise calculation program has been successfully validated in a rigorous validation exercise with roughly 20000 single flights around ZRH and GVA [
11]. The simulations within the present study were conducted with the scientific MATLAB tool version 7 of sonAIR, using the sonAIR emission model version 1.1-0013 based on measurement campaigns in 2013, 2014, 2016 and 2017 at ZRH.
2.2.2. FLULA2
Details on FLULA2 are given in [
24,
25]. In short, FLULA2 is, like sonAIR, a time step noise calculation program. It uses two-dimensional sound emission patterns, rotationally symmetric with respect to the roll axis. The sound emission and propagation are combined in a fully empirical model description [
25]. FLULA2 was developed for calculations of yearly air traffic scenarios and is one of three official models in Switzerland for aircraft noise calculations [
26].
FLULA2 yields the A-weighted sound exposure level of single flights, accounting for real three-dimensional flight trajectories, as well as speed and terrain data. An additional term accounts for lateral attenuation, but no engine installation effects are considered. Emission models are available for approaches and departures with either maximum or reduced (flex) power [
24]. For the current calculations, FLULA2 version 004 was used with the emission database RC_2019, based on measurement campaigns in 1996, 2013, 2014, 2016 and 2017 at ZRH. Note that the FLULA2 sound source data for the aircraft types examined in the present study were fully derived from sound source data of sonAIR, based on the latter four campaigns (internal Empa report No. 5214.019893).
2.2.3. AEDT
Details on AEDT are given in [
18]. In short, AEDT is a software system to calculate fuel consumption, gaseous emissions and noise related to aircraft operations. The flight trajectories are divided in flight segments [
27]. AEDT uses noise power distance (NPD) curves as noise calculation database, which contain A-weighted noise values depending on power setting and slant distances to the receiver for different aircraft and operational modes. The noise emission and propagation models are fully empirical and combined within the NPD curves. Additional terms account for lateral attenuation and engine installation effects. AEDT (previously Integrated Noise Model, INM) was developed for calculations of yearly air operations. Amongst other things, it is used by the U.S. government for regulatory studies, research and domestic as well as international aviation environmental policy analyses [
15] and is fully compliant to ICAO Doc 9911 [
19]. We used the software version AEDT 3c within this paper, with the corresponding underlying NPD database and airport specific default procedural profiles.
The aim of this study was to investigate how well AEDT performs with default settings, and therefore (unlike for FLULA2 and sonAIR), we did not make any adjustments to meet local conditions. This means that NPD data, (procedural) flight profiles and weather data are not adapted to conditions around ZRH and GVA. Instead, standard procedural profiles of ZRH and GVA, standard weather conditions (ISA atmosphere) and unadjusted NPD data were used. While adjusted NPD data and flight profiles are likely to improve results, adjustment of the weather data should only have minor effects on the noise calculations (for sonAIR, differences in calculations with standard atmospheric and local atmospheric conditions were found to be less than 0.1 dB [
11]).
Simulation process and settings in AEDT for this study: The AEDT simulation process is not designed for calculating several thousand individual flights with one command, if the calculation results of every flight have to be evaluated separately. Therefore, a process workaround was done for the calculations in the present study. AEDT allows importing simulation specific input data for a single flight via AEDT standard input files (ASIF). The corresponding data are stored in an SQL server and can be manipulated via SQL commands. This allows defining all necessary calculation settings. The automation of input via ASIF and SQL commands, execution and output (LAE) of the calculation of each single flight is realized by calling command line files.
2.3. Acoustic Measurements
Three existing acoustic measurement datasets are used for this study. One data set was obtained during a measurement campaign carried out in autumn of 2017, in the far range of up to 53 km from touchdown at ZRH, by the authors’ institution, Empa [
11]. The other two data sets were obtained from stationary noise monitoring terminals (NMT) in the close range to ZRH and GVA [
11]. The measurement campaigns are described in [
11]. For readers’ convenience, we give a summary of the campaigns below.
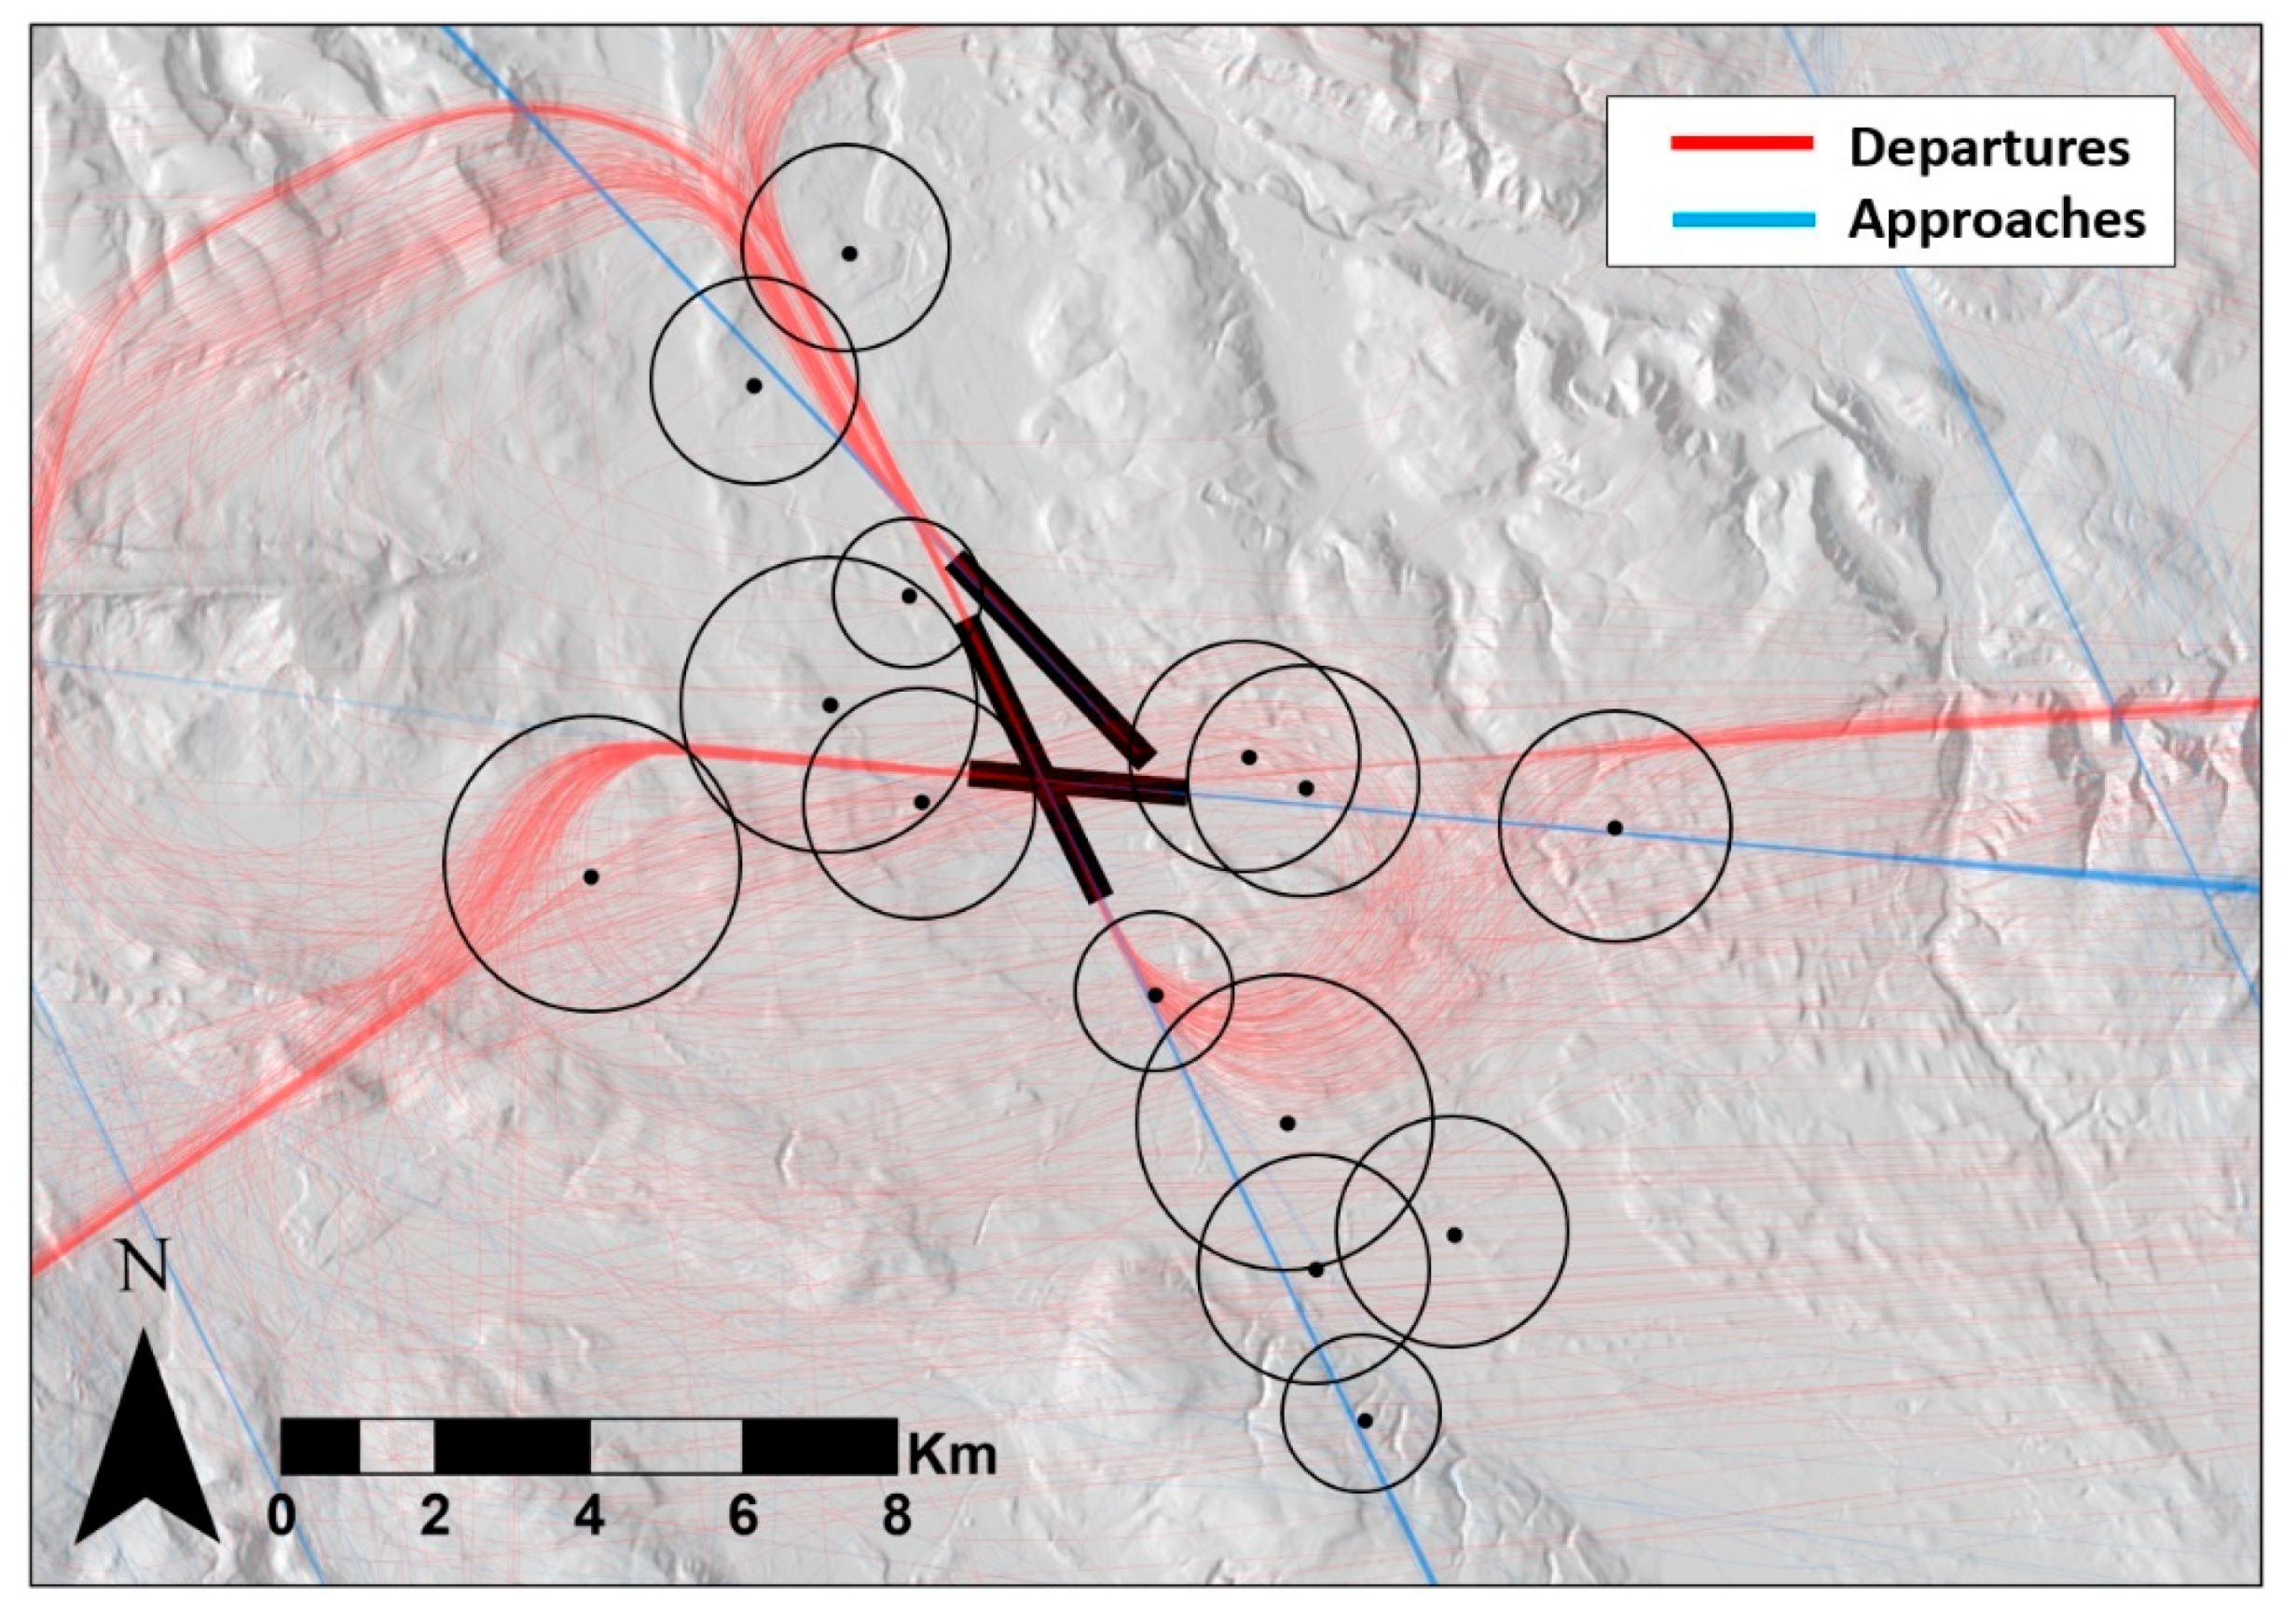
Figure 1 and
Figure 2 show the NMT network in the close range to ZRH and GVA. The NMT network of ZRH consists of 14 terminals which are distributed around the airport to cover the major departure and approach routes. The NMT network of GVA consists of 4 terminals. The black dots in
Figure 1 and
Figure 2 represent the locations of the microphones where the aircraft noise was measured. The black circles around each measurement location represent spatial gates, which the flight trajectories have to penetrate to be considered in this study. In the Figures, all simulated departure and approach trajectories are visualized.
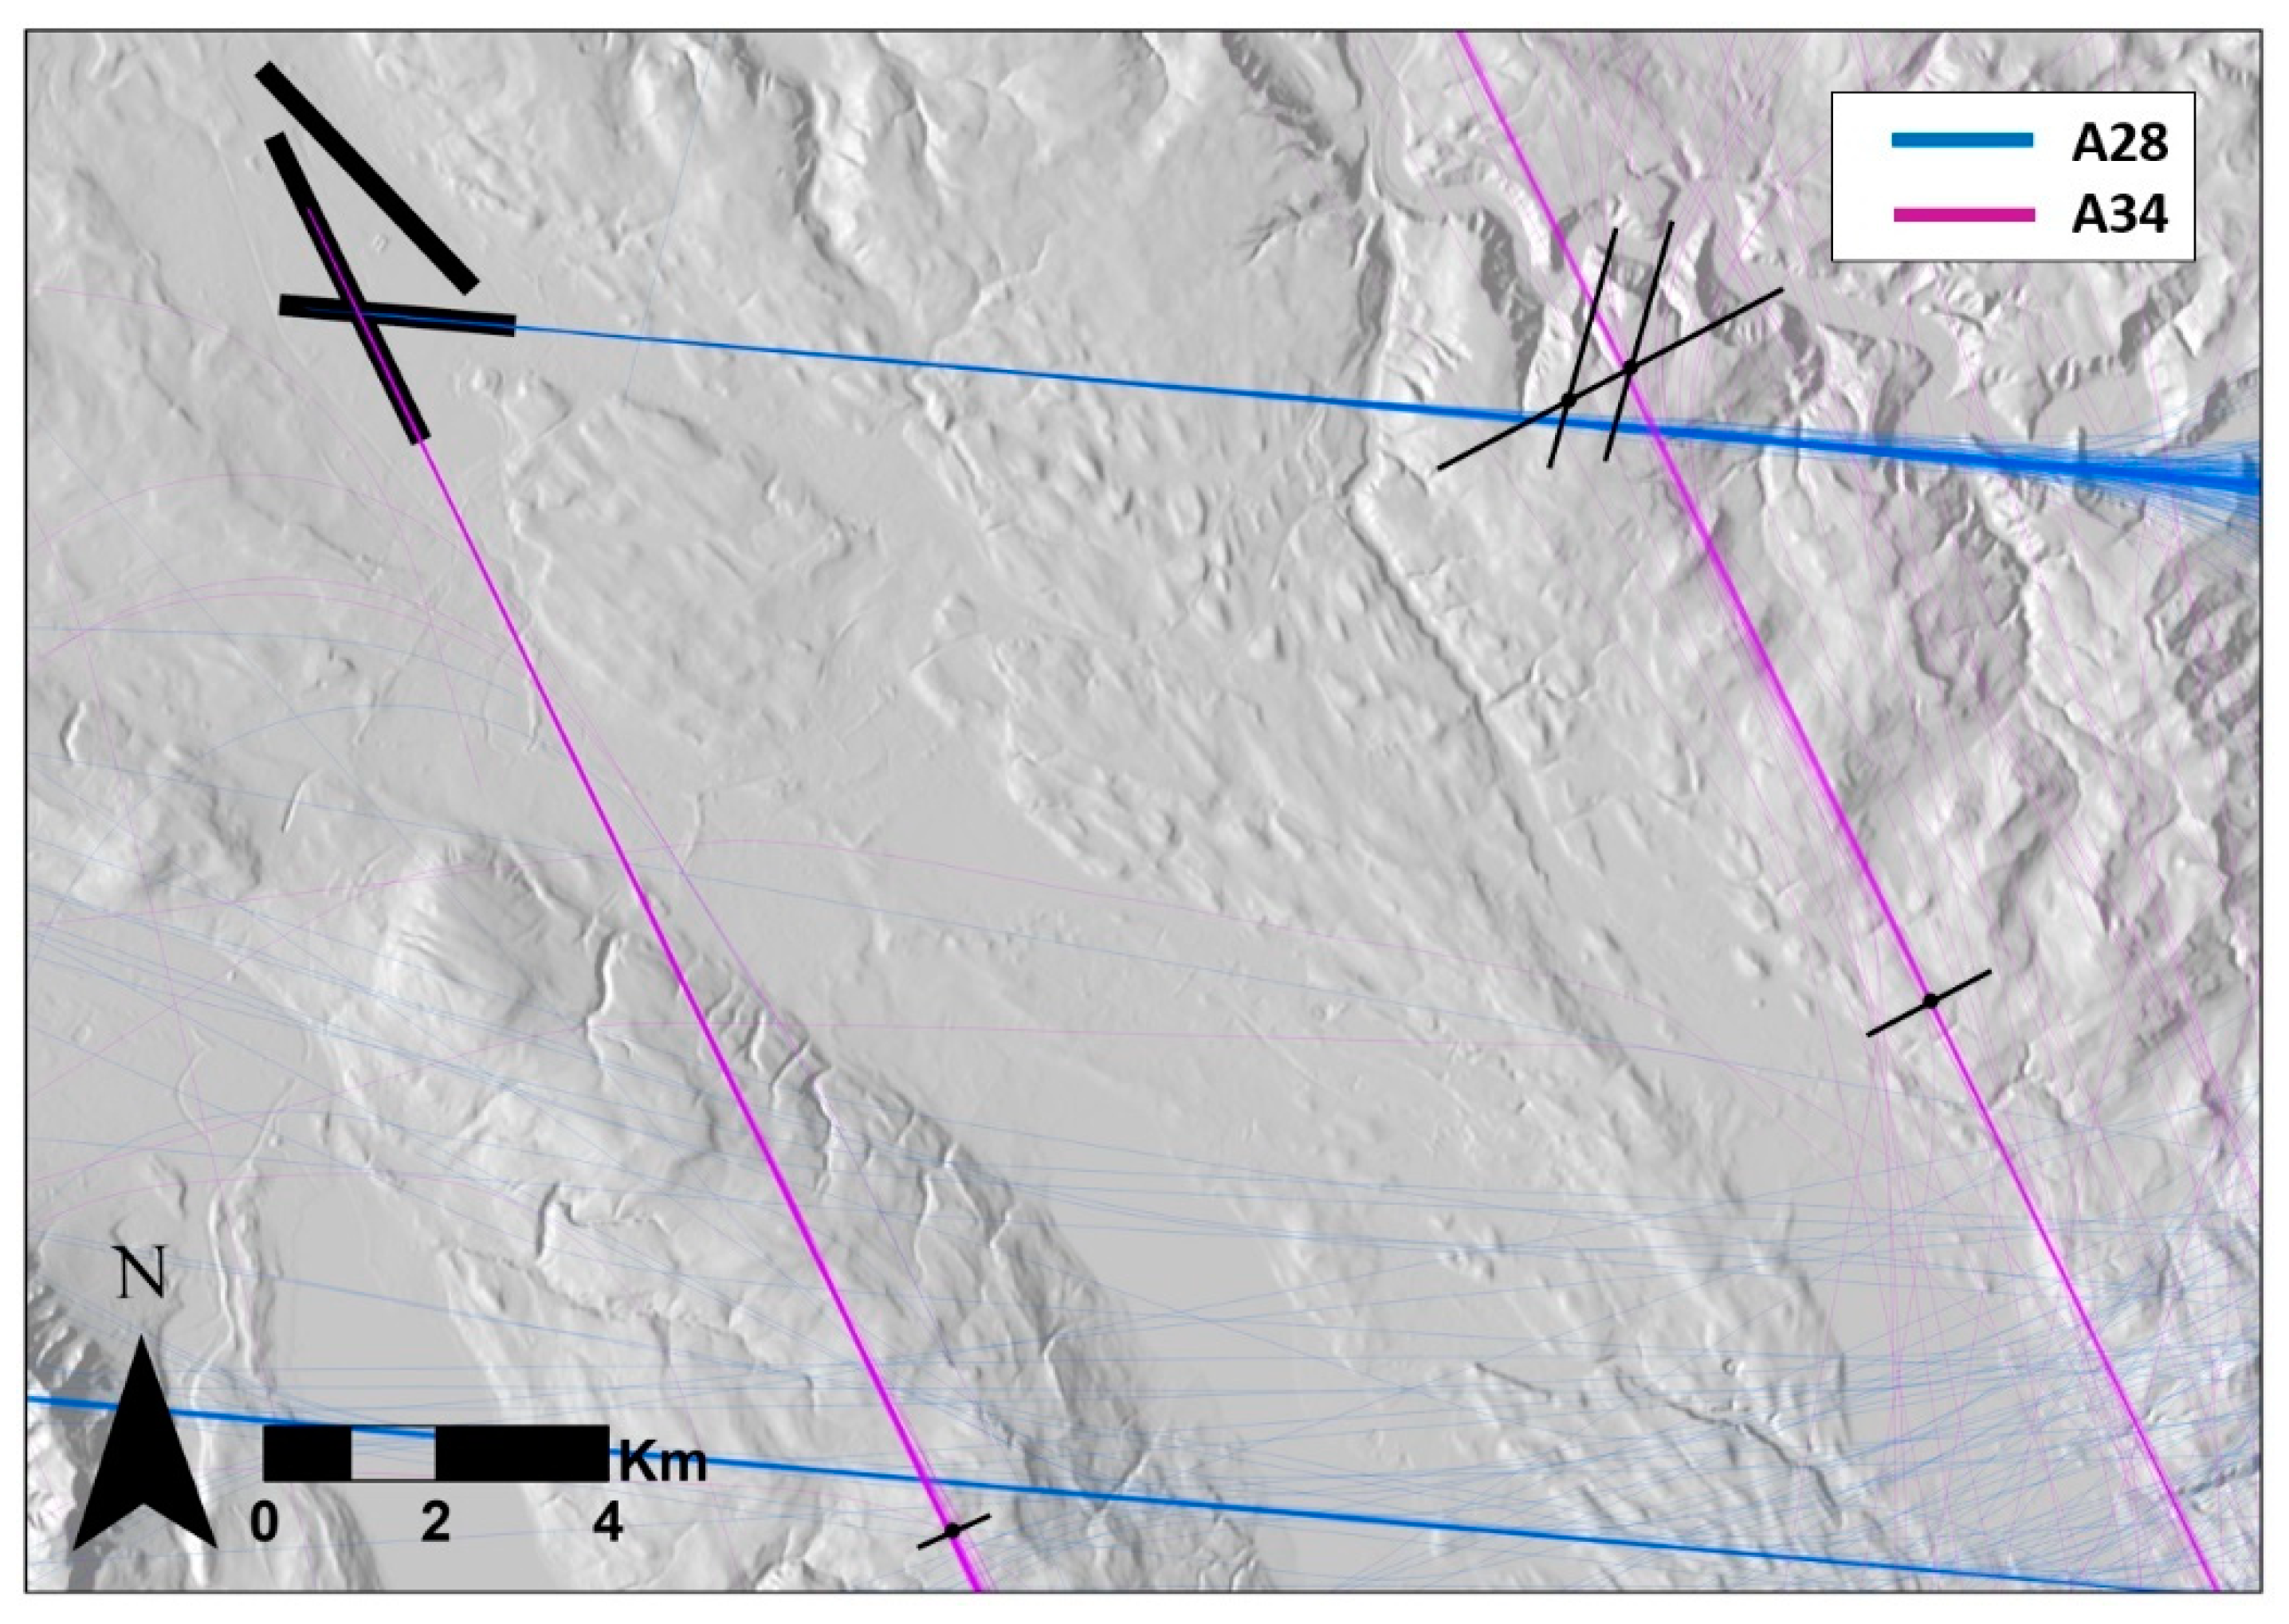
Figure 3 shows the measurement layout in the far range to ZRH. The black lines in this this Figure represent spatial gates, which the flight trajectories have to penetrate to be considered in this study. In this case, approaches on runways 28 (A28) and 34 (A34) were measured.
As measurements conducted during bad weather conditions, such as strong wind situations with wind speeds exceeding 5 m/s and/or rain, generally have higher background noise, they were systematically excluded from the analysis.
2.4. Simulation Input Data
2.4.1. Flight Data
We simulated each individual flight separately using either FDR data or radar data (see
Section 2.1). FDR data were provided by Swiss International Air Lines. If no FDR data were available, we used radar data provided by Flughafen Zürich AG (owner and operator of Zurich Airport). The trajectory data were processed as necessary (e.g., N1 estimation for sonAIR in case of radar data, see above) to serve as inputs for the single flight simulation in sonAIR, FLULA2 and AEDT.
Table 3 provides an overview of the simulated flights that are compared with the corresponding measurements.
2.4.2. Additional Input Data
Weather data for the sonAIR simulations were available as vertical profiles of air pressure, temperature, humidity and wind speed (COSMO-1 forecast data by the Federal Office of Meteorology and Climatology, MeteoSwiss). For FLULA2 and AEDT, standard atmospheric conditions for air pressure (1013.25 hPa) and temperature (15 °C) according to the International Standard Atmosphere (ISA) were used, with 70% relative humidity. Note that while AEDT may also consider specific (e.g., local) meteorological conditions, we used standard atmospheric conditions for AEDT, as we wanted to test how the program performs with default settings (cf.
Section 2.2.3).
sonAIR and FLULA2 both by default perform simulations with terrain data (Digital Terrain Model DTM by the Federal Office of Topography, swisstopo). FLULA2 uses a resolution of 25 m × 25 m in the whole calculation area. sonAIR uses a resolution of 25 m × 25 m in the far range of the airport, but a finer resolution of 2 m × 2 m closer to the airports, to integrate buildings, on which the NMTs were installed, manually from the swissBUILDINGS3D vector based dataset by swisstopo. The terrain model was used in both FLULA2 and sonAIR, to account for receiver height (= microphone height), ground reflections from roofs of the NMT locations (sonAIR only), as well as possible shielding effects (FLULA2: by terrain only, sonAIR: also by buildings close to the airport), which, however, are negligible for the examined microphone locations in this study, given the present terrain situation. In AEDT, we did not model shielding by terrain, but accounted for the true microphone height.
Ground cover data were obtained from the Swiss Map Vector 25 by swisstopo in the far range and from cadastral surveying of the cantons in the close range to the airports, both with a resolution of 5 m × 5 m.
2.4.3. Sound Level Correction in AEDT
The aircraft and engine designations in the input data of the simulated flights had to be renamed to assign a suitable emission dataset in AEDT. If there is no corresponding emission model in the database, AEDT substitutes with a proxy type [
20]. However, the sound emission levels (NPD curves) of the substitution model may differ from the actual aircraft, which needs to be corrected afterwards. The method of the sound level correction is given in Section 6.4 of Doc 29, Volume 1 [
28]. The database for the sound level corrections is the EASA Jet aeroplanes noise database [
29]. The list of aircraft types simulated with AEDT, their emission models and corresponding level corrections can be found in
Table S1 in the
Supplementary Materials. Note that for FLULA2 and sonAIR, no substitutions and corresponding level corrections were necessary as all studied aircraft types were available in their data bases.
2.5. Measurement and Calculation Uncertainties
Measurement uncertainties differ between accompanied and automated measurements [
7,
30]. In accompanied measurements, such as those in the far range to ZRH, local influencing factors such as ambient noise or reflections on buildings can largely be excluded. Here, the remaining uncertainty is due to the measurement devices and amounts to around 0.5 dB (68% standard uncertainty). Automated measurements, such as the NMT stations in the close range to ZRH and GVA, are characterized by less controlled measurement conditions. The locations might not be ideal from an acoustical point of view, and event trigger levels are used for recordings. In addition to device-related uncertainties, buildings and ambient noise may affect the accuracy of the measurement. Depending on the locations, the measurement uncertainty amounts to 0.5–0.9 dB [
7,
30].
Besides, calculations are also afflicted by input data and (sound emission and propagation) modelling uncertainties, which vary along the flight path [
6,
7,
8]. The calculation uncertainties for FLULA2 were estimated to amount to between 0.5 dB (day) and 1.0 dB (night) for legally relevant yearly noise exposures L
Aeq ≥ 53 dB (day) and L
Aeq ≥ 43 dB (night), respectively [
6,
7]. These values are likely to be similar for sonAIR and AEDT.
When comparing the simulation results with the measurement and interpreting the differences, one should keep these uncertainties in mind [
7,
31].
3. Results
This section shows the comparisons between the simulations with the different programs and the measurements. The comparisons are separately done for each program and distinguished between events with FDR data (referred to as “FDR” in the following) and without FDR data available (“nonFDR”), as well as in close and far range to the airports. Note that the subsequent plots display multiple aircraft types and measurement locations with different local conditions. A list with mean values and standard deviation of the differences between calculations and measurements of the three models for each aircraft type can be found in
Tables S2–S4 in the
Supplementary Materials.
3.1. Close Range to Airports, FDR
The aircraft types with FDR data included (“FDR types”) in the study in close range to the airports are given in
Table 1.
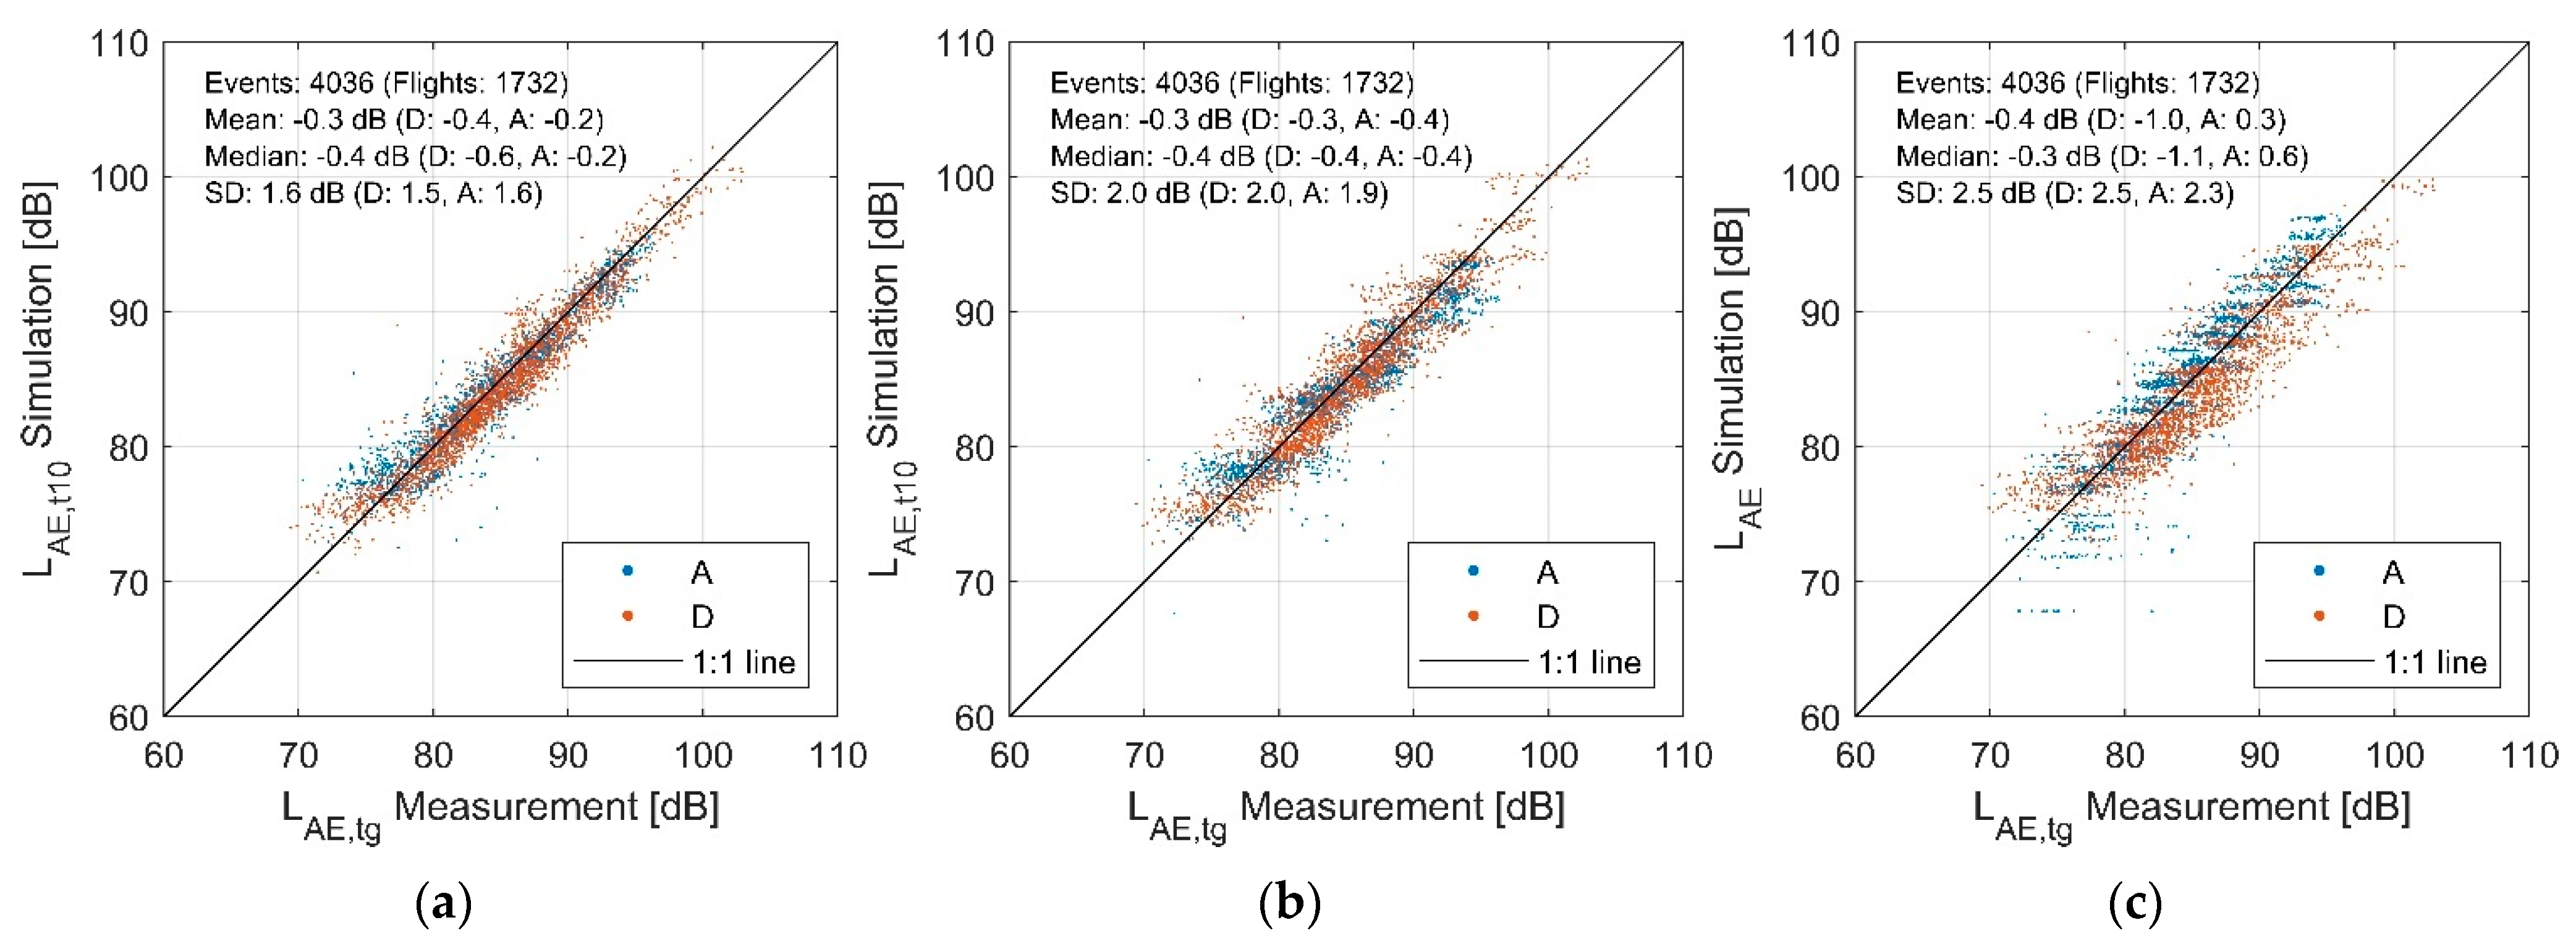
Figure 4 shows the differences between corresponding calculations and measurements with scatterplots, separately for all three programs.
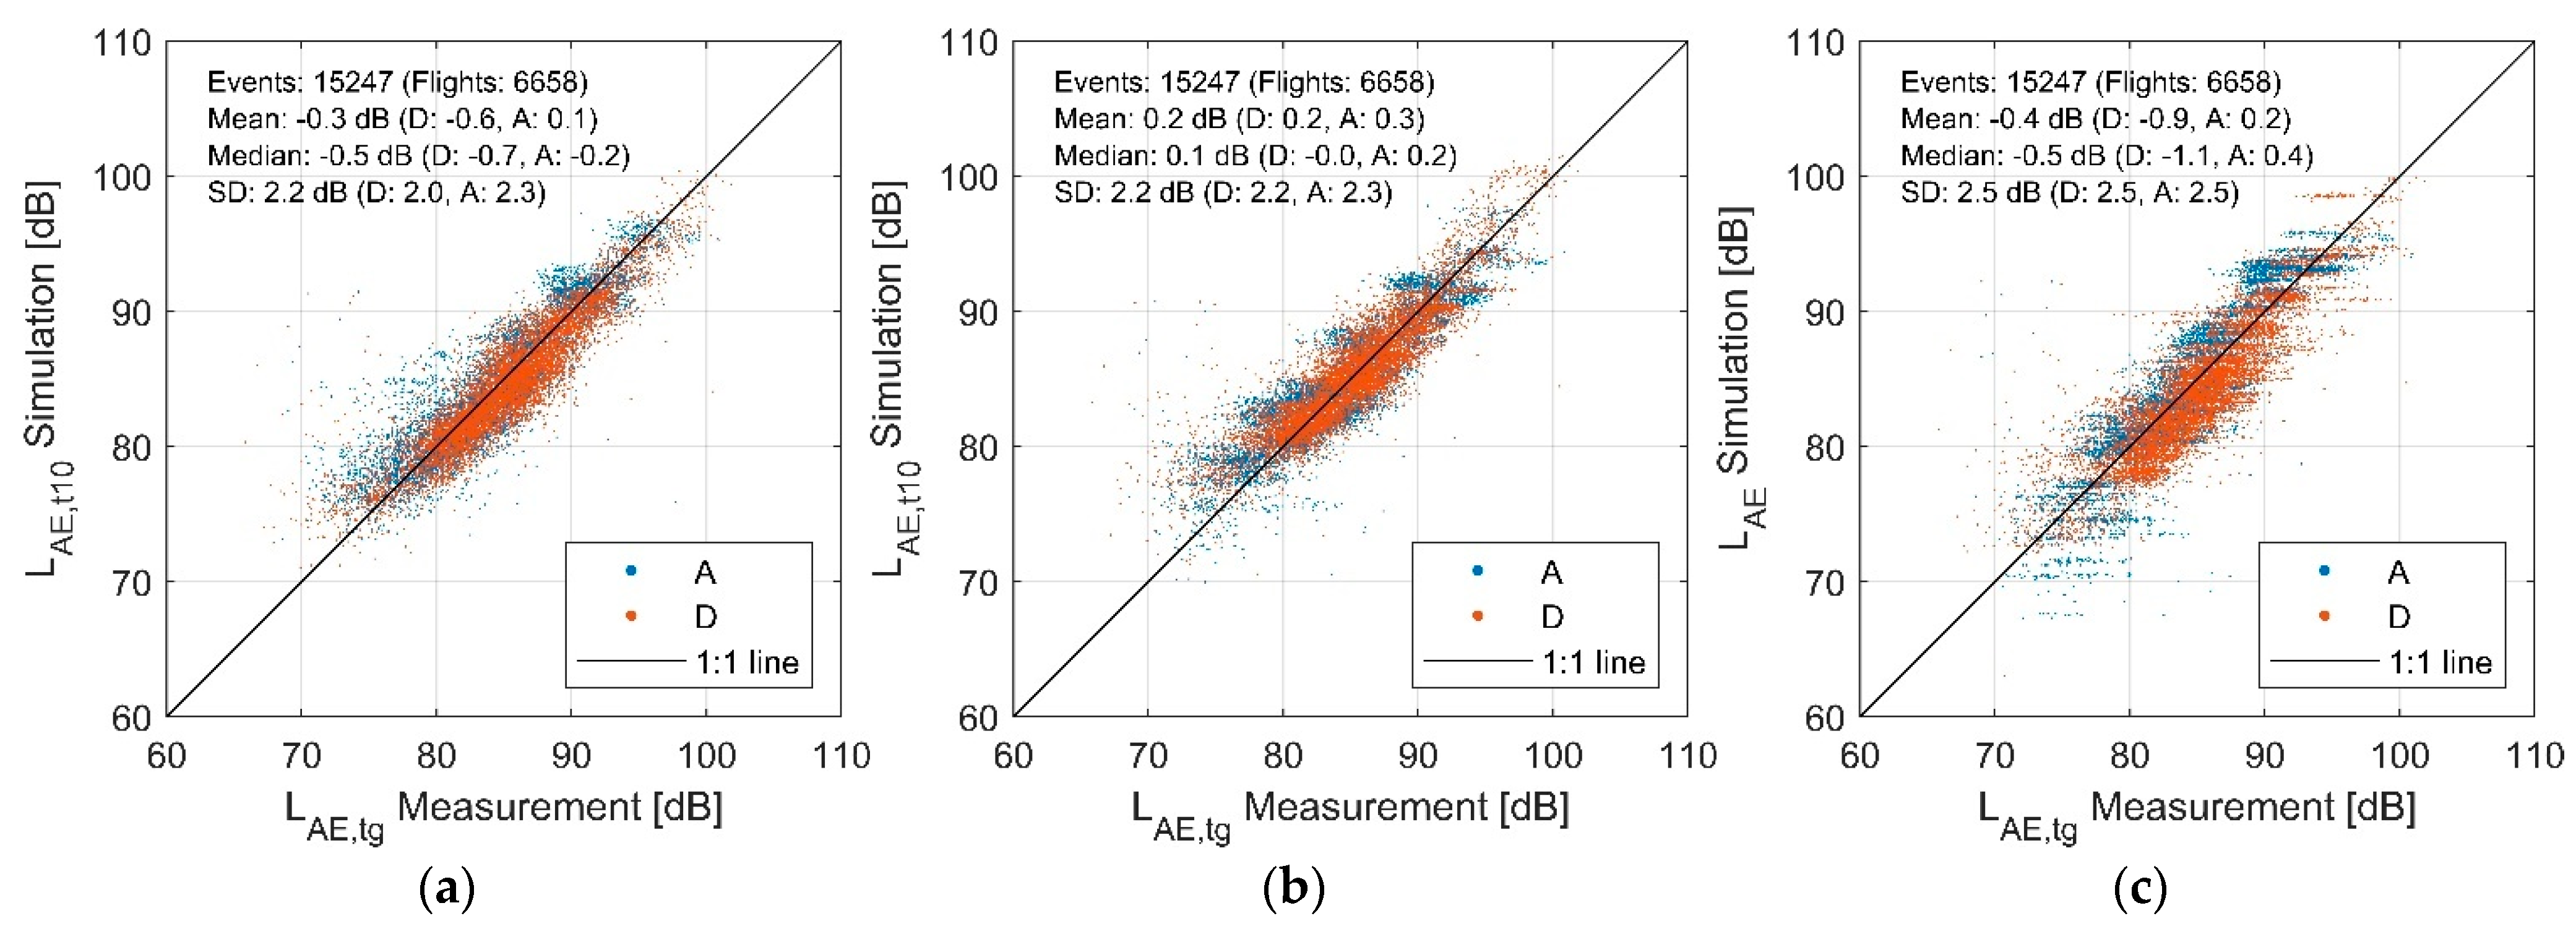
Overall, there is a very good agreement between calculations and measurement in the close range with sonAIR. The single event level LAE,t10 is slightly underestimated (−0.3 dB), with departures particularly contributing to this underestimation. The standard deviation for the LAE,t10 is 1.6 dB.
The L
AE,t10 calculated with FLULA2 also agree well with measurements. Overall, calculations slightly underestimate measurements by −0.4 dB, but this difference is substantially smaller than the measurement and calculation uncertainties (
Section 2.5). In the scatter plot, there are slight horizontal stratifications, which are due to the rigid directivity patterns of FLULA2. For sonAIR with dynamic sound source data, these stratifications are not visible.
The overall simulation results obtained with AEDT also agree well with measurements. The scattering is somewhat larger than for sonAIR and FLULA2. The LAE for departures are generally underestimated and those for approaches generally overestimated. As in FLULA2, there are horizontal stratifications visible in the scatter plot. The reason in this case is that AEDT uses type-specific standard procedural profiles for the calculations in this study, in which the thrust and altitude profile is the same for a large number of flights. Especially for quieter approaches, some aircraft type-specific deviations can be identified, which appear as horizontally layered clusters.
sonAIR is able to represent all aircraft types with high accuracy, while FLULA2 and especially AEDT show more type-specific deviations. For more details on specific aircraft types, we refer to
Table S2 of the
Supplementary Materials.
3.2. Close Range to Airports, nonFDR
The aircraft types without FDR data included (“nonFDR types”) in the study in close range to the airports are given in
Table 1.
Figure 5 shows the differences between corresponding calculations and measurements with scatterplots, separately for all three programs.
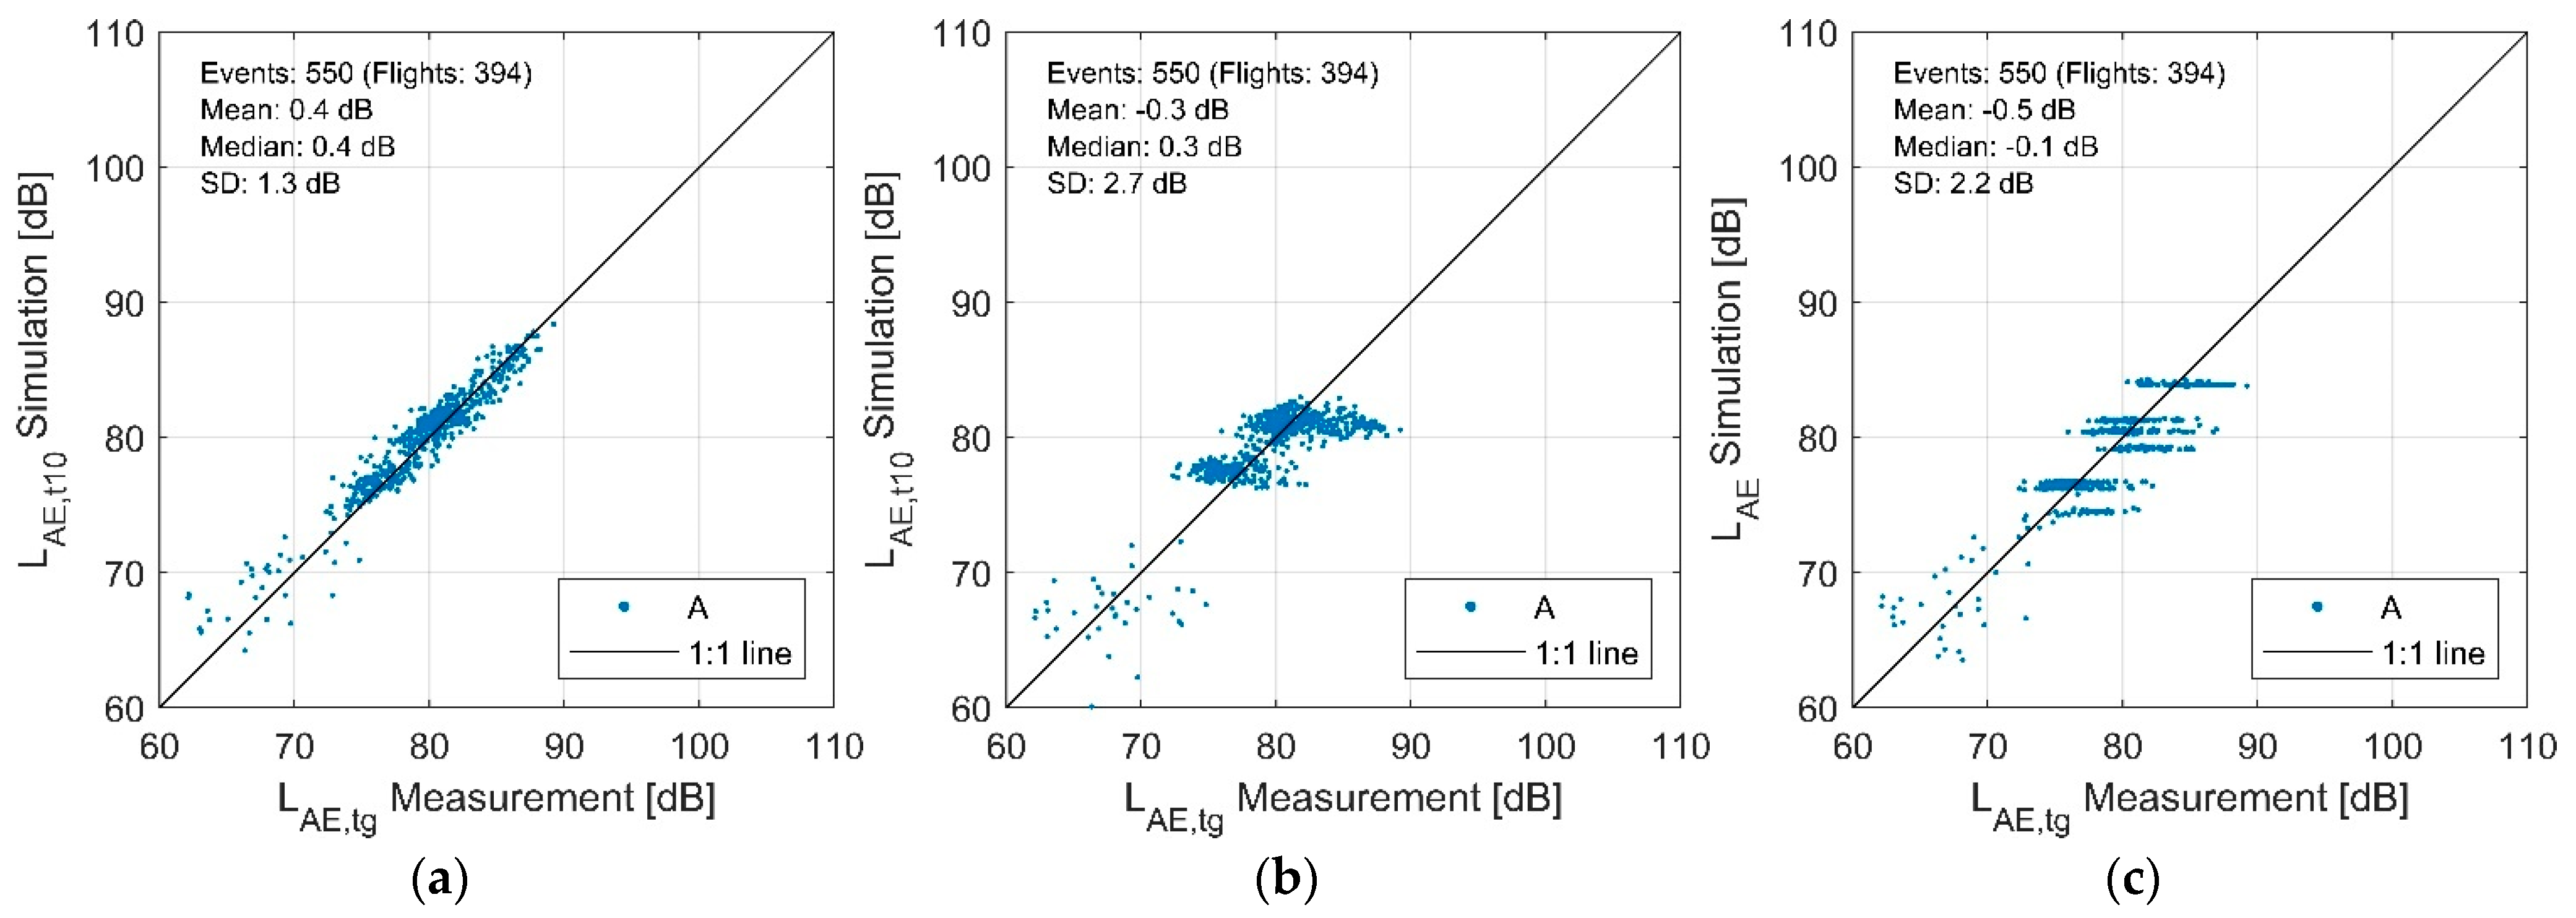
On average, sonAIR reproduces the measurements as good as with the FDR types, with a mean difference of −0.3 dB, but with a larger standard deviation of 2.2 dB. Departures are again slightly underestimated, while the approaches show on average a very good match.
Overall, there is also a good agreement between calculations and measurements for FLULA2. The standard deviation is very similar for calculations with FDR data. Nevertheless, a larger number of outliers is visible, especially in cases of lower L
AE,t10. This is further discussed in
Section 3.4.
The calculations of AEDT with nonFDR types also show on average a good agreement with the measurements. As with the FDR types, approaches are generally overestimated and departures are underestimated. The standard deviation of 2.5 dB is the same as for calculations with FDR data. This was expected, as AEDT and FLULA2, in contrast to sonAIR, do not include additional flight parameters from the FDR data. Again, horizontal stratifications are visible for both FLULA2 and AEDT.
As for the FDR types, the differences in aircraft type-specific differences are smallest for sonAIR. FLULA2 and especially AEDT show larger differences. The corresponding data can be found in
Table S3 of the
Supplementary Materials.
3.3. Far Range to Airports, FDR
The aircraft types with FDR data included (“FDR types”) in the study in far range to the airports are A319, A320, A321, A333, A343.
Figure 6 shows the differences between corresponding calculations and measurements with scatterplots, separately for all three programs.
sonAIR reproduced the measured noise exposure values well over all microphone locations and aircraft types. On average, there is a slight overestimation, with a mean difference of +0.4 dB and a standard deviation of 1.3 dB. In the area of lower sound pressure levels (corresponding to larger propagation distances/flight distances to touchdown), a slightly increased scattering can be observed. These differences are likely a consequence of turbulence induced scattering of the measured levels, which tends to be more pronounced at greater propagation distances. Another uncertainty arises from the fact that sonAIR has to estimate the sound emission outside of the verified model parameter range in these cases (extrapolation of model parameters).
The calculations with FLULA2 show, on average, a good agreement with the measurements. However, the differences are clearly larger than in the close range, especially for approaches on runway 34 with an underestimation of 3.2 dB (see
Table 4). For FLULA2, the scattering is substantially larger in situations with L
AE,t10 below 70 dB. In addition, the horizontal stratifications in the scatter plot are more pronounced than in the close range. This is expected, as FLULA2 has fixed directivity patterns, which represent the configuration of the final approach state. Therefore, FLULA2 can represent flight conditions far away from the airport only to a limited extent, and larger differences to measurements, as observed here, may occur.
Overall, the calculations with AEDT show good agreement with the measurements. The standard deviation of 2.2 dB is similar to the close range. Similar to FLULA2, the horizontal stratification in the scatter plot is more pronounced, whereby two horizontal clusters are clearly to the right of the 1:1 line (at simulated LAE of ~75 and 80 dB). These are the calculations of one specific aircraft type, which AEDT seems to generally underestimate (about 2 dB lower LAE than FLULA2 and sonAIR). This might be explained by the fact that this type is poorly mapped by the NPD curves of its proxy type in AEDT.
3.4. Overall Comparison of the Three Aircraft Noise Programs
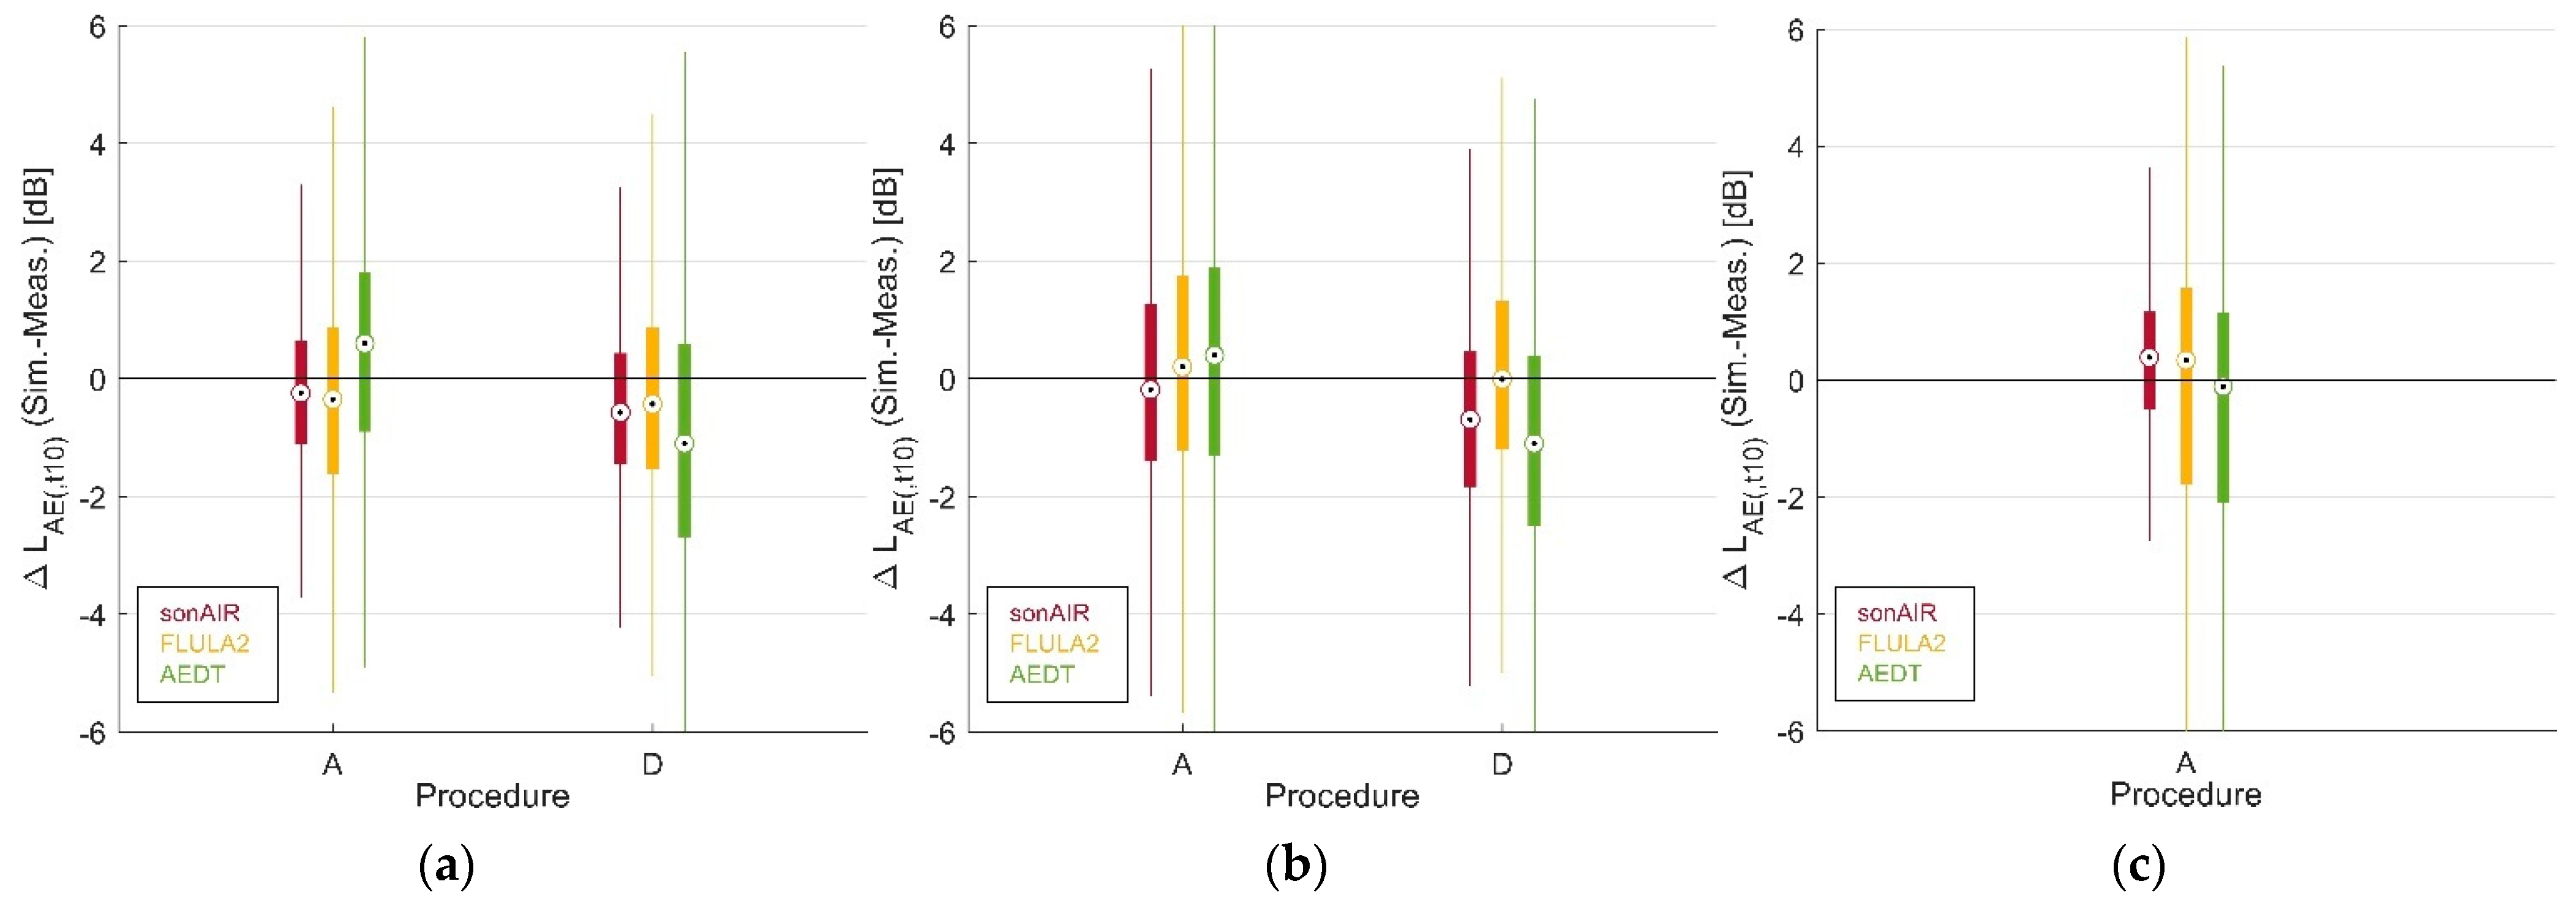
Figure 7 shows the overall performance comparison (differences in calculations vs. measurements) of the three models with Box-Whiskers-plots, separately for approaches and departures.
Table 4 numerically summarizes the results presented in
Figure 7. In the close range to the airports, sonAIR and FLULA2 reproduce the measured values similarly well, with differences mostly smaller than 0.5 dB, while the calculations with AEDT show an overestimation for approaches (up to 0.6 dB) and a more pronounced underestimation for departures (up to −1.1 dB). In addition, for the FDR types, sonAIR has the smallest standard deviations (up to 1.6 dB) and AEDT has the largest (2.5 dB); FLULA2 lies in between (2.5 dB). For the nonFDR types, sonAIR calculations show similar standard deviations as FLULA2 and AEDT (
Table 4).
In the far range, all three models show, on average, good agreement with the measurement data. The smallest standard deviations are obtained with the sonAIR calculations.
Figure 8 and
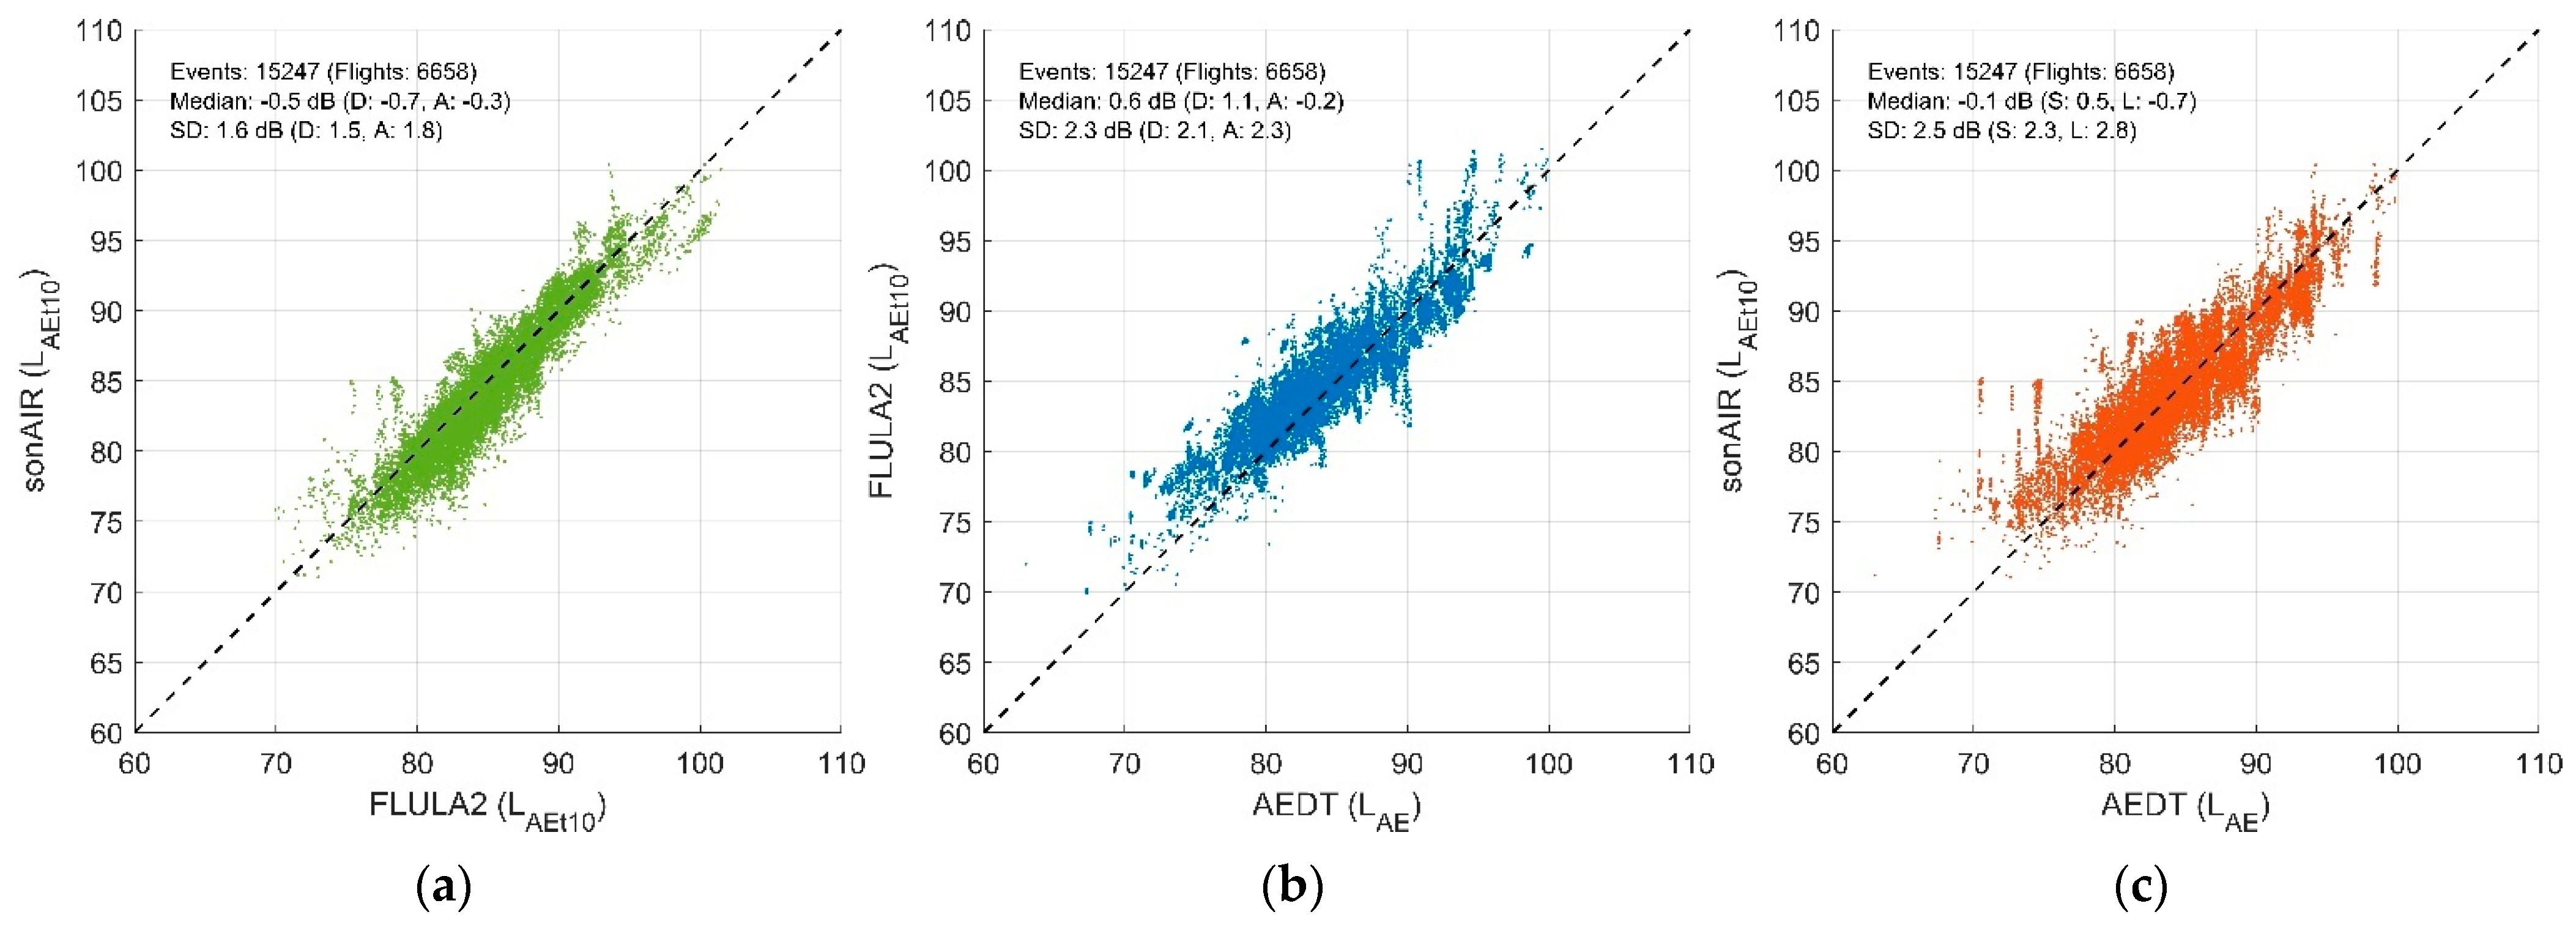
Figure 9 compare the calculated L
AE,t10 (L
AE for AEDT) of the three models for the datasets with and without FDR data in the close range to ZRH and GVA. This gives an indication of the overall agreement between the three model calculations (the results of the far range are not included in this comparison, as the number of flights are limited, and as only approaches of FDR types are available). The calculated event levels with sonAIR and FLULA2 agree well for both, FDR and nonFDR types, with a moderate standard deviation of 1.6 dB. This was expected, as FLULA2’s sound source data for the aircraft types of the present study were derived from sound source data of sonAIR (
Section 2.2.2). Thus, differences between sonAIR and FLULA2 are exclusively due to different underlying modelling approaches, but not different databases. The comparisons of AEDT with FLULA2 and sonAIR show somewhat larger deviations from the 1:1 line. The standard deviation varies between 2.2 and 2.5 dB. This may be due to aircraft type or measurement location specific differences in the calculated event levels. Larger differences between AEDT and sonAIR/FLULA2 were expected, as AEDT differs not only with respect to underlying modelling approaches, but also databases (NPD curves and standard procedural profiles). Overall, there are no systematic differences between the three programs, indicating that their calculation results are equivalent on average.
Larger outliers as observed in
Figure 4 and especially
Figure 5 mostly vanish. These deviations are therefore likely due to turbulence-induced sound propagation effects and/or ambient noise contaminations that neither of the examined calculation programs accounts for.
4. Discussion
In this study, a comparison and systematic validation of three inherently different aircraft noise calculation programs, namely sonAIR, FLULA2 and AEDT, was performed with a large measurement data set.
The calculations with sonAIR show a very good agreement with the measurements, both in the close and in the far range to the airports, although the L
AE,t10 of departures is generally slightly underestimated. If FDR data are available as input, sonAIR is particularly accurate, with smaller standard deviations of the differences to the measurements than those of FLULA2 and AEDT. This is particularly evident in the far range, where sonAIR calculates noise exposure with a standard deviation of 1.3 dB, compared to 2.7 dB of FLULA2 and 2.2 dB of AEDT. By considering airplane configuration and the separation of engine and airframe noise, approaches in particular can thus be more accurately reproduced by sonAIR. Only a few nonFDR types show somewhat larger mean differences: here, sonAIR performs similarly accurately as FLULA2. Also the far range calculations would be less accurate if no FDR data were available, with roughly 1 dB larger standard deviations [
11].
In the close range, the L
AE,t10 calculated by FLULA2 also agree well with the measurements. However, FLULA2 is not able to reproduce the L
AE,t10 of all aircraft types equally well as sonAIR, and a larger number of aircraft type-specific differences larger than 1 dB result. In the far range, FLULA2 shows a strong underestimation of −3.2 dB for approaches on runway 34 (see
Table 4). During the entire approach phase, FLULA2 uses static source model representing final approach configuration. This leads to an underestimation of the airframe noise far from the airport when airplane speeds are higher than close to touchdown. The FLULA2 emission patterns therefore only partially represent flight conditions far from airports, where, e.g., flaps and gears settings are completely different.
AEDT also overall yields a good agreement with measurements, in the near and far range to the airports, although in close range, approaches tend to be overestimated while departures are underestimated. The differences to measurements in the close range are generally greater than for sonAIR and FLULA2. In interpreting these results, however, one should keep in mind that AEDT’s sound source database does not cover all aircraft engine types that we measured. Thus, they had to be substituted with comparable proxy types in some cases. In addition, contrary to sonAIR and FLULA2, neither sound source data nor flight profiles were specifically tuned to the local conditions of ZRH and GVA.
This study shows that sonAIR is clearly more accurate than the best practice models FLULA2 and AEDT if FDR data with flight configuration information are available for calculations. In this case, sonAIR can exploit its full potential, by using the best possible 3D source model with detailed consideration of the flight configurations. For calculations without FDR data, all three models show similar results. However, for all three programs, the accuracy of calculations varies between different aircraft types; here, the fleet mix determines how well the results are on average. For yearly aircraft noise calculations with a fleet consisting of many aircraft types, this point is not critical. While both FLULA2 and sonAIR are based on measurement data around ZRH and therefore adapted to local conditions such as the exact aircraft fleet, flight profiles, etc., in this region, this is not the case for AEDT. By adjusting the source data, AEDT in particular could be better tuned to local conditions which would improve modelling results. However, input data adjustment and corresponding calculations were beyond scope of this paper.
In conclusion, there are no systematic differences between the three models, indicating that their calculation results are equivalent on average. All three programs are well suited to reproduce measurements sufficiently accurate on average and thus also to determine averaged noise metrics resulting from complex scenarios consisting of many flights (e.g., yearly air operations), while sonAIR is additionally capable to highly accurately reproduce single flights in greater detail. sonAIR also shows the lowest aircraft type specific deviations, which makes it more robust with respect to single-flight simulations.
5. Conclusions
In this study, we calculated the A-weighted sound exposure level of several thousand single flights with three different aircraft noise calculation programs at receiver locations around Zurich and Geneva airports. We compared the results to measurements and between the programs. Overall, all three models yield results that achieve good agreement between each other and with the measurements. Using FDR data, sonAIR shows a substantially lower deviation from measurements than FLULA2 and AEDT, for both, departures and approaches, especially in far range to the airports. Without using FDR data, however, the deviations are similar to those of FLULA2 in the close range. However, substantially more aircraft type and measurement location-specific deviations larger than 1 dB occur with calculations of FLULA2 than with sonAIR, especially in the far range. This reveals the advantage of the sonAIR modeling approach with dynamic and separate sound source models for engine and airframe noise. AEDT also reproduced the measurements well, in both, the close and far range to the airports, with slightly larger mean differences and standard deviations than sonAIR and FLULA2. However, standardized procedural profiles and NPD curves were used without adaptions to the local conditions, while FLULA2 and sonAIR are adjusted to specific Swiss conditions. Consequently, AEDT can be attested a high modelling performance as well.
In conclusion, the present study shows that, on average, all three inherently different modelling approaches of the aircraft noise calculation programs are able to reproduce measurements in the close and far range sufficiently accurate, with mean differences below 1 dB. All three programs are therefore well suited to determine averaged noise metrics resulting from complex (e.g., yearly) airport scenarios. The strength of sonAIR is shown especially if FDR data are available and/or in the far range of airports, being able to reproduce individual flights very precisely (low scatter).
Supplementary Materials
The following are available online at
https://www.mdpi.com/article/10.3390/aerospace8120388/s1, Table S1: List of aircraft types simulated with AEDT, their emission models and corresponding level corrections, Tables S2–S4: List of emission models with FDR data in the close range (ZRH and GVA combined), with mean values and standard deviations between calculations and measurements, separately for departures and approaches.
Author Contributions
Conceptualization, B.S.; data processing, J.M., S.S., D.J. and C.Z.; formal analysis, J.M., S.S. and D.J.; funding acquisition, B.S.; investigation, J.M., S.S., D.J. and C.Z.; project administration, B.S.; writing—original draft, J.M. and S.S.; writing—review & editing, J.-M.W., D.J., C.Z. and B.S. All authors have read and agreed to the published version of the manuscript.
Funding
This study (research project CompAIR) was funded by the Swiss Federal Office for the Environment FOEN (assignment No. 5211.01812.100.01). The manuscript preparation was funded by the authors’ institution, Empa.
Institutional Review Board Statement
Not applicable.
Informed Consent Statement
Not applicable.
Data Availability Statement
Not applicable.
Acknowledgments
We would like to thank the Swiss International Airlines and Zurich and Geneva Airport for permission to use the data for this study.
Conflicts of Interest
The authors declare no conflict of interest.
References
- Schäffer, B.; Thomann, G.; Huber, P.; Brink, M.; Plüss, S.; Hofmann, R. Zurich Aircraft Noise Index: An index for the assessment and analysis of the effects of aircraft noise on the population. Acta Acust. United Acust. 2012, 98, 505–519. [Google Scholar] [CrossRef]
- Peris, E. Environmental Noise in Europe—2020; European Environment Agency (EEA): Luxembourg, 2020. [Google Scholar]
- Jarup, L.; Babisch, W.; Houthuijs, D.; Pershagen, G.; Katsouyanni, K.; Cadum, E.; Dudley, M.-L.; Savigny, P.; Seiffert, I.; Swart, W.; et al. Hypertension and exposure to noise near airports: The HYENA study. Environ. Health Perspect. 2008, 116, 329–333. [Google Scholar] [CrossRef] [PubMed]
- WHO. Environmental Noise Guidelines for the European Region; WHO: Copenhagen, Denmark, 2018. [Google Scholar]
- EASA; EEA; EUROCONTROL. European Aviation Environmental Report 2019; EASA: Cologne, Germany, 2019. [Google Scholar]
- Schäffer, B.; Plüss, S.; Thomann, G. Estimating the model-specific uncertainty of aircraft noise calculations. Appl. Acoust. 2014, 84, 58–72. [Google Scholar] [CrossRef]
- Thomann, G. Uncertainties of Measured and Calculated Aircraft Noise and Consequences in Relation to Noise Limits (Mess-und Berechnungsunsicherheit von Fluglärmbelastungen und ihre Konsequenzen). Ph.D. Dissertation, Diss. ETH Nr. 17433, ETH Zurich, Zurich, Switzerland, 2007. [Google Scholar]
- Bertsch, L.; Schäffer, B.; Guérin, S. Uncertainty Analysis for Parametric Aircraft System Noise Prediction. J. Aircr. 2019, 56, 529–544. [Google Scholar] [CrossRef]
- Rhodes, D.; Ollerhead, J. Aircraft noise model validation. In Proceedings of the INTER-NOISE and NOISE-CON Congress and Conference Proceedings, The Hague, The Netherlands, 27–30 August 2001. [Google Scholar]
- Buetikofer, R.; Thomann, G. Validation of FLULA, a time-step model for aircraft noise calculations. In INTER-NOISE and NOISE-CON Congress and Conference Proceedings; Institute of Noise Control Engineering: West Lafayette, IN, USA, 2001. [Google Scholar]
- Jäger, D.; Zellmann, C.; Schlatter, F.; Wunderli, J.M. Validation of the sonAIR aircraft noise simulation model. Noise Mapp. 2020, 8, 95–107. [Google Scholar] [CrossRef]
- Bertsch, L.; Sanders, L.; Thomas, R.H.; Le Griffon, I.; June, J.C.; Clark, I.A.; Lorteau, M. Comparative Assessment of Aircraft System Noise Simulation Tools. J. Aircr. 2021, 58, 4. [Google Scholar] [CrossRef]
- Zaporozhets, O.; Levchenko, L. Accuracy of Noise-Power-Distance Definition on Results of Single Aircraft Noise Event Calculation. Aerospace 2021, 8, 121. [Google Scholar] [CrossRef]
- Wunderli, J.M.; Zellmann, C.; Köpfli, M.; Habermacher, M.; Schwab, O.; Schlatter, F.; Schäffer, B. sonAIR—A GIS-Integrated Spectral Aircraft Noise Simulation Tool for Single Flight Prediciton and Noise Mapping. Acta Acust. United Acust. 2018, 104, 440–451. [Google Scholar] [CrossRef]
- Zellmann, C.; Schäffer, B.; Wunderli, J.M.; Isermann, U.; Paschereit, C.O. Aircraft Noise Emission Model Accounting for Aircraft Flight Parameters. J. Aircr. 2017, 55, 682–695. [Google Scholar] [CrossRef]
- Jäger, D.; Zellmann, C.; Wunderli, J.M.; Scholz, M.; Abdelmoula, F.; Gerber, M. Validation of an airline pilot assistant system for low-noise approach procedures. Transp. Res. Part D Transp. Environ. 2021, 99, 103020. [Google Scholar] [CrossRef]
- Pietrzko, S.; Hofmann, R.F. Prediction of A-weighted aircraft noise based on measured directivity patterns. Appl. Acoust. 1988, 23, 29–44. [Google Scholar] [CrossRef]
- U.S. Department of Transportation Volpe National Transportation Systems Center. Aviation Environmental Design Tool (AEDT) Version 3c. Technical Manual; U.S. Department of Transportation: Washington, DC, USA, 2020.
- ICAO. Recommended Method for Computing Noise Contours Around Airports. Doc 9911, 1st ed.; International Civil Aviation Organization (ICAO): Montréal, QC, Canada, 2008. [Google Scholar]
- ECAC. ECAC.CEAC Doc 29: Report on Standard Method of Computing Noise Contours around Civil Airports, Volume 1: Applications Guide, 4th ed.; European Civil Aviation Conference (ECAC): Neuilly-sur-Seine, France, 2016. [Google Scholar]
- ECAC. ECAC.CEAC Doc 29: Report on Standard Method of Computing Noise Contours around Civil Airports, Volume 2: Technical Guide, 4th ed.; European Civil Aviation Conference (ECAC): Neuilly-sur-Seine, France, 2016. [Google Scholar]
- Schwab, O.; Zellmann, C. Estimation of Flight-Phase-Specific Jet Aircraft Parameters for Noise Simulations. J. Aircr. 2020, 57, 1111–1120. [Google Scholar] [CrossRef]
- Schlatter, F.; Wunderli, J.M.; Köpfli, M. Relevance of buildings in aircraft noise predictions. In Proceedings of the INTER-NOISE 2018—Impact of Noise Control Engineering, Chicago, IL, USA, 26–29 August 2018. [Google Scholar]
- Empa. FLULA2, a Method for the Calculation and Illustration of Aircraft Noise Exposure. Technical Program Documentation (FLULA2, Ein Verfahren zur Berechnung und Darstellung der Fluglärmbelastung. Technische Programm-Dokumentation), Version 4; Empa, Swiss Federal Laboratories for Materials Science and Technology, Laboratory for Acoustics/Noise Control: Dübendorf, Switzerland, 2010. [Google Scholar]
- Krebs, W.; Bütikofer, R.; Plüss, S.; Thomann, G. Sound source data for aircraft noise simulation. Acta Acust. United Acust. 2004, 90, 91–100. [Google Scholar]
- Federal Office for the Environment (FOEN). Determination of Aircraft Noise. Available online: https://www.bafu.admin.ch/bafu/en/home/topics/noise/info-specialists/determination-and-evalution-of-noise/determination-of-aircraft-noise.html (accessed on 22 September 2021).
- Isermann, U.; Vogelsang, B. AzB and ECAC Doc.29—Two best-practice European aircraft noiseprediction models. Noise Control Eng. J. 2010, 58, 455–461. [Google Scholar] [CrossRef]
- ECAC. DOC.29: Report on Standard Method of Computing Noise Contours around Civil Airports, Volume 1: Applications Guide, 3rd ed.; European Civil Aviation Conference (ECAC): Neuilly-sur-Seine, France, 2005. [Google Scholar]
- European Union Aviation Safety Agency (EASA). EASA Certification Noise Levels. Available online: https://www.easa.europa.eu/domains/environment/easa-certification-noise-levels (accessed on 27 October 2021).
- Bütikofer, R.; Thomann, G. Uncertainty and level adjustments of aircraft noise measurements. In Proceedings of the 2009 International Congress and Exposition on Noise Control Engineering (Inter-Noise 2009), Ottawa, ON, Canada, 23–26 August 2009. [Google Scholar]
- Thomann, G. Measurement and calculation uncertainty of aircraft noise exposure. In Proceedings of the 42nd International Congress and Exposition on Noise Control Engineering, Innsbruck, Austria, 15–18 September 2013. [Google Scholar]
Figure 1.
Noise monitoring terminals (NMT) in close range to ZRH with all flight trajectories used for this study, colored by procedure. The black circles around each terminal represent spatial gates, which the flight trajectories have to penetrate to be considered (basemap: swissALTI3D LV95, swisstopo; source: Federal Office of Topography).
Figure 2.
Noise monitoring terminals (NMT) in close range to GVA with all flight trajectories used for this study, colored by procedure. The black circles around each terminal represent spatial gates, which the flight trajectories have to penetrate to be considered (basemap: swissALTI3D LV95, swisstopo; source: Federal Office of Topography).
Figure 3.
Measuring stations of the measurement campaign in the far range to ZRH with all flight trajectories used for this study. Approaches on runway 28 (A28) are depicted in blue and on runway 34 (A34) in purple. The black lines represent spatial gates, which the flight trajectories have to penetrate to be considered (basemap: swissALTI3D LV95, swisstopo; source: Federal Office of Topography).
Figure 4.
Scatter plots of simulation vs. measurements for aircraft with FDR data in the close range to the airports (ZRH and GVA combined), grouped by procedure (D: Departure, A: Approach, SD: Standard deviation). (a) sonAIR, (b) FLULA2, (c) AEDT.
Figure 4.
Scatter plots of simulation vs. measurements for aircraft with FDR data in the close range to the airports (ZRH and GVA combined), grouped by procedure (D: Departure, A: Approach, SD: Standard deviation). (a) sonAIR, (b) FLULA2, (c) AEDT.
Figure 5.
Scatter plots of simulation vs. measurements for aircraft without FDR data in the close range to the airports (ZRH and GVA combined), grouped by procedure (D: Departure, A: Approach, SD: Standard deviation). (a) sonAIR, (b) FLULA2, (c) AEDT.
Figure 5.
Scatter plots of simulation vs. measurements for aircraft without FDR data in the close range to the airports (ZRH and GVA combined), grouped by procedure (D: Departure, A: Approach, SD: Standard deviation). (a) sonAIR, (b) FLULA2, (c) AEDT.
Figure 6.
Scatter plots of simulation vs. measurements for approaches of aircraft with FDR data in the far range of ZRH. A: Approach, SD: Standard deviation. Note that no departures were recorded (
Section 2.3). (
a) sonAIR, (
b) FLULA2, (
c) AEDT.
Figure 6.
Scatter plots of simulation vs. measurements for approaches of aircraft with FDR data in the far range of ZRH. A: Approach, SD: Standard deviation. Note that no departures were recorded (
Section 2.3). (
a) sonAIR, (
b) FLULA2, (
c) AEDT.
Figure 7.
Box-whisker-plots of differences ∆LAE,t10 for sonAIR and FLULA2 and ∆LAE for AEDT (simulation minus measurements) for all scenarios, grouped by procedure (D: Departure, A: Approach). (a) ZRH & GVA, FDR, close range; (b) ZRH & GVA, nonFDR, close range; (c) ZRH, FDR, far range.
Figure 7.
Box-whisker-plots of differences ∆LAE,t10 for sonAIR and FLULA2 and ∆LAE for AEDT (simulation minus measurements) for all scenarios, grouped by procedure (D: Departure, A: Approach). (a) ZRH & GVA, FDR, close range; (b) ZRH & GVA, nonFDR, close range; (c) ZRH, FDR, far range.
Figure 8.
Scatter plots of the calculated event levels LAEt10 (LAE for AEDT) between the three models for aircraft with FDR data in the close range (ZRH and GVA combined), grouped by procedure (D: Departure, A: Approach, SD: Standard deviation). (a) sonAIR vs. FLULA2; (b) FLULA2 vs. AEDT; (c) sonAIR vs. AEDT.
Figure 9.
Scatter plots of the calculated event levels LAE, t10 (LAE for AEDT) between the three models for aircraft without FDR data in the close range (ZRH and GVA combined), grouped by procedure (D: Departure, A: Approach, SD: Standard deviation). (a) sonAIR vs. FLULA2; (b) FLULA2 vs. AEDT; (c) sonAIR vs. AEDT.
Table 1.
Simulated aircraft types with and without FDR data available. For several aircraft types, both cases occurred.
Table 1.
Simulated aircraft types with and without FDR data available. For several aircraft types, both cases occurred.
| Simulation Models | Aircraft Types (ICAO Designation) |
|---|
| Aircraft Types with FDR Data Available (ICAO Designation): | A319, A320, A321, A333, A343, B77W, BCS1, BCS3 |
| Aircraft Types without FDR Data Available (ICAO Designation): | A319, A320, A321, A333, A343, A388, B733, B734, B735, B736, B737, B738, B739, B762, B763, B764, CRJ7, CRJ9, CRJX, E170, E190, E195, F100, FA7X |
Table 2.
Properties of the three programs for the calculations in the scope of this paper.
Table 2.
Properties of the three programs for the calculations in the scope of this paper.
| Model Properties | sonAIR | FLULA2 | AEDT |
|---|
| Model approach | Time step model | Time step model | Segmented model |
| Noise calculation method | Semi-empirical source model and separate
sound propagation model | Combined sound emission and propagation in an empirical sound emission pattern | Combined sound emission and propagation using noise power distance (NPD) curves |
| Spectral calculation | Yes | No (A-weighted level) | No (A-weighted level) |
| Source model | 3D (aircraft type specific), separate engine and airframe model | 2D (longitudinal directivity) | 3D (2D + engine installation effects) |
| Bank Angle considered | Yes | No (as 2D source model) | Yes |
| Thrust setting considered | Yes (with N1) | No, but separate emission models for departure with max and flex power and for approaches | Yes (calculated thrust) |
| Aircraft weight for thrust estimation | Implicitly in N1 estimation if no FDR data available, not used if FDR data available | D: different sound emission patterns (max and flex power) depending on weight | D: Depending on flight distance A: Max. landing weight |
| Departure Cut-Back | Yes (with N1) | Yes (sound level reduction) | Yes (with thrust) |
| Aircraft configuration | Yes (if FDR data available) | No | No |
| Approach reversed thrust | No | No | Yes |
| Aircraft trajectory | Real 3D trajectory | Real 3D trajectory | 2D (ground track) with standard profiles or 3D with fixed point profiles |
| Terrain | Yes | Yes | Yes |
| Buildings | Yes | No | No |
| Ground properties | Yes | No, soft ground | No, soft ground |
| Weather | Vertical profiles of pressure, temperature, humidity and wind speed | ISA atmosphere | ISA atmosphere or
high fidelity weather data or average airport weather |
| Atmospheric attenuation | ISO 9613-1 | ISO 9613-1 | SAE-ARP-5534 or
SAE-ARP-866A or
SAE-AIR-1845 |
Table 3.
Number of simulated flights and aircraft types.
Table 3.
Number of simulated flights and aircraft types.
| Close/Far Range to Airports | FDR Available | # Flights | Airport (s) | # Different Aircraft Types |
|---|
| close | yes | 1732 | ZRH/GVA | 8 |
| close | no | 6659 | ZRH/GVA | 24 |
| far | yes | 394 | ZRH | 5 |
Table 4.
Differences between simulation and measurements for all scenarios, in brackets separated into departures (D) and approaches (A).
Table 4.
Differences between simulation and measurements for all scenarios, in brackets separated into departures (D) and approaches (A).
| Scenario | Model | Median (dB) | SD (dB) |
|---|
| ZRH & GVA, FDR, close range | sonAIR | −0.4 (D: −0.6, A: −0.2) | 1.6 (D: 1.5, A: 1.6) |
| FLULA2 | −0.4 (D: −0.4, A: −0.4) | 2.0 (D: 2.0, A: 1.9) |
| AEDT | −0.3 (D: −1.1, A: +0.6) | 2.5 (D: 2.5, A: 2.3) |
| ZRH & GVA, nonFDR, close range | sonAIR | −0.5 (D: −0.7, A: −0.2) | 2.2 (D: 2.0, A: 2.3) |
| FLULA2 | 0.1 (D: 0.0, A: +0.2) | 2.2 (D: 2.2, A: 2.3) |
| AEDT | −0.5 (D: −1.1, A: +0.4) | 2.5 (D: 2.5, A: 2.5) |
| ZRH, FDR, far range | sonAIR | 0.4 (A28: +0.5, A34: +0.2) | 1.3 |
| FLULA2 | 0.3 (A28: +0.8, A34: −3.2) | 2.7 |
| AEDT | −0.1 | 2.2 |
| Publisher’s Note: MDPI stays neutral with regard to jurisdictional claims in published maps and institutional affiliations. |
© 2021 by the authors. Licensee MDPI, Basel, Switzerland. This article is an open access article distributed under the terms and conditions of the Creative Commons Attribution (CC BY) license (https://creativecommons.org/licenses/by/4.0/).


 ,
, 


