Article

A Method for Aero-Engine Gas Path Anomaly Detection Based on Markov Transition Field and Multi-LSTM

1
School of Automation Science and Electrical Engineering, Beijing University of Aeronautics and Astronautics, Beijing 100191, China
2
Sichuan Aviation Maintenance Engineering Department, Chengdu 610207, China
*
Authors to whom correspondence should be addressed.
Aerospace 2021, 8(12), 374; https://doi.org/10.3390/aerospace8120374
Submission received: 29 September 2021 / Revised: 23 November 2021 / Accepted: 25 November 2021 / Published: 2 December 2021
(This article belongs to the Section Aeronautics)

Abstract

:
There are some problems such as uncertain thresholds, high dimension of monitoring parameters and unclear parameter relationships in the anomaly detection of aero-engine gas path. These problems make it difficult for the high accuracy of anomaly detection. In order to improve the accuracy of aero-engine gas path anomaly detection, a method based on Markov Transition Field and LSTM is proposed in this paper. The correlation among high-dimensional QAR data is obtained based on Markov Transition Field and hierarchical clustering. According to the correlation analysis of high-dimensional QAR data, a multi-input and multi-output LSTM network is constructed to realize one-step rolling prediction. A Gaussian mixture model of the residuals between predicted value and true value is constructed. The three-sigma rule is applied to detect outliers based on the Gaussian mixture model of the residuals. The experimental results show that the proposed method has high accuracy for aero-engine gas path anomaly detection.

1. Introduction

Aero-engine is the heart of an aircraft, and is also the system with high failure rate and complex maintenance. Working condition of the aero-engine directly affects the reliability of aircraft, and even the safety of passengers [1]. According to incomplete statistics, more than 90% of aero-engine failures are related to gas path components, and the corresponding cost of these failures accounts for 60% of the total maintenance cost. Gas path anomaly detection is the top priority in aero-engine anomaly detection research [2]. Aero-engine gas path anomalies usually include intermittent gas path anomalies and persistent gas path anomalies. Intermittent gas path anomalies are often difficult to be detected because of their short duration, and the detection of such anomalies currently relies mainly on the oral reports of pilots. The Quick Access Recorder (QAR) data records the complete flight process of aircraft [3], and its sampling frequency is up to 1 Hz, which can be applied to detect anomalies of aero-engine gas path.
In recent years, there are more and more researches on anomaly detection of time series. For different manifestations of anomalies, there are four categories, including point anomaly, pattern anomaly, sequence anomaly, and subsequence anomaly. For different detection principles, there are five categories, including distribution-based methods, depth-based methods, clustering-based methods, distance-based methods, and density-based methods. Hao Sun [4] proposed a weakly supervised method based on mapping relationship mining and improved density peak clustering for gas-path anomaly detection of civil aero-engines. Chen, Jiusheng [5] proposed an adaptive weighted one-class SVM-based fault detection method coupled with incremental and decremental strategy. Pérez-Ruiz [6] proposed a hybrid fault-recognition technique based on regularized extreme learning machines and sparse representation classification for both fault detection and fault identification. Zaccaria, Valentina [7] proposed a probabilistic Bayesian network simulated by an adaptive performance model for fault detection and identification for engines. Gharoun, Hassan [8] applied the data-driven methods to analyze the relationship between engine exhaust gas temperature (EGT) and other parameters of the engine, and proposed one-class support vector machine to detect faults in each flight. XIE Ji-wei [9] proposed a method based on Mahalanobis distance for aero-engines health monitoring. Wen Ying [10] proposed an anomaly monitoring method based on self-adaptive kernel principal component analysis. The above methods have carried out research on the aero-engine anomaly detection and have made certain innovations and breakthroughs. However, the detection accuracy of the above methods needs a large number of samples for training. Furthermore, the above methods do not consider the correlation between different monitoring data, and the applicability of the anomaly detection is not strong. In this paper, different time series are transformed into Markov transfer matrix, and a hierarchical cluster is applied to obtain the correlation of time series. Compared with other time series correlation analysis methods, this method reduces the impact of information loss. Multi-LSTM is applied for anomaly detection of time series. As a special cyclic neural network, LSTM not only has the advantages of RNN dynamic memory, but also avoids the gradient disappearance of RNN and the lack of long and short memory ability. LSTM model has advantages of processing the nonlinear aero-engine gas path monitoring data, automatically selecting the optimal time interval and memorizing long-time historical data. Compared with other anomaly detection methods based on LSTM, the construction of multi-LSTM improves the accuracy of prediction and improves the accuracy of anomaly detection furtherly.
The rest of this paper is organized as follows. Aero-engine gas path and monitoring data are introduced briefly in Section 2. In Section 3, the correlation between gas path monitoring data is analyzed based on Markov Transition Field and hierarchical clustering. Section 4 constructs the anomaly detection model based on LSTM and Gaussian anomaly detection model. Section 5 discusses the experiment results and evaluates the accuracy of proposed anomaly detection model. Finally, Section 6 summarizes the conclusions.

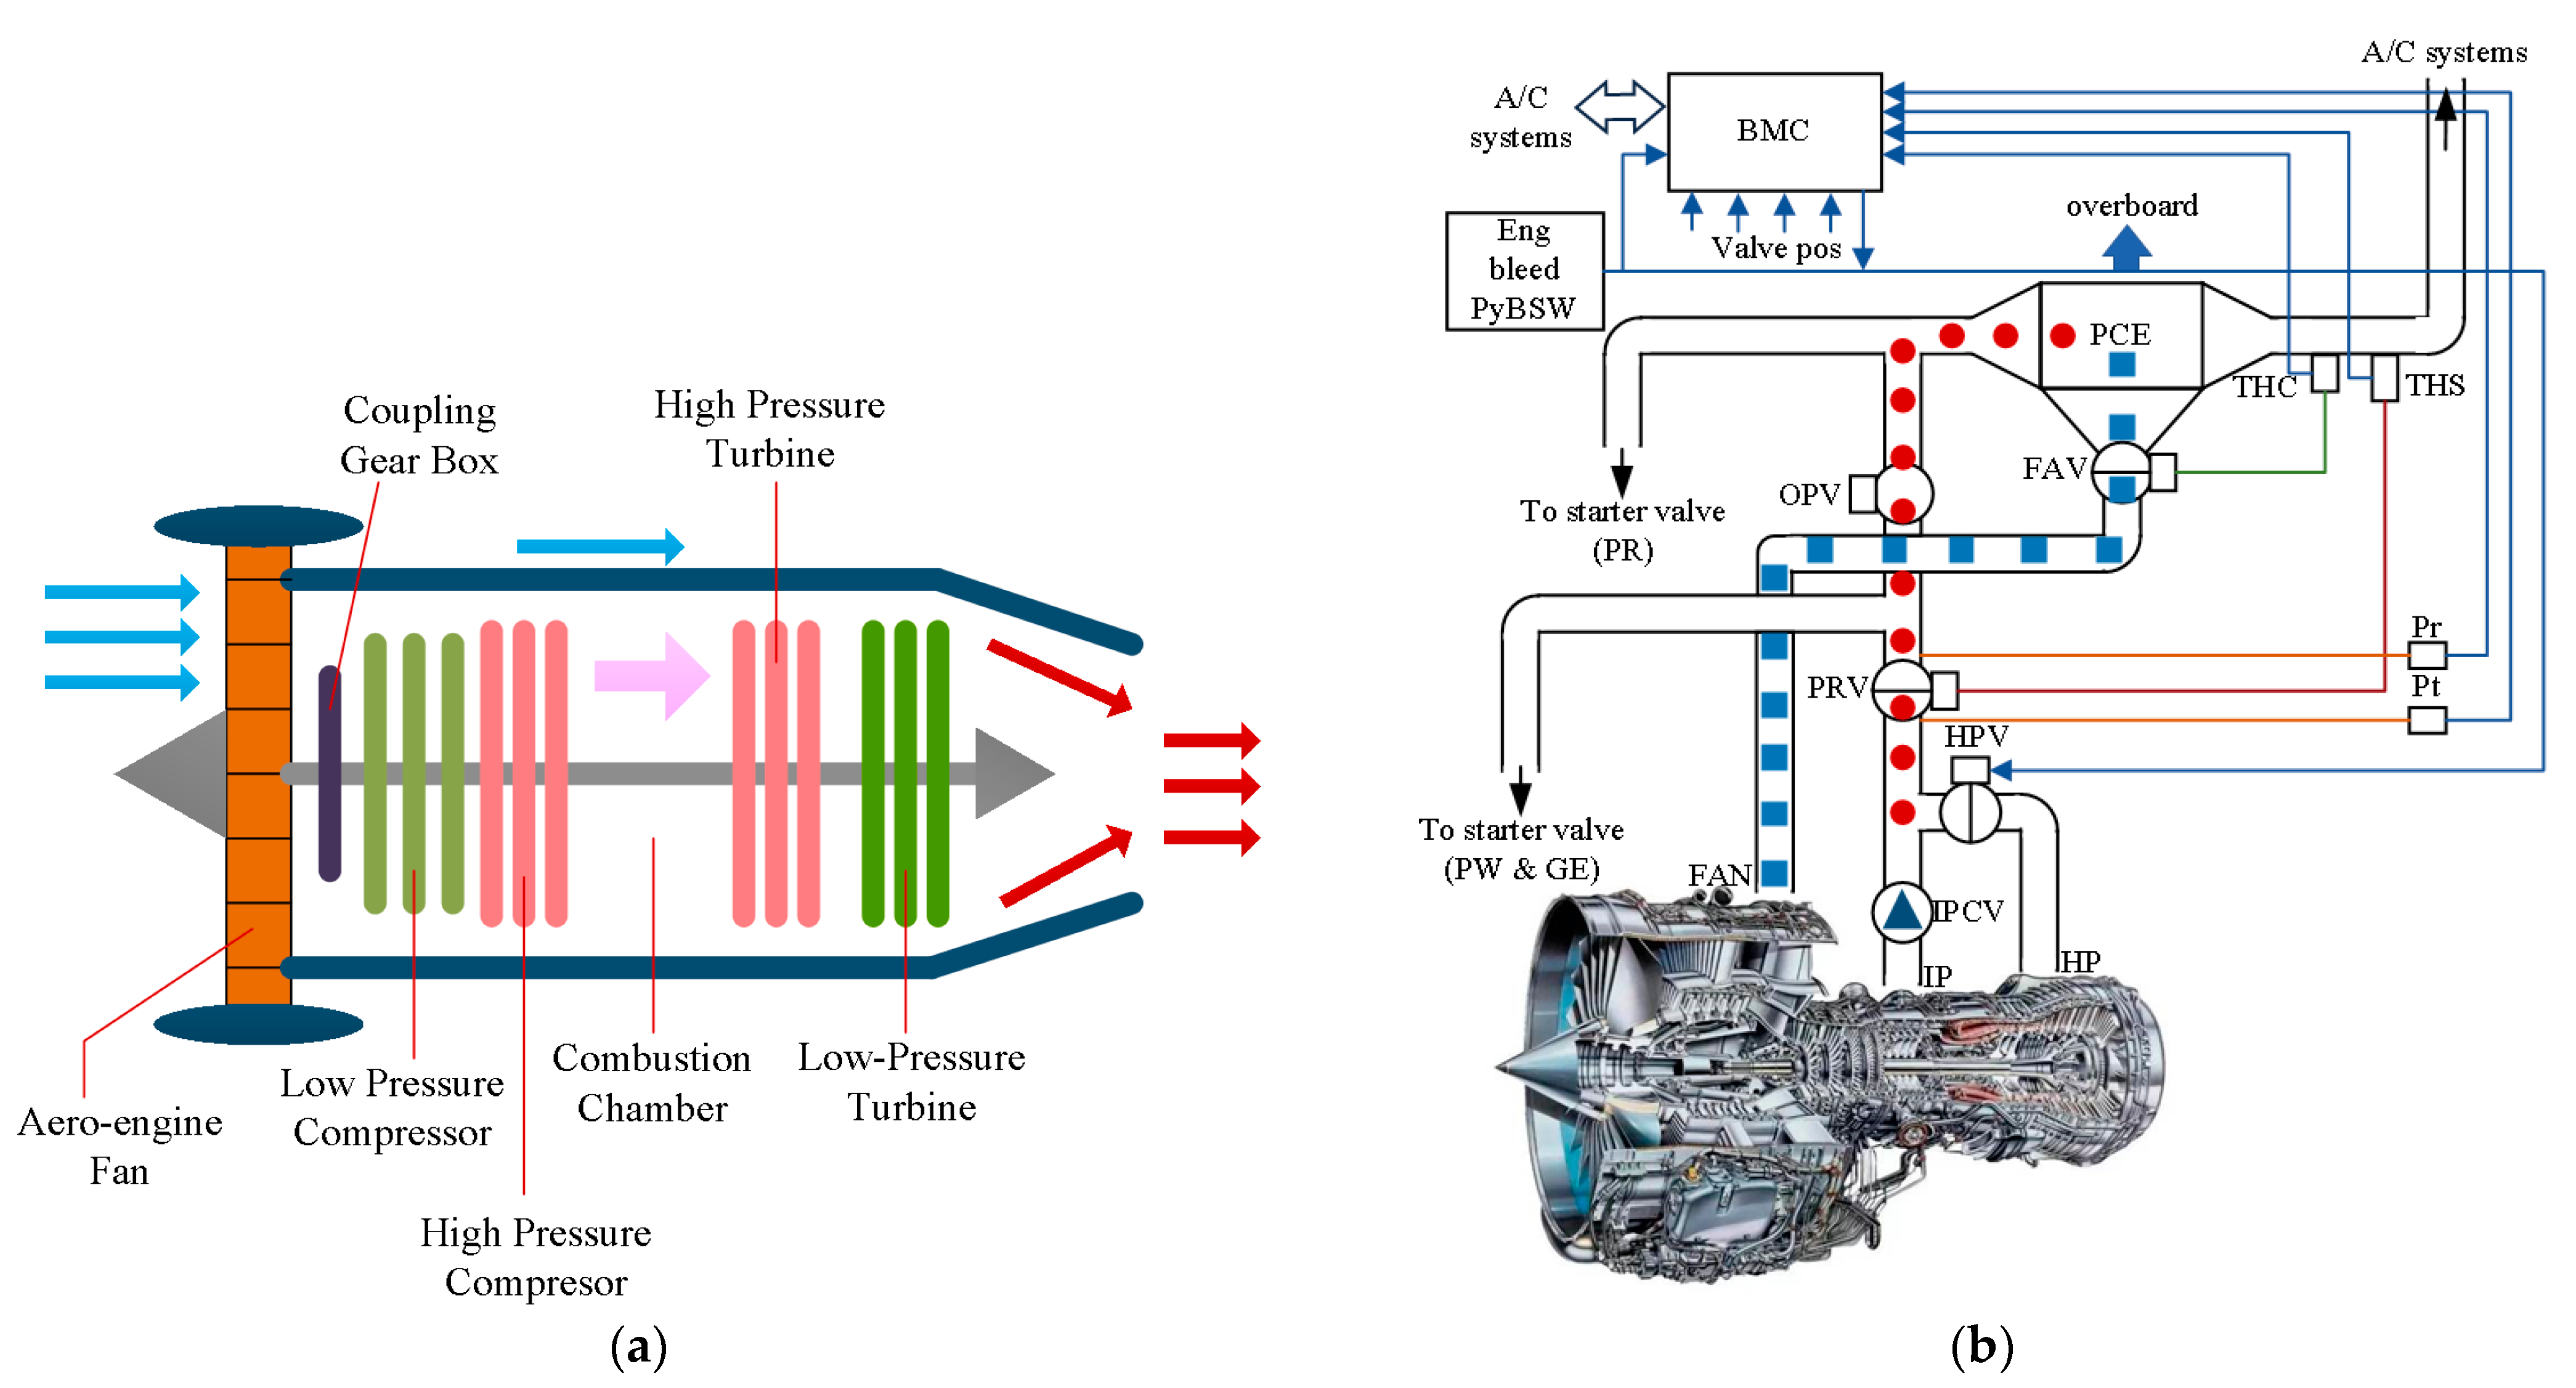
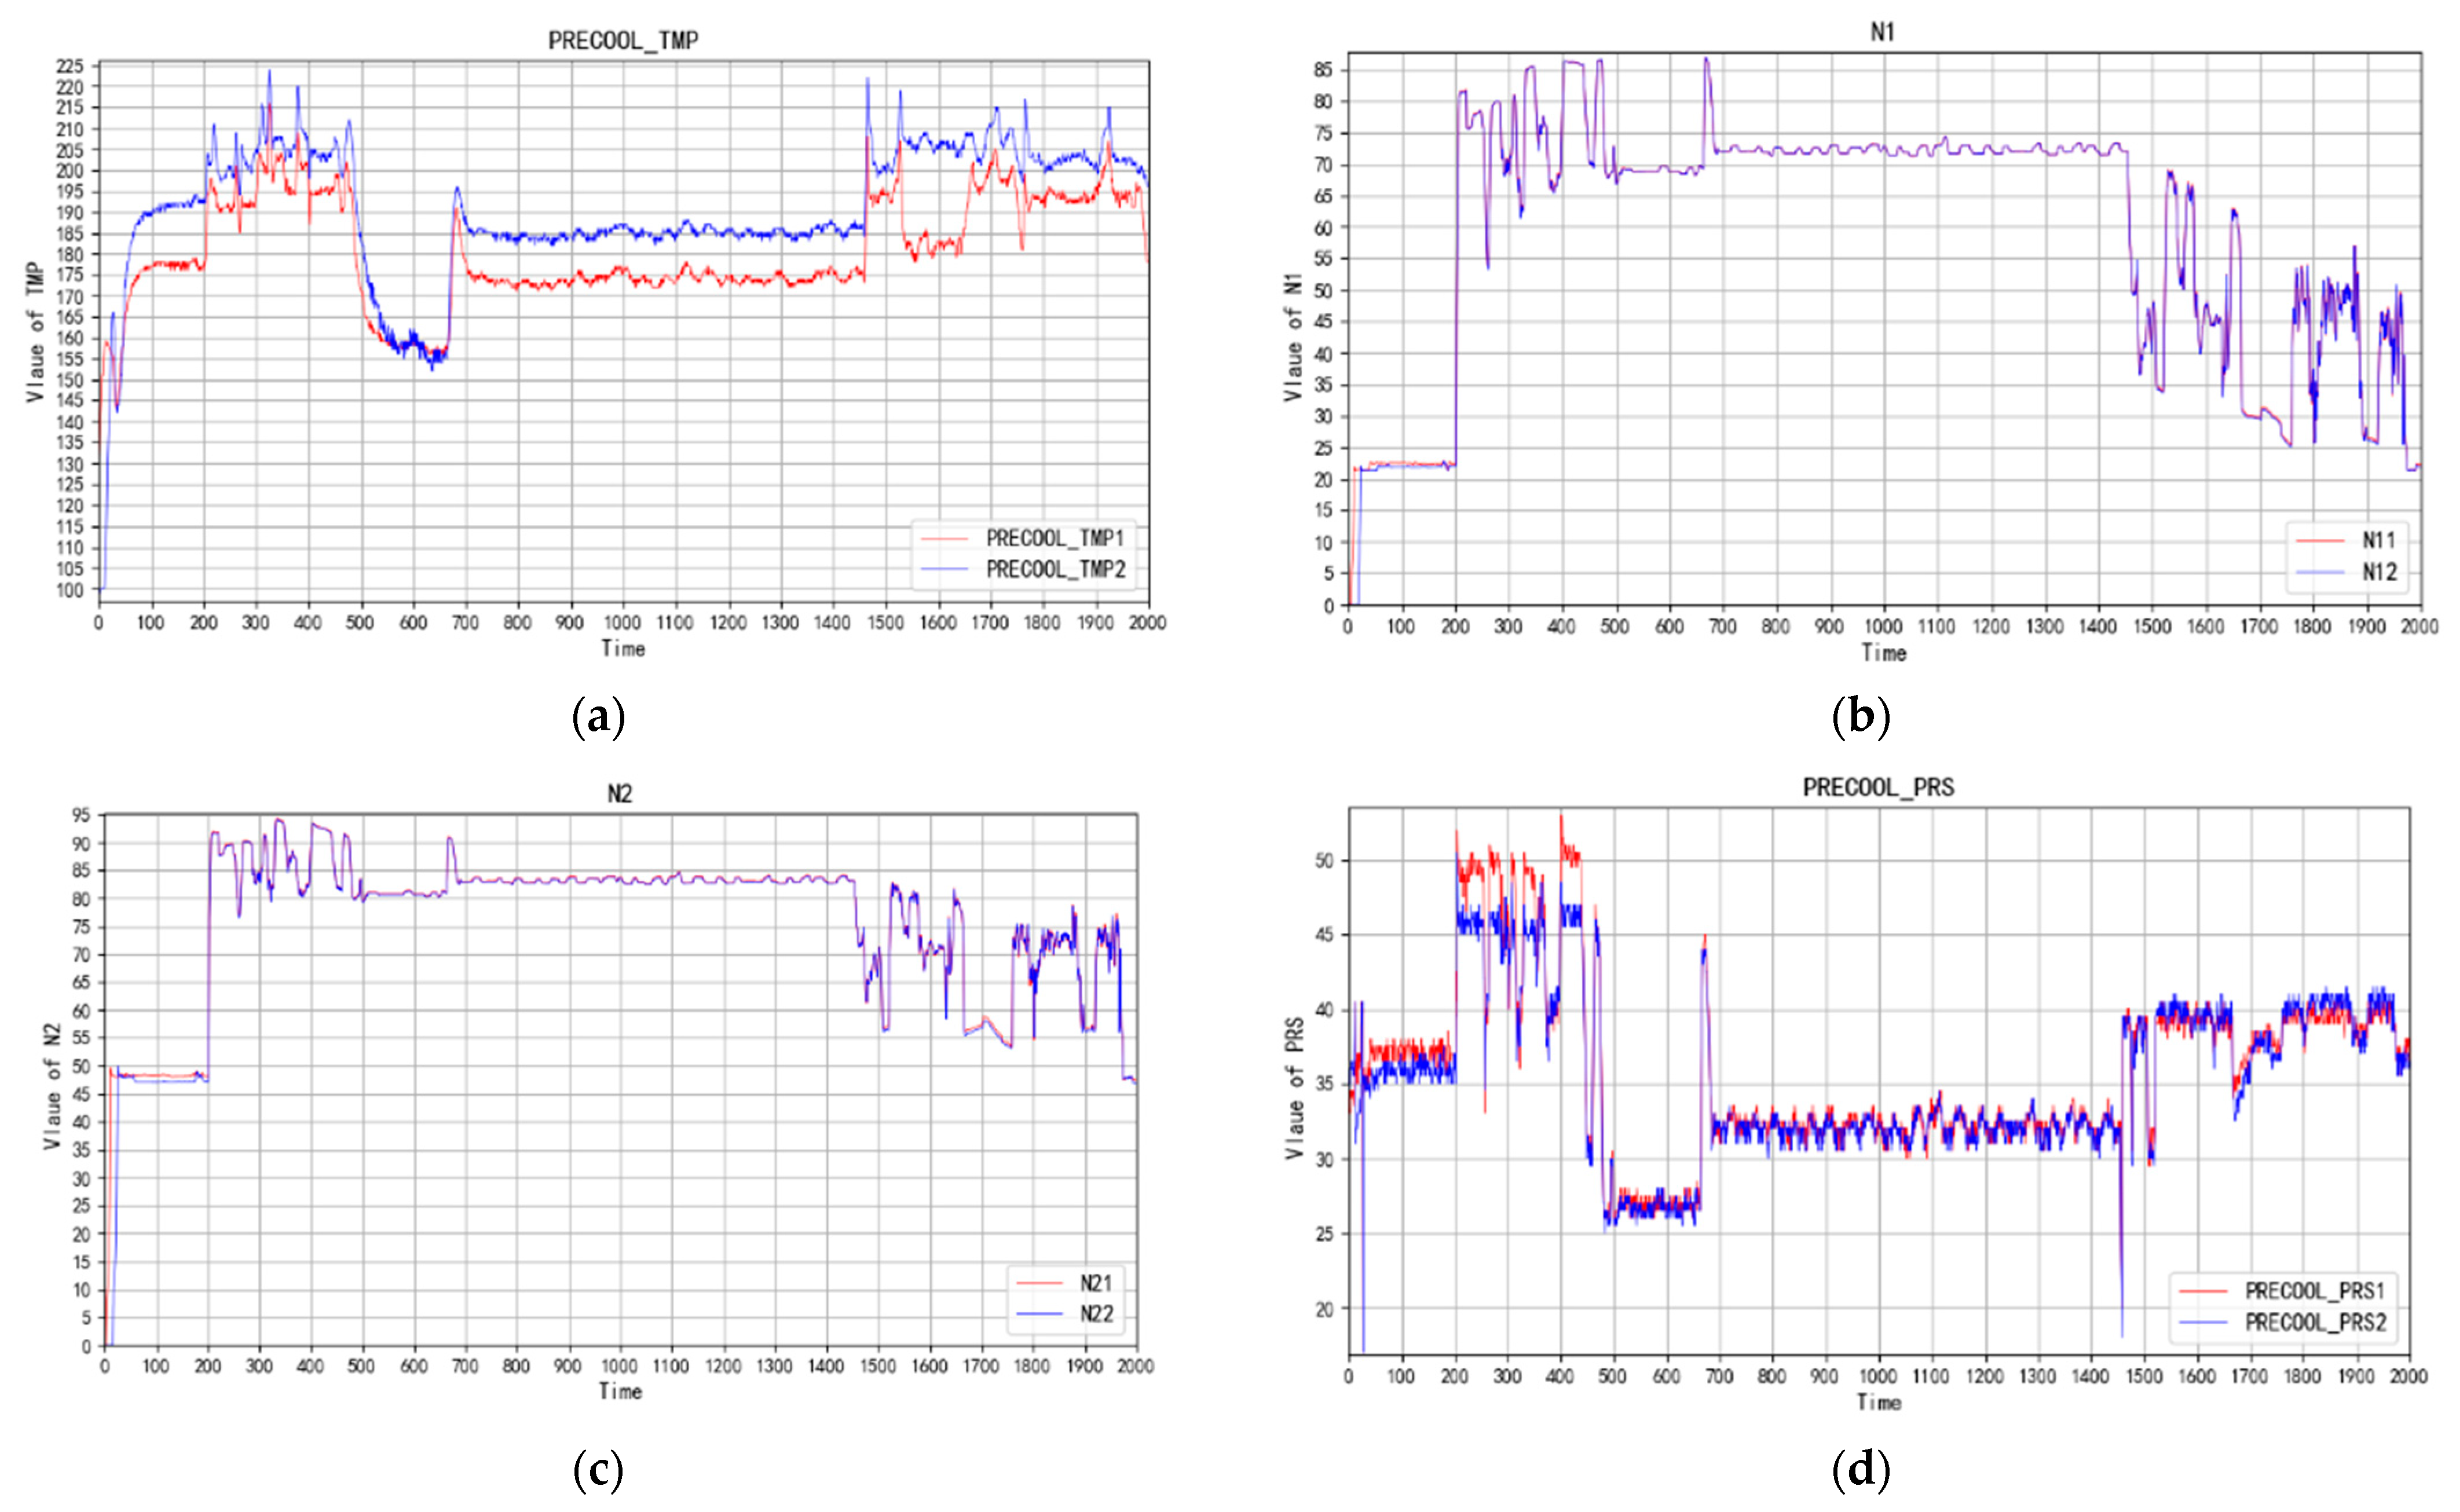
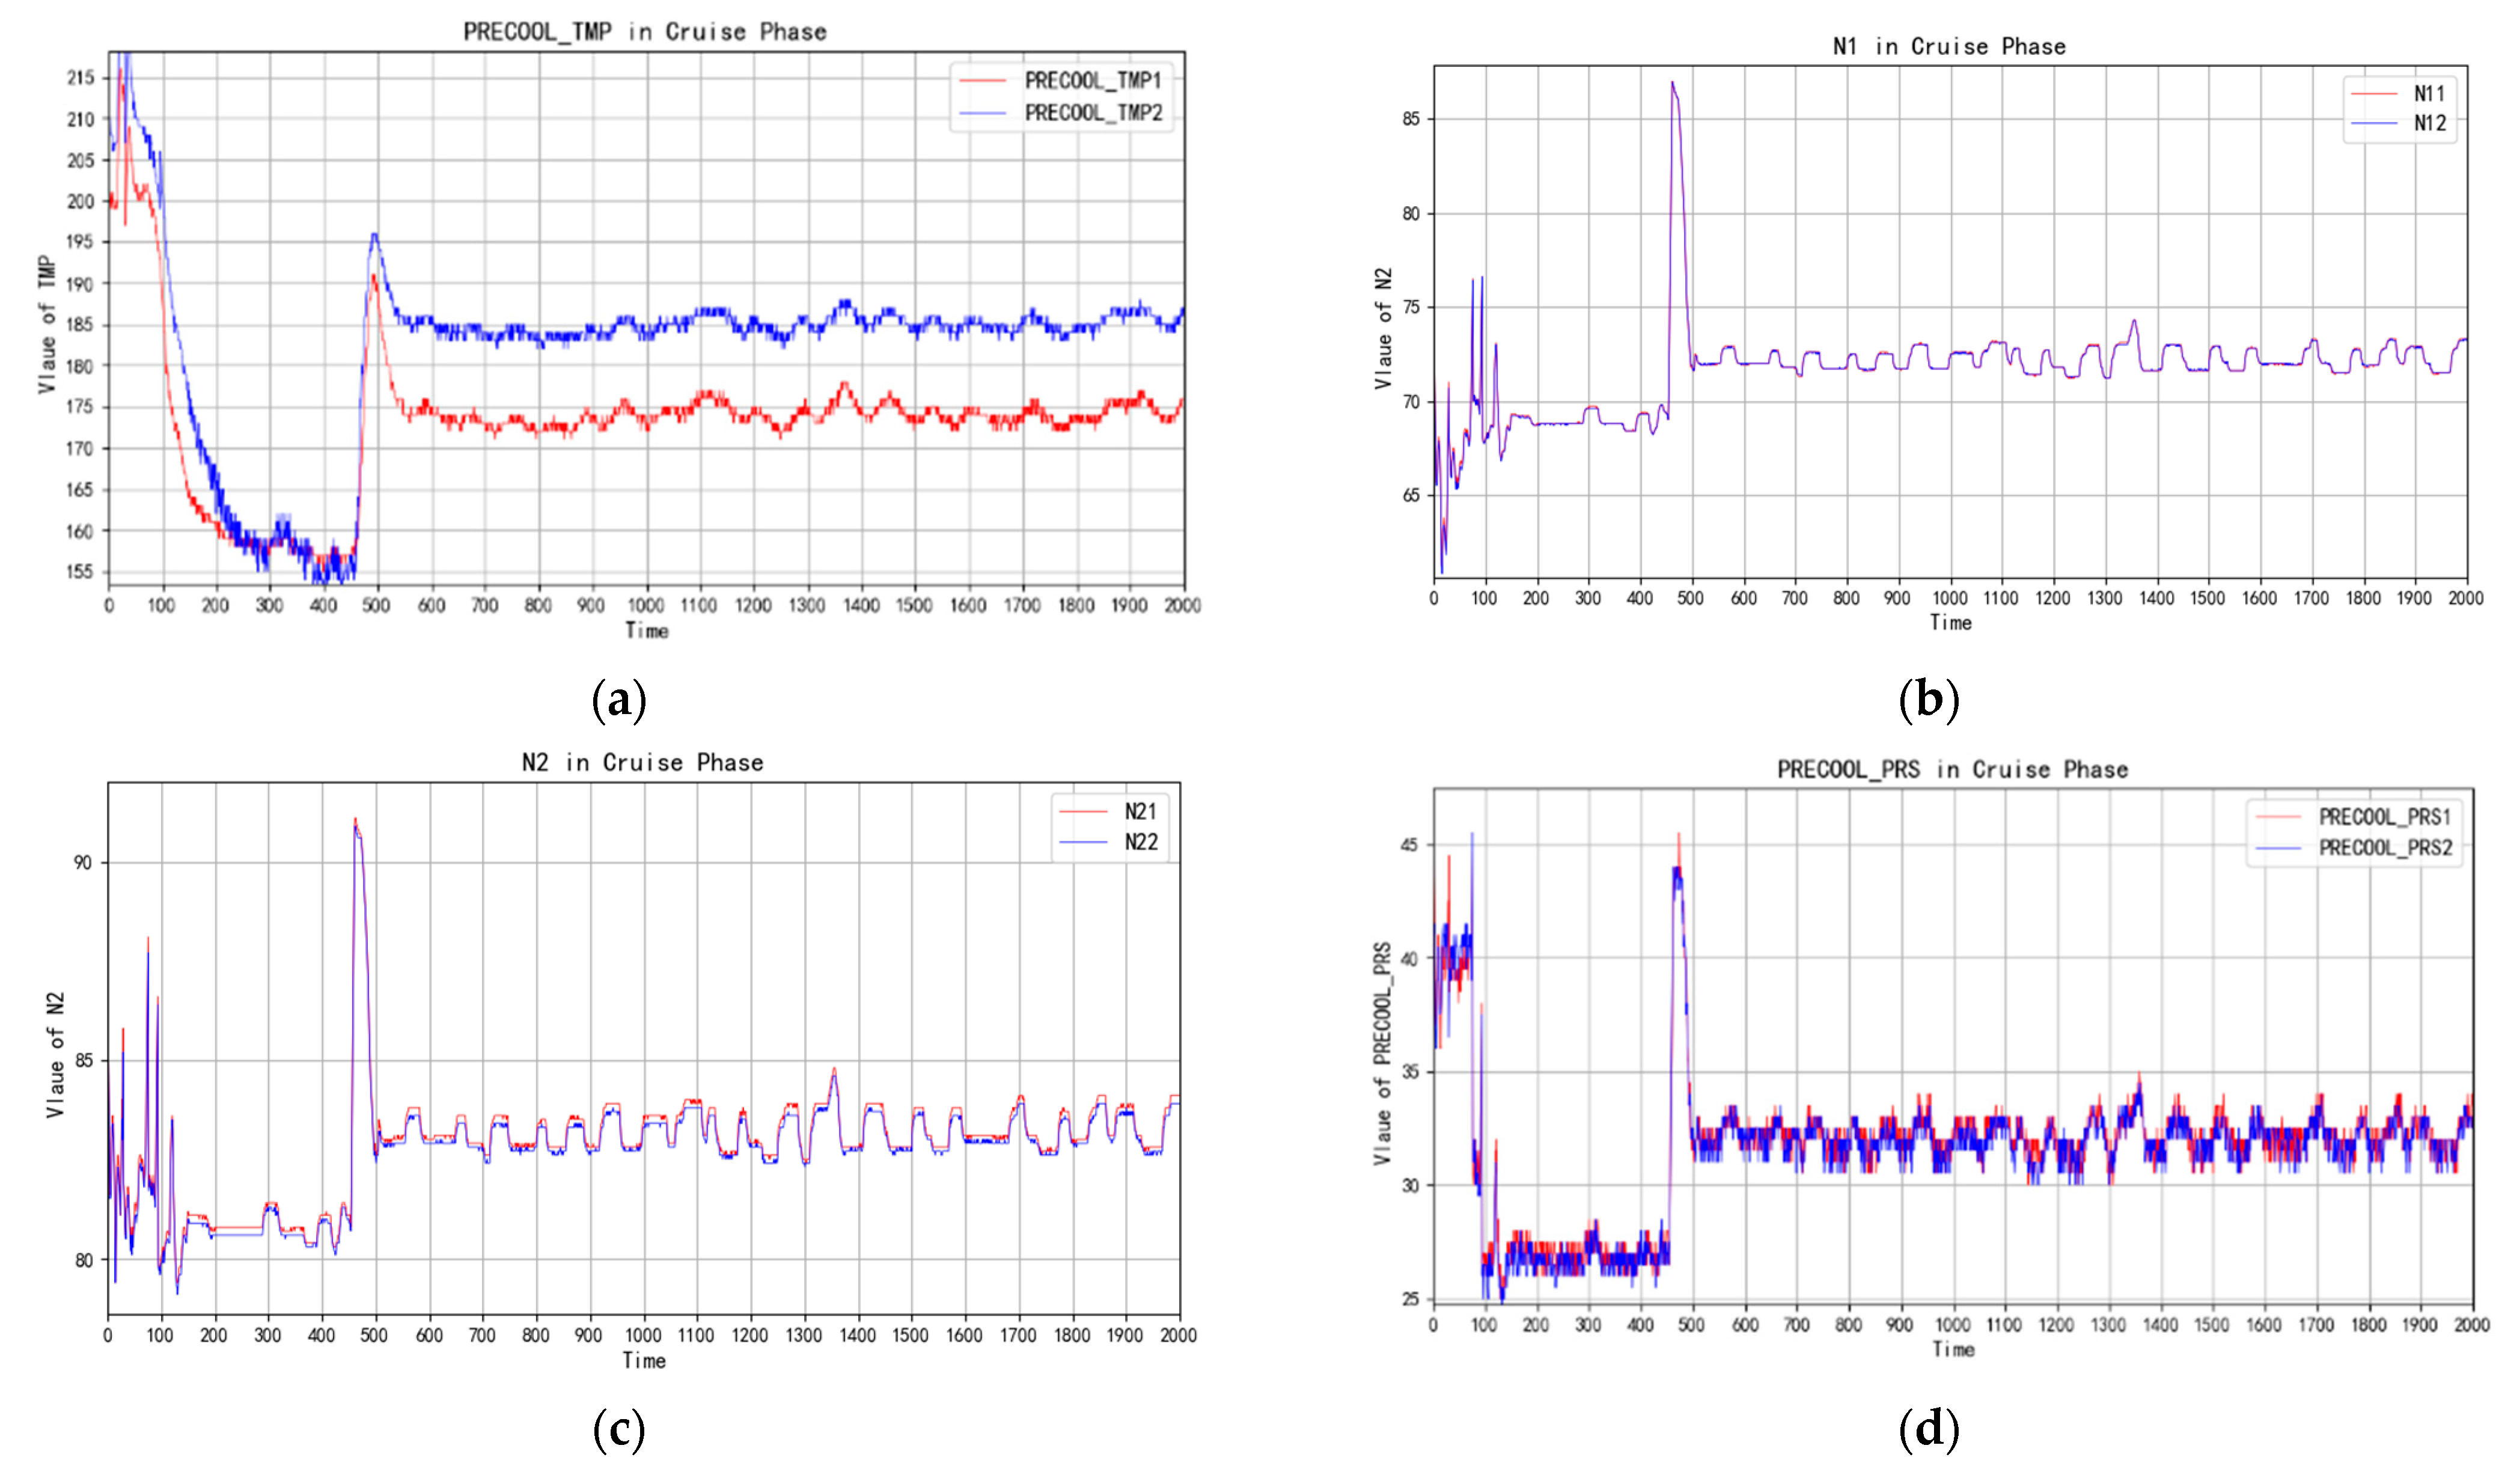
2. Introduction of Aero-Engine Gas Path and Monitoring Data

The research object of this paper is the Airbus A330, Rolls-Royce Trent700 aero-engine gas path system. The aero-engine and its gas path structure are shown in Figure 1 [11,12]. The aero-engine gas path is composed of Bleed Monitoring Computer (BMC), Temperature Control Thermostat (ThC), Solenoid Thermostat (Ths), Regulated Pressure Transducer (Pr), Transferred Pressure Transducer (Pt), PreCooler Exchanger (PCE), OverPressure Valve (OPV), Fan Air Valve (FAV), Intermediate Pressure Valve (IPCV), High Pressure Valve (HPV), and so on.
The aero-engine flight phase includes take-off, climb, cruise, and landing. The QAR data of each phase has different characteristics. During the aero-engine flight phase, the QAR data of the gas path system includes temperature of precooler 1 (TMP1), temperature of precooler 2 (TMP2), speed of No.1 engine N1 (N11), speed of No.2 engine N1 (N12), speed of No.2 engine N1 (N21), speed of No.2 engine N2 (N22), standard atmospheric pressure height (ALT_STD), pressure of precooler 1 (PRS1), pressure of precooler 2 (PRS2), and so on. Some QAR monitoring data of aero-engine gas path is shown in Table 1.
The gas path monitoring data of the whole flight phase includes temperature of precooler, speed of engine N1, speed of engine N2, and pressure of precooler. The gas path monitoring data is shown in Figure 2.
Since the QAR data of different flight phases have different characteristics, this paper mainly conducts anomaly detection on the QAR monitoring data of aero-engine gas path in the cruise stage. The QAR data of cruise stage is shown in Figure 3.

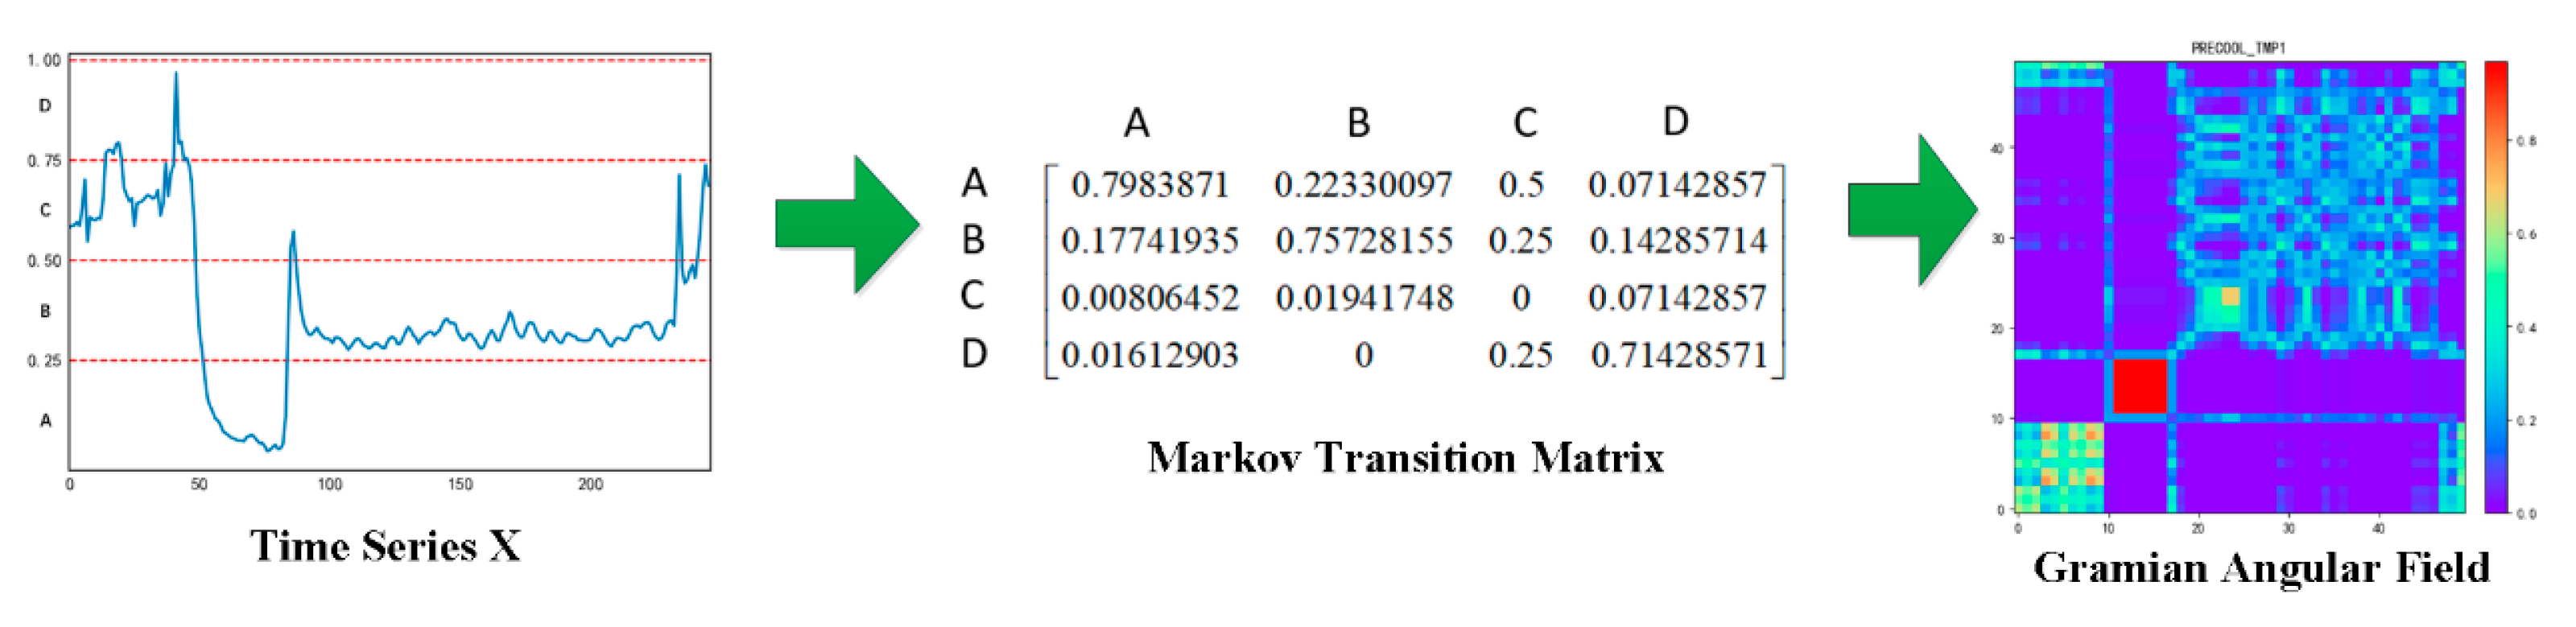
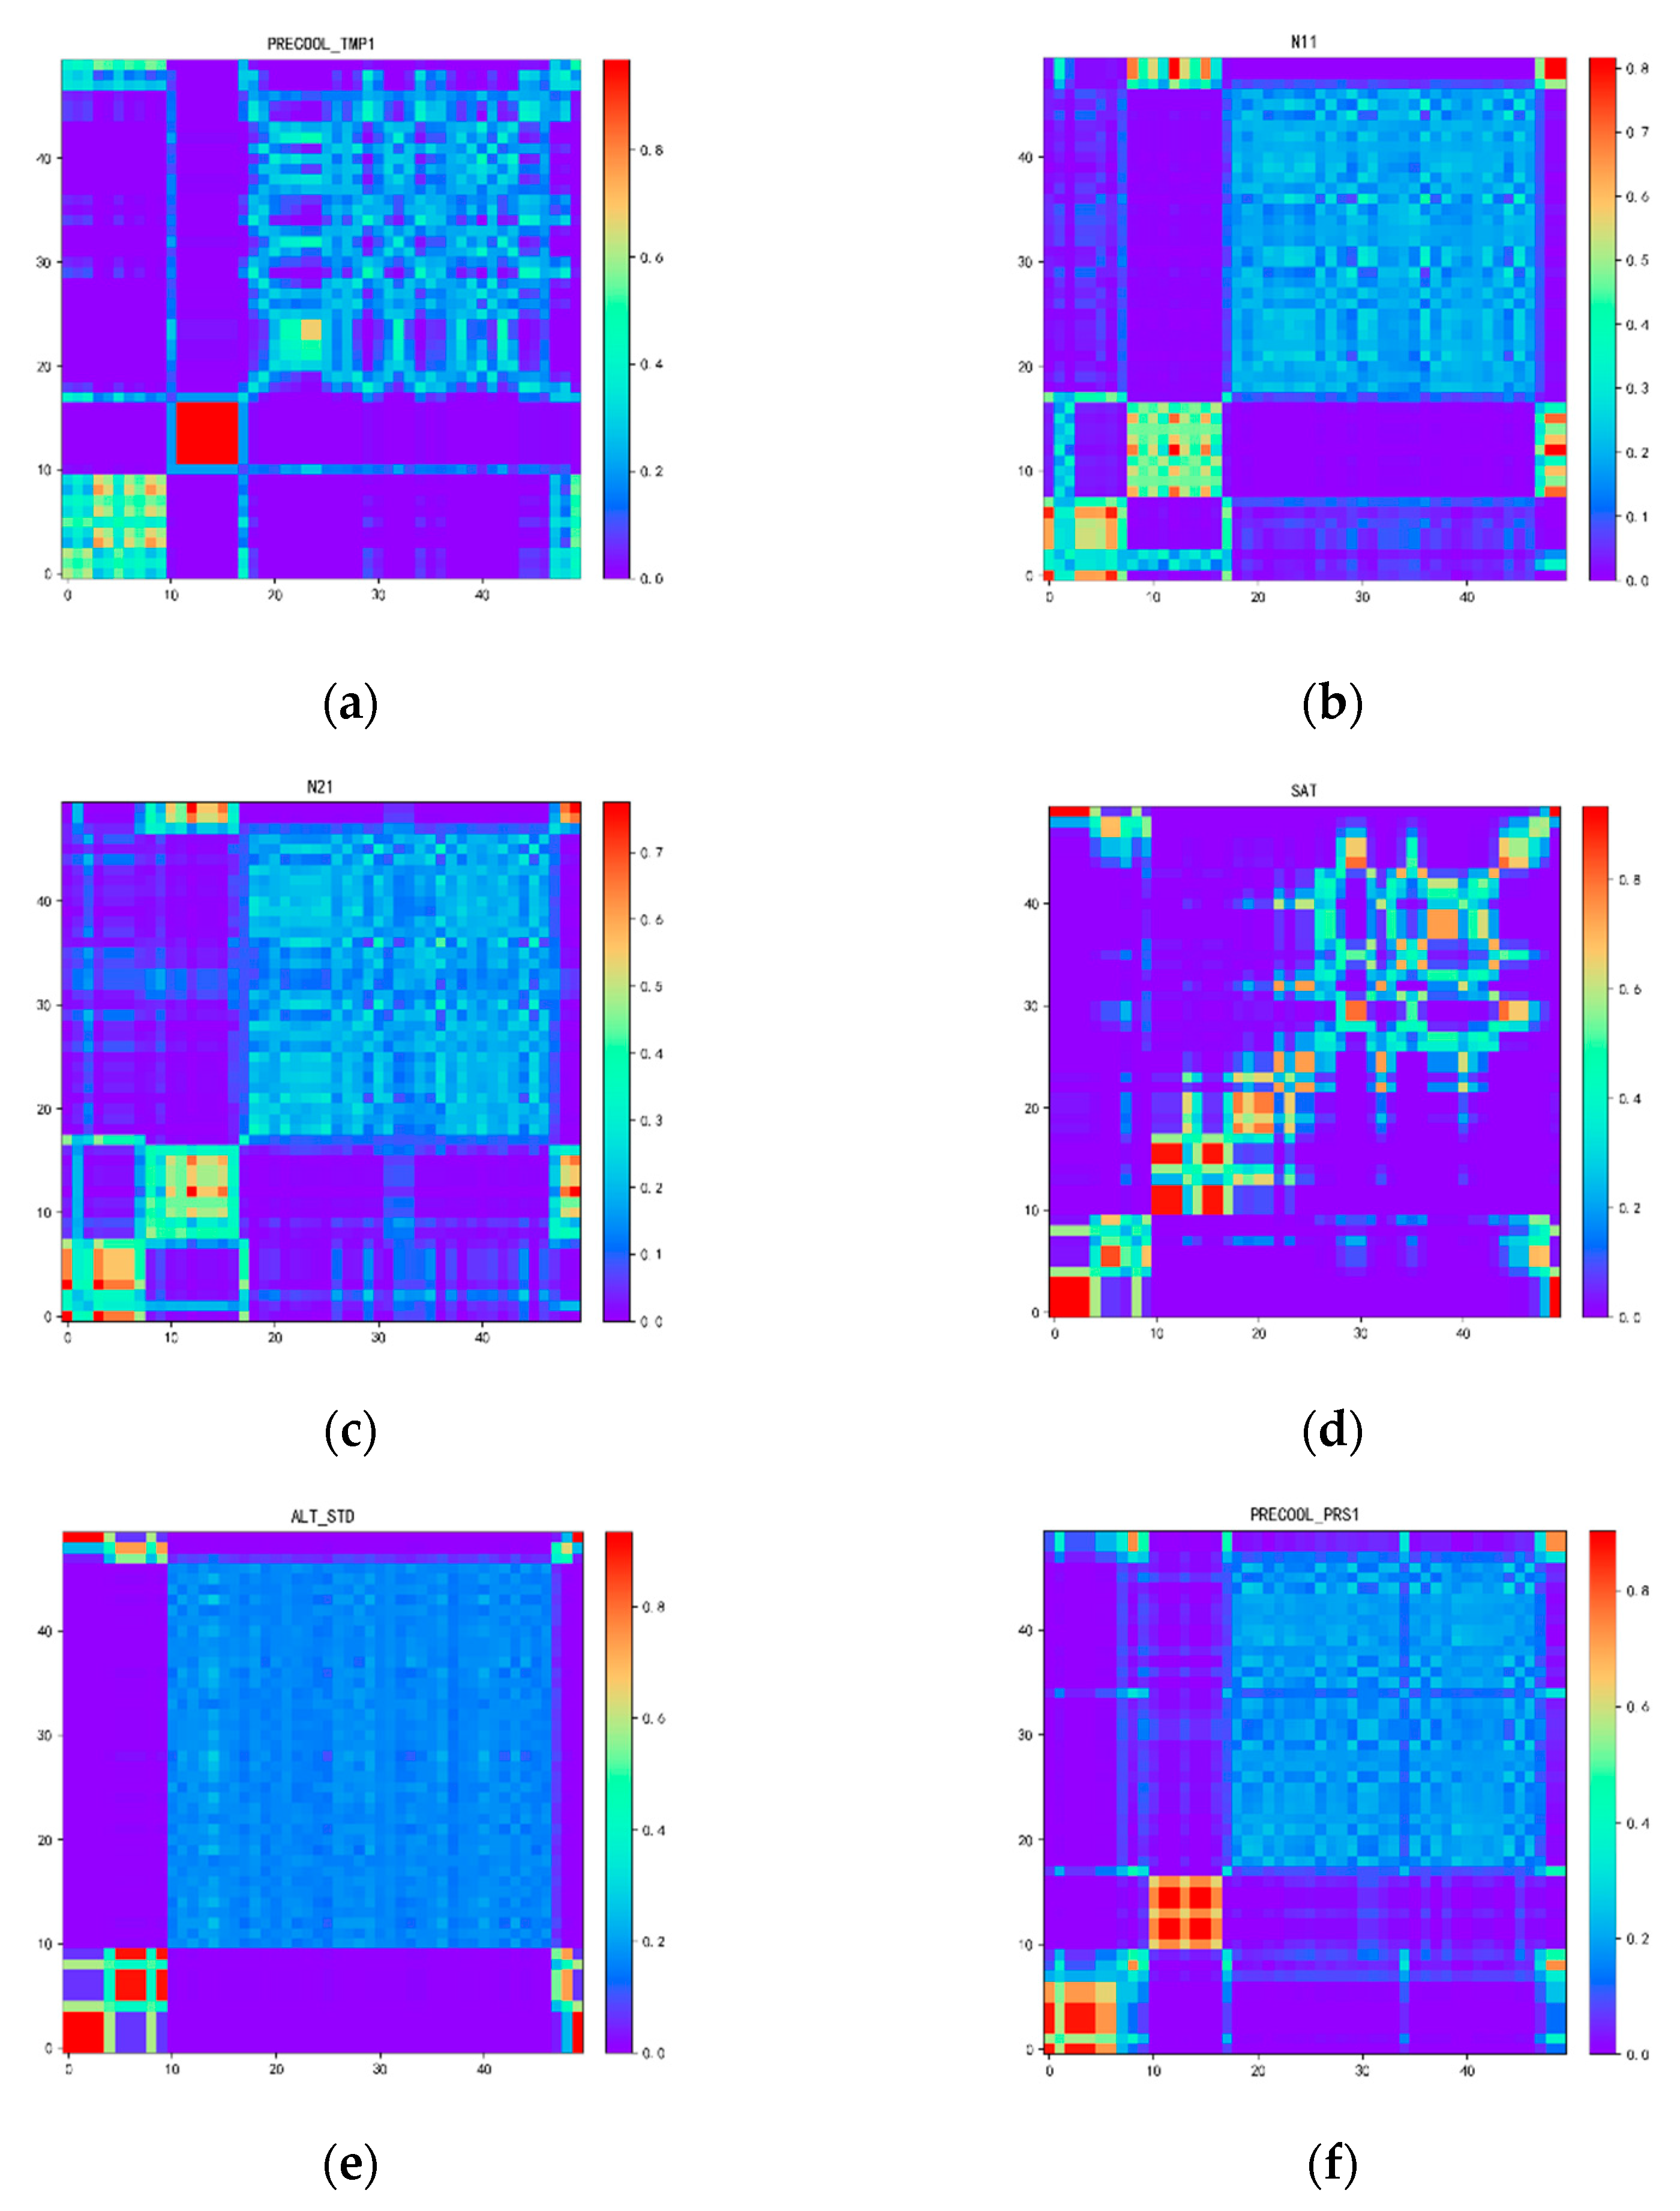
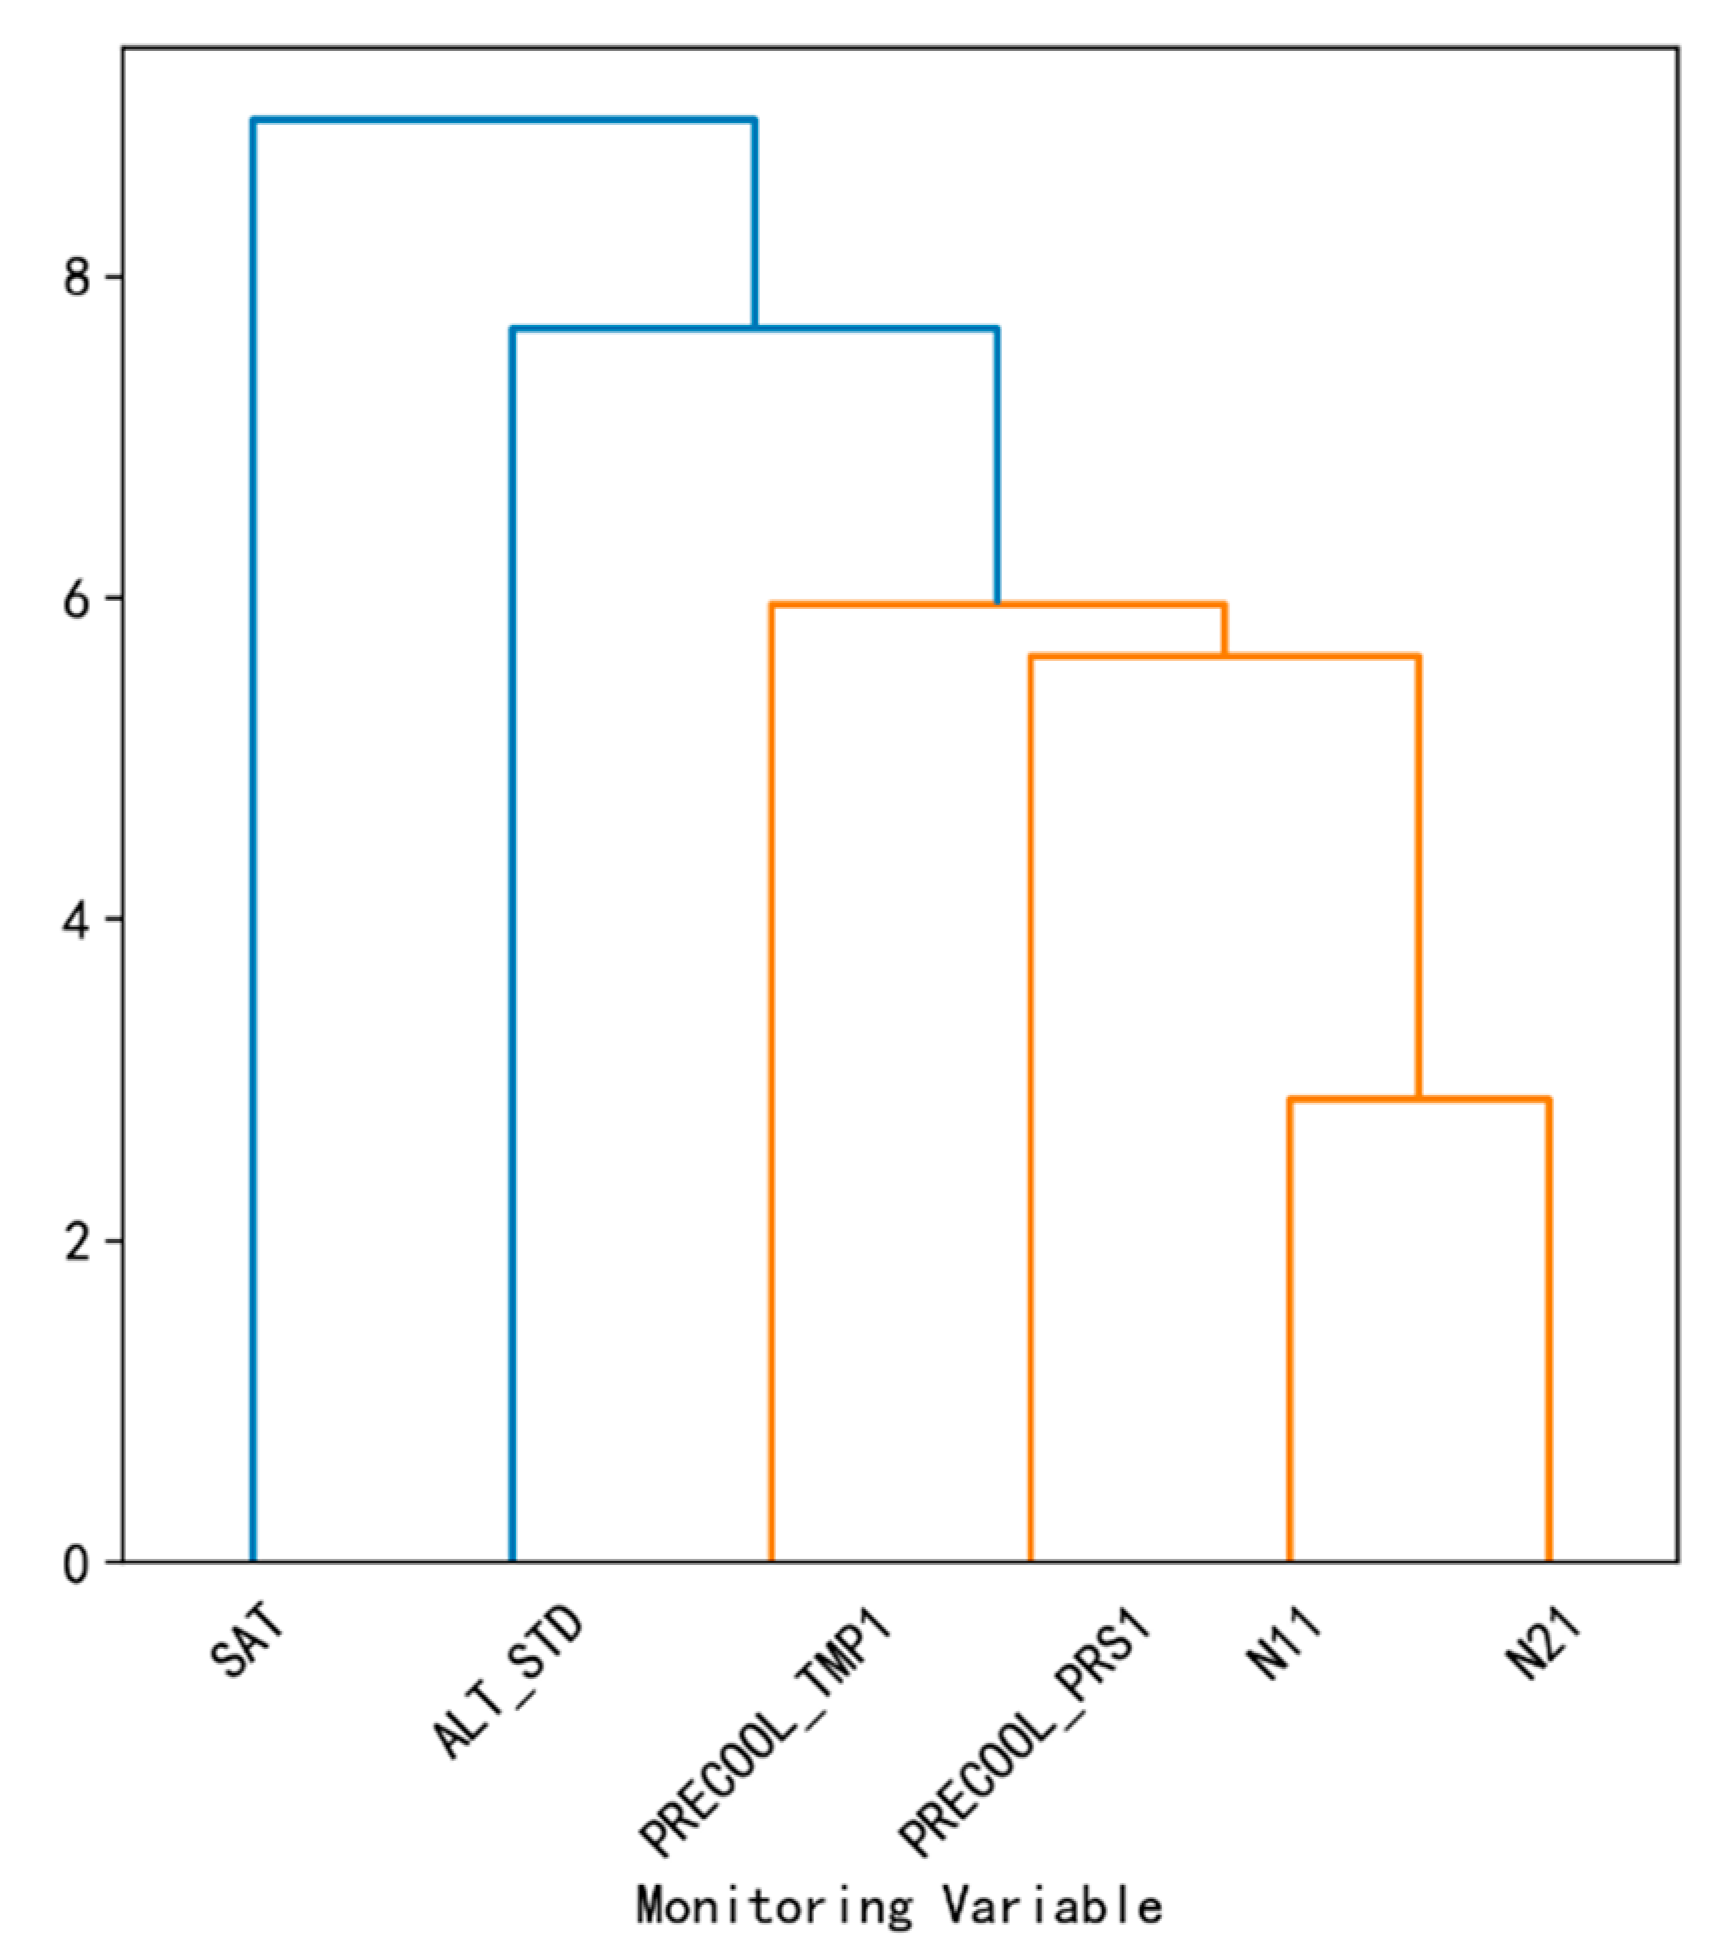
3. Correlation Analysis of Gas Path Monitoring Data Based on Markov Transition Field and Hierarchical Clustering

In this section, the correlation of different time series is obtained by calculating the similarity of Markov Transition Probability Matrix. Based on the similarity of time series, hierarchical cluster analysis is applied to obtain the correlation of different time series.
Based on the time sequence of aero-engine QAR data, a Markov Transition Matrix is formed by calculating the Markov Transition Probability of the time series to represent the correlation of time series [13,14,15].
IFor a given time series X , the range of the time series is divided into Q parts, then any X i in the time series will be mapped to the corresponding q i . At this time, in the order of time axis, the transfer probability between data points can be calculated as first-order Markov chain to construct a weighted adjacency matrix W of Q × Q , where w i , j represents the frequency of quantile q j transferring to quantile q i . After standardization, the generated matrix W is the Markov Transition Matrix. The matrix is not sensitive to the distribution of X and the step size of time series t i . In order to reduce the impact of information loss, the Markov Transition Field is transformed on the Markov Transition Matrix.
M = [ v i j x 1 q i , x 1 q j v i j x 1 q i , x n q j v i j x 2 q i , x 1 q j v i j x 1 q i , x 2 q j v i j x n q i , x 1 q j v i j x n q i , x n q j ]
Depending on the length of the original data, the data is converted into Q quantiles, and a Q × Q Markov Transition Matrix (MTF) is generated, which contains the step size (i.e., the time axis) i and j in the time series and the transition direction q j . In MTF, M i j is the probability of q i transferring to q j . MTF increases the time step and position relationship based on Markov Transition Matrix.
According to the different step-size probabilities of the selected time series point i to point j, it is represented by different pixels to generate M i j . MTF encodes the transfer probability of the time series. M i j represents the transition probability between points with time interval k. When k = 0, the matrix can be taken to the main diagonal M i j , which represents the probability of each quantile i shifting to itself. In order to reduce the size of the generated image, facilitate the preservation and improve the computational efficiency, the transition probability in the subsequence of length m can be added together. The conversion process of Markov change field is shown in Figure 4.
The analysis results of QAR data with Markov Transition Field are as shown in Figure 5.
Based on the Markov Transition Probability Matrix of aero-engine QAR data, the similarity of the matrix is calculated, and the clustering analysis is carried out to obtain the correlation between different variables.
Cohesive hierarchical clustering algorithm is a bottom-up clustering algorithm [16,17]. The algorithm flow is shown as Algorithm 1. It takes each sample in the dataset as an initial class, then merges the two classes with the smallest distance between classes until the maximum distance within each class is less than the set threshold, or the number of classes reaches the set value.
Algorithm 1. Cohesive Hierarchical Clustering Algorithm
Input: candidate sample set, maximum distance threshold ε.
Output: feature clustering result set C.
   For Si ∈ D   // Use each sample in D as an initial cluster.
     Ci ← empty set;
     Ci ← Ci∪Si;
     C ← C∪Ci;
   End for
   While Maximum sample distance less than e after merging two classes.
          Calculate the distance between the two classes, merge the
    smallest distance classes, and select one of them to merge if there are
    many pairs of smallest distance classes with the same distance.
   End while
The hierarchical clustering results are as shown as Figure 6.
According to the clustering results, there is a strong correlation between TMP, PRS, N1, and N2 for aero-engine gas path.

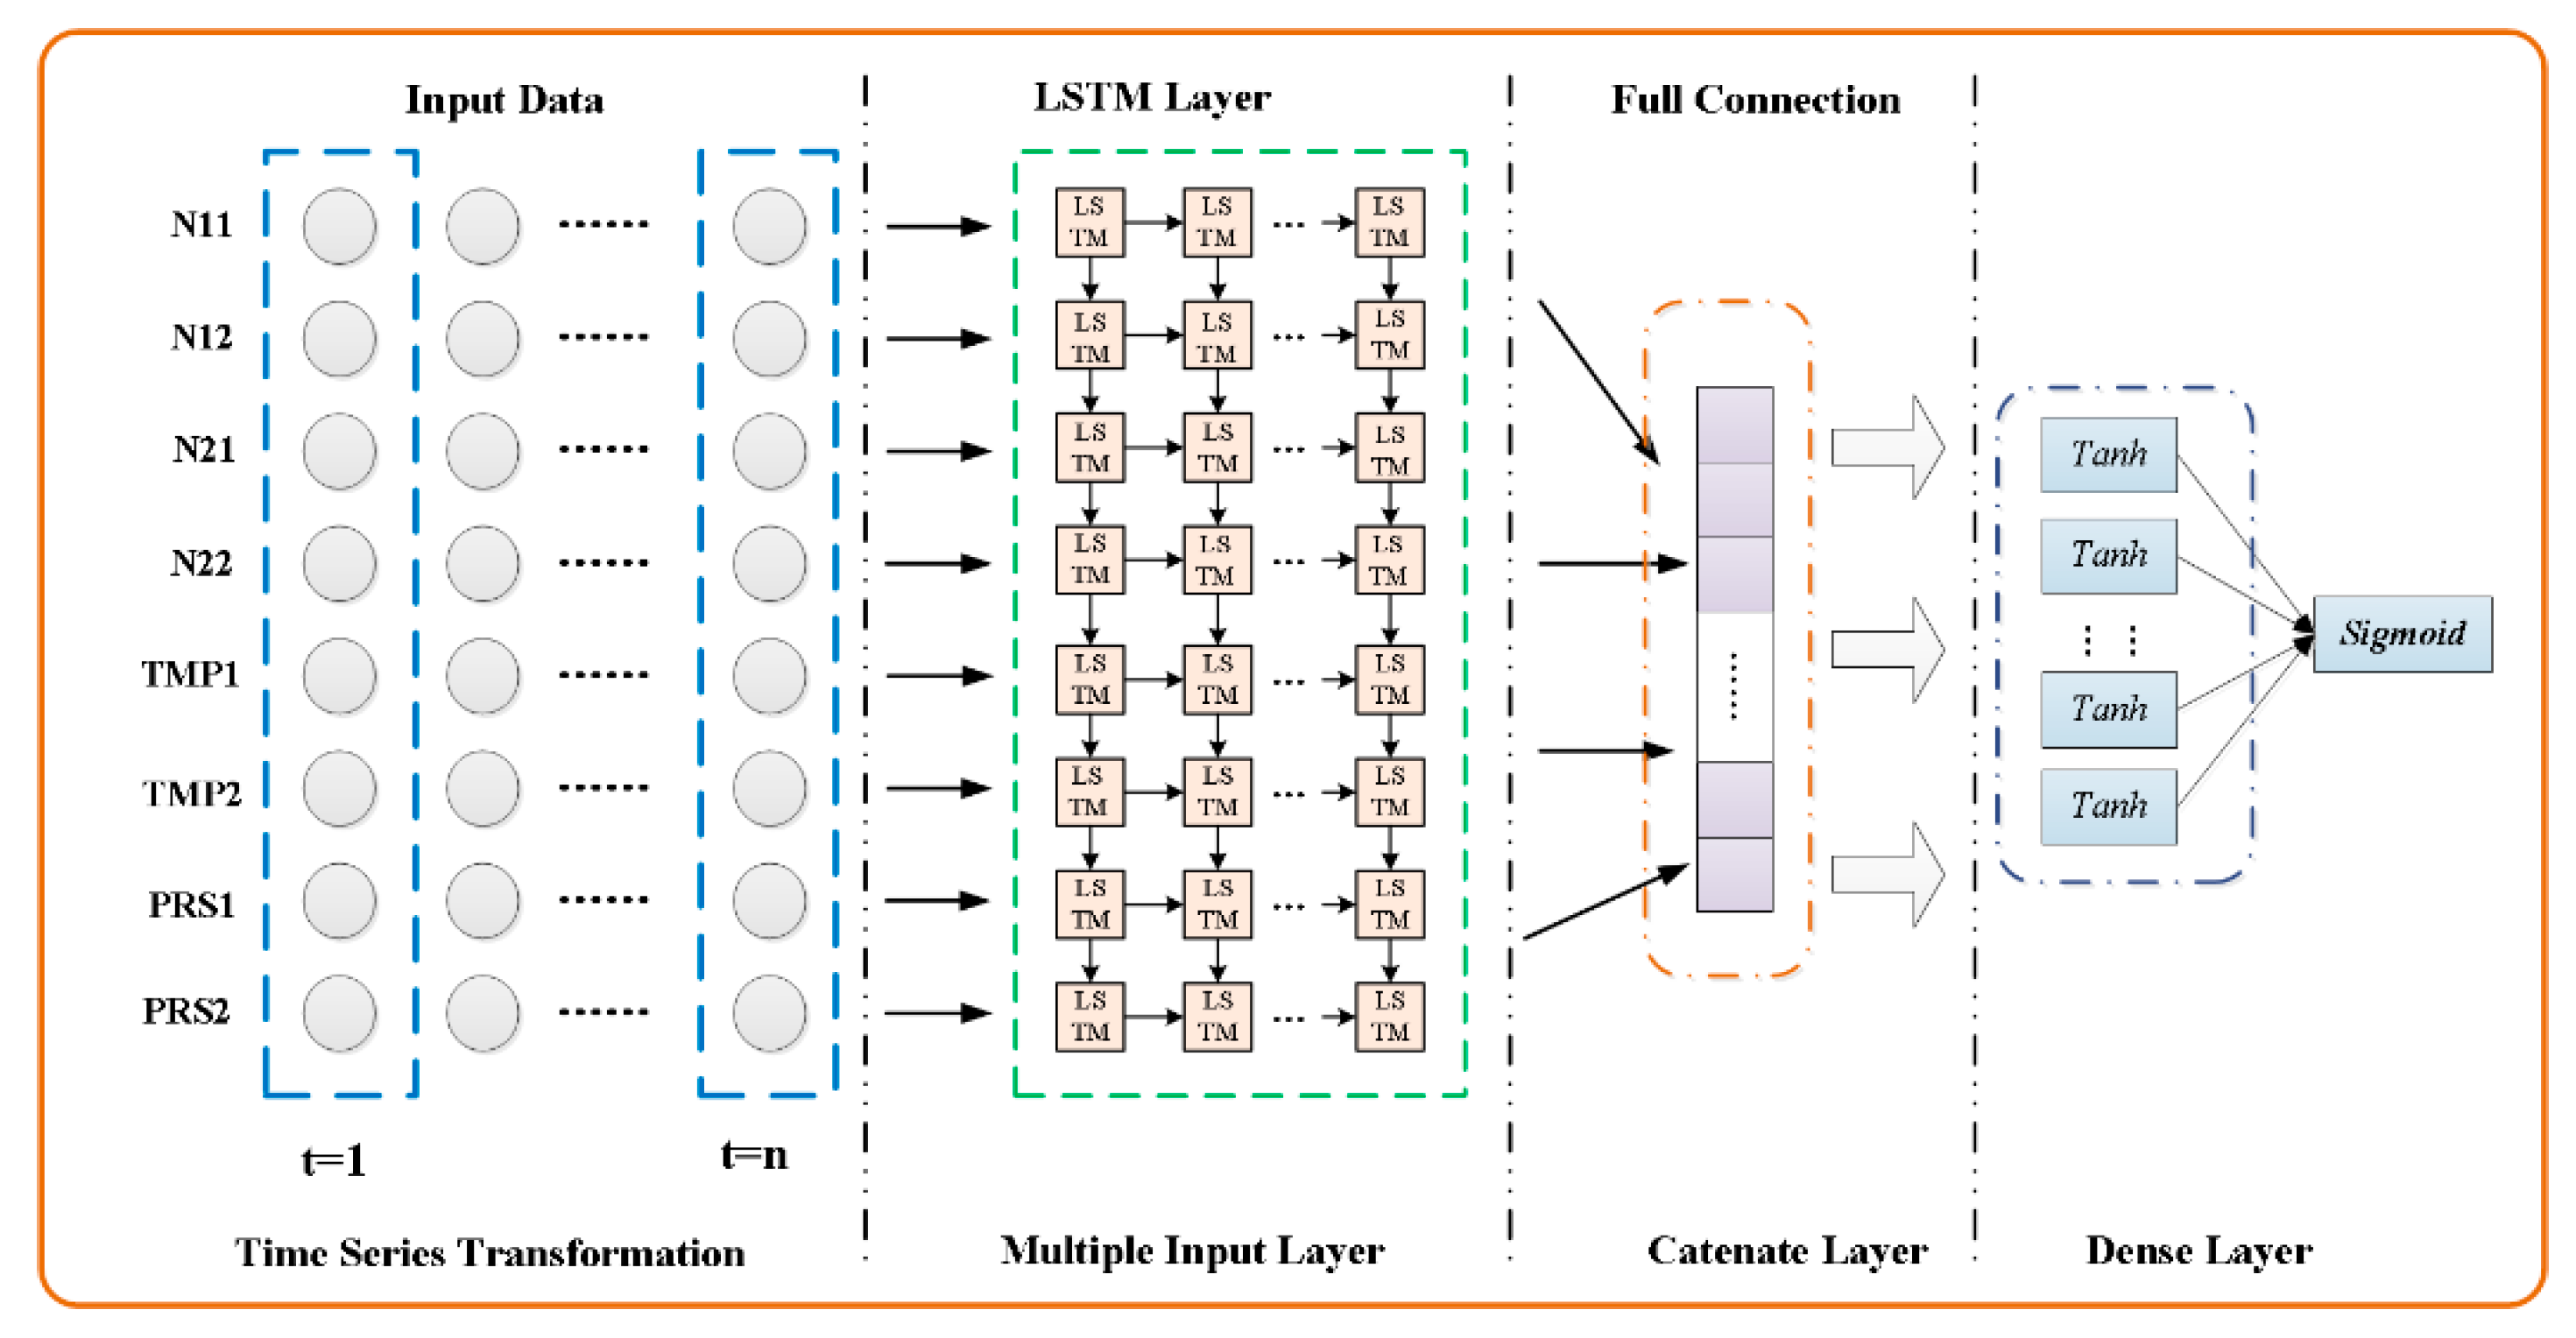
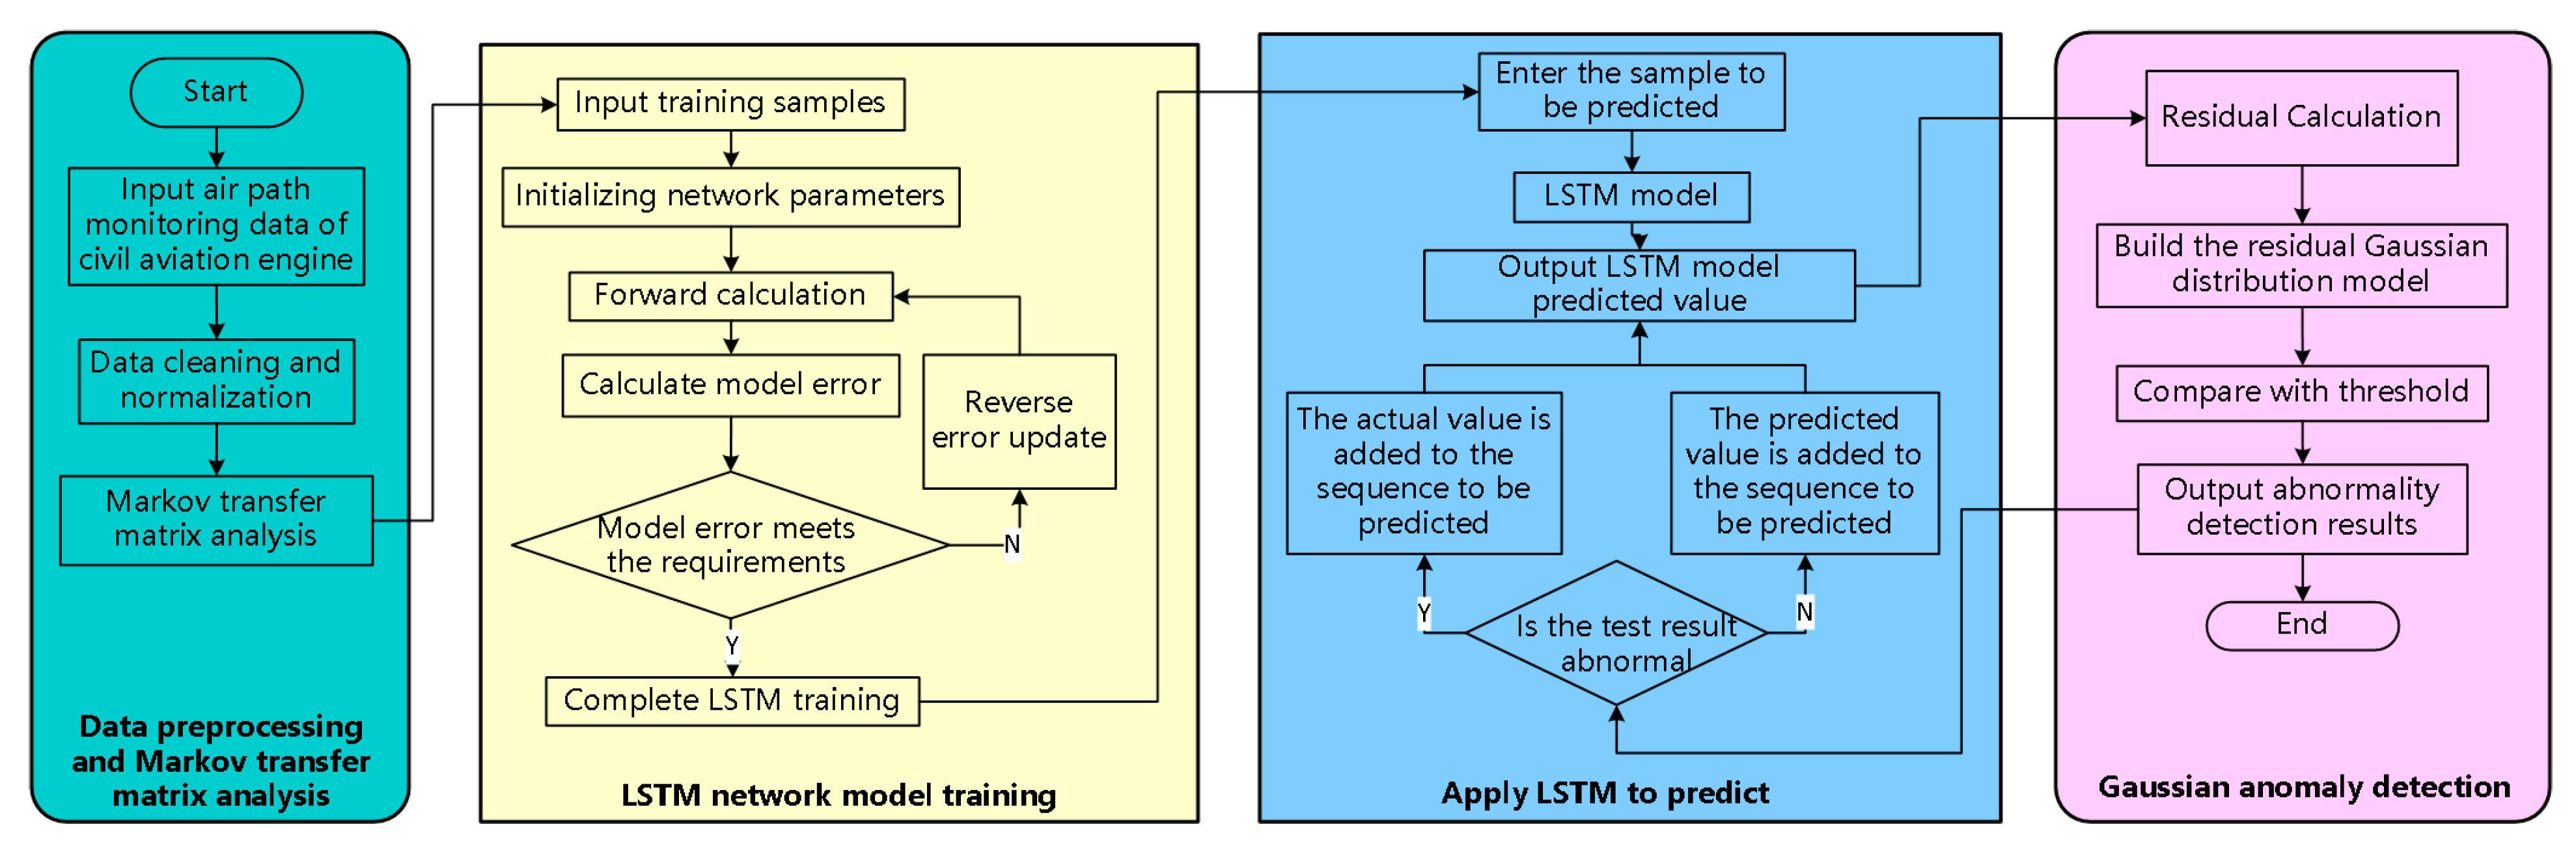
4. Construction of Anomaly Detection Model Based on Multi-LSTM and Gaussian Anomaly Detection Model

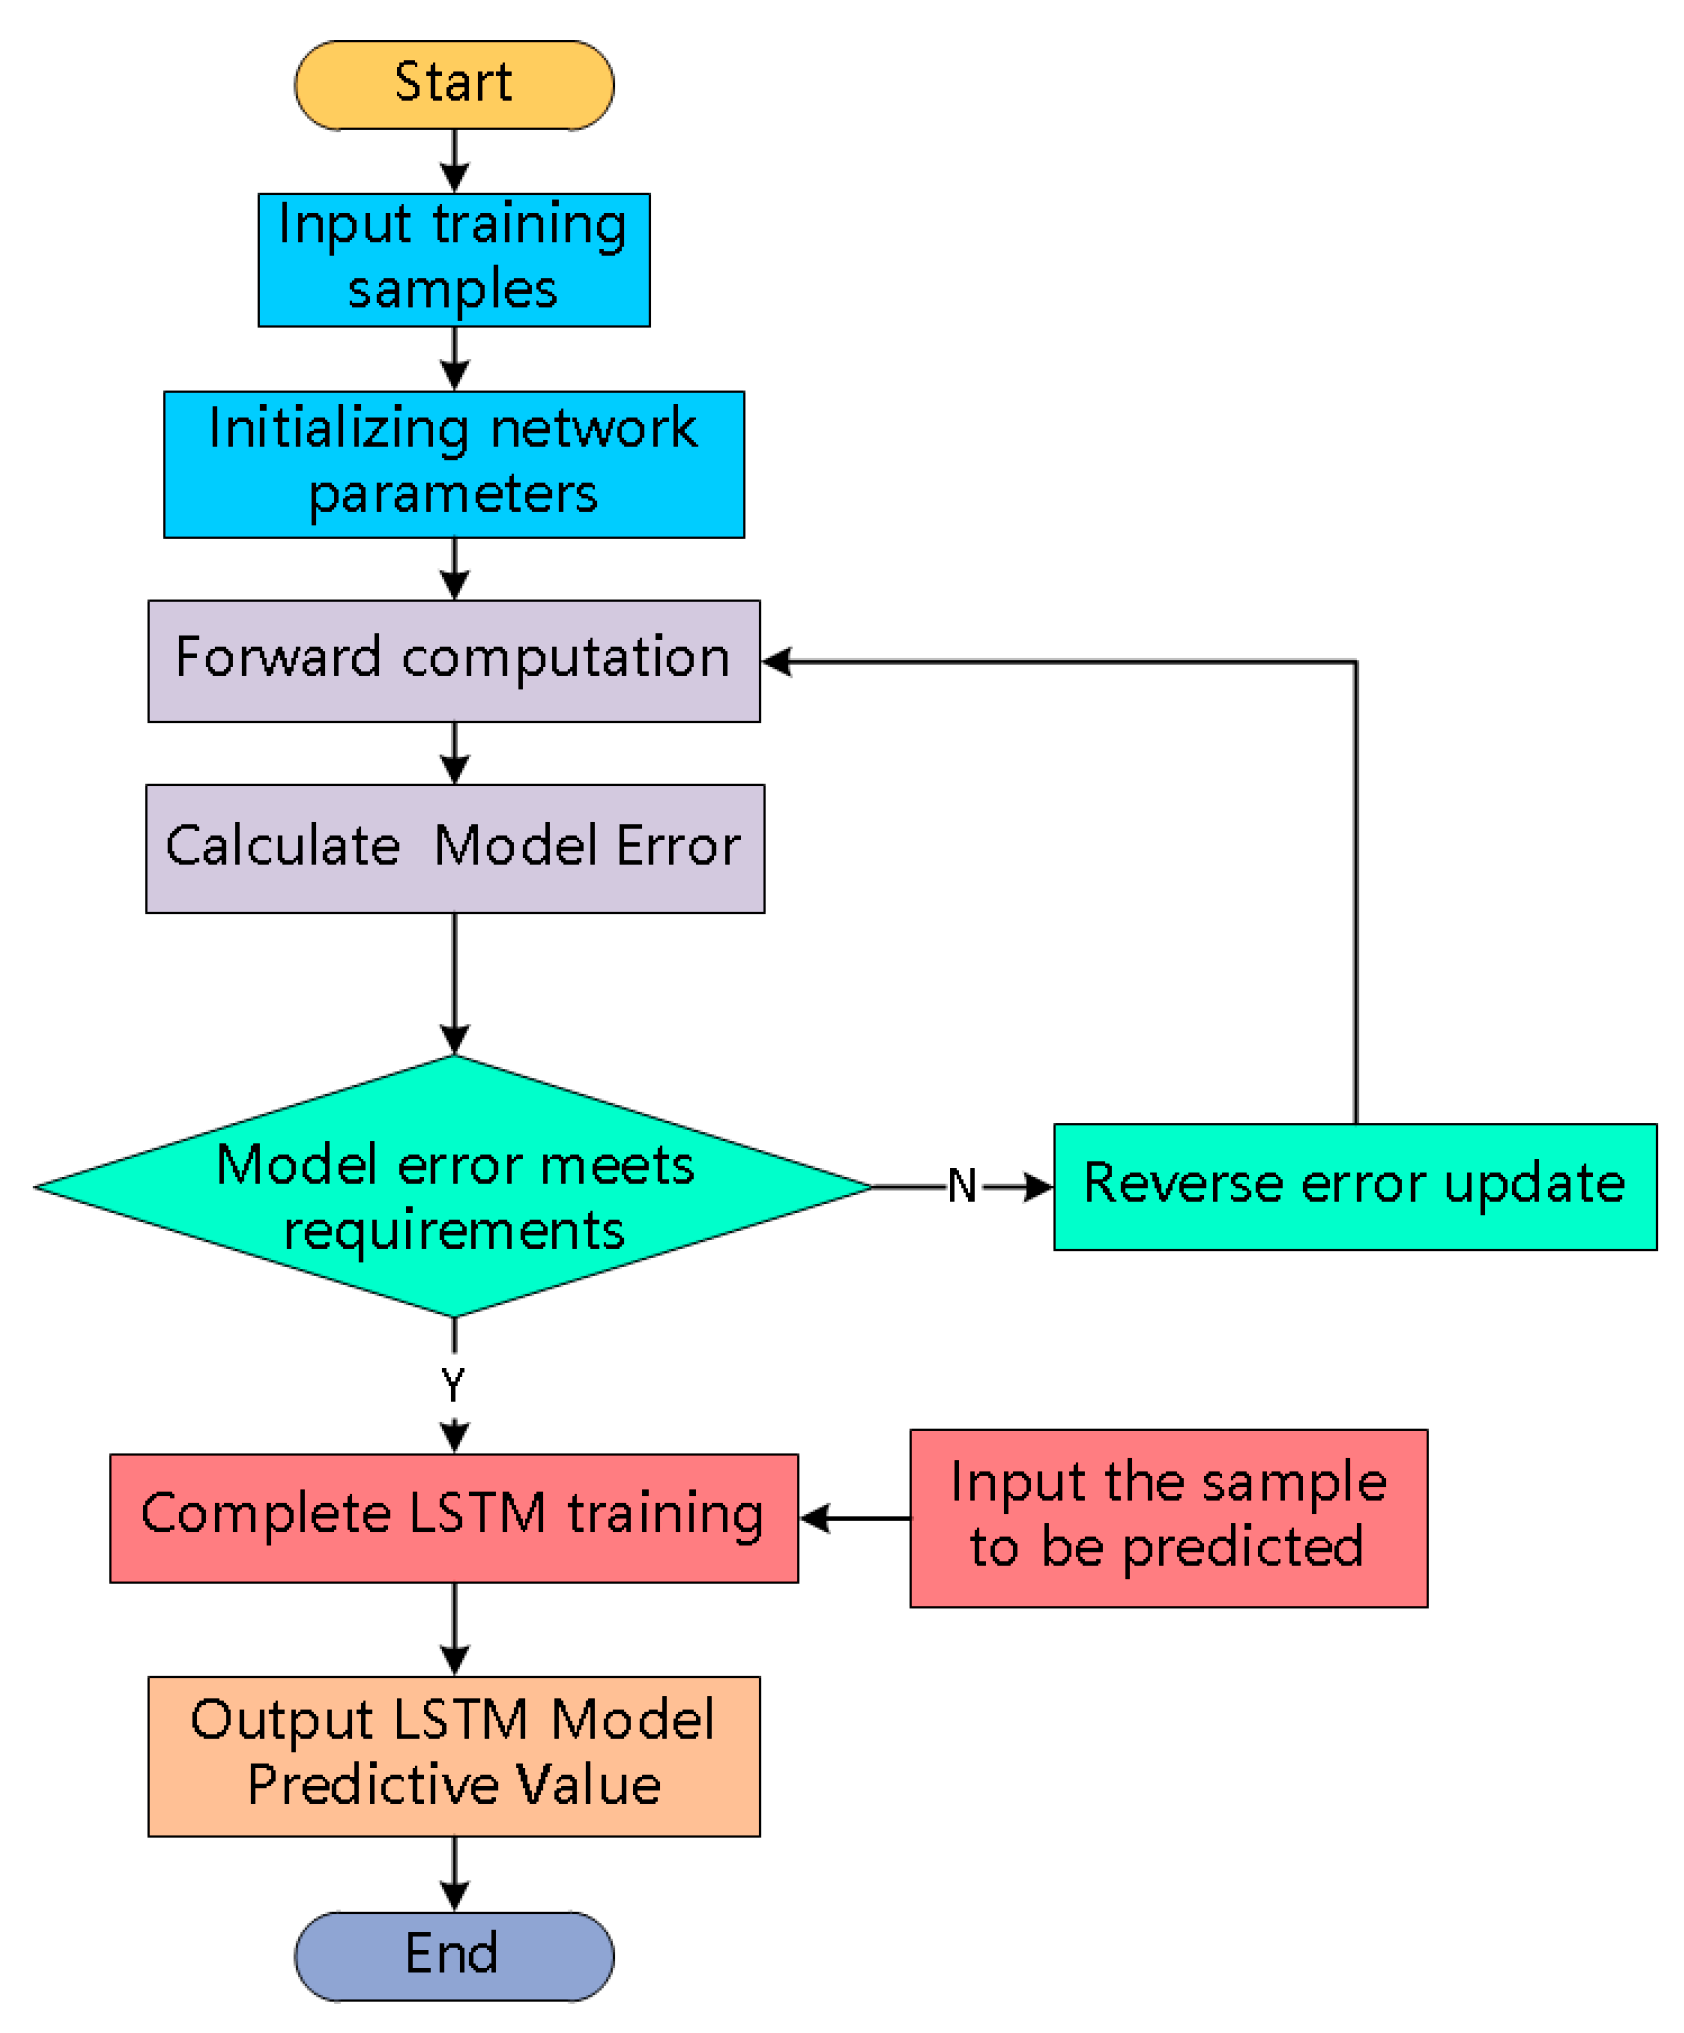
4.1. Prediction Based on Multi-LSTM

The inputs of LSTM are selected based on the correlation analysis of time series to construct multi-LSTM network. The LSTM prediction principle is shown in Figure 7 [18,19,20].
In multi-LSTM model, the key parameters and formulas are shown as follows.
f t = σ ( W f ( h t 1 , x t ) + b f )
i t = σ ( W i ( h t 1 , x t ) + b i )
c ˜ t = tanh ( W c ( h t 1 , x t ) + b c )
c t = f t c t 1 + i t c ˜ t
o t = σ ( W o ( h t 1 , x t ) + b o )
h t = o t tanh ( c t )
In formula, W and b are the weight matrix and bias of forgetting gate. Formula (6) is the output of the whole LSTM. The number of neurons in the input layer of LSTM is the number of input sequences, and the number of output neurons is the number of output sequences. When predicting the QAR data of aero-engine, one or more future time series of the aero-engine can be predicted by inputting the current or historical data in a period of time. Multi-LSTM prediction flow is shown in Figure 8.

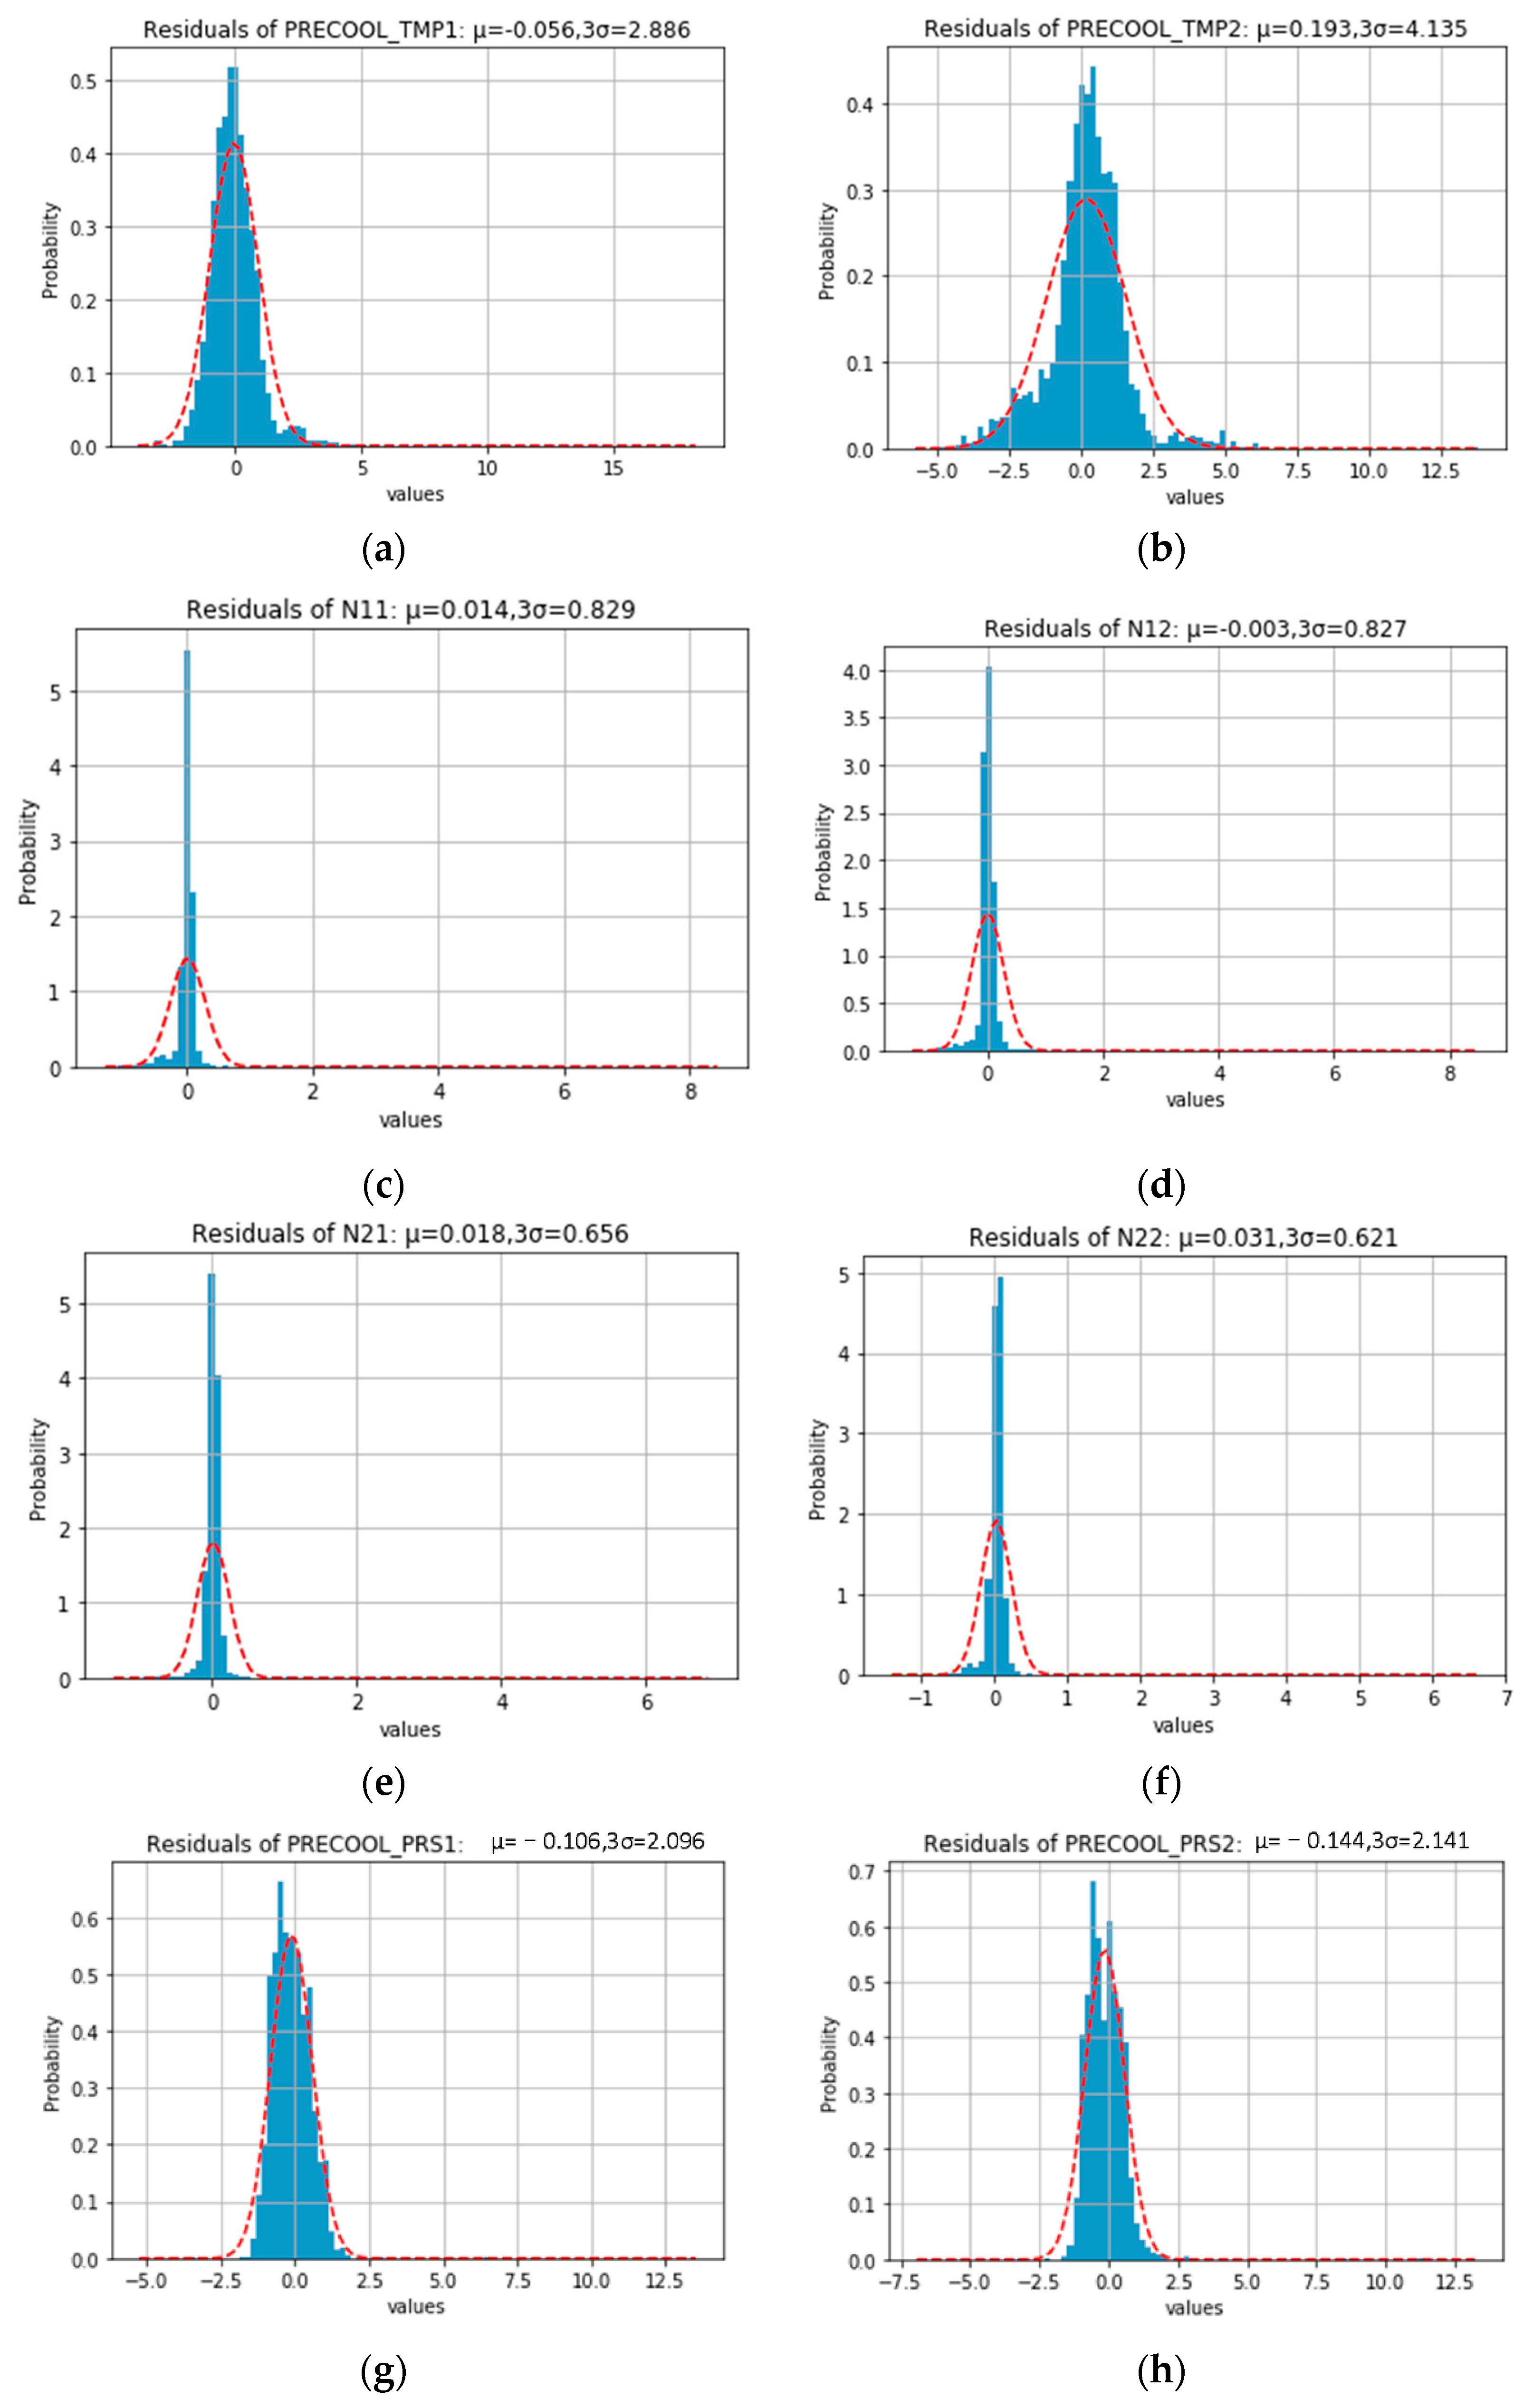
4.2. Gaussian Distribution Model Based on Prediction Error

Gaussian distribution method is a common anomaly detection method [21,22,23]. Its basic assumption is that the data set obeys a Gaussian distribution. The probability density of normal data in the Gaussian distribution is high, and the probability density of abnormal data in the Gaussian distribution is low. This method has a wide range of applications and performs well on non-Gaussian data sets. In addition, the Gaussian distribution method has the advantages of good anomaly detection effect, easy programming, and fast calculation speed, which can obtain better results for anomaly detection of gas path.
For a data set, the maximum likelihood estimation method can be used to estimate the mean and variance of each parameter. The specific calculation is shown as follows.
μ j = 1 m i = 1 m x i j
σ j 2 = 1 m i = 1 m ( x i j μ j ) 2
In formula, μ j represents the mean value of the j parameter. σ j 2 represents the variance of parameter j. x i j represents the j parameter of the i sample.
After the mean and variance of each parameter are estimated, the probability density of each parameter in its parameter distribution can be calculated. Assuming that each parameter is independent of each other, the probability density of each sample in the Gaussian distribution is the product of the probability density of all parameters. The probability density calculation in the dataset distribution is shown below.
p ( x i j ; μ j , σ j 2 ) = 1 2 π σ j 2 e ( x i j μ j ) 2 2 σ j 2
p ( x i ) = j = 1 n p ( x i j ; μ j , σ j 2 )
where p ( x i ) represents the probability density of x i in the Gaussian distribution of the dataset.
Those samples with low probability density are likely to be abnormal. Assuming that there is a critical value, normal and abnormal samples can be distinguished by this critical value. The division of normal and abnormal samples is as follows.
y i = { 1 , p ( x i ) < ε 0 , o t h e r s
In the formula, y i represents the anomaly detection results of the i sample; ε represents threshold. The appropriate critical value is the key to ensure that the Gaussian model can accurately identify abnormal samples. The selection of the critical value is determined by the three-sigma rule [24]. The anomaly detection process based on LSTM and Gaussian model is shown in Figure 9.

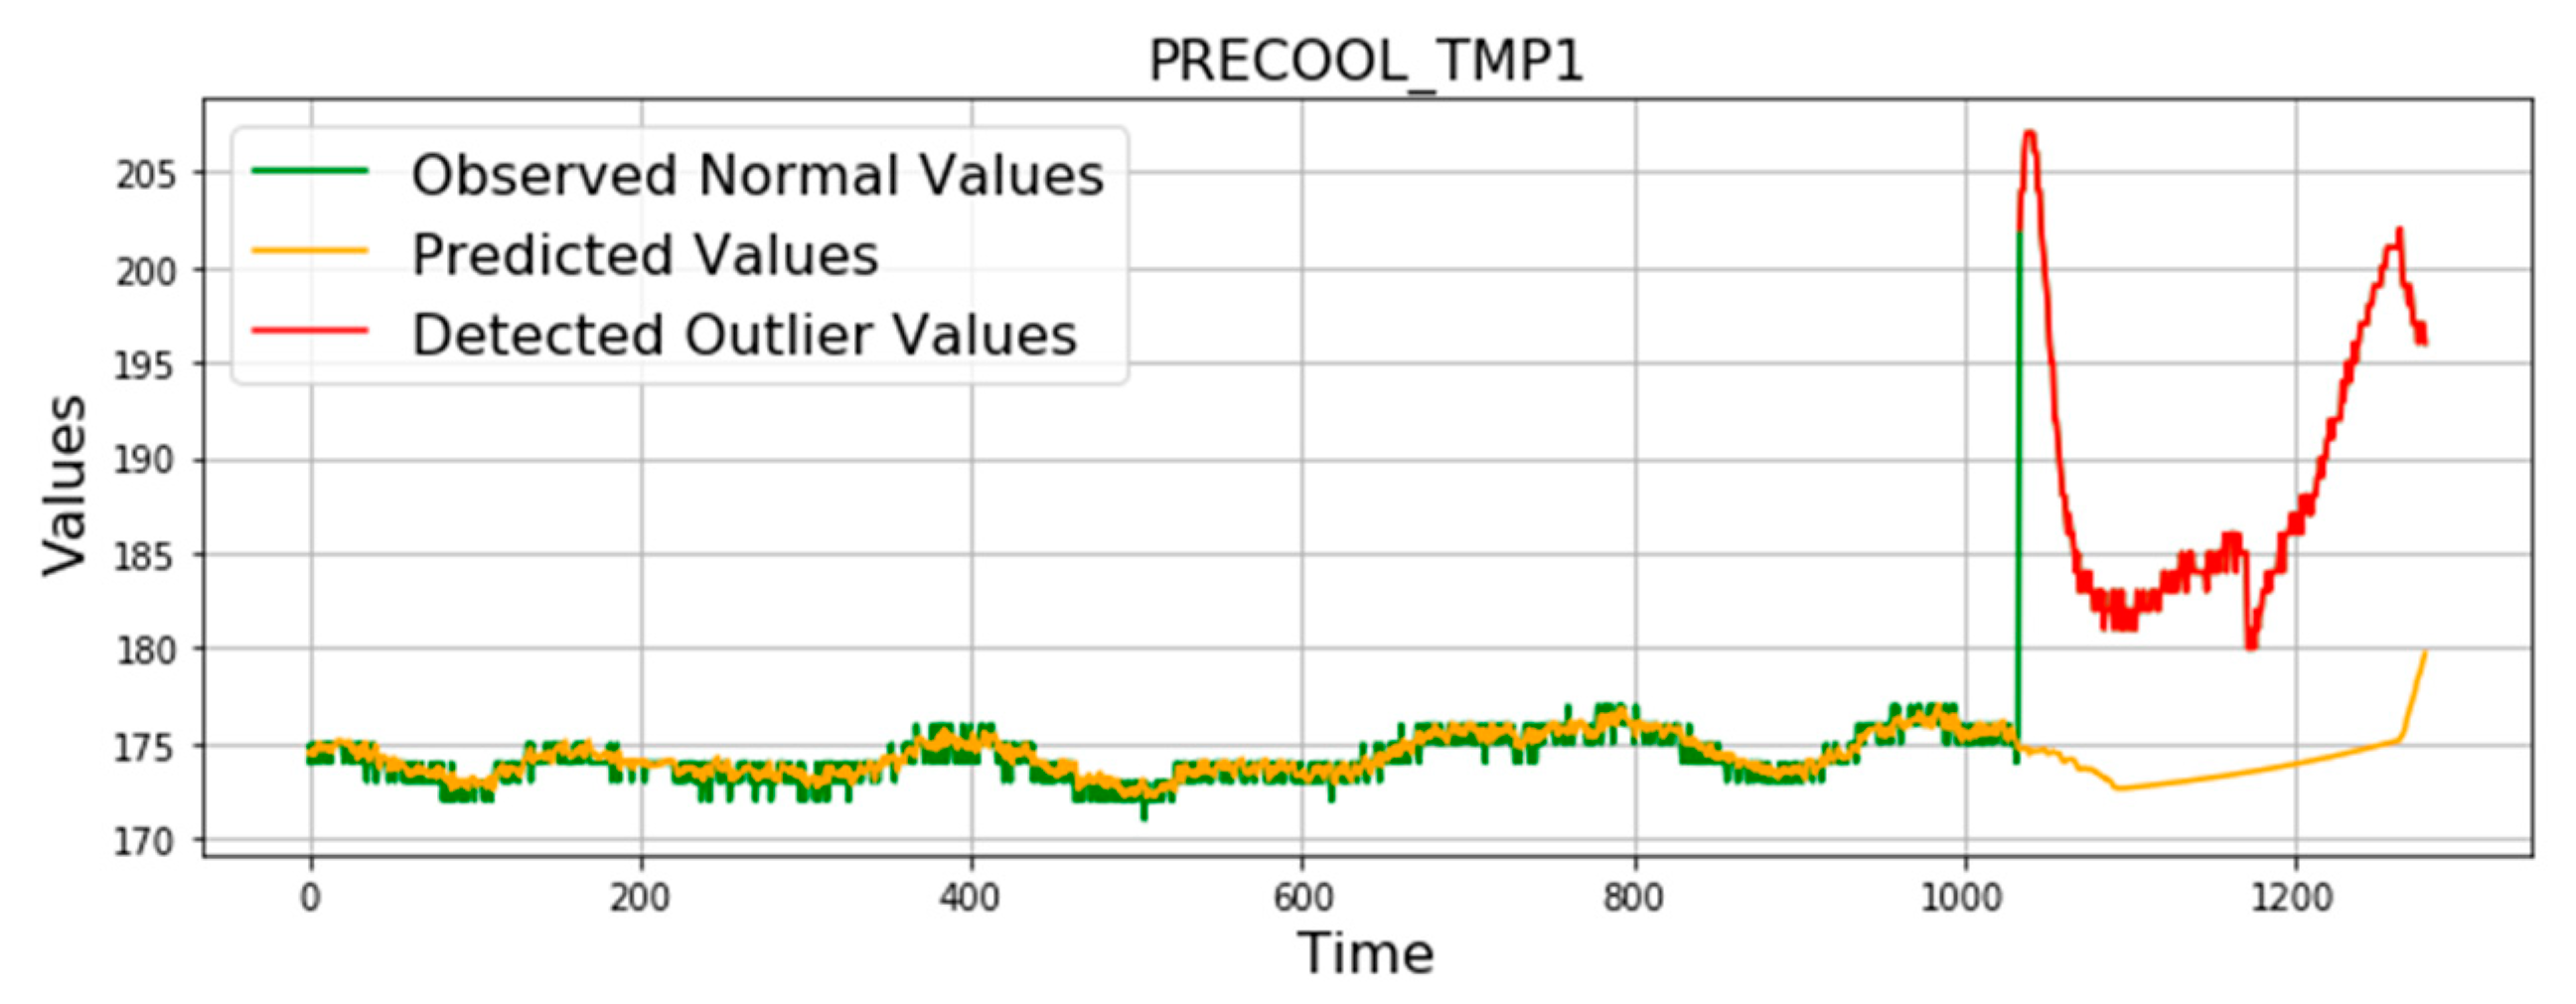
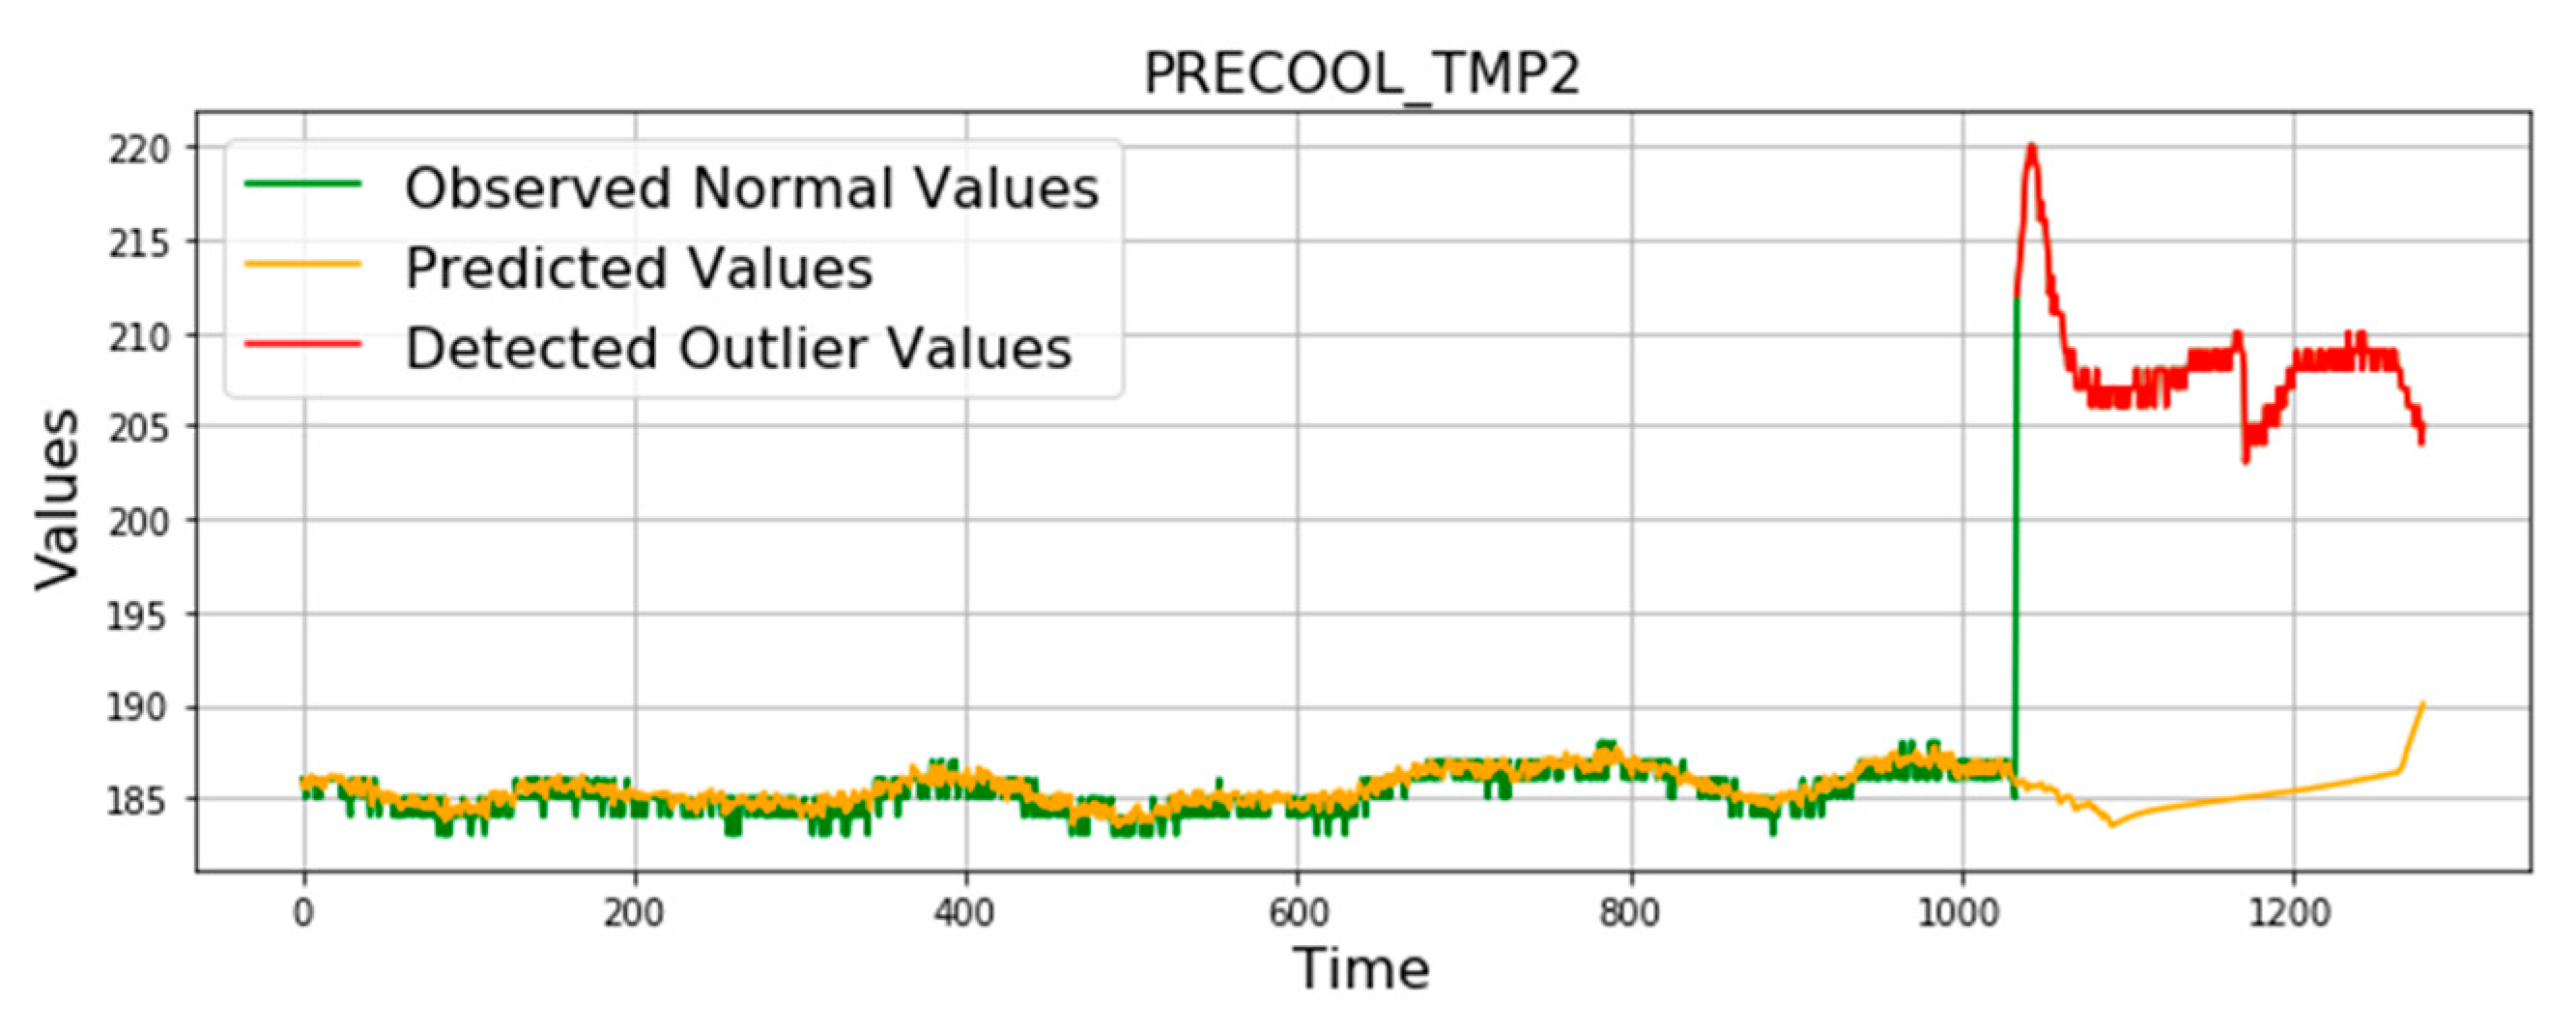
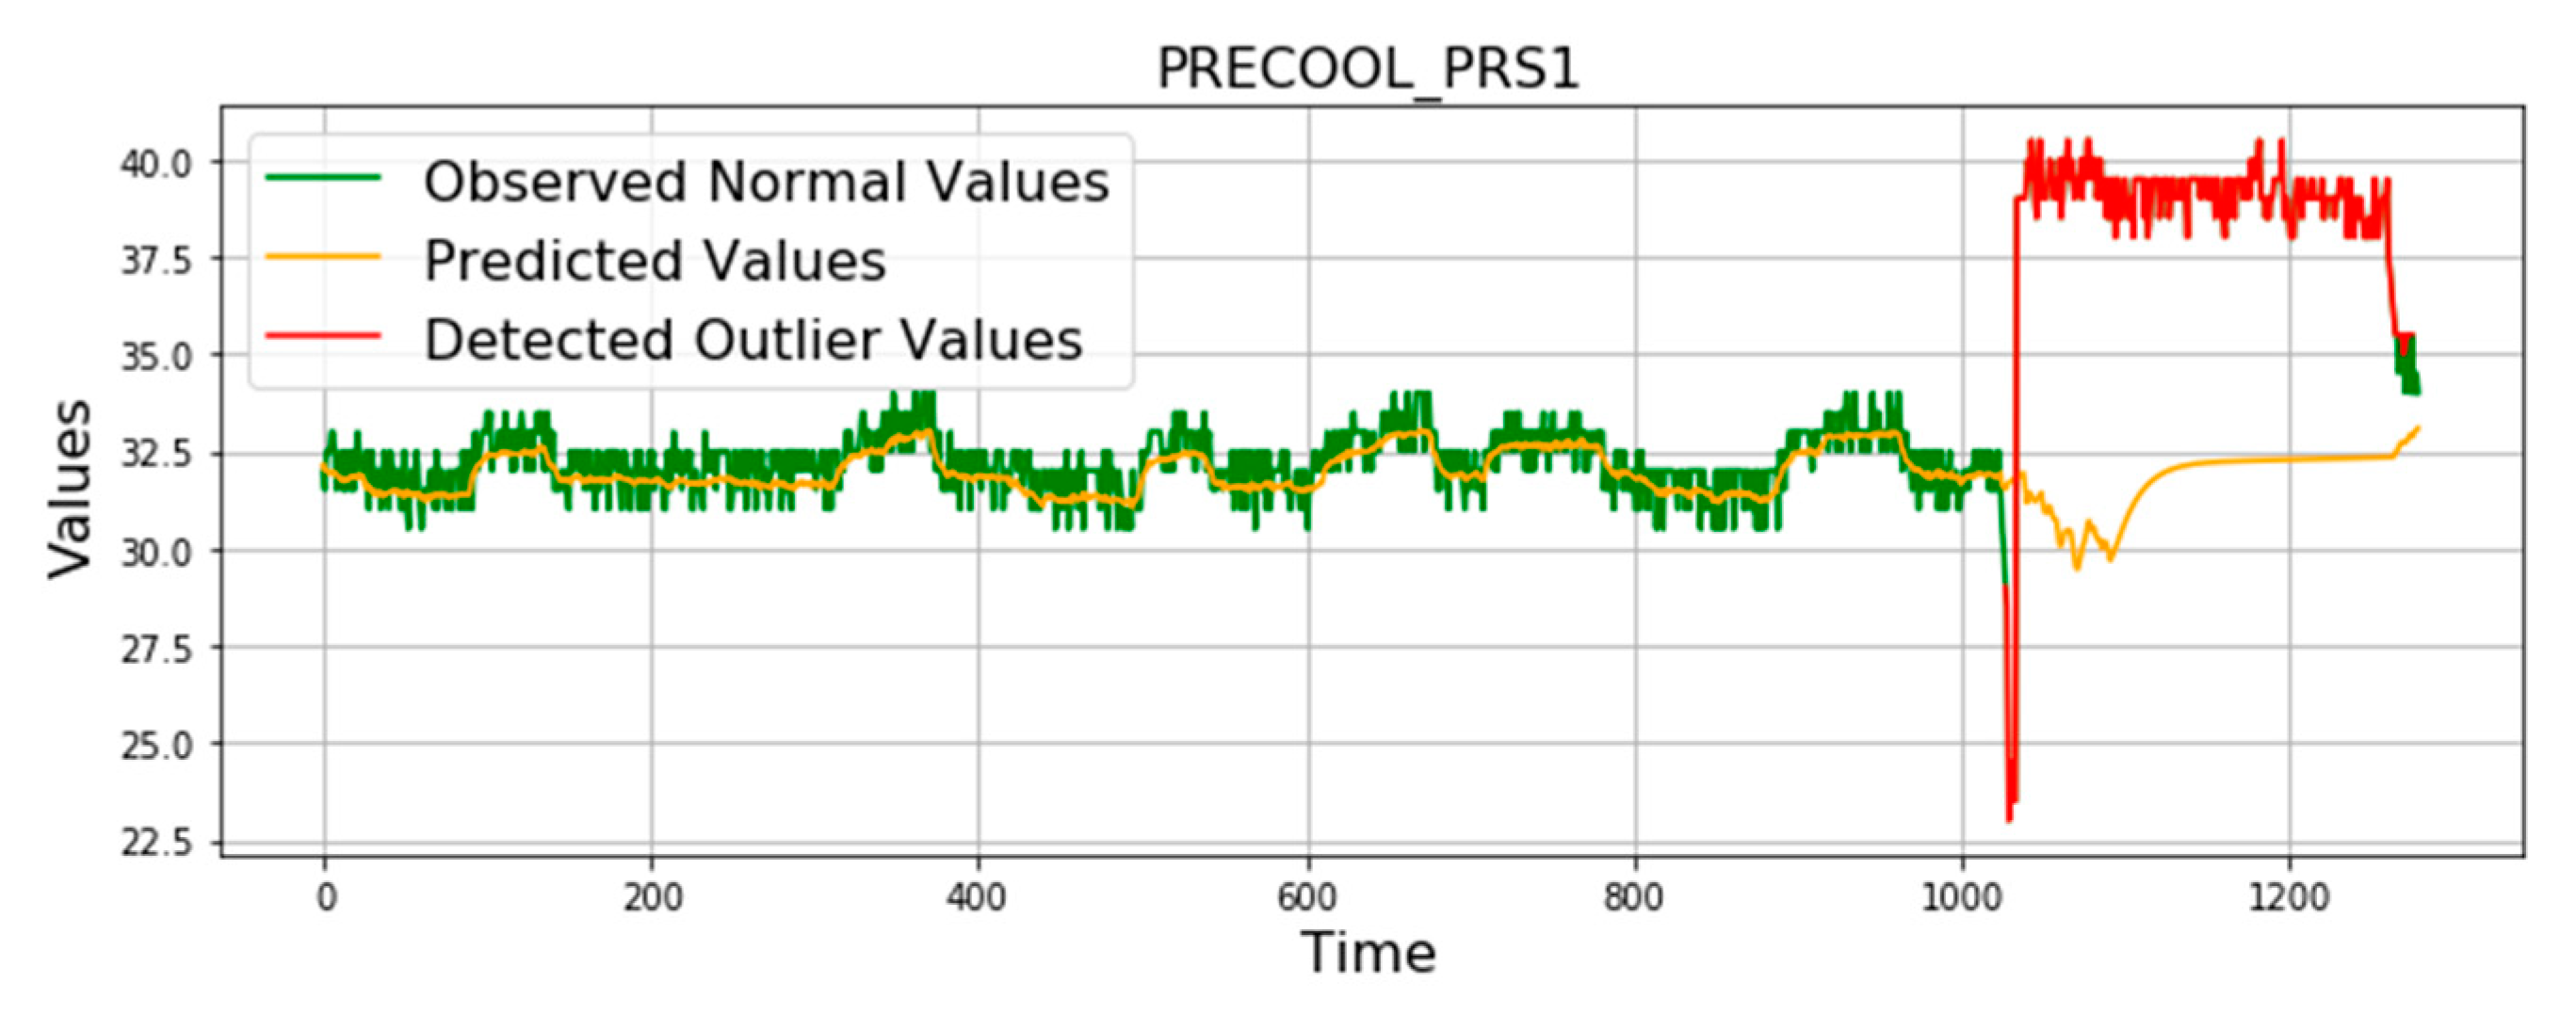
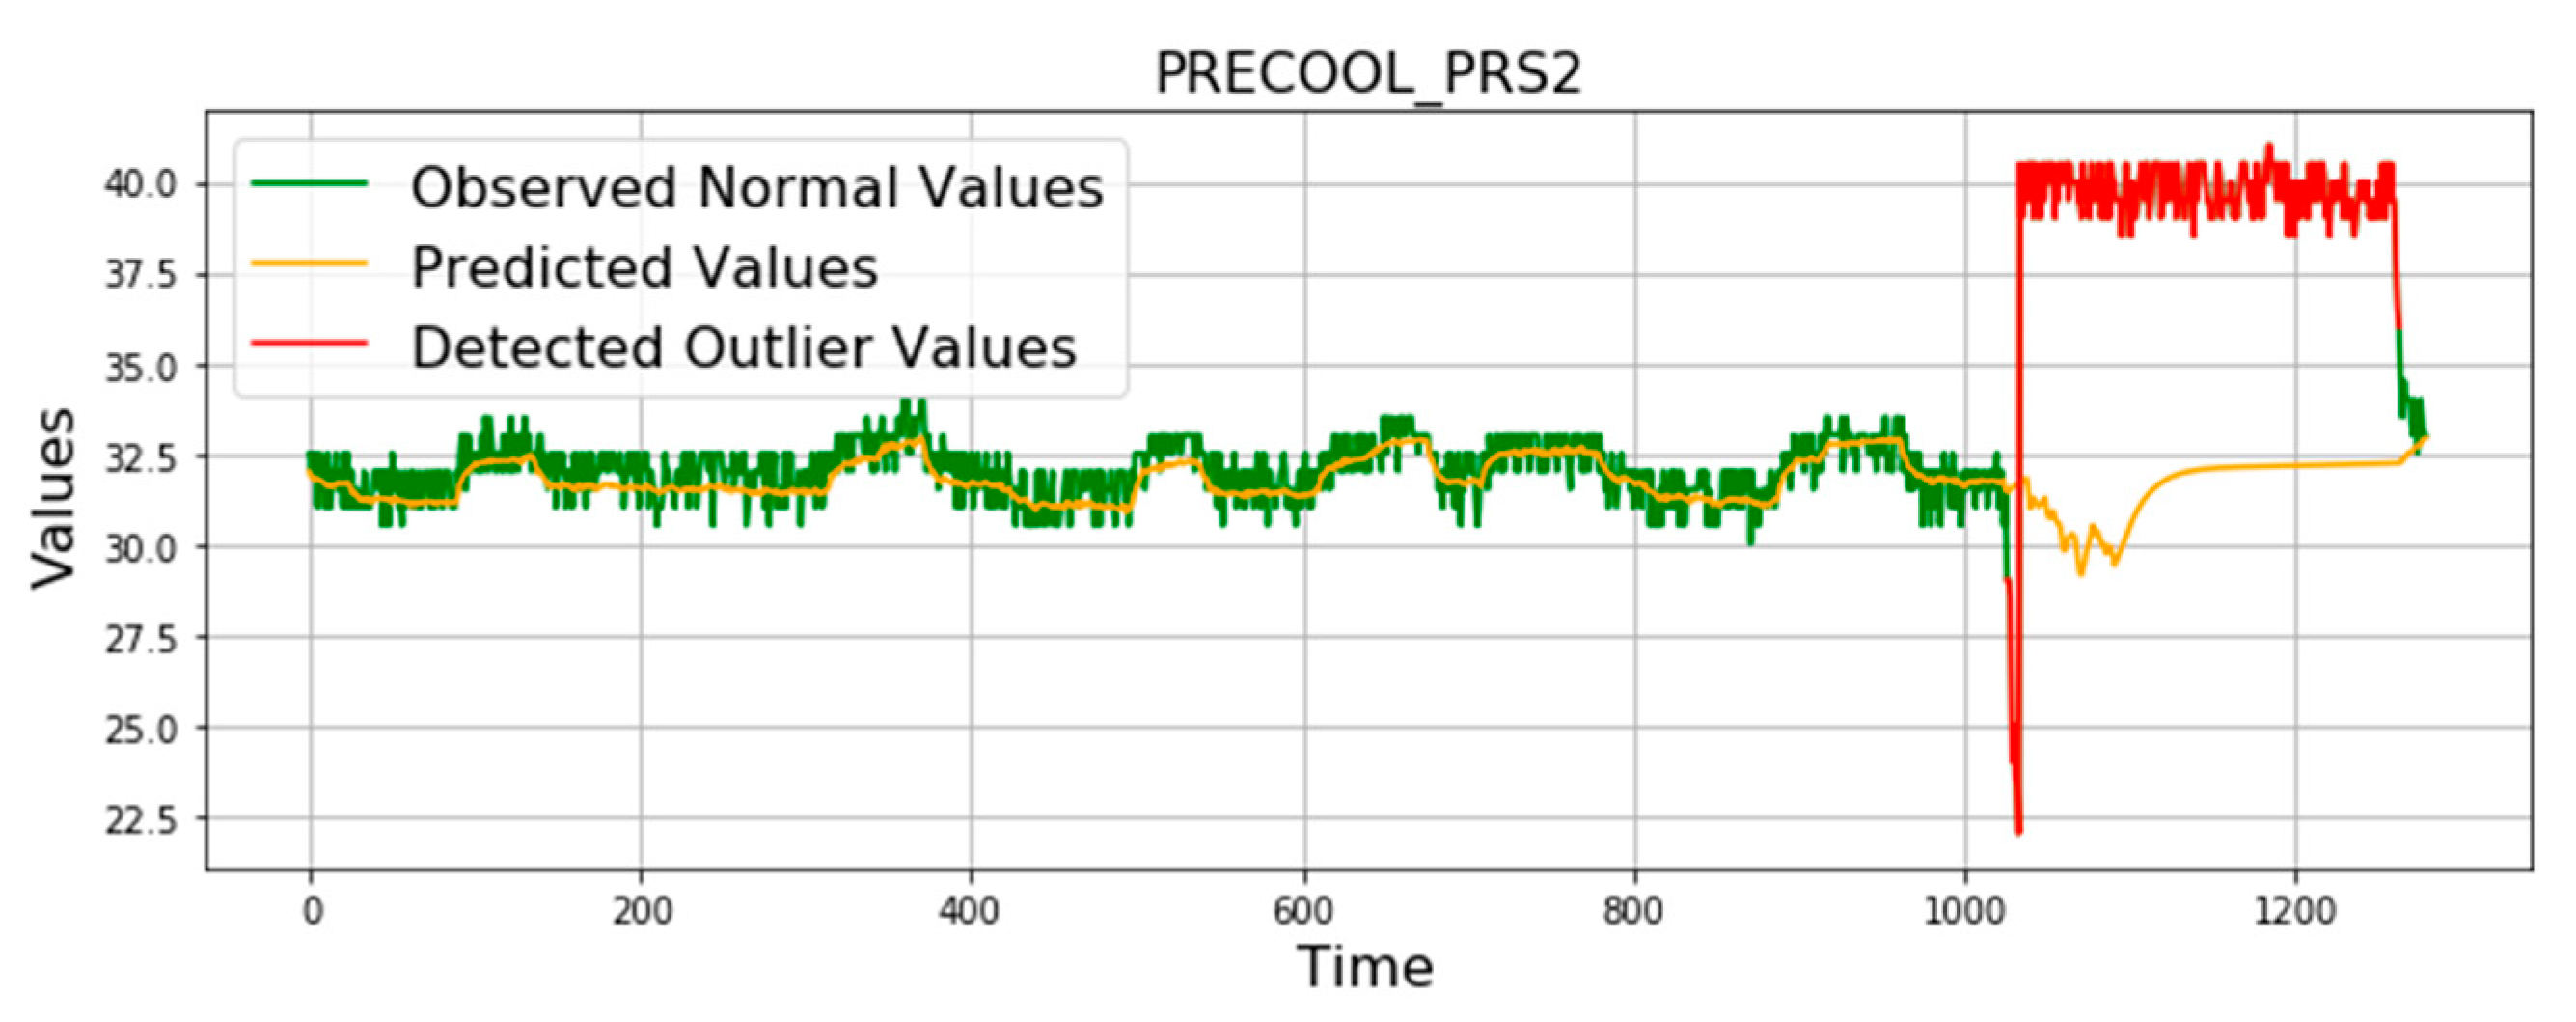
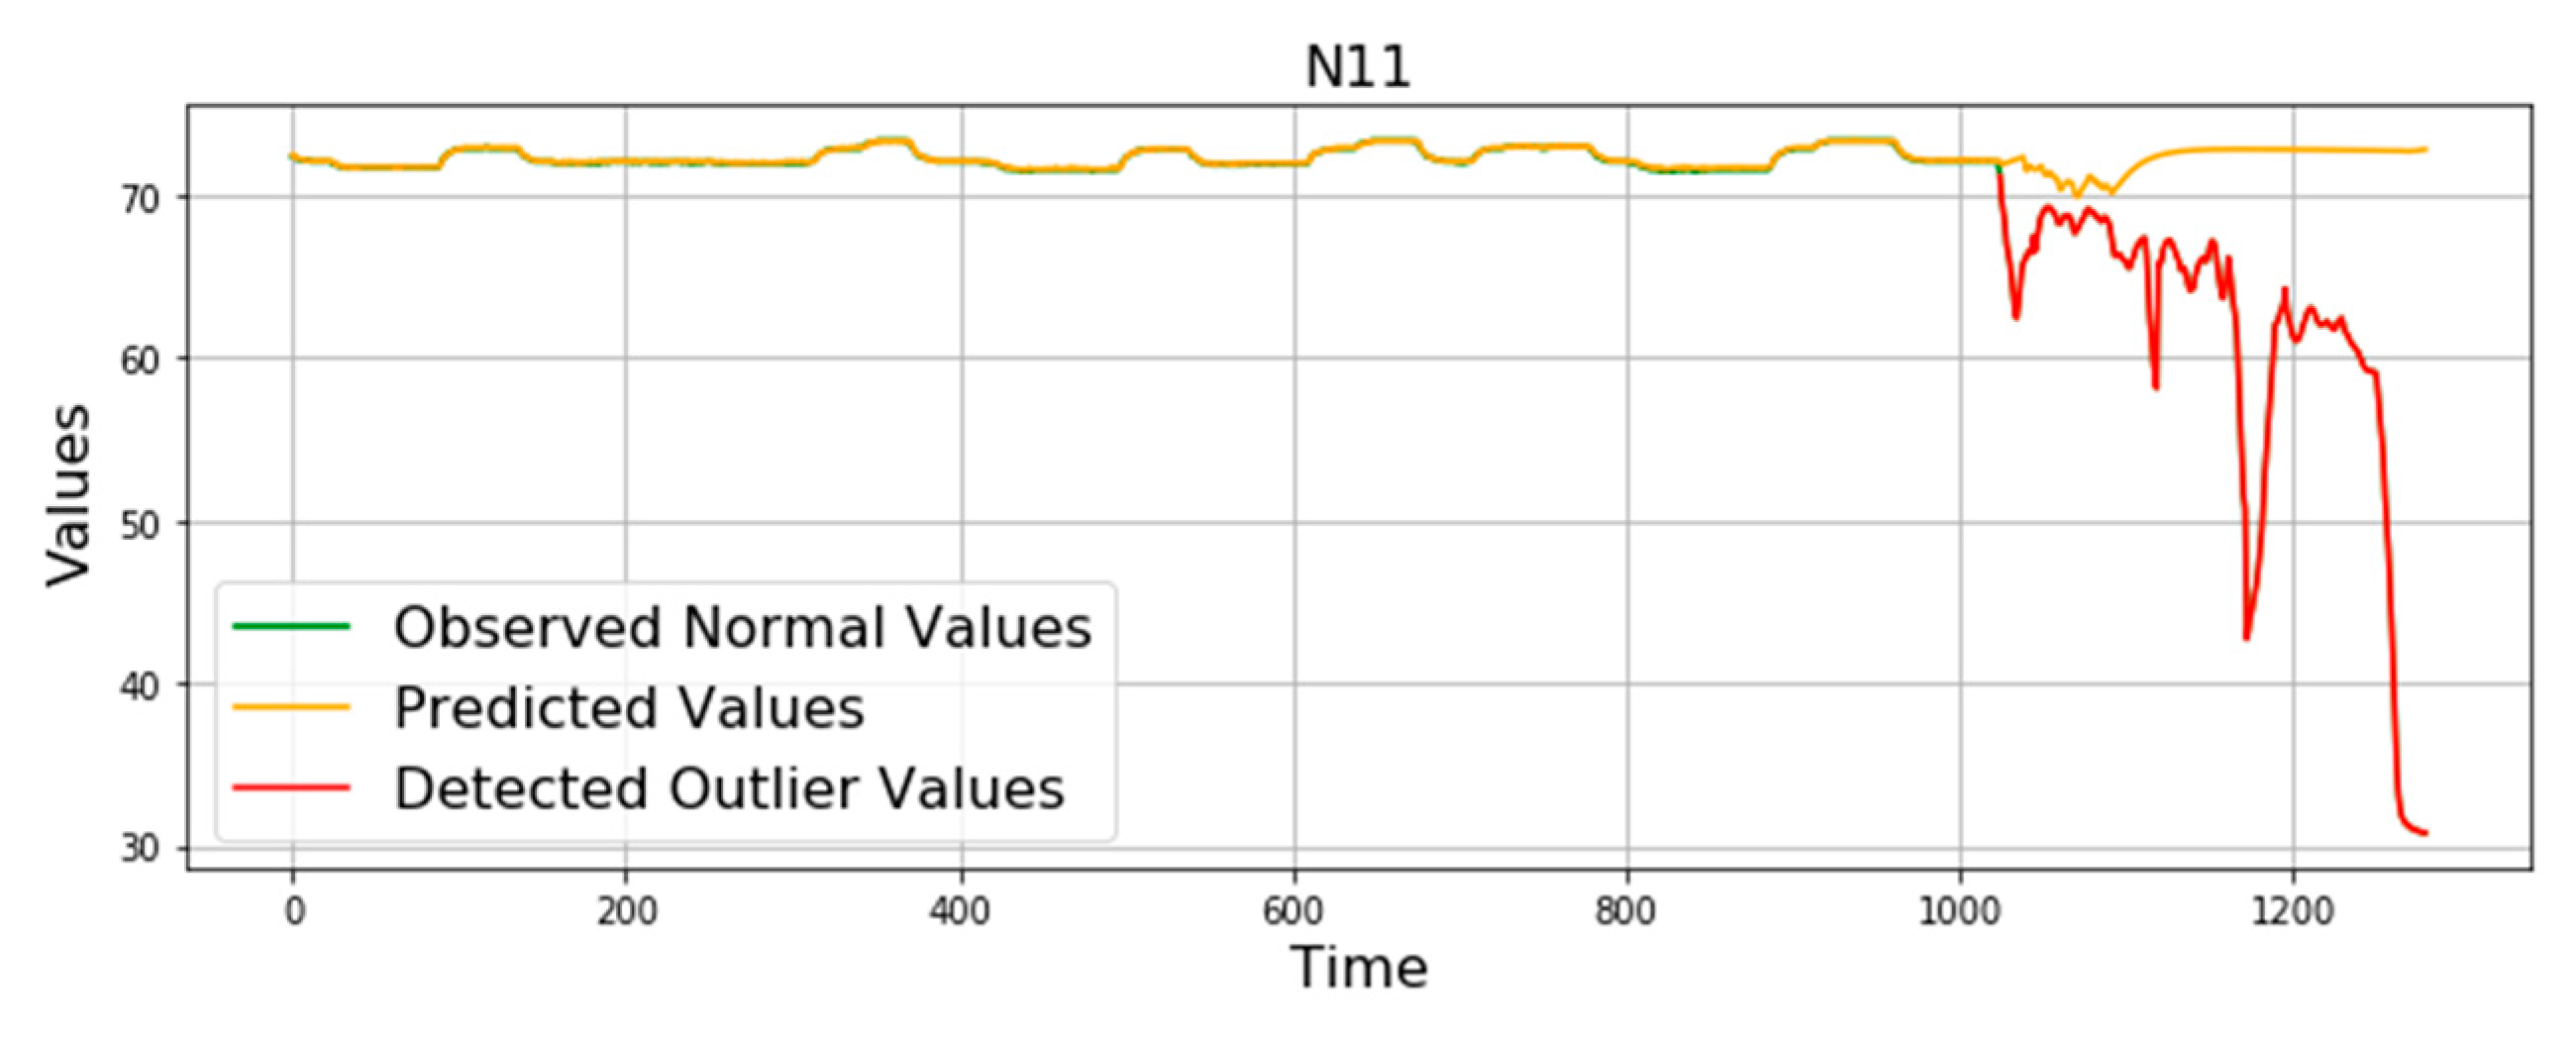
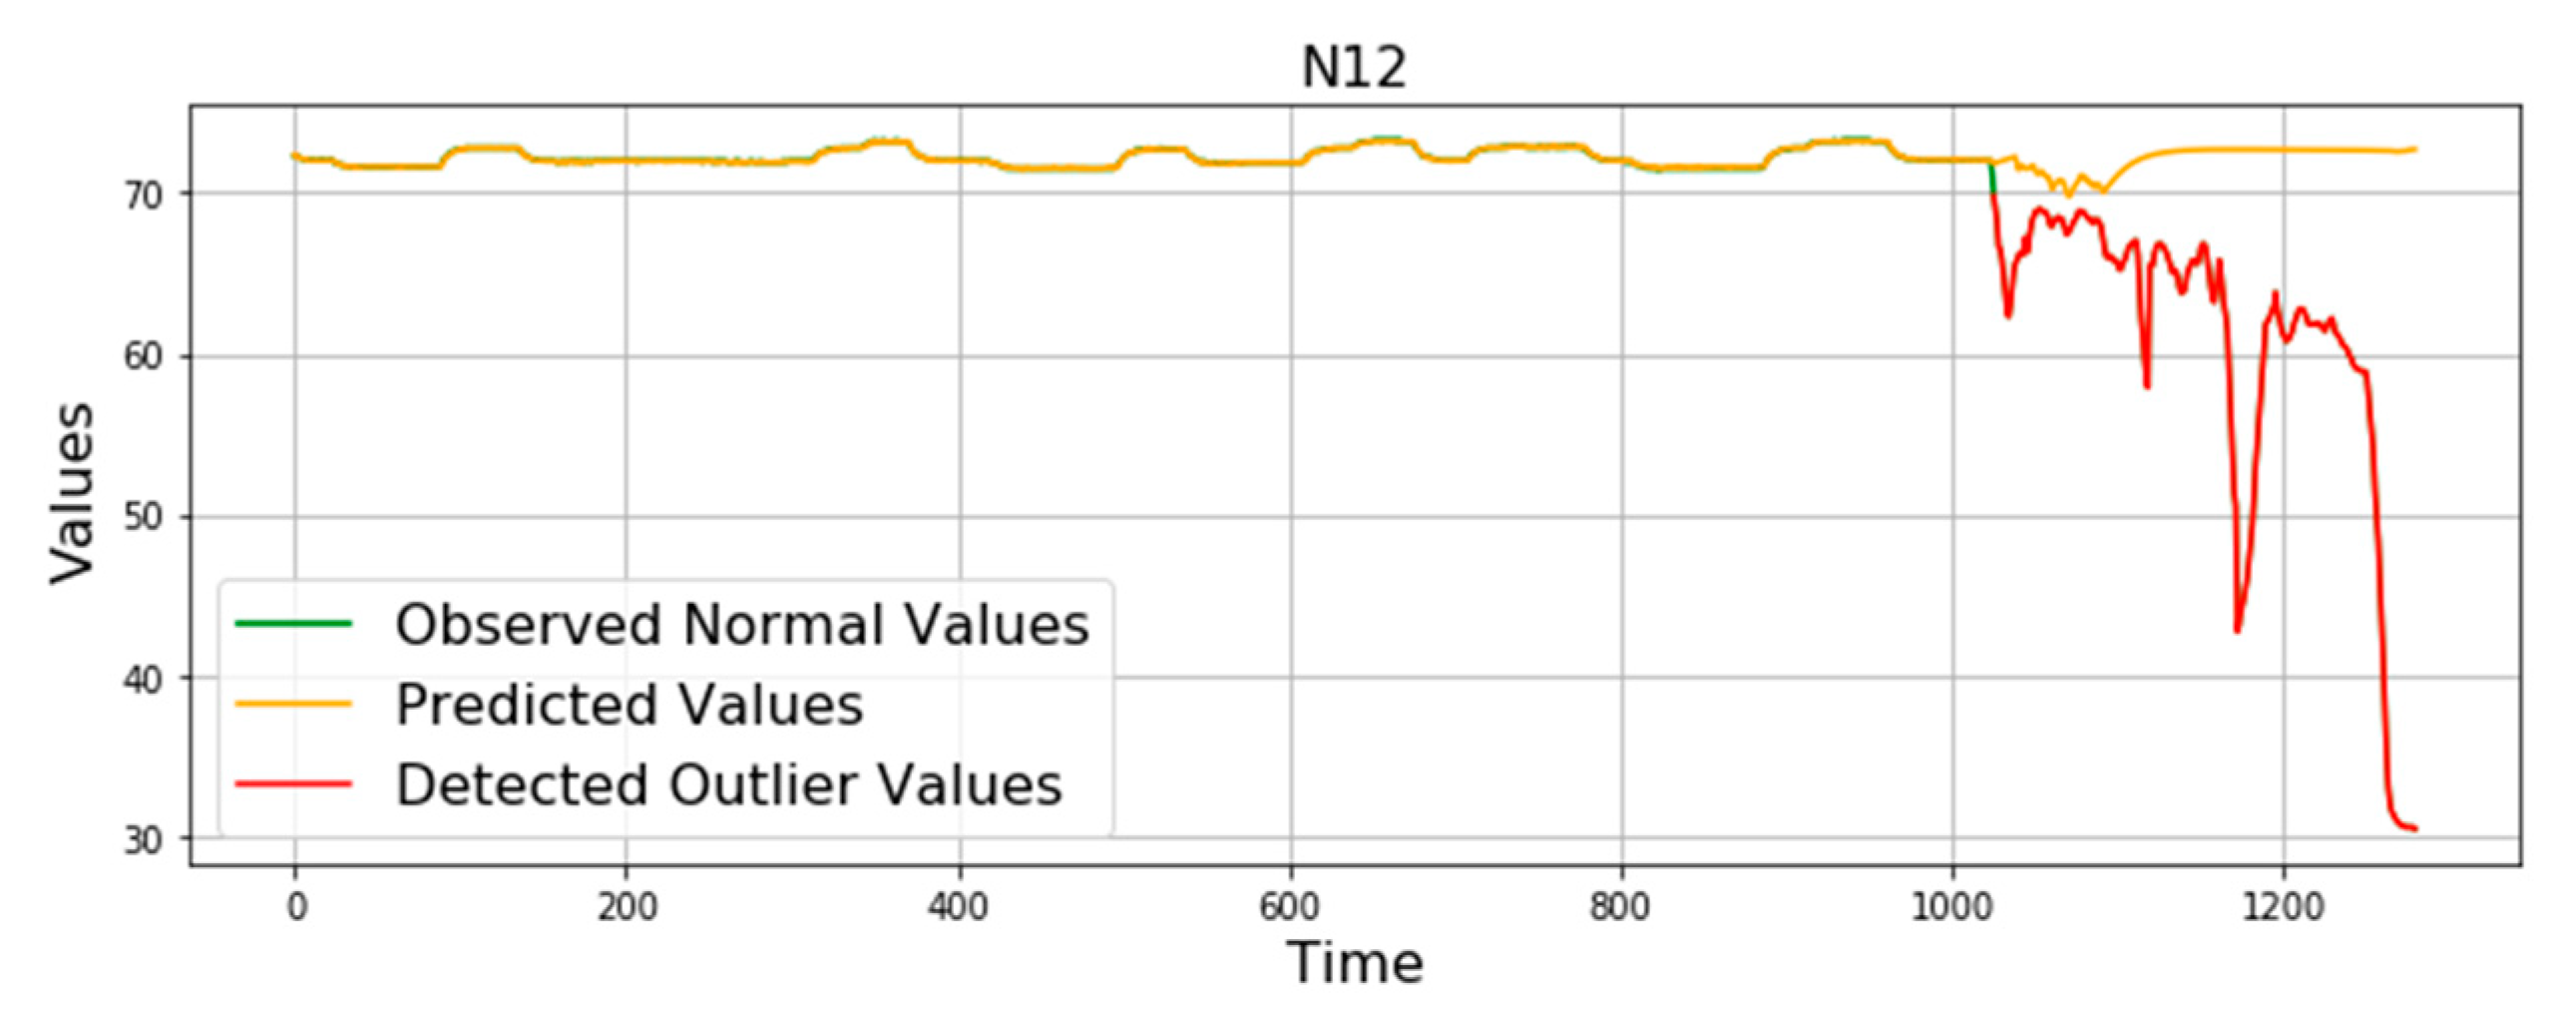
5. Results and Discussion

Data in the experiment is derived from the real QAR data of civil aviation engines. The experimental environment configuration is shown in Table 2.
The parameter settings of multiple-input and multiple-output LSTM network are shown in Table 3.
The Root Mean Square Error (RMSE) is applied to estimate prediction accuracy.
R M S E = 1 m i = 1 m ( f i y i ) 2
where f i and y i represent the predicted value and true value.
The prediction errors of different QAR data are shown in Table 4.
After training, the multi-LSTM model is applied for prediction. The residuals between the predicted value and the actual value are calculated. The residual probability distribution functions based on the Gaussian mixture model is shown in Figure 10.
The three-sigma rule is applied for anomaly detection. The anomaly detection accuracy is calculated as follows.
A c c u r a c y = ( T P + T N ) / ( T P + T N + F P + F N )
TP (True Positives) indicates that the prediction result of an actual positive case is a positive case. FP (False Positives) indicates that the prediction result of an actual negative case is a positive case. FN (False Negatives) indicates that the prediction result of an actual positive case is a negative case. TN (True Negatives) indicates that the prediction result of an actual negative case is a negative case.
The accuracy of anomaly detection is shown in Table 5.
The anomaly detection results are shown in Figure 11, Figure 12, Figure 13, Figure 14, Figure 15, Figure 16, Figure 17 and Figure 18. The green curve represents the observed data, the yellow curve represents the curve predicted by multi-LSTM, and the red curve represents the abnormal value detected by the model.
According to the anomaly detection results as shown in Table 5 and Figure 11, Figure 12, Figure 13, Figure 14, Figure 15, Figure 16, Figure 17 and Figure 18, for anomaly detection of aero-engine gas path, the accuracy of proposed method is over 98%. The experiment results show the superiority of the method proposed in this paper, and it can be applied to solve similar time series anomaly detection problems.

6. Conclusions

In this paper, the correlation among QAR data is analyzed by Markov transition matrix and hierarchical clustering method. Based on correlation analysis, the key monitoring data is selected to construct the multi- LSTM network prediction. The residuals between the predicted value and the real value are calculated, and the probability distribution of residuals is constructed based on the Gaussian mixture model. Based on the residual probability distribution, the three-sigma rule is applied for anomaly detection. Experiments show that the method proposed in this paper can detect the anomaly of aero-engine gas path accurately, and it is suitable for solving similar anomaly detection problems.

Author Contributions

L.C. proposed and designed the anomaly detection methods; L.C. and C.Z. contributed to the manuscript discussion and writing; Q.Z. and Y.S. gave comments on the manuscript and checked the writing; J.W. and Y.J. contributed to some results of the study. C.L. and Y.W. contributed QAR data for results and analysis. All authors have read and agreed to the published version of the manuscript.

Funding

This research received no external funding.

Institutional Review Board Statement

Not applicable.

Informed Consent Statement

Not applicable.

Data Availability Statement

Data are available by contacting the corresponding author.

Conflicts of Interest

The authors declare no conflict of interest.

References

  1. Wang, X.-Y.; Li, C.-F.; Gao, M.-Y.; Li, Z.-S. Fault diagnosis of aero-engine gas path based on SVM and SNN. J. Aerosp. Power 2014, 10, 2493–2498. [Google Scholar]
  2. Zhang, Y.-Z.; Zhong, S.-S.; Fu, X.-Y.; Lin, L. Aeroengine gas path parameter prediction based on dynamic ensemble algorithm. J. Aerosp. Power 2018, 9, 2285–2295. [Google Scholar]
  3. Cao, H.-L.; Gao, Y. Research on QAR Data Knowledge and Application in Civil Aviation Field. Mech. Eng. Autom. 2018, 1, 24–26. [Google Scholar]
  4. Sun, H.; Fu, X.-Y.; Zhong, S.-S. A Weakly Supervised Gas-Path Anomaly Detection Method for Civil Aero-Engines Based on Mapping Relationship Mining of Gas-Path Parameters and Improved Density Peak Clustering. Sensors 2021, 21, 4526. [Google Scholar] [CrossRef]
  5. Chen, J.-S.; Xu, X.-K.; Zhang, X.-Y. Fault Detection for Turbine Engine Disk Based on Adaptive Weighted One-Class Support Vector Machine. J. Electr. Comput. Eng. 2020, 10, 1–10. [Google Scholar] [CrossRef]
  6. Pérez-Ruiz, J.L.; Tang, Y.; Loboda, I. Aircraft Engine Gas-Path Monitoring and Diagnostics Framework Based on a Hybrid Fault Recognition Approach. Aerospace 2021, 8, 232. [Google Scholar] [CrossRef]
  7. Zaccaria, V.; Fentaye, A.D.; Stenfelt, M.; Kyprianidis, K.G. Probabilistic Model for Aero-Engines Fleet Condition Monitoring. Aerospace 2020, 7, 66. [Google Scholar] [CrossRef]
  8. Gharoun, H.; Keramati, A.; Nasiri, M.M.; Azadeh, A. An integrated approach for aircraft turbofan engine fault detection based on data mining techniques. Expert Syst. 2019, 36, 1. [Google Scholar] [CrossRef]
  9. Xie, J.-W.; Liu, J.-Q.; Wang, X.-L. Aero-engines Health Monitoring Method Based on Mahalanobis Distance. Aeronaut. Comput. Tech. 2015, 3, 72–75. [Google Scholar]
  10. Wen, Y.; Yan, Y. Aero Engine Anomaly Monitoring Based on Self-adaptive Kernel Principal Component Analysis. Ordnance Ind. Autom. 2016, 35, 1–8. [Google Scholar]
  11. Trent 700-Rolls-Royce. Available online: https://www.rolls-royce.com/products-and-services/civil-aerospace/airlines/trent-700.aspx (accessed on 16 November 2021).
  12. Calderano, P.H.S.; Ribeiro, M.G.C.; de Aguiar, E.P.; Amaral, R.P.F.; Vellasco, M.M.B.R.; Tanscheit, R. An enhanced aircraft engine gas path diagnostic method based on upper and lower singleton type-2 fuzzy logic system. J. Braz. Soc. Mech. Sci. Eng. 2019, 41, 2. [Google Scholar] [CrossRef]
  13. Wang, Z.; Oates, T. Encoding Time Series as Images for Visual Inspection and Classification Using Tiled Convolutional Neural Networks. In Proceedings of the Workshops at the Twenty-ninth Aaai Conference on Artificial Intelligence, Austin, TX, USA, 25–26 January 2015. [Google Scholar]
  14. Jiang, J.-R.; Yen, C.-T. Product Quality Prediction for Wire Electrical Discharge Machining with Markov Transition Fields and Convolutional Long Short-Term Memory Neural Networks. Appl. Sci. 2021, 11, 5922. [Google Scholar] [CrossRef]
  15. Bugueno, M.; Molina, G.; Mena, F.; Olivares, P.; Araya, M. Harnessing the power of CNNs for unevenly-sampled light-curves using Markov Transition Field. Astron. Comput. 2021, 35, 100461. [Google Scholar] [CrossRef]
  16. Hulot, A.; Laloë, D.; Jaffrézic, F. A unified framework for the integration of multiple hierarchical clusterings or networks from multi-source data. BMC Bioinform. 2021, 22, 1–20. [Google Scholar] [CrossRef]
  17. Alter, B.-J.; Anderson, N.-P.; Gillman, A.-G.; Yin, Q.; Jeong, J.-H.; Wasan, A.-D. Hierarchical clustering by patient-reported pain distribution alone identifies distinct chronic pain subgroups differing by pain intensity, quality, and clinical outcomes. PLoS ONE 2021, 16, e0254862. [Google Scholar] [CrossRef]
  18. Zhou, X.; Hu, Y.; Liang, W.; Ma, J.; Jin, Q. Variational LSTM Enhanced Anomaly Detection for Industrial Big Data. IEEE Trans. Ind. Inform. 2021, 17, 3469–3477. [Google Scholar] [CrossRef]
  19. Ergen, T.; Kozat, S.-S. Unsupervised Anomaly Detection with LSTM Neural Networks. IEEE Trans. Neural Netw. Syst. 2020, 31, 3127–3141. [Google Scholar] [CrossRef] [Green Version]
  20. Maleki, S.; Maleki, S.; Jennings, N.-R. Unsupervised anomaly detection with LSTM autoencoders using statistical data-filtering. Appl. Soft Comput. J. 2021, 108, 107443. [Google Scholar] [CrossRef]
  21. Rippel, O.; Mertens, P.; Konig, E.; Merhof, D. Gaussian Anomaly Detection by Modeling the Distribution of Normal Data in Pretrained Deep Features. IEEE Trans. Instrum. Meas. 2021, 70, 1–13. [Google Scholar] [CrossRef]
  22. Liang, J.-M.; Shen, S.-Q.; Li, M.; Li, L. Quantum Anomaly Detection with Density Estimation and Multivariate Gaussian Distribution. Phys. Rev. A 2019, 99, 052310. [Google Scholar] [CrossRef] [Green Version]
  23. Pandit, R.-K.; Infield, D. SCADA—based wind turbine anomaly detection using Gaussian process models for wind turbine condition monitoring purposes. IET Renew. Power Gener. 2018, 12, 1249–1255. [Google Scholar] [CrossRef] [Green Version]
  24. Spevakova, R.G.; Sharifullina, G.R.; Fadeyeva, E.P. Application of the «Three sigma» rule in the risk assessment of investment project. Eur. Res. 2011, 9, 932–933. [Google Scholar]
Figure 1. Aero-engine: (a) Diagram of the aero-engine model; (b) Gas path system.
Aerospace 08 00374 g001
Figure 2. Monitoring data of QAR aero-engine gas path in whole flight phase: (a) Temperature of precooler; (b) Speed of engine N1; (c) Speed of engine N2; (d) Pressure of precooler.
Aerospace 08 00374 g002
Figure 3. QAR data of aero-engine gas path in cruise phase: (a) Temperature of precooler in cruise phase; (b) Speed of engine N1 in cruise phase; (c) Speed of engine N2 in cruise phase; (d) Pressure of precooler in cruise phase.
Aerospace 08 00374 g003
Figure 4. Transition Process of Markov Transition Field.
Aerospace 08 00374 g004
Figure 5. Results of Markov Transition Field Analysis: (a) Markov Transition Field analysis of Precool_TMP1; (b) Markov Transition Field analysis of N11; (c) Markov Transition Field analysis of N21; (d) Markov Transition Field analysis of SAT; (e) Markov Transition Field analysis of ALT_STD; (f) Markov Transition Field analysis of PRS1.
Aerospace 08 00374 g005
Figure 6. The hierarchical clustering results.
Aerospace 08 00374 g006
Figure 7. Multi-LSTM network.
Aerospace 08 00374 g007
Figure 8. LSTM prediction flow chart.
Aerospace 08 00374 g008
Figure 9. Anomaly Detection Process Based on LSTM and Gaussian Distribution.
Aerospace 08 00374 g009
Figure 10. The residual probability distribution based on the Gaussian mixture model: (a) the residual probability distribution function of TMP1; (b) the residual probability distribution function of TMP2; (c) the residual probability distribution function of N11; (d) the residual probability distribution function of N12; (e) the residual probability distribution function of N21; (f) the residual probability distribution function of N22; (g) the residual probability distribution function of PRS1; (h) the residual probability distribution function of PRS2.
Aerospace 08 00374 g010
Figure 11. The anomaly detection results of TMP1.
Aerospace 08 00374 g011
Figure 12. The anomaly detection results of TMP2.
Aerospace 08 00374 g012
Figure 13. The anomaly detection results of PRS1.
Aerospace 08 00374 g013
Figure 14. The anomaly detection results of PRS2.
Aerospace 08 00374 g014
Figure 15. The anomaly detection results of N11.
Aerospace 08 00374 g015
Figure 16. The anomaly detection results of N12.
Aerospace 08 00374 g016
Figure 17. The anomaly detection results of N21.
Aerospace 08 00374 g017
Figure 18. The anomaly detection results of N22.
Aerospace 08 00374 g018
Table 1. QAR data of aero-engine gas path.
TimeTMP1TMP2N11N12N21N22ALT_STDPRS1PRS2
(deg C)(deg C)(%)(%)(%)(%)(feet)(psi)(psi)
10:43:511341070000−44837.537.5
10:43:521351070000−44837.537
10:43:531341070000−4483737
10:43:541351060000−44835.536.5
10:43:551351060000−44834.537.5
10:43:561351070000−44835.537.5
10:43:571371060000−4483637.5
Table 2. Experimental Environment Configuration.
ProcessorMemoryGPUOperating SystemTensorflow
Intel Core i7-10875H16 GBGeForce GTX2070Windows 10Tensorflow 2.5.0
Table 3. Parameters of multi-LTSM prediction model.
Model ParameterActual Value
Input layer parameters50 × 8
Hidden layer1
Neuronal number100
Prediction step1
Output layers8
Table 4. Prediction errors of different QAR data.
Monitoring DataRMSE
TMP10.619
TMP20.742
PRS10.581
PRS20.586
N110.078
N120.068
N210.065
N220.070
Table 5. The accuracy of anomaly detection.
Monitoring DataDetection Accuracy (%)
TMP1100
TMP298.79
PRS199.45
PRS2100
N1198.65
N1299.86
N21100
N2298.35
Publisher’s Note: MDPI stays neutral with regard to jurisdictional claims in published maps and institutional affiliations.

