
The Effect of Vortex Generators on Shock-Induced Boundary Layer Separation in a Transonic Convex-Corner Flow


1
Aerospace Science and Technology Research Center, National Cheng Kung University, Tainan City 711, Taiwan
2
Department of Aeronautics and Astronautics, National Cheng Kung University, Tainan City 701, Taiwan
*
Author to whom correspondence should be addressed.
Aerospace 2021, 8(6), 157; https://doi.org/10.3390/aerospace8060157
Submission received: 29 April 2021
/
Revised: 29 May 2021
/
Accepted: 29 May 2021
/
Published: 2 June 2021
Abstract
:Deflected control surfaces can be used as variable camber control in different flight conditions, and a convex corner resembles a simplified configuration for the upper surface. This experimental study determines the presence of passive vortex generators, VGs (counter-rotating vane type), on shock-induced boundary layer separation for transonic convex-corner flow. The mean surface pressure distributions in the presence of VGs for h/δ = 0.2 and 0.5 are similar to those for no flow control. If h/δ = 1.0 and 1.5, there is an increase in the amplitude of the mean surface pressure upstream of the corner’s apex, which corresponds to greater device drag and less downstream expansion. There is a decrease in peak pressure fluctuations as the value of h/δ increases, because there is a decrease in separation length and the frequency of shock oscillation. The effectiveness of VGs also depends on the freestream Mach number. For M = 0.89, there is an extension in the low-pressure region downstream of a convex corner, because there is greater convection and induced streamwise vorticity. VGs with h/δ ≤ 0.5 are preferred if deflected control surfaces are used to produce lift.
1. Introduction
Deflected control surfaces on transport aircraft with a constant angle of attack can be used as a high-lift device. This is known as variable camber control [1]. However, shock-induced boundary layer separation (SIBLS) occurs at the critical Mach number of approximately 1.3 [2]. A convex corner resembles a simplified configuration for the upper surface of a deflected device. A typical flow pattern comprises mild upstream flow expansion, a strong favorable pressure gradient near the corner’s apex, and downstream compression [3,4]. The peak Mach number and the maximum pressure fluctuations correspond to freestream Mach number, M, and convex-corner angle, η. A similarity parameter, β (=), was proposed by Chung [5]. If β > 13, SIBLS occurs and induces low-frequency (several hundred to thousand hertz) shock oscillation [6]. This phenomenon is also observed for supersonic flow [7].
SIBLS results in energy loss and a reduction in aerodynamic efficiency [8,9]. SIBLS is reduced either by altering the inviscid part of the flow (or shock system) or by energizing the boundary layer [10,11,12]. A vortex generator, VG, is a simple technology to manipulate the boundary layer and to add momentum to the near flow. An array of VGs is positioned normal to the surface at an angle of incidence, α, to the local flow [13]. Streamwise vorticity near the wall is produced. This results in an increase in wall shear stress near the surface and in resistance to an adverse pressure gradient.
The effect of VGs on SIBLS depends on their geometrical parameters, particularly type (co-rotating vane, triangle ramp, counter-rotating vane-CRV, etc.), and the ratio h* (=h/δ) of the height to the boundary layer thickness. VGs using a CRV produce the greatest reduction in separation length, L [14,15]. The split pattern for a CRV allows the primary flow to pass and interact with flow that develops from two vanes in pairs. The vortices move closer to the neighboring vortex pair and eventually form a new counter-rotating pair with a common flow [16]. There are stronger three-dimensional vortices and a delay in vortex lift-off from the surface [17]. Bur et al. [18] found a significant modification of the near-wall flow pattern due to the presence of shock waves, and the size of the vortices was increased. A large vortex formed and resulted in a reduction in the separation region.
The wing flaps in the rear part of the airfoil is used to increase lift during take-off and landing. These deflected control surfaces can also provide variable camber control within the operational flight envelopes. However, they may result in SIBLS at high subsonic Mach numbers. VGs as an effective flow control device are widely used in external aerodynamics (flap, winglet, blade, etc.) [19,20,21,22]. A low-profile or sub-δ-scale (h* ≤ 0.5) VG produces less device or parasitic drag [23,24,25]. A study by Mitchell [26] showed that VGs for which h* ≥ 1.2 feature greater control of boundary layer separation, and there is little effect on total pressure recovery, because the momentum added to the near wall region is proportional to h. Similar results were reported by Lee and Loth [27,28].
This study uses VGs positioned upstream of a convex corner (or upper surface of a flap). The mean and fluctuating pressure distributions with and without the presence of CRV VGs are presented at transonic speeds. The effect of the height of VGs (h* = 0.2, 0.5, 1.0 and 1.5) on SIBLS and shock oscillation is determined. Before discussing the results, details of the experiment setup are outlined next.
2. Experimental Setup
2.1. Transonic Wind Tunnel
The experiments are conducted in a blowdown transonic wind tunnel at the Aerospace Science and Technology Research Center of National Cheng Kung University (ASTRC/NCKU). The facility comprises compressors, air dryers (dew point ≈ −40 °C), a cooling water system, storage tanks (180 m3), and a tunnel. There is a 600 × 600 mm2 square test section (1500 mm in length) with solid sidewalls and porous top/bottom walls with holes inclined at 60°. The respective flow angularity and the centerline Mach number uniformity are 0.2° and 0.005. The stagnation pressure, Po, and temperature, To, are set at, respectively, 172 ± 0.5 kPa and room temperature. The freestream Mach number, M, is 0.83 and 0.89 ± 0.01. The corresponding Reynolds number is 2.33 and 2.41 × 10⁷ per meter.
2.2. Test Model
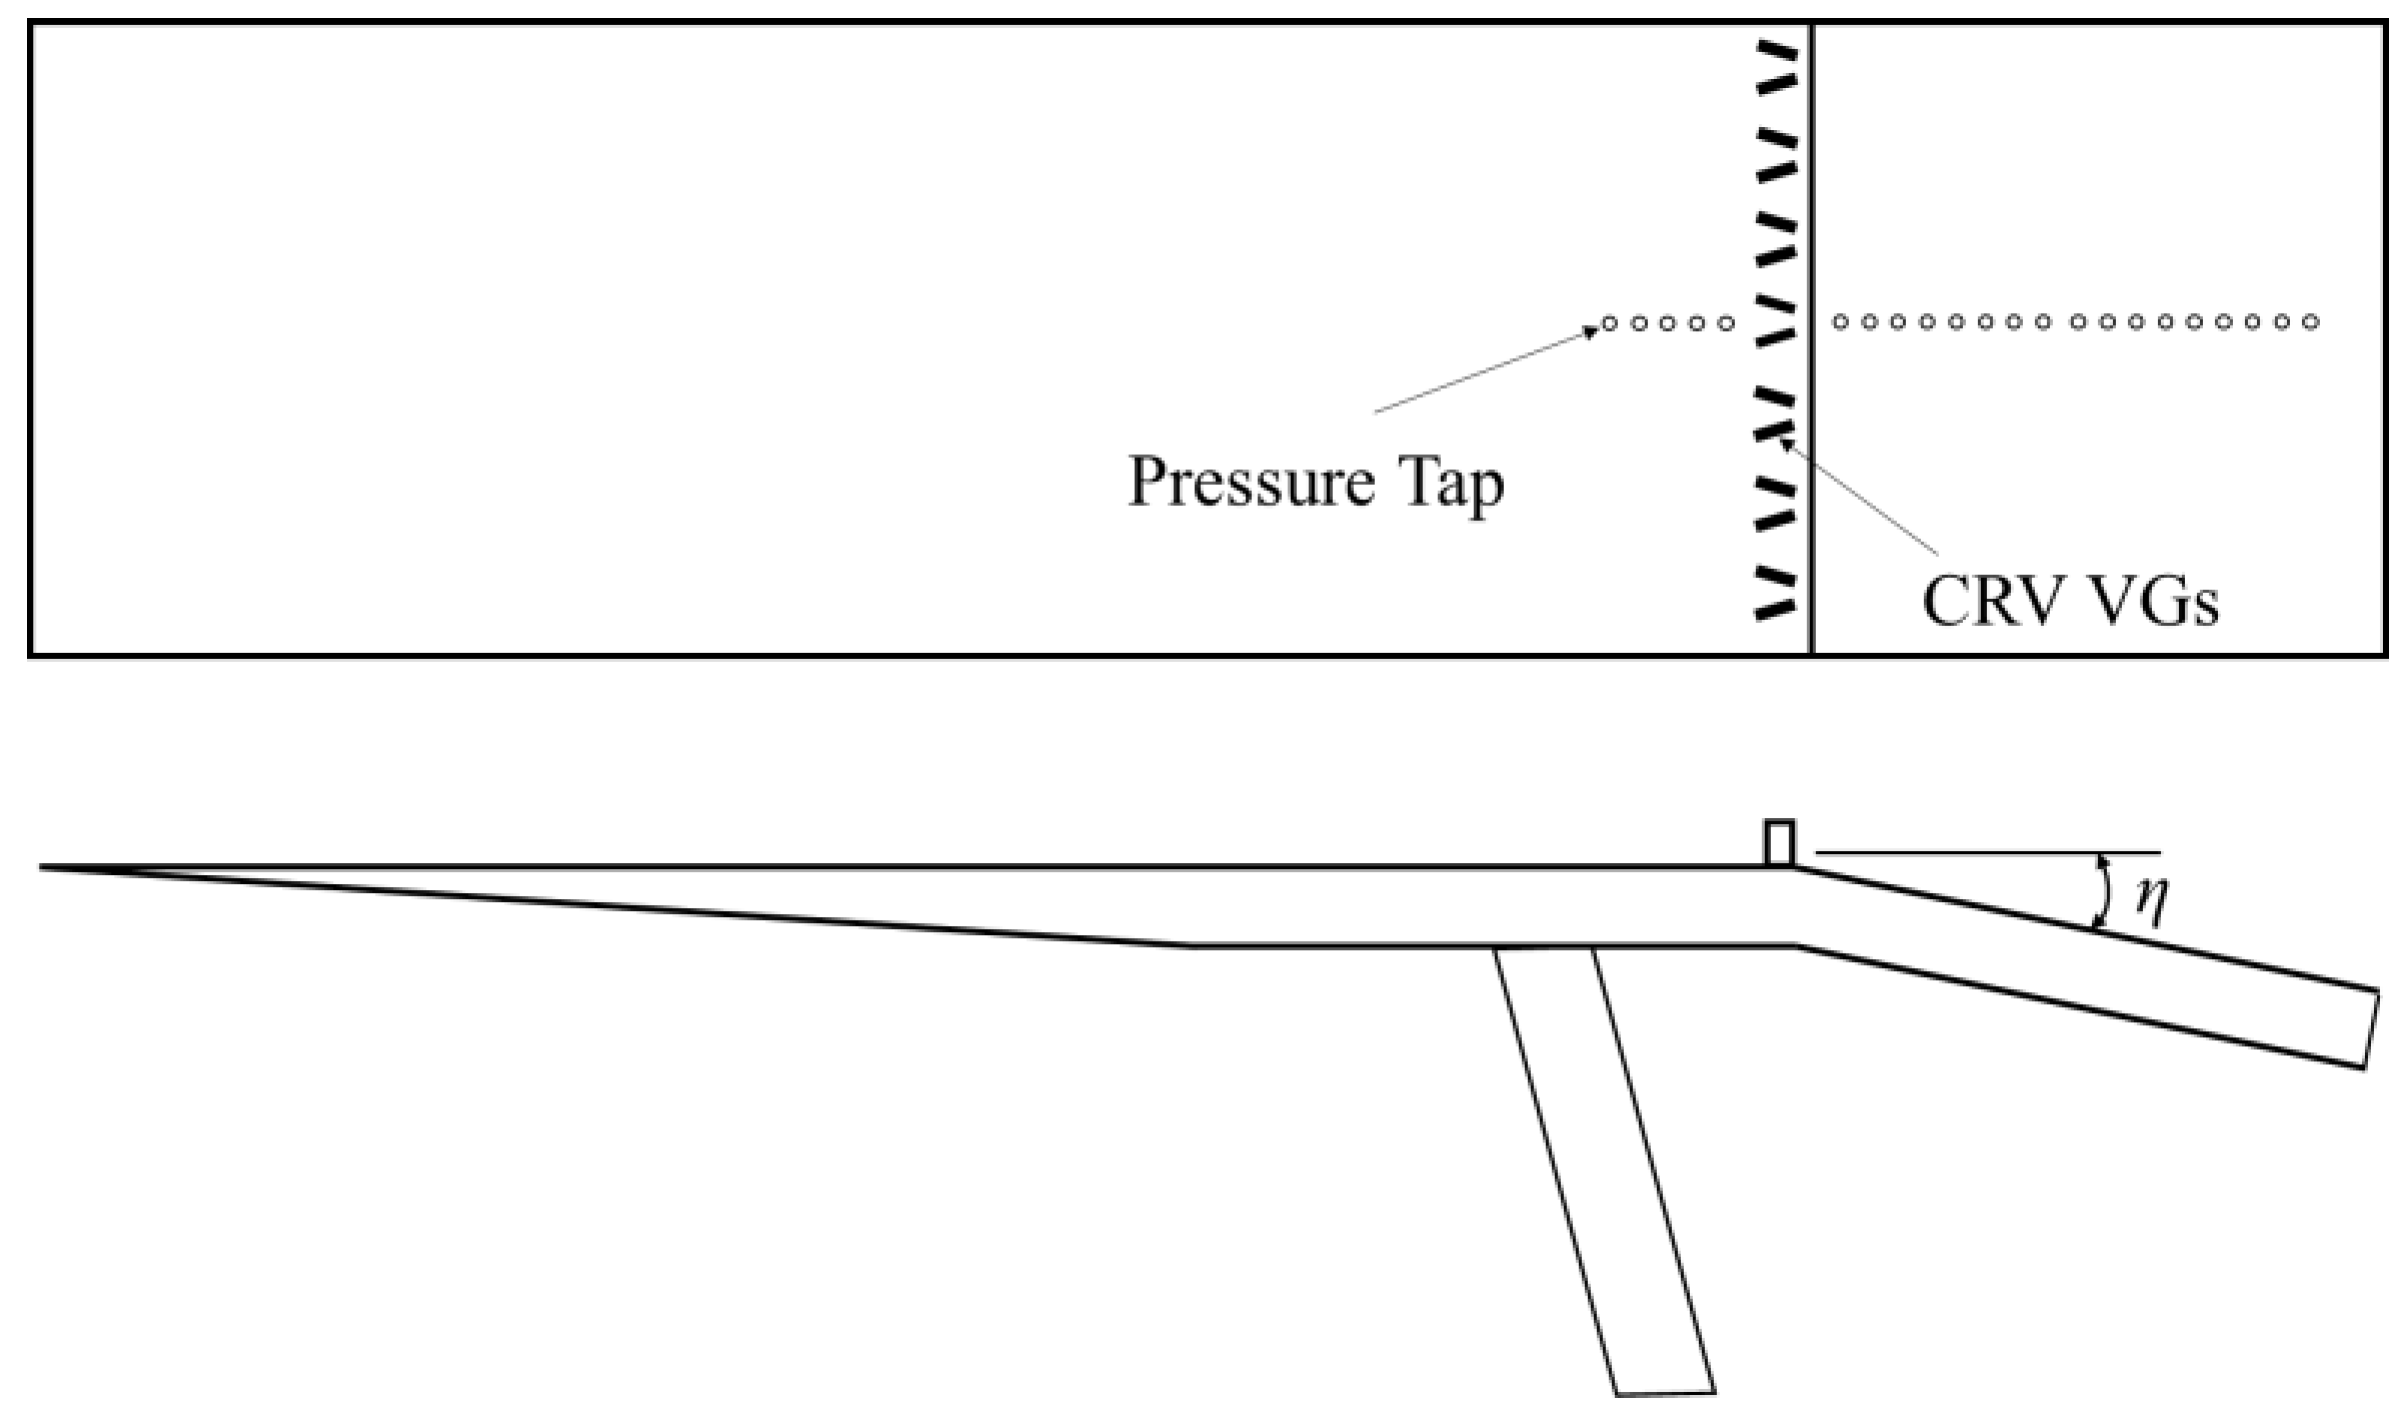
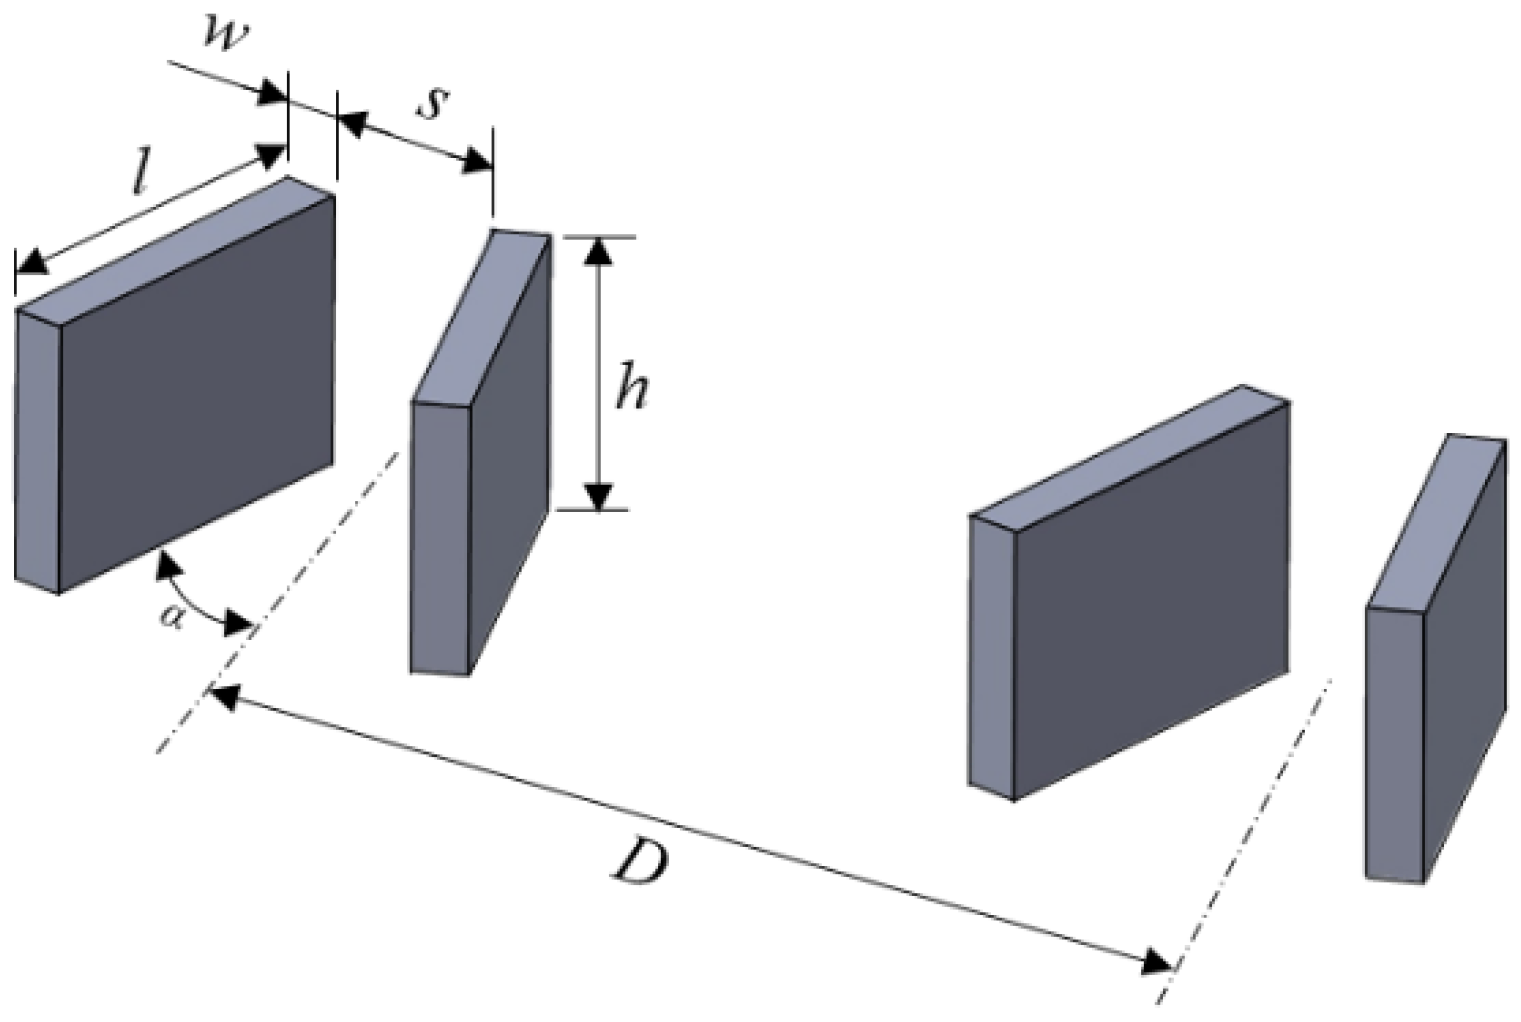
The test model consists of a flat plate and an instrumentation plate with/without VGs, as shown in Figure 1. The flat plate is 450 mm in length and 150 mm in width. The interchangeable instrumentation plates (170 and 150 mm) have a convex corner (η = 13° and 15°; β > 13). SIBLS occurs. The corner’s apex is 500 mm from the leading edge of the flat plate. The test configuration without the presence of VGS is denoted as the baseline case. An array of VGs is positioned upstream of the corner’s apex. The configuration of the VGs is shown in Figure 2, and the scales are listed in Table 1. The length, l, of a CRV is 1.0 δ, and the width, w, is 0.2 δ. The distance between CRVs, D, is 3.0 δ. The value of α is 15°. A boundary layer develops naturally, and the value of δ at 25 mm upstream of the corner’s apex is approximately 7 mm [29]. The value of h* is 0.2, 0.5, 1.0, and 1.5, which is denoted as VG1–VG4. There are 17 pressure taps machined perpendicular to the surface of the test model along the centerline (streamwise direction): 5 pressure taps ahead of the VGs and 12 pressure taps downstream of the corner. The spacing between the pressure taps is 6 mm.
2.3. Instrumentation and Data Acquisition System
The mean, Pw, and fluctuating, σw, surface pressures are measured using flush-mounted Kulite pressure transducers (Model XCS-093-25A, B screen; Leonia, NJ, USA) with a natural frequency of 200 kHz. The nominal outer diameter is 2.36 mm, and the pressure sensitive element is 0.97 mm. External amplifiers (Ectron Model E713; San Diego, CA, USA) with a roll-off frequency of 140 kHz (or low-pass frequency) are used to increase the signal-to-noise ratio. All input channels are triggered simultaneously using a National Instruments (CI SCXI; Austin, TX, USA) device, and the sample size for each channel is 131,072 with a sampling rate of 5 μs (or 200 kHz). The data are divided into 32 blocks. The mean value of each block (4096 data points) is calculated so that the ensample average is determined. The experimental uncertainty is the standard deviation for the flat plate case using ten Kulite sensors. The value is 1.24% for the mean surface pressure coefficient, Pw/Po, and 0.97% for the fluctuating pressure coefficient, σp/Pw.
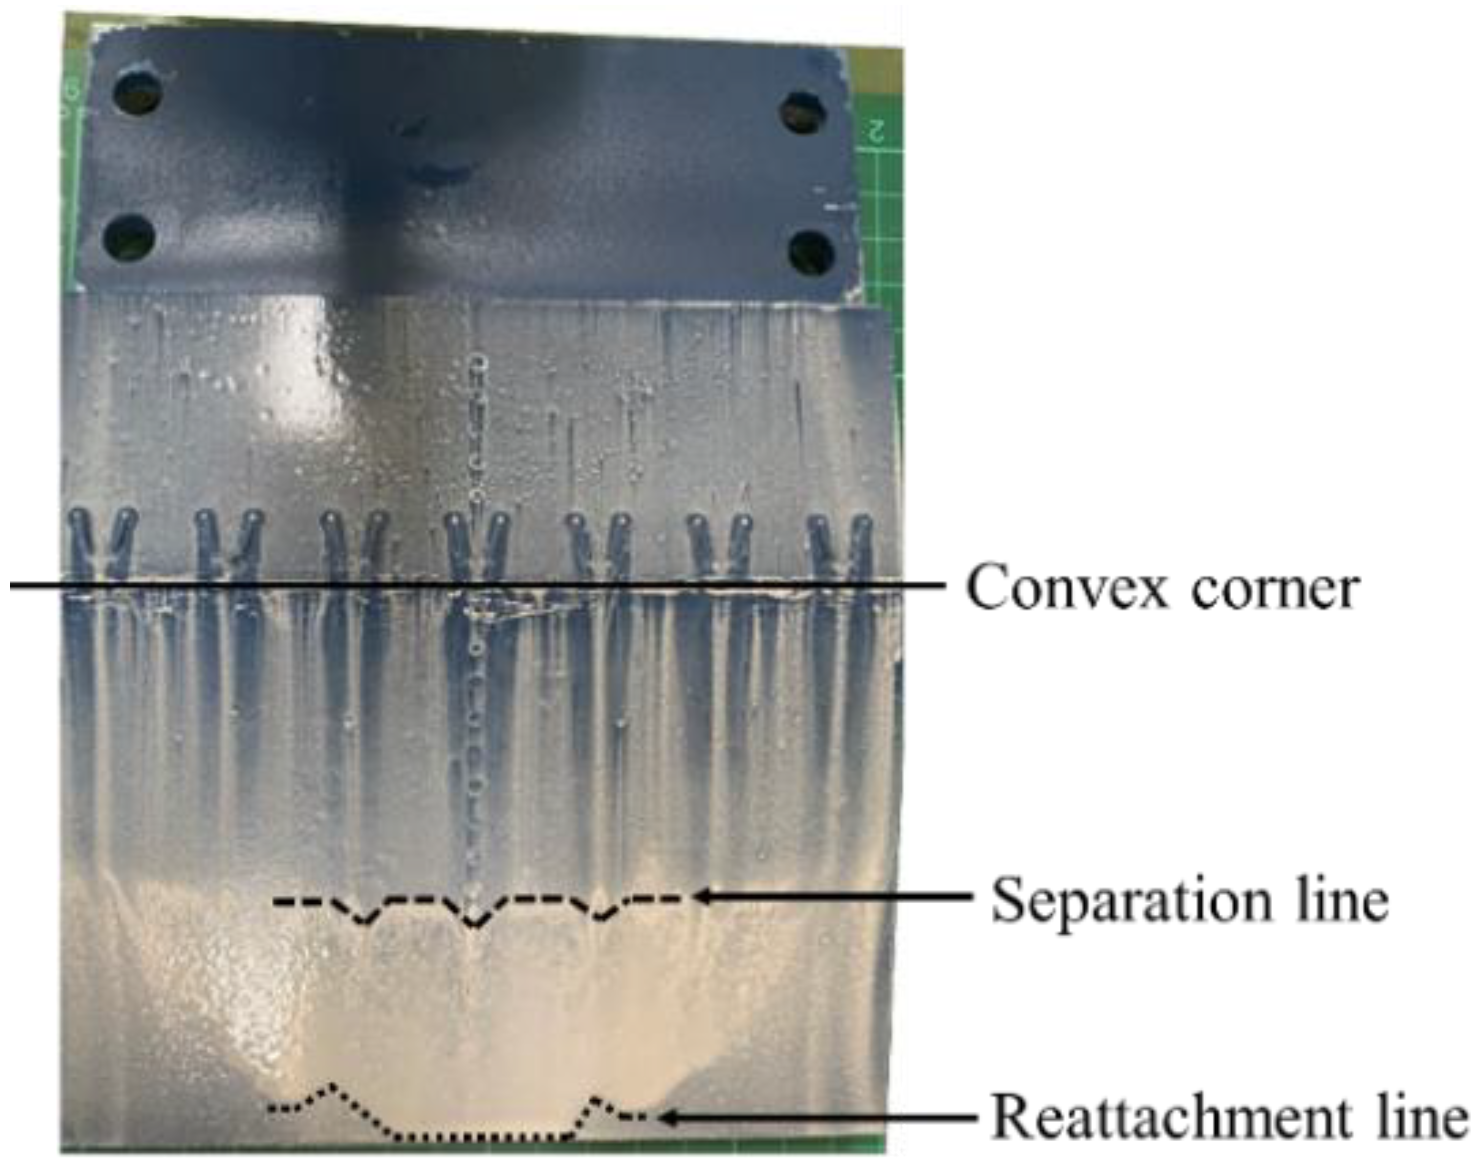
The separation length, L, is determined using an oil-flow visualization technique. The mixture comprised titanium dioxide, oil, oleic acid, and kerosene. This is applied on the surface of an instrumentation plate. An example of a surface oil-flow pattern is shown in Figure 3, which shows a corrugated pattern [14]. The separation location is identified when there is an accumulation of titanium dioxide, and the end of the deflected streamlines is denoted as the reattachment location. The value of L is determined based on the mean separation and reattachment locations, and its uncertainty is approximately ±1 mm.
3. Results and Discussion
3.1. Mean Surface Pressure Distribution
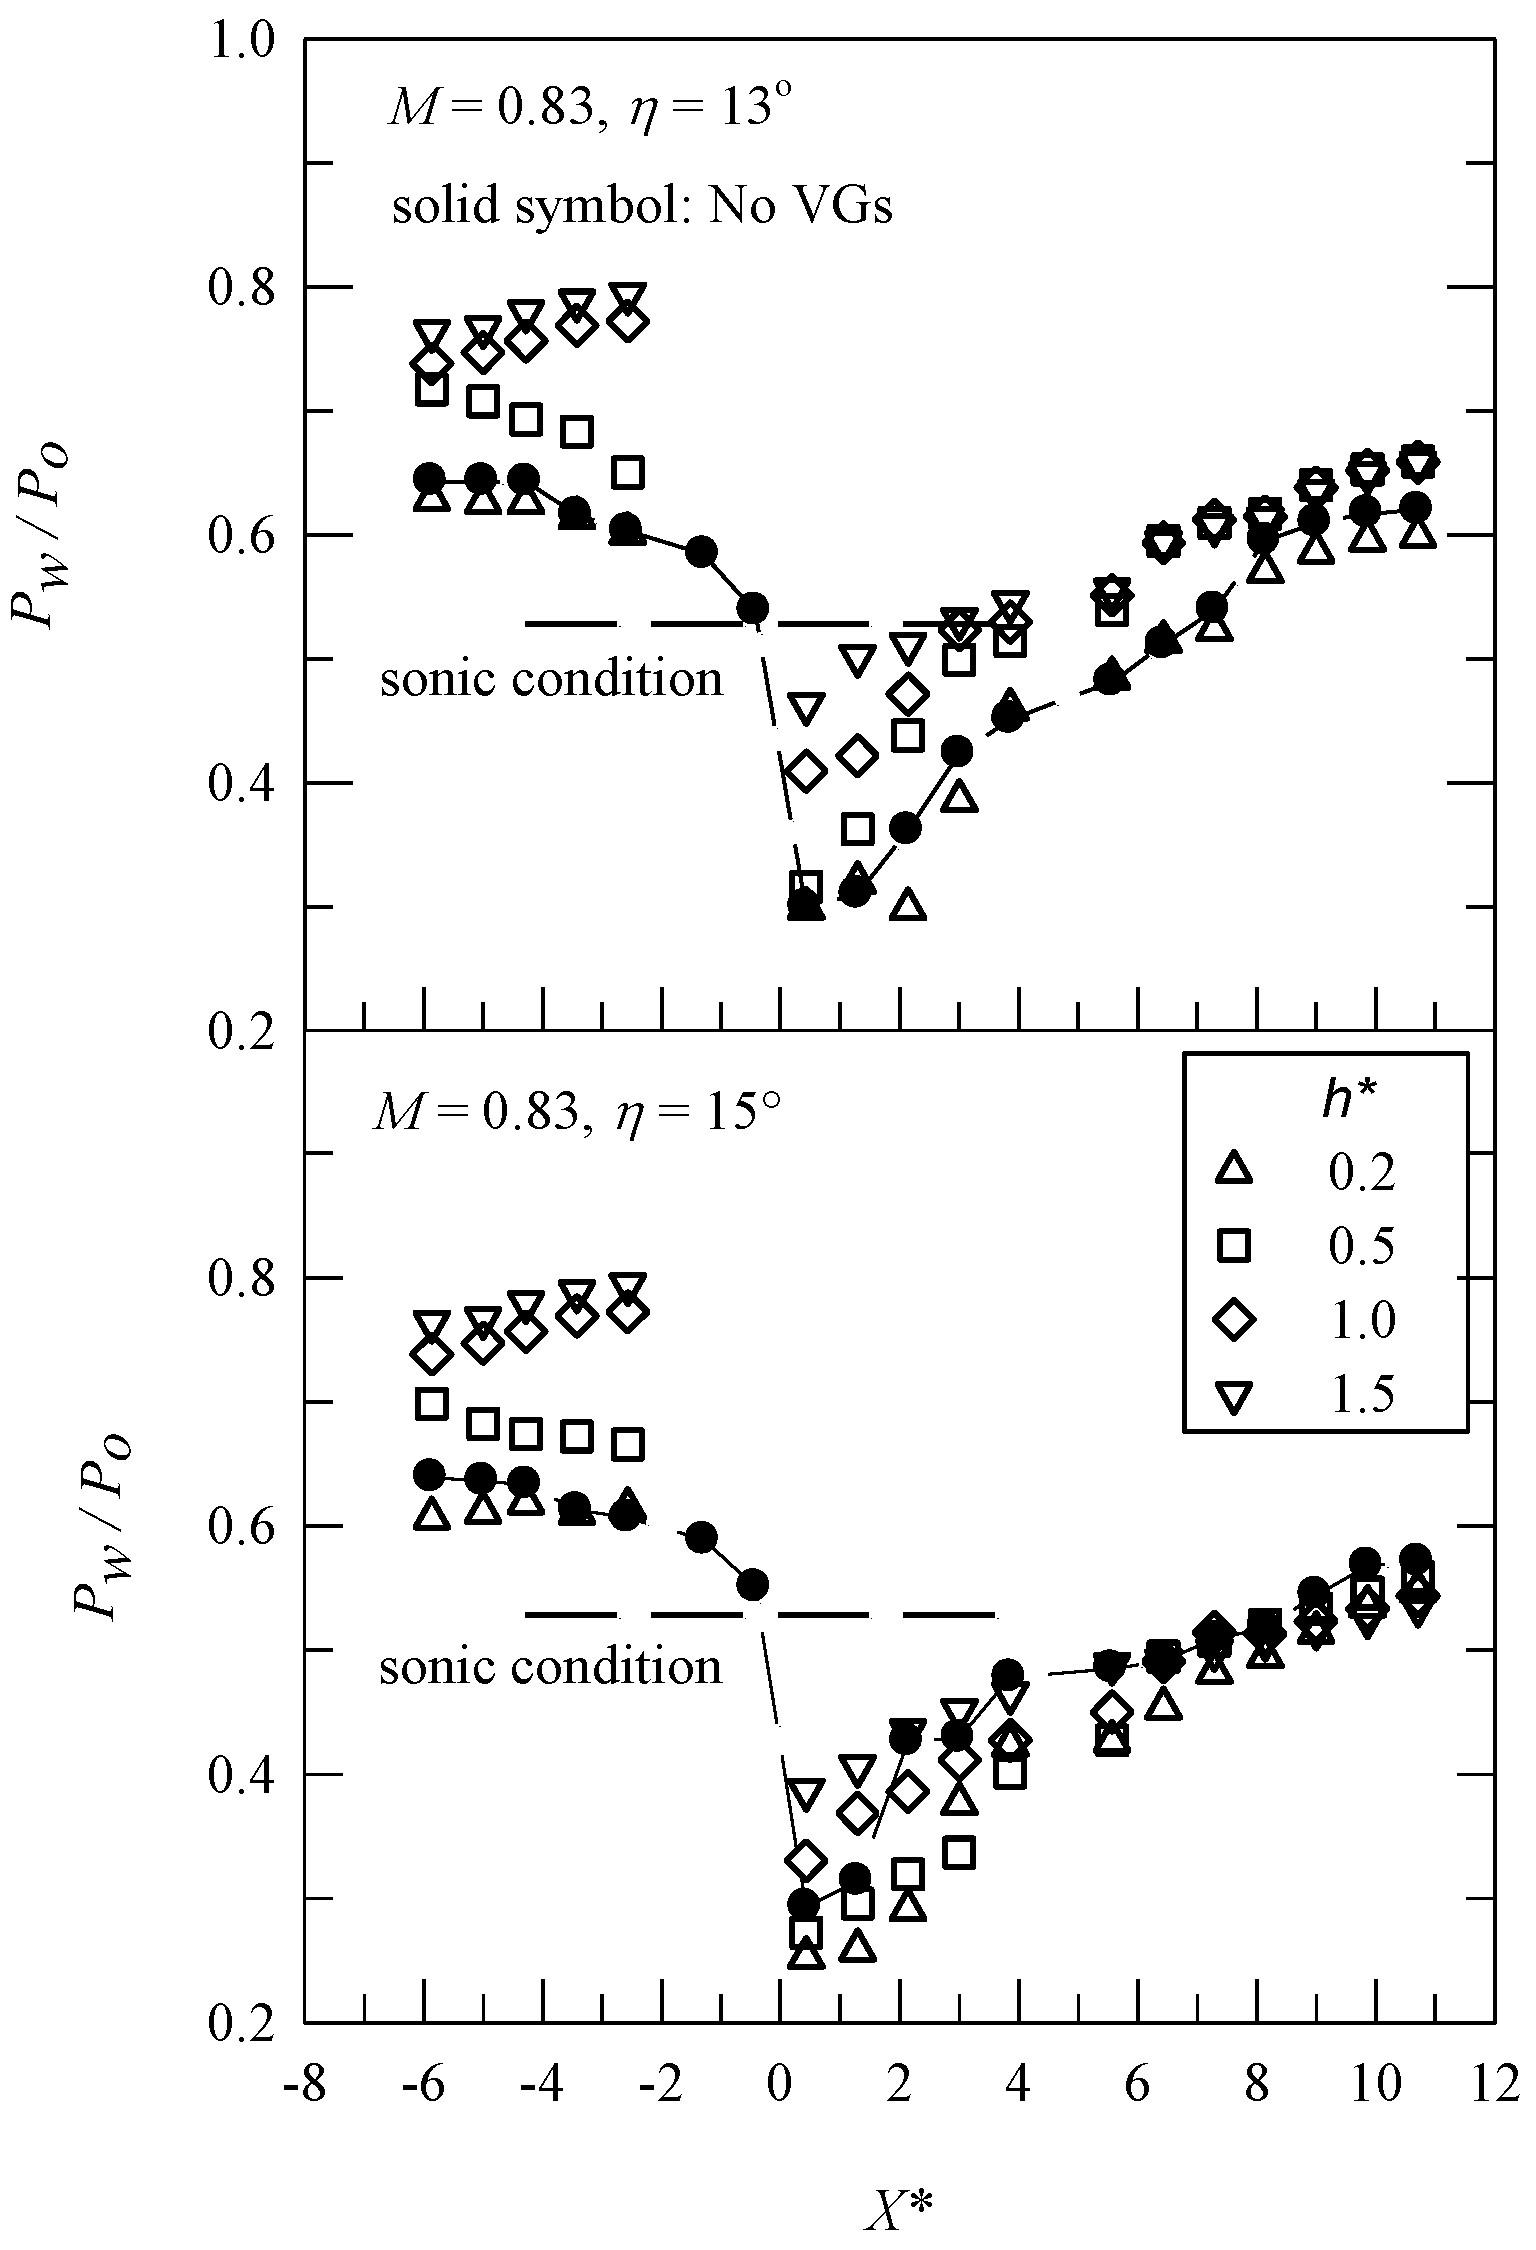
The Pw/Po distributions for M = 0.83 at η = 13° and 15° are shown in Figure 4. The horizontal axis shows the normalized streamwise location, X* (=X/δ), and the origin of horizontal axis is the corner’s apex. There are no data between X* = −2 and 0 because of the presence of VGs. The sonic condition (Pw/Po = 0.5283) is shown for reference. For a convex-corner flow, there is mild upstream expansion, a strong favorable pressure gradient near the corner’s apex, and downstream compression. The presence of VG1 (h* = 0.2) has a limited effect on the Pw/Po distribution for η = 13°. The minimum value for Pw/Po, (Pw/Po)min, occurs further downstream than for the baseline case because of the trailing-edge expansion that is induced by a VG1 [30]. The Pw/Po distribution for VG2–VG4 shows a similar surface pressure pattern. An increase in the value of h* results in an increase in the amplitude of Pw/Po upstream of the corner. This shows greater parasitic drag, particularly for VG3 and VG4 (h* = 1.0 and 1.5). There is an increase in the amplitude of (Pw/Po)min (or a lower peak Mach number, Mpeak). It means the presence of larger scale VGs on a deflected surface reduces the lift force. For η = 15°, the effect of VGs on the surface pressure distributions is similar to that for η = 13°. A distinctive kink is observed at X* ≈ 2 for the baseline case. This represents SIBLS [29]. The pressure plateau moves downstream if VGs are installed.
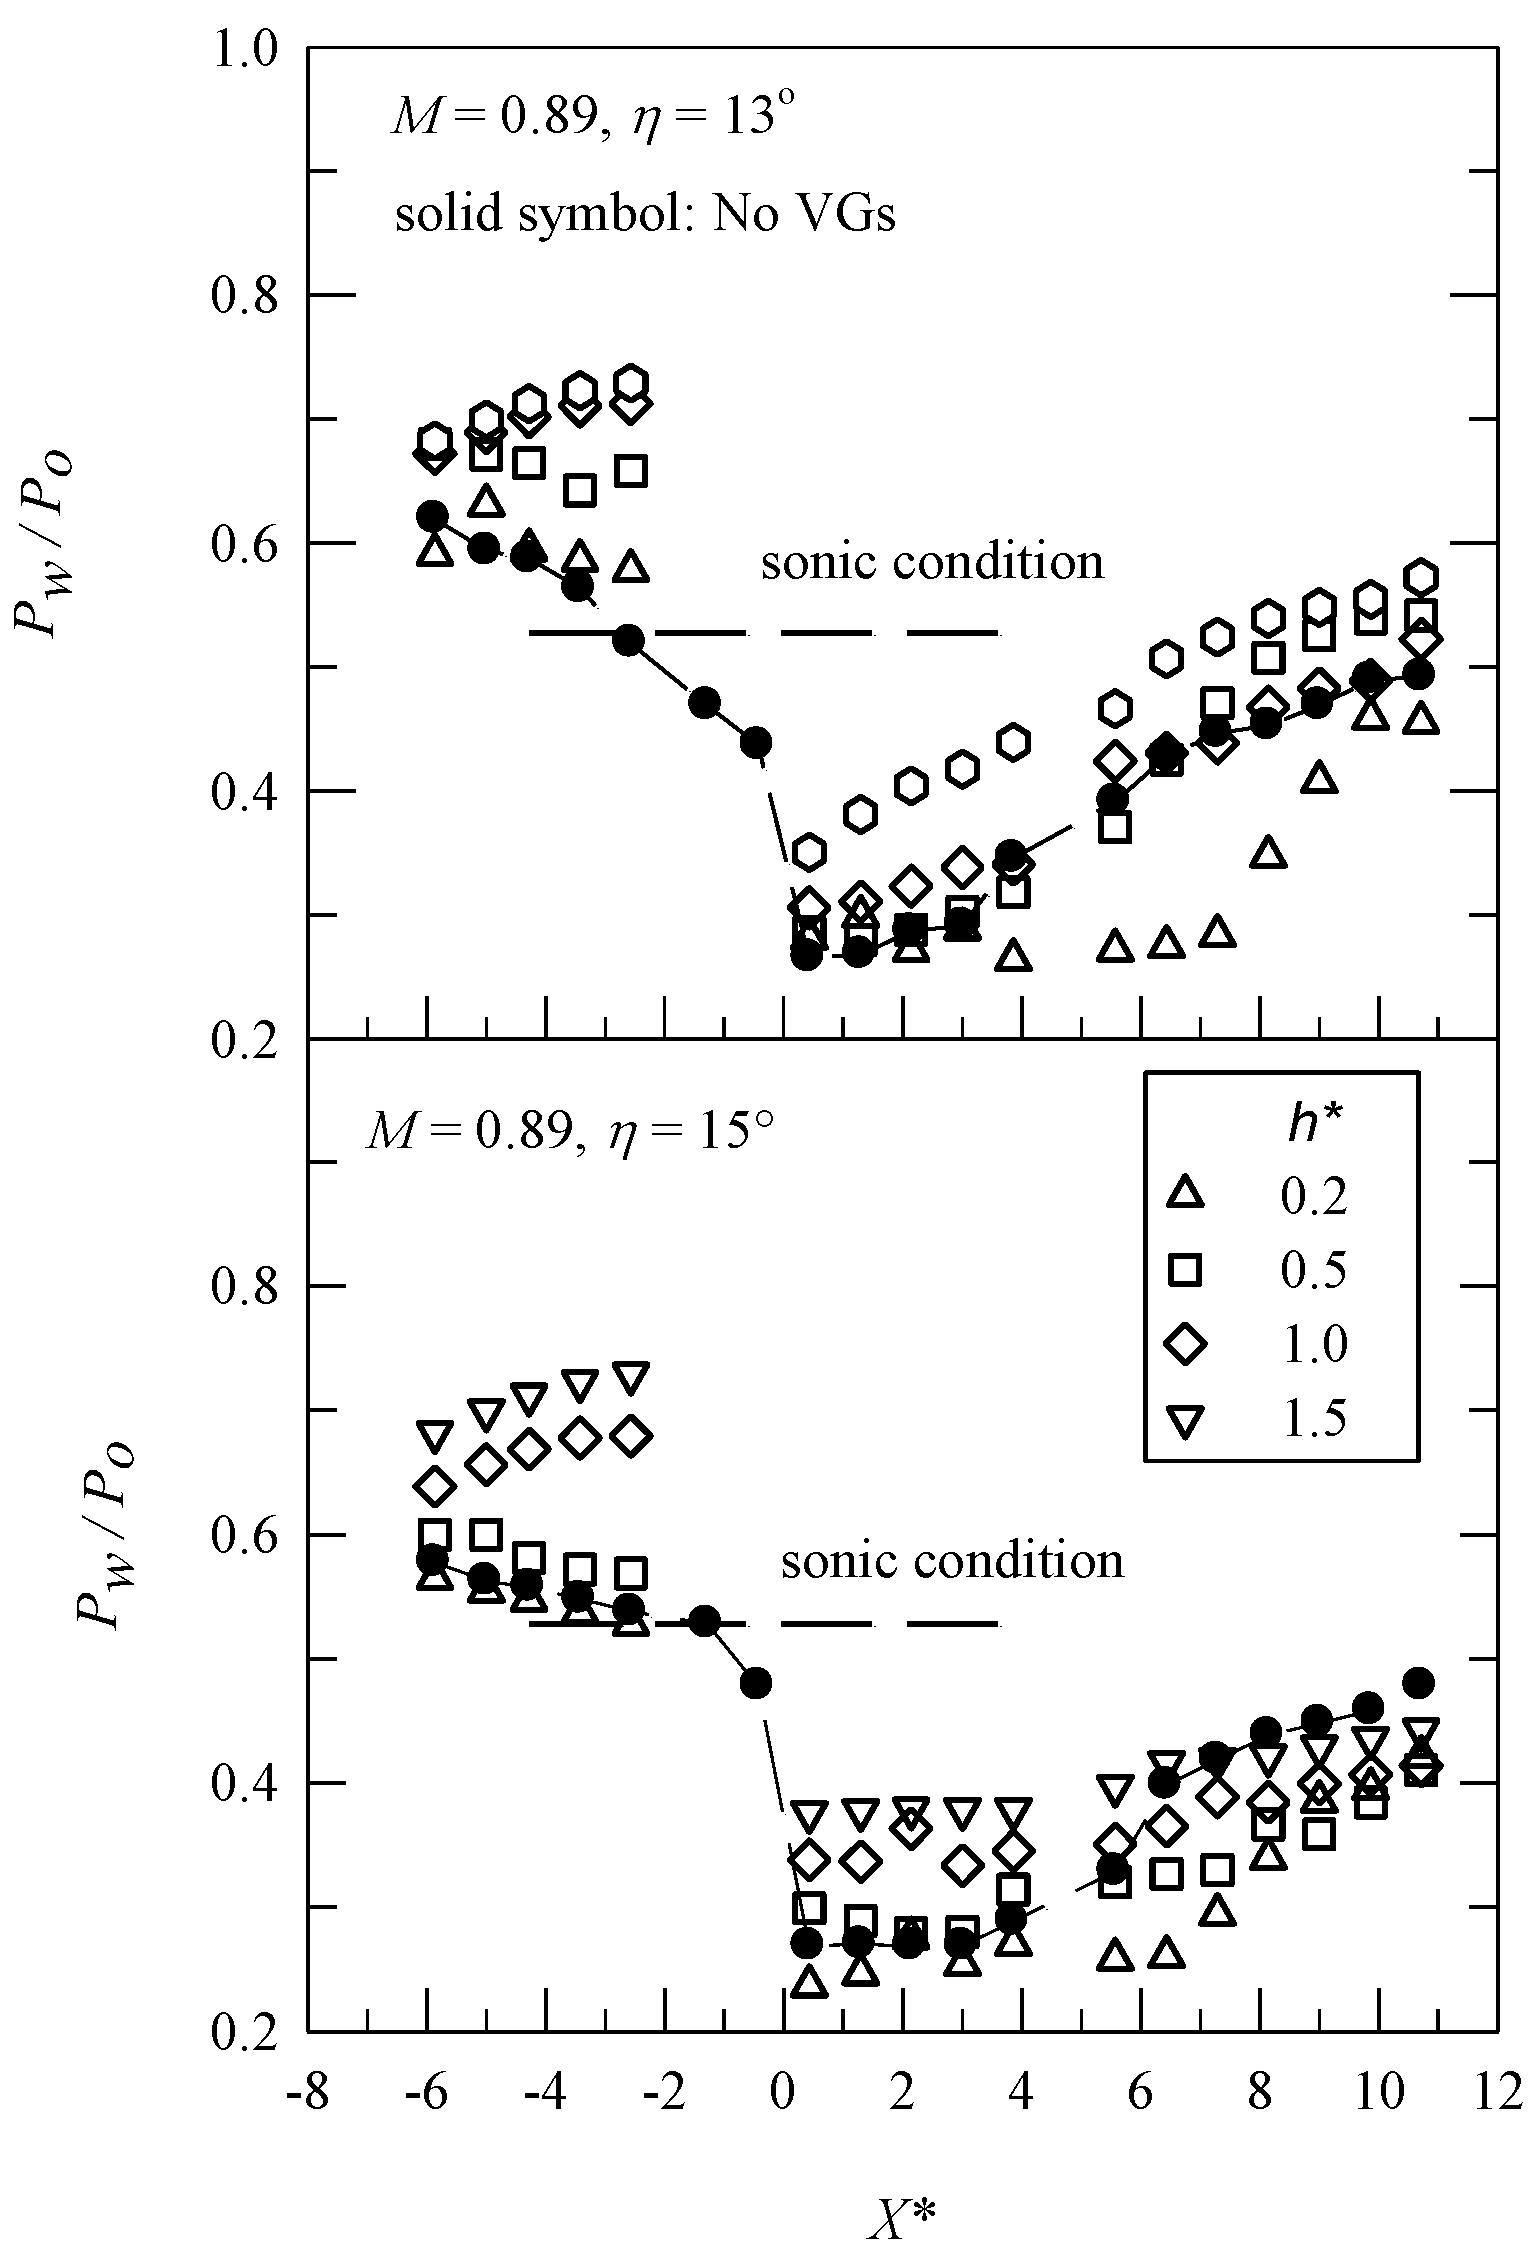
Figure 5 shows the Pw/Po distributions for M = 0.89. There is also an increase in the amplitude of Pw/Po upstream of the corner as h* increases. For the baseline case, downstream compression occurs farther downstream than for M = 0.83. This result is in good agreement with that for the study by Bouhadji and Braza for an aerofoil at transonic speeds [31], because there is greater convection at M ≈ 0.9. A sweep for perturbation action propagates farther downstream because of the hyperbolic character of the flow. The presence of a VG1 for η = 13° and 15° results in an extension of the low-pressure region to X* of 6.4. This indicates greater convection effect. As the value of (Pw/Po)min increases (or Mpeak decreases), the presence of VGs for h* ≥ 0.5 (VG2–VG4) has a minor effect on the extension of the low-pressure region for η = 15° compared to the baseline case. For η = 13°, an increase in h* results in smaller low-pressure region, particularly for VG4, for which there is flow compression immediately downstream of the corner.
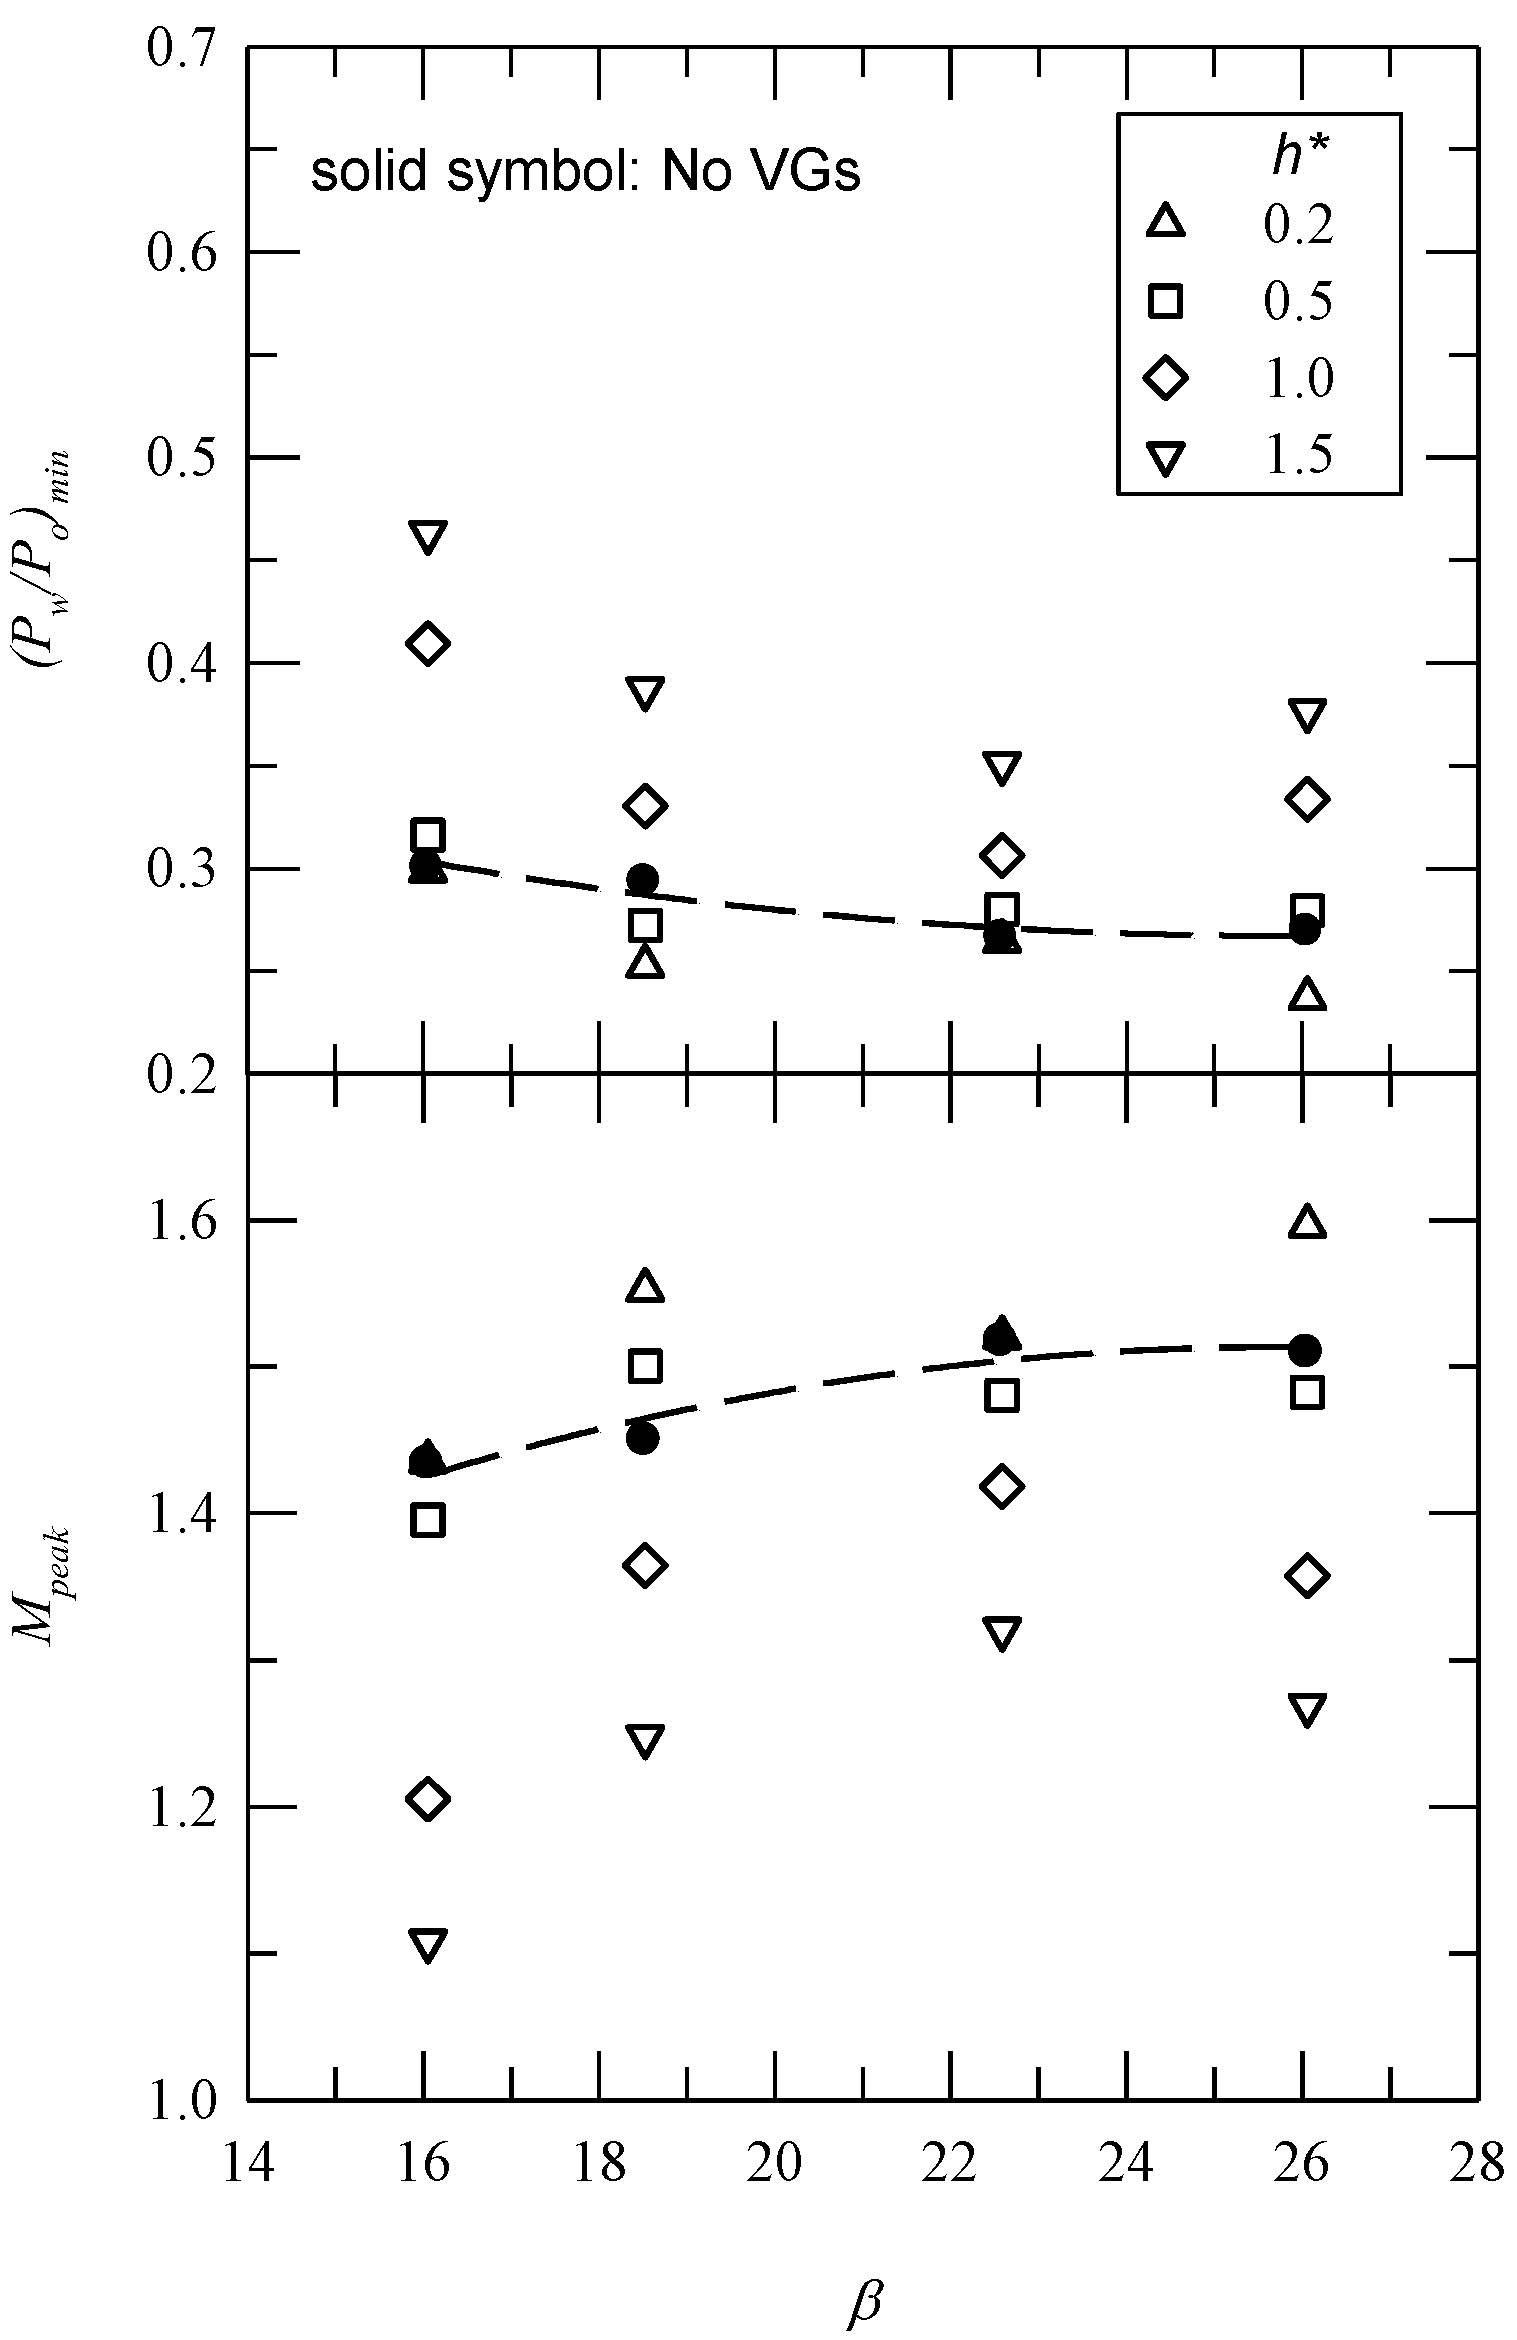
The variation in (Pw/Po)min and Mpeak with β is shown in Figure 6. For the baseline case, which is shown as solid symbol, there is an increase in the value of Mpeak or a decrease in (Pw/Po)min as β increases. This depends on M if VG1 (h* = 0.2) is installed. For M = 0.83 (β = 16.1 and 22.6), the values of (Pw/Po)min and Mpeak are approximately the same as those for the baseline case. This is not true for M = 0.89 (β = 18.5 and 26.1), for which there is a decrease in (Pw/Po)min and an increase in Mpeak. As mentioned previously, this is due to stronger convection. For h* = 0.5, the presence of VG2 has a minor effect on flow expansion near the corner’s apex. As h* (=1.0 and 1.5) increases, there is less expansion, so there is a reduction in the lift force for a deflected control surface.
3.2. Surface Pressure Fluctuations
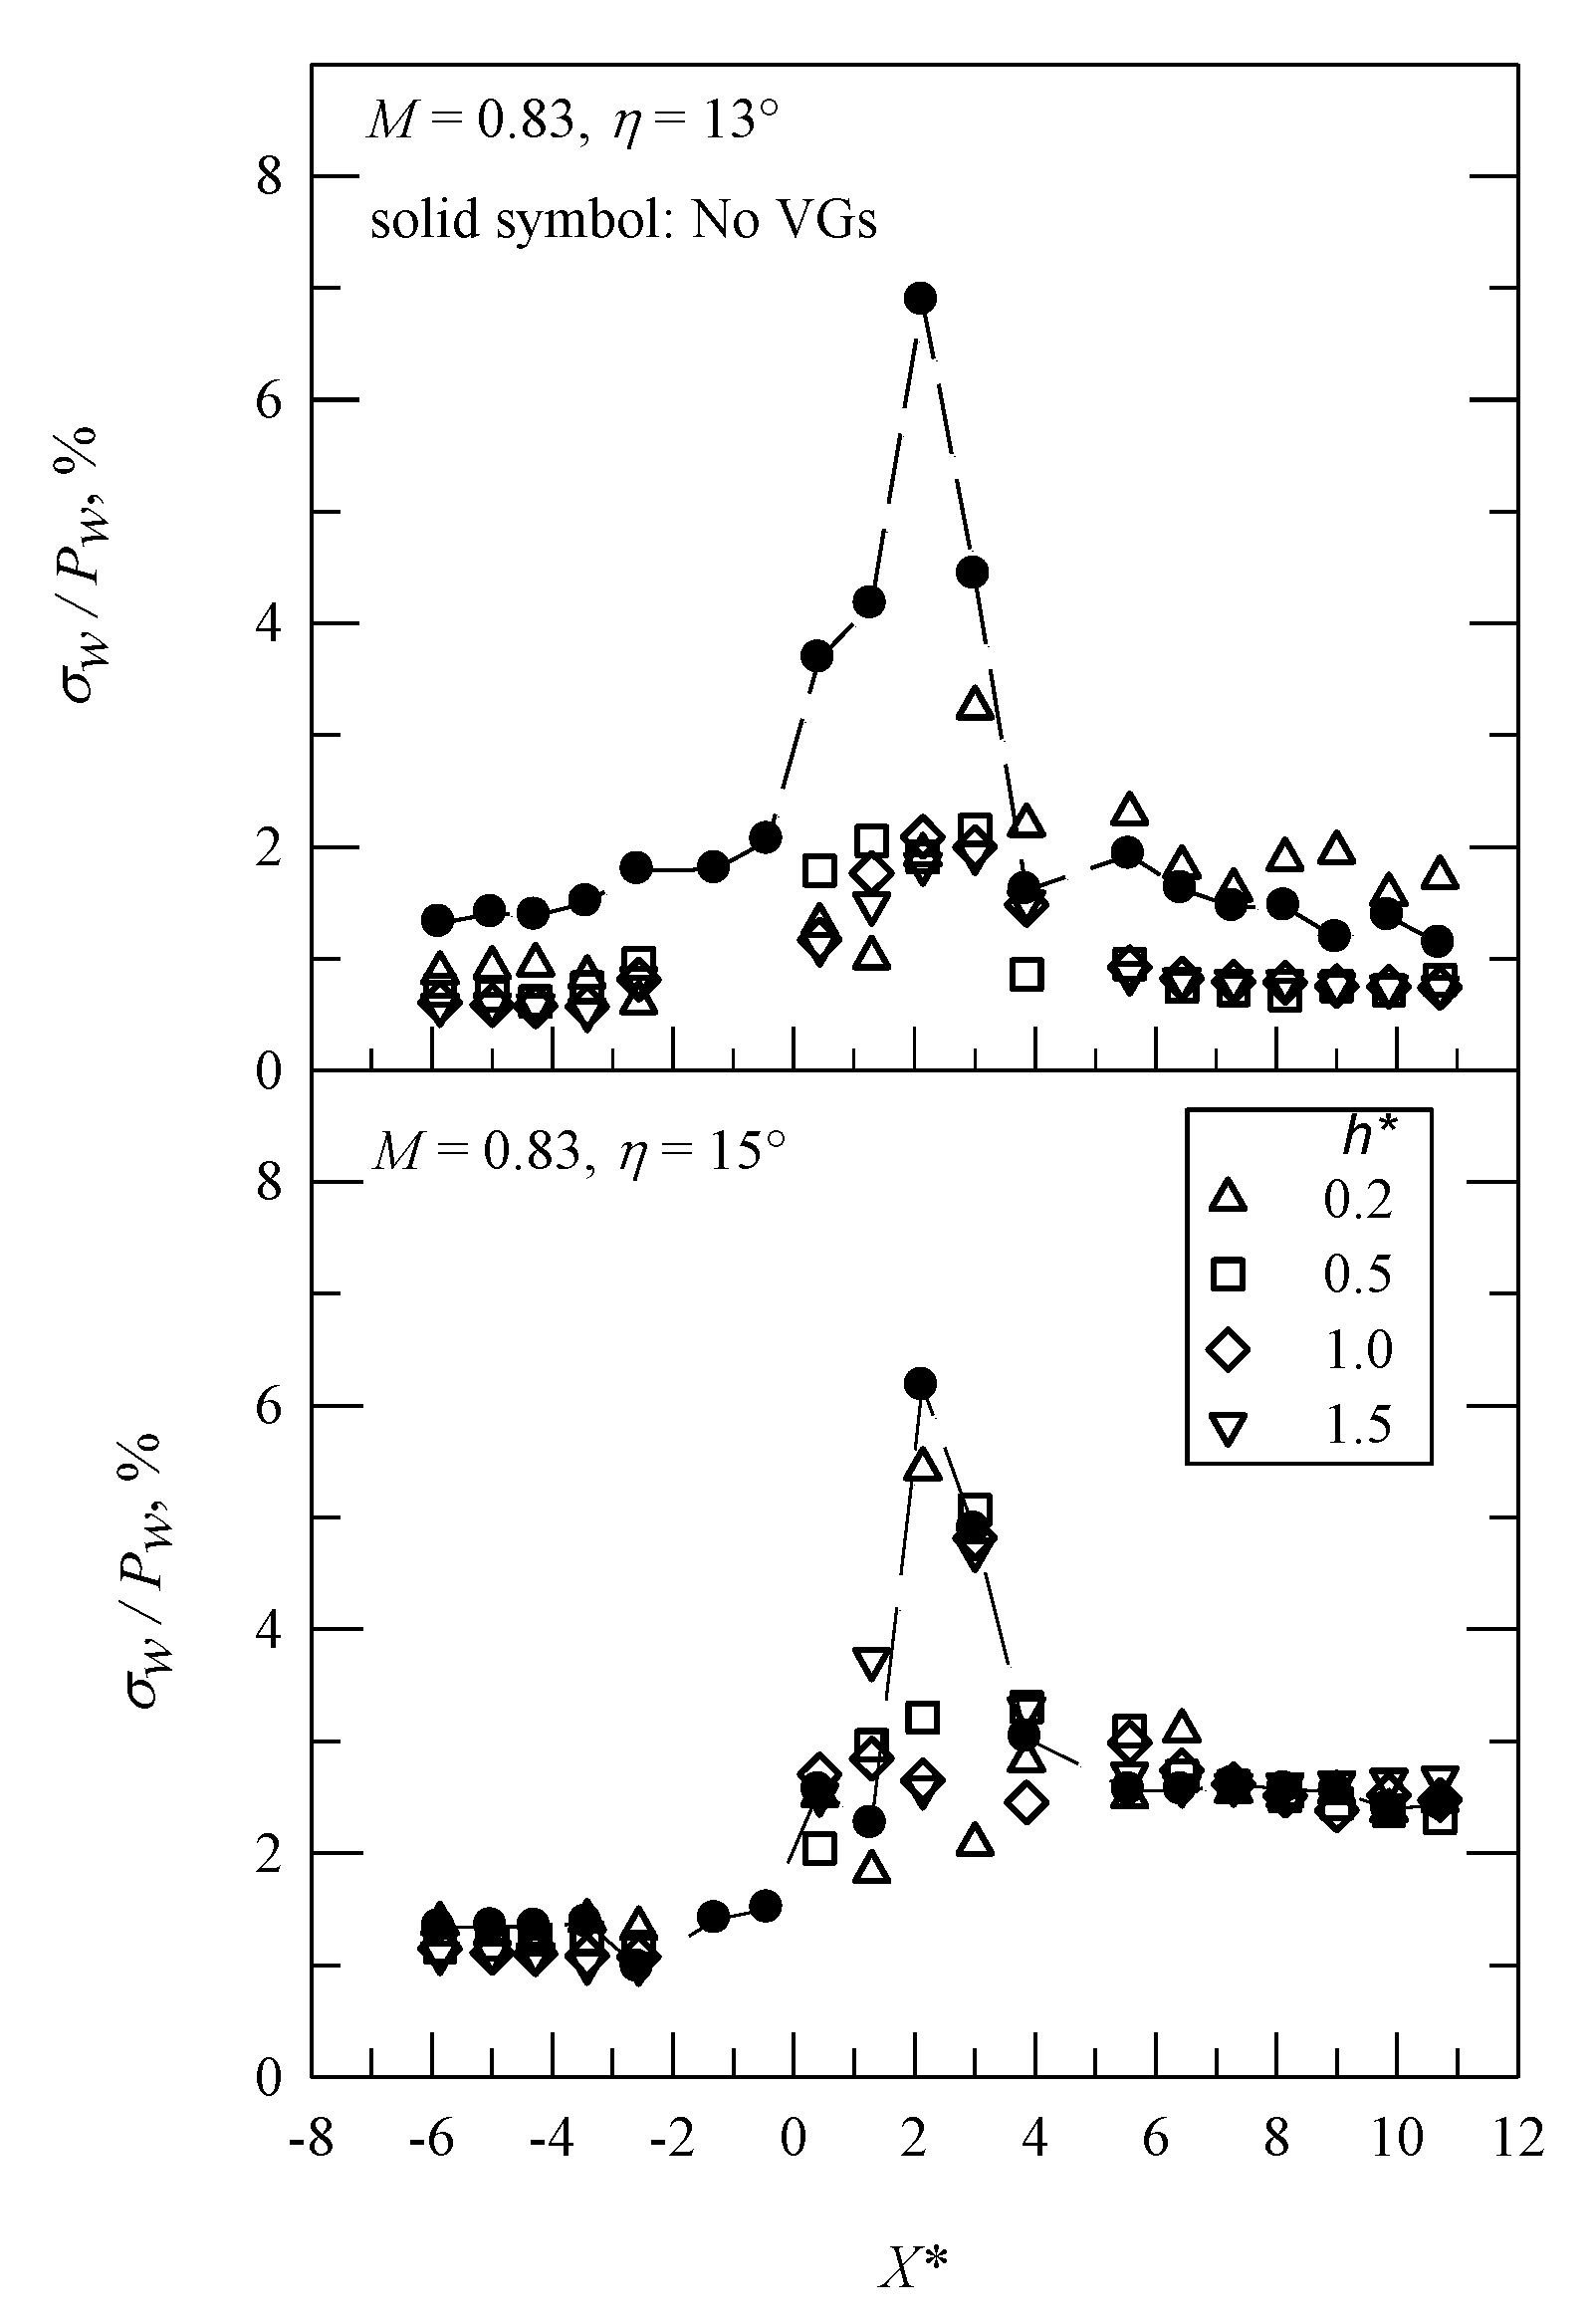
SIBLS induces intense pressure fluctuations and flow unsteadiness. Shock excursion is associated with contraction and expansion for a separation bubble. Figure 7 shows the distribution of σp/Pw along the centerline for M = 0.83. For the baseline case, there is a peak value for σp/Pw, (σp/Pw)max (=6.9% and 6.2% for η = 13° and 15°, respectively), at X* = 2.14. The presence of VGs for η = 13° results in a decrease in (σp/Pw)max (=3.2–1.9% at X* = 3.0). This is also true as h* increases. There is a lower value for σp/Pw farther downstream, because the local Mach number increases [32], as shown in Figure 4. For η = 15°, the presence of VGs has less effect on the σp/Pw distribution. The value for (σp/Pw)max ranges from 4.7% to 5.4%.
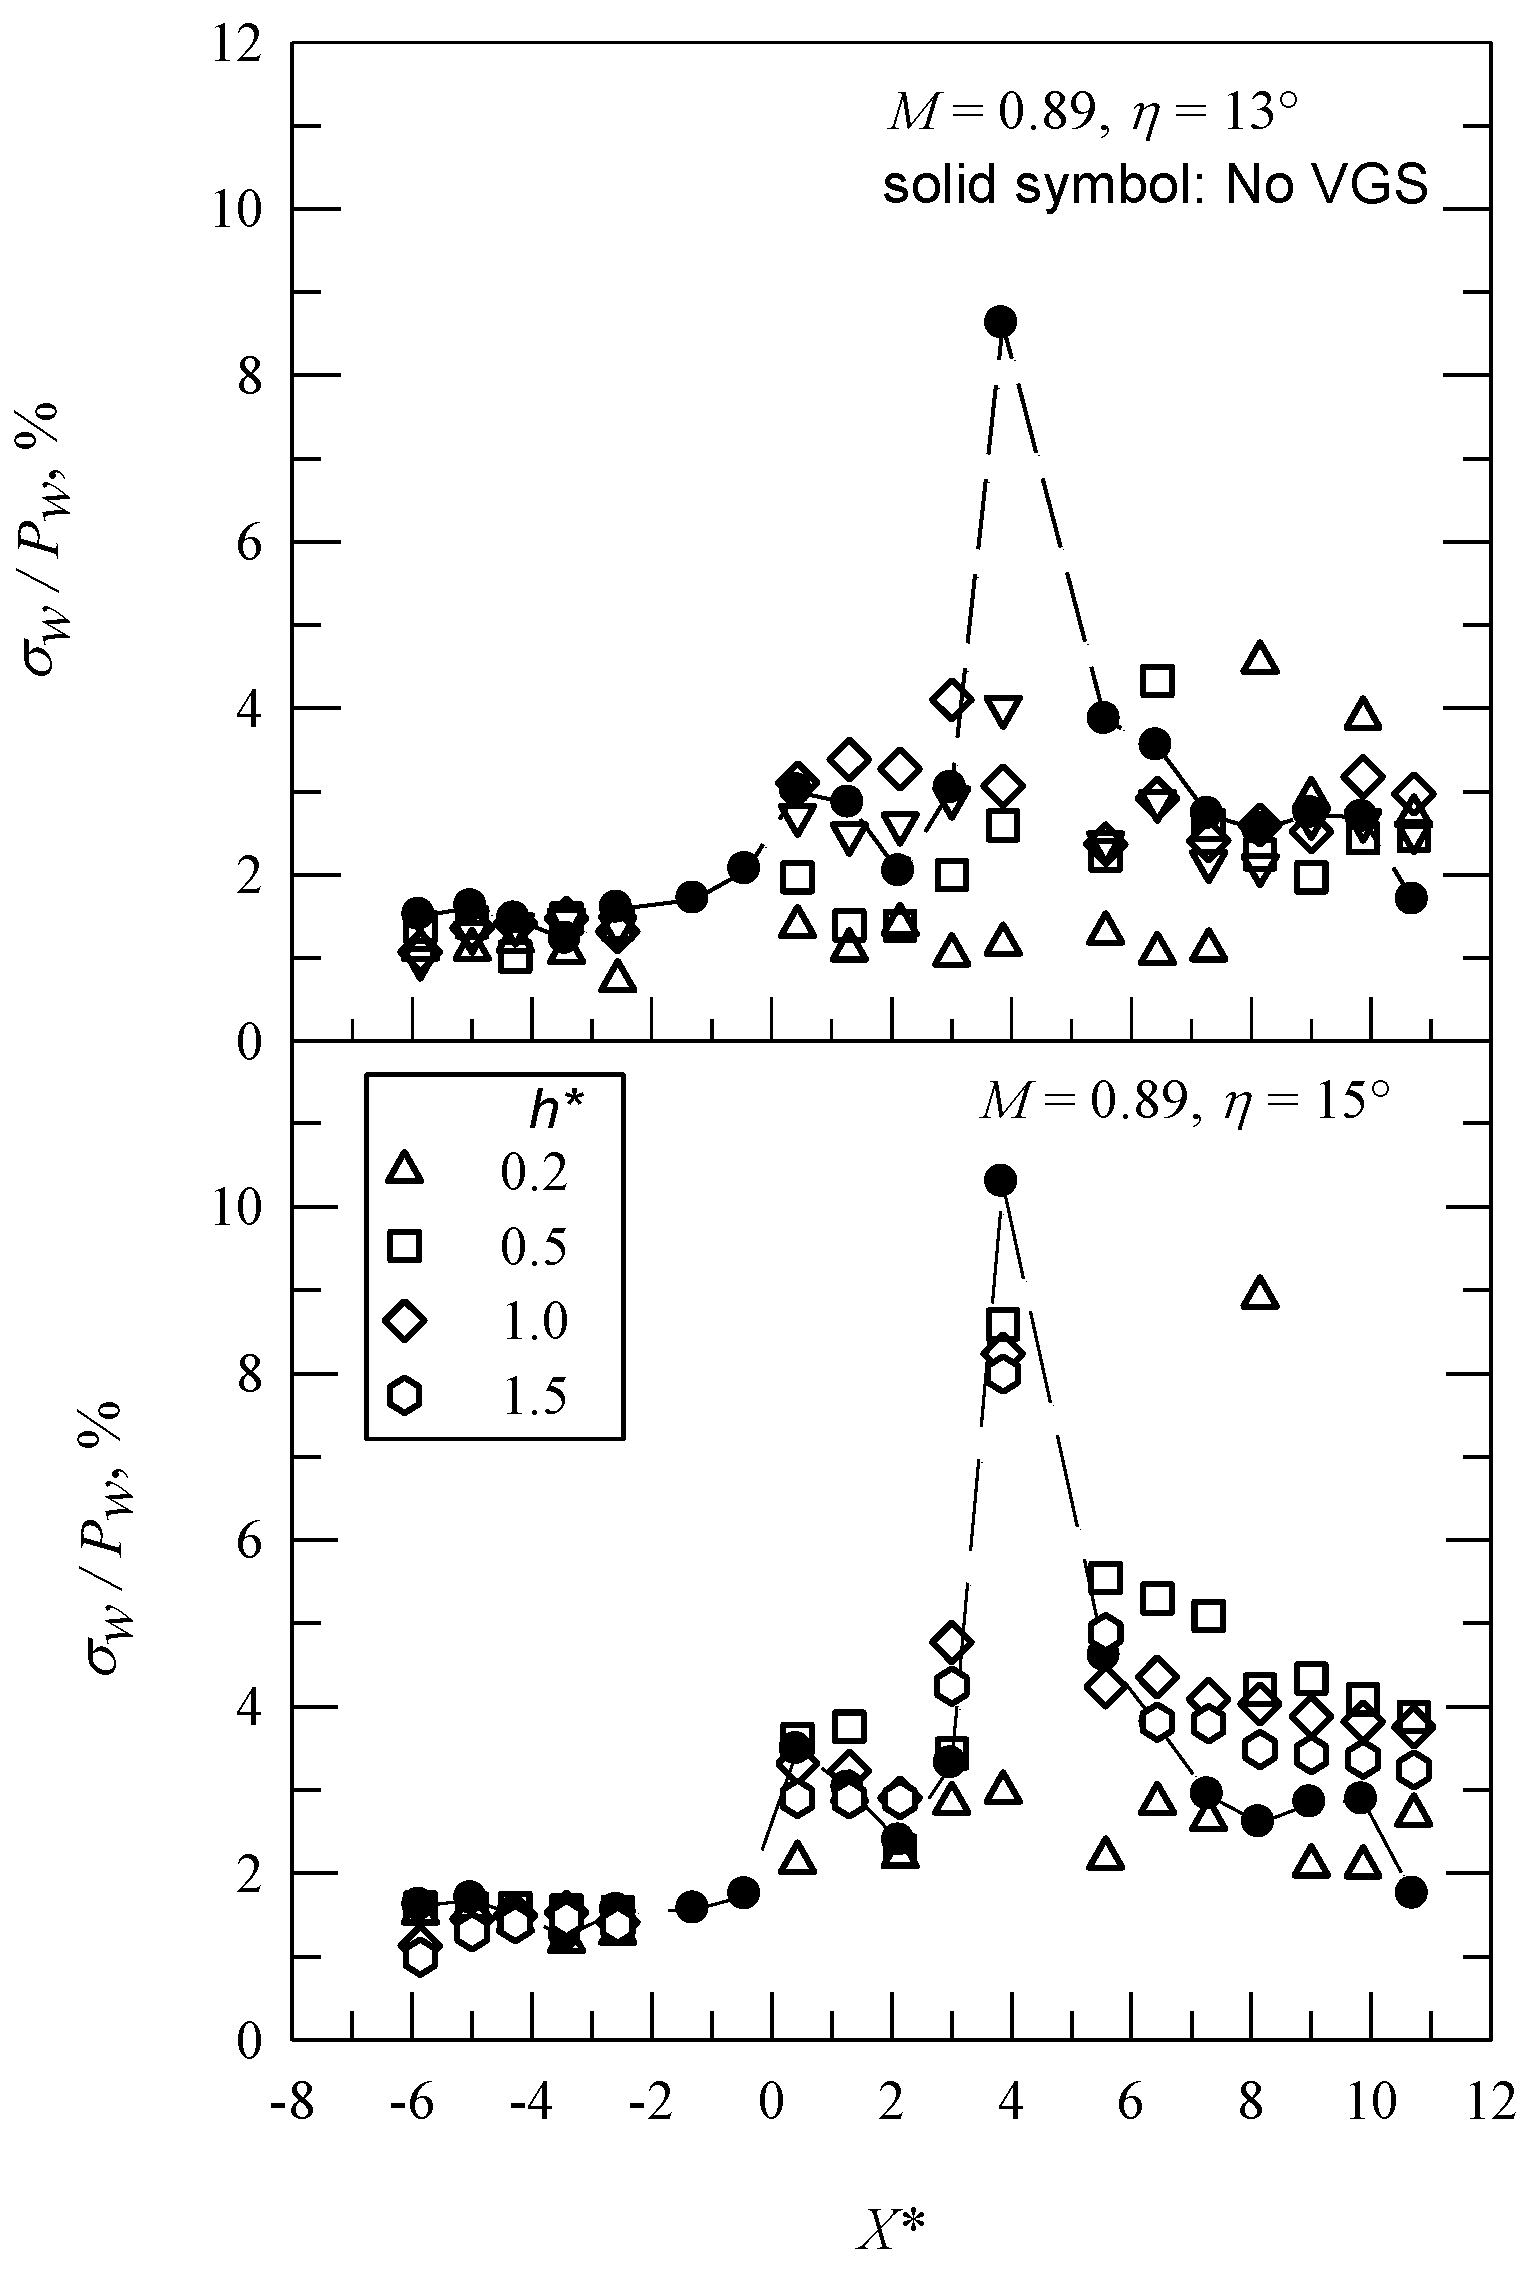
For M = 0.89, the σp/Pw distributions are shown in Figure 8. For the baseline case, (σp/Pw)max has a greater amplitude at X* = 3.86 than for M = 0.83, which is 8.6% for η = 13° and 10.32% for 15°. For h* = 0.2, an extension in low-pressure region (or late compression) induces downstream movement for (σp/Pw)max at X* = 8.14. There is also a decrease in the amplitude of (σp/Pw)max for η = 13° and 15°. Babinsky and Ogawa [33] showed that the optimal location for VGs is near the onset of flow separation. There is an extension of the low-pressure region for η = 15°, as shown in Figure 5, so VGs have less effect on the amplitude of (σp/Pw)max.
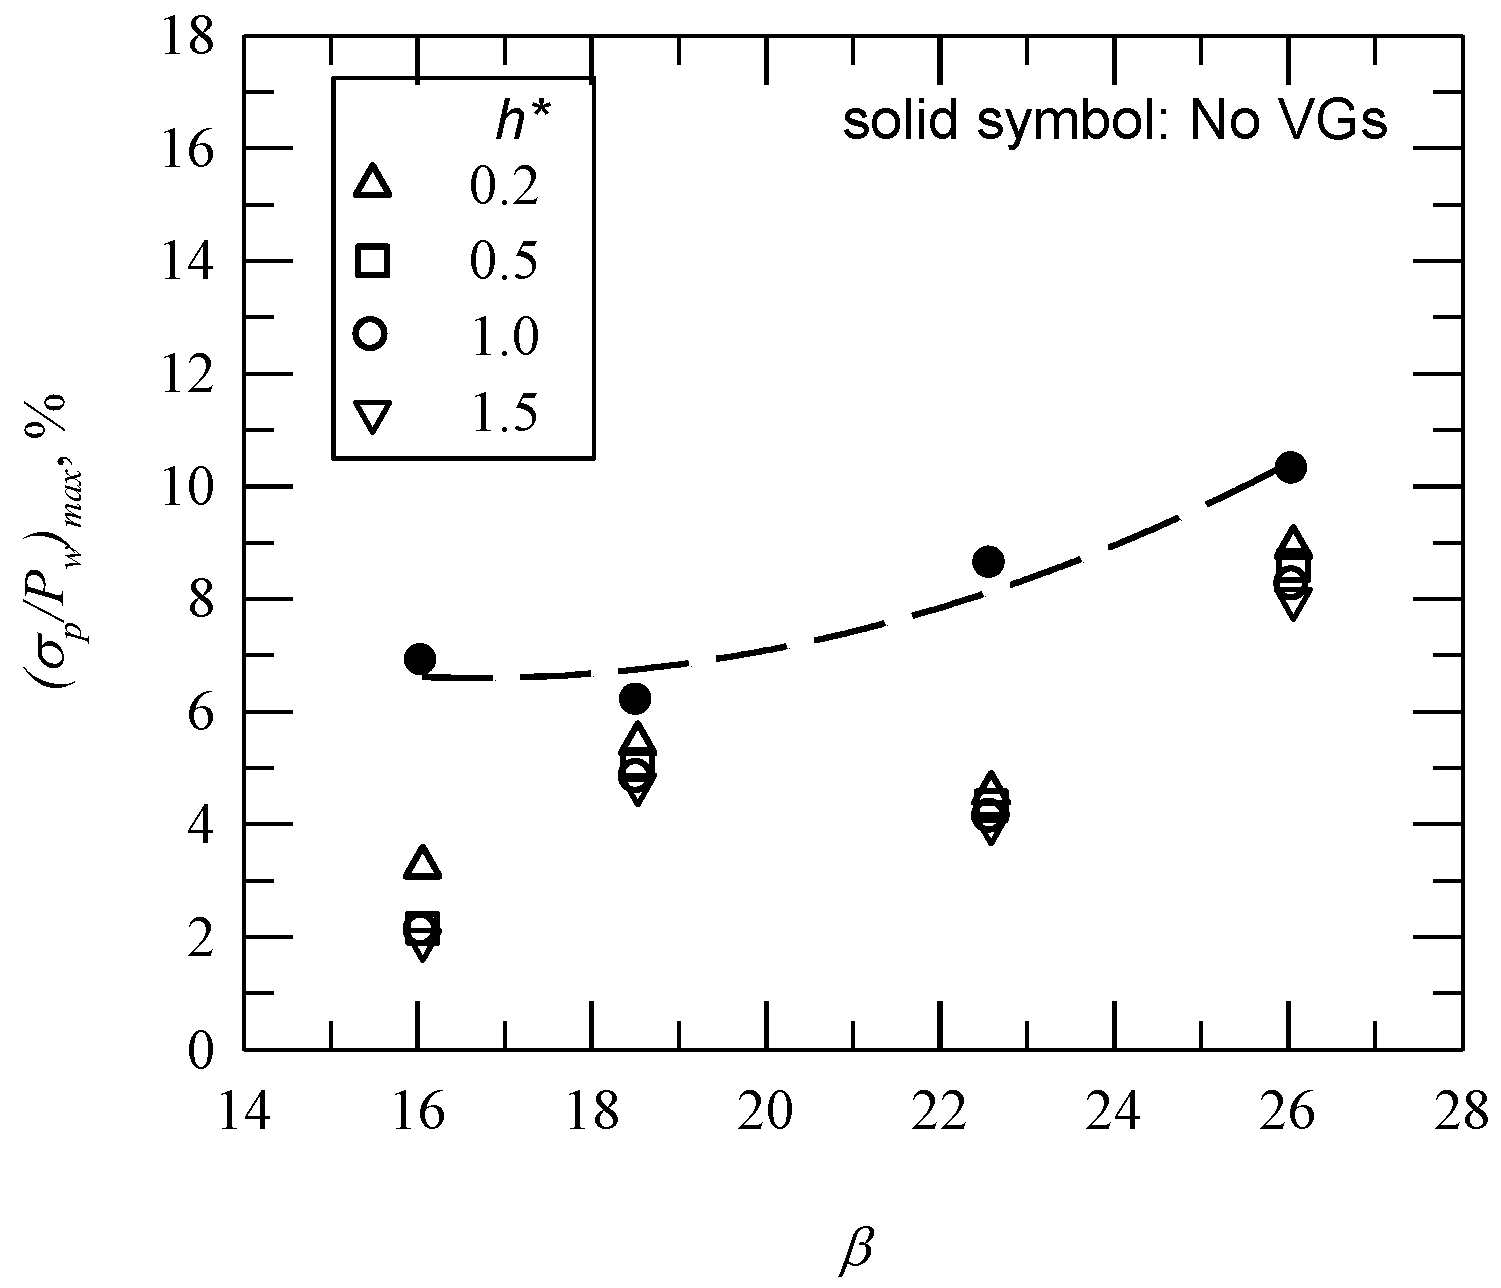
The variation in (σp/Pw)max with β is shown in Figure 9. For the baseline case, the amplitude of (σp/Pw)max increases with β. The presence of VGs results in a decrease in the amplitude of (σp/Pw)max, which is more significant as h* increases. The data also shows the effect of M. The value of (σp/Pw)max differs more significantly from the value for the baseline case for M = 0.83 (β = 16.1 and 22.6), because there is greater spacing between VGs and the location at which compression (or shock) is initiated for M = 0.89.
3.3. Shock Oscillation
SIBLS is accompanied by unsteady motions at frequencies of one or two orders lower than the boundary layer characteristic frequency, U/δ [34]. This low-frequency behavior is related to the interaction between coherent structures in the bubble and the shock (downstream dynamics) [35]. Beresh et al. found that there is a clear correlation between streamwise velocity fluctuations in the lower part of the upstream boundary layer and low-frequency shock motions, but not in the upper part of the upstream boundary layer (upstream dynamics) [36]. Hu et al. determined that Görtler-like vortices are induced by the centrifugal forces originating from the strong curvature of the streamlines in the reattachment region, which results in the low-frequency shock oscillation [37].
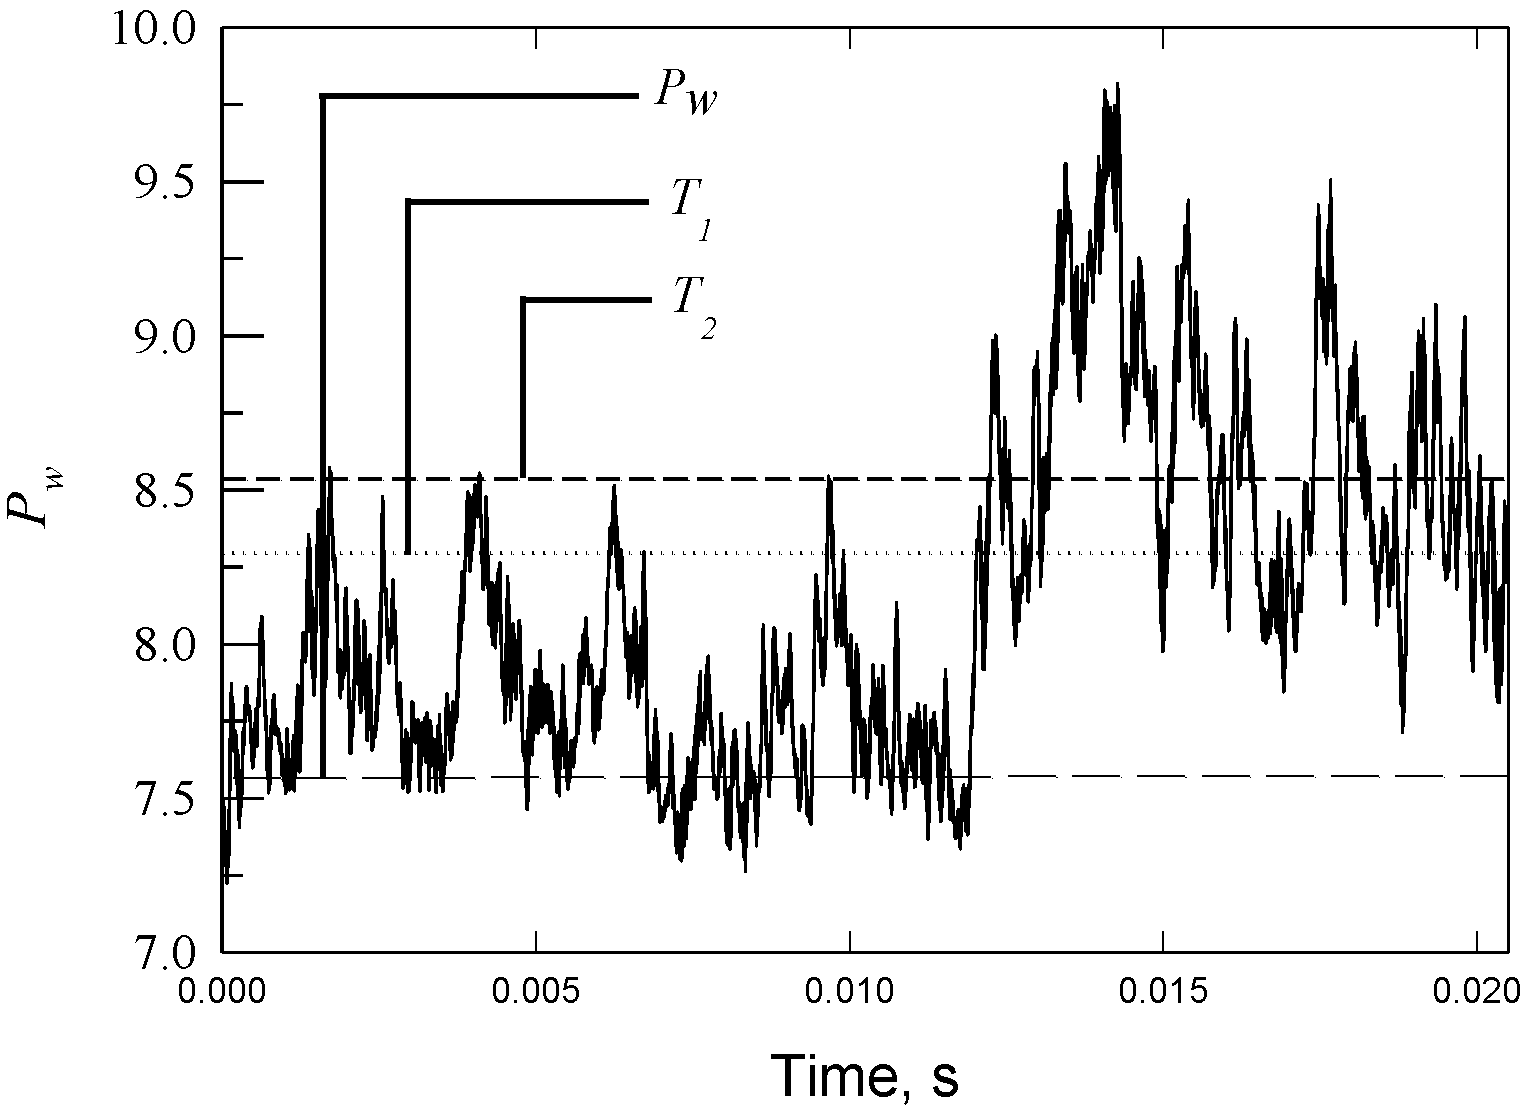
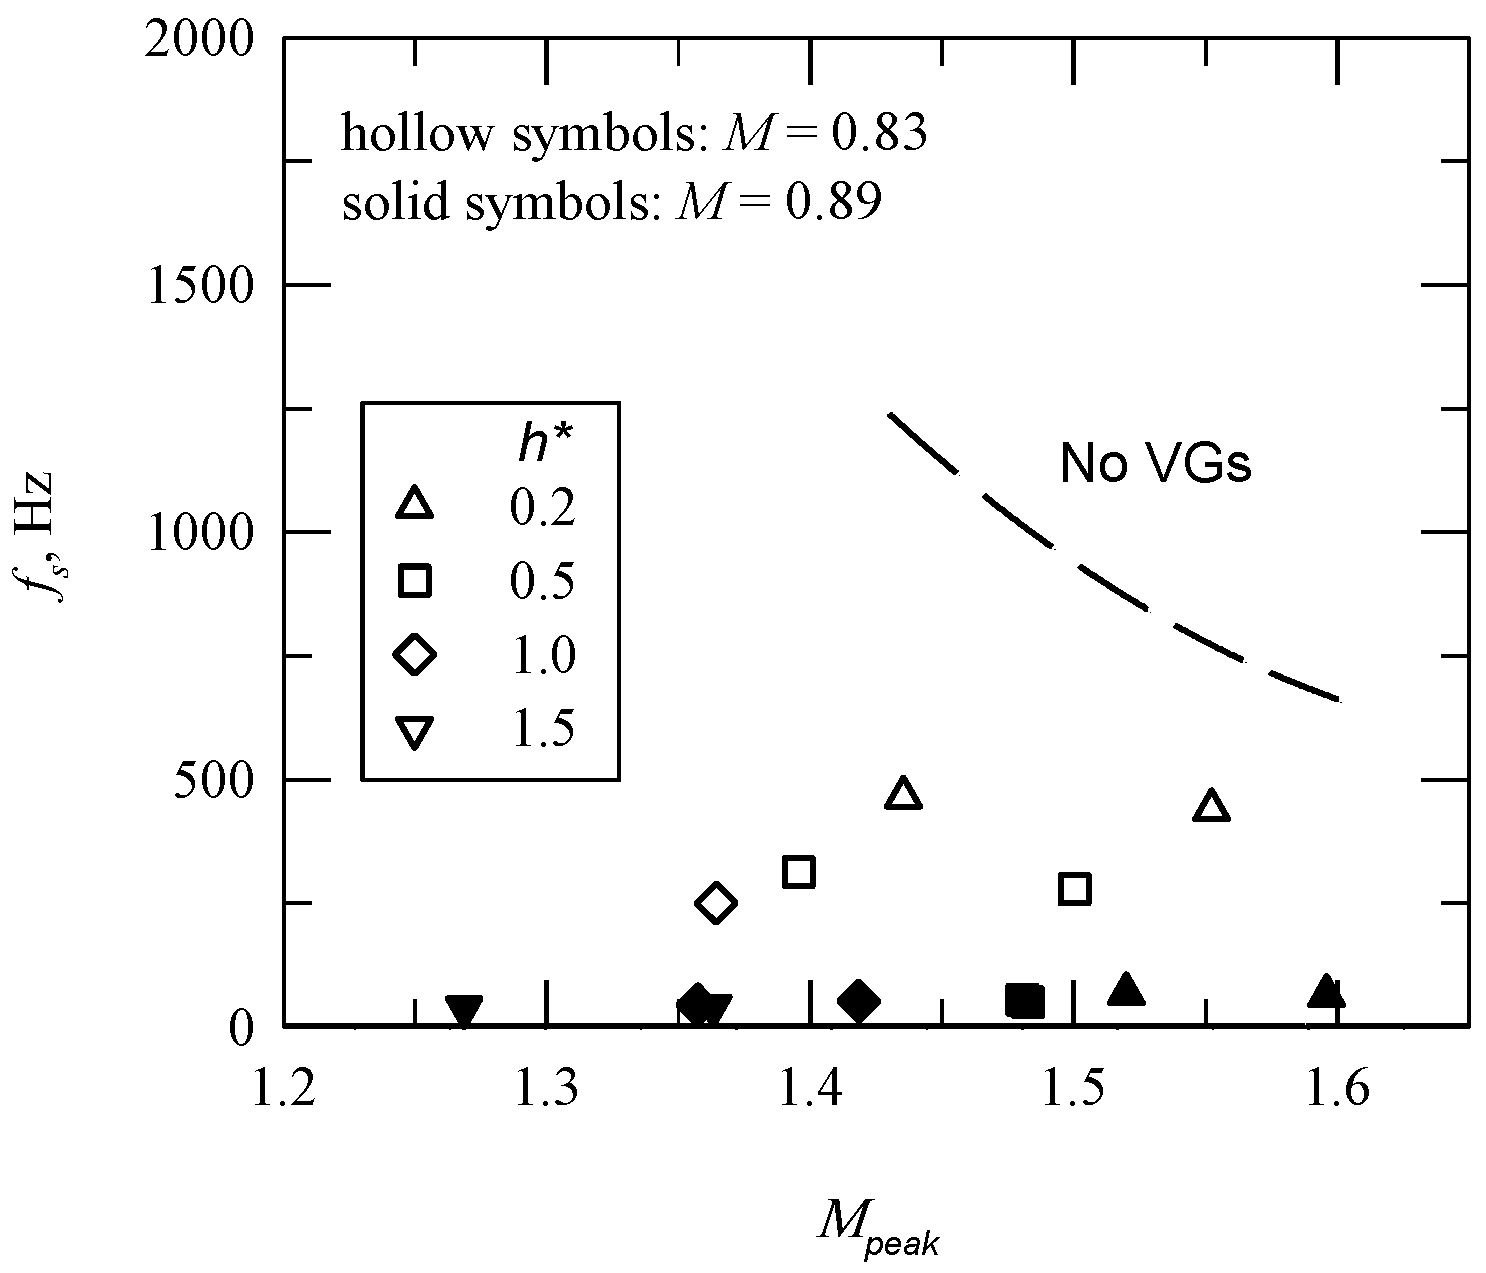
When an unsteady shock moves across a pressure sensor, there is an intermittent pressure signal [6]. A two-threshold method (THM) was proposed by Dolling and Brusniak [7] to determine the shock zero-crossing frequency, fs. THM was set as T1 = Pw + 3σp and T2 = Pw + 6σp, as shown in Figure 10. The value of fs versus Mpeak with and without the presence of VGs is presented in Figure 11. The uncertainty of fs is estimated to be ±5%, which is determined from the repeated runs for each test configuration. For the baseline case, there is a decrease in the value of fs (=1320–640 Hz) as Mpeak increases, because the separation length, L, changes [6]. The presence of VGs results in a significant decrease in the value of fs (=465–39 Hz), particularly for M = 0.89 and an increase in h*.
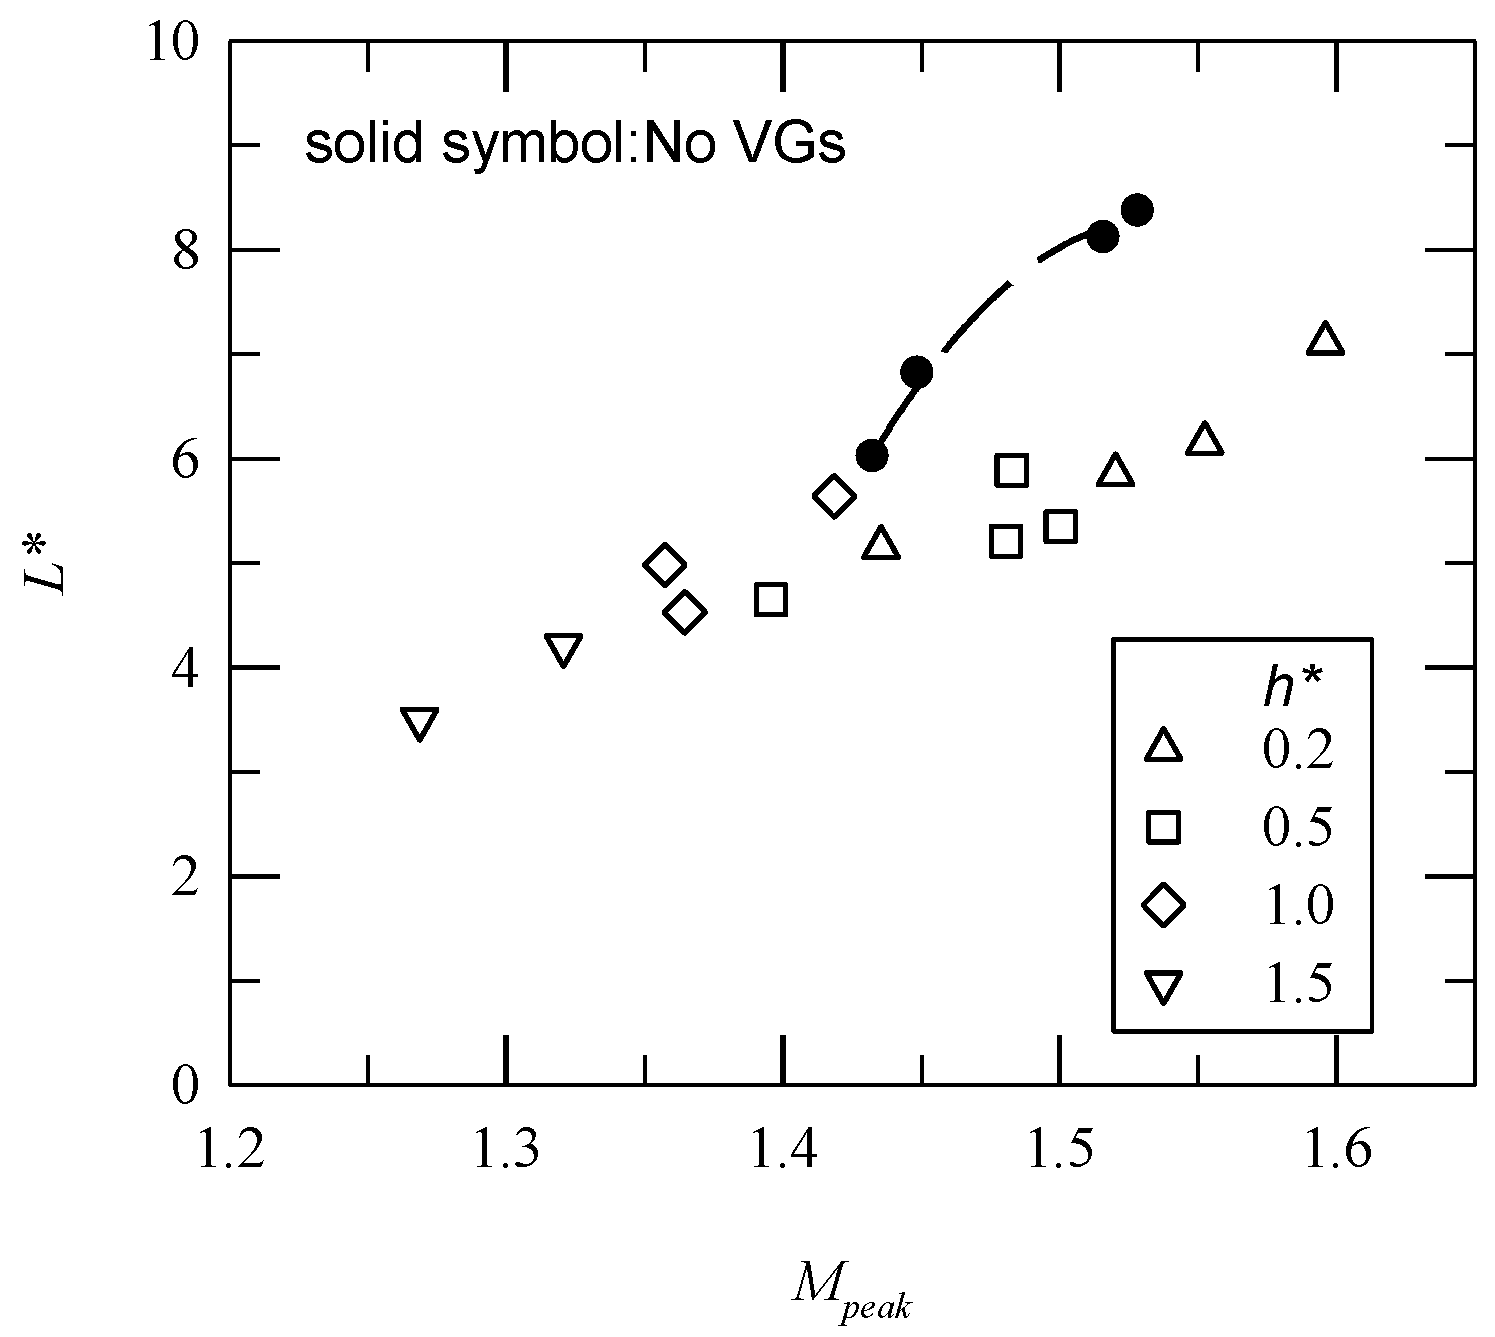
Piponniau et al. [38] showed that a separation bubble is approximately in a triangle shape and that separation length is the most important parameter. Figure 12 shows the normalized separation length of L*, L/δ, versus Mpeak. There is an increase in L* as Mpeak increases for all test cases. The presence of VGs results in a decrease in L*, particularly as h* increases. This result agrees with the study of Verma and Manisankar [15]. Note that there is an approximately linear relationship between L* and Mpeak.
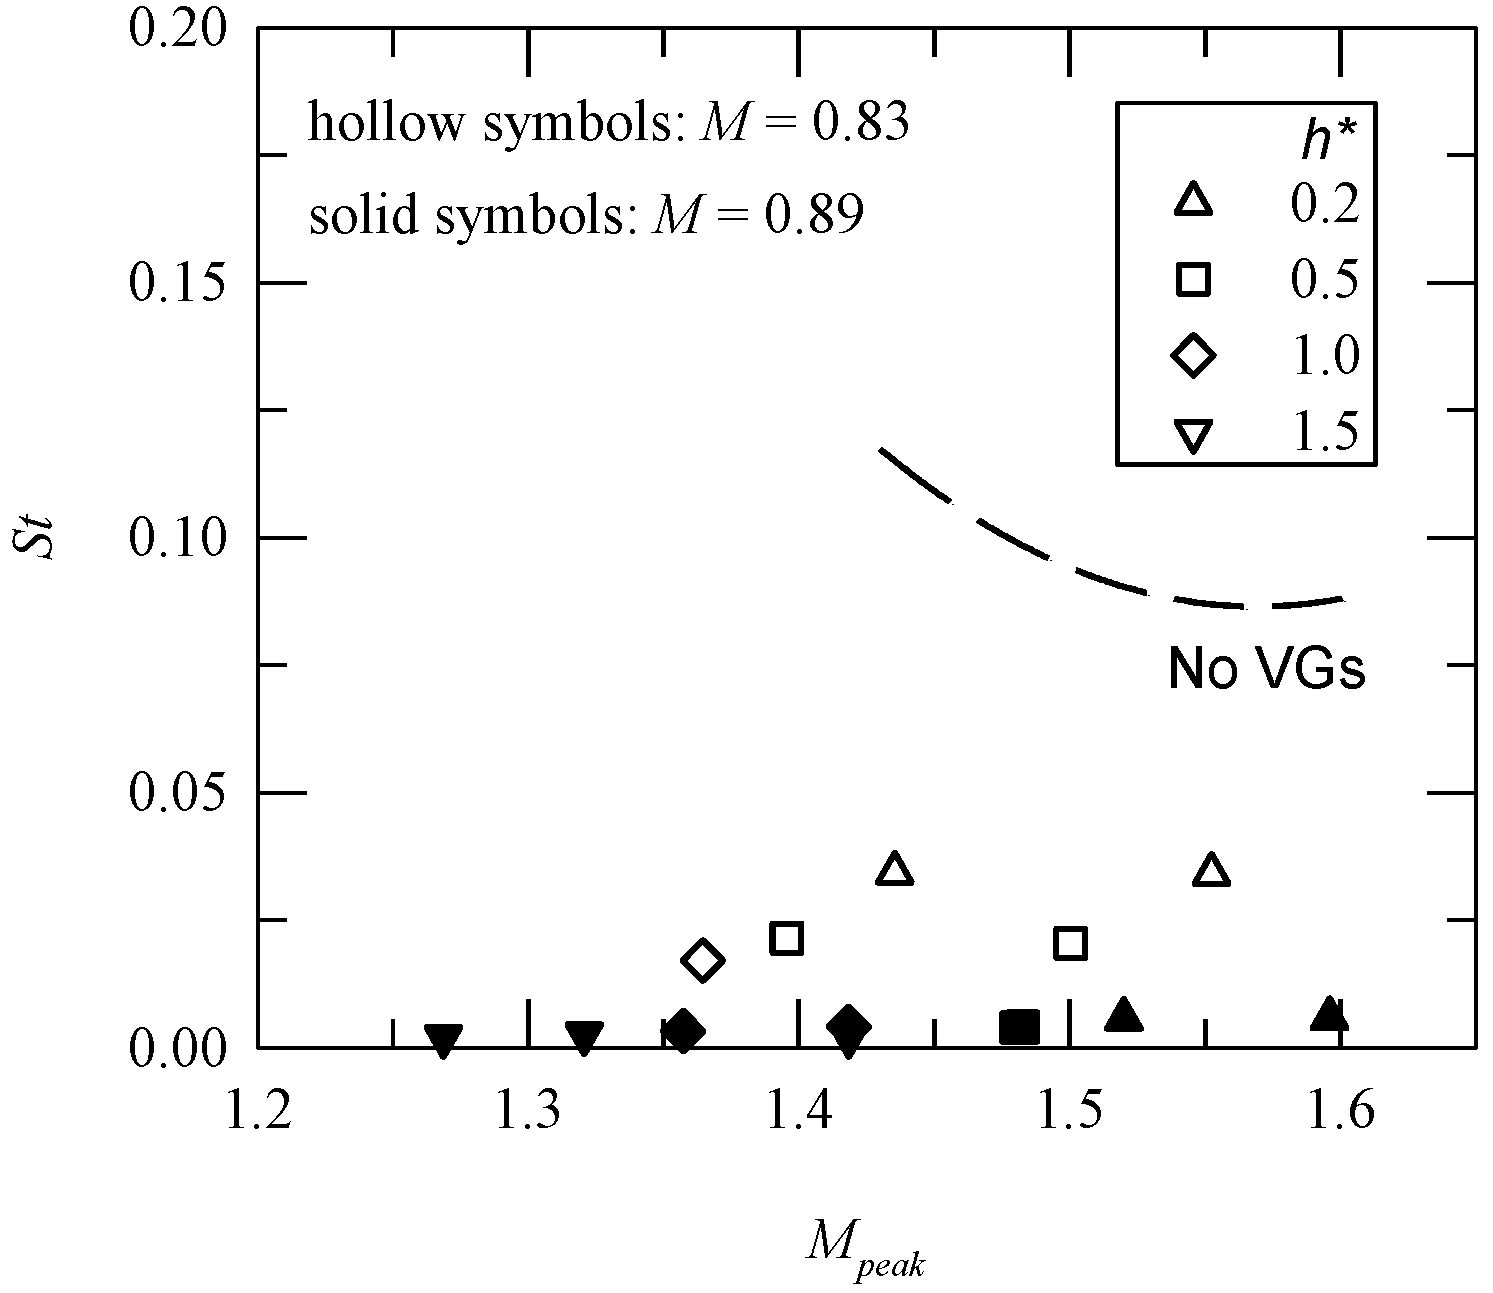
Figure 13 shows a plot for the Strouhal number, St = fsL/Up, versus Mpeak, where Up is the peak velocity. The value of St in the presence of VGs (≈0.034–0.002) is significantly less than that for the baseline case (St ≈ 0.120–0.089), so there is a decrease in shock oscillation if VGs are installed.
4. Conclusions
Deflected control surfaces can be used as a high-lift device for transport aircraft, but they may induce SIBLS and flow unsteadiness. This study determines the effect of the height of VGs in a transonic convex-corner flow. The distribution of mean surface pressure is less affected by sub-δ-scale VGs. The amplitude of the mean surface pressure upstream of the convex corner increases as h* increases, so device drag increases. There is less expansion near the corner’s apex. The effect of VGs also depends on M. For M = 0.89, there is an extension in the low-pressure region downstream of a convex corner, because there is greater convection and induced streamwise vorticity.
An increase in h* results in decreases in (σp/Pw)max and L*, so there is less expansion or Mpeak decreases downstream of the convex corner. The values for fs and St are also determined. Shock oscillation decreases in the presence of VGs, particularly as h* increases. VGs with h* ≤ 0.5 are preferred if deflected surfaces are used to produce lift.
Author Contributions
Conceptualization, K.-C.S. and K.-M.C.; methodology, K.-C.S.; formal analysis, K.-C.S.; resources, K.-M.C.; data curation, K.-C.S.; writing—original draft preparation, K.-C.S.; writing—review and editing, K.-M.C. and K.-C.C.; funding acquisition, K.-M.C. All authors have read and agreed to the published version of the manuscript.
Funding
This study was funded by Ministry of Science and Technology, Taiwan: grant number MOST 107-2212-E-006-115-MY3.
Institutional Review Board Statement
Not Applicable.
Informed Consent Statement
Not Applicable.
Data Availability Statement
Not Applicable.
Acknowledgments
The authors are also grateful for technical support from the ASTRC/NCKU technical staff.
Conflicts of Interest
The authors declare no conflict of interest.
Nomenclature
| fs | shock zero-crossing frequency, Hz |
| h | height of vortex generator |
| h* | normalized height of vortex generator |
| L | length of boundary separation |
| L* | normalized separation length, L/δ |
| M | freestream Mach number |
| Mpeak | peak Mach number |
| Po | stagnation pressure |
| Pw | mean surface pressure |
| (Pw/Po)min | The minimum pressure ratio for Pw/Po |
| To | stagnation temperature |
| U | freestream velocity |
| Up | peak velocity |
| X | longitudinal coordinate along the surface of the corner, mm |
| X* | normalized streamwise distance, X/δ |
| α | incidence angle for VGs |
| β | similarity parameter, |
| δ | thickness of incoming boundary-layer |
| η | convex-corner angle, deg |
| σp | standard deviation of surface pressure |
| (σp/Pw)max | peak value for σp/Pw |
References
- Szodruch, J.; Hilbig, R. Variable wing camber for transport aircraft. Prog. Aerosp. Sci. 1988, 25, 297–328. [Google Scholar] [CrossRef]
- Liu, X.; Squire, L.C. An investigation of shock/boundary layer interactions on curved surfaces at transonic speeds. J. Fluid Mech. 1998, 187, 467–486. [Google Scholar] [CrossRef]
- Chung, K.M. Unsteadiness of transonic convex-corner flows. Exper. Fluids 2004, 37, 917–922. [Google Scholar] [CrossRef]
- Chung, K.M.; Su, K.C.; Chang, K.C. Global Visualization of compressible swept convex-corner flow using pressure-sensitive paint. Aerospace 2021, 8, 106. [Google Scholar] [CrossRef]
- Chung, K.M.; Chang, P.H.; Chang, K.C. Flow similarity in compressible convex-corner flows. AIAA J. 2012, 50, 985–988. [Google Scholar] [CrossRef]
- Chung, K.M.; Lee, K.H.; Chang, P.H. Low-frequency shock motion in transonic convex-corner flows. AIAA J. 2017, 55, 2109–2112. [Google Scholar] [CrossRef]
- Dolling, D.S.; Brusniak, L. Separation shock motion in fin, cylinder, and compression ramp induced turbulent interactions. AIAA J. 1989, 27, 734–742. [Google Scholar] [CrossRef]
- Lee, B.H.K. Self-sustained shock oscillations on airfoils at transonic speeds. Prog. Aerosp. Sci. 2001, 37, 147–196. [Google Scholar] [CrossRef]
- Wang, C.; Yang, X.; Xue, L.; Kontis, K.; Jiao, Y. Correlation analysis of separation shock oscillation and wall pressure fluctuation in unstarted hypersonic inlet flow. Aerospace 2019, 6, 8. [Google Scholar] [CrossRef] [Green Version]
- Titchener, N.; Babinsky, H. A review of the use of vortex generator for mitigating shock-induced separation. Shock Waves 2015, 25, 473–494. [Google Scholar] [CrossRef] [Green Version]
- Lin, J.C. Review of research on low-profile vortex generators to control boundary-layer separation. Prog. Aerosp. Sci. 2002, 38, 389–420. [Google Scholar] [CrossRef]
- Ferrero, A. Control of a supersonic inlet in off-design conditions with plasma actuators and bleed. Aerospace 2020, 7, 32. [Google Scholar] [CrossRef] [Green Version]
- Panaras, A.G.; Lu, F.K. Micro-vortex generators for shock wave/boundary layer interactions. Prog. Aerosp. Sci. 2015, 74, 16–47. [Google Scholar] [CrossRef]
- Verma, S.B.; Manisankar, C. Assessment of various low-profile mechanical vortex generators in controlling a shock-induced separation. AIAA J. 2017, 55, 2228–2240. [Google Scholar] [CrossRef]
- Verma, S.B.; Manisankar, C. Control of a Mach reflection-induced interaction using an array of vane-type vortex generators. Shock Waves 2018, 28, 815–828. [Google Scholar] [CrossRef]
- Cathalifauda, P.; Godardb, G.; Braudc, C.; Stanislas, M. The flow structure behind vortex generators embedded in a decelerating turbulent boundary layer. J. Turbul. 2009, 10, 1–37. [Google Scholar] [CrossRef]
- Lin, J.C.; Robinson, S.K.; Mcghee, R.J.; Valarezo, W.O. Separation control on high-lift airfoils via micro-vortex generators. J. Aircr. 1994, 31, 1317–1323. [Google Scholar] [CrossRef]
- Bur, R.; Coponet, D.; Carpels, Y. Separation control by vortex generator devices in a transonic channel flow. Shock Waves 2009, 19, 521–530. [Google Scholar] [CrossRef]
- Souckova, N.; Kuklova, J.; Popelka, L.; Matejka, M. Visualization of flow separation and control by vortex generators on a single flap in landing configuration. EPJ Web Conf. 2012, 25, 02026. [Google Scholar] [CrossRef] [Green Version]
- Brüderlin, M.; Zimmer, M.; Hosters, N.; Behr, M. Numerical simulation of vortex generators on a winglet control surface. Aerosp. Sci. Technol. 2017, 71, 651–660. [Google Scholar] [CrossRef]
- Hu, J.; Wang, R.; Huang, D. Flow control mechanisms of a combined approach using blade slot and vortex generator in compressor cascade. Aerosp. Sci. Technol. 2018, 78, 320–331. [Google Scholar] [CrossRef]
- Li, X.K.; Liu, W.; Zhang, T.J.; Wang, P.M.; Wang, X.D. Analysis of the effect of vortex generator spacing on boundary layer flow separation control. Appl. Sci. 2019, 9, 5495. [Google Scholar] [CrossRef] [Green Version]
- McCormick, D.C. Shock/boundary-layer interaction control with vortex generators and passive cavity. AIAA J. 1993, 31, 91–96. [Google Scholar] [CrossRef]
- Ashill, P.R.; Fulker, J.L.; Hackett, K.C. Research at DERA on sub boundary layer vortex generators (SBVGS). AIAA J. 2001, 887. [Google Scholar] [CrossRef]
- Tichener, N.; Babinsky, H. Shock wave/boundary-layer interaction control using a combination of vortex generators and bleed. AIAA J. 2013, 51, 1221–1223. [Google Scholar] [CrossRef]
- Mitchell, G.A. Experimental Investigation of the performance of vortex generators mounted in the supersonic portion of a mixed-compression inlet. Contract 1971, 764, 74. [Google Scholar]
- Lee, S.; Loth, E.; Babinsky, H. Normal shock boundary layer control with various vortex generator geometries. Comput. Fluids 2011, 49, 233–234. [Google Scholar] [CrossRef]
- Lee, S.; Loth, E. Impact of ramped vanes on normal shock boundary-layer interaction. AIAA J. 2012, 50, 2069–2079. [Google Scholar] [CrossRef]
- Chung, K.M. Investigation on transonic convex-corner flows. J. Aircr. 2002, 39, 1014–1018. [Google Scholar] [CrossRef]
- Holden, H.A.; Babinsky, H. Vortex generators near shock/boundary layer interactions. AIAA Paper 2004, 2142. [Google Scholar] [CrossRef]
- Bouhadji, A.; Braza, M. Organised modes and shock-vortex interaction in unsteady viscous transonic flows around an aerofoil Part I: Mach number effect. Comput. Fluids 2003, 32, 1233–1260. [Google Scholar] [CrossRef]
- Laganelli, A.L.; Martellucci, A.; Shaw, L.L. Wall pressure fluctuations in attached boundary-layer flow. AIAA J. 1983, 21, 495–502. [Google Scholar] [CrossRef]
- Babinsky, H.; Ogawa, H. SBLI control for wings and inlets. Shock Waves 2008, 18, 89–96. [Google Scholar] [CrossRef]
- Touber, E.; Sandham, N.D. Low-order stochastic modelling of low-frequency motions in reflected shock-wave/boundary-layer interactions. J. Fluid Mech. 2011, 671, 417–465. [Google Scholar] [CrossRef] [Green Version]
- Pirozzoli, S.; Grasso, F. Direct numerical simulation of impinging shock wave/turbulent boundary layer interaction at M = 2.25. Phys. Fluids 2006, 18, 065113. [Google Scholar] [CrossRef]
- Beresh, S.J.; Clements, N.T.; Dolling, D.S. Relationship between upstream turbulent boundary-layer velocity fluctuations and separation shock unsteadiness. AIAA J. 2002, 40, 2412–2422. [Google Scholar] [CrossRef]
- Hu, W.; Hickel, S.; Van Oudheusden, B.W. Low-frequency unsteadiness mechanisms in shock wave/turbulent boundary layer interactions over a backward-facing step. J. Fluid Mech. 2021, 915, A107. [Google Scholar] [CrossRef]
- Piponniau, S.; Dussage, J.P.; Debieve, J.F.; Dupont, P. A simple model for low frequency unsteadiness in shock-induced separation. J. Fluid Mech. 2009, 629, 87–108. [Google Scholar] [CrossRef]
Figure 1.
A sketch of the test configuration.

Figure 2.
Configuration of VGs.

Figure 3.
Surface oil-flow visualization for VG1 at M = 0.89 and η = 13°.

Figure 4.
Mean surface pressure distributions for M = 0.83.

Figure 5.
Mean surface pressure distributions for M = 0.89.

Figure 6.
The effect of the presence of VGs on flow expansion near the corner’s apex.

Figure 7.
Distribution of surface pressure fluctuations for M = 0.83.

Figure 8.
Distributions of pressure fluctuations distribution for M = 0.89.

Figure 9.
The effect of the height of VGs on peak pressure fluctuations.

Figure 10.
A sketch for two-threshold method.

Figure 11.
Shock zero-crossing frequency in the presence/absence of VGs.

Figure 12.
Normalized separation length versus peak Mach number.

Figure 13.
St versus peak Mach number.


Table 1.
Geometrical parameters for VGs.
| Configuration | Height (h/δ) | Length (l/δ) | Width (w/δ) | Distance (D/δ) | Angle of Incidence (α, Degree) |
|---|---|---|---|---|---|
| VG1 | 0.2 | 1.0 | 0.2 | 3.0 | 15 |
| VG2 | 0.5 | ||||
| VG3 | 1.0 | ||||
| VG4 | 1.5 |
Publisher’s Note: MDPI stays neutral with regard to jurisdictional claims in published maps and institutional affiliations. |
© 2021 by the authors. Licensee MDPI, Basel, Switzerland. This article is an open access article distributed under the terms and conditions of the Creative Commons Attribution (CC BY) license (https://creativecommons.org/licenses/by/4.0/).
Share and Cite
MDPI and ACS Style
Chung, K.-M.; Su, K.-C.; Chang, K.-C. The Effect of Vortex Generators on Shock-Induced Boundary Layer Separation in a Transonic Convex-Corner Flow. Aerospace 2021, 8, 157. https://doi.org/10.3390/aerospace8060157
AMA Style
Chung K-M, Su K-C, Chang K-C. The Effect of Vortex Generators on Shock-Induced Boundary Layer Separation in a Transonic Convex-Corner Flow. Aerospace. 2021; 8(6):157. https://doi.org/10.3390/aerospace8060157
Chicago/Turabian StyleChung, Kung-Ming, Kao-Chun Su, and Keh-Chin Chang. 2021. "The Effect of Vortex Generators on Shock-Induced Boundary Layer Separation in a Transonic Convex-Corner Flow" Aerospace 8, no. 6: 157. https://doi.org/10.3390/aerospace8060157
Note that from the first issue of 2016, this journal uses article numbers instead of page numbers. See further details here.