
Review of Magnetoelectric Sensors
by
 ,
,
Junqi Gao
1,2,3 ,
,
Zekun Jiang
1,2,3,
Shuangjie Zhang
1,2,3,
Zhineng Mao
1,2,3,
Ying Shen
1,2,3,* and
Zhaoqiang Chu
1,2,3,* 1
Acoustic Science and Technology Laboratory, Harbin Engineering University, Harbin 150001, China
2
Ministry of Industry and Information Technology, Key Laboratory of Marine Information Acquisition and Security, Harbin Engineering University, Harbin 150001, China
3
College of Underwater Acoustic Engineering, Harbin Engineering University, Harbin 150001, China
*
Authors to whom correspondence should be addressed.
Actuators 2021, 10(6), 109; https://doi.org/10.3390/act10060109
Submission received: 26 April 2021
/
Revised: 15 May 2021
/
Accepted: 19 May 2021
/
Published: 24 May 2021
(This article belongs to the Special Issue Advances in Piezoelectric Actuators 2022)
Abstract
:Multiferroic magnetoelectric (ME) materials with the capability of coupling magnetization and electric polarization have been providing diverse routes towards functional devices and thus attracting ever-increasing attention. The typical device applications include sensors, energy harvesters, magnetoelectric random access memories, tunable microwave devices and ME antennas etc. Among those application scenarios, ME sensors are specifically focused in this review article. We begin with an introduction of materials development and then recent advances in ME sensors are overviewed. Engineering applications of ME sensors are followed and typical scenarios are presented. Finally, several remaining challenges and future directions from the perspective of sensor designs and real applications are included.
1. Introduction
Multiferroic materials have been recently attracting ever-increasing attention because of the capability of coupling at least two ferric orders, i.e., ferroelectricity, ferromagnetism, or ferroelasticity, and the vast potential for multifunctional devices applications [1,2,3,4,5]. A control of polarization P by external magnetic field H (direct ME (DME) effect) or a manipulation of magnetization M by an electric field E (converse ME (CME) effect) can be realized in multiferroic magnetoelectric (ME) materials [6]. Compared with single-phase ME material, ME heterostructures and ME laminates perform greatly enhanced coupling capability, which is generally characterized by ME coefficient [7,8,9]. After a development of nearly half a century, tremendous progress regarding ME composites and related device applications has been reported [1,2,3,6,10,11,12,13,14,15,16,17,18,19].
In this article, the focus is placed on magnetoelectric sensors and the corresponding engineering applications. After an overview of materials fundaments, we present current advances in ME sensors including DC, low-frequency and resonant magnetic field sensing. Then we summarize typical engineering applications of ME sensors including object detection and localization, speed and displacement sensing, current sensing and non-destructive testing, stress and strain sensing, and biological magnetic measuring. We will also discuss some remaining questions of ME sensors and their engineering applications at the end of the article.
2. Materials for ME Sensors
The ME effect was first experimentally demonstrated in single-phase multiferroic material Cr2O3 in 1961 [20,21]. After that, diverse studies all over the globe were conducted to further enhance the coupling capability of ferroelectric and magnetic orderings in a single-phase material system [20,22], but the low Curie temperature and the weak ME coupling capability in single-phase ME materials, such as BiFeO3, BiMnO3 and LuFe2O4, greatly limited their applications [1,23,24]. The proposal of a product effect in composite ME materials by combining the piezomagnetic and piezoelectric effects of ferromagnetic and ferroelectric materials then provided new routes towards improved ME coupling performance. Early in 1986, Pantinakis et al. proposed 2-2 type ME composites based on the aforementioned product effect [25] and giant ME coefficients were gradually realized in laminated ME composites starting from the beginning of 21st century [1,6,10]. Compared with single-phase or 0-3 typed ME materials, 2-2 typed ME composites, such as a bulk ME laminates with piezoelectric phase (Pb(Zr,Ti)O3(PZT), Pb(Mg,Nb)O3-PbTiO3 (PMN-PT)) embedded in piezomagnetic materials (FeCoSiB, FeBSiC Terfenol-D, Ni or Fe-Ga) [8] and a FeGaB/AlN thin-film ME heterostructure [26], exhibited enhanced ME coupling performance benefitting from the removal of the leakage current and the improvement of the interfacial strain transfer. At this section, we will first review materials advances in ME sensors since 2002.
2.1. Bulk ME Laminates
It is highly desirable to design new connectivity structures for circumventing the limitation of leakage current that occurs in 0-3 typed ME composites. Back in 2002, Ryu et al. developed a laminated Terfenol-D/PZT/Terfenol-D ME composite (Figure 1a) with 2-2 type connectivity to solve the leakage current problem in 0-3 type ME composites, and the obtained ME coupling coefficient at non-resonance frequency reached as high as 5 V/cm·Oe [27]. This was a significant event in the development of ME laminates and various kinds of laminated structures were proposed afterwards [10,27]. For example. Dong et al. reported 2-2 type ME laminates consisting of Terfenol-D ferrite and PMN-PT piezoelectric crystal. These ME composites work with L-T mode and display relatively low ME coefficients of 2.2 V/cm·Oe at non-resonance frequency [28]. In a bid to further improve the ME voltage coefficient, Dong et al. in 2005 first proposed a push-pull mode that increased the distance between electrodes and decreased the static capacitance of ME laminates from nF to pF scale [29,30]. In such 2-2 type ME composites, the piezoelectric core was symmetrically poled along its longitudinal direction and rgw d33 piezoelectric constant of a piezoelectric material could be utilized. A giant ME voltage coefficient of 1.6 V/Oe at non-resonant frequencies was observed experimentally [30]. One year later, Dong et al. further developed a multi-push-pull mode in 2-1 ME composites. The schematic structure configuration and operation mode of such a 2-1 ME composite is presented in Figure 1c. It consisted of a piezo-fiber layer laminated between FeBSiC alloys. For the first time, the non-resonant ME coefficient at 1 Hz reached 22 V/cm·Oe, making such a structure especially suitable for low-frequency and passive magnetic sensing [31,32,33,34,35], but it should be noted here that the mechanical quality factor for such a 2-1 type ME composites is normally less than 100, so ultra-high resonant ME coefficients cannot be realized in this case [29].
Another way to address the difficulty of fully polarizing the piezoelectric phase in 0-3 type ME composites is replacing the particle phase with a 1-D piezoelectric fiber (forming 1-3 typed connectivity). For example, in 2005 Nan et al. reported a 1-3 type ME composite with ZT rod arrays embedded in a Terfenol-D medium via a dice-and-fill technique. The non-resonant ME coupling coefficient reached 6.2 V/cm·Oe [36], which represented great progress for ME composites. Two years later, Ma et al. simplified this 1-3 type ME structure by just embedding one single PZT rod in a Terfenol-D/epoxy mixture [37]. The single period element of the 1-3 ME composites is shown in Figure 1b. Although the non-resonant ME coupling coefficient decreased by almost one order of amplitude, this simple structure, low-cost fabrication process and sub-millimeter size made it attractive for micro-ME array applications [37].
In 2017, Chu et al. reported a 1-1 type ME composites, which consisted of a [011]-oriented Pb(Mg,Nb)O3-PbZrO3-PbTiO3 (PMN-PZT) single crystal fiber and laser-treated amorphous alloy Metglas. The 1-1 type ME composite featured the one-dimensional configuration as shown in Figure 1d [8]. The laser treatment could decrease magnetic hysteresis loss of Metglas and thereby enhance the Q value of the ME resonator. In addition, the fiber configuration effectively utilized the magnetic flux concentration effect occurring in Metglas layers. More importantly, this 1-D configuration favored the longitudinal vibration mode of ME laminates. A ME coupling coefficient of , that was nearly seven times higher than the best result published previously, was finally realized, opening a door to develop new ME devices, e.g., resonant magnetic receivers in particular [8]. In addition, a high ME coefficient of 29.3 V/cm·Oe at non-resonant frequency was also achieved for our 1-1 type composites. Note, only one single crystal was consumed in this case, while previous 2-1 type composites normally took five crystals. In 2020, the resonant ME coefficient of 1-1 type ME composites was further enhanced to 12,500 V/cm·Oe by using a hard piezo-crystal Mn-PMN-PZT [9]. A summary of the field coupling coefficient of different ME laminates, i.e., 0-3, 2-2, 2-2.1-1 ME laminates, is given in Table 1.
With respect to ceramic-based thin film multiferroic laminates, Ryu et al. recently developed a Pb(Zr,Ti)O3 film deposited on piezomagnetic materials, e.g., Ni and Metglas. The crystallization of PZT film was implemented by laser annealing, which was able to keep the piezomagnetic layer free from property degradation [38,39,40,41]. Readers can get access to more detailed information concerning film-based ME composites in other review papers [3,6,10].
2.2. MEMS and NEMS ME Laminates
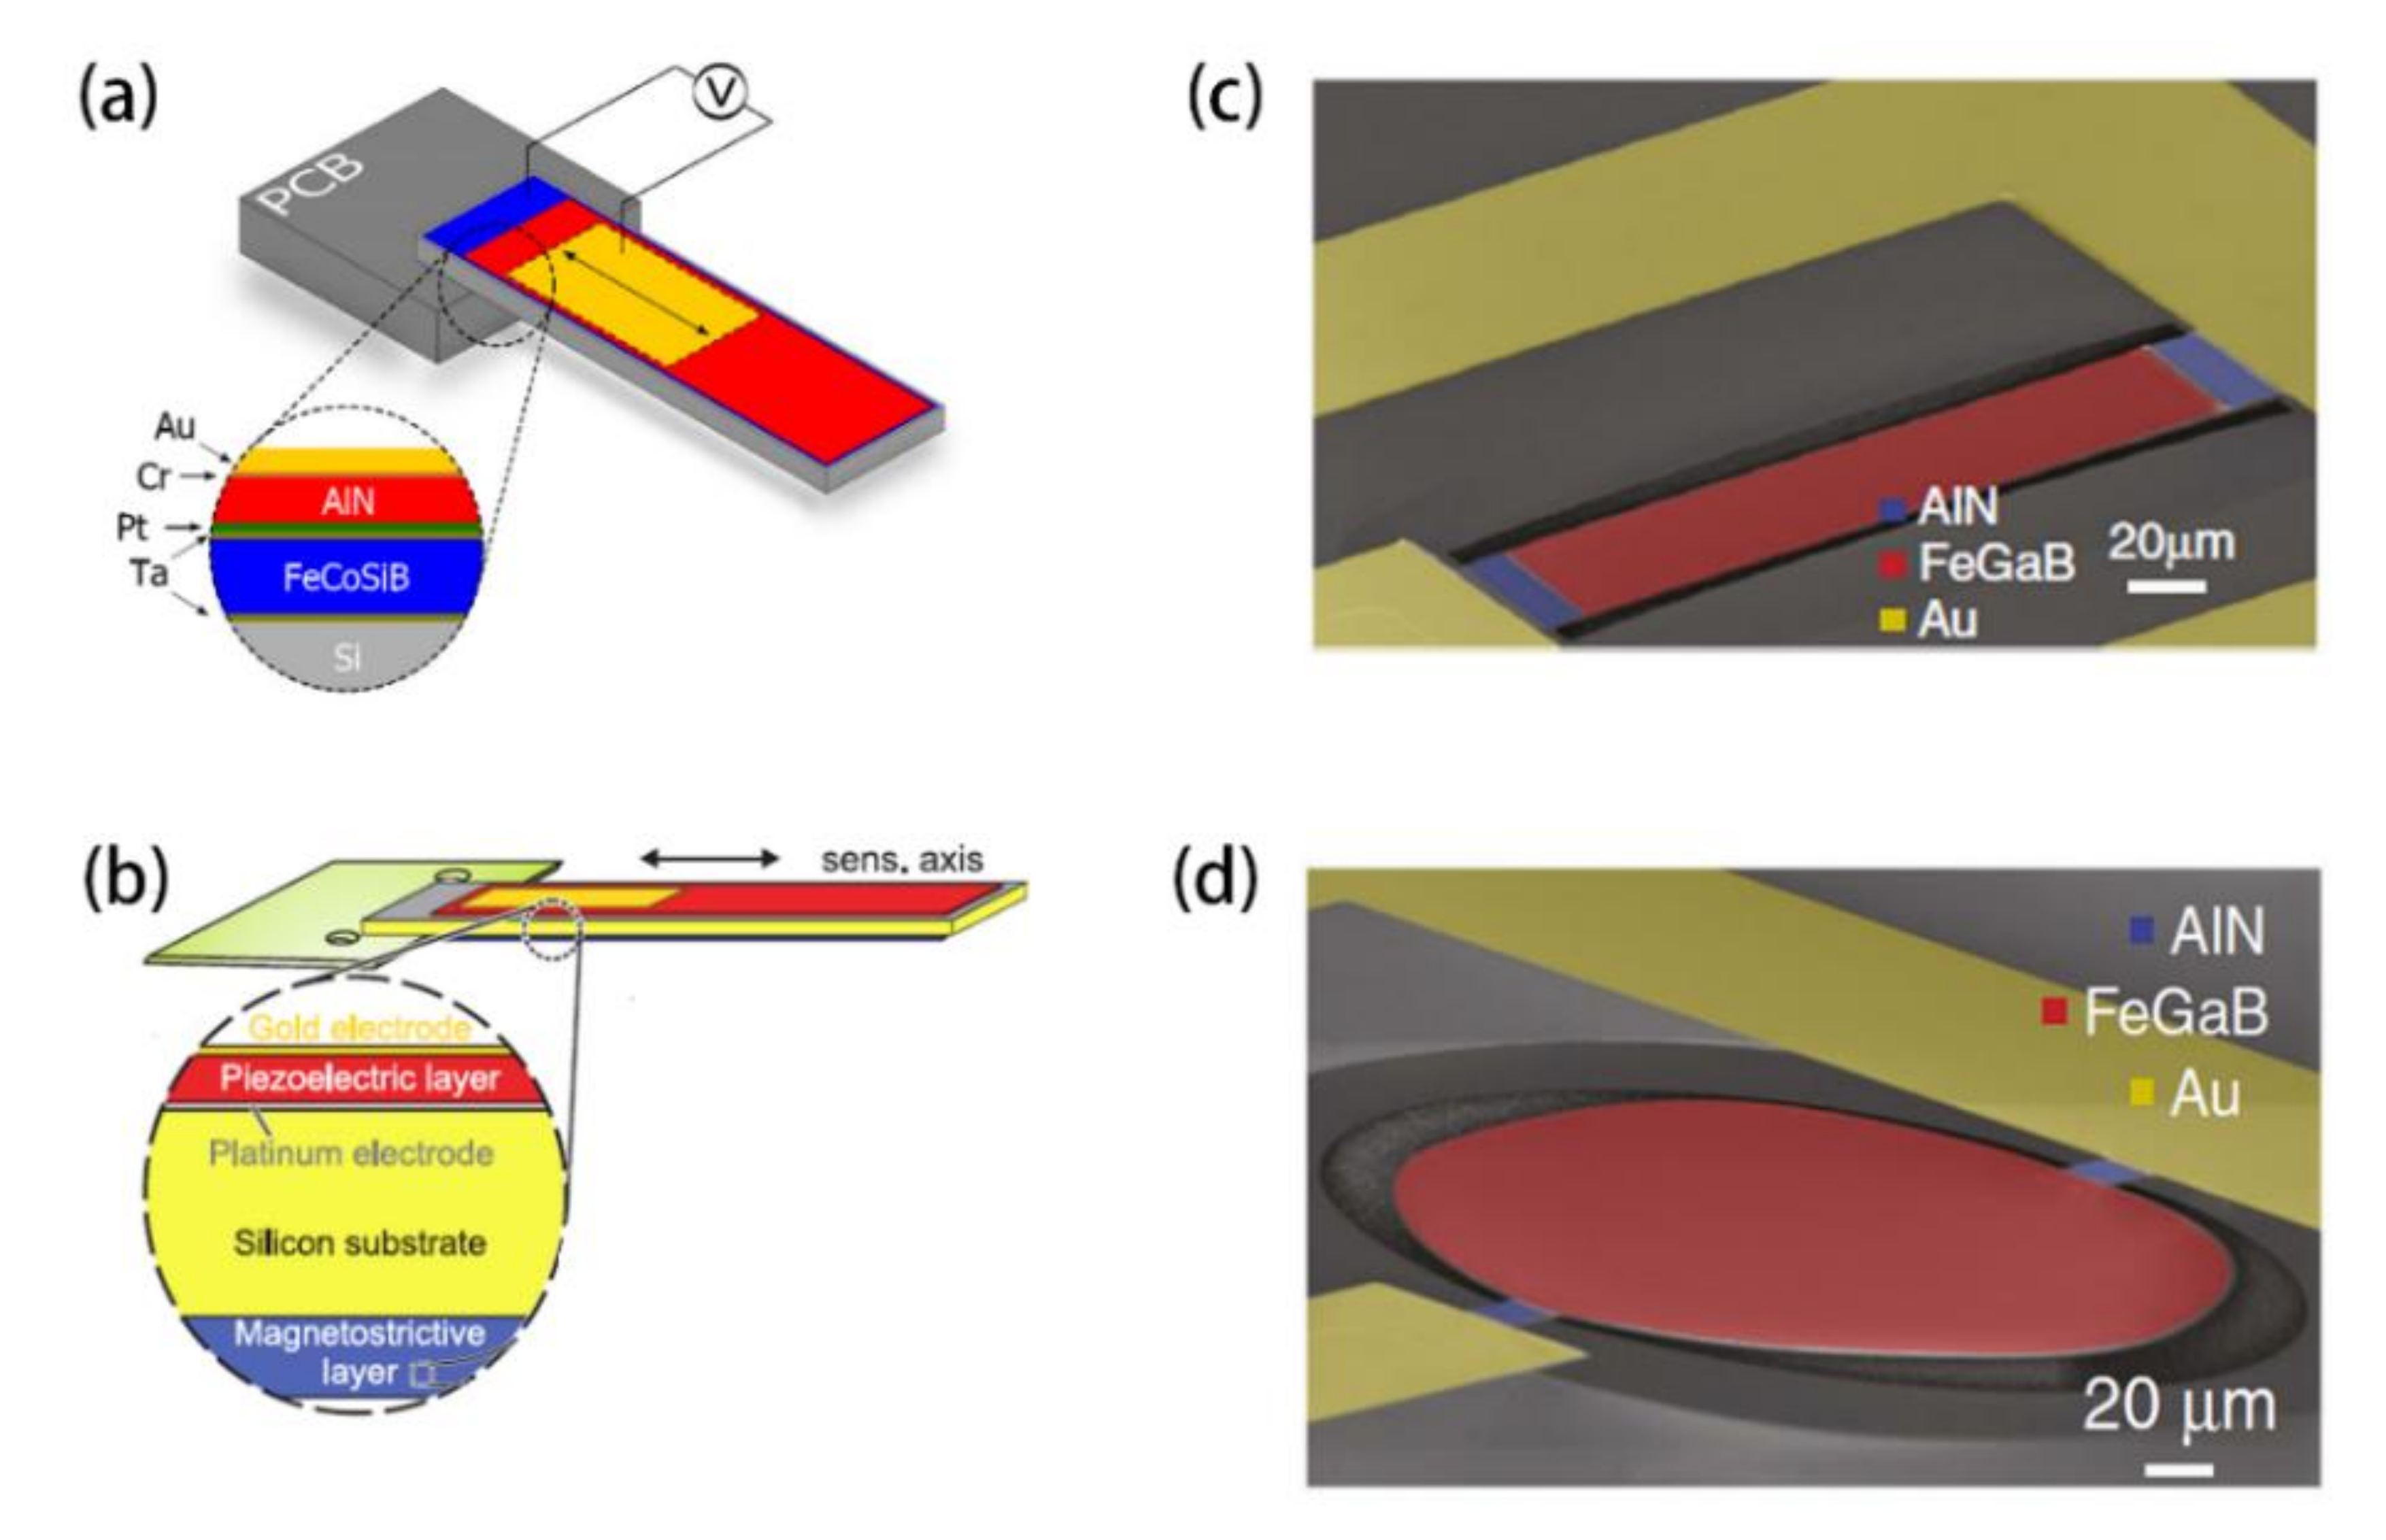
In a bid to obtain miniaturized ME devices with enhanced ME coupling capability, micro-electro-mechanical systems (MEMS) fabrication technology is a promising approach benefiting from the strong interfacial bonding force and the fine control over the material composition. Greve et al. developed a thin film MEMS composite consisting of AlN and amorphous Fe90Co78Si12B10 [49]. AlN is an ideal piezoelectric material compatible with MEMS techniques, and amorphous soft magnetic alloy is a good candidate for the piezomagnetic phase because of its high piezomagnetic properties. As shown in Figure 2a,b, two kinds of deposition flow could be used for MEMS ME composites. Conventional process flow involves the deposition of a high temperature constituent (AlN). In Figure 2a, a reverse flow was then proposed, where FeCoSiB was deposited as the first layer on the smooth wafer surface and AlN, including with the Pt seed layer, was deposited on top of it without any substrate heating [47]. A giant ME coupling coefficient of 5000 V/cm·Oe was measured in this case [47]. In Figure 2b, depositing the magnetostrictive layer and the piezoelectric layer on two sides of a silicon substrate separately is another way to obtain good MEMS ME films [50]. With respect to NEMS ME films, Sun’s group in Northeastern University has contributed lots of works in this field [26,51,52]. As shown in Figure 2c,d, the typical material is AlN and FeGaB film. As a ME resonator, both laterally-vibrating (Figure 2c) or vertically-vibrating (Figure 2d) mode can be realized at different frequency bands. Recently, a NEMS ME resonator has been successfully utilized for mechanical antennas with miniaturized size compared with traditional antennas driven by RF current [53].
3. Advances in ME Sensors
The giant ME coupling in ME composites provides the chances to be implemented as diverse functional devices, such as sensors, energy harvesters, magnetoelectric random access memories, tunable microwave devices and ME antennas, etc. Among those application scenarios, advances in ME sensors will be reviewed in this section.
To assess the performance of a general magnetic sensor, several critical parameters should be considered, i.e., limit of detection (LoD), sensitivity, working temperature, dynamic range, power consumption, size and the cost, but one should note LoD and sensitivity should be given a high priority when taking the research stage of ME sensors into consideration. With respect to the LoD of ME sensors, the ME coupling coefficient and the voltage noise level should be considered equally. Table 1 summarizes the ME coefficients of typical ME composites. The total noise level comes from both internal and external noise sources. The internal noise is dominated by the dielectric loss and the leakage resistance , which can be written as follows [32,33]:
where k is the Boltzmann constant (1.38 × 10⁻²³ J K−1), T is the temperature in Kelvin, Cp is the static capacitance, tan δ is the dielectric loss, f is the frequency in Hz and R is the DC resistance of the ME sensor. The total noise density has a 1/f spectrum and makes the magnetic field detection at low frequency much more difficult. On the other hand, ME sensors are susceptible to external environment variations, e.g., temperature fluctuation and base vibration, which typically occurs in low frequency as well [7,54]. We will discuss the current advances in ME sensors focusing on the improvement of LoD in the following sections.
3.1. Low-Frequency Magnetic Sensor
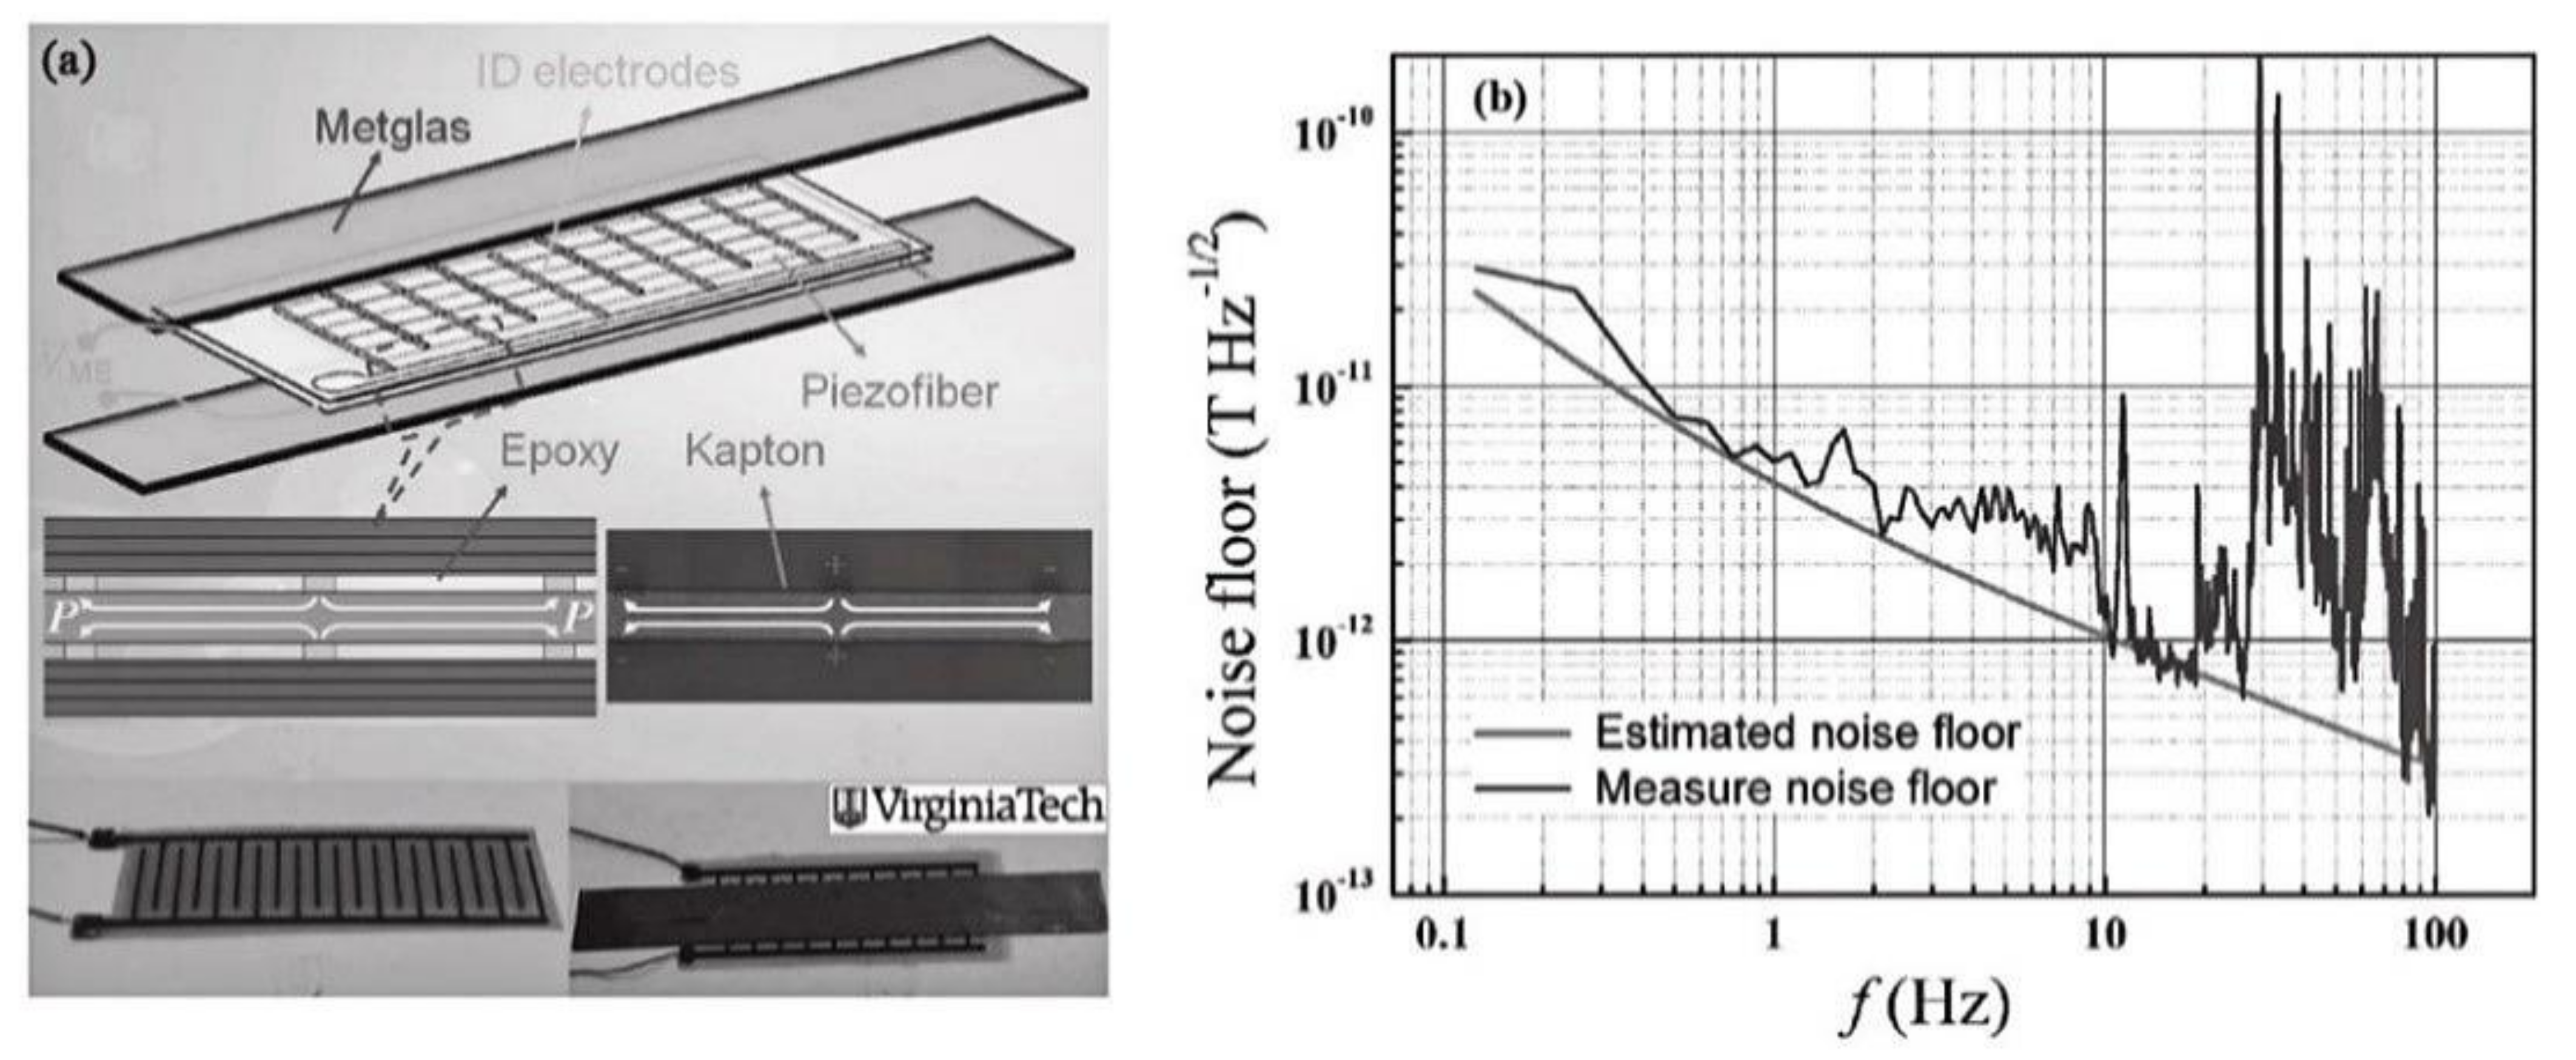
In 2011, Wang et al. reported the realization of an extremely low limit of detection through a combination of giant ME coupling in 2-1 type ME composites and a reduction in each noise source. Giant ME coupling was achieved by optimizing the stress transfer in multi-push-pull mode, the thickness ratio of Metglas to piezofiber, and the ID electrodes distribution on Kapton (Figure 3a). Experimental results showed that an extremely low equivalent magnetic noise of 5.1 pT/ at 1 Hz was obtained (Figure 3b) [33].
The problem in 2-1 type ME composites based on multi-push-pull working mode is the difficulty to fully polarize the piezoelectric phase and the capacitance in this configuration is usually small. In 2012, Li et al. further pointed out that the equivalent magnetic noise could be reduced by a factor of through stacking some number N of ME sensor units in parallel [32]. From the perspective of reducing the total noise level , connecting N ME sensor units in series could be also effective to increase the detection capability. For example, Fang et al. reported a 2-1 ME sensor based on multi-L-T mode, of which the schematic is shown in Figure 4a,b [55]. In this case, the ME charge coefficient could be kept at a high level while the static capacitance and the leakage current could be decreased remarkably by increasing the number (N) of piezoelectric crystal. As a result, the measured equivalent magnetic noise (EMN) of the Metglas/Mn-PMNT composite was as low as 0.87 pT/ at 30 Hz for N = 7, which was 1.8 times lower than that for N = 1 (see Figure 4c,d) [55].
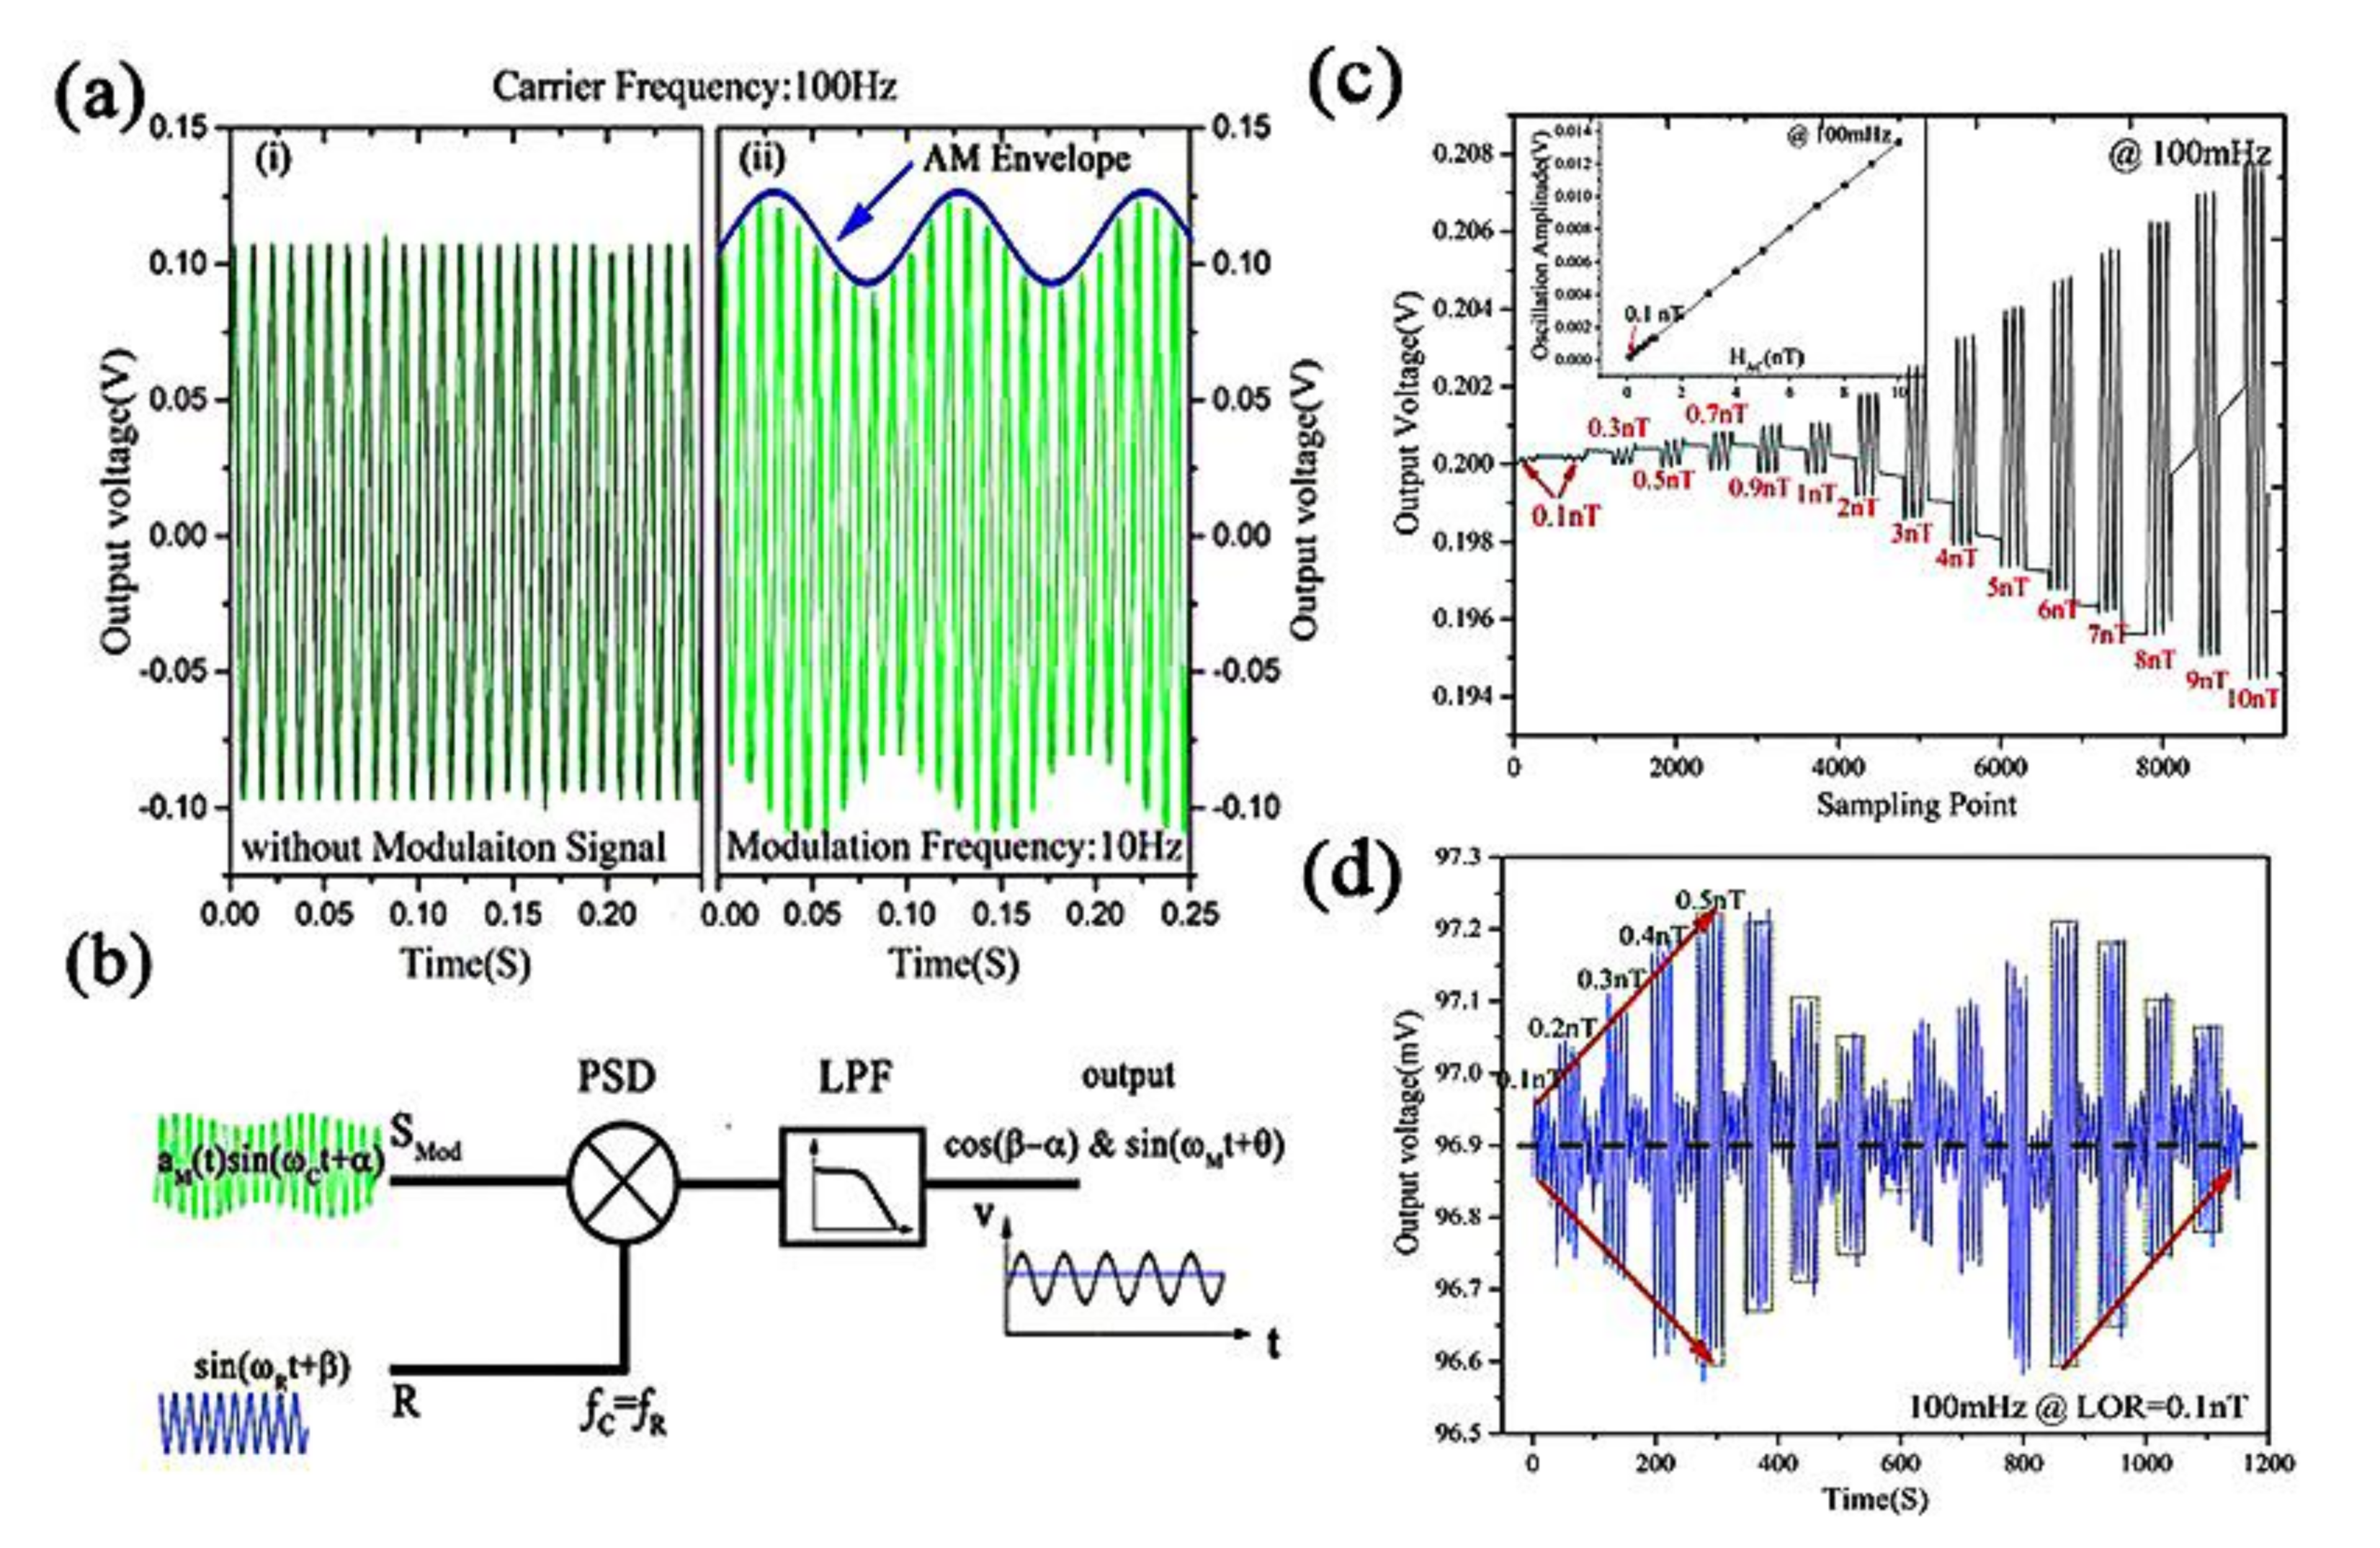
In 2011, frequency conversion technology (FCT) was proposed to circumvent the large 1/f noise for active ME sensors [56,57,58,59,60]. Quasi-static or extremely-low frequency magnetic fields can be effectively detected in this case. For example, Chu et al. realized a limit of detection of 33 pT/ at 0.1 Hz by using amplitude modulation method combined with FCT in 1-1 type magnetoelectric composites [61]. During the measurement, a carrier signal and a modulation signal were both applied to the ME sensor.
Figure 5a,b demonstrates the fundamental modulation phenomenon and the block diagram of the correlation detection scheme with respect to an amplitude modulation signal SMod (t). The output voltage waveform was observed by a mixed signal oscilloscope. The ME sensor was driven by 100 Hz carrier signal and the modulation frequency is 10 Hz. Once the low-frequency modulation field HAC with an intensity of 10−6 T was applied, a clear amplitude modulation (envelope) signal was generated due to the intrinsic frequency mixing characteristic in ME sensors, as shown in Figure 5a(ii).
In order to test the limit of detection by using this amplitude modulation method, the time constant decreased to 10 ms and the demodulated signal from time domain waveform via a lock-in amplifier was analyzed. Figure 5c shows the measured output voltage in response to an applied 100 mHz HAC varying from 0.1 to 10 nT. Clearly, a standard linear-response to HAC within this range was obtained as given in the inset in Figure 5c. Accordingly, the limit of resolution (LOR) of the ME sensor based on this amplitude modulation method was determined to be as low as 100 pT. To confirm this LOR, Figure 5d further verified it by measurement. Considering an equivalent noise bandwidth (ENBW)of 7.8 Hz corresponding to the given measurement system, the calculated LoD was then calculated as 33 pT/ at 0.1 Hz.
3.2. Resonant-Frequency Magnetic Sensor
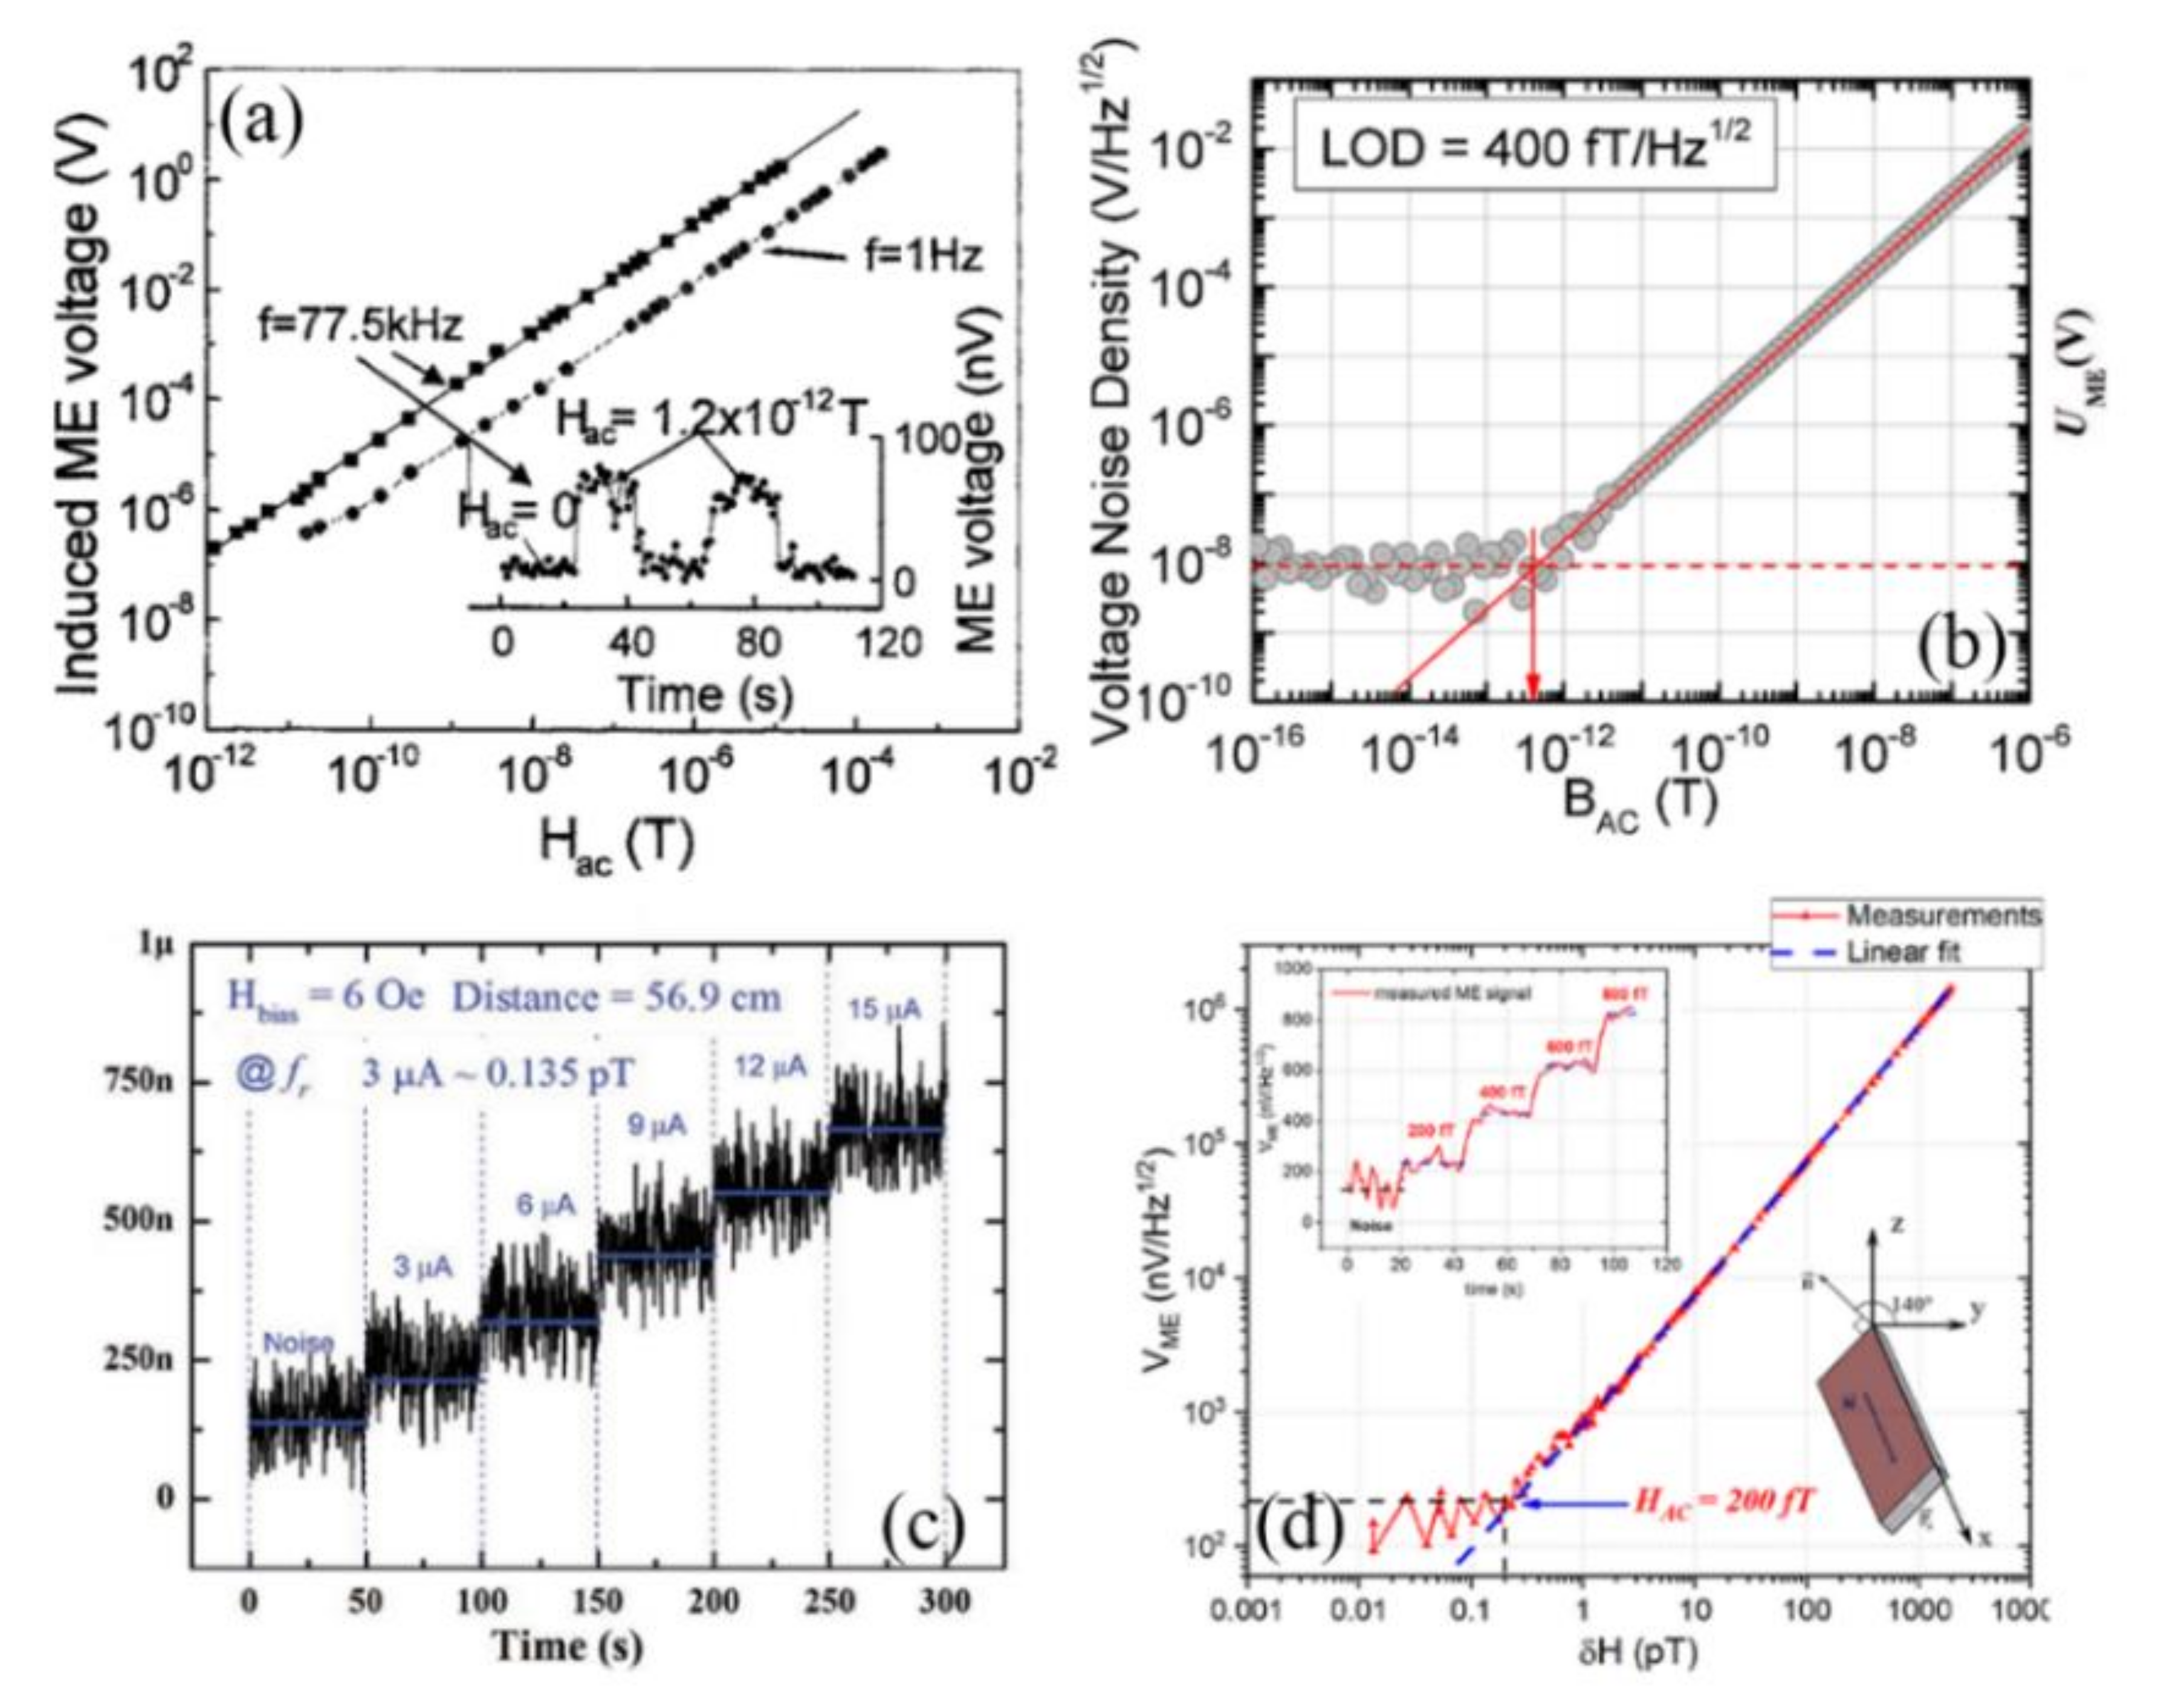
ME laminates can be viewed as resonators from the perspective of mechanics and resonant phenomenon is also able to enhance the ME coupling coefficient and thus to improve the detection ability [10]. In this regard, ME sensors could be highly competitive over other magnetic field sensors, e.g., fluxgate sensor and optical pump magnetometer. Using a 2-2 ME composite, Dong et al. reported an enhanced LoR of 1.2 pT early in 2005 (see Figure 6a) [29]. As for MEMS ME magnetic sensor, Yarar et al. developed a low temperature deposition route of very high quality AlN film, allowing the reversal process flow as talked in Section 2.2. Correspondingly, the LoD was enhanced by almost an order of magnitude approaching 400 fT/Hz1/2 at the electromechanical resonance, as shown in Figure 6b [47]. Based on the giant resonance ME coupling coefficient in 1-1 type ME laminate, a superhigh resonant magnetic-field sensitivity close to be 135 fT (see Figure 6c) was further obtained by Chu et al. [8], which indicates great potential for 1-1 type ME composites in the field of eddy current sensing, space magnetic sensing and active magnetic localizing [8,62]. In 2018 Turutin et al. reported a new ME composite consisting of the y + 140° cut congruent lithium niobate piezoelectric plates with an antiparallel polarized “head-to-head” bidomain structure and magnetostrictive material Metglas [48]. Based on this 2-2 ME bimorph, the equivalent magnetic noise spectral density was only 92 fT/Hz1/2 and the directly measured resolution was found to be 200 fT at a bending resonance frequency of 6862 Hz (see Figure 6d), but one should note that the bandwidth of resonant ME sensors is normally below 1 kHz due to the high mechanical quality factor, which is a major limitation facing practical engineering applications [8,48,63]. It should however be noted that resonant ME sensors are greatly limited by the narrow bandwidth and specifically suited applications need to be considered.
3.3. DC Magnetic Sensor
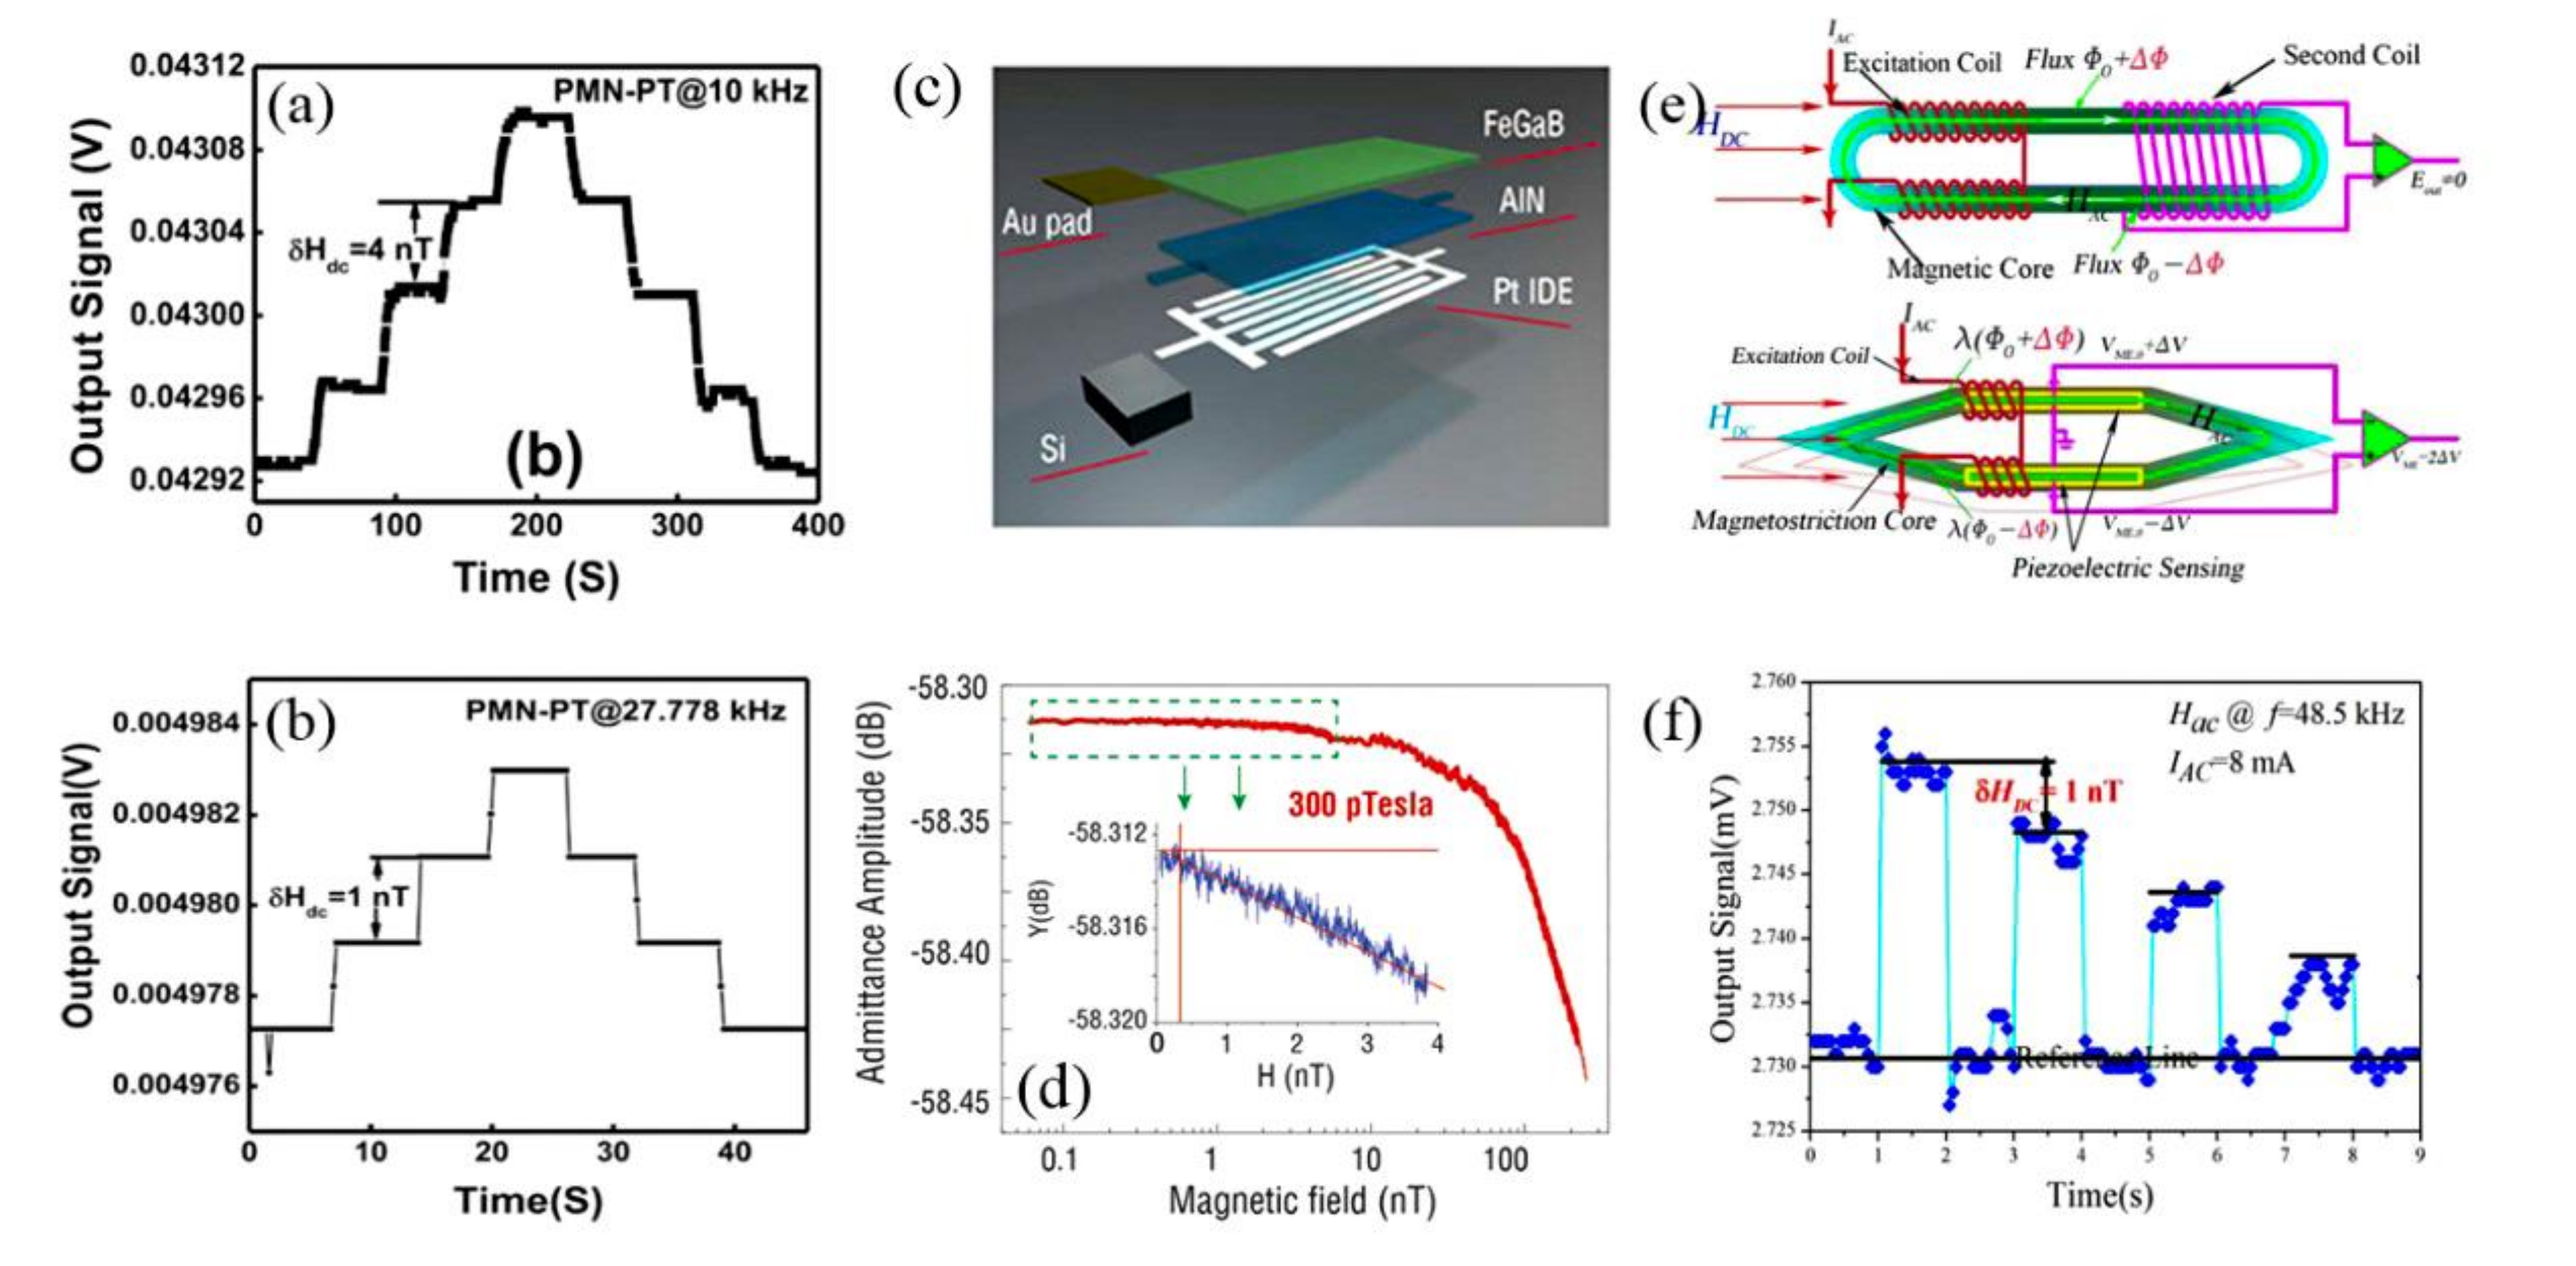
DC or quasi-static magnetic sensors are promising for magnetic anomaly detection uses, such as geomagnetic navigation, metal detection and magnetic medical diagnosis, etc. Early in 2011, Gao et al. demonstrated the excellent detection ability for DC field using 2-1 ME composite [31]. As shown in Figure 7a,b, the magnetic resolution was found to be 4 nT and 1 nT when driving the composite at non-resonant frequency and resonance frequency, respectively [31]. In 2013, Nan et al. reported a self-biased 215 MHz magnetoelectric NEMS resonator consisting of an AlN/(FeGaB/Al2O3) multilayered heterostructure (Figure 7c), for ultra-sensitive DC magnetic field detection [51]. An ultra-sensitive detection level starting from 300 picoTesla was obtained experimentally (Figure 7d) [51]. The RF NEMS magnetoelectric sensor is compact, power efficient and readily integrated with CMOS technology, however, the measurement of the resonance frequency and the admittance spectrum is not technologically convenient. Li et al. then further proposed to monitor the reflected output voltage from the ME resonator directly [26]. The optimized detection sensitivity was determined as 2.8 Hz/nT for AlN/FeGaB resonator. An ultra-high frequency (UHF) lock-in amplifier and a directional coupler were used to apply and test the RF signal of this resonator. And the final limit of detection was measured to be around 0.8 nT.
Using the nonlinear resonance magnetoelectric effect in ME composites, Burdin et al. fabricated a planar langatate-Metglas structure and employed the third harmonics of the output signal to measure the DC magnetic field as low as 10 nT [65]. In addition, a broad dynamic range from ~10 nT to about 0.4 mT was also successfully obtained using the nonlinear ME effect [66]. More recently, Chu et al. proposed a shuttle-shaped, non-biased magnetoelectric flux gate sensor (MEFGS) for DC magnetic field sensing enlightened by the design of conventional flux gate sensor [64]. Figure 7e shows both the schematic of typical flux gate senor and the proposed magnetoelectric flux gate sensor. The flux gate sensor based on Faraday’s Law of Induction is composed of a racetrack type magnetic core surrounded by an excitation (first) coil and a detection (second) coil. With respect to MEFGS, a similar differential structure, which can produce a longitudinal-bending vibration when applying a DC field, can reject in-phase vibration noise and enhance the out-of-phase ME voltage signal simultaneously [54]. We note here that in [54] the authors found that a ME flux gate sensor excited under a non-resonant high frequency field could perform better detection ability. As shown in Figure 7f, the relative change of the ME voltage output signal in response to a LOD of 1 nT is around 0.2% and the output signal can return to the reference level during the repeated test cycles when choosing a non-resonant frequency of 48.5 kHz [64].
Performance summary of some typical magnetoelectric sensors was given in Table 2. Table 3 further compares the LoD of passive ME sensors with some commercially available magnetometers, i.e., magnetoresistive sensors, giant magneto-impedance sensors, fluxgate sensors, optically pumped magnetometers and SQUID magnetometers. As it can be seen in Table 3, ME sensor shows comparable and competitive performance with these products. Specifically, the low power consumption and high detection ability are significant advantages for ME sensors, while vibration interference still now greatly limits the engineering applications. On the other hand, piezoelectric materials are normally susceptible to the working temperature and the temperature stability of ME sensors is also a critical issue. For example, Burdin et al. compared the temperature dependence of the resonant magnetoelectric effect in several kinds of ME composites and showed that the widely studied PZT-Metglas ME sensor can only work in a narrow temperature range of 0 °C to +50 °C [67].
4. Engineering Applications of ME Sensors
As we summarized in Table 2 and Table 3, ME sensors show competitive performance with commercial optically pumped magnetometers, giant magneto-impedance sensors and fluxgate magnetometers. In this regard, a large number of works that utilize ME sensors for magnetic field sensing have been published and various applications have been implemented. In this section, we will overview current advances in sensing applications of ME sensors.
4.1. Magnetic Target Detection and Localization
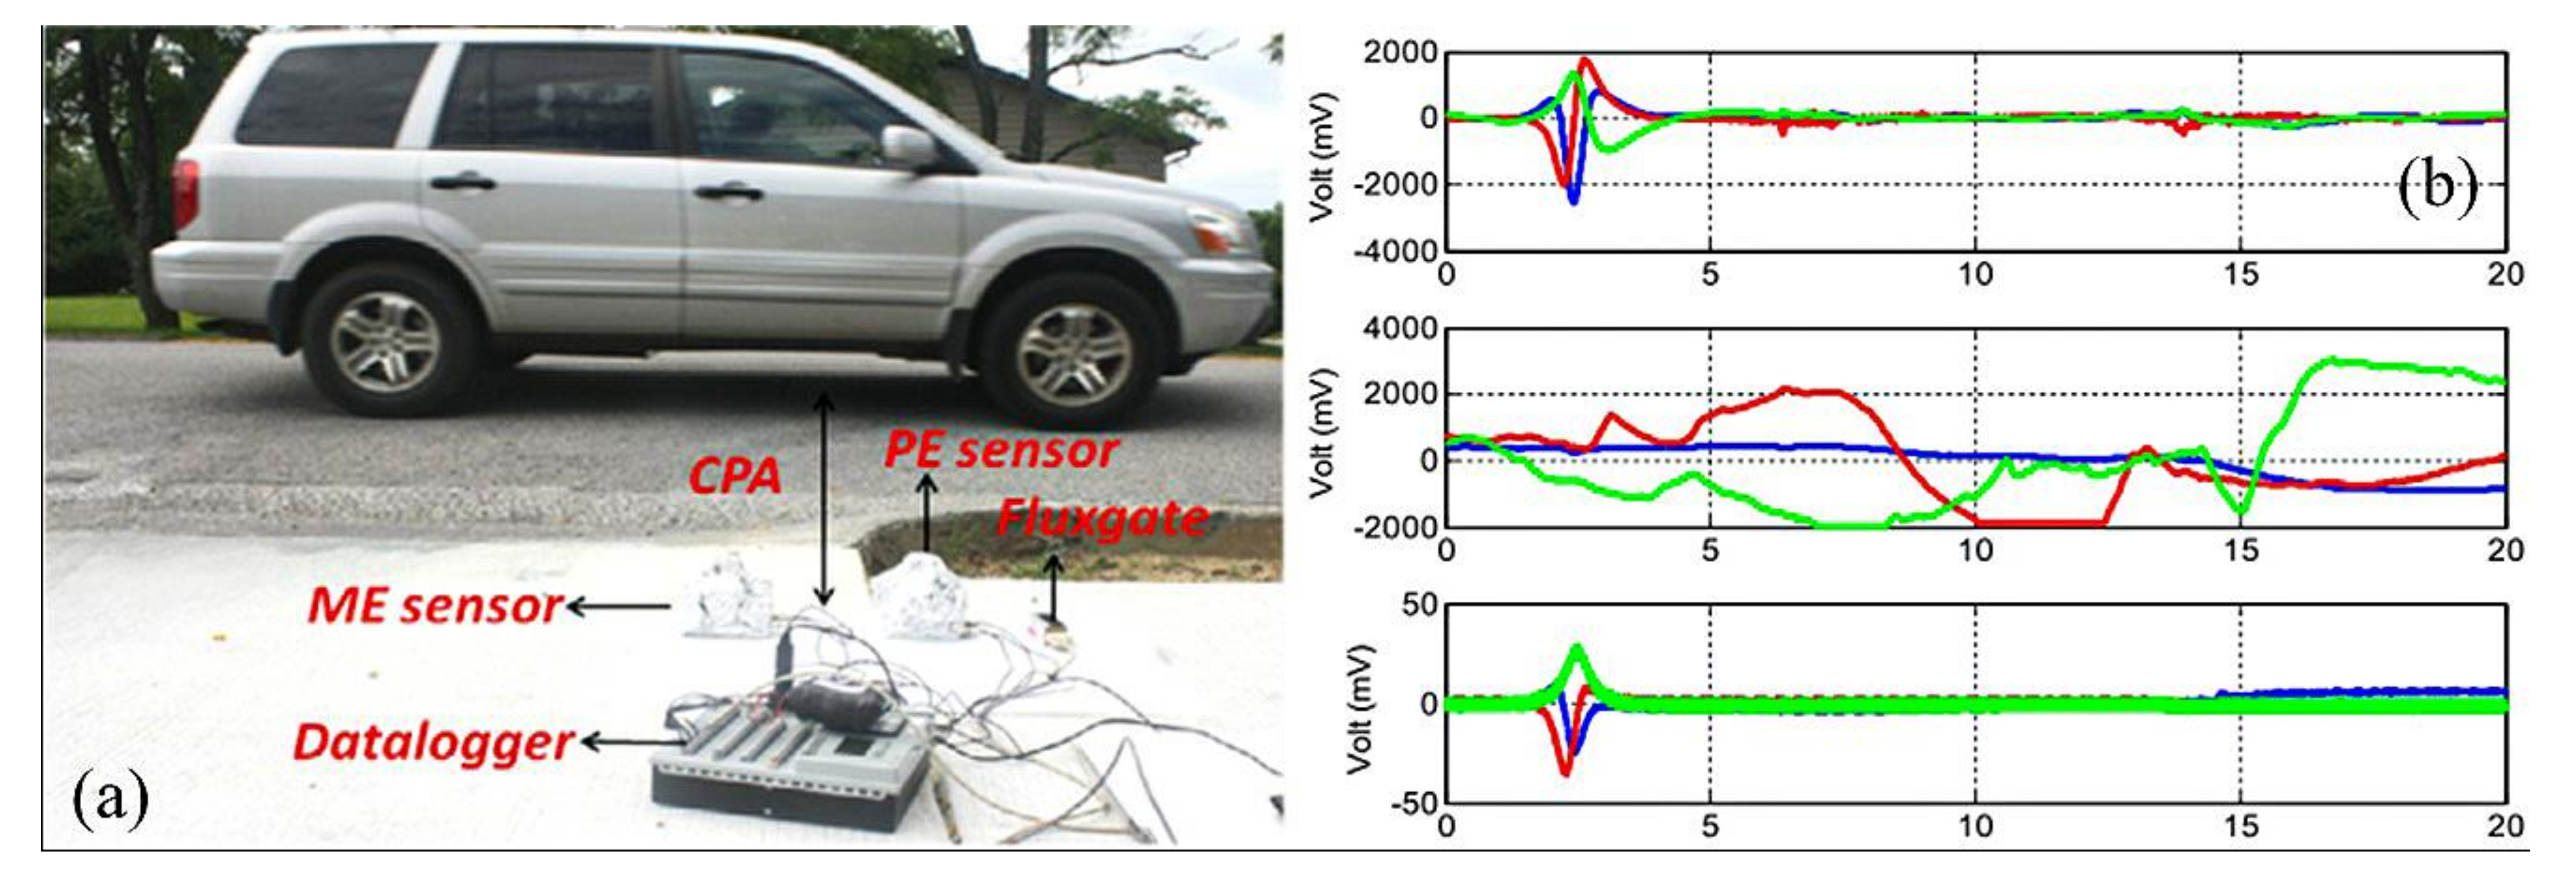
A metallic material can be magnetized by the geomagnetic field along each of its three orthogonal directions, which in turn generates three magnetic signature vectors. In 2012, Shen et al. proposed a triple-axis magnetic anomaly detection system based on Metglas/Pb(Zr,Ti)O3/Metglas ME sensors. To compare the performance of ME sensor with widely used fluxgate sensor, they placed a tri-axial ME sensor, a tri-axial piezoelectric sensor (PE) and a fluxgate sensor on the ground in a line with the same closest path approach (CPA) as shown in Figure 8a. The obtained signals are given in Figure 8b. It can be seen there was little vibration or acoustic contribution to the tri-axial ME sensor at 2.5 s, and the response amplitude of ME sensor was obviously higher than that of the fluxgate sensor [69]. Then, they also modeled the magnetic field of metallic objects as a magnetic dipole and designed a ME sensor array to analyze the magnetic signature. The orientation and velocity of target were presented in the form of a characteristic magnetic waveform, which provided the basis for magnetic anomaly detection and identification [70].
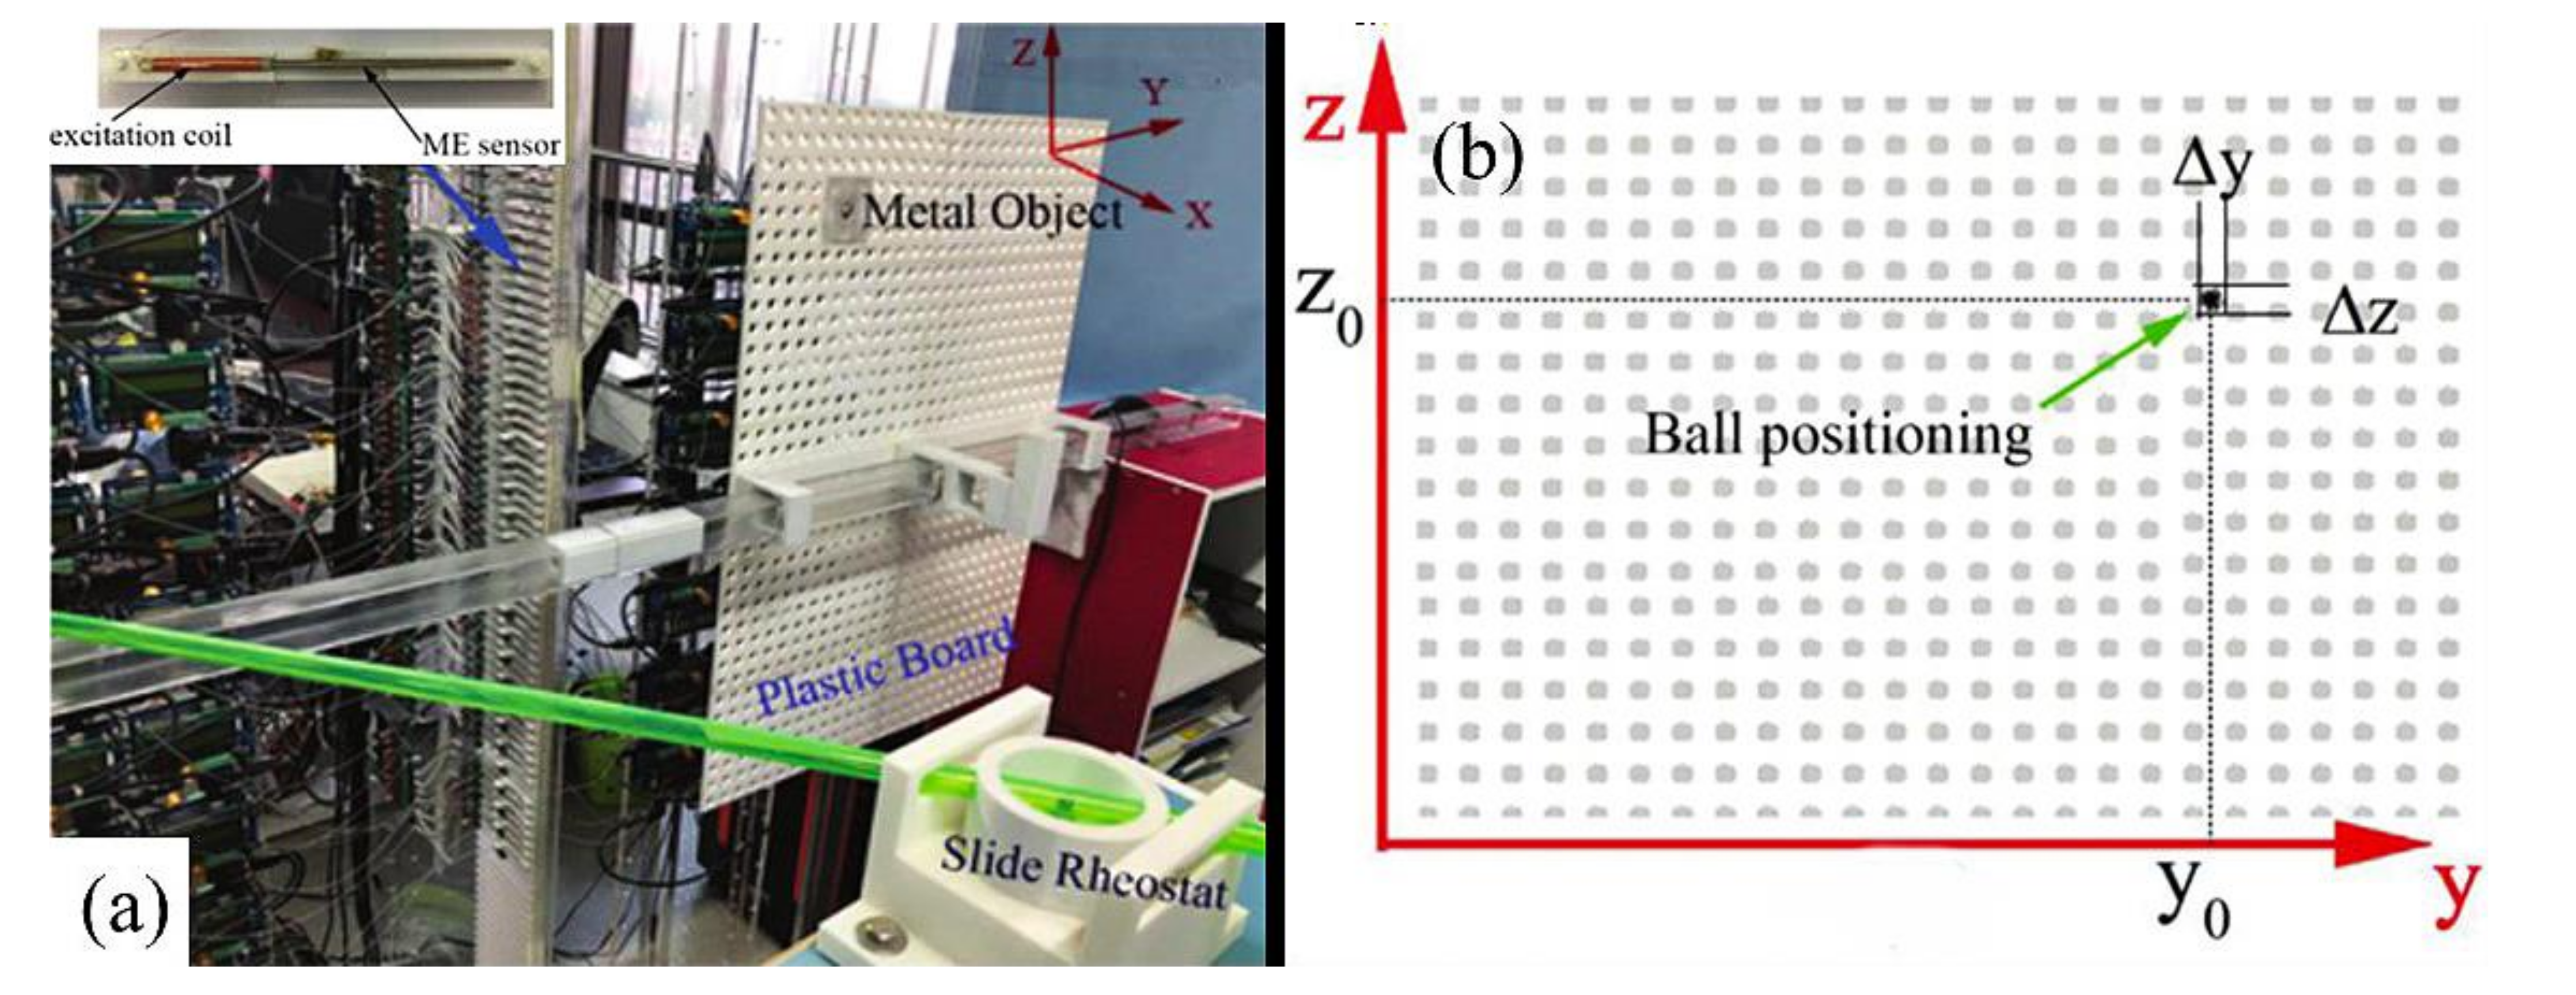
With respect to magnetic object localization, Xu et al. constructed a magnetic gradient meter consisting of eight measuring points using 2-1 type ME sensors to locate the magnetic source in a 3-D cube [71]. Their experimentally obtained data that successfully yielded 3-D vector outputs representing the distribution of the magnetic flux lines of the tested source placed in the center of the cube. Based on a 1-1 type ME sensor, Chu et al. also proposed a 2-D magnetic positioning and sketching system consisting of a 1-D ME sensor array as shown in Figure 9a. Experimental results concerning the positioning of an iron ball with a diameter of 5 mm are given in Figure 9b. The localization error was roughly estimated as 2.4 cm in a scanning area of 70 cm (in length) × 50 cm (in height). In addition, the posture and the length-diameter ratio of a metal bar could be also successfully recognized via the system [72].
4.2. Geomagnetic Field Sensing
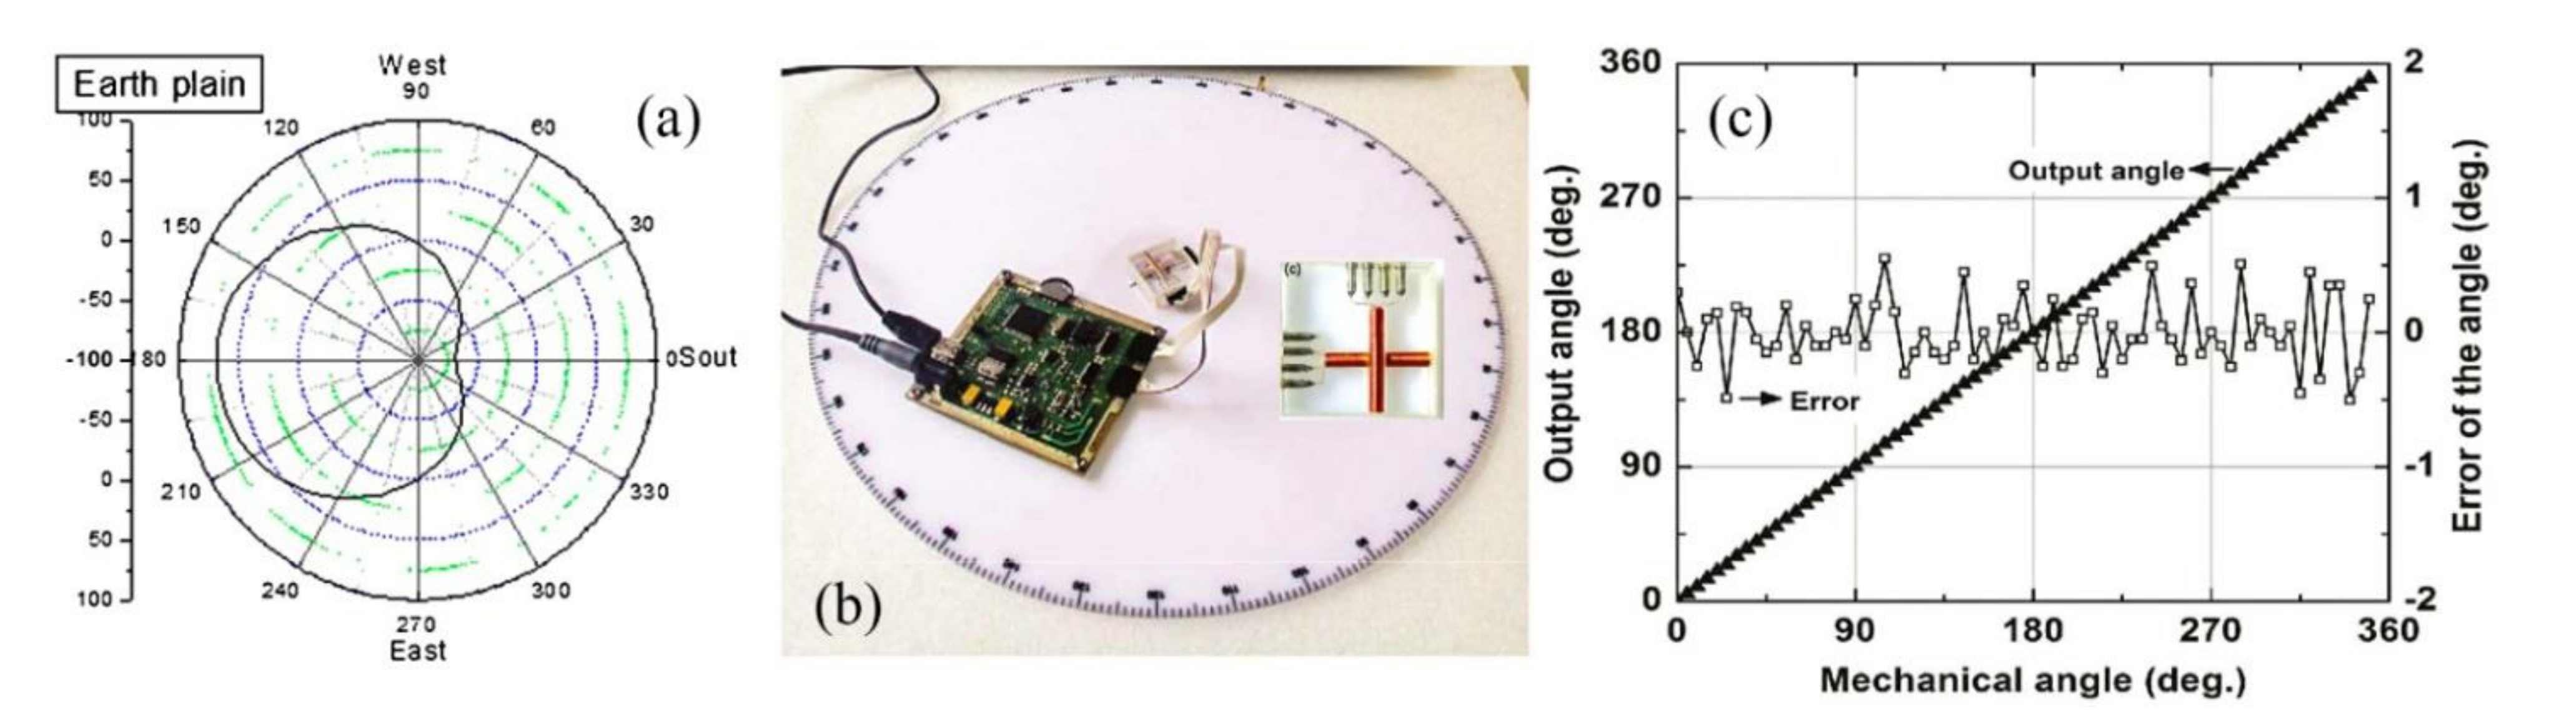
When it comes to applications, e.g., vehicle detection, maritime navigation and aeronautical magnetic exploration, it is necessary to obtain the orientation of a DC (or AC) magnetic field. In 2007, Zhai et al. measured the value of both the Earth’s magnetic field and its inclination based on Metglas/piezoelectric-fiber ME laminates [73]. This ME sensor was working under an active mode without any bias field and it was found that DC magnetic field variations of less than 10−9 T and angular inclinations of less than 10−5 deg can be detected. The voltage output measured when the ME sensor was rotated in the Earth’s plane is shown in Figure 10. It could be clearly seen that the maximum voltage output could reach −100 mV when the sensitive direction of the ME sensor was oriented along the geomagnetic field in the Earth’s plane, but when the sensor was oriented along the east and west directions in this plane, its output was essentially 0 mV, implying a high single-axis directivity and the potential application in geomagnetic navigation.
In 2013, Duc et al. presented an integrated two-dimensional geomagnetic device which consisted of two one-dimensional magnetoelectric sensors arranged in an orthogonal direction. They also finished the circuit design and hardware implementation (Figure 10b). The obtained accuracy of angle measurement reached as low as ±0.5° (Figure 10c) and the spatial angles can be automatically computed while rotating the sensor module [74].
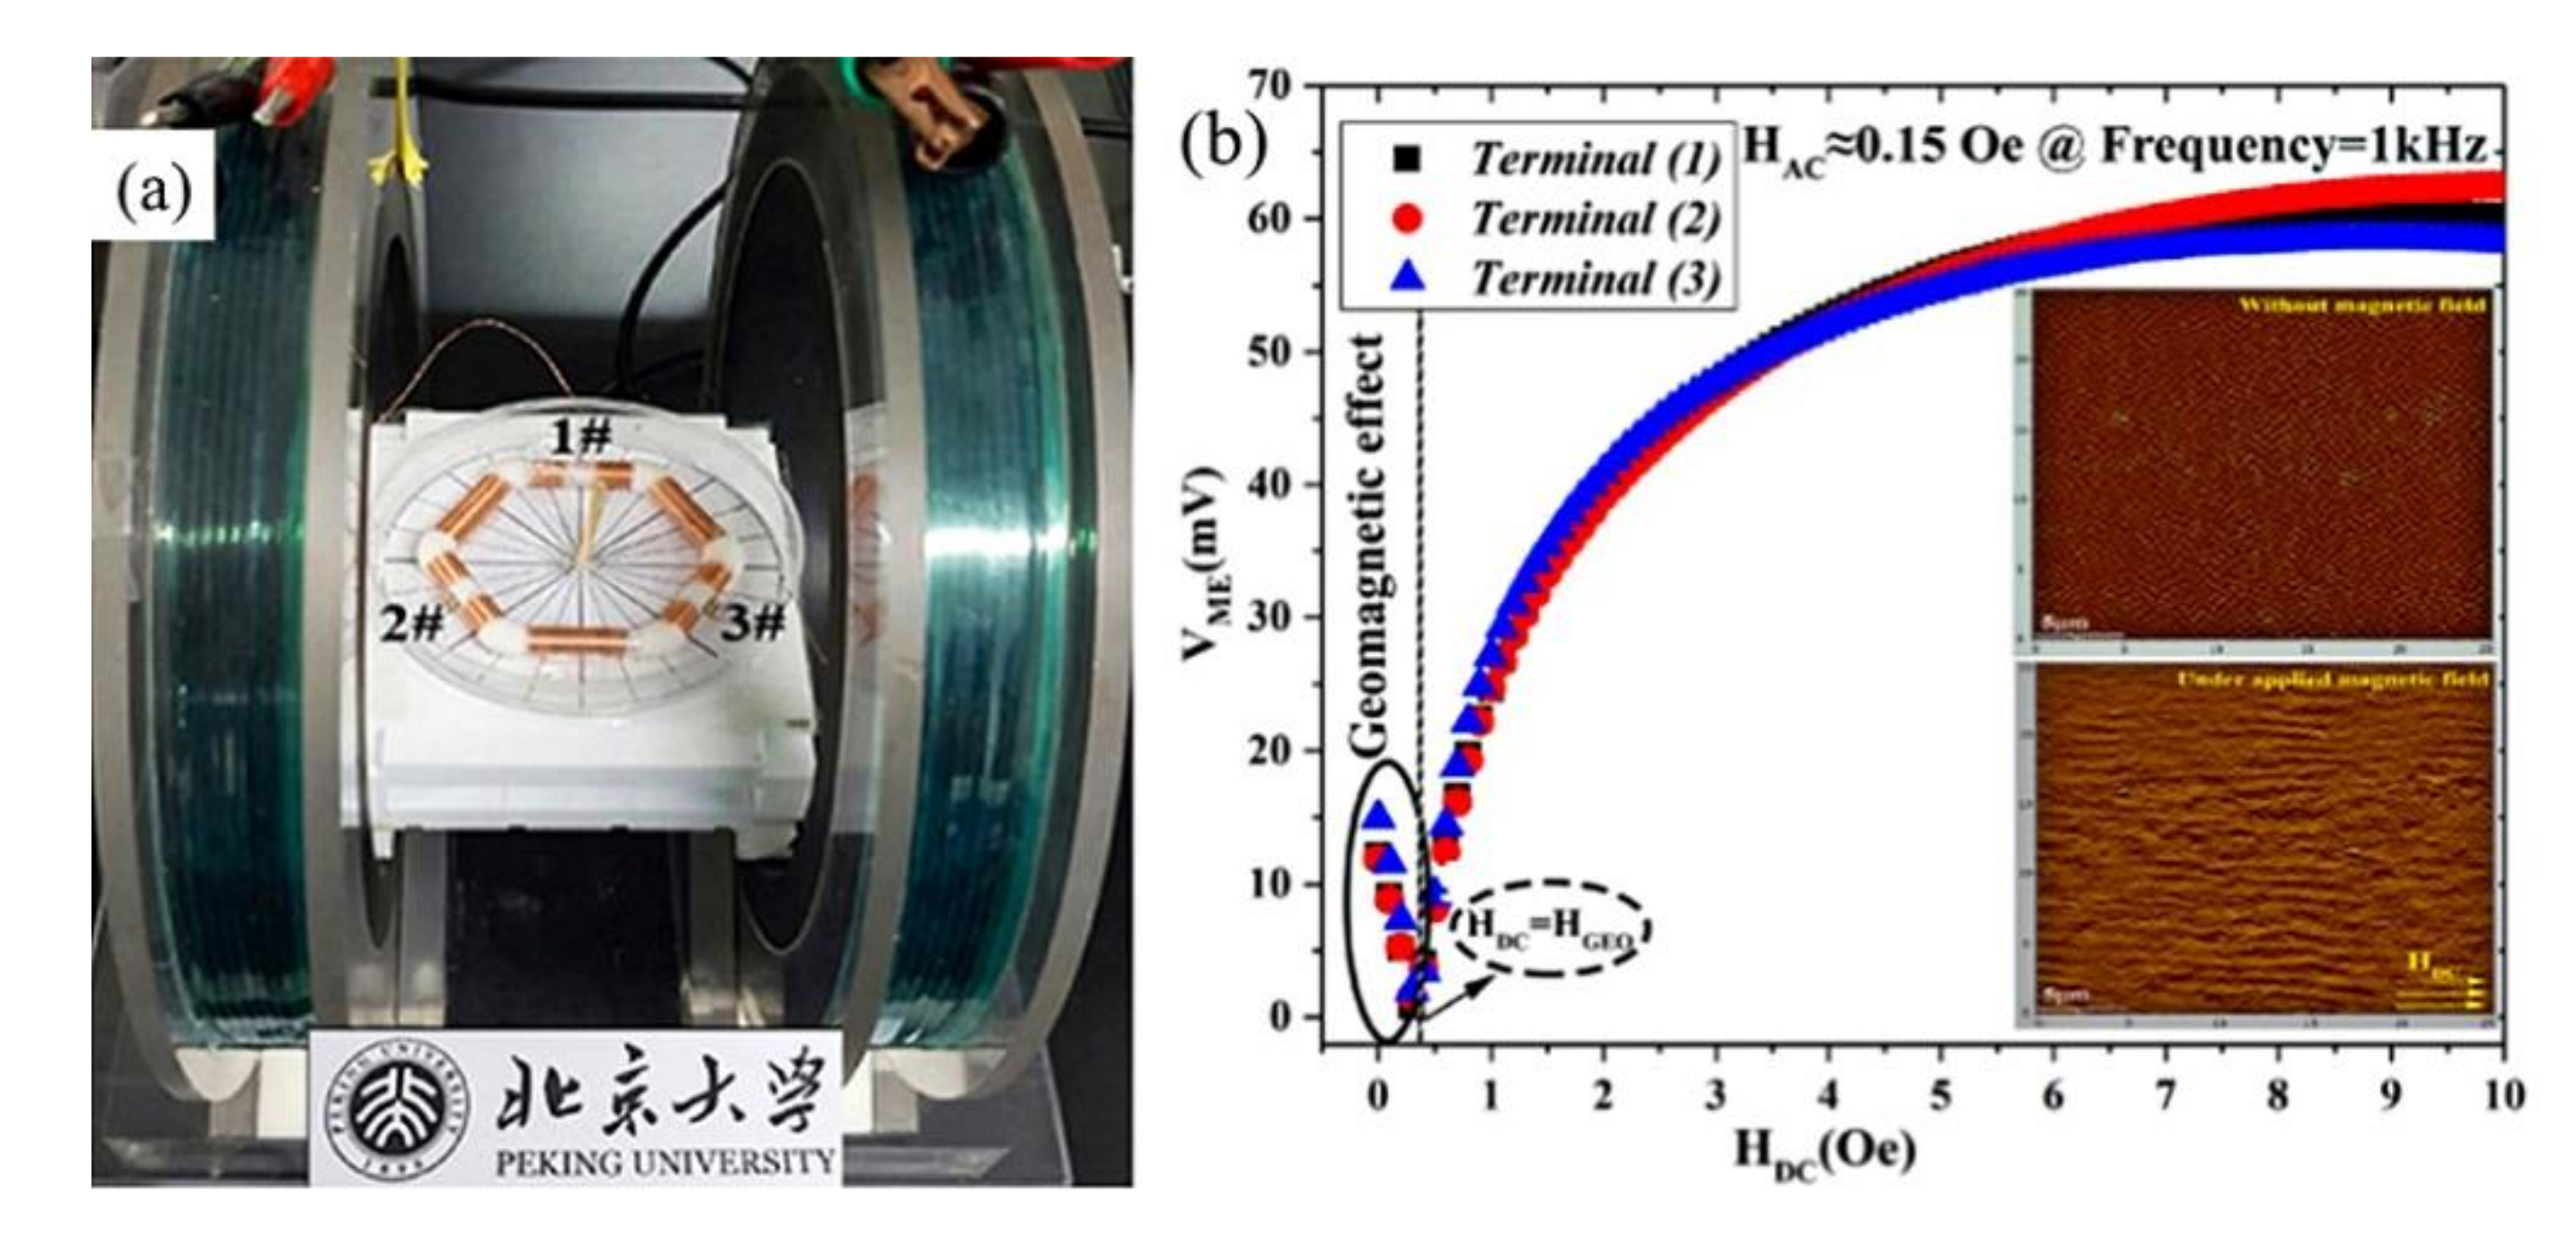
In 2018, Pourhosseini et al. presented a multi-terminal hexagonal-framed magnetoelectric composite (HFMEC) to realize the same goal as mentioned above. The hexagonal-framed ME composite (HFMEC) was fabricated by using three thickness poled [011]-oriented PMN-PT single crystal fibers (Pb(Mg1/3Nb2/3)O3-PbTiO3) sandwiched between two hexagonal-framed FeBSi alloys (Metglas).
According to the threefold symmetric ME voltage responses of the HFMEC, a valid formula for calculating the angular direction of the magnetic field was given and a high angular resolution of about 0.1° was experimentally verified. In addition, the obtained “V” shape as shown in Figure 11b in the output signal could also be used to determine the absolute geomagnetic field intensity [75].
4.3. Current Sensing and Non-Destructive Detection
With respect to power grids and chips monitoring and protection, current detection is urgently needed. Based on Ampere’s law, non-contact measurement is usually achieved by magnetic sensors, such as current transformers (CTs), Hall devices, SQUIDs, and magnetoresistance elements. However, CTs and Hall devices are limited by low sensitivity and narrow dynamic range; SQUIDs must work at extremely low temperatures and the inherent 1/f noise also restricts the magnetoresistance elements’ sensitivity [76]. In this case, researchers tried to achieve high-sensitivity current detection by using ME sensors. For example, Dong et al. first proposed a ME current sensor based on a ring-type ME composite consisting of a Pb(Zr,Ti)O3 core laminated between two Terfenol-D layers and operated in a circumferentially magnetized and circumferentially polarized mode, which featured a stable frequency response ranging from 0.5 Hz to 2 kHz [77]. However, it was difficult to apply the magnetic bias along its easily magnetized axes with respect to a ring type Terfenol-D and it was highly desired to design a self-biased ME current sensor. Then Zhang et al. further proposed to construct a Fe73.5Cu1Nb3Si13.5B9 air-gapped high-permeability flux concentrator to enhanced the ME response of SmFe2/PZT/SmFe2 self-biased magnetoelectric (ME) laminate as shown in Figure 12a. In Figure 12b, they compared the detection ability at 119.75 kHz (resonance) and 1kHz (off-resonance), respectively. A linear output response was obtained for both cases, and the output sensitivity measured at resonance was roughly one order of magnitude higher [78].
Oil and natural gas pipelines are normally buried underground or distributed under the sea, and are thus susceptible to corrosion and pressure damage. The eddy current testing (ECT) technology is widely to monitor the working status of those pipelines [79]. In 2021, Chu et al. constructed an ECT probe, by integrating the exciting coil and a 1-1 type ME sensor. During the experiment, they set the lift-off distance to 3 mm. Figure 12a shows the measurement result for an aluminum pipeline with a 10 × 1 × 1 mm3 crack placed in the center. The scanning signal displayed an obvious response to this crack. In order to further compare the crack detection and localization performance, authors also separately tested an aluminum pipeline and a steel pipeline both with a one-dimensionally distributed cracks labelled 1# and 2#, respectively. Specific response to different cracks was obviously obtained and the location was also identified for both two cases as shown in Figure 12d. It should be noted here the power consumption of ME ECT probe was only 0.625 μW, which represents a 2–3 orders of magnitude improvement compared with magnetoresistive (MR) sensors and represented a crucial step towards online low-power monitoring of pipeline cracks [80].
4.4. Velocity and Displacement Sensing
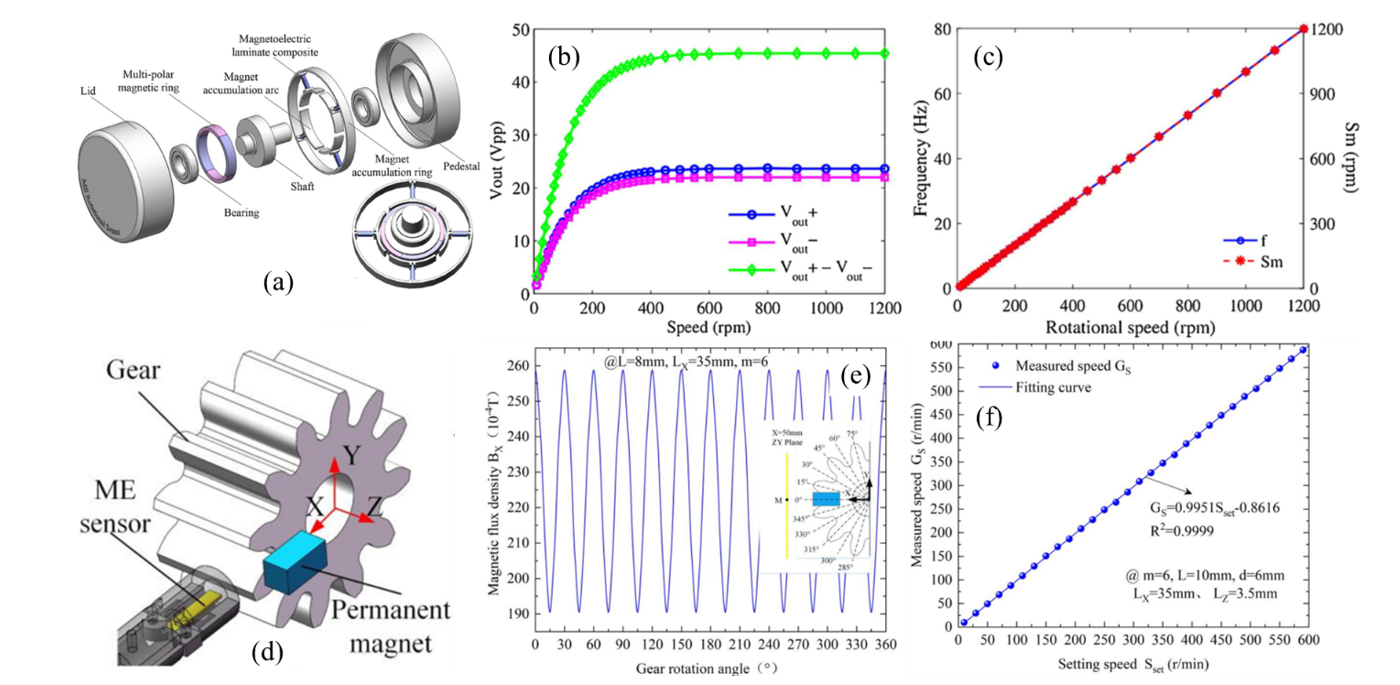
It is of great significance to monitor the position and speed of crankshafts in the field of industrial automation. In 2018, Wu et al. fabricated an angle speed sensor based on a ME sensor, which consisted of four PZT/FeGa/PZT magnetoelectric (ME) laminate composites, a closed magnetic circuit composed by a magnetic accumulation (MA) ring and four magnetic accumulation arcs with magnetostrictive layer embedded into the U-shaped slots, a multi-polar magnetic ring (MPMR), and a holder composed of a shaft and shells as shown in Figure 13a. The rotating shaft drove the MPMR, which applied alternating magnetic field to ME sensor. As the speed enlarged, the output voltage increased at first, and then reached to stable values, as shown in Figure 13b. In addition, the measured frequency of the generated alternating magnetic field presented a linear response as a function of the rotation speed, as given in Figure 13c. The authors accordingly concluded the sensor could distinguish a small step-change rotational angle of 0.2° under a rotational speed of 120 r/min [81].
In 2021, Lu et al. found that during the rotation of the gear, the change of the permeability between the tooth and the air will disturb the magnetic field produced by the magnet, which can be used to measure the rotational speed of gear as well. The proposed system was composed of a ME sensor, a gear and a permanent magnet, as shown in Figure 13d, When the gear was rotating, the convex and concave teeth of the gear alternately passed, which generated alternating magnetic flux density. As shown in Figure 13e, the spatial magnetic field varied as the gear rotation angle changed. When the convex tooth was parallel to the permanent magnet, high permeability of gear led to large magnetic field at the position of ME sensor. On the contrary, the low permeability of air led to a small magnetic field. Then, they determined the best distance of three parts of the system in Figure 13d, and obtained the curve of measured speed (Gs) as a function of setting speed (Sset), as shown in Figure 13f [82].
Micro-displacement sensing is crucial for precise positioning applications, including micro-manufacturing and biological engineering. Without the obstruction of fringe effects occurred in capacitive sensors, and the limitations of complicated optical components required in optical sensors, the ME effect was recently proposed for micro displacement measurement. In 2021, Yang et al. fabricated a ME sensor based on Terfenol-D/PZT composites [83]. The change of displacement led to the change of air gap (), which brought variation to the magnetic field applied to Terfenol-D by the permanent magnet and thus enabled an ME voltage output. Then, they investigated the dynamic displacement amplitude and static position measurement performance of the prototype. The ME sensor achieved its highest sensitivity in the case of resonant excitation and the measured displacement resolution was less than 13.27 nm, which was comparable to and competitive with commercial laser displacement sensors [83]. A magnetic proximity sensor was also recently proposed by Pereira et al. based on the ME effect [84].
4.5. Stress and Strain Measurement
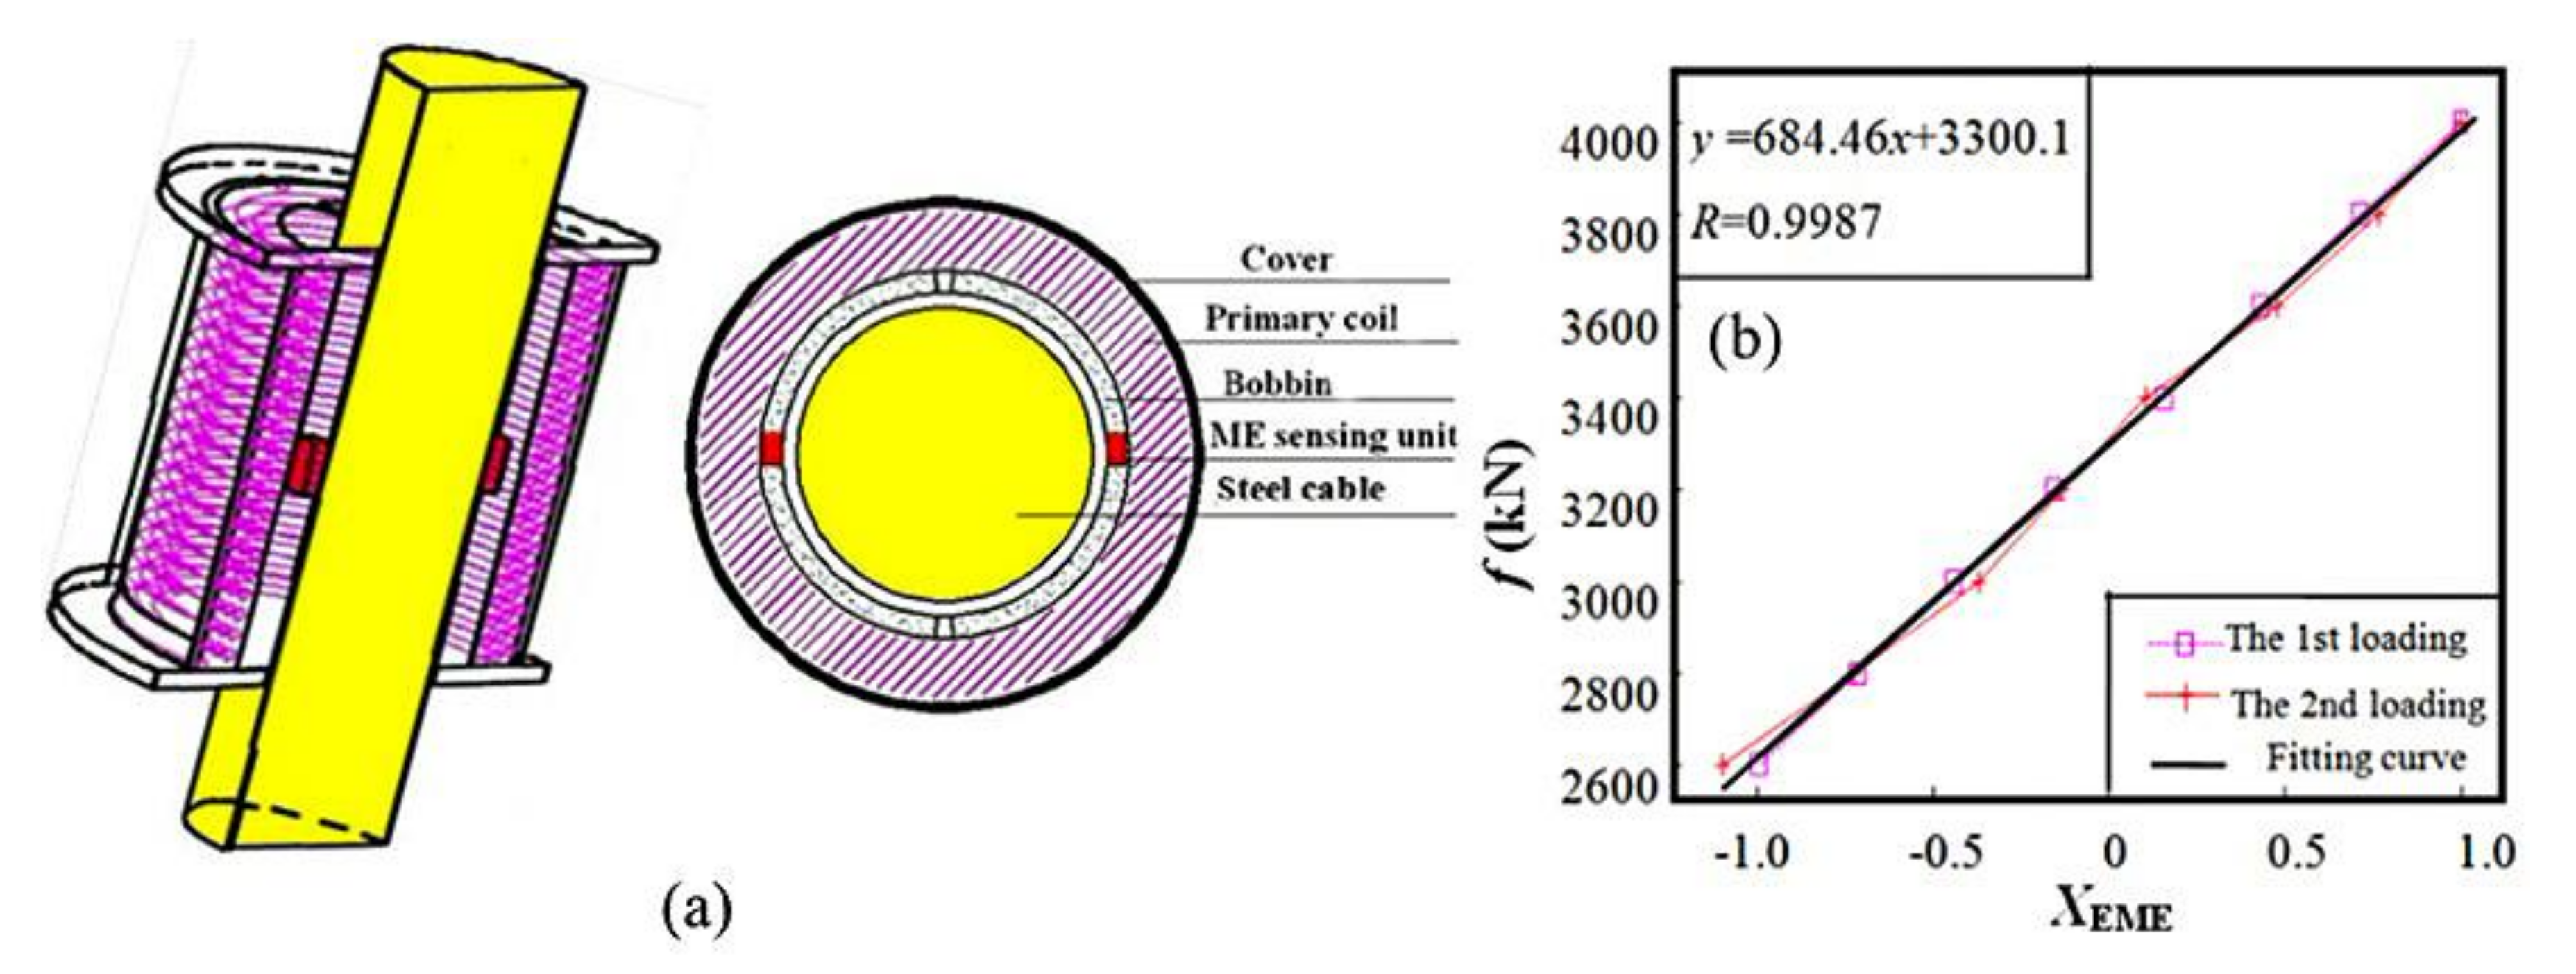
Strain measurement is essential for various applications, such as structural health monitoring and medical diagnosis. Steel cables are widely used in bridges, ships, mining and other engineering fields. It is very important to ensure the stress and structure integrity of steel cable. However, the real-time stress monitoring of steel cables is still a difficult problem. In 2014, Zhang et al. proposed an elasto-magneto-electric (EME) sensor based on the elasto-magnetic (EM) and magneto-electric (ME) effect, which has advantages of high sensitivity, fast response, and ease of installation compared with conventional detection devices [85]. With an exciting coil around the cable, the magnetic field generated by the current would magnetize the cable and the surrounding area. The stress on the cable would then change the magnetization strength of the cable, which led to the variation of the secondary field induced by the cable as shown in Figure 14a. Figure 14b shows their experimental results, where f was the load value under high stress as measured by the load cell, and XEME was the normalized result of the signal output of the EME sensor. It can be seen that a good linear relationship between the stress and the output signal was obtained [85].
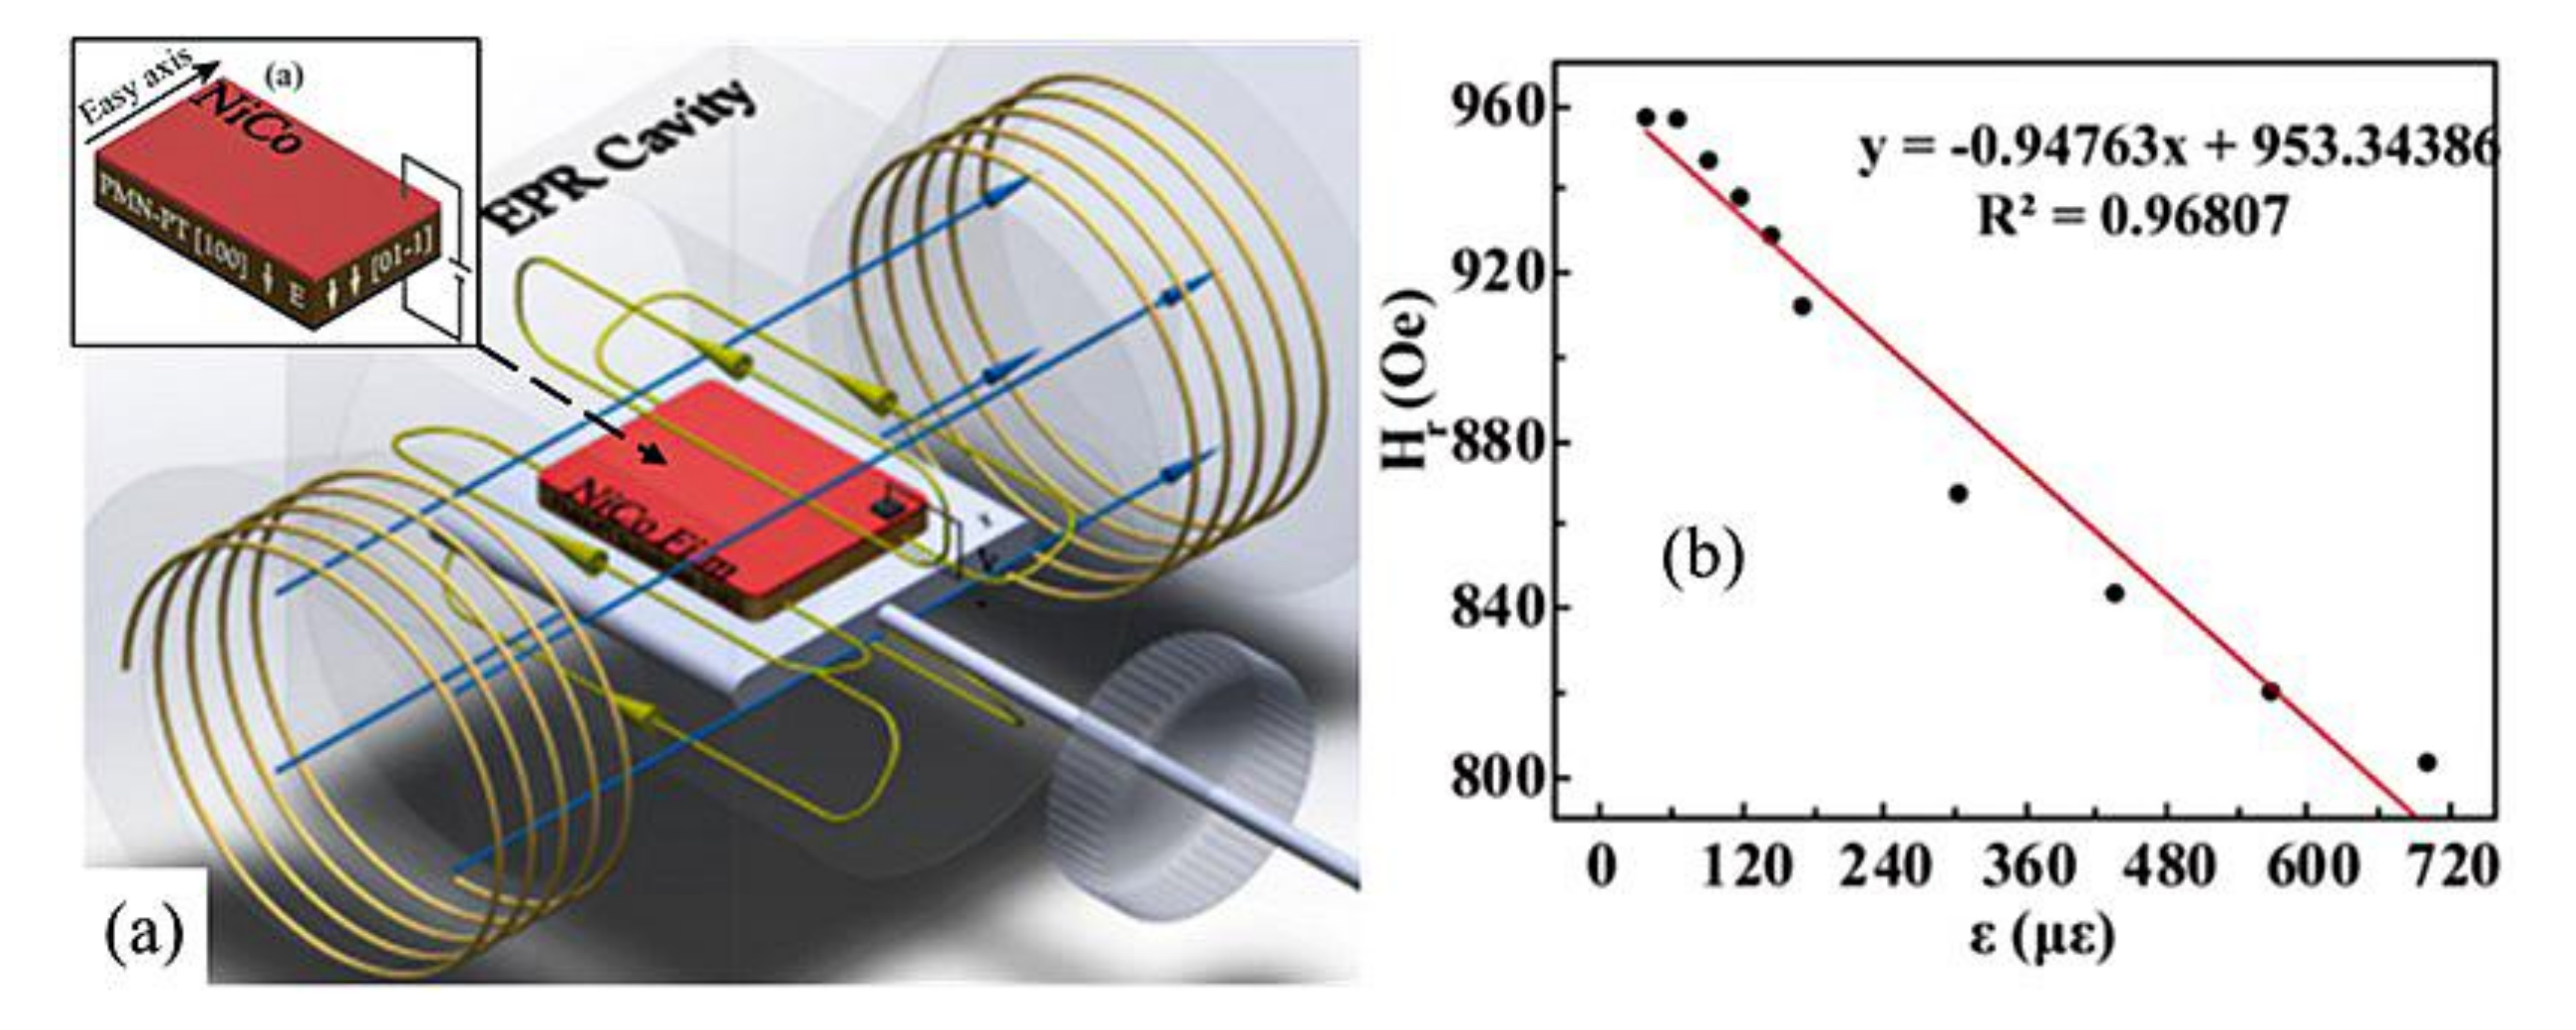
In 2020, Chen et al. fabricated a strain sensor based on ME heterostructures, the measurement setup of which was shown in Figure 15a [86]. The frequency shift of ferromagnetic resonance occurred in NiCo film by applying an elastic strain generated by piezoelectric single crystal PMN-PT was employed to detect the substrate’s strain status. When excited at 9.4 GHz, the resonant field Hr decreased from 956.65 Oe to 802.83 Oe with the strain ε increased from 0 με to 700 με, indicating a resonant frequency shift of about 430.7 MHz, as shown in Figure 15b. Accordingly, the calculated strain sensitivity S = (∆ f/f)/ε was determined as 65.46 ppm/με [86]. Considering the resolution of FMR spectra, the limit of detection of the wireless strain sensor was around 0.54 με, which was comparable with that of commercial metal-foil sensors that needed connection wires [86].
4.6. Biomagnetic Measurement
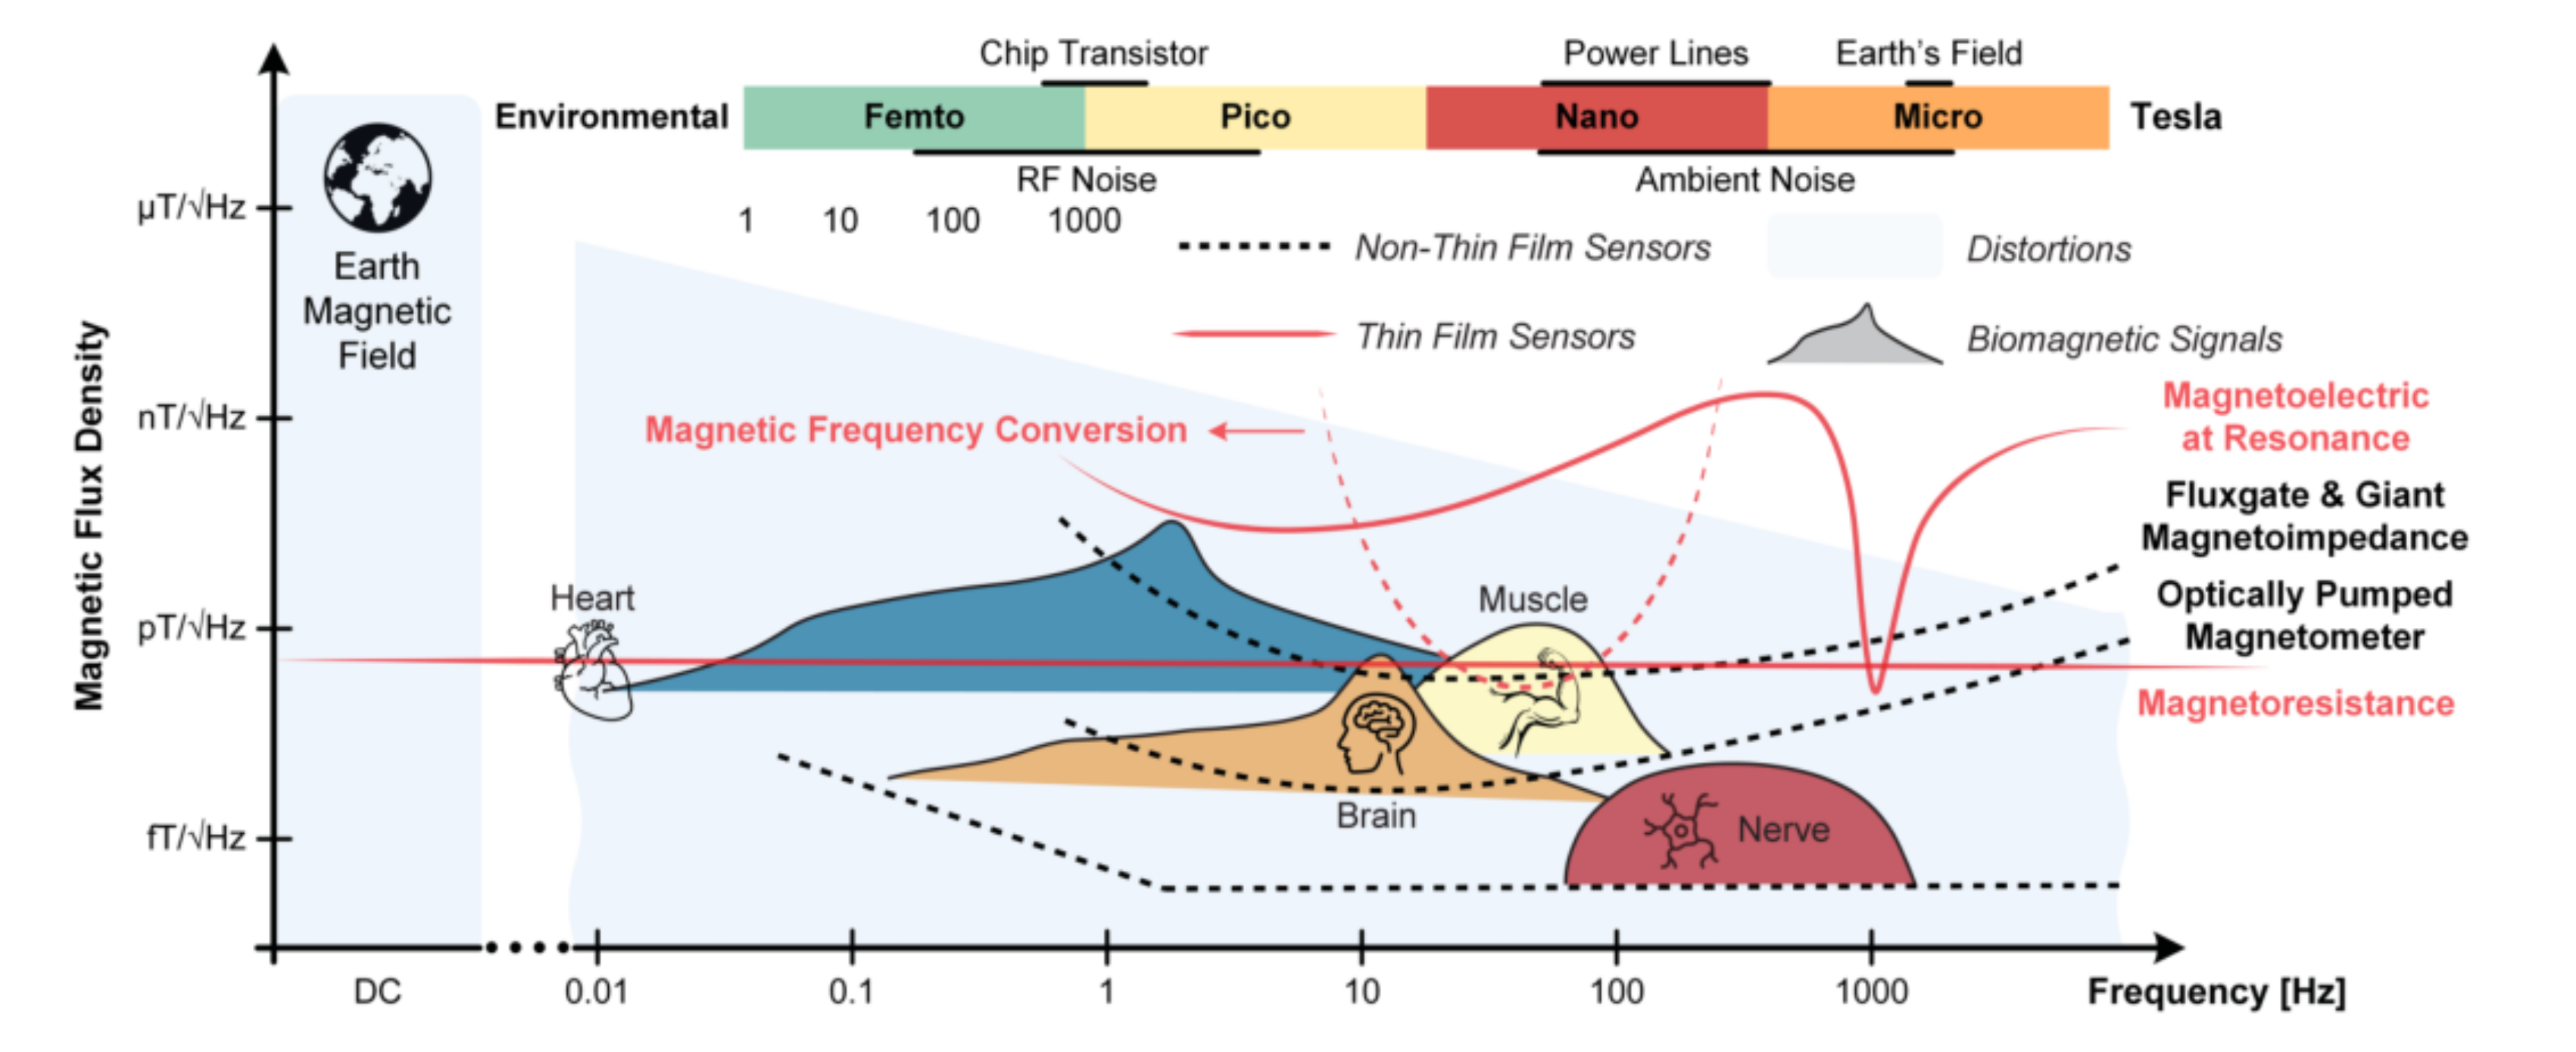
Contactless imaging or monitoring of biological entities by using the magnetic field components of biological currents, has become an emerging field of magnetoelectric sensors [87]. Room temperature working and stringent spatial resolution are typical requirements for biomagnetic measurement [88]. Furthermore, the magnetic signals emanating freely from humans are of very low amplitude compared with the Earth’s magnetic field. For instance, cardiac magnetic signals are on the order of 10~100 pT, whereas brain magnetic signals are typically one to two orders of magnitude lower [89]. Therefore, the magnetic detection device needs a super-high sensitivity and wide dynamic range. Figure 16 shows the intensity and frequency distribution of various magnetic signals in human body and the typical limit of detection of some representative sensors [90]. Compared with widely used superconducting quantum interference device (SQUID) requiring liquid nitrogen cooling and optically pumped magnetometers (OPM) suffering from bandwidth and scalability limitations, ME magnetic field sensors offer passive and thus low-power detection, high sensitivity, compact structure and also a large dynamic range [91].
In 2016, Hao et al. designed a kind of biomagnetic liver susceptometry (BLS) instrument for assessing the liver iron concentration (LIC) based on ME sensors, which can be operated under room temperature and in an unshielded environment [88]. In 2020, Lukat et al. further successfully localized and mapped superparamagnetic iron oxide nanoparticles (SPIONs) with a technique based on ME sensors [92].
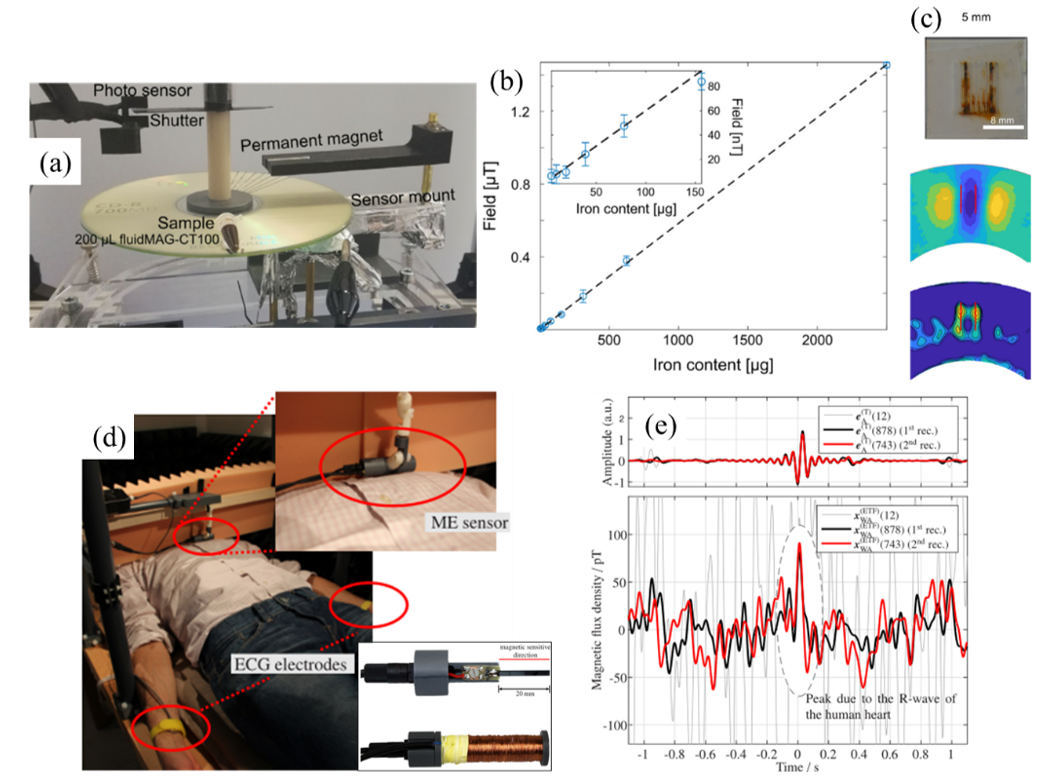
The structure of SPIONs mapping system is shown in Figure 17a. A rotating plate holder generating periodic signal was used to enable an easy acquirement of useful signals from the sample and to remove the environment drift. The permanent magnet and electrically shielded ME sensor were placed on two sides of the plate holder [92]. Compared with other methods, this system circumvents the difficulty to separate the magnetic field generated by the sample under excitation and the magnetic field superposition of the excitation source in magnetic particle imaging (MPI) [93] and magnetic particle mapping (MPM) [94]. The magnetic signal originating from different concentrations of SPIONs was measured to determine the performance of the system. As shown in Figure 17b, the signal strength linearly depended on concentrations of SPIONs and the limit of detectable iron content was about 20 μg. With respect to the spatial resolution, different samples can be well distinguished in a smallest distance of 5 mm as shown in Figure 17c [92].
Reermann et al. recently proved the statement that thin-film magnetoelectric sensors could be used for heart magnetic measurements. They successfully measured the R-wave signals from the heart of a volunteer in a shielded room as shown in Figure 17d, and the inset highlights the layout of the ME sensor used. The sensor was placed at a distance of about 10 mm above the skin. The result of two times measurement was shown in Figure 17e. After several-times average of the collected data, a specific peak corresponding to the R-wave of a human heart was obviously observed [95].
5. Future Outlook
In this review article, we have introduced the advances in ME sensors and their engineering applications. Here, we end with some perspectives that we suggest should be addressed in the coming future. First, continued efforts should be made to further enhance the ME coefficient for both thin-film and bulk ME composites by improving the interfacial stress transfer, looking for better component materials and optimizing the structure parameters. Considering the specific application for weak magnetic field sensing, the noise contribution in ME composites should be emphasized as well. Secondly, the realization of quasi-static and DC magnetic sensing with satisfactory sensitivity based on ME composites remains a big challenge. Compared with widely studied passive ME sensors, active ones could be one possible scheme to address this problem. In this case, studies about the packaging technology to keep a low damping and the corresponding circuit design should be a priority. In addition, methods to eliminate the high influence from environment vibration should be also considered in a bid to realize engineering applications of ME sensors in relatively complex environment. Finally, we appeal to the industrial community to get involved in the development of ME sensors for the applications discussed in this article. Besides the LoD, other critical parameters as mentioned at the beginning of Section 3 should be studied as well. For example, efforts could be made to further improve the temperature stability, to enlarge the dynamic range and to guarantee the final linearity of a ME sensor. This may create new dimensions for ME community and facilitate the industrialization of ME products.
Author Contributions
Conceptualization, Z.C., J.G.; writing—original draft preparation, J.G., Z.J.; writing—review and editing, Z.C., Y.S.; visualization, Z.J., Z.C.; supervision, S.Z., Y.S.; funding acquisition, Z.C., Z.M. All authors have read and agreed to the published version of the manuscript.
Funding
This research work was funded by Fundamental scientific research business expenses of central universities (3072021CFJ0501).
Institutional Review Board Statement
Not applicable.
Informed Consent Statement
Not applicable.
Data Availability Statement
The data presented in this study are available on request from the corresponding author.
Conflicts of Interest
The authors declare no conflict of interest. The funders had no role in the design of the study; in the collection, analyses, or interpretation of data; in the writing of the manuscript, and in the decision to publish the results.
References
- Ma, J.; Hu, J.; Li, Z.; Nan, C.W. Recent progress in multiferroic magnetoelectric composites: From bulk to thin films. Adv. Mater. 2011, 23, 1062–1087. [Google Scholar] [CrossRef] [PubMed]
- Hu, J.-M.; Nan, T.; Sun, N.X.; Chen, L.-Q. Multiferroic magnetoelectric nanostructures for novel device applications. MRS Bull. 2015, 40, 728–735. [Google Scholar] [CrossRef] [Green Version]
- Hu, J.-M.; Duan, C.-G.; Nan, C.-W.; Chen, L.-Q. Understanding and designing magnetoelectric heterostructures guided by computation: Progresses, remaining questions, and perspectives. NPJ Comput. Mater. 2017, 3, 1–21. [Google Scholar] [CrossRef]
- Kleemann, W. Multiferroic and magnetoelectric nanocomposites for data processing. J. Phys. D Appl. Phys. 2017, 50, 223001. [Google Scholar] [CrossRef]
- Lawes, G.; Srinivasan, G. Introduction to magnetoelectric coupling and multiferroic films. J. Phys. D Appl. Phys. 2011, 44, 243001. [Google Scholar] [CrossRef]
- Palneedi, H.; Annapureddy, V.; Priya, S.; Ryu, J. Status and Perspectives of Multiferroic Magnetoelectric Composite Materials and Applications. Actuators 2016, 5, 9. [Google Scholar] [CrossRef] [Green Version]
- Chu, Z.; PourhosseiniAsl, M.; Dong, S. Review of multi-layered magnetoelectric composite materials and devices applications. J. Phys. D Appl. Phys. 2018, 51, 243001. [Google Scholar] [CrossRef]
- Chu, Z.; Shi, H.; Shi, W.; Liu, G.; Wu, J.; Yalng, J.; Dong, S. Enhanced Resonance Magnetoelectric Coupling in (1-1) Connectivity Composites. Adv. Mater. 2017, 29, 1606022. [Google Scholar] [CrossRef]
- PourhosseiniAsl, M.; Gao, X.; Kamalisiahroudi, S.; Yu, Z.; Chu, Z.; Yang, J.; Lee, H.-Y.; Dong, S. Versatile power and energy conversion of magnetoelectric composite materials with high efficiency via electromechanical resonance. Nano Energy 2020, 70, 104506. [Google Scholar] [CrossRef]
- Nan, C.-W.; Bichurin, M.I.; Dong, S.; Viehland, D.; Srinivasan, G. Multiferroic magnetoelectric composites: Historical perspective, status, and future directions. J. Appl. Phys. 2008, 103, 031101. [Google Scholar] [CrossRef]
- Fiebig, M. Revival of the magnetoelectric effect. J. Phys. D Appl. Phys. 2005, 38, R123–R152. [Google Scholar] [CrossRef]
- Zhai, J.; Xing, Z.; Dong, S.; Li, J.; Viehland, D. Magnetoelectric Laminate Composites: An Overview. J. Am. Ceram. Soc. 2008, 91, 351–358. [Google Scholar] [CrossRef]
- Wang, Y.; Li, J.; Viehland, D. Magnetoelectrics for magnetic sensor applications: Status, challenges and perspectives. Mater. Today 2014, 17, 269–275. [Google Scholar] [CrossRef]
- Gutierrez, J.; Lasheras, A.; Martins, P.; Pereira, N.; Barandiaran, J.M.; Lanceros-Mendez, S. Metallic Glass/PVDF Magnetoelectric Laminates for Resonant Sensors and Actuators: A Review. Sensors 2017, 17, 1251. [Google Scholar] [CrossRef]
- Sreenivasulu, G.; Qu, P.; Petrov, V.; Qu, H.; Srinivasan, G. Sensitivity Enhancement in Magnetic Sensors Based on Ferroelectric-Bimorphs and Multiferroic Composites. Sensors 2016, 16, 262. [Google Scholar] [CrossRef] [Green Version]
- Annapureddy, V.; Palneedi, H.; Hwang, G.-T.; Peddigari, M.; Jeong, D.-Y.; Yoon, W.-H.; Kim, K.-H. Magnetic energy harvesting with magnetoelectrics: An emerging technology for self-powered autonomous systems. Sustain. Energy Fuels 2017, 1, 2039–2052. [Google Scholar] [CrossRef]
- Vopson, M.M. Fundamentals of Multiferroic Materials and Their Possible Applications. Crit. Rev. Solid State Mater. Sci. 2015, 40, 223–250. [Google Scholar] [CrossRef] [Green Version]
- Gao, X.; Yan, Y.; Carazo, A.V.; Dong, S.; Priya, S. Low-temperature cofired unipoled multilayer piezoelectric transformers. IEEE Trans. Ultrason. Ferroelectr. Freq. Control 2017, 65, 513–519. [Google Scholar] [CrossRef]
- Yang, N.; Wu, H.; Wang, S.; Yuan, G.; Zhang, J.; Sokolov, O.; Bichurin, M.I.; Wang, K.; Wang, Y. Ultrasensitive flexible magnetoelectric sensor. APL Mater. 2021, 9, 021123. [Google Scholar] [CrossRef]
- Dong, S.; Liu, J.-M.; Cheong, S.-W.; Ren, Z. Multiferroic materials and magnetoelectric physics: Symmetry, entanglement, excitation, and topology. Adv. Phys. 2015, 64, 519–626. [Google Scholar] [CrossRef] [Green Version]
- Astrov, D.N. Magnetoelectric Effect In Chromium Oxide. Sov. Phys. Jetp 1961, 13, 729–733. [Google Scholar]
- Schmid, H. Multi-ferroic magnetoelectrics. Ferroelectrics 1994, 162, 317–338. [Google Scholar] [CrossRef]
- Catalan, G.; Scott, J.F. Physics and Applications of Bismuth Ferrite. Adv. Mater. 2009, 21, 463–2485. [Google Scholar] [CrossRef]
- Yamauchi, K.; Picozzi, S. Orbital degrees of freedom as origin of magnetoelectric coupling in magnetite. Phys. Rev. B 2012, 85, 085131. [Google Scholar] [CrossRef] [Green Version]
- Pantinakis, A.; Jackson, D.A. High-sensitivity low-frequency magnetometer using magnetostrictive primary sensing and piezoelectric signal recovery. Electron. Lett. 1986, 22, 737–738. [Google Scholar] [CrossRef]
- Li, M.; Matyushov, A.; Dong, C.; Chen, H.; Lin, H.; Nan, T.; Qian, Z.; Rinaldi, M.; Lin, Y.; Sun, N.X. Ultra-sensitive NEMS magnetoelectric sensor for picotesla DC magnetic field detection. Appl. Phys. Lett. 2017, 110, 143510. [Google Scholar] [CrossRef]
- Ryu, J.; Priya, S.; Uchino, K.; Kim, H.-E. Magnetoelectric Effect in Composites of Magnetostrictive and Piezoelectric Materials. J. Electroceramics 2002, 8, 107–119. [Google Scholar] [CrossRef]
- Dong, S.; Li, J.-F.; Viehland, D. Ultrahigh magnetic field sensitivity in laminates of TERFENOL-D and Pb(Mg1/3Nb2/3)O3–PbTiO3 crystals. Appl. Phys. Lett. 2003, 83, 2265–2267. [Google Scholar] [CrossRef] [Green Version]
- Dong, S.; Zhai, J.; Bai, F.; Li, J.-F.; Viehland, D. Push-pull mode magnetostrictive/piezoelectric laminate composite with an enhanced magnetoelectric voltage coefficient. Appl. Phys. Lett. 2005, 87, 062502. [Google Scholar] [CrossRef] [Green Version]
- Dong, S.; Zhai, J.; Li, J.; Viehland, D. Near-ideal magnetoelectricity in high-permeability magnetostrictive/piezofiber laminates with a (2-1) connectivity. Appl. Phys. Lett. 2006, 89, 252904. [Google Scholar] [CrossRef] [Green Version]
- Gao, J.; Shen, L.; Wang, Y.; Gray, D.; Li, J.; Viehland, D. Enhanced sensitivity to direct current magnetic field changes in Metglas/Pb(Mg1/3Nb2/3)O3–PbTiO3 laminates. J. Appl. Phys. 2011, 109, 074507. [Google Scholar] [CrossRef] [Green Version]
- Li, M.; Gao, J.; Wang, Y.; Gray, D.; Li, J.; Viehland, D. Enhancement in magnetic field sensitivity and reduction in equivalent magnetic noise by magnetoelectric laminate stacks. J. Appl. Phys. 2012, 111, 104504. [Google Scholar] [CrossRef] [Green Version]
- Wang, Y.; Gray, D.; Betrry, D.; Gao, J.; Li, M.; Li, J.; Viehland, D. An extremely low equivalent magnetic noise magnetoelectric sensor. Adv. Mater. 2011, 23, 4111–4114. [Google Scholar] [CrossRef] [PubMed]
- Li, M.; Berry, D.; Das, J.; Gray, D.; Li, J.; Viehland, D. Enhanced Sensitivity and Reduced Noise Floor in Magnetoelectric Laminate Sensors by an Improved Lamination Process. J. Am. Ceram. Soc. 2011, 94, 3738–3741. [Google Scholar] [CrossRef]
- Gao, J.; Das, J.; Xing, Z.; Li, J.; Viehland, D. Comparison of noise floor and sensitivity for different magnetoelectric laminates. J. Appl. Phys. 2010, 108, 084509. [Google Scholar] [CrossRef] [Green Version]
- Shi, Z.; Nan, C.W.; Zhang, J.; Cai, N.; Li, J.-F. Magnetoelectric effect of Pb(Zr,Ti)O3 rod arrays in a (Tb,Dy)Fe2/epoxy medium. Appl. Phys. Lett. 2005, 87, 012503. [Google Scholar] [CrossRef]
- Ma, J.; Shi, Z.; Nan, C.W. Magnetoelectric Properties of Composites of Single Pb(Zr,Ti)O3 Rods and Terfenol-D/Epoxy with a Single-Period of 1-3-Type Structure. Adv. Mater. 2007, 19, 2571–2573. [Google Scholar] [CrossRef]
- Palneedi, H.; Choi, S.-Y.; Kim, G.; Annapureddy, V.; Maurya, D.; Priya, S.; Lee, K.J.; Chung, S.; Kang, S.L.; Ryu, J. Tailoring the Magnetoelectric Properties of Pb(Zr,Ti)O3 Film Deposited on Amorphous Metglas Foil by Laser Annealing. J. Am. Ceram. Soc. 2016, 99, 2680–2687. [Google Scholar] [CrossRef]
- Palneedi, H.; Maurya, D.; Kim, G.-Y.; Priya, S.; Kang, S.-J.L.; Kim, K.-H.; Choi, S.-Y.; Ryu, J. Enhanced off-resonance magnetoelectric response in laser annealed PZT thick film grown on magnetostrictive amorphous metal substrate. Appl. Phys. Lett. 2015, 107, 012904. [Google Scholar] [CrossRef]
- Palneedi, H.; Yeo, H.G.; Hwang, G.-T.; Annapureddy, V.; Kim, J.-W.; Choi, J.-J.; Trolier-McKinstry, S.; Ryu, J. A flexible, high-performance magnetoelectric heterostructure of (001) oriented Pb(Zr0.52Ti0.48)O3 film grown on Ni foil. Appl. Mater. 2017, 5, 096111. [Google Scholar] [CrossRef] [Green Version]
- Palneedi, H.; Maurya, D.; Kim, G.-Y.; Annapureddy, V.; Noh, M.-S.; Kang, C.-Y.; Kim, J.-W.; Choi, J.-J.; Choi, S.-Y.; Chung, S.-Y.; et al. Unleashing the Full Potential of Magnetoelectric Coupling in Film Heterostructures. Adv. Mater. 2017, 29, 1605688. [Google Scholar] [CrossRef]
- Srinivasan, G.; Rasmussen, E.T.; Gallegos, J.; Srinivasan, R.; Bokhan, Y.I.; Laletin, V.M. Magnetoelectric bilayer and multilayer structures of magnetostrictive and piezoelectric oxides. Phys. Rev. B 2001, 64, 214408. [Google Scholar] [CrossRef]
- Zhai, J.; Dong, S.; Xing, Z.; Li, J.; Viehland, D. Giant magnetoelectric effect in Metglas/polyvinylidene-fluoride laminates. Appl. Phys. Lett. 2006, 89, 083507. [Google Scholar] [CrossRef] [Green Version]
- Jin, J.; Lu, S.-G.; Chanthad, C.; Zhang, Q.; Haque, M.A.; Wang, Q. Multiferroic Polymer Composites with Greatly Enhanced Magnetoelectric Effect under a Low Magnetic Bias. Adv. Mater. 2011, 23, 3853. [Google Scholar] [CrossRef]
- Sreenivasulu, G.; Fetisov, L.Y.; Fetisov, Y.K.; Srinivasan, G. Piezoelectric single crystal langatate and ferromagnetic composites: Studies on low-frequency and resonance magnetoelectric effects. Appl. Phys. Lett. 2012, 100, 052901. [Google Scholar] [CrossRef]
- Kirchhof, C.; Krantz, M.; Teliban, I.; Jahns, R.; Marauska, S.; Wagner, B.; Knoöchel, R.; Gerken, M.; Meyners, D.; Quandt, E. Giant magnetoelectric effect in vacuum. Appl. Phys. Lett. 2013, 102, 232905. [Google Scholar] [CrossRef]
- Yarar, E.; Salzer, S.; Hrkac, V.; Piorra, A.; Höft, M.; Knöchel, R.; Kienle, L.; Quandt, E. Inverse bilayer magnetoelectric thin film sensor. Appl. Phys. Lett. 2016, 109, 022901. [Google Scholar] [CrossRef]
- Turutin, A.V.; Vidal, J.V.; Kubasov, I.V.; Kislyuk, A.M.; Malinkovich, M.D.; Parkhomenko, Y.N.; Kobeleva, S.P.; Pakhomov, O.V.; Kholkin, A.L.; Sobolev, N.A. Magnetoelectric metglas/bidomain y + 140°-cut lithium niobate composite for sensing fT magnetic fields. Appl. Phys. Lett. 2018, 112, 262906. [Google Scholar] [CrossRef]
- Greve, H.; Woltermann, E.; Quenzer, H.-J.; Wagner, B.; Quandt, E. Giant magnetoelectric coefficients in (Fe90Co10)78Si12B10-AlN thin film composites. Appl. Phys. Lett. 2010, 96, 182501. [Google Scholar] [CrossRef]
- Jovičević Klug, M.; Thormählen, L.; Röbisch, V.; Toxværd, S.D.; Höft, M.; Knöchel, R.; Quandt, E.; Meyners, D.; McCord, J. Antiparallel exchange biased multilayers for low magnetic noise magnetic field sensors. Appl. Phys. Lett. 2019, 114, 192410. [Google Scholar] [CrossRef]
- Nan, T.; Hui, Y.; Rinaldi, M.; Sun, N.X. Self-biased 215 MHz magnetoelectric NEMS resonator for ultra-sensitive DC magnetic field detection. Sci. Rep. 2013, 3, 1985. [Google Scholar] [CrossRef] [PubMed] [Green Version]
- Tu, C.; Chu, Z.-Q.; Spetzler, B.; Hayes, P.; Dong, C.-Z.; Liang, X.-F.; Chen, H.-H.; He, Y.-F.; Wei, Y.-Y.; Lisenkov, I.; et al. Mechanical-Resonance-Enhanced Thin-Film Magnetoelectric Heterostructures for Magnetometers, Mechanical Antennas, Tunable RF Inductors, and Filters. Materials 2019, 12, 2259. [Google Scholar] [CrossRef] [PubMed] [Green Version]
- Nan, T.; Lin, H.; Gao, Y.; Matyushov, A.; Yu, G.; Chen, H.; Sun, N.; Wei, S.; Wang, Z.; Li, M.; et al. Acoustically actuated ultra-compact NEMS magnetoelectric antennas. Nat. Commun 2017, 8, 296. [Google Scholar] [CrossRef] [PubMed]
- Chu, Z.; Shi, H.; Gao, X.; Wu, J.; Dong, S. Magnetoelectric coupling of a magnetoelectric flux gate sensor in vibration noise circumstance. AIP Adv. 2018, 8, 015203. [Google Scholar] [CrossRef]
- Fang, C.; Jiao, J.; Ma, J.; Lin, D.; Xu, H.; Zhao, X.; Luo, H. Significant reduction of equivalent magnetic noise by in-plane series connection in magnetoelectric Metglas/Mn-doped Pb(Mg1/3Nb2/3)O3-PbTiO3laminate composites. J. Phys. D Appl. Phys. 2015, 48, 465002. [Google Scholar] [CrossRef]
- Liu, Y.; Jiao, J.; Ma, J.; Ren, B.; Li, L.; Zhao, X.; Luo, H.; Shi, L. Frequency conversion in magnetoelectric composites for quasi-static magnetic field detection. Appl. Phys. Lett. 2013, 103, 212902. [Google Scholar] [CrossRef]
- Petrie, J.R.; Fine, J.; Mandal, S.; Sreenivasulu, G.; Srinivasan, G.; Edelstein, A.S. Enhanced sensitivity of magnetoelectric sensors by tuning the resonant frequency. Appl. Phys. Lett. 2011, 99, 043504. [Google Scholar] [CrossRef] [Green Version]
- Petrie, J.; Mandal, S.; Gollapudi, S.; Viehland, D.; Gray, D.; Srinivasan, G.; Edelstein, A.S. Enhancing the sensitivity of magnetoelectric sensors by increasing the operating frequency. J. Appl. Phys. 2011, 110, 124506. [Google Scholar] [CrossRef] [Green Version]
- Ou-Yang, J.; Liu, X.; Zhou, H.; Zou, Z.; Yang, Y.; Li, J.; Zhang, Y.; Zhu, B.; Chetn, S.; Yang, X. Magnetoelectric laminate composites: An overview of methods for improving the DC and low-frequency response. J. Phys. D Appl. Phys. 2018, 51, 324005. [Google Scholar] [CrossRef]
- Chu, Z.; Dong, C.; Tu, C.; Liang, X.; Chen, H.; Sun, C.; Yu, Z.; Dong, S.; Sun, N.-X. A low-power and high-sensitivity magnetic field sensor based on converse magnetoelectric effect. Appl. Phys. Lett. 2019, 115, 162901. [Google Scholar] [CrossRef]
- Chu, Z.; Yu, Z.; PourhosseiniAsl, M.; Tu, C.; Dong, S. Enhanced low-frequency magnetic field sensitivity in magnetoelectric composite with amplitude modulation method. Appl. Phys. Lett. 2019, 114, 132901. [Google Scholar] [CrossRef]
- PourhosseiniAsl, M.; Yu, Z.; Chu, Z.; Yang, J.; Xu, J.; Hou, Y.; Dong, S. Enhanced self-bias magnetoelectric effect in locally heat-treated ME laminated composite. Appl. Phys. Lett. 2019, 115, 112901. [Google Scholar] [CrossRef]
- Li, J.; Ma, G.; Zhang, S.; Wang, C.; Jin, Z.; Zong, W.; Zhao, G.; Wang, X.; Xu, J.; Cao, D.; et al. AC/DC dual-mode magnetoelectric sensor with high magnetic field resolution and broad operating bandwidth. AIP Adv. 2021, 11, 045015. [Google Scholar] [CrossRef]
- Chu, Z.; Shi, H.; PourhosseiniAsl, M.J.; Wu, J.; Shi, W.; Galo, X.; Yuan, X.; Dong, S. A magnetoelectric flux gate: New approach for weak DC magnetic field detection. Sci. Rep. 2017, 7, 8592. [Google Scholar] [CrossRef] [Green Version]
- Burdin, D.A.; Chashin, D.V.; Ekonomov, N.A.; Fetisov, Y.K.; Stashkevich, A.A. High-sensitivity dc field magnetometer using nonlinear resonance magnetoelectric effect. J. Magn. Magn. Mater. 2016, 405, 244–248. [Google Scholar] [CrossRef]
- Burdin, D.; Chashin, D.; Ekonomov, N.; Fetisov, L.; Fetisov, Y.; Shamonin, M. DC magnetic field sensing based on the nonlinear magnetoelectric effect in magnetic heterostructures. J. Phys. D Appl. Phys. 2016, 49, 375002. [Google Scholar] [CrossRef]
- Burdin, D.A.; Ekonomov, N.A.; Chashin, D.V.; Fetisov, L.Y.; Fetisov, Y.K.; Shamonin, M. Temperature Dependence of the Resonant Magnetoelectric Effect in Layered Heterostructures. Materials 2017, 10, 1183. [Google Scholar] [CrossRef] [Green Version]
- Schmelz, M.; Stolz, R.; Zakosarenko, V.; Schönau, T.; Anders, S.; Fritzsch, L.; Mück, M.; Meyer, M.; Meyer, H.-G. Sub-fT/Hz1/2 resolution and field-stable SQUID magnetometer based on low parasitic capacitance sub-micrometer cross-type Josephson tunnel junctions. Phys. C Supercond. Its Appl. 2012, 482, 27–32. [Google Scholar] [CrossRef]
- Shen, Y.; Gao, J.; Hasanyan, D.; Wang, Y.; Li, M.; Li, J.; Viehland, D. Investigation of vehicle induced magnetic anomaly by triple-axis magnetoelectric sensors. Smart Mater. Struct. 2012, 21, 115007. [Google Scholar] [CrossRef]
- Shen, Y.; Hasanyan, D.; Gao, J.; Wang, Y.; Li, J.; Viehland, D. A magnetic signature study using magnetoelectric laminate sensors. Smart Mater. Struct. 2013, 22, 095007. [Google Scholar] [CrossRef]
- Xu, J.; Leung, C.M.; Zhuang, X.; Li, J.; Viehland, D. Spatial magnetic source detection based on active mode magnetoelectric gradiometer with 2D and 3D configurations. J. Phys. D Appl. Phys. 2020, 53, 365002. [Google Scholar] [CrossRef]
- Chu, Z.; Shi, W.; Shi, H.; Chen, Q.; Wang, L.; PourhosseiniAsl, M.J.; Xiao, C.; Xie, T.; Dong, S. A 1D Magnetoelectric Sensor Array for Magnetic Sketching. Adv. Mater. Technol. 2019, 4, 1800484. [Google Scholar] [CrossRef]
- Zhai, J.; Dong, S.; Xing, Z.; Li, J.; Viehland, D. Geomagnetic sensor based on giant magnetoelectric effect. Appl. Phys. Lett. 2007, 91, 123513. [Google Scholar] [CrossRef] [Green Version]
- Duc, N.H.; Tu, B.D.; Ngoc, N.T.; Lap, V.D.; Giang, D.T.H. Metglas/PZT-Magnetoelectric 2-D Geomagnetic Device for Computing Precise Angular Position. IEEE Trans. Magn. 2013, 49, 4839–4842. [Google Scholar] [CrossRef]
- PourhosseiniAsl, M.J.; Chu, Z.; Gao, X.; Dong, S. A hexagonal-framed magnetoelectric composite for magnetic vector measurement. Appl. Phys. Lett. 2018, 113, 092902. [Google Scholar] [CrossRef]
- Zhang, J.; Li, P.; Wen, Y.; He, W.; Yang, J.; Yang, A.; Lu, C.; Li, W. Enhanced sensitivity in magnetoelectric current-sensing devices with frequency up-conversion mechanism by modulating the magnetostrictive strain. J. Appl. Phys. 2014, 115, 17E505. [Google Scholar] [CrossRef]
- Dong, S.; Li, J.-F.; Viehland, D. Vortex magnetic field sensor based on ring-type magnetoelectric laminate. Appl. Phys. Lett. 2004, 85, 2307–2309. [Google Scholar] [CrossRef] [Green Version]
- Zhang, J.; Li, P.; Wen, Y.; He, W.; Yang, A.; Lu, C. Packaged current-sensing device with self-biased magnetoelectric laminate for low-frequency weak-current detection. Smart Mater. Struct. 2014, 23, 095028. [Google Scholar] [CrossRef]
- Zhao, S.; Sun, L.; Gao, J.; Wang, J.; Shen, Y. Uniaxial ACFM detection system for metal crack size estimation using magnetic signature waveform analysis. Measurement 2020, 164, 108090. [Google Scholar] [CrossRef]
- Chu, Z.; Jiang, Z.; Mao, Z.; Shen, Y.; Gao, J.; Dong, S. Low-power eddy current detection with 1-1 type magnetoelectric sensor for pipeline cracks monitoring. Sens. Actuators A Phys. 2021, 318, 112496. [Google Scholar] [CrossRef]
- Wu, Z.; Bian, L.; Chen, S. Packaged angle-sensing device with magnetoelectric laminate composite and magnetic circuit. Sens. Actuators A Phys. 2018, 273, 232–239. [Google Scholar] [CrossRef]
- Lu, C.; Zhu, R.; Yu, F.; Jiang, X.; Liu, Z.; Dong, L.; Hua, Q.; Ou, Z. Gear rotational speed sensor based on FeCoSiB/Pb(Zr,Ti)O3 magnetoelectric composite. Measurement 2021, 168, 108409. [Google Scholar] [CrossRef]
- Yang, Y.; Yang, B. Displacement Sensor with Nanometric resolution Based on Magnetoelectric Effect. IEEE Sens. J. 2021, 21, 12084–12091. [Google Scholar]
- Pereira, N.; Lima, A.C.; Correia, V.; Perinka, N.; Lanceros-Mendez, S.; Martins, P. Magnetic Proximity Sensor Based on Magnetoelectric Composites and Printed Coils. Materials 2020, 13, 1729. [Google Scholar] [CrossRef] [PubMed] [Green Version]
- Zhang, R.; Duan, Y.; Or, S.W.; Zhao, Y. Smart elasto-magneto-electric (EME) sensors for stress monitoring of steel cables: Design theory and experimental validation. Sensors 2014, 14, 13644–13660. [Google Scholar] [CrossRef] [PubMed] [Green Version]
- Chen, Y.; Hu, C.; Wang, Z.; Li, Y.; Zhu, S.; Su, W.; Hu, Z.; Zhou, Z.; Liu, M. Wireless strain sensor based on the magnetic strain anisotropy dependent ferromagnetic resonance. AIP Adv. 2020, 10, 150310. [Google Scholar] [CrossRef]
- Hayes, P.; Klug, M.J.; Toxværd, S.; Durdaut, P.; Schell, V.; Teplyuk, A.; Burdin, D.; Winkler, A.; Weser, R.; Fetisov, Y.; et al. Converse Magnetoelectric Composite Resonator for Sensing Small Magnetic Fields. Sci. Rep. 2019, 9, 16355. [Google Scholar] [CrossRef]
- Xi, H.; Qian, X.; Lu, M.-C.; Mei, L.; Rupprecht, S.; Yang, Q.X.; Zhang, Q.M. A Room Temperature Ultrasensitive Magnetoelectric Susceptometer for Quantitative Tissue Iron Detection. Sci. Rep. 2016, 6, 29740. [Google Scholar] [CrossRef] [Green Version]
- Wikswo, J.P. SQUID magnetometers for biomagnetism and nondestructive testing: Important questions and initial answers. IEEE Trans. Appl. Supercond. 1995, 5, 74–120. [Google Scholar] [CrossRef]
- Zuo, S.; Schmalz, J.; Ozden, M.-O.; Gerken, M.; Su, J.; Niekiel, F.; Lofink, F.; Nazarpour, K.; Heidari, H. Ultrasensitive Magnetoelectric Sensing System for Pico-Tesla MagnetoMyoGraphy. IEEE Trans. Biomed. Circuits Syst 2020, 14, 971–984. [Google Scholar] [CrossRef]
- Ripka, P.; Janosek, M. Advances in Magnetic Field Sensors. IEEE Sens. J. 2010, 10, 1108–1116. [Google Scholar] [CrossRef] [Green Version]
- Lukat, N.; Friedrich, R.-M.; Spetzler, B.; Kirchhof, C.; Arndt, C.; Thormählen, L.; Faupel, F.; Selhuber-Unkel, C. Mapping of magnetic nanoparticles and cells using thin film magnetoelectric sensors based on the delta-E effect. Sens. Actuators A Phys. 2020, 309, 112023. [Google Scholar] [CrossRef]
- Gleich, B.; Weizenecker, J. Tomographic imaging using the nonlinear response of magnetic particles. Nature 2005, 435, 1214–1217. [Google Scholar] [CrossRef]
- Friedrich, R.M.; Zabel, S.; Galka, A.; Lukat, N.; Wagner, J.-M.; Kirchhof, C.; Quandt, E.; Mccord, J.; Selhuber-Unkel, C.; Siniatchkin, M.; et al. Magnetic particle mapping using magnetoelectric sensors as an imaging modality. Sci. Rep. 2019, 9, 2086. [Google Scholar] [CrossRef]
- Reermann, J.; Durdaut, P.; Salzer, S.; Demming, T.; Piorra, A.; Quandt, E.; Frey, N.; Höft, M.; Schmidt, G. Evaluation of magnetoelectric sensor systems for cardiological applications. Measurement 2018, 116, 230–238. [Google Scholar] [CrossRef]
Figure 1.
(a) Schematic structure (top) and photograph (bottom) of ME laminate composites using Terfenol-D and PZT disks [27]. (b) 3D and crosss ectional schematic illustration of the single period of 1-3-type ME structure [37]. (c) Illustration of the FeBSiC/piezofiber laminate configuration working on multi-push-pull mode [29,30]. (d) The schematic view for 1-1 laminated ME composite and a-(ii) the prototype snapshot of the 1-1 typed ME sample [8].

Figure 2.
Sketch of ME MEMS cantilever with the functional layer deposited on one side (a) [47] and two side (b) [50] of silicon substrate. (c) Scanning electron microscopy (SEM) images of the ME nano plate resonator. (d) Scanning electron microscopy (SEM) images of the fabricated ME thin-film bulk acoustic wave resonators. The red and blue areas show the suspended circular plate and AlN anchors. The yellow area presents the electrode [53].

Figure 3.
(a) Schematic diagram and the protype photo of 2-1 type ME composite working on multi-push-pull mode. (b) Measured and estimated equivalent magnetic noise of the proposed sensor unit [33].
Figure 3.
(a) Schematic diagram and the protype photo of 2-1 type ME composite working on multi-push-pull mode. (b) Measured and estimated equivalent magnetic noise of the proposed sensor unit [33].

Figure 4.
3D structure of Metglas/Mn-PMNT ME composite (a) and its cross-sectional diagram (b); (c) The EMN over the frequency range of 8 Hz < f < 100 Hz. (d)The EMN and of different Metglas/Mn-PMNT sensors at 30 Hz [55].
Figure 4.
3D structure of Metglas/Mn-PMNT ME composite (a) and its cross-sectional diagram (b); (c) The EMN over the frequency range of 8 Hz < f < 100 Hz. (d)The EMN and of different Metglas/Mn-PMNT sensors at 30 Hz [55].

Figure 5.
(a) The demonstration of fundamental modulation and frequency mixing phenomenon in ME sensors; (b) A block diagram of the amplitude demodulation method with respect to amplitude modulation signal SMod (t). (c) The measured output waveform in response to an applied weak AC magnetic field at 100 mHz. (d) A linear-response to varying HAC at 100 mHz with a step of 0.1 nT [61].

Figure 6.
(a) Magnetic field detection limit measurements at frequencies of f = 1 Hz and f = 77.5 kHz (resonance condition), respectively [29]; (b)The measurement of LOD for MEMS ME sensor [47], (c) for 1-1 typed ME sensor [8] and (d) for a 2-2 ME bimorph [48].

Figure 7.
The measurement of LoD for Metglas/PMN–PT ME laminate at (a) f = 10 kHz and (b) resonance frequency of 27.778 kHz [31]. (c) Schematic representation and (d) the measurement of LoD for NMES AlN/(FeGaB/Al2O3) multilayered heterostructure [51]; (e) Schematic representation of the conventional flux gate senor and the proposed ME flux gate sensor [64]; (f) The measured results for DC magnetic field resolution [64].

Figure 8.
(a) Photograph of the vehicle detection system setup; (b) sensor output signals in terms of the X (blue curve), Y (red curve) and Z (green curve) component in the ME sensor (top), PE sensor (middle) and fluxgate sensor (bottom) [69].
Figure 8.
(a) Photograph of the vehicle detection system setup; (b) sensor output signals in terms of the X (blue curve), Y (red curve) and Z (green curve) component in the ME sensor (top), PE sensor (middle) and fluxgate sensor (bottom) [69].

Figure 9.
(a) Prototype of the measurement setup using 1-D ME sensor array and imaging system. (b) the positioning result of an Fe-ball [72].
Figure 9.
(a) Prototype of the measurement setup using 1-D ME sensor array and imaging system. (b) the positioning result of an Fe-ball [72].

Figure 10.
(a)Output voltage from the magnetoelectric sensor when it is rotated in the Earth’s plane [73]. (b) Photograph of the experimental rotation system and (c) the accuracy measurement of spatial angles [74].

Figure 11.
(a) The structure of the HFMEC. (b) ME coupling response of the HFMEC as a function of the DC magnetic-field, the signal exhibits a “V” shape and the knee point of the curve reveals the geomagnetic field [75].
Figure 11.
(a) The structure of the HFMEC. (b) ME coupling response of the HFMEC as a function of the DC magnetic-field, the signal exhibits a “V” shape and the knee point of the curve reveals the geomagnetic field [75].

Figure 12.
(a) Schematic and photograph of the current-sensing device; (b) Comparison of the sensitivities measured at low frequency and resonant frequency [78]. (c) Measured ME voltage response with respect to an aluminum pipe with a 10 mm crack in the center (the inset highlighted by dashed line showed the structure of the ME ECT probe). (d) Crack identifying results for one-dimensionally distributed cracks labelled 1# and 2# for an aluminum pipeline and steel pipeline, respectively [80].

Figure 13.
(a) Schematic view of the packaged sensor; (b) The peak-to-peak values under different rotational speed; (c) The frequency of the output signal as a function of the rotational speed [81]. (d) Schematic layout of the gear, permanent magnet and FeCoSiB/Pb(Zr,Ti)O3 sensor; (e) The magnetic flux density with the gear rotates one circle (f) the measurement speed (Gs) under different rotational speed [82].

Figure 14.
(a)Structure of the EME sensor; (b) Stress response of EME sensors [85].
Figure 14.
(a)Structure of the EME sensor; (b) Stress response of EME sensors [85].

Figure 15.
(a) the schematic of the EPR cavity and FMR measurement setup; (b) the negative correlation between Hr and ε of the NiCo film with a static strain range of 0 με–700 με by linear fitting [86].
Figure 15.
(a) the schematic of the EPR cavity and FMR measurement setup; (b) the negative correlation between Hr and ε of the NiCo film with a static strain range of 0 με–700 με by linear fitting [86].

Figure 16.
Amplitude densities of magnetic signals generated by various sources of the human body [90].
Figure 16.
Amplitude densities of magnetic signals generated by various sources of the human body [90].

Figure 17.
(a) Setup for measuring distributions of SPIONs. (b) Maximum magnetic field amplitude for different iron content measurements. (c) Place the sample in different grooves (top), the measured field distributions of the two sample, and the red line in the field distribution shows the location of the grooves (middle), the particle distribution reconstructed from these measurements (bottom) [92]. (d) Measurement setup of cardiological magnetic detection. (e) Averaged result of the R-wave measurement [95].


Table 1.
Some ME laminates and their ME coupling performances.
| Composition | Year | Connectivity | Working Mode | ||
|---|---|---|---|---|---|
| Terfenol-D/PZT [37] | 2007 | 3-1 | L-L | 0.5 | 18.2 |
| NiFe2O4/PZT [42] | 2001 | 2-2 | L-T | 1.5 | / |
| Terfenol-D/PZT [27] | 2002 | 2-2 | L-T | 5 | / |
| Metglas/PVDF [43] | 2006 | 2-2 | L-T | 7.2 | 310 |
| Metglas/P(VDF-TrFE) [44] | 2011 | 2-2 | L-L | 17.7 | 383 |
| Lanthanum gallium tantalite/ permendur [45] | 2012 | 2-2 | / | 2.3 | 720 |
| FeCoSiB/(Pt)/AlN in vacuum [46] | 2013 | 2-2 | L-T | / | 20,000 |
| FeCoSiB/(Pt)/AlN [47] | 2016 | 2-2 | L-T | / | 5000 |
| Metglas/LiNbO3 [48] | 2018 | 2-2 | L-T | 1.9 | 1704 |
| FeBSiC/PZT [30] | 2006 | 2-1 | L-L | 22 | 500 |
| Metglas/PMN-PT [31] | 2011 | 2-1 | L-L | 45 | 1100 |
| Metglas/PMN-PT without laser treatment [8] | 2017 | 1-1 | L-T | 29.3 | 5500 |
| Metglas/PMN-PT with laser treatment [8] | 2017 | 1-1 | L-T | 22.9 | 7000 |
| Metglas/Mn-PMN-PZT with laser treatment [9] | 2020 | 1-1 | L-T | 23.6 | 12,500 |
Note: Connectivity. We use different number to represent the connectivity of each individual phase. For example, 1-3 type composite means one-phase fiber (denoted by 1) was embedded in the matrix of another phase (denoted by 3); 2-2 type composite means laminated structure (each phase has a plane configuration denoted by 2); 2-1 type composite means one-phase fiber was laminated with another phase plate; 1-1 type means both phases are in the form of fiber configuration. Working mode. L-L, L-T means longitudinal vibrations with longitudinal magnetization and transverse polarization(L-L) or transverse magnetization and transverse polarization (L-T).
Table 2.
Performance summary of typical magnetoelectric sensors.
| Composition | Working Mode | Sensing Mode | ||
|---|---|---|---|---|
| Low-frequency magnetic field sensing | Metglas/Mn-PMNT [55] | Longitudinal vibration (Multi-L-T) | Passive sensing | 0.87 pT/ @ 30 Hz |
| Metglas/PMN-PT [33] | Longitudinal vibration (Multi-push-pull) | Passive sensing | 5.1 pT/ @ 1 Hz | |
| Metglas/PMN-PZT [61] | Longitudinal vibration (L-T) | Active Modulation | 33 pT/ @ 0.1 Hz | |
| Resonant magnetic field sensing | Metglas/ LiNbO3 [48] | bending mode | Direct Sensing | 92 fT/√Hz |
| FeCoSiB/(Pt)/AlN [47] | bending mode | Direct Sensing | 400 fT/√Hz | |
| Metglas/PMN-PZT [8] | Longitudinal vibration (L-T) | Direct Sensing | 123 fT/√Hz | |
| DC magnetic field sensing | langatate-Metglas [65] | bending mode | Nonlinear ME effect | 10 nT |
| Metglas/PMN-PZT [9] | Longitudinal vibration (L-T) | Linear ME effect | 1 nT | |
| FeCoSiB/(Pt)/AlN [26] | Lateral vibration | Delta-E effect | 0.8 nT | |
| FeCoSiB/(Pt)/AlN [51] | Lateral vibration | Delta-E effect | 0.4 nT |
Table 3.
Performance Comparison with commercially available magnetometer for 1 Hz magnetic field sensing.
Table 3.
Performance Comparison with commercially available magnetometer for 1 Hz magnetic field sensing.
| Magnetometer | Working Temperature | Power Consumption (mW) | Typical Size | Limitations | |
|---|---|---|---|---|---|
| ME sensor [33] | 0 °C to +50 °C ① | <1 | 80 mm × 10 mm @ ME composites | 5.1 | Vibration interference |
| Magnetoresistive sensor ② | −40 °C to +125 °C | ~0.02 | 6 mm × 5 mm × 1.5 mm @ sensing element | 100 | Low sensitivity |
| Giant magneto-impedance sensor ③ | −20 °C to +60 °C | 75 | 35 mm × 11 mm × 4.6 mm @ sensing element | 15–25 | Low sensitivity |
| Fluxgate magnetometer ④ | −40 °C to +70 °C | 350 | ø100 mm × 125 mm @ system size | 2–6 | Power consumption |
| Optically pumped magnetometer ⑤ | −35 °C to +50 °C | >12,000 | 175 cm × 28 cm × 28 cm @ system size | 4 | Complex setup |
| SQUID magnetometer [68] | <−196 °C | >1000 | 12.5 mm × 12.5 mm @ chip size | <0.005 | Cooling |
① Estimated from the data in ref. [65]; ② Based on commercial product TMR9001 in MultiDimension Technology Co., Ltd. (Zhangjiagang Free Trade Zone, Jiangsu Province, China); ③ Based on commercial product MI-CB-1DH in AICHI STEEL CORPORATION (Tōkai city, Aichi Prefecture, Japan); ④ Based on commercial product Mag03 from Bartington Instruments Ltd (Witney, Oxon, OX28 4GG United Kingdom).; ⑤ Based on commercial product G882 marine magnetometer from GEOMETRICS, INC (San Jose, CA, USA).
Publisher’s Note: MDPI stays neutral with regard to jurisdictional claims in published maps and institutional affiliations. |
© 2021 by the authors. Licensee MDPI, Basel, Switzerland. This article is an open access article distributed under the terms and conditions of the Creative Commons Attribution (CC BY) license (https://creativecommons.org/licenses/by/4.0/).
Share and Cite
MDPI and ACS Style
Gao, J.; Jiang, Z.; Zhang, S.; Mao, Z.; Shen, Y.; Chu, Z. Review of Magnetoelectric Sensors. Actuators 2021, 10, 109. https://doi.org/10.3390/act10060109
AMA Style
Gao J, Jiang Z, Zhang S, Mao Z, Shen Y, Chu Z. Review of Magnetoelectric Sensors. Actuators. 2021; 10(6):109. https://doi.org/10.3390/act10060109
Chicago/Turabian StyleGao, Junqi, Zekun Jiang, Shuangjie Zhang, Zhineng Mao, Ying Shen, and Zhaoqiang Chu. 2021. "Review of Magnetoelectric Sensors" Actuators 10, no. 6: 109. https://doi.org/10.3390/act10060109
Note that from the first issue of 2016, this journal uses article numbers instead of page numbers. See further details here.