Development of a Regeneration Technique for Aluminum-Rich and Iron-Rich Phosphorus Sorption Materials


1
Department of Agricultural & Biological Engineering, Purdue University, West Lafayette, IN 47907, USA
2
National Soil Erosion Research Laboratory, USDA-ARS, West Lafayette, IN 47907, USA
*
Author to whom correspondence should be addressed.
Water 2020, 12(6), 1784; https://doi.org/10.3390/w12061784
Submission received: 22 May 2020
/
Revised: 16 June 2020
/
Accepted: 16 June 2020
/
Published: 23 June 2020
(This article belongs to the Special Issue Advances and Challenges in Improving Water Quality with Phosphorus Removal Structures: Scaling Up to the Field)
Abstract
:The reduction of dissolved phosphorus (P) transport to water systems is of critical importance for water quality. Phosphorus sorption materials (PSMs) are media with high affinity for dissolved P, and therefore serve as the core components of P removal structures. These structures can intercept dissolved P in surface and subsurface flows, before discharge into water bodies. While the P removal ability of PSMs has been extensively studied, lesser is known about the capacity to regenerate and recover P from P-saturated PSMs. This article evaluates a methodology to recover the P removal ability of aluminum- and iron-rich P-saturated PSMs. A series of flow-through experiments were conducted, alternating between P sorption (0.5 and 50 mg L P) and desorption with potassium hydroxide (KOH; 5 or 20 pore volumes [PV]), varying residence times (0.5 min and 10 min), and number of recirculations (0, 6 and 24). Across two cycles of sorption-desorption, Alcan, Biomax and PhosRedeem showed an average P recovery of 81%, 79%, and 7%, with standard deviation of 10%, 21% and 6%, respectively. The most effective regeneration treatment was characterized by the largest KOH volume (20 PV) and no recirculation, with up to 100% reported P recovery. Although KOH at 5 PV was less effective, the use of recirculation did increase P recovery. The lifetime of Al/Fe-dominated PSMs in P removal structures can be extended through feasible regeneration techniques demonstrated in this study, for both high and low P concentration scenarios.
1. Introduction
Phosphorus Sorption Materials (PSMs) are media with a high affinity for phosphorus (P) and the core of P removal structures, i.e., landscape-scale filters able to intercept surface and subsurface P-rich water. Phosphorus sorption materials can be broadly categorized as (1) natural materials; (2) manufactured materials; or (3) industrial residuals. Their ability to bind with dissolved P has been amply studied and several media have been tested to that end, including steel slag, acid mine drainage residuals, limestone, and gypsum [1,2]. A common characteristic among PSMs is their high affinity for dissolved P due to their calcium (Ca), magnesium (Mg), iron (Fe), or aluminum (Al) contents. These elements are responsible for actively retaining P from flowing waters through different mechanisms. Calcium- or Mg-rich media remove dissolved P primarily by precipitation, forming solid Mg/Ca-phosphates when pH is sufficiently high [3]. Aluminum- or Fe-rich materials retain P mainly through ligand exchange adsorption reactions on their surface hydroxyl sites. The practical difference between these mechanisms is reaction time: ligand exchange is a rapid reaction, while precipitation of phosphate compounds can have a much slower rate of reaction [4]. Another difference involves the ability to regenerate the media once they become saturated with P; for adsorption-based removal, the P sorption reaction can be reversed by favoring the desorption of P through shifts in chemical equilibrium conditions. However, for precipitation-based removal, the loss of Ca/Mg as P-precipitates prevents the recovery of the original sorption material.
The choice of PSM for a P removal structure is partly a function of the P removal mechanism, either precipitation or adsorption, as well as the characteristics of the incoming flow, especially peak flow rate and residence time. Other factors that will influence the choice of PSM and the potential efficacy of a P removal structure are incoming P concentration, volume, and direction of flow. These factors will also define the longevity of the PSM; once saturated, it will require replacement, or regeneration of the media.
The purpose of this study was to develop and evaluate a methodology to recover the P removal ability of P-saturated Al/Fe-based PSMs using potassium hydroxide (KOH). If successful, this would prevent the need for frequent physical replacement of PSMs, decreasing costs and further simplifying the use of P removal structures.
1.1. Sorption of P by Al/Fe-Rich Materials
In the context of P removal technologies, Al/Fe-rich media, such as Al/Fe oxides, iron mine tailings, Al/Fe-coated materials and alum residuals, have been evaluated as sorbents for phosphate, demonstrating varying degrees of efficiency of P sorption. In the literature, there are examples of applications in wetlands, wastewater, non-point drainage and groundwater treatment [4,5,6,7,8,9]. For example, Wood and McAtamney [7] reported a 93% P removal by using laterite—a material rich in hydrous oxides of Fe and Al, in a newly constructed wetland. Dobbie et al. [5] investigated the use of iron ochre (Fe(OH) and FeO(OH)) for removing P from a secondary-treated wastewater effluent. The authors observed a 50% removal of total P mass, indicating a significant efficacy of the media to remove P from wastewater. Clayton et al. [10] observed that iron mine tailings significantly reduced P release from lake sediments to solution, suggesting the formation of hydrous ferric oxide complexes or precipitates containing P. Coated materials have also been reported in the literature. For example, Ayoub et al. [11] evaluated the performance of Al/Fe hydroxy(oxide) coated sand and olivine, showing a removal of 70% to 90% depending on the source of P, i.e., either water or wastewater, with outflow concentrations of 0.05 mg L.
Phosphorus adsorption by metal (hydr)oxides is a well-understood process. As Fe is a ubiquitous component of soils (especially tropical and highly weathered soils), the mechanisms of P adsorption by metal oxides has been amply studied and can be applied to the context of Al- and Fe-rich PSMs. Phosphate (PO) sorption onto Al/Fe-rich PSMs can be accomplished through three different mechanisms: (1) precipitation of metal-phosphates through dissolution of Fe, Fe or Al, (2) ligand exchange on particle surfaces, and (3) anion exchange at low pH range [4,12].
Both ferric (Fe) and ferrous (Fe) iron react with phosphate, forming precipitates, hydrous ferric oxide and phosphate compounds, depending on pH and Eh. Most Fe minerals are insoluble, but under acidic conditions, they dissolve and can then react with PO. In wastewater treatment, Mao and Yue [13] claimed that to remove P using ferric salts, the most efficient route is to form the precipitate FePO4(s), due to the 1:1 molar ratio of Fe and P. However, at circumneutral pHs, this precipitation reaction is unlikely to occur, and P removal is dominated by phosphate adsorption to ferric oxides [13], according to the reaction:
Aluminum hydroxide is also a popular chemical for phosphorus removal in wastewater and it has been used in lake restoration as a P coagulant agent [14]. The P adsorption mechanism onto Al-rich PSMs is similar to the process described in Equation (1), the ligand exchange between H(PO) and the hydroxide groups on the surface of the minerals.
Essentially, the metal (Al/Fe) beneath the surface hydroxyl acts as a Lewis acid and exchanges the surface OH groups for phosphates, resulting in an inner-sphere complex (no water in between). The exact type of complex being formed depends on the type of Al/Fe (hydr)oxides, pH and initial P concentration, and determines the strength with which P is bound [15]. Equation (1) also illustrates the determinant role of pH in P adsorption. In general, as pH decreases, H(PO) adsorption increases, whereas solubility of the metal-phosphate complex decreases [16]. Siwek et al. [16] stated that the optimal pH range for the formation of durable Fe-P compounds is between 5 and 7. In this range, the electrostatic attraction between P and the Fe-rich PSM is optimum (pH of solution is lower than its point of zero charge and P is in its anionic form). For Al, Tanada et al. [17] reported a maximum P adsorption capacity by aluminum oxyhydroxide at pH = 4.
1.2. Desorption of P from Al/Fe-Rich Materials
Once the Al/Fe-rich PSMs are saturated and are not able to sequester additional dissolved P, there are two options for the P removal structure to continue functioning: (1) replacement, or (2) regeneration of the media. Due to a relatively high cost of Al/Fe-rich PSMs and labor-intensive processes of replacing the material after exhaustion, regeneration is of great interest. Few studies on regeneration of PSMs at bench-scale and pilot-scale have been reported in the literature. A standard treatment able to be performed at the field scale is yet to be determined. In particular, most studies do not use a feasible volume of regenerative solution able to be scaled up to field conditions (i.e., the solid-solution ratio established at the laboratory scale must be maintained for providing the same proportion between available OH and surface sorption sites).
An example of existing regeneration treatments is reported by Sibrell and Kehler [18], in which they tested a regeneration treatment on granular ferric hydroxide media samples, after an extensive P removal trial to remediate trout wastewater. The authors used 0.5 M NaOH solution in a 24-h recirculation. Prior to the addition of NaOH, the media was washed with softened tap water, followed by a rinse with 0.5% sodium hypochlorite. At the conclusion of the regeneration sequence, the media was again washed with tap water and the authors continuously sparged CO to maintain an optimal pH in the interstitial solution. They reported a 45% desorption of P. Although the volume of regenerative solution was not reported in this study, the authors mention prior research that resulted in 70–80% of recovery by using up to 60 bed volumes of 0.5 M NaOH solution [19].
Allred et al. [4] tested desorption/dissolution cycles after a P sorption saturated column experiment. The methodology consisted of a 3-pore volume flush with a 4% by weight NaOH solution followed by a 27 pore volume distilled water rinse. The authors reported that around 80% of the adsorbed P was remobilized in the regeneration process tested in columns. In column experiments, the regenerated material exhibited the same effectiveness of P removal when compared to the original media (>98%). When tested in a field scale filtering system, the regenerated material was able to remove 34% of incoming phosphate in comparison to 75% removal by the original iron oxyhydroxide. However, in the field scale system, the authors used 195 L of 4% by weight NaOH solution, while the pore volume of the PSM in the field system was 229 L; to reproduce the laboratory conditions, 687 L would be required for a 3 pore volume flush. The lesser volume used for regeneration may have contributed to the inferior performance of the field system as compared to the results obtained from the laboratory trial.
In another study, Kunaschk et al. [20] successfully tested a regeneration method on a granular hydrated ferric oxide using three steps: (1) Fe-rich adsorbent was rinsed with diluted hydrochloric acid, (2) desorption of P using 80 to 100 bed volumes of 1 M NaOH solution and (3) adsorbent was rinsed with deionized (DI) water until reaching a near-neutral pH. The authors reported that the adsorbent was nearly restored to its initial state after six regeneration cycles.
The regeneration research cited above share one common notion: pH manipulation forcing P from the surface adsorption sites. Ligand exchange is a pH-sensitive mechanism, and the affinity between the media and P is directly affected by the addition of OH. The added anion competes with the adsorbed phosphate and the equilibrium in Equation (1) is reversed.
In this research, we evaluated the degree of reversibility of P adsorption by Al/Fe compounds and, based on that, we aimed to develop a regeneration strategy for Al/Fe-rich PSMs, in order to improve cost and longevity of P removal structures. Specifically, the objectives for this work were to (1) evaluate P removal by three different Al/Fe-rich media at two different inflow P concentrations under flow-through conditions; (2) test the efficiency of different pore volumes, residence time, and number of recirculations on stripping P from PSMs; (3) quantify the ability of the regenerated media to remove P; and (4) determine if regeneration is repeatable. This study differs from previous research on PSM regeneration in that it uses simpler regeneration sequences and feasible pore volumes, residence time, and number of recirculations that can be translated to manageable techniques when scaling up to field P removal structures.
2. Materials and Methods
2.1. Characterization of PSMs
ActiGuard AAFS50 (henceforth referred to as Alcan), Biomax and PhosRedeem are the objects of this research. Alcan and Biomax are manufactured media, while PhosRedeem is a naturally occurring mined mineral; all three are commercialized as media for contaminant removal. Alcan (Axens Solutions, Rueil-Malmaison, France) is an iron-enhanced activated alumina, marketed for arsenic removal, but also proven useful in phosphate and nitrate reduction [21]. Biomax is a product of ABS Materials (Wooster, OH, USA), marketed as a solution for stormwater treatment [22], and PhosRedeem (US Iron LLC Mines, Miramar Beach, FL, USA) is an iron oxide-based mineral, marketed specifically for P removal of surface waters.
Table 1 shows the major elemental composition of the tested PSMs, obtained through acid digestion (Method USEPA 3050B Acid digestion of sediments, sludges and soils; six replications). The Al, Ca, Fe and Mg concentration in digestates was determined by inductively coupled plasma optical emission spectroscopy (ICP-OES). Media pH (two replications) was determined with an ion-selective electrode in deionized (DI) water (1:5 solid:solution ratio) after equilibration for 15 min.
Prior to the experiments, PhosRedeem was sieved to obtain between 0.5–2 mm particle diameter. Alcan was washed with DI water and filtered through a geotextile fabric (ADS Geosynthetics 0401T, Advanced Drainage Systems, Hilliard, OH, USA), typically used in the field for constructing P removal structures and blind inlets, in order to remove very fine particles.
2.2. Preliminary Evaluation: Flow-through Experiments and Batch Isotherms
To evaluate the P removal capacity of the PSMs under flowing conditions, we conducted flow-through sorption experiments. A summary of the flow-through technique and setup is further detailed in Penn and Bowen [23]. Essentially, this method is characterized as a dynamic sorption experiment, in which a continuous flow of a P-rich solution passes through a cell containing a known mass of PSM. By collecting samples at predetermined intervals and analyzing for dissolved P concentrations, the total amount of sorbed P is calculated and presented as a function of the cumulative amount of added P. The experiment is ideally conducted until PSM saturation, and duration depends on the sample, incoming concentrations and flow rate. In this work, the objective of the flow-through experiments was to estimate the total P removal capacity of the PSM (in terms of mg P per kg of PSM; “P”) under the flow-through conditions given below. At this target, the PSMs are considered “saturated” and are no longer effective for removing P (i.e., inflow and outflow P concentrations are equal).
We conducted the flow-through experiments using two inflow P concentrations: 0.5 mg L and 50 mg L, simulating typical agricultural drainage and wastewater P concentrations, respectively. The solutions were produced with potassium phosphate (KHPO) and DI water. The mass of PSM used in the experiments varied between 0.75 g and 3 g, and inert pure quartz sand (Acros Organics, CAS: 14808-60-7) was added to complete 5 g of media in the flow-through cell, in order to achieve the desired pore volume. The theoretical hydraulic residence time (RT) was 0.28 min and the duration of the experiments varied between 360 and 720 min, depending on the materials and P inflow concentration. All flow-through experiments were conducted in duplicates.
The results from this preliminary evaluation allowed calculation of P under the specified flow-through conditions, i.e., the target in the first sorption phase (S0) of the regeneration sequence. The P value (Table 2) was calculated as the mean between the two replicates of each material.
Following the preliminary flow-through sorption experiments, we conducted batch isotherms to determine the P concentrations (mg L) that corresponded to the target P (mg P per kg of PSM) for each PSM at both inflow P concentrations (i.e., 0.5 and 50 mg L; Table 2). Using batch isotherms in the first sorption phase allowed for quickly saturating a large mass of PSM to the level of P, in preparation for testing the first regeneration. The P concentrations tested in the isotherms (solid:solution ratio of 1:15 and 3 hours of equilibration) were 0, 0.5, 5, 25, 50, 100, 200, 500, 750 and 1000 mg L. The isotherms revealed a linear behavior for all PSMs. After fitting the appropriate model, we were able to establish the P concentration that would be used for saturating the PSMs in order to achieve P (individual P concentrations are listed below).
2.3. Sorption-Desorption Cycles: Testing Regeneration Treatments
The regeneration treatments were evaluated through sorption-desorption cycles (Table 3). The experiments were conducted on the flow-through system, except for the first sorption phase (S0). The objective of S0 was simply to load the PSM sample to achieve P previously determined from the preliminary flow-through experiments, specific to each PSM and inflow P concentration. Using the same solid:solution ratio and equilibration time as the batch isotherm, a sufficient mass of each PSM was initially saturated to achieve their respective P, for use in the subsequent regeneration experiments described below. Specifically, the value corresponding to the 0.5 mg P L inflow P was achieved by equilibrating 1000, 570, and 88 mg P L with Alcan, Biomax, and PhosRedeem, respectively. For the 50 mg L inflow P value, samples were equilibrated with 1250, 1470, and 2800 mg P L with Alcan, Biomax, and PhosRedeem, respectively. The target P values are listed in Table 2. The remaining phases were all conducted in the flow-through system with several adaptations for desorption, including the elimination of the Mariotte bottle, since specific pore volumes and recirculation number were being tested.
Every sorption phase was followed by a desorption phase, i.e., the regeneration step. 1 M KOH was used as the regenerative solution. Hydroxyl is the hardest Lewis base among common inorganic anions, therefore, KOH acts as an eluting reagent [24]. The use of KOH rather than NaOH was proposed to potentially increase the added value of the final extract, which would contain both potassium (K) and P.
We tested regeneration treatments at two different initial P values by varying the volume of regenerative solution, RT and number of recirculations (Figure 1). The volume of regenerative solution tested was 5 and 20 pore volumes. The regeneration treatment consisted of adding the appropriate amount of KOH to the sample inside the adapted flow-through cell and adjusting the flow rate to achieve the desired RT: 0.5 min or 10 min. When recirculation was tested, the outflow tube of the cell was connected back into the inflow and the KOH solution was allowed to recirculate through the media to test the impact of 6 and 24 recirculations. For no-recirculation experiments, once the entire solution flowed through the PSM, it was immediately collected and not pumped back into the inflow of the cell. After desorption, the PSM samples were rinsed twice in a 60-mL vial to remove P remaining in pore water. The rinse involved using a 0.01 KCl solution at a ratio of 1:15 with 5 min equilibration. The same rinsing process was repeated after sorption cycles, but only once. The PSM samples were then air-dried before the next phase.
As described in Table 3 and Figure 1, we conducted 2 cycles of sorption-desorption. Table 3 specifies the terms “cycle” and “phase”, respectively, as the sorption-desorption sequence (cycle) and the individual sorption or desorption experiments (phase), e.g., cycle 0 refers to the first sorption-desorption phases jointly, while phase S0 refers to the first sorption run alone. By repeating the sorption-desorption cycle, the main purpose was to evaluate whether repeated regeneration would result in similar efficacy of P stripping. All collected samples from sorption and desorption phases were analyzed calorimetrically by the Murphy–Riley method [25], using an automated analyzer (Gallery, Thermo Fisher Scientific, Waltham, MA, USA).
3. Results and Discussion
In this section, we first discussed the P removal ability of the tested PSMs as measured in the flow-through experiments (Section 3.1). Then, we evaluated the proposed regeneration treatments (Section 3.2), assessing the effects of P concentration (Section 3.2.1), residence time (Section 3.2.2) volume of regenerative solution (Section 3.2.3) and recirculation (Section 3.2.4). Finally, in Section 3.2.5, we examined the efficacy of repeated desorption phases.
3.1. Preliminary Experiments: Evaluation of P Removal Ability of Al/Fe-Rich PSMs
All PSMs possessed a high content of Fe; the differences among them are most evident regarding Ca and Al proportions. Alcan and Biomax are Al-dominated, while PhosRedeem is Fe- and Ca-dominated. Based on the pH measurements, we can conclude that Alcan and Biomax offer favorable conditions for P adsorption by Al/Fe, while pH of PhosRedeem is within the range that favors Ca precipitation. Nevertheless, as Fe and Al were predominant, the expectation was that P removal would be dominated by adsorption, a mechanism less dependent on RT. Based on that, the sorption experiments were conducted under a short RT (0.28 min) for all PSMs.
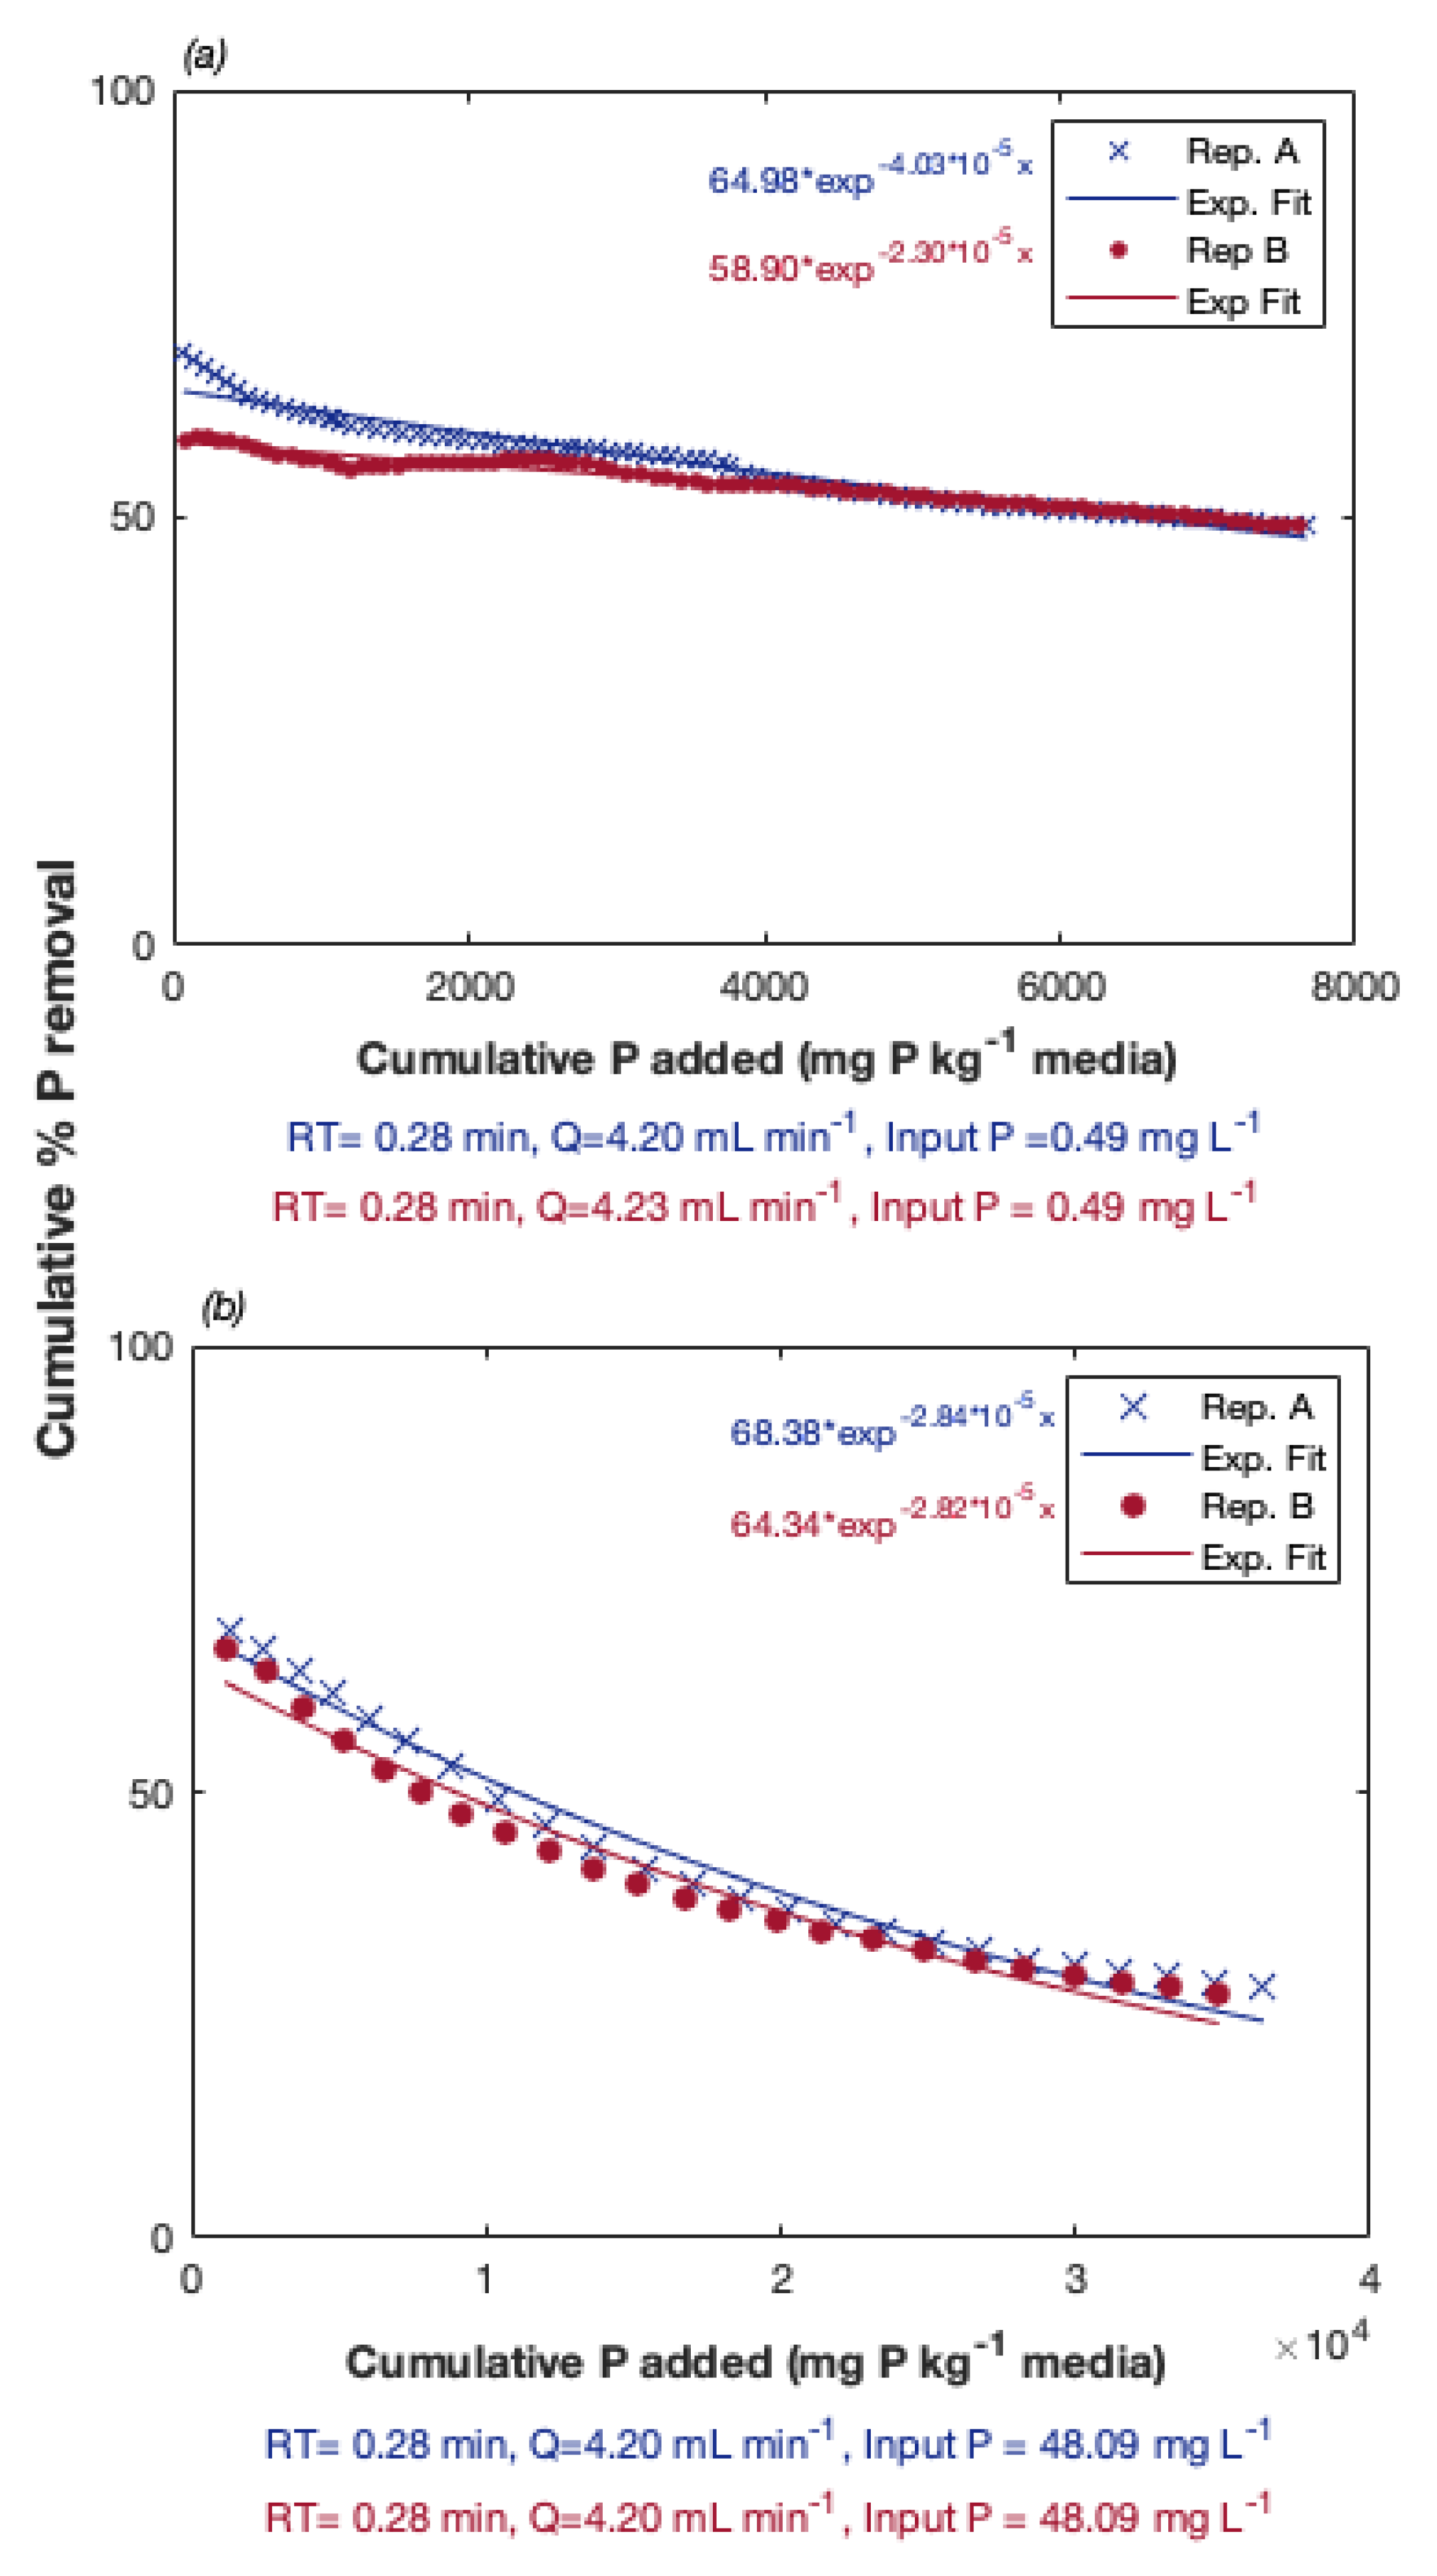
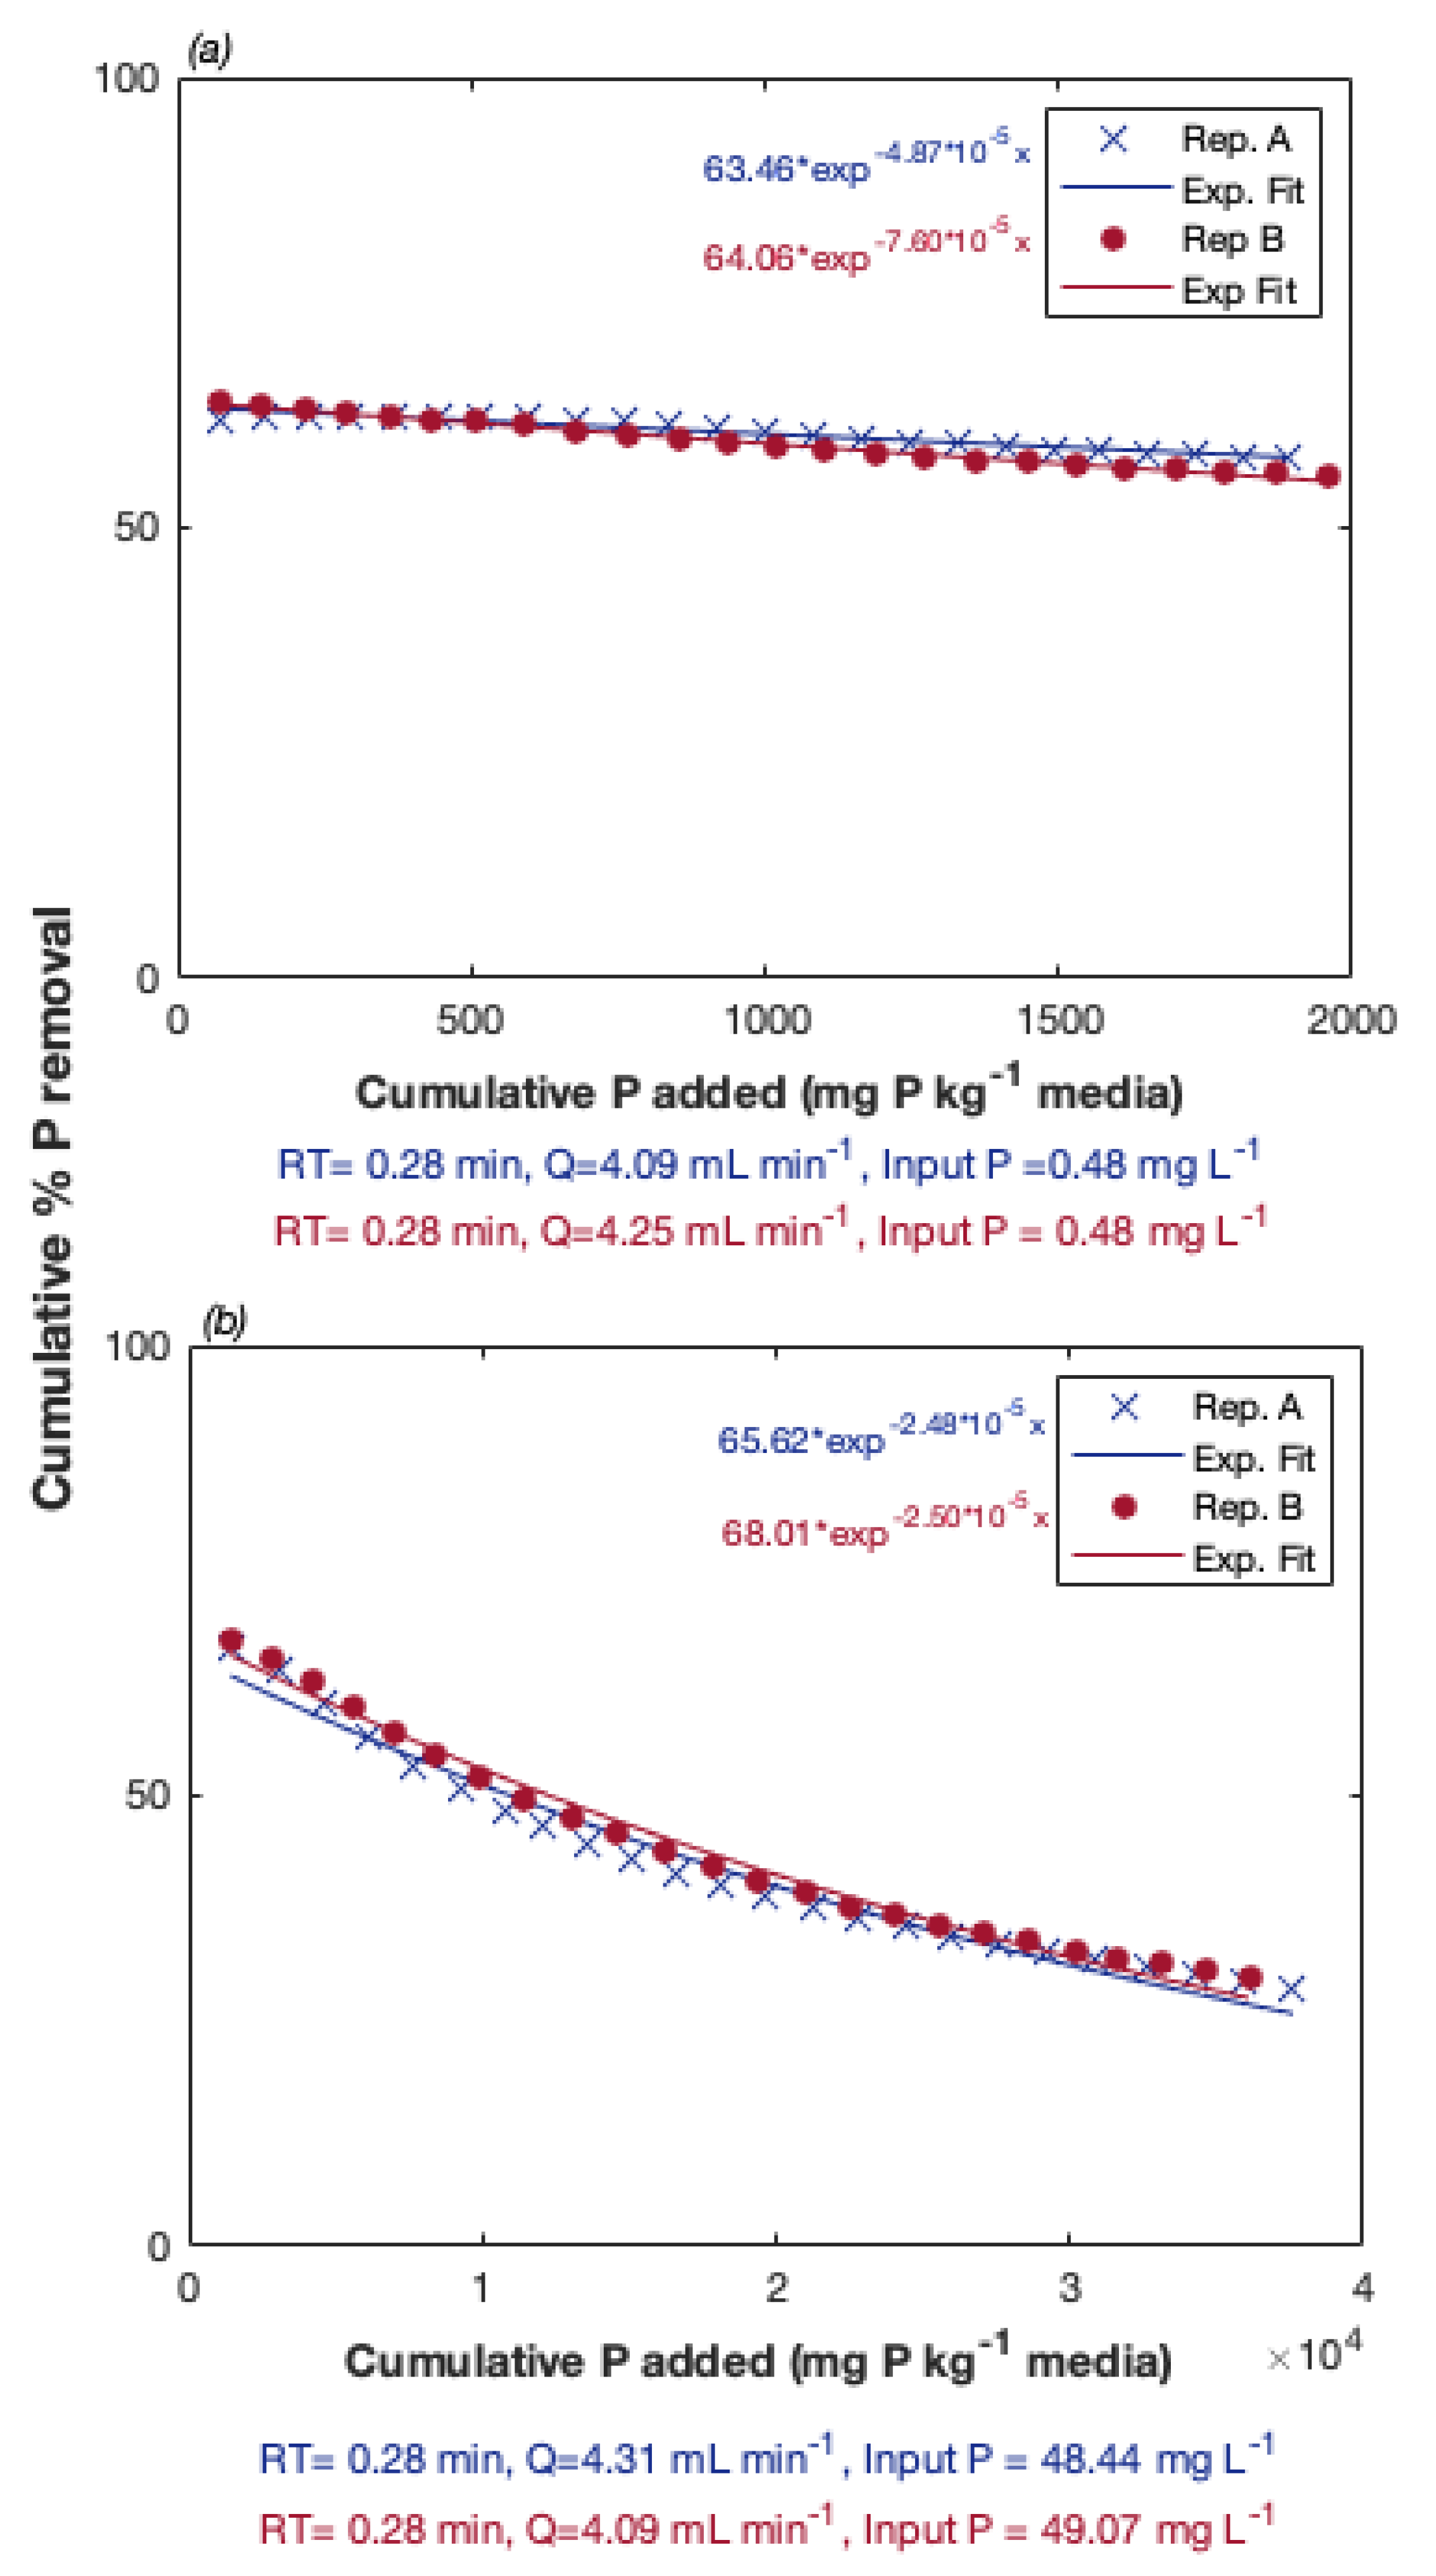
Cumulative P removal under flow-through conditions was measured as a function of total P added during the experiments. We tested two levels of P concentrations, as described in Section 2.2. The advantage of flow-through experiments over the more common batch isotherms is the ability to determine a more practical P value that is specific to flow-through conditions, rather than an absolute maximum that occurs through saturating media with unrealistic P concentrations. The flow-through experiments simulate processes occurring in P removal structures, therefore, the estimated P removal potential can be scaled up to field installations. P removal potential is estimated with more realistic conditions. The P removal flow-through curves are shown in Figure 2, Figure 3 and Figure 4, for both P concentration levels.
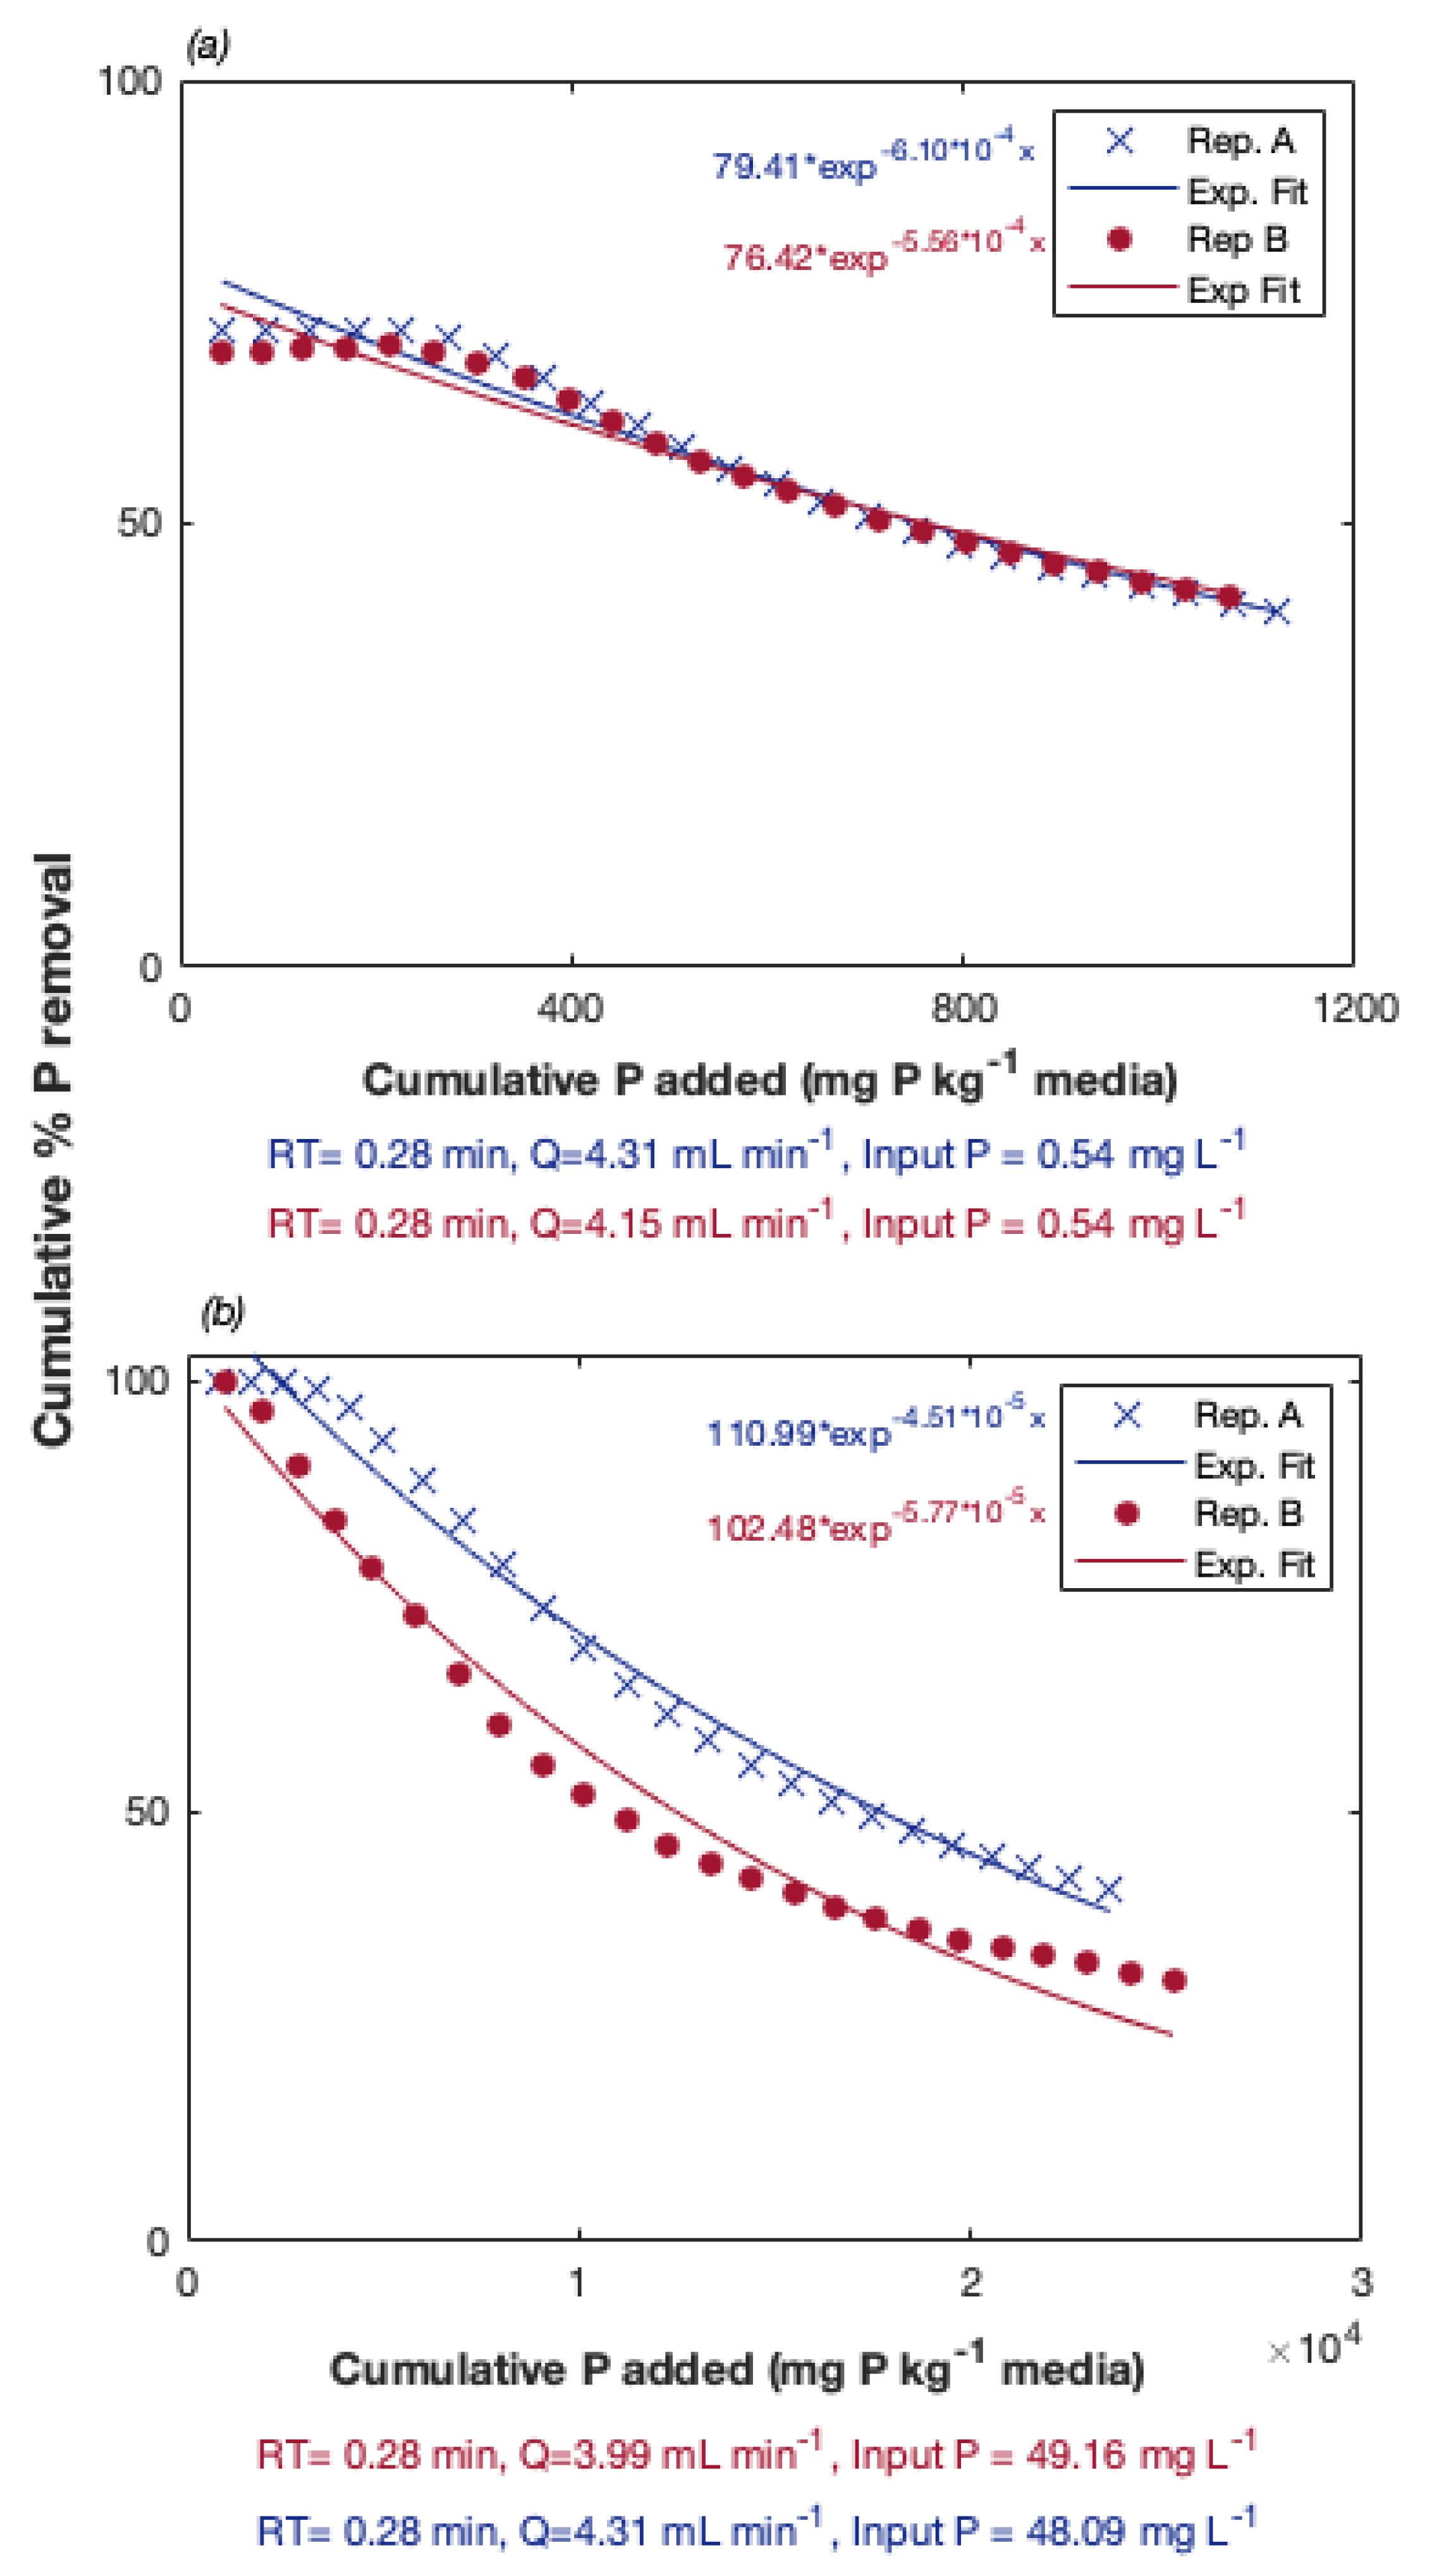
The shape of the curves provides information about P removal potential and longevity of PSMs. For instance, a steeper slope, such as the one observed in the PhosRedeem curves, is an indication of a short-lived PSM. On the contrary, Biomax and Alcan exhibited a gradual decay, indicating a longer lifetime in comparison to PhosRedeem, as quantified by the slope of the exponential model listed in Table 2 and Figure 2, Figure 3 and Figure 4. Additionally, P removal curves for Biomax and Alcan were similar at both 0.5 and 50 mg P L, as indicated by the slope and intercept of the exponential equations. However, Alcan demonstrated a greater longevity in the 0.5 mg L experiments. After adding 8000 mg P kg media, cumulative P removal by Alcan was still above 40%, which is considered the target P reduction for western Lake Erie as established by the Great Lakes Water Quality Agreement (GLWQA) [26].
The differences in P removal between the PSMs at 0.5 mg P L inflow were not observed during the 50 mg P L sorption experiments. In fact, for the 50 mg L experiments, Alcan, Biomax and PhosRedeem had a relatively similar behavior in terms of P removal, while the PhosRedeem had a much lower slope compared to Alcan and Biomax at 0.5 mg P L (Table 2). For Alcan and Biomax, the similarity in flow-through sorption slope and intercepts between the 0.5 and 50 mg P L experiments reveals that the P sorption mechanism is likely dominated by ligand exchange. Little difference in percent P removal with increasing P concentrations is a characteristic of ligand exchange that distinguishes it from precipitation [27], whereas precipitation increases percent P removal as the initial concentration is increased. Phosphorus removal by PhosRedeem improved with inflow concentrations of 50 mg P L compared to 0.5 mg P L, suggesting precipitation as the dominant mechanism. Overall, we can conclude that all three PSMs tested would behave similarly in removing P from wastewater treatment plants; however, Alcan would be the most appropriate media to be used to treat non-point drainage water containing low P concentrations.
3.2. Regeneration Treatments
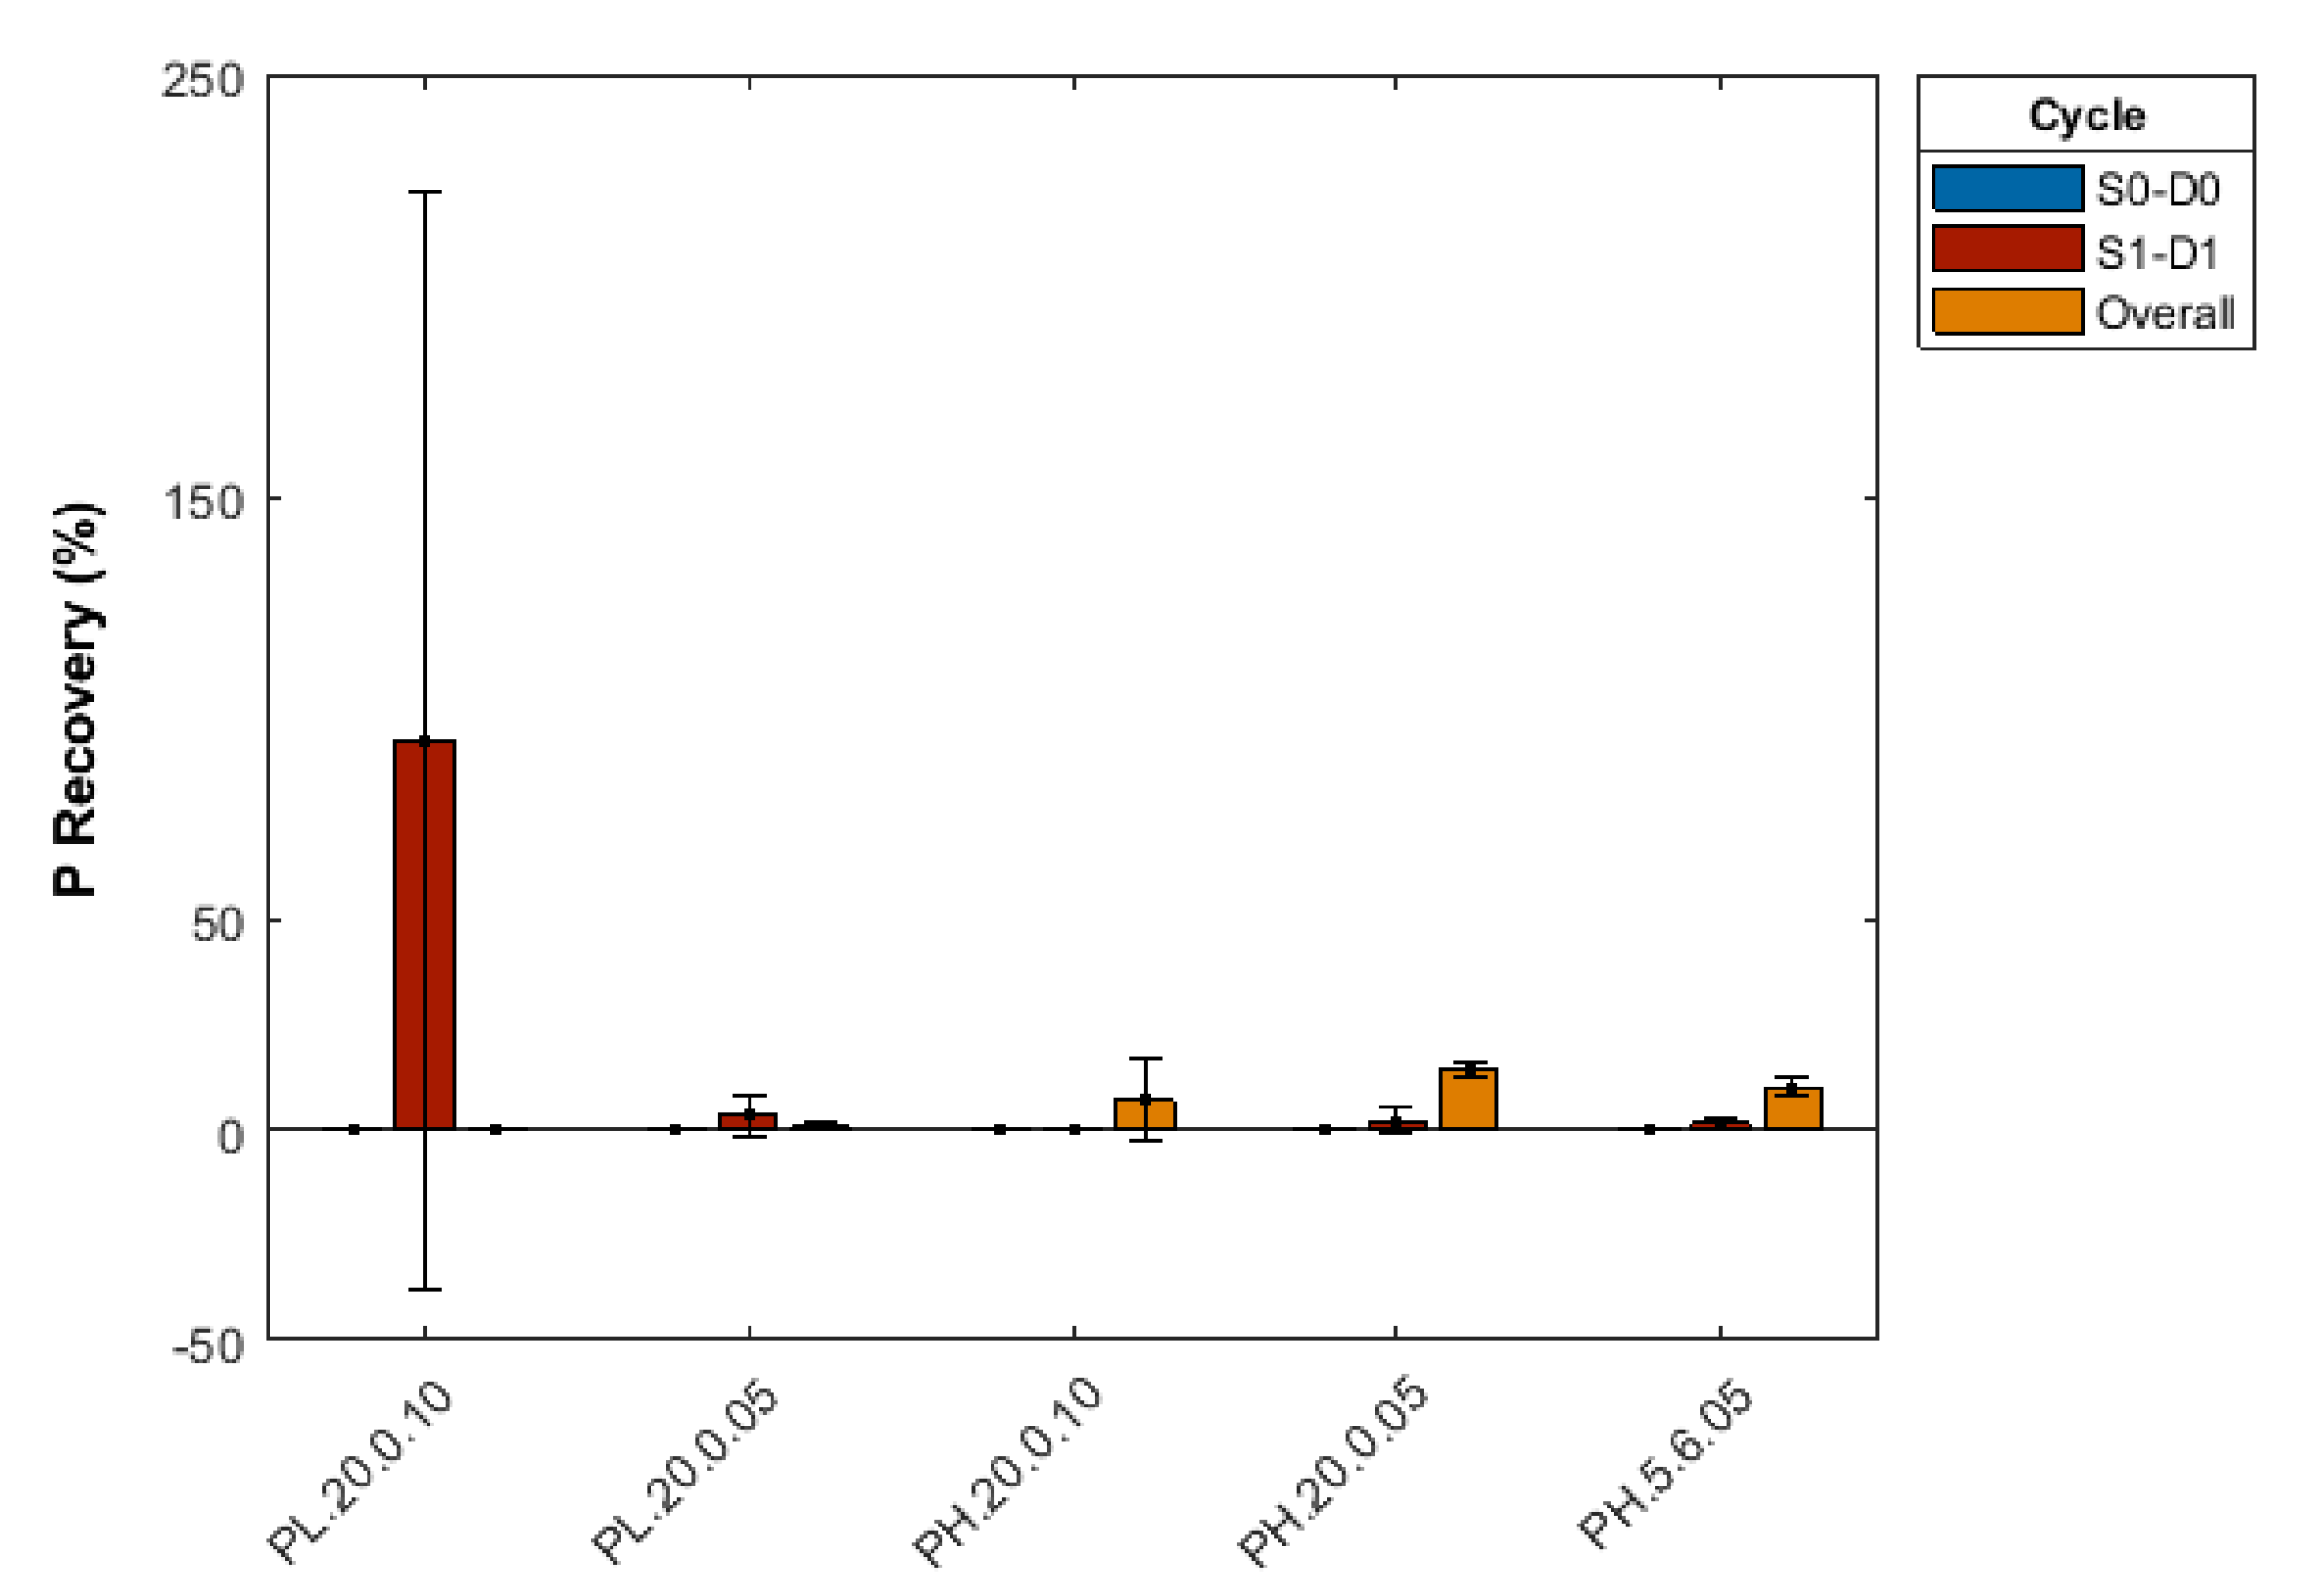
Overall, PhosRedeem had the lowest desorption efficacy when comparing the PSMs. In fact, during the 0.5 mg P L PhosRedeem treatments, none of the evaluated desorption phases were able to displace P. The unsuccessful desorption can be attributed to the fact that the dominant removal mechanism for PhosRedeem is likely Ca-phosphate precipitation and not Fe adsorption. Because Ca-dominated PSMs with pH levels above 6, such as PhosRedeem (Table 1), favor the precipitation of Ca-phosphates [20], the proposed regeneration treatment would be ineffective for such products. The pH measured in treated water samples confirmed the prevalence of elevated pH. More specifically, the range of pH measured in random outflow samples collected from the PhosRedeem 0.5 mg L flow-through experiments was 8.98 to 10.19. For the same experimental conditions, pH range of Alcan and Biomax flow-through samples was 6.31–9.35 and 6.12–9.39, respectively, with the lower values reported towards the end of the experiment. Further evidence of P removal via precipitation is supported by the increase in P removal from increasing P inflow concentrations from 0.5 to 50 mg P L, as previously discussed.
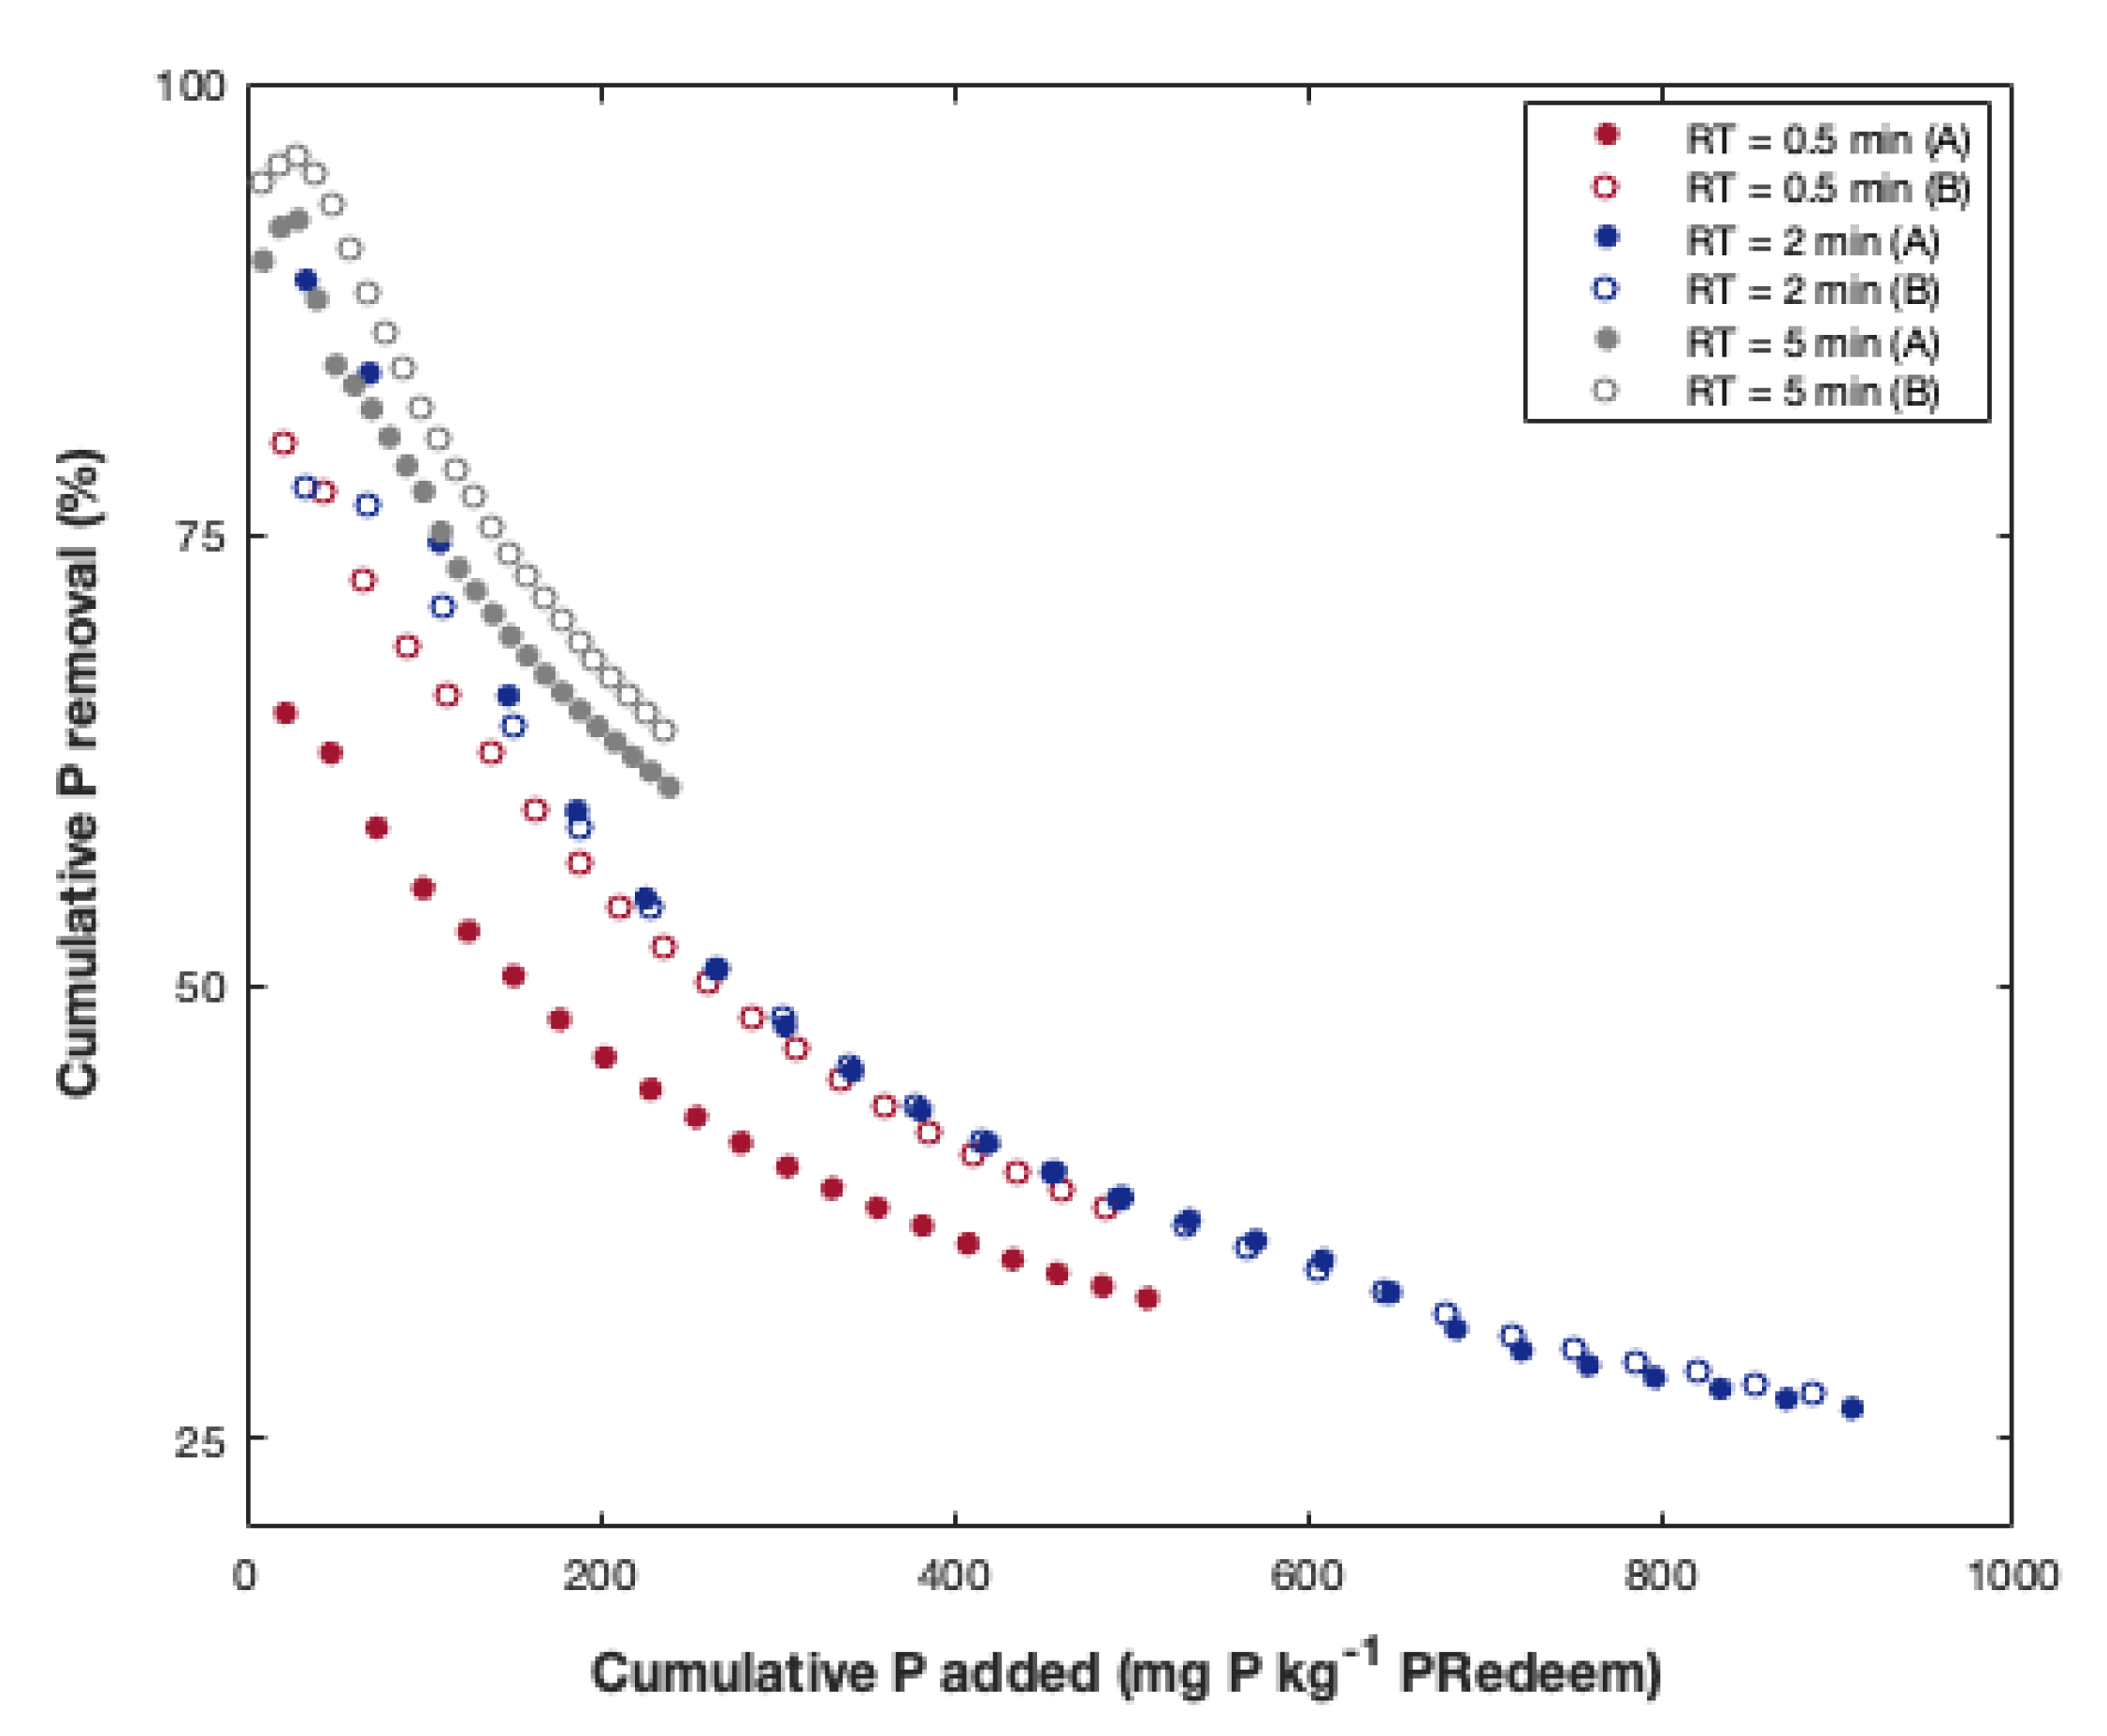
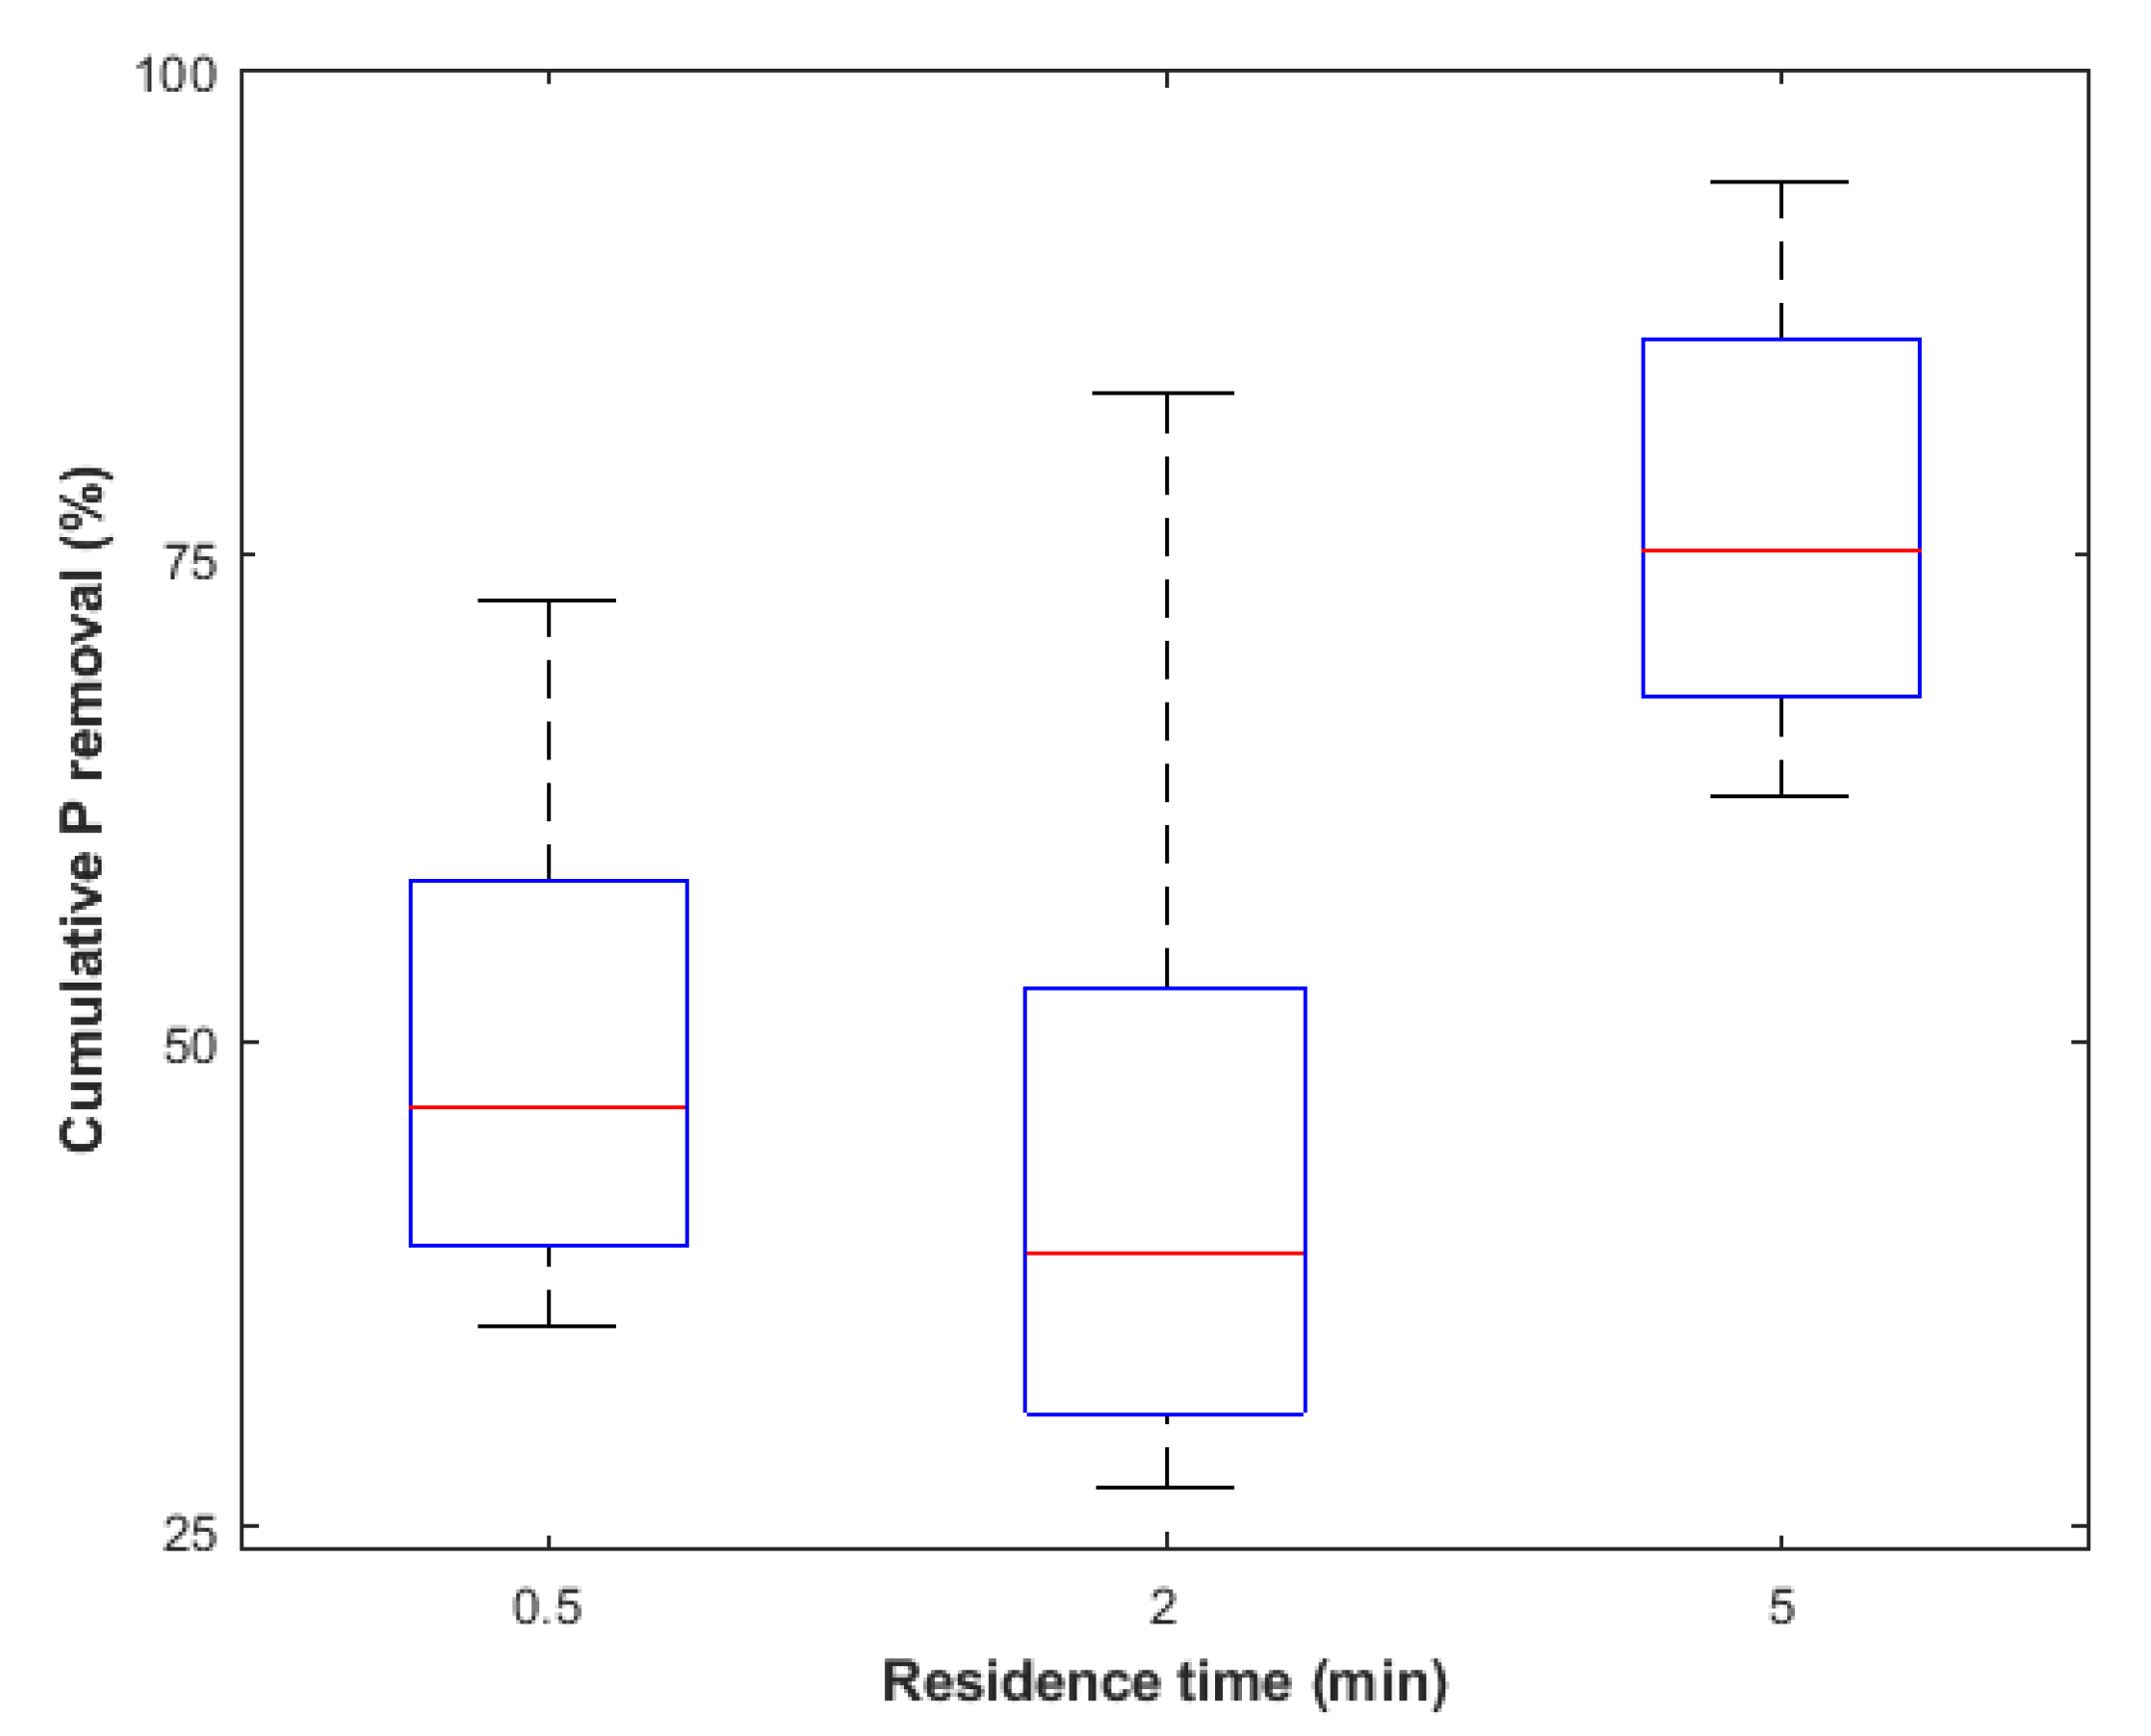
Additionally, in order to illustrate the dependency of PhosRedeem P removal on Ca precipitation—and therefore, on RT, we conducted flow-through sorption experiments under various RT: 0.5, 2 and 5 min (Figure A1). It is clear that P removal was dependent on RT (Figure A2). For instance, consider the experiments conducted with a 5-minute RT compared to 0.5 min. The greater P removal at a RT of 5 min was confirmed by a Tukey Studentized Range Test, through which we concluded that RT = 5 min results in significantly greater P removal in comparison to the other RTs ().
All tested regeneration treatments were successful on Biomax and Alcan, for samples produced from both 0.5 and 50 mg P L P sorption experiments. The differences in desorption capacity between the tested treatments are discussed in the sections below. We evaluated the efficacy of desorption as “P recovery”, a relative measurement calculated according to Equation (2):
P recovery was calculated per cycle and was used as the comparative measure for the different treatments and PSMs tested. Additionally, we present the net P sorbed after completing all cycles. The average P recovery across all treatments and sorption-desorption cycles was 81%, 79% and 7% for Alcan, Biomax and PhosRedeem, with standard deviations () of 10%, 21% and 6%, respectively.
3.2.1. Effect of P Concentration on Regeneration
As discussed in Section 2.2, we tested two levels of P concentrations, 0.5 and 50 mg P L. Intuitively, we expected that the PSM saturated with the greater P concentration (50 mg P L) would result in more P being stripped in the subsequent desorption phase. It is known that the sorption of P is concentration-driven, the question here was whether the desorption would also exhibit similar behavior.
In absolute terms, we can see that 50 mg P L experiments did in fact result in a greater amount of desorbed P, but the increase in desorption was not proportional to the P concentration increase from 0.5 to 50 mg P L. For instance, for Alcan, the first desorption phases (D0) exhibited a range of total desorbed P of 4380–10,900 and 5000–13,300 mg P per kg of media across the different treatments for the 0.5 mg P L and 50 mg P L, respectively. For Biomax, the ranges were 1700–8000 and 7800–16,100 mg P kg PSM for the low and high levels of P concentration, respectively. However, when considering 0.5 mg P L and 50 mg P L in terms of the amount of P desorbed compared to the amount of P sorbed in the previous sorption phase, we can identify a certain proportionality in most of the tested treatments. The predicted amount of P to be desorbed in the 50 mg P L experiments was calculated based on the proportion of total adsorbed and desorbed in the 0.5 mg P L experiments. (A true proportional amount of P desorbed in the 50 mg P L experiments would be 100% of the expected amount of desorbed P, based on the results obtained in the 0.5 mg P L experiments.) The observed and predicted P desorbed were similar in 4 and 3 of the 5 desorption treatments with Alcan and Biomax, respectively (100% ± 10%). The remaining predictions showed a deviation of 55% or less compared to the actual results for both Alcan and Biomax.
Overall, the desorptions following the 0.5 mg L P and 50 mg L P sorption experiments showed similar P recovery for both Biomax and Alcan. For instance, Alcan exhibited an average P recovery across all treatments of 67% and 64% for low and high P concentrations, respectively, with standard deviations () of 26% and 16%. For the same experimental conditions, Biomax exhibited an average P recovery of 65% ( = 20%) and 64% ( = 21%).
For PhosRedeem, the 0.5 mg P L desorption treatments were virtually ineffective. For the 50 mg P L samples, however, D0 could remove a portion of P (9% to 16% of total P sorbed during previous P sorption phase). We do not attribute the P desorption to chemical regeneration via ligand exchange, but rather a result of dissolution of P minerals formed in the sample. This conclusion arises from the fact that both KOH and the KCl wash were equally effective in removing P from the PhosRedeem samples. The second desorption phase (D1) was again virtually ineffective for this PSM, at both P concentrations tested.
Thus far, the discussion regarding P concentration was based solely on cycle 0, the first sorption-desorption cycle, aiming to isolate the effect of input P concentrations on regeneration. For the second phase (D1), carry-over effects must also be considered. Overall, the results showed that Biomax and Alcan at both low and high P saturation levels can be regenerated to achieve similar P recovery. For PhosRedeem, regeneration treatments were ineffective at both P concentration levels.
3.2.2. Effect of Residence Time
We tested two residence times (RT) during the regeneration phases: 0.5 and 10 min. Our hypothesis was that a longer RT would allow for a greater contact between the KOH solution and media, resulting in a more effective P desorption.
Both RTs were tested using 20 pore volumes of KOH for each PSM and no recirculation. At this point, we had already established that the regeneration treatment was not effective for PhosRedeem, and therefore this PSM is excluded from this discussion. Additionally, only D0 was used for the comparison between RTs, aiming to isolate the effect of this variable on the regeneration treatment.
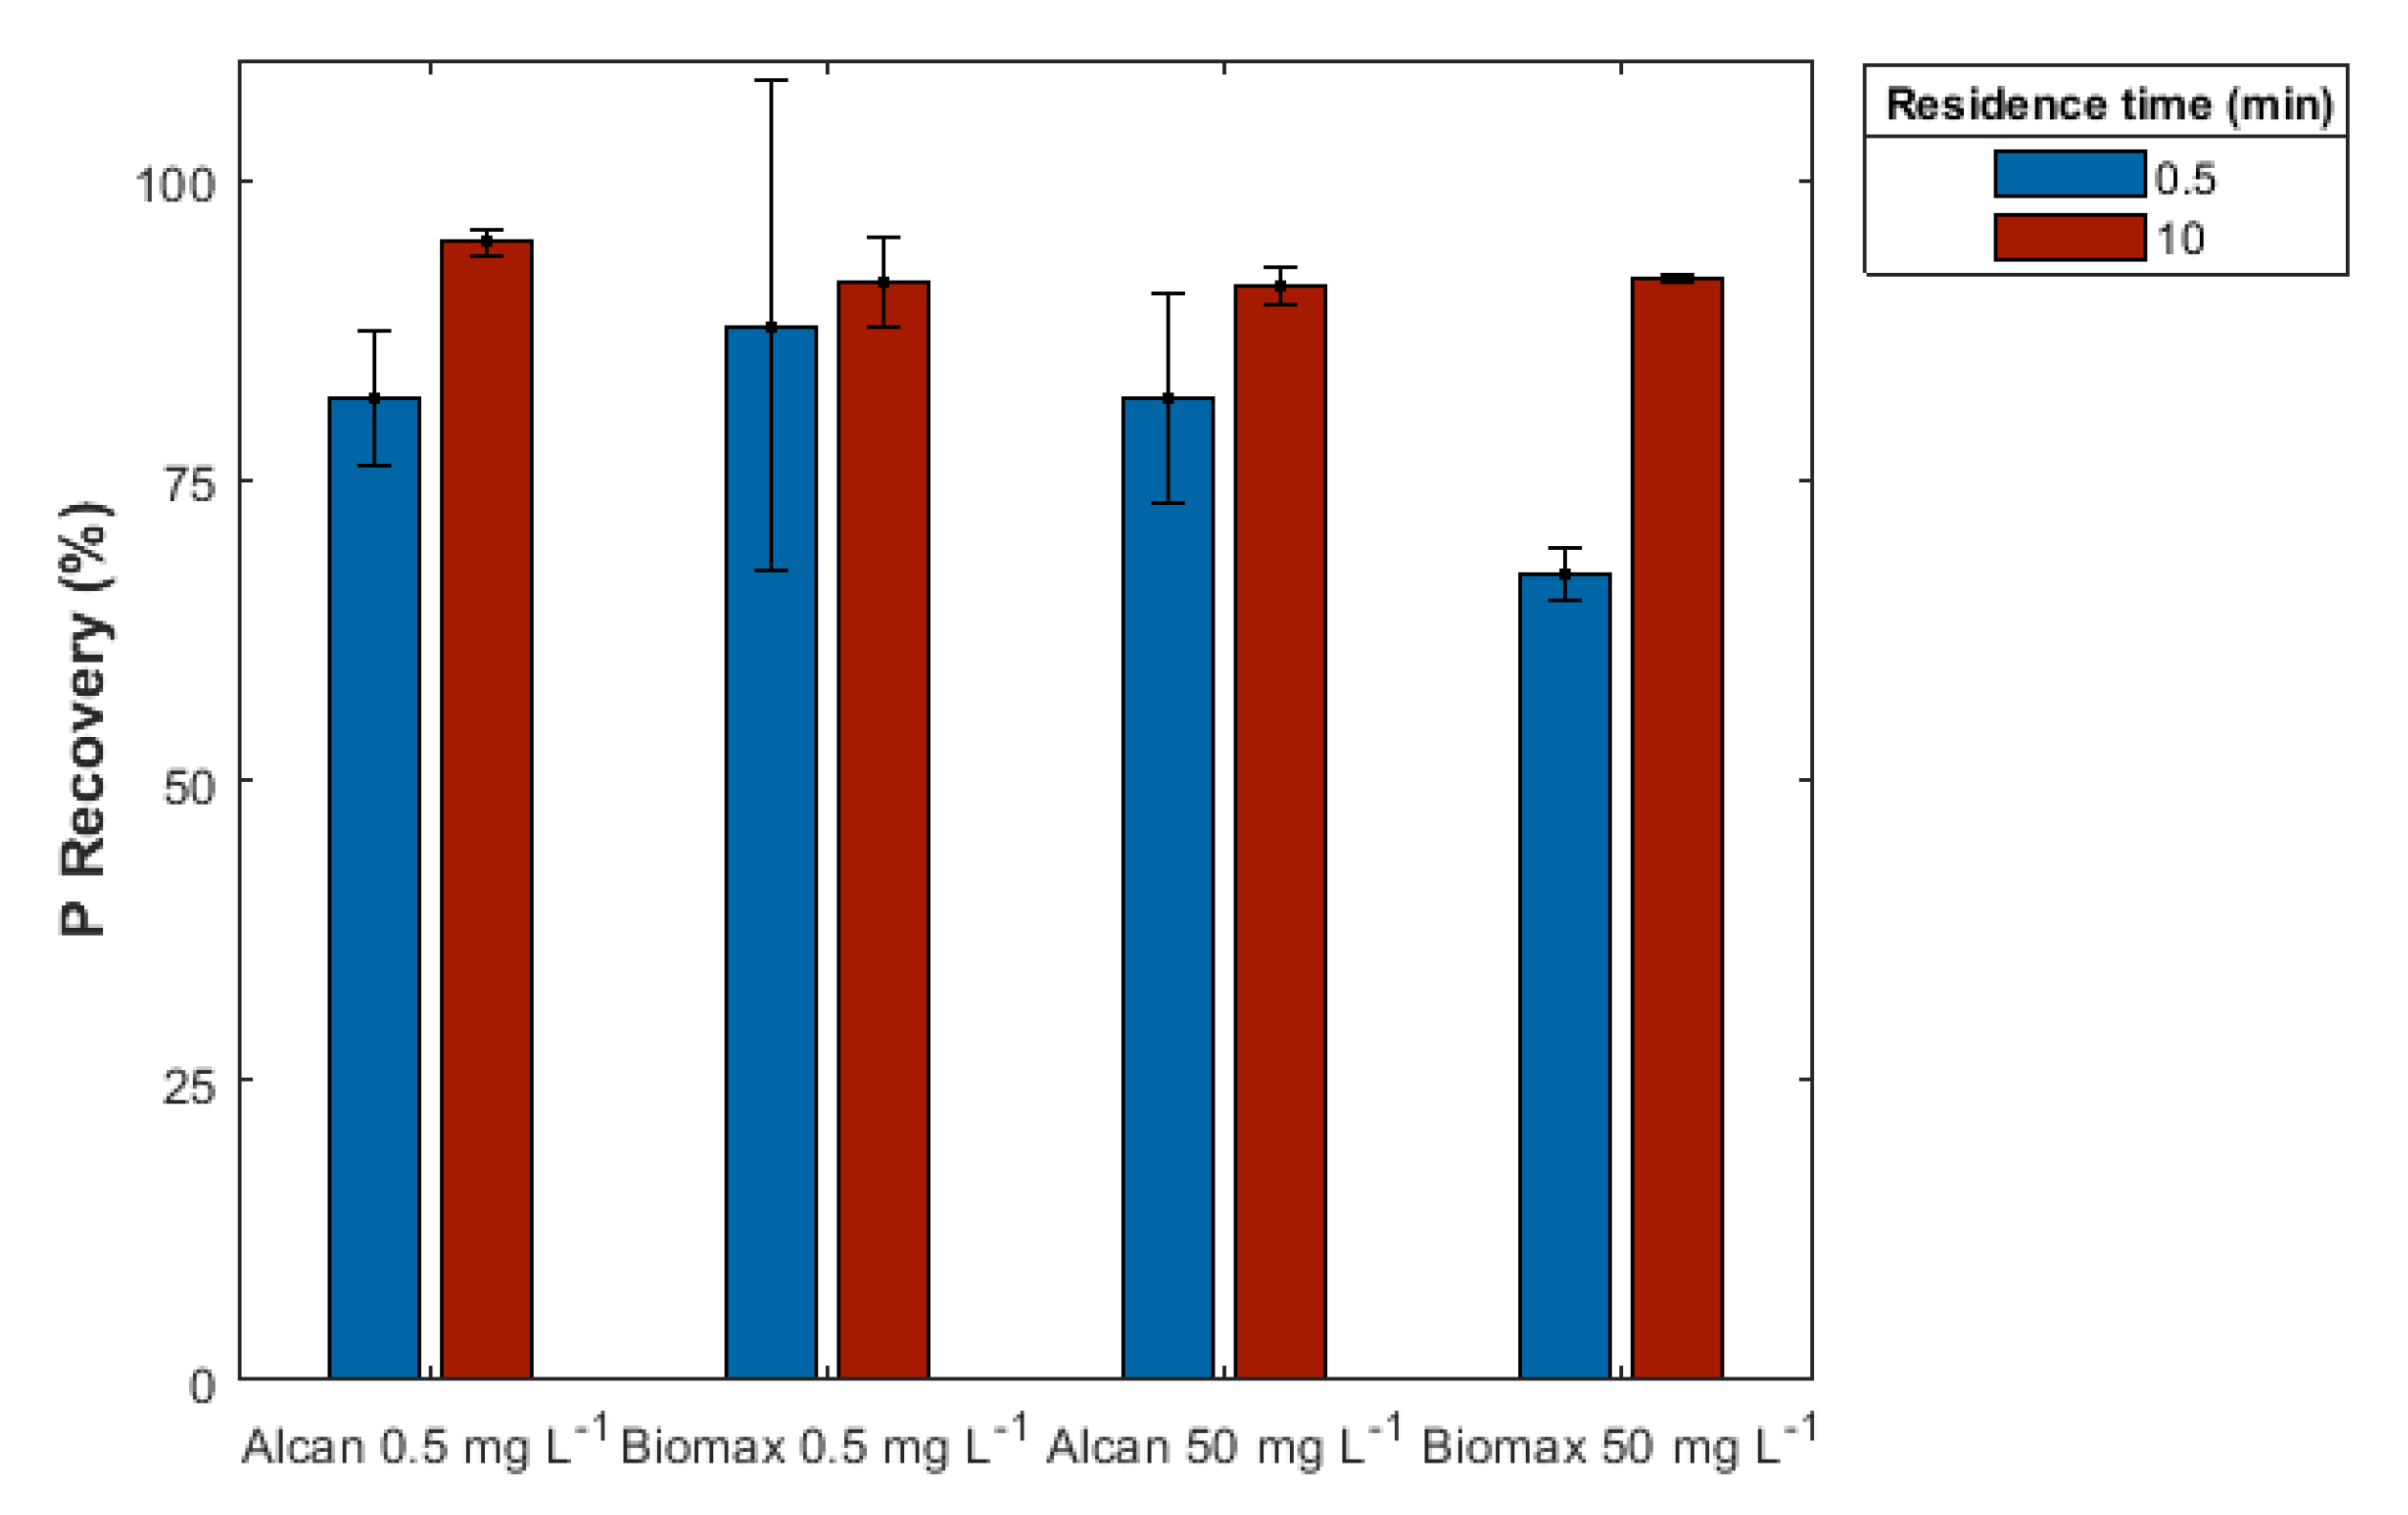
For Alcan, P recovery in D0 using RT=10 min was moderately superior over 0.5 min, with 93% ( = 2%) and 82% ( = 6%), respectively. These values refer to the average P recovery of both inflow concentration levels. For the 0.5 mg P L experiments only, the average P recovery was 95% ( = 1%) and 82% ( = 5%), at a RT 10 min and 0.5 min, respectively. Phosphorus recovery for the 50 mg P L treatments was also in the same range: 91% ( = 2%) and 82% ( = 9%) for 10 and 0.5 min, respectively. The differences in P recovery between RTs in D0 were statistically significant for Alcan (p-value = 0.01; Figure 5). (All statistical tests were conducted at a significance level of 0.05.)
Biomax exhibited similar P recovery for 0.5 min and 10 min for the 0.5 mg P L: 88% ( = 20%) and 91% ( = 4%). The difference between RTs for Biomax was not statistically significant (p-value = 0.19). During the 50 mg P L experiments, however, RT=10 min showed a relatively better efficacy, with 92% ( = 0.5%) in comparison to 67% ( = 2%) using RT=0.5 min (Figure 5).
Based on this analysis, a RT of 10 min would be preferred in a regeneration treatment of PSMs, particularly when dealing with higher input P concentrations. The difference between all 10 min treatments in comparison to all 0.5 min proved to be statistically significant (p-value = 0.02). However, when comparing only the 0.5 mg L experiments, the difference between RTs was not significant (p-value = 0.28). These results indicate that a longer RT can improve the results of regeneration in heavily P loaded samples, perhaps because it allows for greater potential contact between P on the sorption sites and the OH in solution. For the 0.5 mg L, the shorter RT is sufficient for a thorough contact between sorbed PO and the regenerative solution. We chose to conduct the remaining treatments using RT = 0.5 min, aiming for establishing an effective yet simplest and most feasible regeneration methodology at the field scale.
3.2.3. Effect of Volume of Regenerative Solution
In this analysis, we compared P recovery between the 5 and 20 pore volumes (PV) treatments with no recirculation and RT = 0.5 min. The expectation was that a larger volume of KOH would be able to desorb a larger amount of P, given the greater OH availability.
There was a clear improvement in P recovery for the first desorption phase (D0) using 20 PV rather than 5 PV, for both 0.5 and 50 mg P L treatments. According to a two-sample t-test, the difference in P recovery between 5 and 20 PV was significant (p-value = 9.69 × 10) and that difference can be visualized in Figure 6. For D1, the relationship was not as clear. For instance, in Alcan 0.5 and 50 mg L experiments, 5 PV showed to be more efficient than 20 PV. However, other variables may be influencing P recovery in D1, due to legacy effects from the previous phases. Therefore, the discussion regarding the effects of different volumes of KOH will be limited to the S0-D0 cycle.
Over all P treatments and PSMs in D0, 5 PV had an average P recovery of 39% ( = 12%), in contrast with 80% ( = 12%) for 20 PV treatments (Figure 6). A larger volume of regenerative solution clearly improves P recovery; however, there is a trade-off with increasing the volume of regenerative solution regarding feasibility, given the large amounts of PSMs typically used in P removal structures.
There is a lack of literature sources discussing the implementation of desorption of P from PSMs at a large scale. Most of the research is conducted in the laboratory, where there are no limitations regarding the amount of regenerative solution to be used, due to the small scale used. In this research, the goal was to evaluate solid:solution ratios that would be most feasible for large structures, especially regarding transport logistics and cost. This is one aspect that previous research overlooked, as some used up to 100 bed volumes of regenerative solution [18,20]. Moreover, with satisfactory P recovery achieved through using 5 or 20 PV, the cost of regeneration can be decreased. Recovery of P in smaller volumes also contributes to the feasibility of recovering the nutrient for posterior use as fertilizer. The comparative analysis of the levels of PV without recirculation indicated that 20 PV is preferred.
3.2.4. Effect of Number of Recirculations
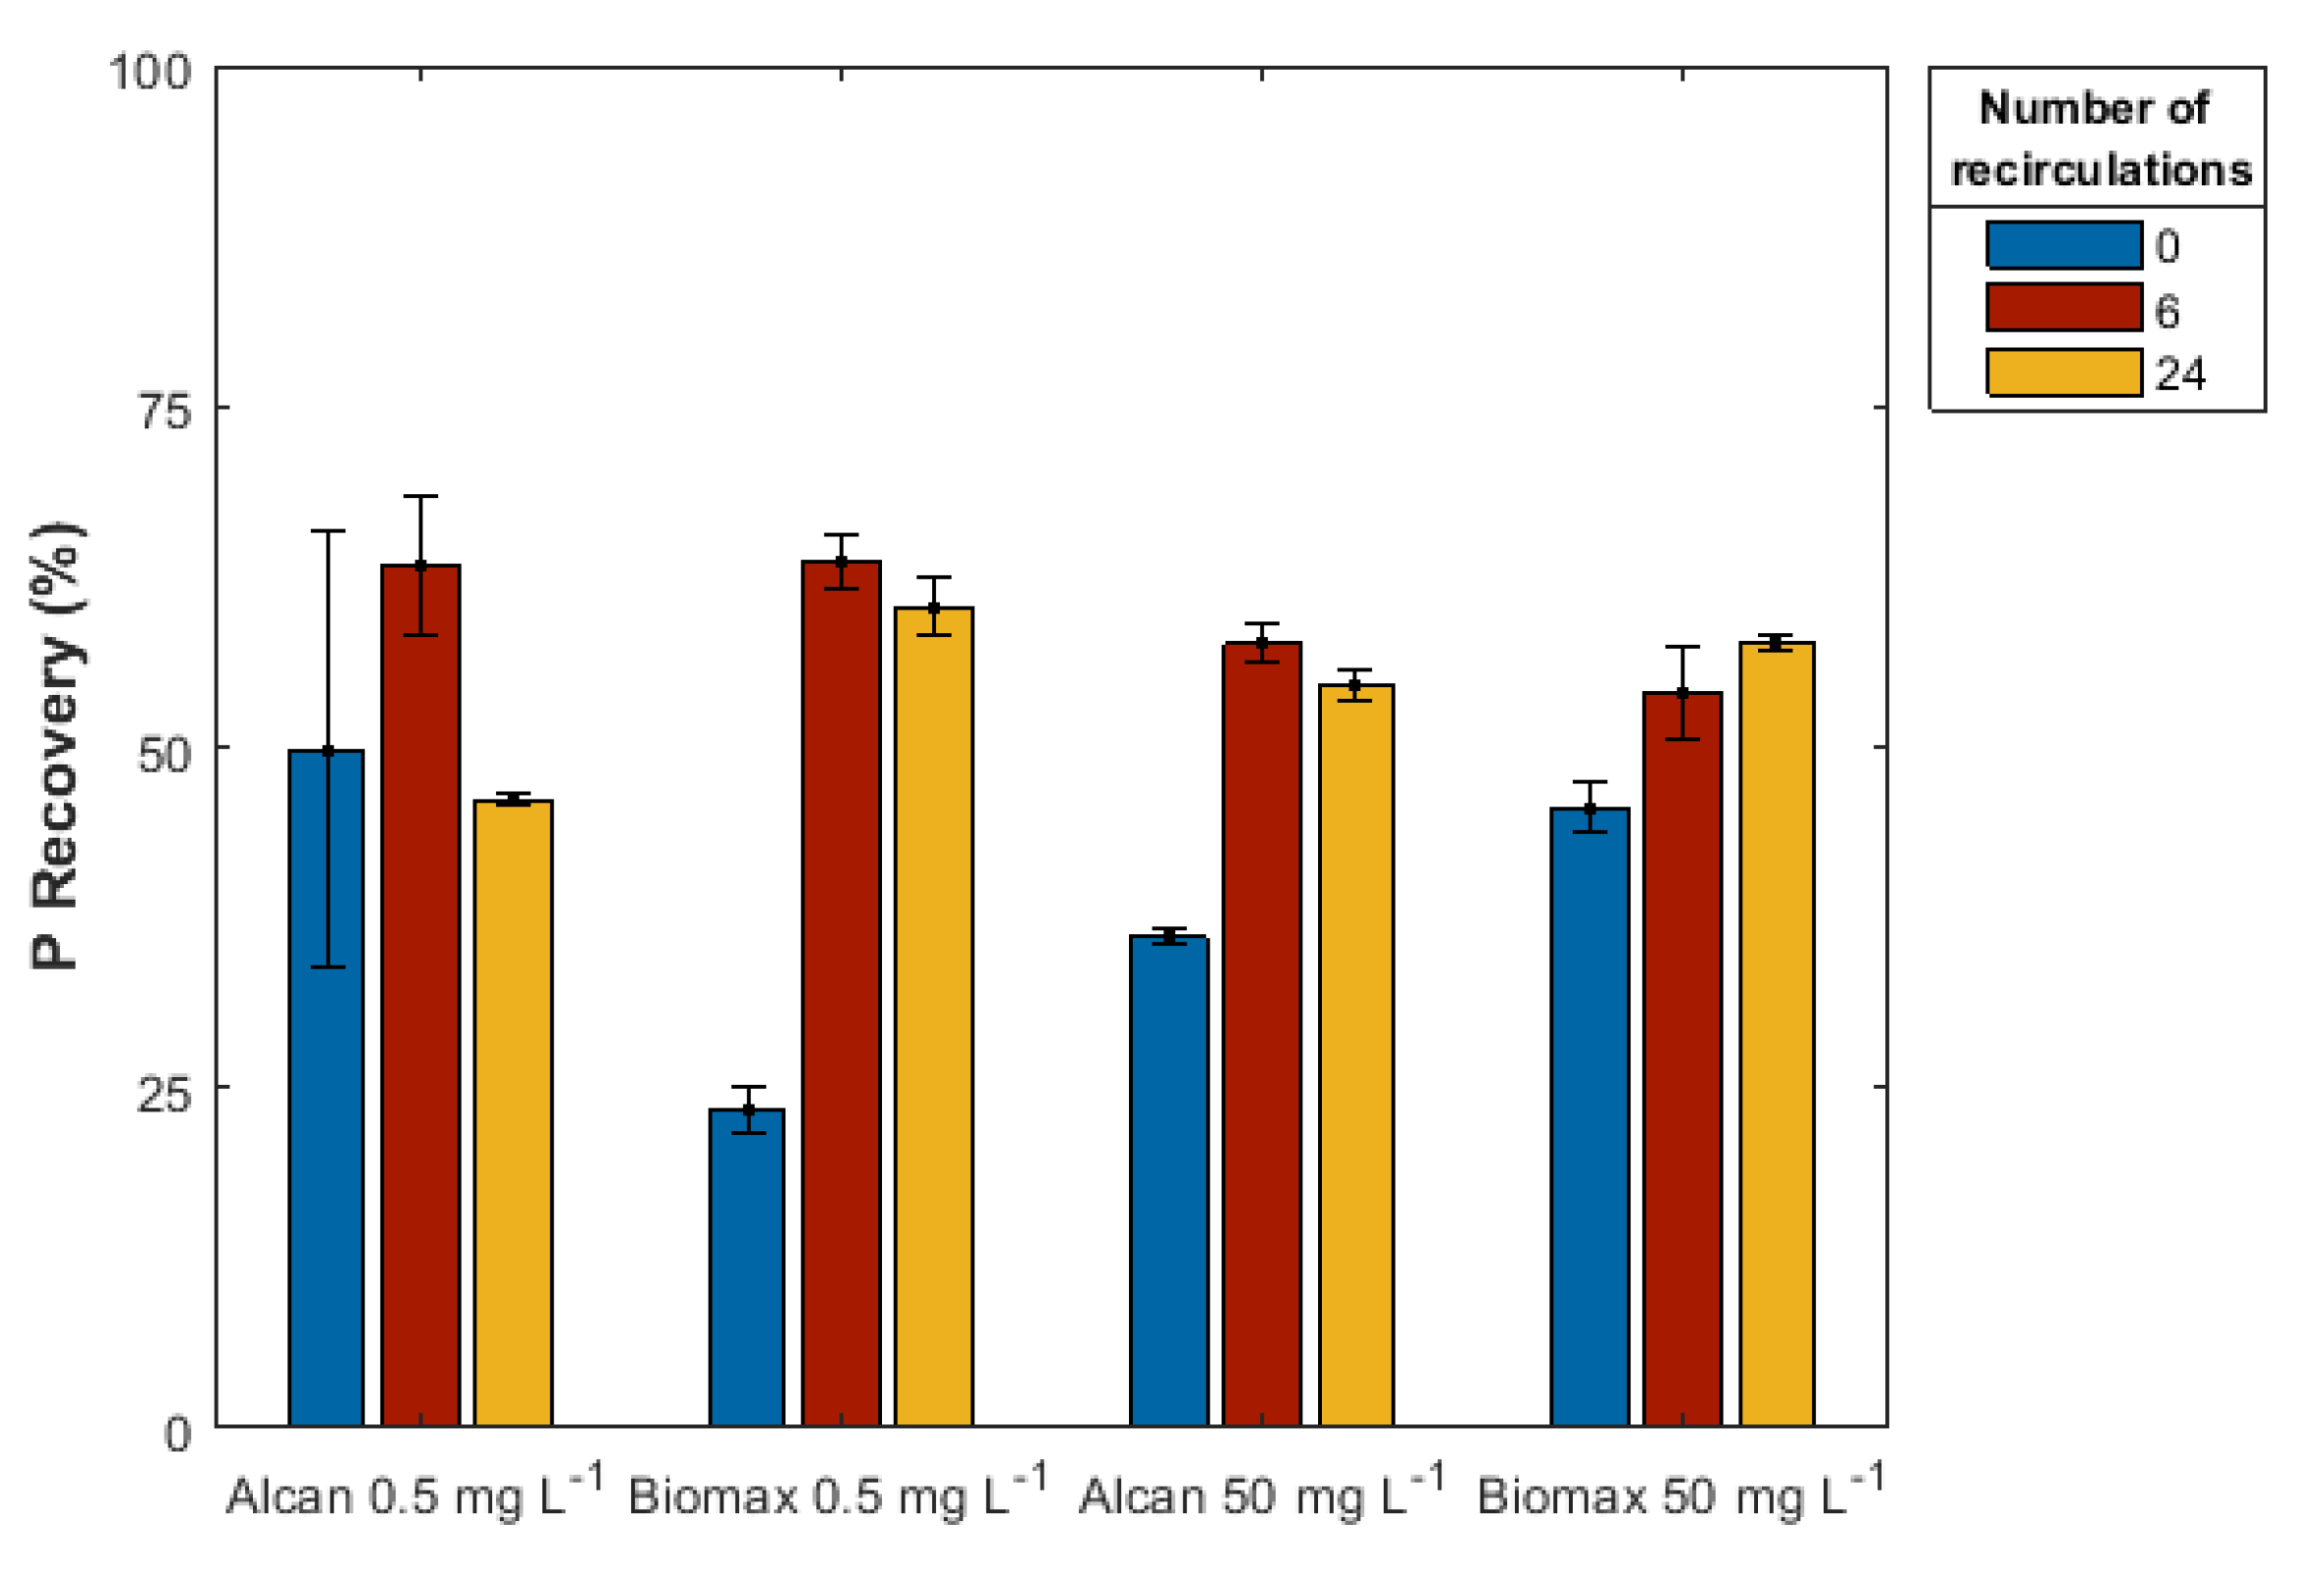
Number of recirculations (RC) was tested at RT = 0.5 min. For Alcan 0.5 mg P L treatments, P recovery was 64% ( = 6%) and 46% ( = 0.5%) with 6 and 24 RC, respectively. At the same P concentration level, Biomax exhibited similar levels of P recovery on both RC tested: 64% ( = 2%) and 60% ( = 2%), for 6 and 24 RC, respectively. For the 50 mg P L experiments, 6 and 24 RC showed equivalent efficacy, for both Alcan (58% and 55%, respectively, with = 1% in both conditions) and Biomax (54% and 58%, with = 3% and = 0.5%, respectively).
Overall, there was no effect of increasing the number of recirculations from 6 to 24, as the difference between these values was not significant (p-value = 0.09). However, when comparing P recovery between recirculation (6,24) and no-recirculation (0) for D0 only, a clearer advantage in using recirculation is observed, as shown in Figure 7. The average P recovery in the 5 PV no recirculation treatment is 39% ( = 12%), in contrast with 59% ( = 5%) and 54% ( = 6%) for 6 and 24 recirculations, respectively. These averages refer to both Alcan and Biomax.
There is an advantage in using recirculation during the desorption phases in comparison to no recirculation when using 5 PV and RT of 0.5 min. By recirculating KOH, we impose a greater potential for contact between the sorbed P and the input solution, with a better use of the available OH. However, when evaluating all tested treatments, the efficacy of 20 PV with no recirculation is still higher (average P recovery is 80% across all 20 PV experiments, with = 12%) than a 5 PV with 6 recirculations (P recovery average of 60%, with = 6%). Thus, the data suggests that when using the larger PV of 20, recirculation does not have much of an impact, but at the smaller PV, recirculation improves P recovery. Recirculation likely improves P recovery at smaller PVs by increasing contact between the added hydroxide and surface-complexed phosphate.
3.2.5. Effect of Repeated Desorption Cycles
Based on previous research conducted on Fe oxides, we suspected that each regeneration treatment would be less effective than the prior. Cabrera et al. [28] discussed that the difficulty in desorbing all P can be explained by its occlusion within the oxides and/or micropores. Our intention in conducting a rinse after each phase was to displace remaining P in interstitial water. However, desorption phases and their respective rinses were never able to remove 100% of the adsorbed P, perhaps due to occlusion of P within the Fe-oxide. As sorption phases were repeated, more P became occluded and the efficacy of the treatment decreased.
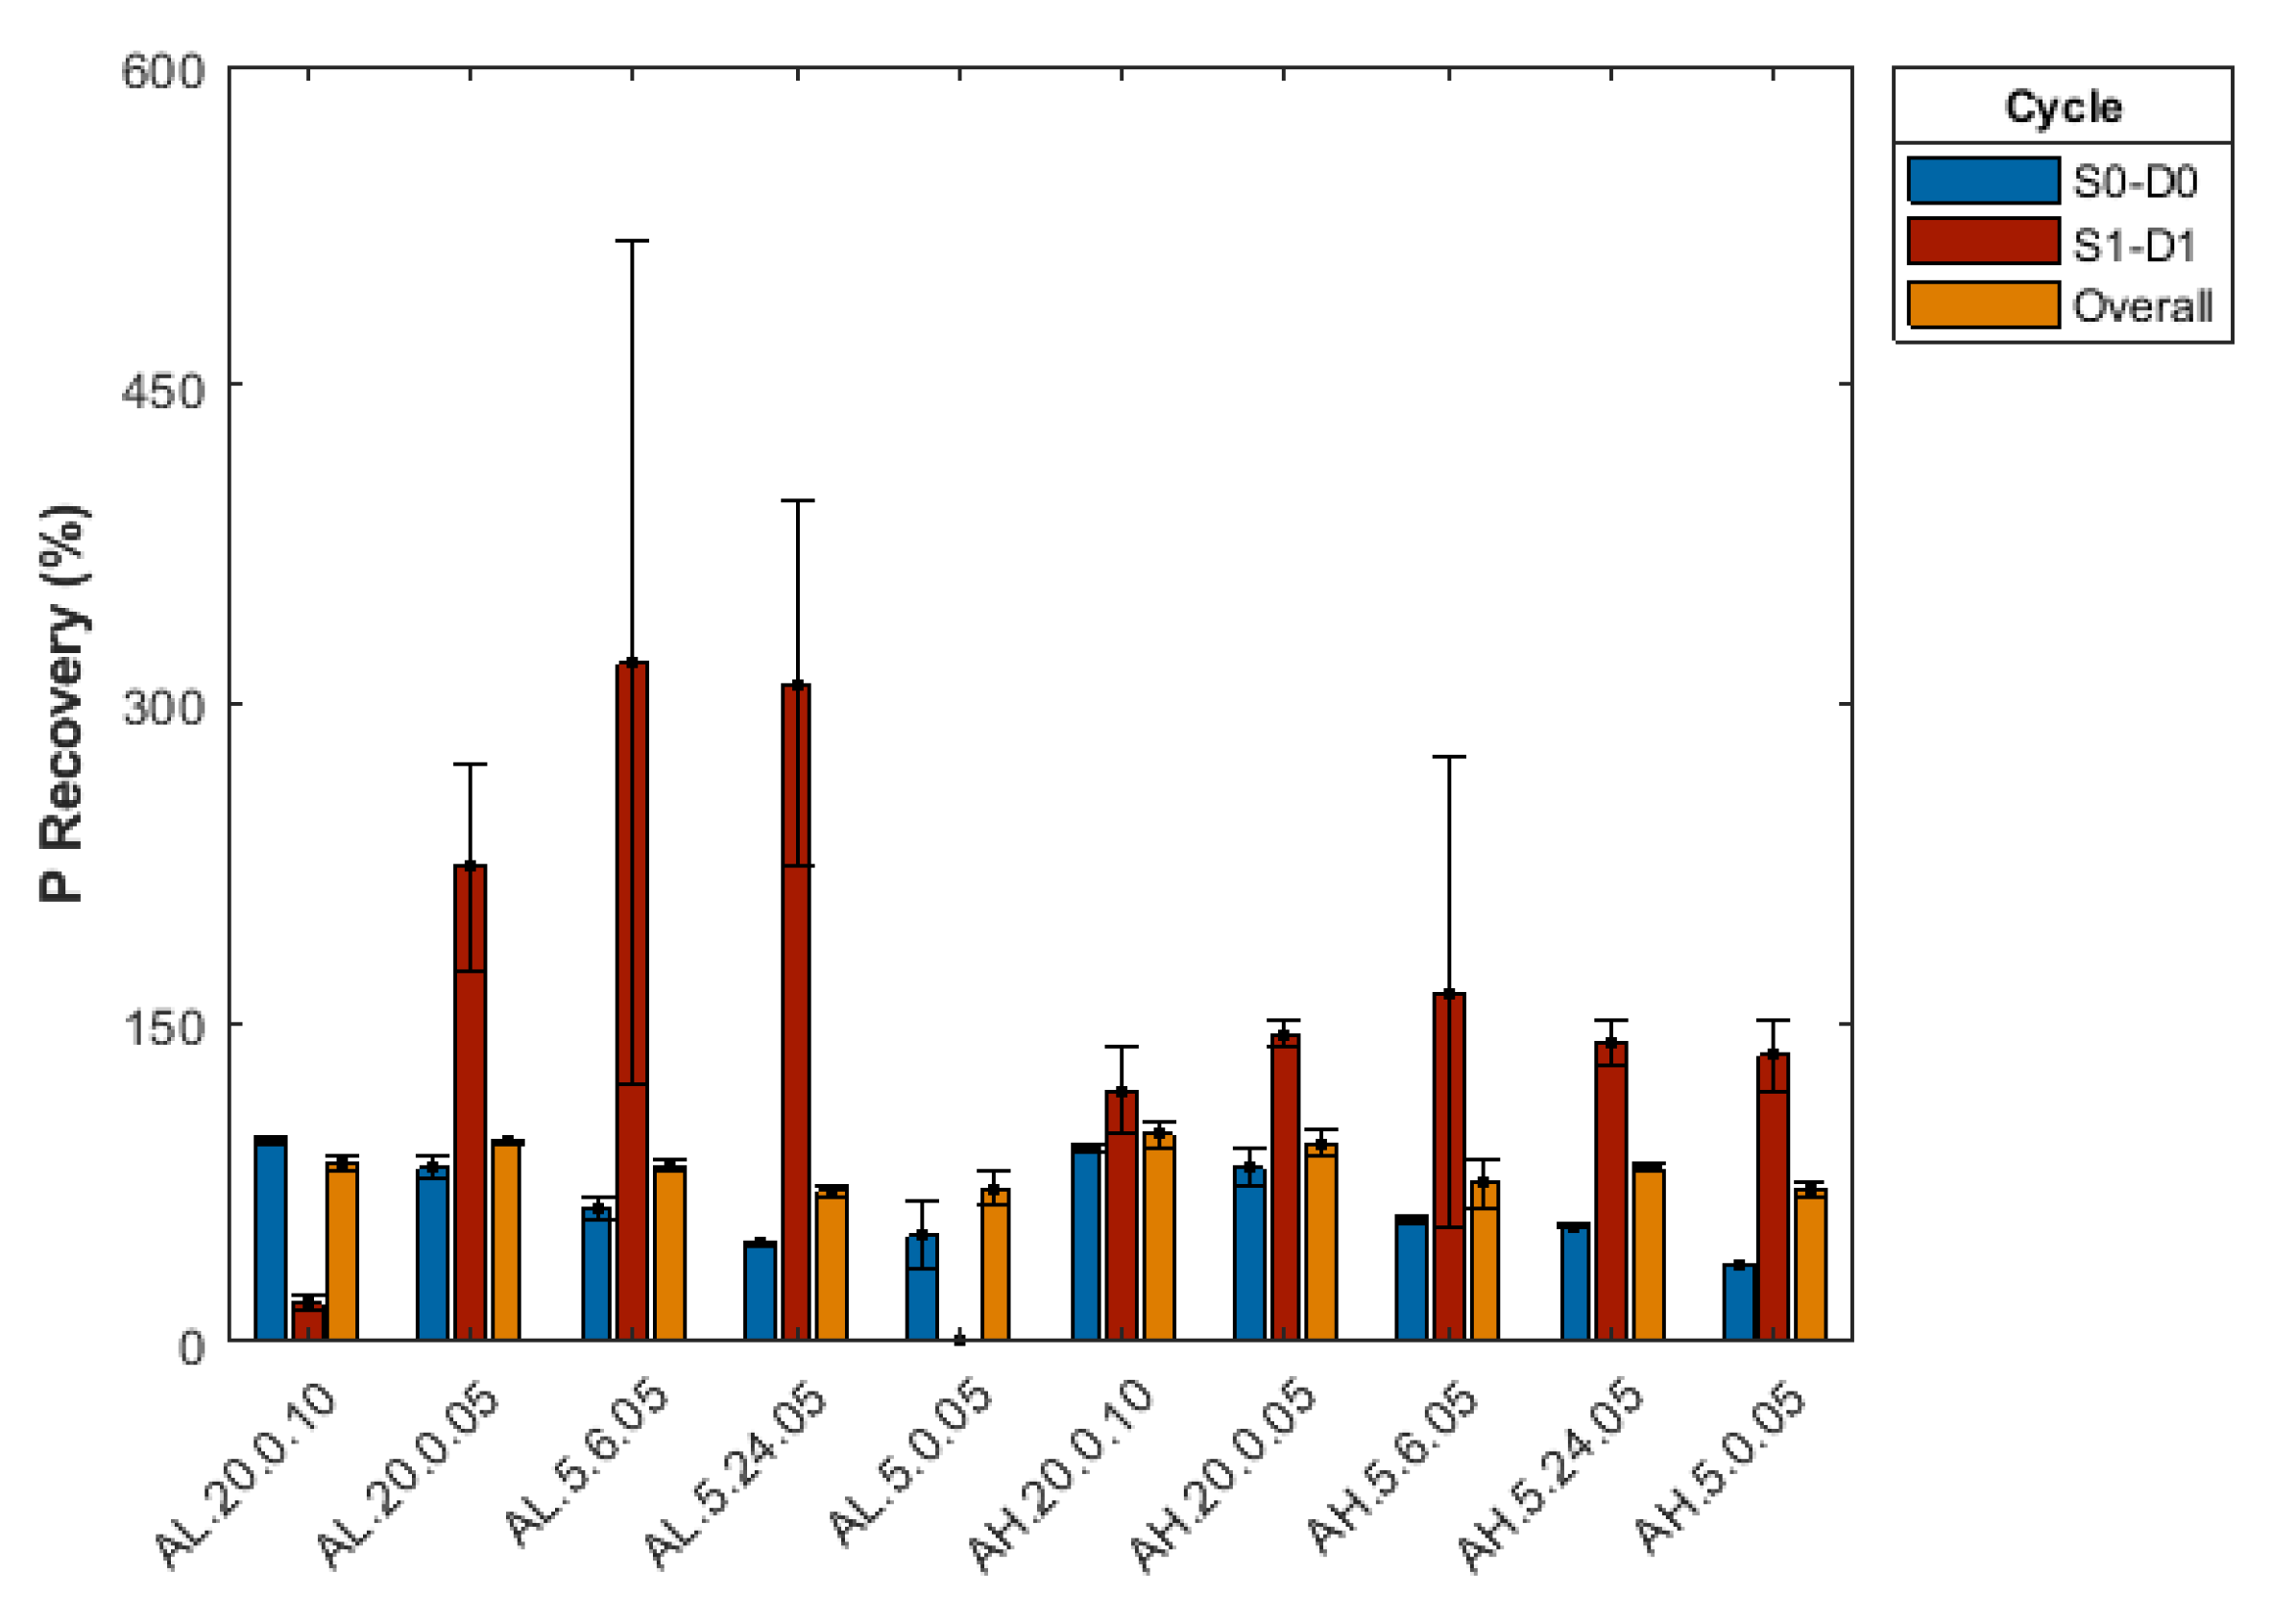
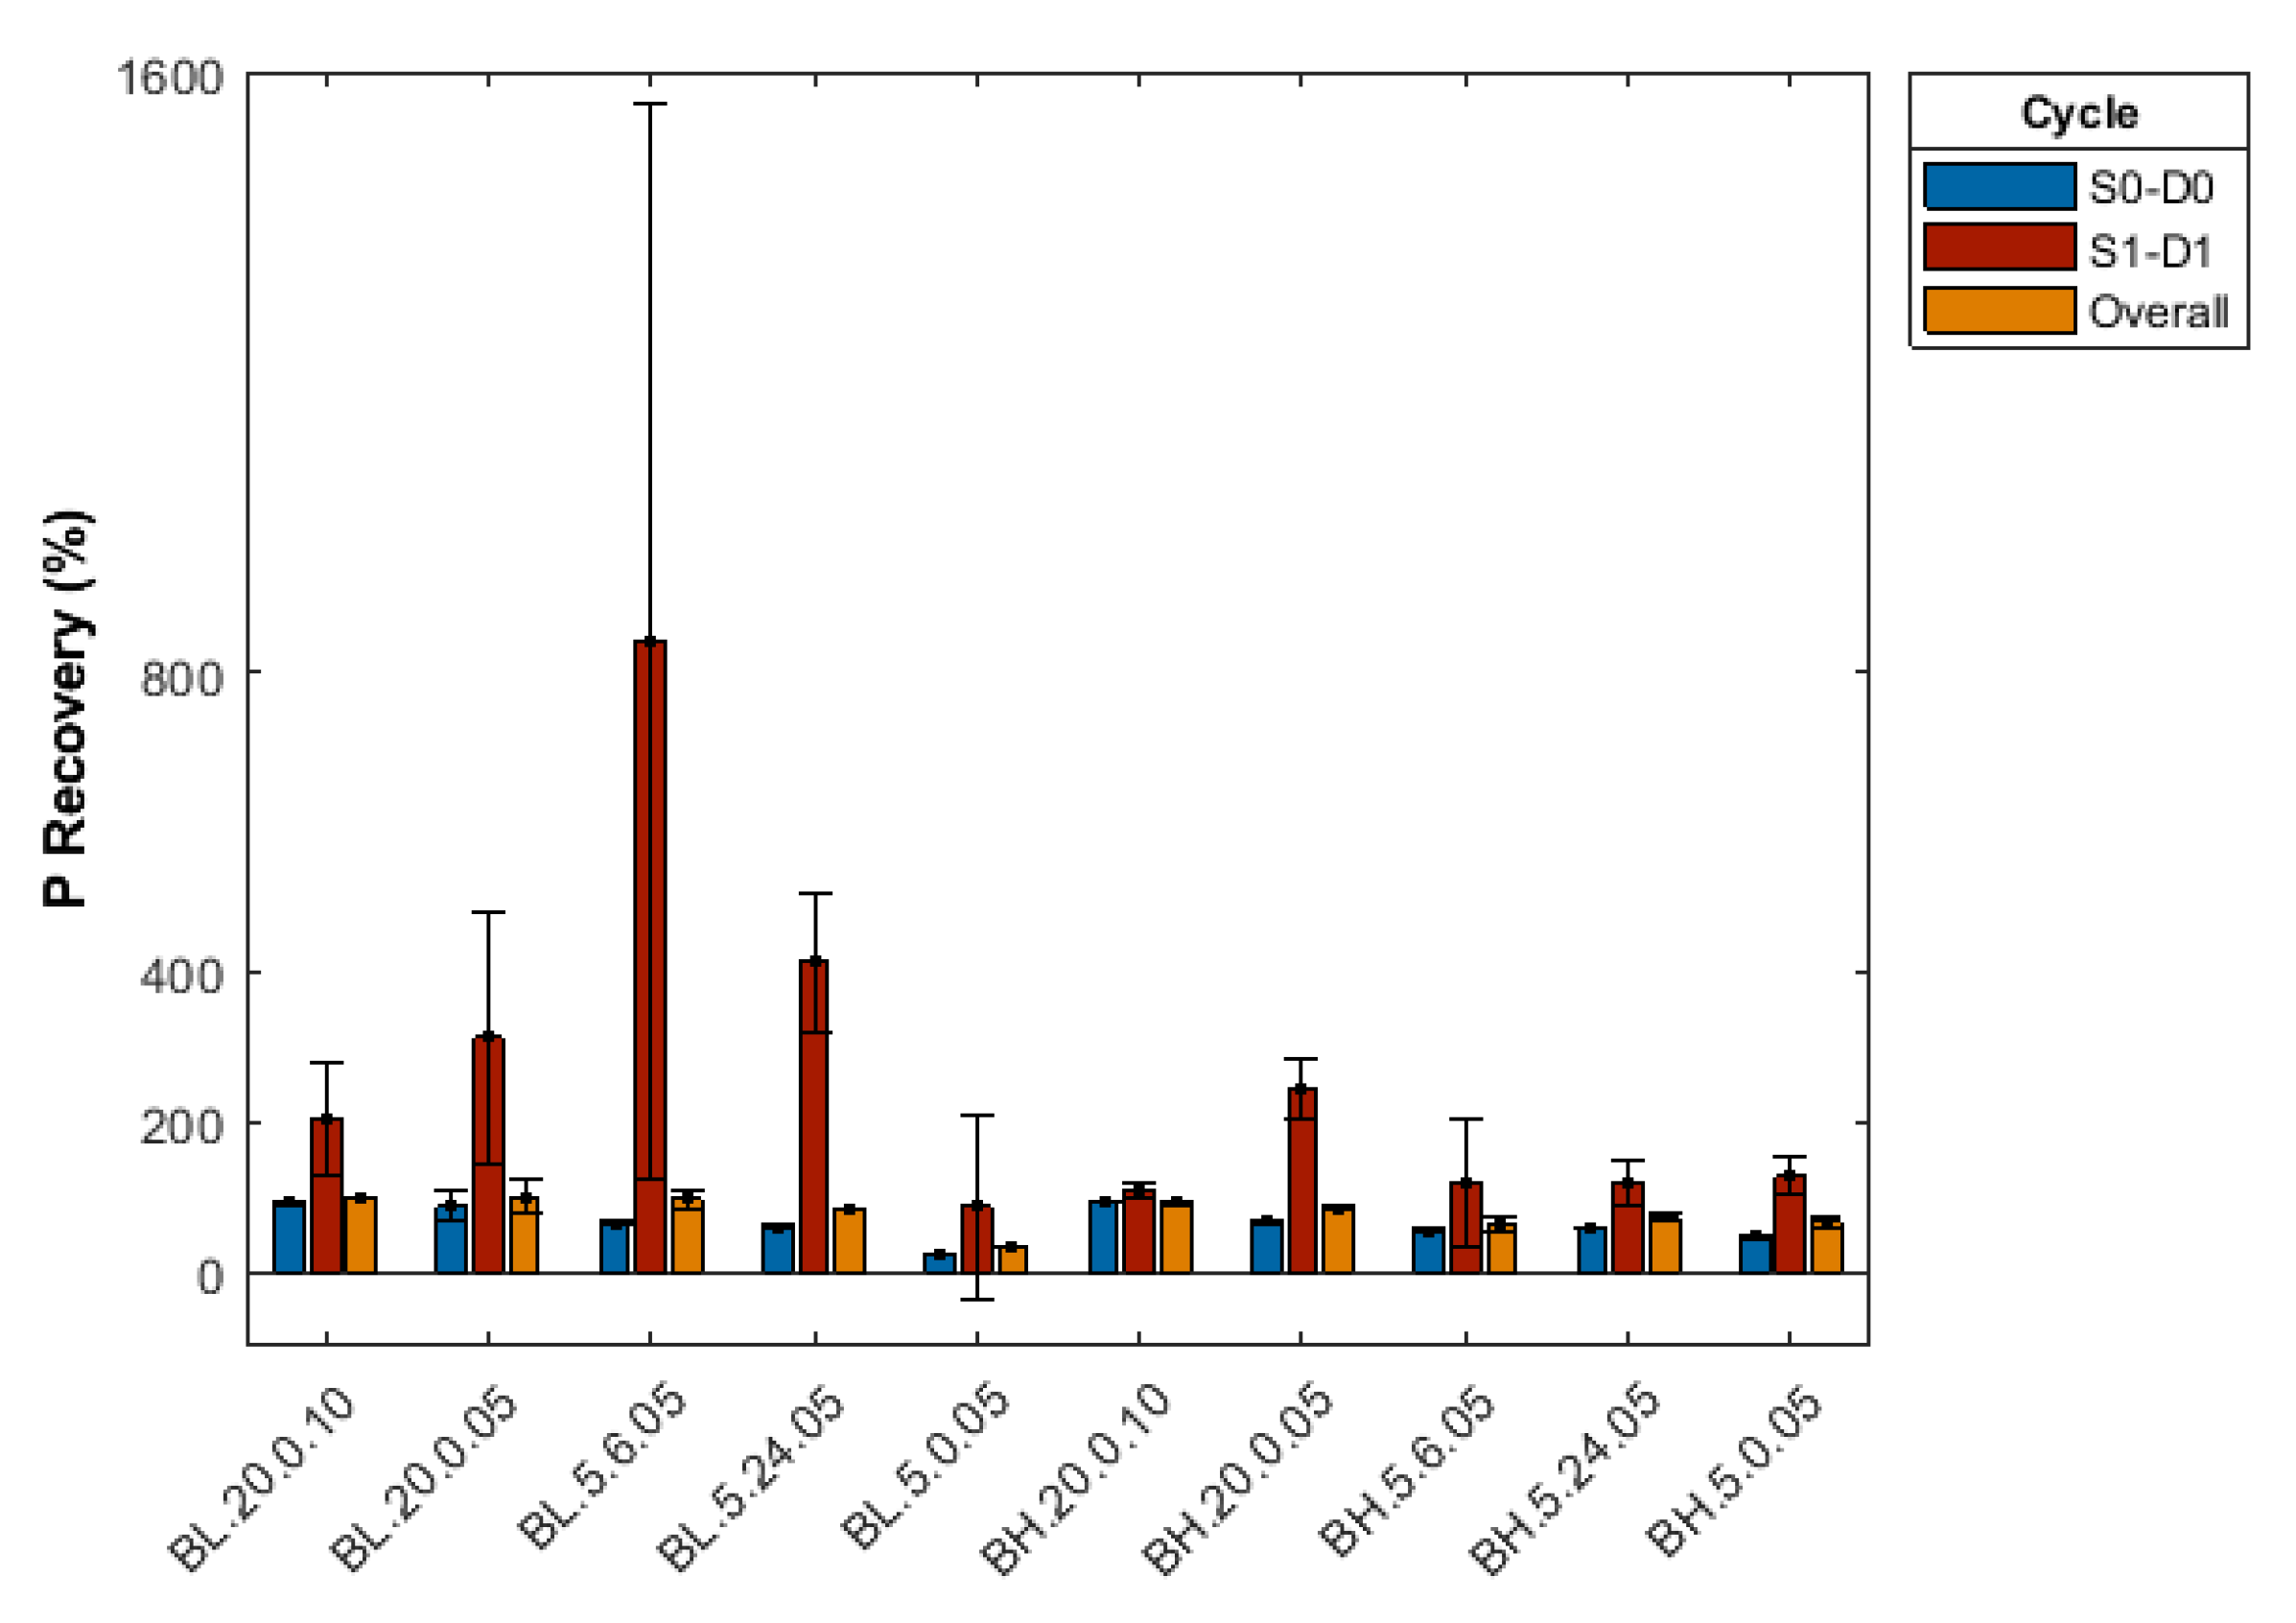
We observed that P recovery for D1 (i.e., the second desorption phase) was highly variable across the different treatments and PSMs, ranging from 0 to 6000% (Figure 8, Figure 9 and Figure 10). This variability demonstrates the carry-over effects of previous sorption and desorption phases. In most of the treatments, D1 had a P recovery of more than 100%, meaning that the KOH regeneration was able to displace P from earlier P additions (i.e., sorption phases). After D1, we again tested another sorption phase (S2) in which the PSMs were observed to retain more P than in the previous sorption (S1). The P removal capacity of the PSMs was successfully recovered in that second desorption phase. (The total mass of sorbed and desorbed P per treatment, phase and cycle is shown in Table A1,Table A2,Table A3.)
Our hypothesis of decreasing efficacy of desorption with repeated regeneration treatment was confirmed. For instance, consider the 20 PV, RT = 0.5 min treatment on Alcan at the low level of P (0.5 mg P L): 9700 mg P kg of PSM was desorbed in the first desorption phase (D0), in comparison to 2100 mg P kg of PSM in the second desorption phase (D1). Thus, regarding the actual mass of P desorbed in mg P kg, D0 was more effective than D1. However, when comparing P recovery (Equation (2)), D1 (190%) was superior to D0 (85%), due to the reduced amount of P sorbed during S1. The same decrease in total desorbed P from D0 to D1 was observed for all tested treatments, except Alcan and Biomax 50 mg P L, at 5 PV, with no recirculation (Table A1 and Table A2). Despite this decrease, P recovery across all sorption-desorption cycles (S0-D0 and S1-D1) was substantial. For some of the tested treatments, the net P was 0, as 100% of the added P was recovered.
We conclude that regeneration cycles can be repeated and although the efficacy of the treatment decreased in absolute values (mg P kg), P recovery (%) did not follow the same pattern due to legacy effects of previous cycles.
4. Conclusions and Implications
Low volumes of regenerative solution are effective for desorption treatments, which can enable the use of regeneration in field-scale P removal structures. Desorption treatments can be used under conditions where PSMs were saturated with P from either low or high P inflow concentrations, simplifying the use of PSMs for P removal. Residence time did not show a significant effect on the final P recovery, measured across all sorption and desorption cycles. In general, increasing the volume of regenerative solution from 5 to 20 PV increased P recovery. Pore volume was more influential than the number of recirculations. For example, the most effective regeneration treatment used 20 PV of 1 M KOH with no recirculation, as recirculation did not improve P recovery when 20 PV were used. Although the smaller PV of 5 was less effective than 20 PV, the use of recirculation (6 or 24 times) increased P recovery. This is important because increasing the PV of regeneration solution translates to greater chemical costs and the need for bigger equipment (tanks) to handle the larger volume of solution, whereas increasing the number of recirculations can be achieved more easily as it simply results in a longer time required for regeneration.
For PhosRedeem, the analysis indicated that although it is a material that resembles a Fe-rich PSM and is commercialized as such, the dominant mechanism of removal is likely Ca-phosphate precipitation. Evidence for this conclusion is found in four observations: (1) the PSM contained a high Ca concentration and maintained an elevated solution pH, (2) P removal increased with increasing RT, (3) an increase in inflow P concentration from 0.5 to 50 mg P L dramatically increased percent P removal, and (4) regenerative treatment with KOH was virtually ineffective.
Regeneration was equally effective on Biomax and Alcan, with final P recovery ranging from 66–100%. Therefore, although these are manufactured PSMs with an appreciable higher cost (about 22 and 3.3 U.S. dollars per kg for Biomax and Alcan, respectively) in comparison to industrial by-products, their use can be effectively extended through the regeneration techniques demonstrated.
The costs of P desorption and PSM regeneration can be segmented into PSM, transportation, chemical solutions, required equipment, and labor. As a demonstration, consider an actual site located in Ohio, U.S., in which a 10 Ha field produces 0.2 mg L dissolved P from 16.3 ML of annual flow volume from a subsurface tile drain. Using the P removal curve shown in Figure 2a, it would require 2.1 Mg of Alcan to remove 40% of the 10-year dissolved P load. This mass of Alcan would cost approximately 6800 U.S. dollars. Assuming an additional US $6000 for materials and labor, this would result in a P removal cost of US $1000 per kg dissolved P removed, which is within the realm of the cost of P removal in wastewater treatment. However, consider that subsequent regeneration would decrease the cost of P removal nearly in half, for every regeneration cycle, since it would not involve any new expenses with PSM replacement. While it is tempting to consider the value of the recovered P in offsetting structure costs, it is important to keep in mind that the mass of dissolved P being lost to surface waters is very small compared to agronomic requirements. Considering current costs of P fertilizer (US $1–2 per kg), the amount of P trapped after ten years with this theoretical structure (12.8 kg) is only worth US $13–26, and not even enough P for fertilization of one ha for a single year. However, under situations where PSMs are used to treat wastewater with high P concentrations, it may become economically favorable to recover the P in the regeneration solution. More research is needed in order to evaluate the feasibility of recovering the desorbed P.
Phosphorus losses to surface waters are considered one of the primary drivers of cultural eutrophication. Eutrophication and associated harmful algal blooms have been reported all over the world, and their occurrence has been increasing with growing anthropogenic pressures on the environment. Current field conservation practices will not be effective in reducing dissolved P in drainage waters, and P removal structures can be an important ally to control dissolved P transport before P enters ditches and channels. However, the construction and maintenance of these structures can be cost-limiting. Our work offered a cost-effective alternative to the replacement of PSMs, improving the longevity and, consequently, the potential ecological benefit of P removal structures.
Overall, the conclusions of this work were: (1) Al/Fe-rich materials can have their P removal ability recovered after the media is saturated with P, (2) the level of P concentration in the sorption phases did not significantly impact P recovery; (3) for higher input P concentrations, increasing RT of regeneration phase resulted in greater P recovery; (4) a larger volume of regenerative solution did result in more P being desorbed; (5) increasing the number of recirculations did significantly improve the efficacy of 5 PV desorptions, and (6) the regeneration treatment can be repeated, but with decreasing efficacy in absolute values of desorbed P.
Author Contributions
All authors were involved in the conceptualization of this research, in the writing, reviewing and editing of the manuscript. I.S.P.C.S. conducted the experiments and wrote the original draft. All authors have read and agreed to the published version of the manuscript.
Funding
This research was funded by the USDA-ARS National program 212.
Conflicts of Interest
The authors declare no conflict of interest.
Appendix A. Effect of Residence Time on PhosRedeem
Figure A1.
Phosphorus (P) removal by PhosRedeem in flow-through experiments using different residence times (RT). Experiments were performed with input solution of 0.5 mg P L.
Figure A1.
Phosphorus (P) removal by PhosRedeem in flow-through experiments using different residence times (RT). Experiments were performed with input solution of 0.5 mg P L.

Figure A2.
Box plot: effect of residence time (RT) on P removal performance of PhosRedeem.

Appendix B. Summary of Sorption-Desorption Cycles

Table A1.
Alcan Phosphorus (P) sorption and desorption results. Each row represents one regeneration treatment. The first ten rows refer to 0.5 mg L P, the second ten are 50 mg L P experiments.
Table A1.
Alcan Phosphorus (P) sorption and desorption results. Each row represents one regeneration treatment. The first ten rows refer to 0.5 mg L P, the second ten are 50 mg L P experiments.
| Replicate | S0 | D0 | Net P Cycle 0 | S1 | D1 | Net P Cycle 1 | S2 | Net P | ||
|---|---|---|---|---|---|---|---|---|---|---|
| P Sorbed | P Desorbed | P Added | P Sorbed | P Desorbed | P Added | P Sorbed | ||||
| mg P kgPSM | ||||||||||
| A.20.0.10.1 | 11,463 | 10,704 | 759 | 2453 | 1343 | 276 | 834 | 3362 | 2377 | 4124 |
| A.20.0.10.2 | 11,463 | 10,884 | 579 | 2533 | 2377 | 377 | −221 | 2984 | 1791 | 4290 |
| A.20.0.05.1 | 11,463 | 9752 | 1711 | 2821 | 1123 | 2127 | −429 | 2986 | 1349 | 1976 |
| A.20.0.05.2 | 11,463 | 8860 | 2604 | 2848 | 1055 | 2725 | −932 | 2936 | 1728 | 2582 |
| A.5.0.05.1 | 11,463 | 4385 | 7079 | 2634 | 51 | 3190 | −607 | 2610 | 1189 | 5049 |
| A.5.0.05.2 | 11,463 | 6956 | 4508 | 2701 | 1188 | 2800 | −1287 | 2773 | 1538 | 4354 |
| A.5.6.05.1 | 11,463 | 6809 | 4654 | 2688 | 744 | 3422 | −1478 | 2951 | 1618 | 3515 |
| A.5.6.05.2 | 11,463 | 7617 | 3846 | 2821 | 1618 | 2896 | −1692 | 2999 | 1670 | 4159 |
| A.5.24.05.1 | 11,463 | 5293 | 6170 | 2596 | 1011 | 3739 | −2155 | 2609 | 1497 | 4858 |
| A.5.24.05.2 | 11,463 | 5210 | 6254 | 2559 | 1496 | 3718 | −2655 | 2582 | 1579 | 5530 |
| A.20.0.10.1 | 14,493 | 12,916 | 1577 | 19,496 | 4767 | 4980 | 9749 | 19,635 | 4414 | 5643 |
| A.20.0.10.2 | 14,493 | 13,246 | 1246 | 21,034 | 4313 | 5844 | 10,878 | 20,479 | 4720 | 4300 |
| A.20.0.05.1 | 14,493 | 12,641 | 1852 | 18,872 | 3513 | 4958 | 10,400 | 19,142 | 3143 | 3415 |
| A.20.0.05.2 | 14,493 | 10,877 | 3616 | 19,844 | 3123 | 4684 | 12,037 | 20,366 | 3158 | 5077 |
| A.5.0.05.1 | 14,493 | 5130 | 9363 | 17,579 | 7206 | 10,850 | −477 | 21,049 | 8599 | 14,183 |
| A.5.0.05.2 | 14,493 | 5232 | 9261 | 18,066 | 8473 | 10,548 | −955 | 18,195 | 6190 | 13,242 |
| A.5.6.05.1 | 14,493 | 8132 | 6361 | 18,196 | 2313 | 5686 | 10,197 | 18,592 | 5940 | 8791 |
| A.5.6.05.2 | 14,493 | 8406 | 6087 | 17,455 | 5909 | 5094 | 6452 | 17,463 | 5524 | 12,292 |
| A.5.24.05.1 | 14,493 | 7729 | 6764 | 18,781 | 6921 | 9345 | 2515 | 17,921 | 5883 | 10,088 |
| A.5.24.05.2 | 14,493 | 7933 | 6560 | 23,141 | 5767 | 8739 | 8635 | 17,795 | 7561 | 11,015 |
Each two replicates refer to a regeneration treatment, defined by (a) volume of KOH (measured in pore volumes, or PV), (b) recirculation and (c) residence time. The identification of the replicates follows the notation: X.PV.RC.RT.Replicate, with X being the initial of the PSM (A for Alcan, B for Biomax or P for PhosRedeem. Total sorbed and desorbed P include rinse P concentrations. , where and are the P concentrations adsorbed in the sorption phases and desorbed in desorption phases, respectively. and are the P concentrations observed in the rinse solution after each sorption or desorption phase.
Table A2.
Biomax phosphorus (P) sorption and desorption results. Each row represents one regeneration treatment. The first ten rows refer to 0.5 mg L P, the second ten are 50 mg L P experiments.
Table A2.
Biomax phosphorus (P) sorption and desorption results. Each row represents one regeneration treatment. The first ten rows refer to 0.5 mg L P, the second ten are 50 mg L P experiments.
| Replicate | S0 | D0 | Net P Cycle 0 | S1 | D1 | Net P Cycle 1 | S2 | Net P | ||
|---|---|---|---|---|---|---|---|---|---|---|
| P Sorbed | P Desorbed | P Added | P Sorbed | P Desorbed | P Added | P Sorbed | ||||
| mg P kgPSM | ||||||||||
| B.20.0.10.1 | 7744 | 6871 | 941 | 947 | 548 | 1401 | −1002 | 1156 | 881 | 900 |
| B.20.0.10.2 | 7744 | 7294 | 518 | 1030 | 881 | 1329 | −1180 | 1064 | 847 | 849 |
| B.20.0.05.1 | 7812 | 7920 | −108 | 1040 | 357 | 1537 | −854 | 1203 | 722 | −635 |
| B.20.0.05.2 | 7812 | 5689 | 2123 | 1063 | 722 | 1386 | −1045 | 1170 | 538 | 1928 |
| B.5.0.05.1 | 7812 | 1721 | 6091 | 1059 | −274 | 779 | 555 | 1075 | 365 | 5335 |
| B.5.0.05.2 | 7812 | 1903 | 5909 | 1050 | 365 | 630 | 55 | 1134 | 467 | 6042 |
| B.5.6.05.1 | 7812 | 4812 | 3000 | 1231 | 270 | 3647 | −2687 | 1249 | 760 | 316 |
| B.5.6.05.2 | 7812 | 5041 | 2771 | 1322 | 760 | 2533 | −1971 | 1393 | 549 | 1480 |
| B.5.24.05.1 | 7812 | 4784 | 3028 | 1107 | 447 | 2141 | −1481 | 1221 | 744 | 2010 |
| B.5.24.05.2 | 7812 | 4558 | 3254 | 458 | 744 | 2578 | −2864 | 1203 | 813 | 2164 |
| B.20.0.10.1 | 18,675 | 16,110 | 2565 | 22,872 | 4995 | 5753 | 12,124 | 22,332 | 5350 | 1105 |
| B.20.0.10.2 | 18,675 | 16,210 | 2465 | 17,296 | 5344 | 5394 | 6558 | 18,124 | 3845 | −142 |
| B.20.0.05.1 | 18,675 | 11,547 | 7128 | 22,254 | 2929 | 6293 | 13,032 | 19,547 | 2232 | 2009 |
| B.20.0.05.2 | 18,675 | 12,110 | 6565 | 17,923 | 2203 | 6017 | 9703 | 23,586 | 5578 | 5068 |
| B.5.0.05.1 | 18,675 | 7800 | 10,875 | 20,310 | 8509 | 9417 | 2385 | 21,775 | 7169 | 7569 |
| B.5.0.05.2 | 18,675 | 8245 | 10,430 | 19,032 | 6982 | 10,116 | 1934 | 21,711 | 8297 | 7553 |
| B.5.6.05.1 | 18,675 | 9097 | 9578 | 23,939 | 3427 | 6147 | 14,365 | 24,318 | 9822 | 12,196 |
| B.5.6.05.2 | 18,675 | 9931 | 8744 | 20,803 | 9765 | 5680 | 5358 | 21,197 | 5606 | 7612 |
| B.5.24.05.1 | 18,675 | 10,237 | 8438 | 21,140 | 7182 | 10,131 | 3827 | 21,162 | 10,014 | 7263 |
| B.5.24.05.2 | 18,675 | 10,096 | 8579 | 20,053 | 9836 | 9436 | 781 | 23,148 | 10,903 | 8988 |
Each two replicates refer to a regeneration treatment, defined by (a) volume of KOH (measured in pore volumes, or PV), (b) recirculation and (c) residence time. The identification of the replicates follow the notation: X.PV.RC.RT.Replicate, with X being the initial of the PSM (A for Alcan, B for Biomax or P for PhosRedeem. Total sorbed and desorbed P include rinse P concentrations. , where and are the P concentrations adsorbed in the sorption phases and desorbed in desorption phases, respectively. and are the P concentrations observed in the rinse solution after each sorption or desorption phase.
Table A3.
PhosRedeem phosphorus (P) sorption and desorption results. Each row represents one regeneration treatment. The first four rows refer to 0.5 mg L P, the following six are 50 mg L P experiments.
Table A3.
PhosRedeem phosphorus (P) sorption and desorption results. Each row represents one regeneration treatment. The first four rows refer to 0.5 mg L P, the following six are 50 mg L P experiments.
| Replicate | S0 | D0 | Net P Cycle 0 | S1 | D1 | Net P Cycle 1 | S2 | Net P | ||
|---|---|---|---|---|---|---|---|---|---|---|
| P Sorbed | P Desorbed | P Added | P Sorbed | P Desorbed | P Added | P Sorbed | ||||
| mg P kgPSM | ||||||||||
| P.20.0.10.1 | 1376 | 0 | 1376 | 1190 | 1036 | 0 | 1035 | 1277 | 129 | 2540 |
| P.20.0.10.2 | 1376 | 3 | 1373 | 1150 | 1021 | 0 | 1021 | 1154 | 102 | 2496 |
| P.20.0.05.1 | 1376 | 0 | 1376 | 1125 | 862 | 21 | 842 | 1261 | 212 | 2429 |
| P.20.0.05.2 | 1376 | 0 | 1376 | 1098 | 887 | 0 | 887 | 1242 | 201 | 2463 |
| P.20.0.10.1 | 15,292 | 2198 | 13,095 | 19,671 | 18,048 | 145 | 17,903 | 19,781 | 1333 | 30,746 |
| P.20.0.10.2 | 15,292 | 2402 | 12,891 | 19,627 | 18,294 | 164 | 18,129 | 18,885 | 1251 | 30,686 |
| P.20.0.05.1 | 15,292 | 1555 | 13,737 | 19,306 | 20,967 | 197 | 20,816 | 19,096 | 776 | 33,698 |
| P.20.0.05.2 | 15,292 | 1355 | 13,937 | 19,783 | 19,008 | 34 | 19,027 | 15,899 | 1370 | 32,697 |
| P.5.6.05.1 | 15,292 | 1522 | 13,770 | 18,489 | 18,791 | 195 | 18,679 | 17,473 | 294 | 31,075 |
| P.5.6.05.2 | 15,292 | 1463 | 13,829 | 18,753 | 18,459 | 181 | 18,380 | 18,187 | 349 | 30,871 |
Each two replicates refer to a regeneration treatment, defined by (a) volume of KOH (measured in pore volumes, or PV), (b) recirculation and (c) residence time. The identification of the replicates follow the notation: X.PV.RC.RT.Replicate, with X being the initial of the PSM (A for Alcan, B for Biomax or P for PhosRedeem. Total sorbed and desorbed P include rinse P concentrations. , where and are the P concentrations adsorbed in the sorption phases and desorbed in desorption phases, respectively. and are the P concentrations observed in the rinse solution after each sorption or desorption phase.
References
- Vohla, C.; Kõiv, M.; Bavor, H.J.; Chazarenc, F.; Mander, Ü. Filter materials for phosphorus removal from wastewater in treatment wetlands—A review. Ecol. Eng. 2011, 37, 70–89. [Google Scholar] [CrossRef]
- Penn, C.; Chagas, I.; Klimeski, A.; Lyngsie, G. A review of phosphorus removal structures: How to assess and compare their performance. Water 2017, 9, 583. [Google Scholar] [CrossRef]
- Claveau-Mallet, D.; Wallace, S.; Comeau, Y. Model of phosphorus precipitation and crystal formation in electric arc furnace steel slag filters. Environ. Sci. Technol. 2012, 46, 1465–1470. [Google Scholar] [CrossRef] [PubMed]
- Allred, B.J.; Martinez, L.R.; Gamble, D.L. Phosphate removal from agricultural drainage water using an iron oxyhydroxide filter material. Water Air Soil Pollut. 2017, 228, 240. [Google Scholar] [CrossRef]
- Dobbie, K.; Heal, K.; Aumonier, J.; Smith, K.; Johnston, A.; Younger, P. Evaluation of iron ochre from mine drainage treatment for removal of phosphorus from wastewater. Chemosphere 2009, 75, 795–800. [Google Scholar] [CrossRef] [Green Version]
- McCobb, T.D.; LeBlanc, D.R.; Massey, A.J. Monitoring the removal of phosphate from ground water discharging through a pond-bottom permeable reactive barrier. Groundw. Monit. Remediat. 2009, 29, 43–55. [Google Scholar] [CrossRef]
- Wood, R.; McAtamney, C. Constructed wetlands for waste water treatment: The use of laterite in the bed medium in phosphorus and heavy metal removal. Hydrobiologia 1996, 340, 323–331. [Google Scholar] [CrossRef]
- Bastin, O.; Janssens, F.; Dufey, J.; Peeters, A. Phosphorus removal by a synthetic iron oxide–gypsum compound. Ecol. Eng. 1999, 12, 339–351. [Google Scholar] [CrossRef]
- Boujelben, N.; Bouzid, J.; Elouear, Z.; Feki, M.; Jamoussi, F.; Montiel, A. Phosphorus removal from aqueous solution using iron coated natural and engineered sorbents. J. Hazard. Mater. 2008, 151, 103–110. [Google Scholar] [CrossRef]
- Clayton, M.E.; Liegeois, S.; Brown, E.J. Phosphorus sequestration in lake sediment with iron mine tailings. Soil Sediment Contam. 2004, 13, 421–431. [Google Scholar] [CrossRef]
- Ayoub, G.M.; Koopman, B.; Pandya, N. Iron and aluminum hydroxy (oxide) coated filter media for low-concentration phosphorus removal. Water Environ. Res. 2001, 73, 478–485. [Google Scholar] [CrossRef]
- Li, M.; Liu, J.; Xu, Y.; Qian, G. Phosphate adsorption on metal oxides and metal hydroxides: A comparative review. Environ. Rev. 2016, 24, 319–332. [Google Scholar] [CrossRef]
- Mao, Y.; Yue, Q. Kinetic modeling of phosphate adsorption by preformed and in situ formed hydrous ferric oxides at circumneutral pH. Sci. Rep. 2016, 6, 35292. [Google Scholar] [CrossRef]
- De Vicente, I.; Jensen, H.S.; Andersen, F.Ø. Factors affecting phosphate adsorption to aluminum in lake water: Implications for lake restoration. Sci. Total Environ. 2008, 389, 29–36. [Google Scholar] [CrossRef] [PubMed]
- Wilfert, P.; Kumar, P.S.; Korving, L.; Witkamp, G.J.; van Loosdrecht, M.C. The relevance of phosphorus and iron chemistry to the recovery of phosphorus from wastewater: A review. Environ. Sci. Technol. 2015, 49, 9400–9414. [Google Scholar] [CrossRef] [PubMed]
- Siwek, H.; Bartkowiak, A.; Włodarczyk, M. Adsorption of Phosphates from Aqueous Solutions on Alginate/Goethite Hydrogel Composite. Water 2019, 11, 633. [Google Scholar] [CrossRef] [Green Version]
- Tanada, S.; Kabayama, M.; Kawasaki, N.; Sakiyama, T.; Nakamura, T.; Araki, M.; Tamura, T. Removal of phosphate by aluminum oxide hydroxide. J. Colloid Interface Sci. 2003, 257, 135–140. [Google Scholar] [CrossRef]
- Sibrell, P.L.; Kehler, T. Phosphorus removal from aquaculture effluents at the Northeast Fishery Center in Lamar, Pennsylvania using iron oxide sorption media. Aquac. Eng. 2016, 72, 45–52. [Google Scholar] [CrossRef]
- Sibrell, P.L.; Montgomery, G.A.; Ritenour, K.L.; Tucker, T.W. Removal of phosphorus from agricultural wastewaters using adsorption media prepared from acid mine drainage sludge. Water Res. 2009, 43, 2240–2250. [Google Scholar] [CrossRef]
- Kunaschk, M.; Schmalz, V.; Dietrich, N.; Dittmar, T.; Worch, E. Novel regeneration method for phosphate loaded granular ferric (hydr) oxide–A contribution to phosphorus recycling. Water Res. 2015, 71, 219–226. [Google Scholar] [CrossRef]
- Axens Solutions. ActiGuard®—Water Treatment Series—Arsenic & Metals Removal from Water. 2017. Available online: https://www.axens.net/product/catalysts-a-adsorbents/228/actiguard-aafs50.html (accessed on 21 October 2019).
- ABS Materials. BioMaxTM Media Application for Bioswales. 2016. Available online: http://abswastewater.com/markets-served/stormwater-treatment/ (accessed on 21 October 2019).
- Penn, C.J.; Bowen, J.M. Design and Construction of Phosphorus Removal Structures for Improving Water Quality; Springer International Publishing AG: Cham, Switzerland, 2017. [Google Scholar]
- Awual, M.R.; Jyo, A.; Ihara, T.; Seko, N.; Tamada, M.; Lim, K.T. Enhanced trace phosphate removal from water by zirconium (IV) loaded fibrous adsorbent. Water Res. 2011, 45, 4592–4600. [Google Scholar] [CrossRef] [PubMed]
- Murphy, J.; Riley, J.P. A modified single solution method for the determination of phosphate in natural waters. Anal. Chim. Acta 1962, 27, 31–36. [Google Scholar] [CrossRef]
- USEPA, Environment and Climate Change Canada. Annex 4 Objects and Targets Task Team, 2015: Recommended Phosphorus Loading Targets for Lake Erie. Available online: http://scavia.seas.umich.edu/wp-content/uploads/2015/06/FINAL-Objectives-TT-report-en-150624-3.pdf (accessed on 20 October 2019).
- McBride, M.B. Environmental Chemistry of Soils; Oxford University Press: New York, NY, USA, 1994. [Google Scholar]
- Cabrera, F.; De Arambarri, P.; Madrid, L.; Toga, C. Desorption of phosphate from iron oxides in relation to equilibrium pH and porosity. Geoderma 1981, 26, 203–216. [Google Scholar] [CrossRef]
Figure 1.
Experimental conditions and phosphorus (P) regeneration treatments tested. PV = pore volume; RT = residence time; RC = recirculation.
Figure 1.
Experimental conditions and phosphorus (P) regeneration treatments tested. PV = pore volume; RT = residence time; RC = recirculation.

Figure 2.
Preliminary evaluation of phosphorus (P) removal ability of Alcan in flow-through experiments conducted at a residence time (RT) of 0.28 min and inflow P concentrations of (a) 0.5 mg L and (b) 50 mg L. Cumulative P removal is plotted as a function of cumulative P added.
Figure 2.
Preliminary evaluation of phosphorus (P) removal ability of Alcan in flow-through experiments conducted at a residence time (RT) of 0.28 min and inflow P concentrations of (a) 0.5 mg L and (b) 50 mg L. Cumulative P removal is plotted as a function of cumulative P added.

Figure 3.
Preliminary evaluation of phosphorus (P) removal ability of Biomax in flow-through experiments conducted at a residence time (RT) of 0.28 min and inflow P concentrations of (a) 0.5 mg L and (b) 50 mg L. Cumulative P removal is plotted as a function of cumulative P added.
Figure 3.
Preliminary evaluation of phosphorus (P) removal ability of Biomax in flow-through experiments conducted at a residence time (RT) of 0.28 min and inflow P concentrations of (a) 0.5 mg L and (b) 50 mg L. Cumulative P removal is plotted as a function of cumulative P added.

Figure 4.
Preliminary evaluation of phosphorus (P) removal ability of PhosRedeem in flow-through experiments conducted at a residence time (RT) of 0.28 min and inflow P concentrations of (a) 0.5 mg L and (b) 50 mg L. Cumulative P removal is plotted as a function of cumulative P added.
Figure 4.
Preliminary evaluation of phosphorus (P) removal ability of PhosRedeem in flow-through experiments conducted at a residence time (RT) of 0.28 min and inflow P concentrations of (a) 0.5 mg L and (b) 50 mg L. Cumulative P removal is plotted as a function of cumulative P added.

Figure 5.
Effects of regeneration residence time on phosphorus (P) recovery from P sorption materials (PSM). Phosphorus recovery is shown after the first sorption cycle (S0-D0) only, treated with 20 pore volumes of 1 M KOH and no recirculation. Treatments separated based on PSM type and P concentration used during the sorption phase.

Figure 6.
Effects of regenerative solution pore volume (PV) on phosphorus (P) recovery from P sorption materials (PSMs). Phosphorus recovery is shown after the first sorption cycle (S0-D0) only, treated with 1 M KOH at a residence time of 0.5 min with no recirculation. Treatments separated based on PSM type and P concentration used during the sorption phase.

Figure 7.
Effects of the number of recirculation of regenerative solution on phosphorus (P) recovery from P sorption materials (PSMs). Phosphorus recovery is shown after the first sorption-desorption cycle (S0-D0) only, treated with five pore volumes of 1 M KOH at a residence time of 0.5 min. Treatments separated based on PSM type and P concentration used during the sorption phase.

Figure 8.
Phosphorus (P) recovery across all evaluated cycles and treatments for Alcan. The treatments identified on the x-axis follow the notation: AX.PV.RC.RT, with X being the level of P concentration (L for low or 0.5 mg L and H for high or 50 mg L), PV: pore volume (5 or 20), RC: number of recirculations (0,6 or 24) and RT: residence time used in the desorption phase. Phosphorus recovery in the S1-D1 cycle was omitted for the treatment AL.5.0.05, which showed an average of 3233% with standard deviation (S) of 2997.

Figure 9.
Phosphorus (P) recovery across all evaluated cycles and treatments for Biomax. The treatments identified on the x-axis follow the notation: PX.PV.RC.RT, with X being the level of P concentration (L for low or 0.5 mg L and H for high or 50 mg L), PV: pore volume (5 or 20), RC: number of recirculations (0, 6, or 24) and RT: residence time used in the desorption phase.

Figure 10.
Phosphorus (P) recovery across all evaluated cycles and treatments for PhosRedeem. The treatments identified on the x-axis follow the notation: PX.PV.RC.RT, with X being the level of P concentration (L for low or 0.5 mg L and H for high or 50 mg L), PV: pore volume (5 or 20), RC: number of recirculations (0, 6, or 24) and RT: residence time used in the desorption phase.

Table 1.
Chemical characterization of PSMs: Average elemental composition and pH.
| Sample | Aluminum | Calcium | Iron | Magnesium | pH |
|---|---|---|---|---|---|
| mg kg | |||||
| Alcan | 350,975 | 348 | 20,286 | 0 | 6.49 |
| Biomax | 297,508 | 356 | 56,502 | 0 | 6.85 |
| PhosRedeem | 7567 | 86,726 | 335,646 | 2917 | 11.49 |
Elemental composition derived from acid digestions. pH in water.
Table 2.
Preliminary performance and subsequent maximum phosphorus (P) removed (P) by three P sorption materials (PSMs) under flow-through conditions of 0.5 and 50 mg P L inflow and 0.284 min residence time. The P values were used as the target for initial P saturation in regeneration experiments.
Table 2.
Preliminary performance and subsequent maximum phosphorus (P) removed (P) by three P sorption materials (PSMs) under flow-through conditions of 0.5 and 50 mg P L inflow and 0.284 min residence time. The P values were used as the target for initial P saturation in regeneration experiments.
| PSM | Sample | Flow-Through Model | P |
|---|---|---|---|
| Alcan 0.5 mg L | A05A | 12,043 | |
| A05B | 16,817 | ||
| AVERAGE | 14,430 | ||
| STD DEV | 3376 | ||
| Biomax 0.5 mg L | B05A | 9469 | |
| B05B | 6193 | ||
| AVERAGE | 7831 | ||
| STD DEV | 2322 | ||
| PhosRedeem 0.5 mg L | P05A | 1123 | |
| P05B | 1164 | ||
| AVERAGE | 1144 | ||
| STD DEV | 16 | ||
| Alcan 50 mg L | A50A | 18,874 | |
| A50B | 16,849 | ||
| AVERAGE | 17,861 | ||
| STD DEV | 1432 | ||
| Biomax 50 mg L | B50A | 19,992 | |
| B50B | 21,231 | ||
| AVERAGE | 20,612 | ||
| STD DEV | 876 | ||
| PhosRedeem 50 mg L | P50A | 22,616 | |
| P50B | 16,308 | ||
| AVERAGE | 18,884 | ||
| STD DEV | 2829 |
Exponential general model: , where x is the cumulative P added to PSM in mg kg, and is the cumulative P removal (%). Maximum P sorption in the flow-through experiments corresponds to the point in which the PSM sample is P saturated. Standard deviation of replicates. Average was calculated based on four replicates and two of them are shown in the table.
Table 3.
Experimental sequence for sorption and desorption cycles for the regeneration of Al/Fe-rich P sorption materials (PSMs). The same cycles were tested at both low level (0.5 mg P L) and high level (50 mg P L) P treatments. All experiments were conducted in duplicate.
Table 3.
Experimental sequence for sorption and desorption cycles for the regeneration of Al/Fe-rich P sorption materials (PSMs). The same cycles were tested at both low level (0.5 mg P L) and high level (50 mg P L) P treatments. All experiments were conducted in duplicate.
| Cycle 0 | SORPTION PHASE | ⇒ | DESORPTION PHASE/REGENERATION |
| Phase S0 | Phase D0 | ||
| Batch sorption isotherm | Flow-through system | ||
| Cycle 1 | SORPTION PHASE | ⇒ | DESORPTION PHASE/REGENERATION |
| Phase S1 | Phase D1 | ||
| Flow-through system | |||
| Cycle 2 | SORPTION PHASE | ||
| Phase S2 | |||
| Flow-through system | |||
© 2020 by the authors. Licensee MDPI, Basel, Switzerland. This article is an open access article distributed under the terms and conditions of the Creative Commons Attribution (CC BY) license (http://creativecommons.org/licenses/by/4.0/).
Share and Cite
MDPI and ACS Style
S. P. C. Scott, I.; J. Penn, C.; Huang, C.-h. Development of a Regeneration Technique for Aluminum-Rich and Iron-Rich Phosphorus Sorption Materials. Water 2020, 12, 1784. https://doi.org/10.3390/w12061784
AMA Style
S. P. C. Scott I, J. Penn C, Huang C-h. Development of a Regeneration Technique for Aluminum-Rich and Iron-Rich Phosphorus Sorption Materials. Water. 2020; 12(6):1784. https://doi.org/10.3390/w12061784
Chicago/Turabian StyleS. P. C. Scott, Isis, Chad J. Penn, and Chi-hua Huang. 2020. "Development of a Regeneration Technique for Aluminum-Rich and Iron-Rich Phosphorus Sorption Materials" Water 12, no. 6: 1784. https://doi.org/10.3390/w12061784
Note that from the first issue of 2016, this journal uses article numbers instead of page numbers. See further details here.