
The Potential Benefits and Limitations of Corn Cob and Sewage Sludge Biochars in an Infertile Oxisol

Abstract
:
1. Introduction
2. Materials and Methods
2.1. Biochars
2.2. Greenhouse Experiments
2.3. Soil and Plant Analyses
2.4. Statistical Analyses
3. Results
3.1. Biochars

| Ultimate Analysis | Proximate Analysis | |||||||||
|---|---|---|---|---|---|---|---|---|---|---|
| C | H | O | N | S | FC a | VM b | ash | |||
| % | ||||||||||
| CC c | 48.7 | 5.75 | 42.2 | 0.51 | 0.06 | NA | NA | 2.83 | ||
| CC UT | 84.9 | 2.42 | 2.66 | 0.89 | 0.13 | 80.3 | 8.26 | 11.4 | ||
| CC T | 84.3 | 2.80 | 4.47 | 0.91 | 0.16 | 84.8 | 9.64 | 5.61 | ||
| SS c | 37.7 | 5.22 | 14.6 | 7.05 | 3.58 | NA | NA | 31.9 | ||
| SS UT | 30.2 | 1.29 | <0.01 | 3.13 | 3.81 | 25.8 | 8.64 | 65.5 | ||
| SS T | 30.5 | 0.54 | <0.01 | 2.62 | 4.26 | 25.2 | 4.29 | 70.5 | ||
| Main Ash Components | ||||||||||
| SiO2 | Al2O3 | Fe2O3 | TiO2 | CaO | MgO | Na2O | K2O | P2O5 | SO3 | |
| % | ||||||||||
| CC c | 52.1 | 1.52 | 1.30 | 0.13 | 2.46 | 1.90 | 0.36 | 21.00 | 8.56 | 2.54 |
| CC UT | 22.2 | 1.57 | 5.41 | 0.25 | 1.79 | 2.64 | 7.19 | 36.9 | 10.1 | 2.84 |
| CC T | 20.1 | 1.45 | 4.54 | 0.24 | 1.62 | 3.31 | 11.0 | 23.6 | 12.7 | 4.03 |
| SS c | 13.4 | 4.79 | 23.3 | 1.17 | 9.11 | 3.69 | 8.44 | 2.36 | 21.3 | 12.5 |
| SS UT | 14.4 | 5.68 | 21.2 | 1.39 | 9.13 | 3.99 | 8.61 | 2.13 | 20.9 | 11.9 |
| SS T | 14.5 | 5.79 | 22.5 | 1.46 | 9.41 | 4.29 | 5.42 | 1.91 | 22.4 | 10.6 |
| Heavy Metals | ||||||||||
| As | Cd | Cr | Cu | Hg | Mo | Ni | Pb | Se | Zn | |
| mg·kg−1 | ||||||||||
| CC c | 0.18 | 0.1 | 9.56 | 4.27 | <0.01 | 2.8 | 1 | 1.5 | <0.05 | 35.1 |
| CC UT | 0.56 | 0.5 | 24.7 | 24 | 0.59 | 16.4 | 14 | 2.1 | 0.89 | 164 |
| SS c | 4.66 | 3.2 | 65 | 346 | 0.28 | 9 | 27 | 14 | 8.58 | 1030 |
| SS UT | 16.7 | 6.0 | 170 | 712 | 0.11 | 13 | 71 | 60 | 14.0 | 2360 |
| SS T | 18.2 | 7.0 | 182 | 766 | <0.01 | 24 | 74 | 81 | 14.9 | 3190 |
| USEPA d | 75 | 85 | NR | 4300 | 57 | 75 | 420 | 840 | 100 | 7500 |
| Hawaii e | 20 | 15 | 200 | 1500 | 10 | 15 | 100 | 300 | 25 | 2000 |
| Sample | pH | CEC | NH4+-N | NO3--N | P | K+ | Ca++ | Mg++ | Na+ |
|---|---|---|---|---|---|---|---|---|---|
| cmolc·kg−1 | mg·kg−1 | ||||||||
| CC UT | 9.20(0.03) | 11.3(1.27) | 10.6(0.8) | 1.04(1.41) | 129(18.5) | 16,371(1286) | 136(12.2) | 432(39.2) | 535(95.6) |
| CC T | 9.45(0.24) | NA a | 24.7(12.8) | 0.03(0.06) | 175(35.8) | 10,547(5025) | 140(12.9) | 471(38.4) | 4416(3457) |
| SS UT | 6.81(0.06) | 15.5(0.10) | 216(34.3) | ND b | 372(90.2) | 1200(274) | 1240(242) | 190(27.0) | 11,077(2985) |
| SS T | 6.86(0.02) | NA | 33.3(5.6) | ND | 1285(19.6) | 1015(163) | 1683(313) | 255(55.1) | 4205(647) |
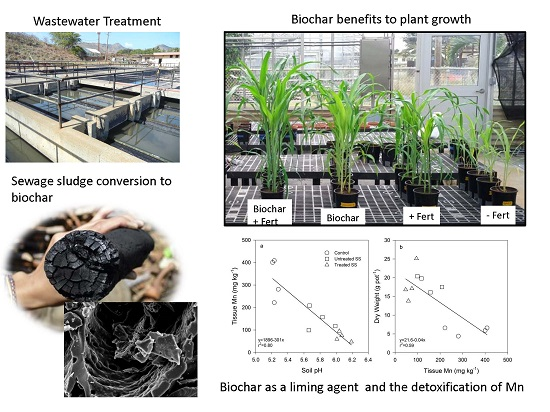
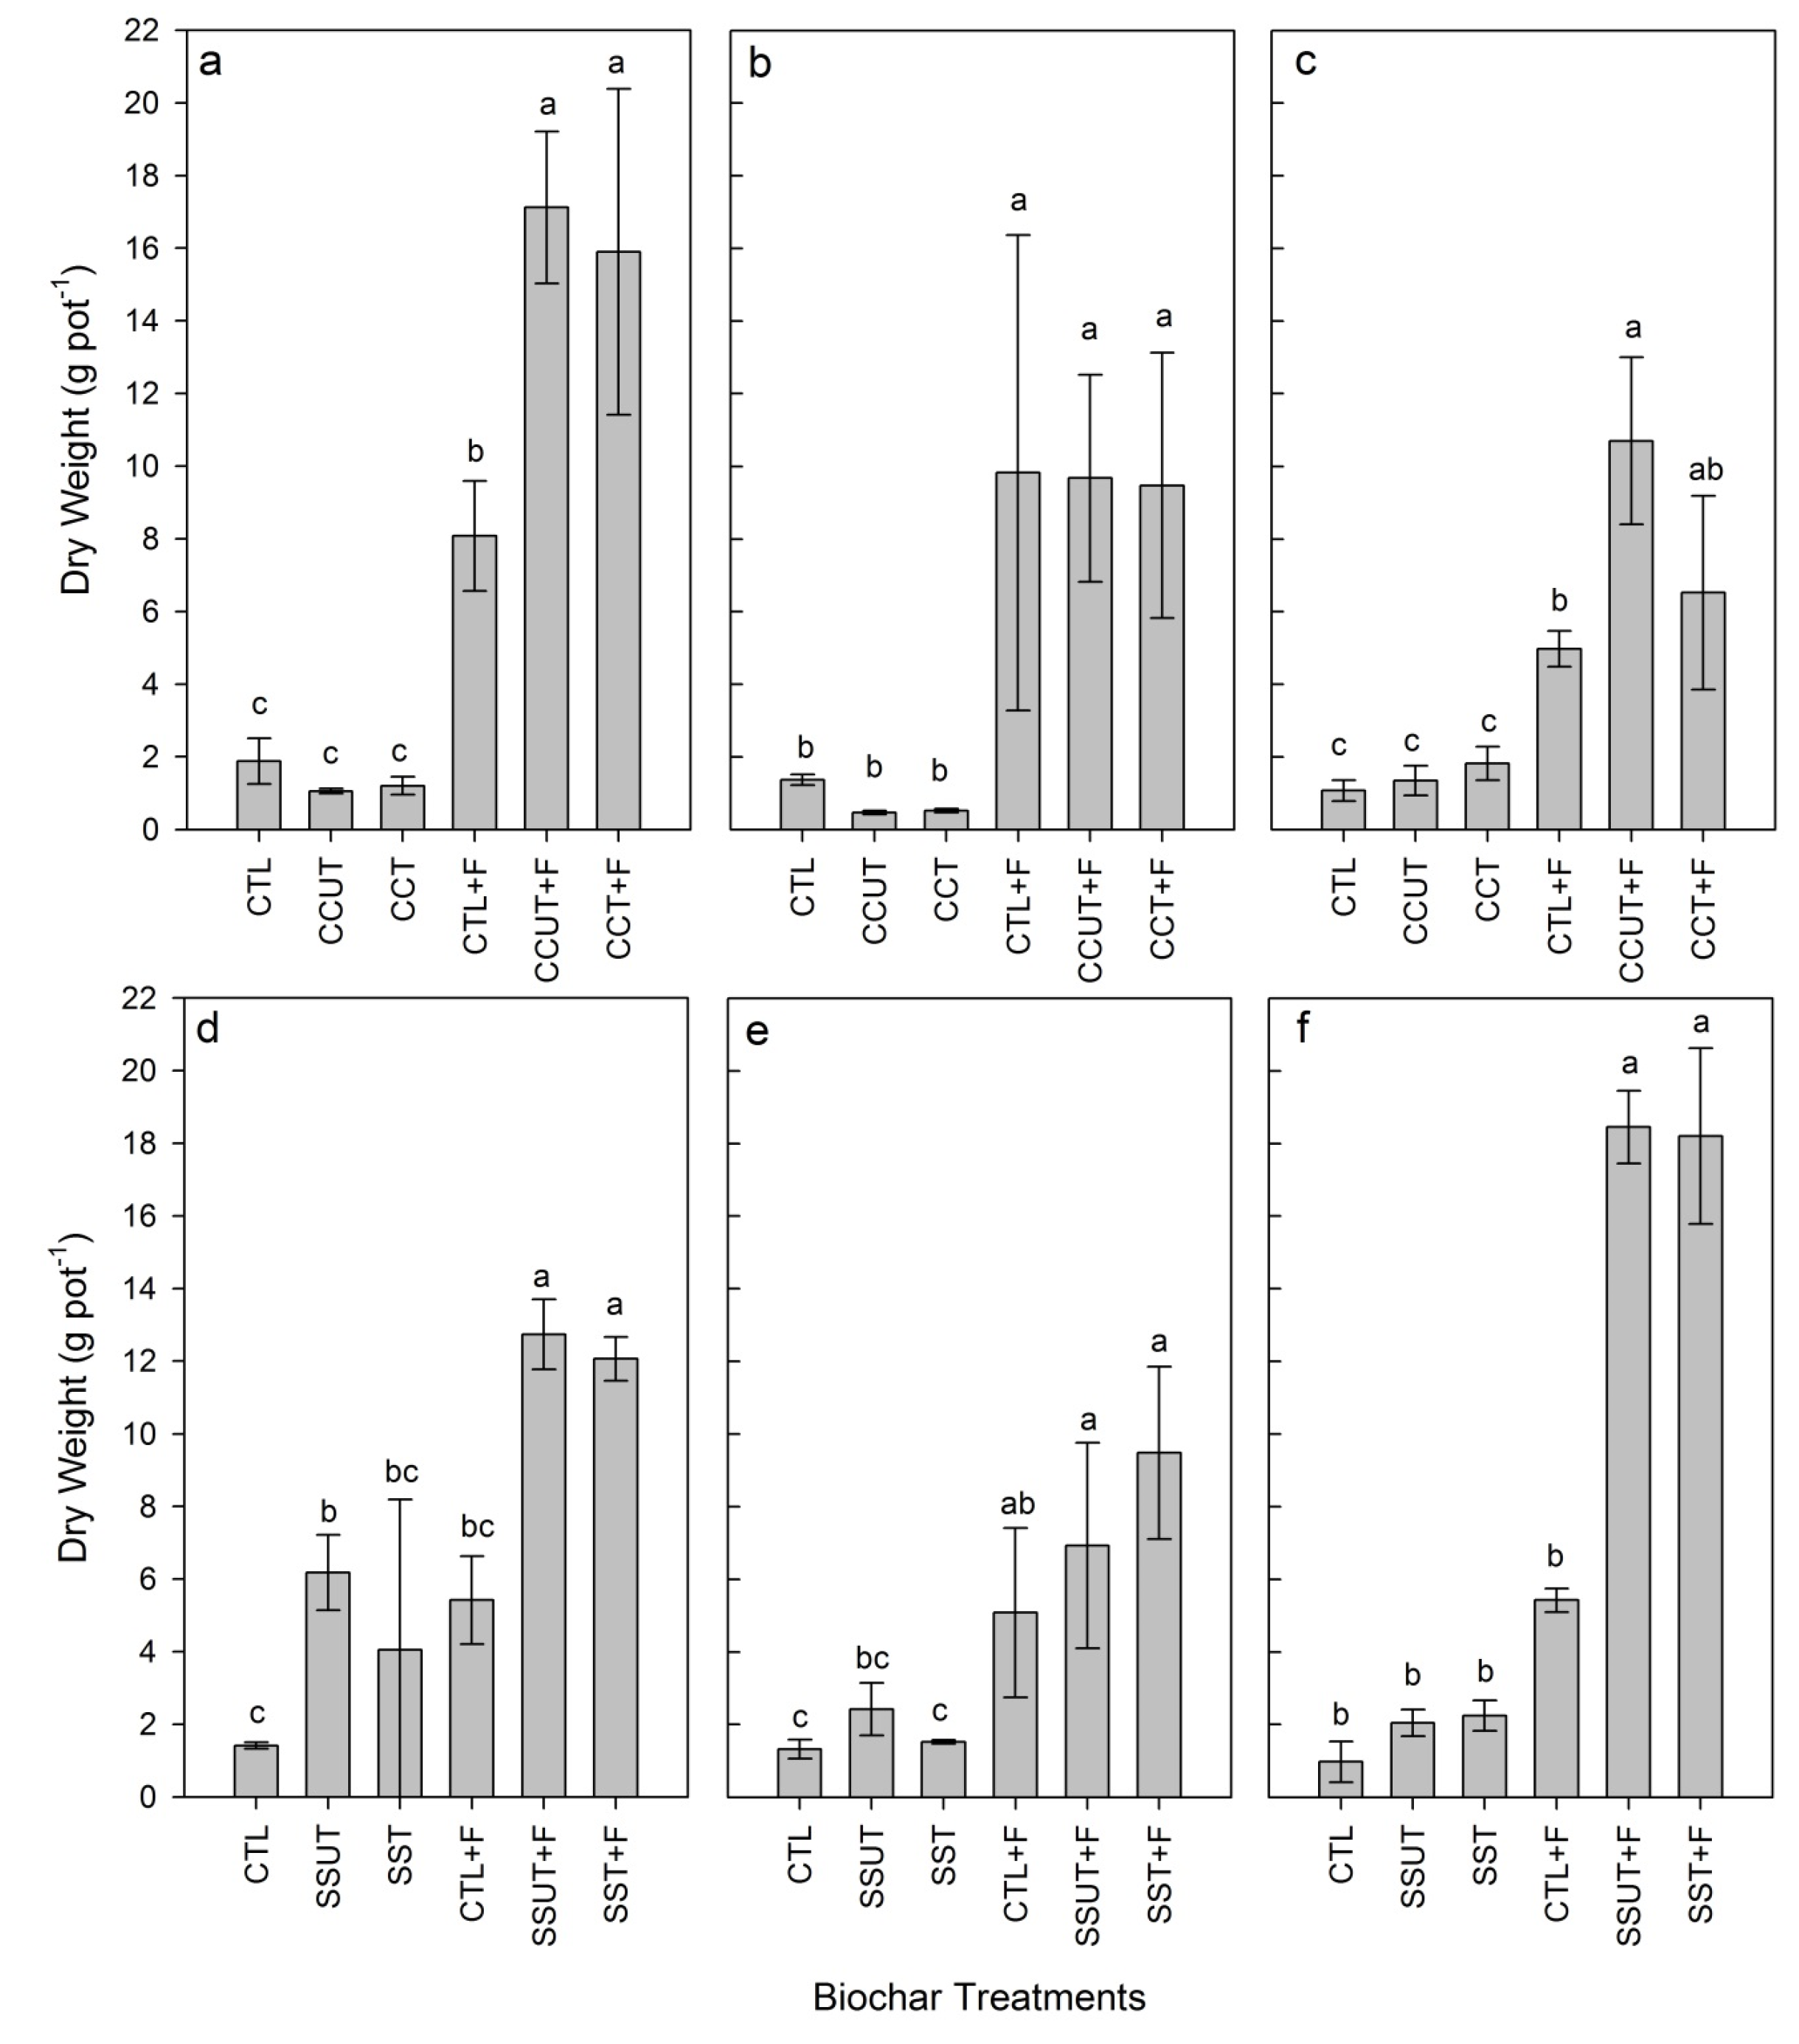
3.2. Plant Growth

3.3. Soil Properties
| Treatment | pH | TC | TN | P | K | Ca | Mg |
|---|---|---|---|---|---|---|---|
| g·kg−1 | mg·kg−1 | ||||||
| Corn Cob Biochar | |||||||
| Crop Cycle 1 | |||||||
| Control | 6.16 b | 12.6 b | 1.5 b | 8.31 b | 427 c | 686 b | 219 c |
| Untreated | 6.31 b | 26.11 a | 3.0 a | 10.7 b | 1083 a | 768 a | 258 b |
| Treated | 7.00 a | 27.2 a | 3.2 a | 16.8 a | 849 b | 812 a | 296 a |
| Crop Cycle 2 | |||||||
| Control | 6.33 b | NA | NA | 6.50 c | 377 d | 714 b | 248 a |
| Control + F | 5.56 d | NA | NA | 10.5 bc | 316 d | 709 b | 242 a |
| Untreated | 6.67 a | NA | NA | 10.2 bc | 926 a | 904 a | 245 a |
| Untreated + F | 6.00 c | NA | NA | 14.8 ab | 704 b | 660 b | 236 a |
| Treated | 6.99 a | NA | NA | 10.0 bc | 665 b | 902 a | 243 a |
| Treated + F | 6.27 bc | NA | NA | 21.6 a | 551 c | 694 b | 247 a |
| Crop Cycle 3 | |||||||
| Control | 6.53 b | 11.7 c | 1.3 b | 7.54 d | 154 d | 754 ab | 207 ab |
| Control + F | 4.58 d | 14.2 c | 1.6 b | 14.8 bc | 222 d | 650 ab | 181 ab |
| Untreated | 6.73 b | 30.7 a | 3.3 a | 7.76 d | 917 a | 830 a | 243 ab |
| Untreated + F | 5.44 c | 26.5 b | 3.0 a | 16.9 ab | 393 c | 531 b | 150 b |
| Treated | 7.08 a | 29.6 ab | 3.4 a | 12.2 c | 608 b | 872 a | 247 a |
| Treated + F | 5.17 c | 28.8 ab | 3.3 a | 19.6 a | 347 c | 544 b | 162 ab |
| Sewage Sludge Biochar | |||||||
| Crop Cycle 1 | |||||||
| Control | 6.23 b | 10.5 c | 2.1 a | 13.8 b | 285 c | 957 b | 251 c |
| Untreated | 6.07 c | 15.7 b | 1.8 a | 24.1 b | 434 a | 1137 a | 363 b |
| Treated | 6.59 a | 17.8 a | 2.1 a | 31.9 a | 375 b | 1092 a | 385 a |
| Crop Cycle 2 | |||||||
| Control | 6.40 a | NA | NA | 8.88 c | 184 a | 835 d | 227 b |
| Control + F | 5.43 c | NA | NA | 8.28 c | 199 a | 900b c | 239 b |
| Untreated | 5.82 b | NA | NA | 30.0 a | 211 a | 945 b | 351 a |
| Untreated + F | 5.73 b | NA | NA | 22.5 b | 211 a | 1055 a | 367 a |
| Treated | 6.32 a | NA | NA | 32.7 a | 237 a | 875 cd | 356 a |
| Treated + F | 6.33 a | NA | NA | 27.0 ab | 263 a | 980 b | 365 a |
| Crop Cycle 3 | |||||||
| Control | 6.33 a | 13.2 c | 1.5 c | 6.48 e | 193 ab | 816 b | 226 d |
| Control + F | 5.24 d | 14.2 c | 1.6 c | 16.5 de | 98.3 bc | 674 c | 151 e |
| Untreated | 5.89 bc | 18.5 b | 2.1 b | 24.4 cd | 160 abc | 916 a | 361 b |
| Untreated + F | 5.79 c | 26.5 a | 2.1 b | 58.8 a | 68.4 c | 850 ab | 272 c |
| Treated | 5.42 d | 17.1 b | 1.9 b | 38.1 bc | 205 a | 909 a | 396 a |
| Treated + F | 6.08 a | 28.8 a | 3.2 a | 52.4 a | 80.3 c | 911 a | 339 a |
3.4. Nutrient Uptake
| Treatment | N | P | K | Ca | Mg | B | Cu | Fe | Mn | Zn |
|---|---|---|---|---|---|---|---|---|---|---|
| mg·pot−1 | mg·pot−1 | |||||||||
| Corn Cob Biochar | ||||||||||
| Crop Cycle 1 | ||||||||||
| Control | 23.1 b | 1.84 c | 82.2 c | 10.5 b | 5.68 c | 0.03 c | 0.02 c | 1.10 ab | 0.33 c | 0.08 cd |
| Control + F | 228 a | 14.2 b | 493 b | 47.9 a | 28.8 b | 0.11 b | 0.08 b | 1.33 a | 4.54 a | 0.44 bc |
| Untreated | 18.6 b | 3.92 c | 44.9 c | 4.93 b | 4.11 c | 0.02 c | 0.005 c | 1.23 a | 0.18 c | 0.07 d |
| Untreated + F | 214 a | 27.6 a | 852 a | 52.4 a | 33.5 ab | 0.16a | 0.11a | 1.23 a | 1.94 b | 2.37 a |
| Treated | 15.6 a | 4.59 c | 68.9 c | 4.90 b | 4.55 c | 0.03 c | 0.005 c | 0.05 b | 0.21c | 0.07d |
| Treated + F | 205 a | 21.8 a | 777 a | 52.7 a | 37.6 a | 0.13 ab | 0.10 ab | 1.63 a | 1.84 b | 0.69 b |
| Crop Cycle 3 | ||||||||||
| Control | 4.88 b | 0.79 c | 36.5 d | 4.05b | 2.92 c | 0.01 b | 0.004 c | 1.31 ab | 0.11 c | 0.02 b |
| Control + F | 138 a | 7.38 bc | 228 bc | 26.9 a | 18.3b | 0.09 a | 0.042 b | 3.61 a | 8.94 a | 0.36 b |
| Untreated | 7.41 b | 2.93 c | 68.9 d | 6.14 b | 5.78c | 0.02 b | 0.005 c | 0.32 b | 0.21 c | 0.07 b |
| Untreated + F | 213 a | 20.7 a | 446 a | 34.4 a | 29.2 a | 0.13 a | 0.075 a | 1.16 ab | 4.58 b | 2.18 a |
| Treated | 13.6 b | 3.86 c | 81.9 cd | 6.61 b | 7.17 c | 0.03 b | 0.006 c | 0.19 b | 0.24 c | 0.09 b |
| Treated + F | 178 a | 14.3 ab | 328 ab | 24.3 a | 21.8 ab | 0.08 a | 0.049 ab | 0.65 b | 4.34 b | 0.42 b |
| Sewage Sludge Biochar | ||||||||||
| Crop Cycle 1 | ||||||||||
| Control | 18.3 d | 1.55 c | 57.9 c | 6.47 c | 4.09 c | 0.03 c | 0.008 c | 0.16 b | 0.18 d | 0.36 d |
| Control + F | 177 bc | 10.3 bc | 284 b | 20.6 b | 14.9 bc | 0.06 bc | 0.05 b | 1.97 a | 1.07 b | 0.24 cd |
| Untreated | 96.5 cd | 17.8 b | 299 b | 19.4 bc | 20.1 b | 0.07 b | 0.04 bc | 1.33 ab | 0.77 bc | 0.45 bc |
| Untreated + F | 381 a | 36.9 a | 699 a | 46.3 a | 46.8 a | 0.16 a | 0.11 a | 1.39 ab | 3.30 a | 1.32 a |
| Treated | 59.1 d | 15.0 bc | 178 bc | 15.3 bc | 13.3 bc | 0.05 bc | 0.02 bc | 0.27 b | 0.34 cd | 0.19 cd |
| Treated+F | 251 b | 33.2 a | 585 a | 37.2 a | 36.4 a | 0.14 a | 0.08 a | 1.15 ab | 0.91 bc | 0.68 b |
| Crop Cycle 3 | ||||||||||
| Control | 11.2 b | 1.08 b | 37.4 c | 4.66 c | 3.08 b | 0.02 b | 0.004 c | 0.15 b | 0.09 d | 0.02 b |
| Control + F | 139 a | 8.55 b | 202 b | 28.2 b | 23.6 b | 0.11 b | 0.04 b | 0.47 ab | 1.94 ab | 0.21 b |
| Untreated | 18.7 b | 7.36 b | 83.2 c | 7.81 c | 10.7 b | 0.07 b | 0.006 c | 0.06 b | 0.31 cd | 0.09 b |
| Untreated + F | 207 a | 36.5 a | 311 a | 45.0 ab | 74.4 a | 0.33 a | 0.08 a | 0.86 ab | 2.63a | 0.89 a |
| Treated | 20.4 b | 8.64 b | 92.9 c | 6.86 c | 9.98 b | 0.05 b | 0.007 c | 0.10 b | 0.16d | 0.09 b |
| Treated + F | 190 a | 39.2 a | 307 a | 52.2 a | 79.4 a | 0.34 a | 0.08 a | 1.43 a | 1.32bc | 0.64 a |
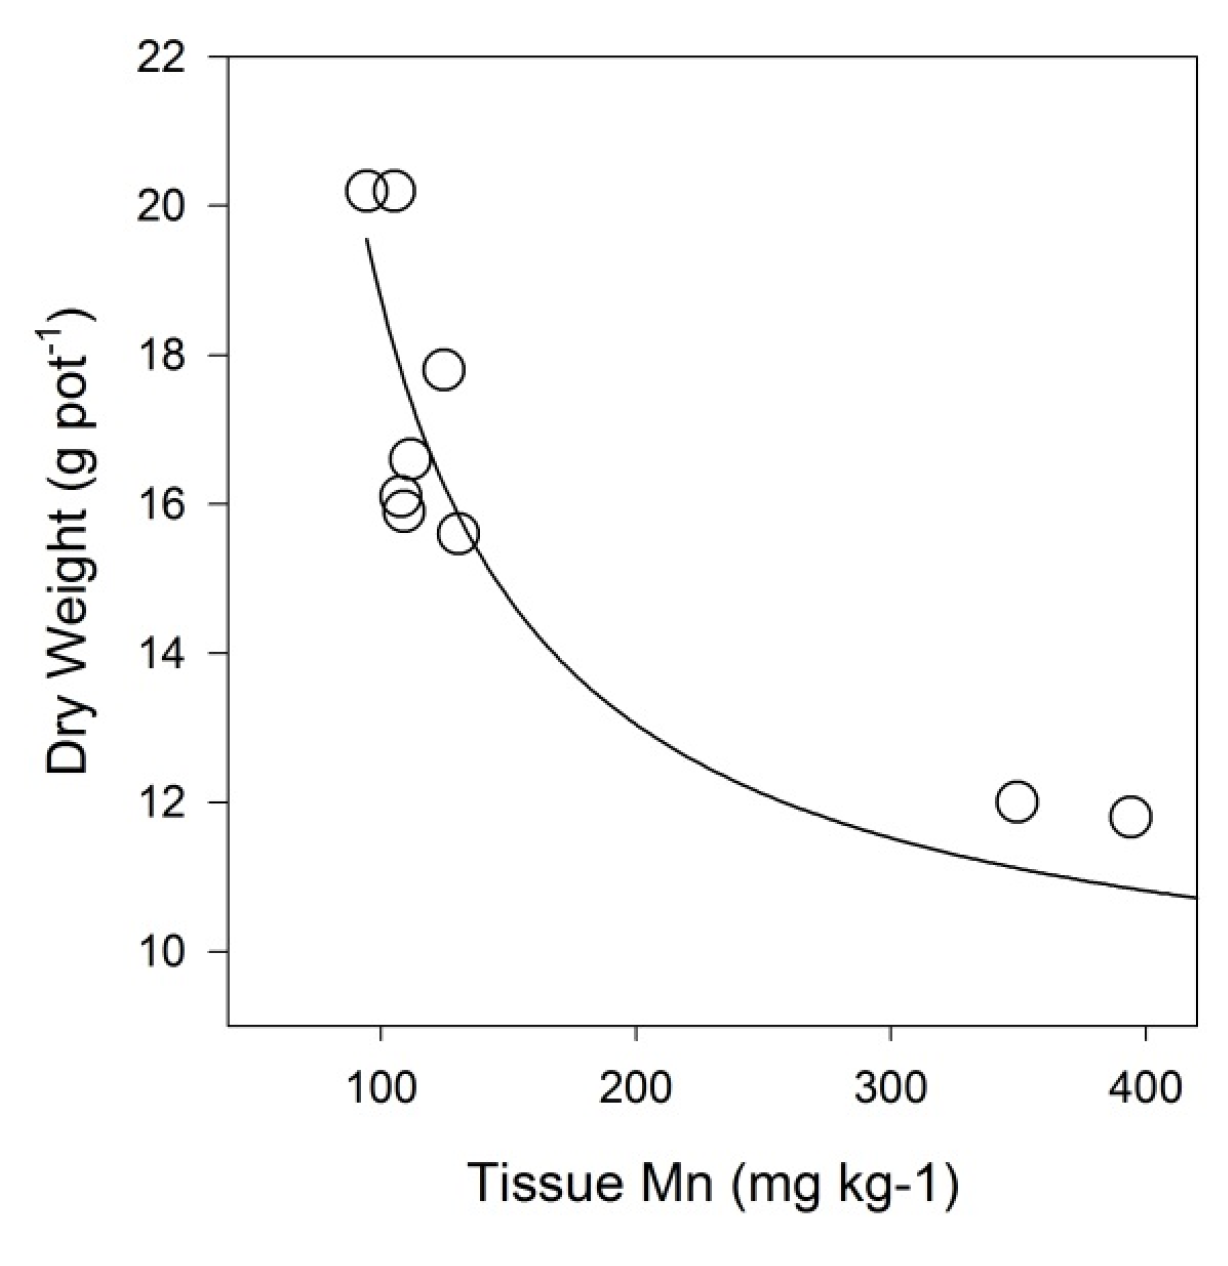
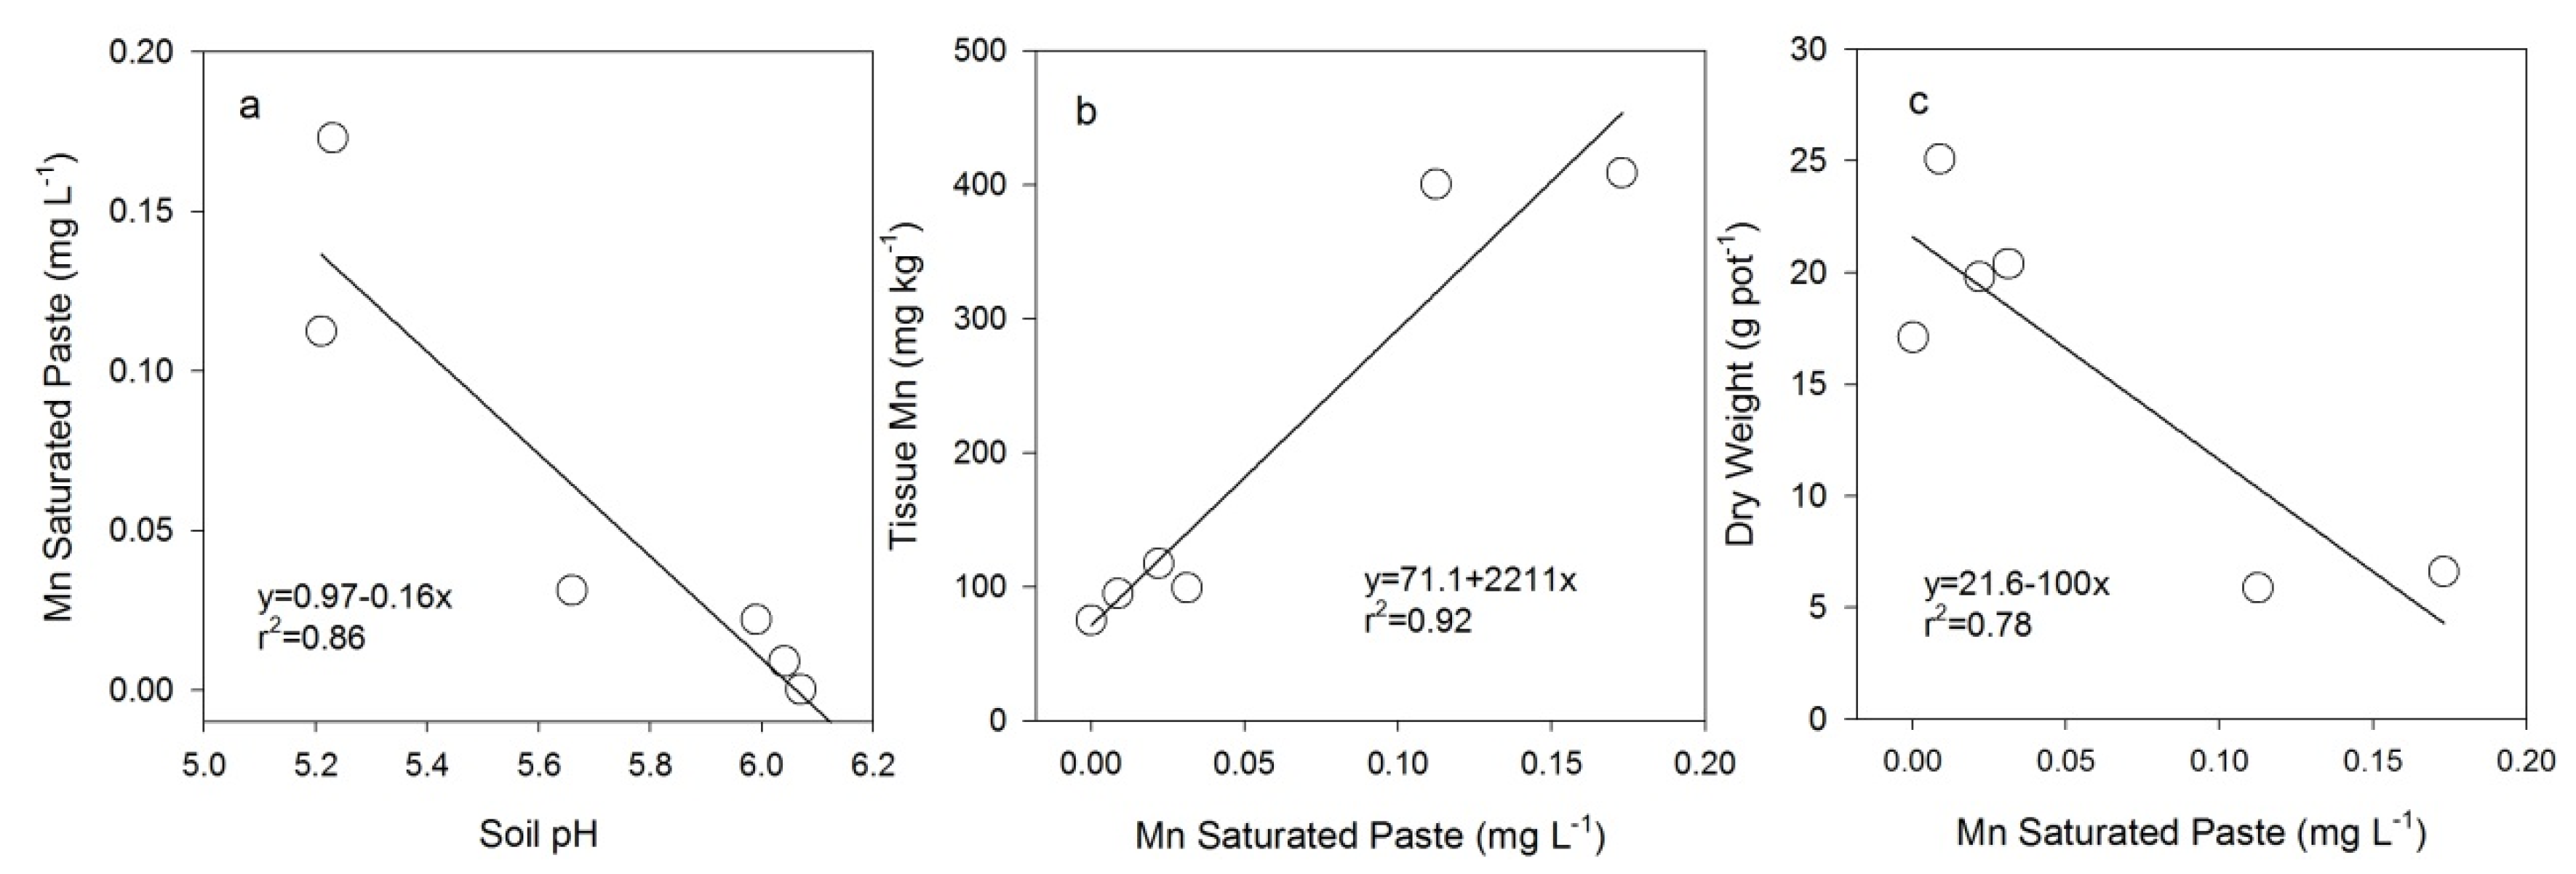
3.5. Heavy Metal Accumulation
| Treatment | As | Cd | Co | Cr | Ni | Pb | Se |
|---|---|---|---|---|---|---|---|
| Crop Cycle 1 | |||||||
| Tissue Concentration | |||||||
| mg·kg−1 | |||||||
| Control | 0.098 a | 0.580 a | 0.060 ab | 0.374 a | 0.214 a | 0.331 a | 0.054 a |
| CC UT | 0.090 a | 0.220 b | 0.015 b | 0.239 ab | 0.191 a | 0.183 a | 0.204 a |
| CC T | 0.087 a | 0.264 b | 0.019 ab | 0.278 ab | 0.129 a | 0.199 a | 0.530 a |
| SS UT | 0.116 a | 0.140 b | 0.088 a | 0.334 ab | 0.206 a | 0.173 a | 0.302 a |
| SS T | 0.093 a | 0.188 b | 0.044 ab | 0.206 b | 0.355 a | 0.132 a | 0.370 a |
| WHO MPC * | 0.1 | 0.05-0.4 | NA | 1.0 | NA | 0.05–1.5 | NA |
| Elemental Uptake | |||||||
| µg·pot−1 | |||||||
| Control | 0.79 a | 4.66 a | 0.49 a | 3.02 a | 1.72 a | 2.65 a | 0.44 a |
| CC UT | 1.58 a | 3.74 abc | 0.28 a | 4.07 a | 3.23 a | 3.13 a | 3.33 a |
| CC T | 1.40 a | 3.94 ab | 0.35 a | 4.24 a | 2.11 a | 3.31 a | 8.81 a |
| SS UT | 1.50 a | 1.85 c | 1.16 a | 4.36 a | 2.76 a | 2.34 a | 3.98 a |
| SS T | 1.17 a | 2.22 bc | 0.50 a | 2.50 a | 4.15 a | 1.62 a | 4.42 a |
| Crop Cycle 3 | |||||||
| Tissue Concentration | |||||||
| mg·kg−1 | |||||||
| Control | 0.129 a | 0.363 a | 0.312 a | 0.226 a | 0.983 a | 0.102 a | 0.347 a |
| CC UT | 0.089 a | 0.194 bc | 0.051 b | 0.342 a | 0.387 a | 0.206 a | 0.450 a |
| CC T | 0.084 a | 0.279 ab | 0.108 b | 0.325 a | 0.359 a | 0.117 a | 0.584 a |
| SS UT | 0.071 a | 0.136 cd | 0.037 b | 0.243 a | 0.161 a | 0.178 a | 0.437 a |
| SS T | 0.082 a | 0.056 d | 0.256 b | 0.285 a | 0.440 a | 0.117 a | 0.375 a |
| Elemental Uptake | |||||||
| µg·pot−1 | |||||||
| Control | 0.64 a | 1.85 a | 1.58 a | 1.34 a | 4.90 a | 0.51 a | 1.78 a |
| CC UT | 0.89 a | 2.00 a | 0.50 b | 3.62 a | 4.12 a | 2.04 a | 5.11 a |
| CC T | 0.58 a | 1.77 a | 0.66 b | 2.05 a | 2.16 a | 0.82 a | 4.38 a |
| SS UT | 0.93 a | 1.80 a | 0.49 b | 3.25 a | 2.13 a | 2.45 a | 5.70 a |
| SS T | 1.55 a | 1.00 a | 0.53 b | 5.40 a | 7.50 a | 2.35 a | 5.82 a |
4. Discussion
4.1. Plant Growth


4.2. Heavy Metal Accumulation
5. Conclusions
Supplementary Materials
Acknowledgments
Author Contributions
Conflicts of Interest
Abbreviations
| MDPI | Multidisciplinary Digital Publishing Institute |
| DOAJ | Directory of open access journals |
| TLA | Three letter acronym |
| LD | linear dichroism |
References
- Fytili, D.; Zabaniotou, A. Utilization of sewage sludge in eu application of old and new methods—A review. Renew. Sustain. Energy Rev. 2008, 12, 116–140. [Google Scholar] [CrossRef]
- Chen, H. Utilization of urban sewage sludge: Chinese perspectives. Environ. Sci. Pollut. Res. Int. 2012, 19, 1454–1463. [Google Scholar] [CrossRef] [PubMed]
- Fonts, I.; Gea, G.; Azuara, M.; Ábrego, J.; Arauzo, J. Sewage sludge pyrolysis for liquid production: A review. Renew. Sustain. Energy Rev. 2012, 16, 2781–2805. [Google Scholar] [CrossRef]
- Lu, Q.; He, Z.L.; Stoffella, P.J. Land application of biosolids in the USA: A review. Appl. Environ. Soil Sci. 2012, 2012, 11. [Google Scholar] [CrossRef]
- Services, D.O.E. 2013 Interim Status Report on the Integrated Solid Waste Management Plan (2008); Services, D.O.E., Ed.; Department of Environmental Services City and County of Honolulu: Honolulu, HI, USA, 2013. [Google Scholar]
- Laird, D.A. The charcoal vision: A win win win scenario for simultaneously producing bioenergy, permanently sequestering carbon, while improving soil and water quality. Agron. J. 2008, 100, 178–181. [Google Scholar] [CrossRef]
- Jeffery, S.; Verheijen, F.G.A.; van der Velde, M.; Bastos, A.C. A quantitative review of the effects of biochar application to soils on crop productivity using meta-analysis. Agric. Ecosyst. Environ. 2011, 144, 175–187. [Google Scholar] [CrossRef]
- Manyà, J.J. Pyrolysis for biochar purposes: A review to establish current knowledge gaps and research needs. Environ. Sci. Technol. 2012, 46, 7939–7954. [Google Scholar] [CrossRef] [PubMed]
- Verheijen, F.G.A.; Graber, E.R.; Ameloot, N.; Bastos, A.C.; Sohi, S.; Knicker, H. Biochars in soils: New insights and emerging research needs. Eur. J. Soil Sci. 2014, 65, 22–27. [Google Scholar] [CrossRef]
- Gascó, G.; Paz-Ferreiro, J.; Méndez, A. Thermal analysis of soil amended with sewage sludge and biochar from sewage sludge pyrolysis. J. Therm. Anal. Calorim. 2012, 108, 769–775. [Google Scholar] [CrossRef]
- Agrafioti, E.; Bouras, G.; Kalderis, D.; Diamadopoulos, E. Biochar production by sewage sludge pyrolysis. J. Anal. Appl. Pyrolysis 2013, 101, 72–78. [Google Scholar] [CrossRef]
- Méndez, A.; Terradillos, M.; Gascó, G. Physicochemical and agronomic properties of biochar from sewage sludge pyrolysed at different temperatures. J. Anal. Appl. Pyrolysis 2013, 102, 124–130. [Google Scholar] [CrossRef]
- Butnan, S.; Deenik, J.L.; Toomsan, B.; Antal, M.J.; Vityakon, P. Biochar characteristics and application rates affecting corn growth and properties of soils contrasting in texture and mineralogy. Geoderma 2015, 237, 105–116. [Google Scholar] [CrossRef]
- Liu, T.; Liu, B.; Zhang, W. Nutrients and heavy metals in biochar produced by sewage sludge pyrolysis: Its application in soil amendment. Pol. J. Environ. Stud. 2014, 23, 271–275. [Google Scholar]
- Lu, H.; Zhang, W.; Wang, S.; Zhuang, L.; Yang, Y.; Qiu, R. Characterization of sewage sludge-derived biochars from different feedstocks and pyrolysis temperatures. J. Anal. Appl. Pyrolysis 2013, 102, 137–143. [Google Scholar] [CrossRef]
- Hossain, M.K.; Strezov, V.; Chan, K.Y.; Ziolkowski, A.; Nelson, P.F. Influence of pyrolysis temperature on production and nutrient properties of wastewater sludge biochar. J. Environ. Manag. 2011, 92, 223–228. [Google Scholar] [CrossRef] [PubMed]
- Srinivasan, P.; Sarmah, A.K.; Smernik, R.; Das, O.; Farid, M.; Gao, W. A feasibility study of agricultural and sewage biomass as biochar, bioenergy and biocomposite feedstock: Production, characterization and potential applications. Sci. Total Environ. 2015, 512, 495–505. [Google Scholar] [CrossRef] [PubMed]
- Zhang, J.; Lü, F.; Zhang, H.; Shao, L.; Chen, D.; He, P. Multiscale visualization of the structural and characteristic changes of sewage sludge biochar oriented towards potential agronomic and environmental implication. Sci. Rep. 2015, 5. [Google Scholar] [CrossRef] [PubMed]
- Marks, E.A.N.; Alcaniz, J.M.; Domene, X. Unintended effects of biochars on short-term plant growth in a calcareous soil. Plant Soil 2014, 385, 87–105. [Google Scholar] [CrossRef]
- Hossain, M.K.; Strezov, V.; Nelson, P.F. Comparative assessment of the effect of wastewater sludge biochar on growth, yield and metal bioaccumulation of cherry tomato. Pedosphere 2015, 25, 680–685. [Google Scholar] [CrossRef]
- Khan, S.; Chao, C.; Waqas, M.; Arp, H.P.H.; Zhu, Y.G. Sewage sludge biochar influence upon rice (oryza sativa l) yield, metal bioaccumulation and greenhouse gas emissions from acidic paddy soil. Environ. Sci. Technol. 2013, 47, 8624–8632. [Google Scholar] [PubMed]
- Hossain, M.K.; Strezov, V.; Yin Chan, K.; Nelson, P.F. Agronomic properties of wastewater sludge biochar and bioavailability of metals in production of cherry tomato (lycopersicon esculentum). Chemosphere 2010, 78, 1167–1171. [Google Scholar] [CrossRef] [PubMed]
- Biederman, L.A.; Harpole, W.S. Biochar and its effects on plant productivity and nutrient cycling: A meta-analysis. GCB Bioenergy 2013, 5, 202–214. [Google Scholar] [CrossRef]
- Glaser, B.; Lehmann, J.; Zech, W. Ameliorating physical and chemical properties of highly weathered soils in the tropics with charcoal—A review. Biol. Fertil. Soils 2002, 35, 219–230. [Google Scholar] [CrossRef]
- Liang, B.; Lehmann, J.; Solomon, D.; Kinyangi, J.; Grossman, J.; O’Neill, B.; Skjemstad, J.O.; Thies, J.; Luizao, F.J.; Petersen, J.; et al. Black carbon increases cation exchange capacity in soils. Soil Sci. Soc. Am. J. 2006, 70, 1719–1730. [Google Scholar] [CrossRef]
- Chan, K.Y.; Van Zwieten, L.; Meszaros, I.; Downie, A.; Joseph, S. Agronomic values of greenwaste biochar as a soil amendment. Aust. J. Soil Res. 2007, 45, 629–634. [Google Scholar] [CrossRef]
- Deenik, J.L.; Diarra, A.; Uehara, G.; Campbell, S.; Sumiyoshi, Y.; Antal, M.J. Charcoal ash and volatile matter effects on soil properties and plant growth in an acid ultisol. Soil Sci. 2011, 176, 336–345. [Google Scholar] [CrossRef]
- Deenik, J.L.; McClellan, T.; Uehara, G.; Antal, M.J.; Campbell, S. Charcoal volatile matter content influences plant growth and soil nitrogen transformations. Soil Sci. Soc. Am. J. 2010, 74, 1259–1270. [Google Scholar] [CrossRef]
- Lehmann, J.; Rillig, M.C.; Thies, J.; Masiello, C.A.; Hockaday, W.C.; Crowley, D. Biochar effects on soil biota—A review. Soil Biol. Biochem. 2011, 43, 1812–1836. [Google Scholar] [CrossRef]
- Viger, M.; Hancock, R.D.; Miglietta, F.; Taylor, G. More plant growth but less plant defence? First global gene expression data for plants grown in soil amended with biochar. Glob. Chang. Biol. Bioenergy 2015, 7, 658–672. [Google Scholar] [CrossRef]
- Gundale, M.J.; DeLuca, T.H. Charcoal effects on soil solution chemistry and growth of koeleria macrantha in the ponderosa pine/douglas-fir ecosystem. Biol. Fertil. Soils 2007, 43, 303–311. [Google Scholar] [CrossRef]
- Buss, W.; Masek, O. Mobile organic compounds in biochar—A potential source of contamination—Phytotoxic effects on cress seed (lepidium sativum) germination. J. Environ. Manag. 2014, 137, 111–119. [Google Scholar] [CrossRef] [PubMed]
- Buss, W.; Mašek, O.; Graham, M.; Wüst, D. Inherent organic compounds in biochar–their content, composition and potential toxic effects. J. Environ. Manag. 2015, 156, 150–157. [Google Scholar] [CrossRef] [PubMed]
- Zheng, R.L.; Cai, C.; Liang, J.H.; Huang, Q.; Chen, Z.; Huang, Y.Z.; Arp, H.P.H.; Sun, G.X. The effects of biochars from rice residue on the formation of iron plaque and the accumulation of cd, zn, pb, as in rice (oryza sativa l.) seedlings. Chemosphere 2012, 89, 856–862. [Google Scholar] [CrossRef] [PubMed]
- Ahmad, M.; Rajapaksha, A.U.; Lim, J.E.; Zhang, M.; Bolan, N.; Mohan, D.; Vithanage, M.; Lee, S.S.; Ok, Y.S. Biochar as a sorbent for contaminant management in soil and water: A review. Chemosphere 2014, 99, 19–33. [Google Scholar] [CrossRef] [PubMed]
- Anawar, H.M.; Akter, F.; Solaiman, Z.M.; Strezov, V. Biochar: An emerging panacea for remediation of soil contaminants from mining, industry and sewage wastes. Pedosphere 2015, 25, 654–665. [Google Scholar] [CrossRef]
- Beesley, L.; Moreno-Jiménez, E.; Gomez-Eyles, J.L.; Harris, E.; Robinson, B.; Sizmur, T. A review of biochars’ potential role in the remediation, revegetation and restoration of contaminated soils. Environ. Pollut. 2011, 159, 3269–3282. [Google Scholar] [CrossRef] [PubMed]
- Park, J.H. Biochar reduces the bioavailability and phytotoxicity of heavy metals. Plant Soil 2011, 348, 439–451. [Google Scholar] [CrossRef]
- Inyang, M.; Gao, B.; Yao, Y.; Xue, Y.; Zimmerman, A.R.; Pullammanappallil, P.; Cao, X. Removal of heavy metals from aqueous solution by biochars derived from anaerobically digested biomass. Bioresour. Technol. 2012, 110, 50–56. [Google Scholar] [CrossRef] [PubMed]
- Liu, Z.; Zhang, F.-S. Removal of lead from water using biochars prepared from hydrothermal liquefaction of biomass. J. Hazard. Mater. 2009, 167, 933–939. [Google Scholar] [CrossRef] [PubMed]
- Lopez, R.J.; Higgins, S.R.; Pagaling, E.; Yan, T.; Cooney, M.J. High rate anaerobic digestion of wastewater separated from grease trap waste. Renew. Energy 2014, 62, 234–242. [Google Scholar] [CrossRef]
- Mohan, D.; Sarswat, A.; Ok, Y.S.; Pittman, C.U., Jr. Organic and inorganic contaminants removal from water with biochar, a renewable, low cost and sustainable adsorbent—A critical review. Bioresour. Technol. 2014, 160, 191–202. [Google Scholar] [CrossRef] [PubMed]
- Yao, Y.; Gao, B.; Inyang, M.; Zimmerman, A.R.; Cao, X.; Pullammanappallil, P.; Yang, L. Biochar derived from anaerobically digested sugar beet tailings: Characterization and phosphate removal potential. Bioresour. Technol. 2011, 102, 6273–6278. [Google Scholar] [CrossRef] [PubMed]
- Angst, T.E.; Sohi, S.P. Establishing release dynamics for plant nutrients from biochar. GCB Bioenergy 2013, 5, 221–226. [Google Scholar] [CrossRef]
- Yao, Y.; Gao, B.; Chen, J.; Yang, L. Engineered biochar reclaiming phosphate from aqueous solutions: Mechanisms and potential application as a slow-release fertilizer. Environ. Sci. Technol. 2013, 47, 8700–8708. [Google Scholar] [CrossRef] [PubMed]
- Antal, M.J.; Mochidzuki, K.; Paredes, L.S. Flash carbonization of biomass. Ind. Eng. Chem. Res. 2003, 42, 3690–3699. [Google Scholar] [CrossRef]
- Armas, C.M.; Santana, B.; Mora, J.L.; Notario, J.S.; Arbelo, C.D.; Rodríguez-Rodríguez, A. A biological quality index for volcanic andisols and aridisols (canary islands, spain): Variations related to the ecosystem degradation. Sci. Total Environ. 2007, 378, 238–244. [Google Scholar] [CrossRef] [PubMed]
- Ayers, A.S.; Hagihara, H.H. Available phosphorus in hawaiian soil profiles. Hawaii. Plant. Rec. 1952, 54, 81–99. [Google Scholar]
- Gentry, C.E.; Willis, R.B. Improved method for automated-determination of ammonium in soil extracts. Commun. Soil Sci. Plant Anal. 1988, 19, 721–737. [Google Scholar] [CrossRef]
- Mulvaney, R.L. Nitrogen- Inorganic Forms; Soil Science Society of America and American Society of Agronomy: Madison, WI, USA, 1996; pp. 1123–1184. [Google Scholar]
- Soil Conservation Service. Soil Survey Laboratory Data and Descriptions for Some Soils of Hawaii; Soil Conservation Service, U.S. Department of Agriculture: Washington, DC, USA, 1976. [Google Scholar]
- Hue, N.V.; Uchida, R.; Ho, M.C. Sampling and analysis of soils and plant tissues. In Plant Nutrient Management in Hawaii Soils; Silva, J.A., Uchida, R.S., Eds.; College of Tropical Agriculture and Human Resources, University of Hawaii: Honolulu, HI, USA, 2000; pp. 23–30. [Google Scholar]
- Porter, G.S.; Bajita-Locke, J.B.; Hue, N.V.; Strand, D. Manganese solubility and phytotoxicity affected by soil moisture, oxygen levels, and green manure additions. Commun. Soil Sci. Plant Anal. 2004, 35, 99–116. [Google Scholar] [CrossRef]
- Environmental Protection Agency. Part 503-Standards for the Use or Disposal of Sewage Sludge; Agency, E.P., Ed.; EPA: Washington, DC, USA, 2013.
- Hawaii Department of Health. Hawaii Administrative Rules Title 11 Wastewater Systems; Hawaii Department of Health: Honolulu, HI, USA, 2004. [Google Scholar]
- World Health Organization. Codex Alimentarius Commission; CF/5 INF/1; World Health Organization: Geneva, Switzerland, 2011. [Google Scholar]
- Smider, B.; Singh, B. Agronomic performance of a high ash biochar in two contrasting soils. Agric. Ecosyst. Environ. 2014, 191, 99–107. [Google Scholar] [CrossRef]
- Xu, G.; Wei, L.L.; Sun, J.N.; Shao, H.B.; Chang, S.X. What is more important for enhancing nutrient bioavailability with biochar application into a sandy soil: Direct or indirect mechanism? Ecol. Eng. 2013, 52, 119–124. [Google Scholar] [CrossRef]
- Chan, K.Y.; Van Zwieten, L.; Meszaros, I.; Downie, A.; Joseph, S. Using poultry litter biochars as soil amendments. Aust. J. Soil Res. 2008, 46, 437–444. [Google Scholar] [CrossRef]
- Major, J.; Rondon, M.; Molina, D.; Riha, S.; Lehmann, J. Maize yield and nutrition during 4 years after biochar application to a colombian savanna oxisol. Plant Soil 2010, 333, 117–128. [Google Scholar] [CrossRef]
- Quilliam, R.S.; Glanville, H.C.; Wade, S.C.; Jones, D.L. Life in the “charosphere”—Does biochar in agricultural soil provide a significant habitat for microorganisms? Soil Biol. Biochem. 2013, 65, 287–293. [Google Scholar] [CrossRef]
- Quilliam, R.S.; Marsden, K.A.; Gertler, C.; Rousk, J.; DeLuca, T.H.; Jones, D.L. Nutrient dynamics, microbial growth and weed emergence in biochar amended soil are influenced by time since application and reapplication rate. Agric. Ecosyst. Environ. 2012, 158, 192–199. [Google Scholar] [CrossRef]
- Wang, T.; Camps-Arbestain, M.; Hedley, M.; Bishop, P. Predicting phosphorus bioavailability from high-ash biochars. Plant Soil 2012, 357, 173–187. [Google Scholar] [CrossRef]
- Wang, Y.; Lin, Y.X.; Chiu, P.C.; Imhoff, P.T.; Guo, M.X. Phosphorus release behaviors of poultry litter biochar as a soil amendment. Sci. Total Environ. 2015, 512, 454–463. [Google Scholar] [CrossRef] [PubMed]
- European Union. Council Directive 86/278/eec of 12 June 1986 on the Protection of the Environment, and in Particular of the Soil, When Sewage Sludge is Used in Agriculture; European Union: Brussels, Belgium, 2009. [Google Scholar]
- Paz-Ferreiro, J.; Fu, S.L.; Mendez, A.; Gasco, G. Interactive effects of biochar and the earthworm pontoscolex corethrurus on plant productivity and soil enzyme activities. J. Soils Sediments 2014, 14, 483–494. [Google Scholar] [CrossRef]
- Zielinska, A.; Oleszczuk, P. The conversion of sewage sludge into biochar reduces polycyclic aromatic hydrocarbon content and ecotoxicity but increases trace metal content. Biomass Bioenergy 2015, 75, 235–244. [Google Scholar] [CrossRef]
- Fellet, G.; Marmiroli, M.; Marchiol, L. Elements uptake by metal accumulator species grown on mine tailings amended with three types of biochar. Sci. Total Environ. 2014, 468, 598–608. [Google Scholar] [CrossRef] [PubMed]
- Méndez, A.; Gómez, A.; Paz-Ferreiro, J.; Gascó, G. Effects of sewage sludge biochar on plant metal availability after application to a mediterranean soil. Chemosphere 2012, 89, 1354–1359. [Google Scholar] [CrossRef] [PubMed]
© 2016 by the authors; licensee MDPI, Basel, Switzerland. This article is an open access article distributed under the terms and conditions of the Creative Commons by Attribution (CC-BY) license (http://creativecommons.org/licenses/by/4.0/).
Share and Cite
Deenik, J.L.; Cooney, M.J. The Potential Benefits and Limitations of Corn Cob and Sewage Sludge Biochars in an Infertile Oxisol. Sustainability 2016, 8, 131. https://doi.org/10.3390/su8020131
Deenik JL, Cooney MJ. The Potential Benefits and Limitations of Corn Cob and Sewage Sludge Biochars in an Infertile Oxisol. Sustainability. 2016; 8(2):131. https://doi.org/10.3390/su8020131
Chicago/Turabian StyleDeenik, Jonathan L., and Michael J. Cooney. 2016. "The Potential Benefits and Limitations of Corn Cob and Sewage Sludge Biochars in an Infertile Oxisol" Sustainability 8, no. 2: 131. https://doi.org/10.3390/su8020131