A Building Project-Based Industrialized Construction Maturity Model Involving Organizational Enablers: A Multi-Case Study in China


Abstract
:1. Introduction
2. Literature Review
2.1. Methods or Models of Evaluating Industrialized Construction Projects
2.2. Maturity Models and Maturity Evaluation in Construction Management
2.3. The EFQM Excellence Model Application in the Construction Industry
2.4. Summary
3. Research Methods
4. ICMM Establishment
4.1. Evaluation Indicator System Determination
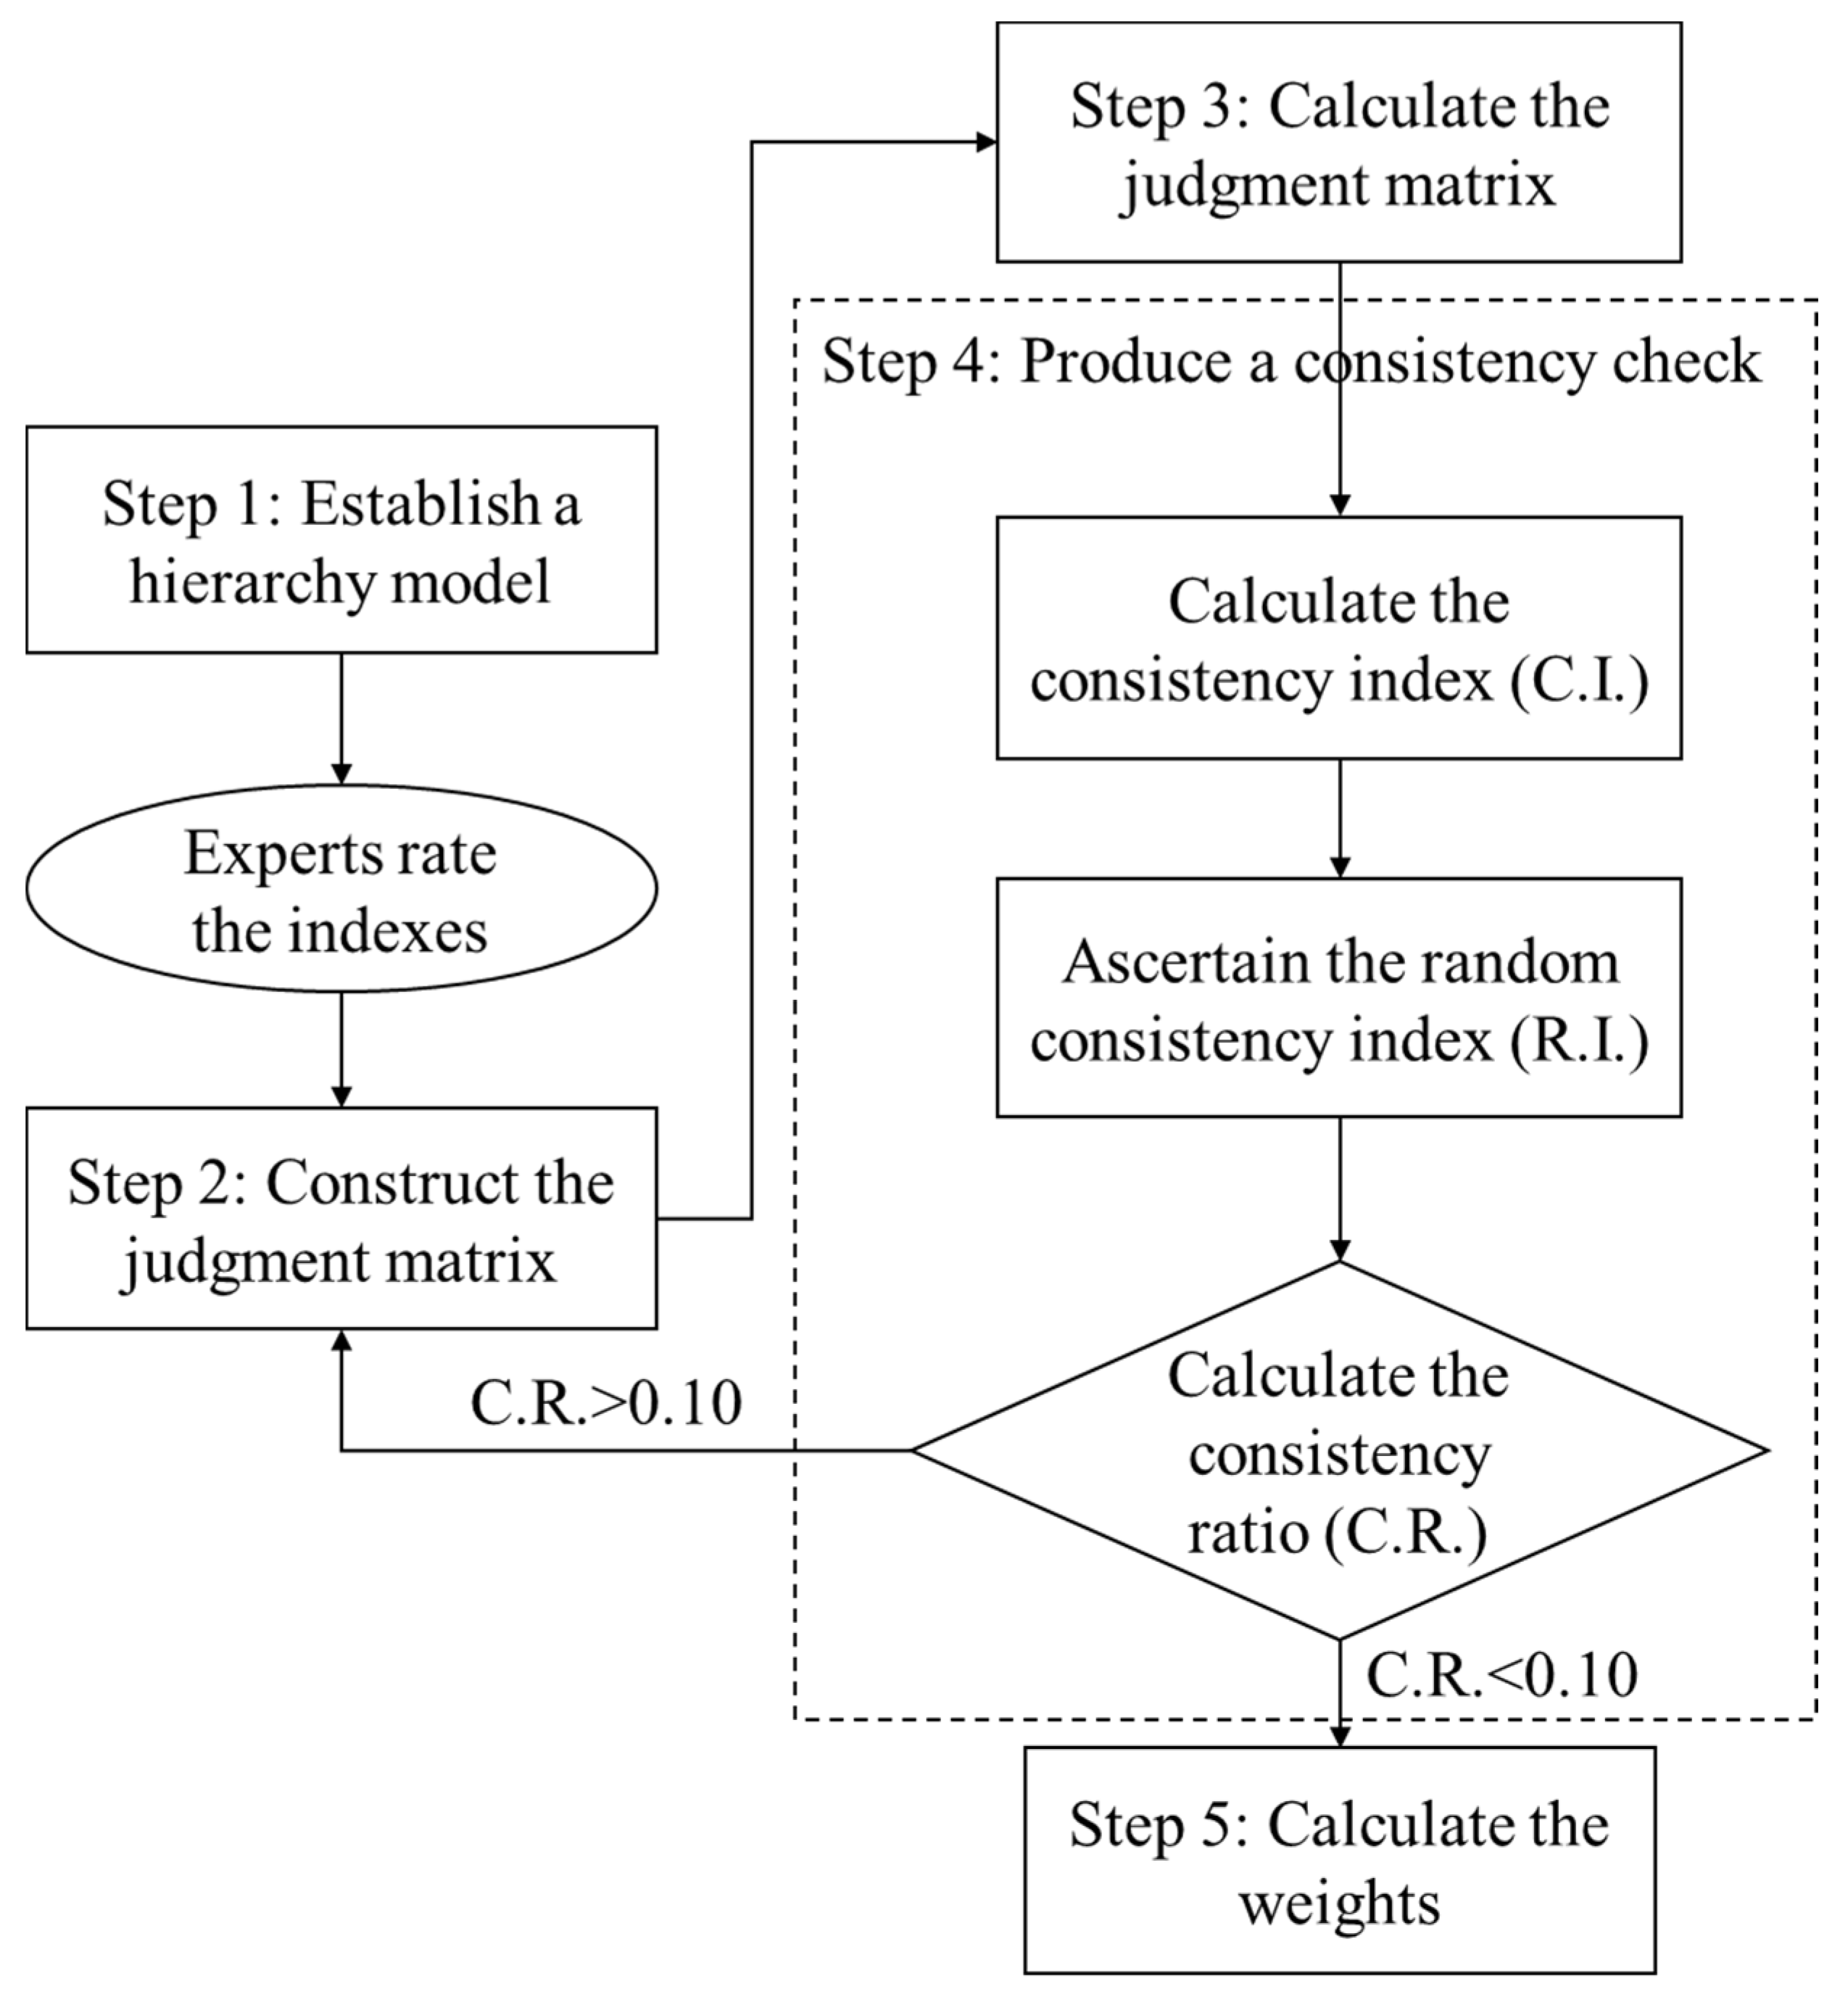
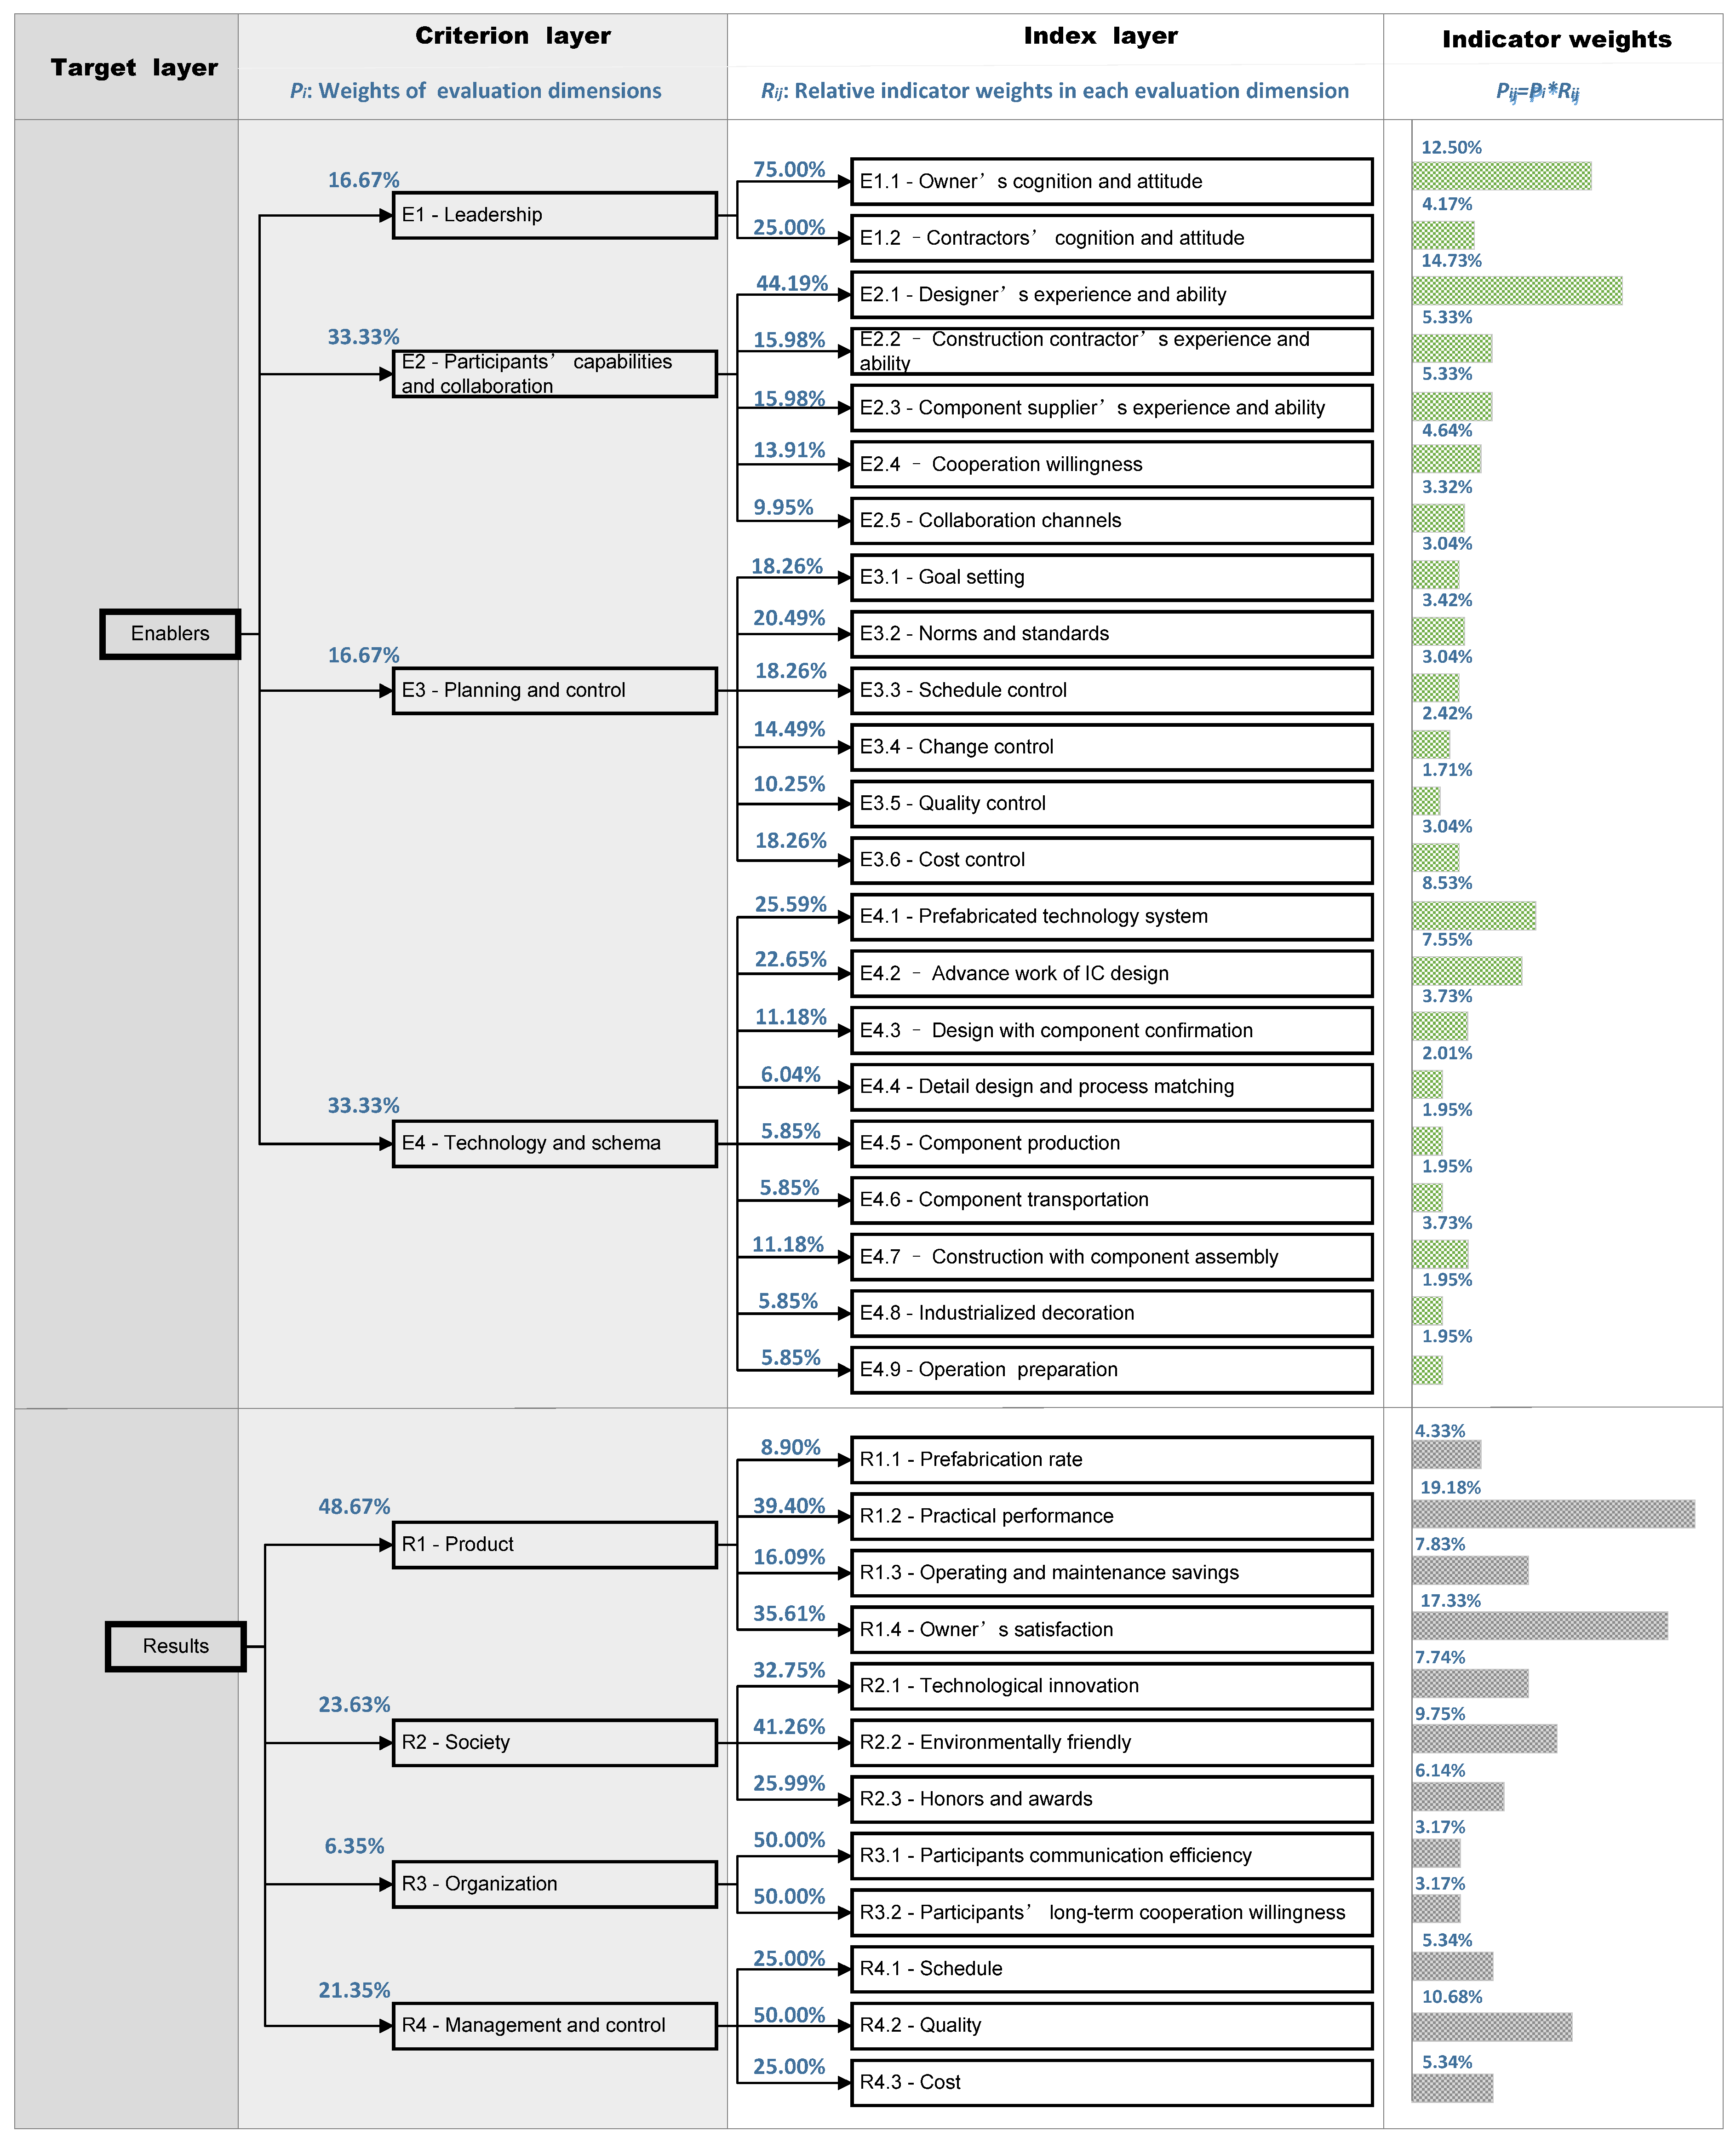
4.2. Indicator Weight Determination
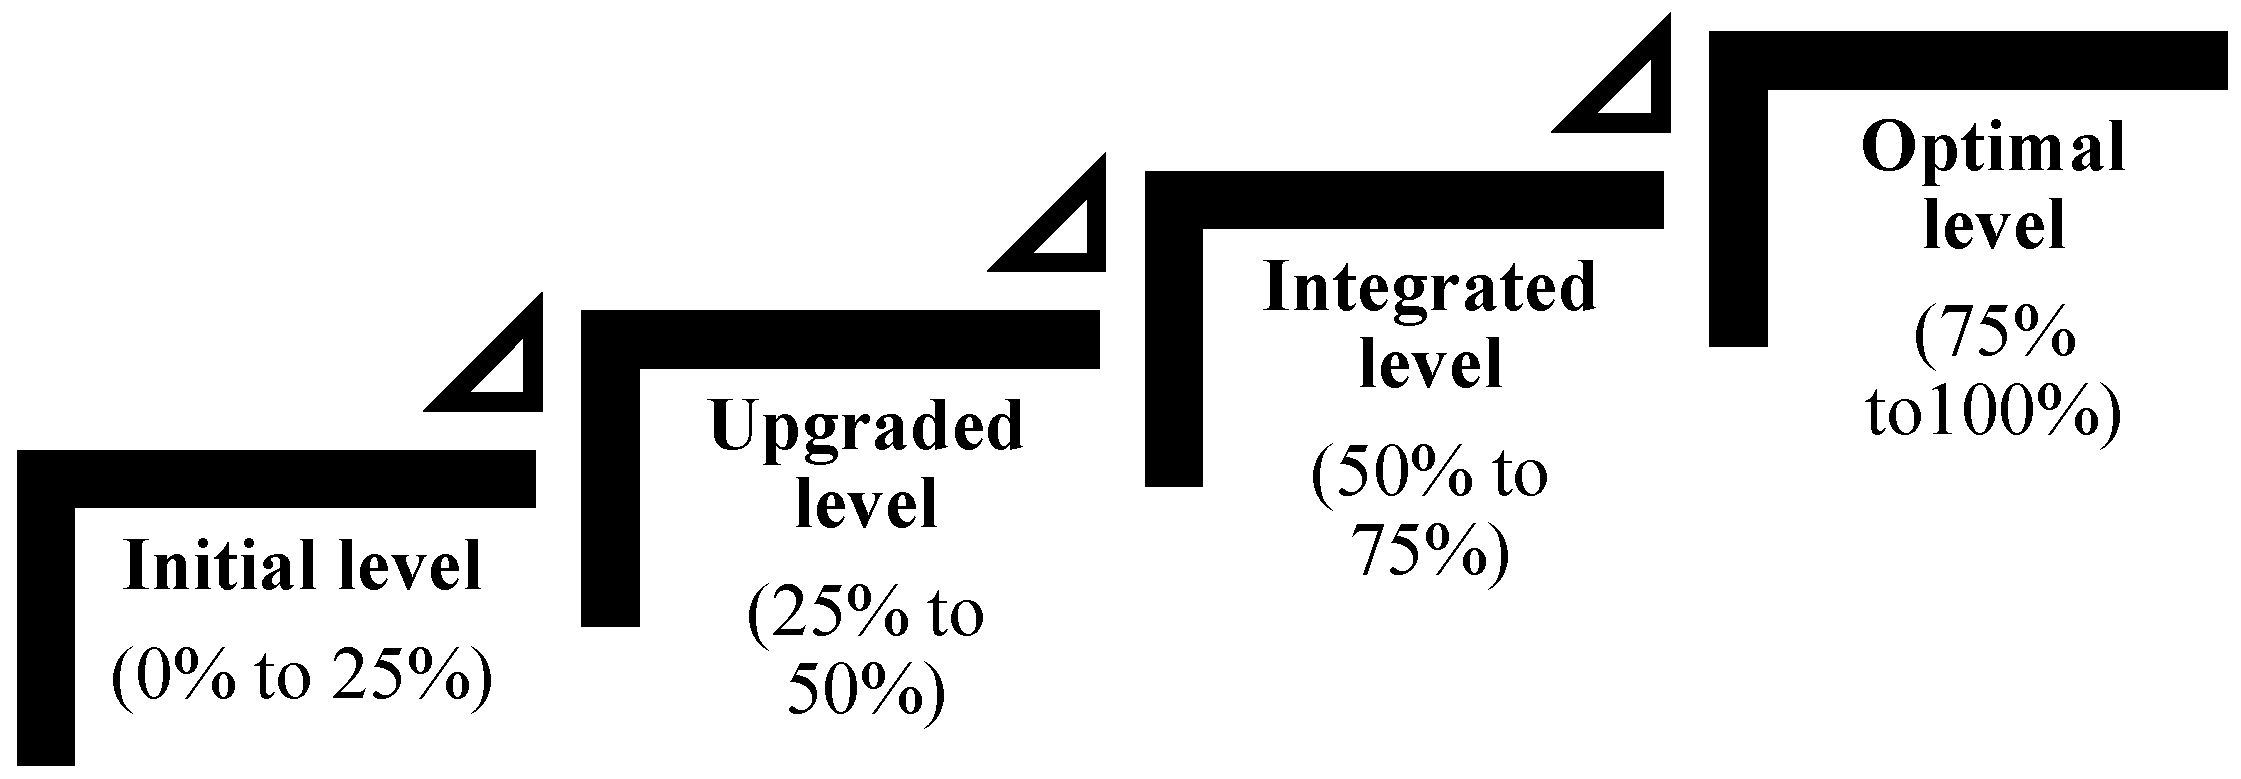
4.3. Maturity Level Design
5. ICMM Validation
5.1. Background of the Multi-Case Study
5.2. Data Reliability Test
5.3. Evaluation Results
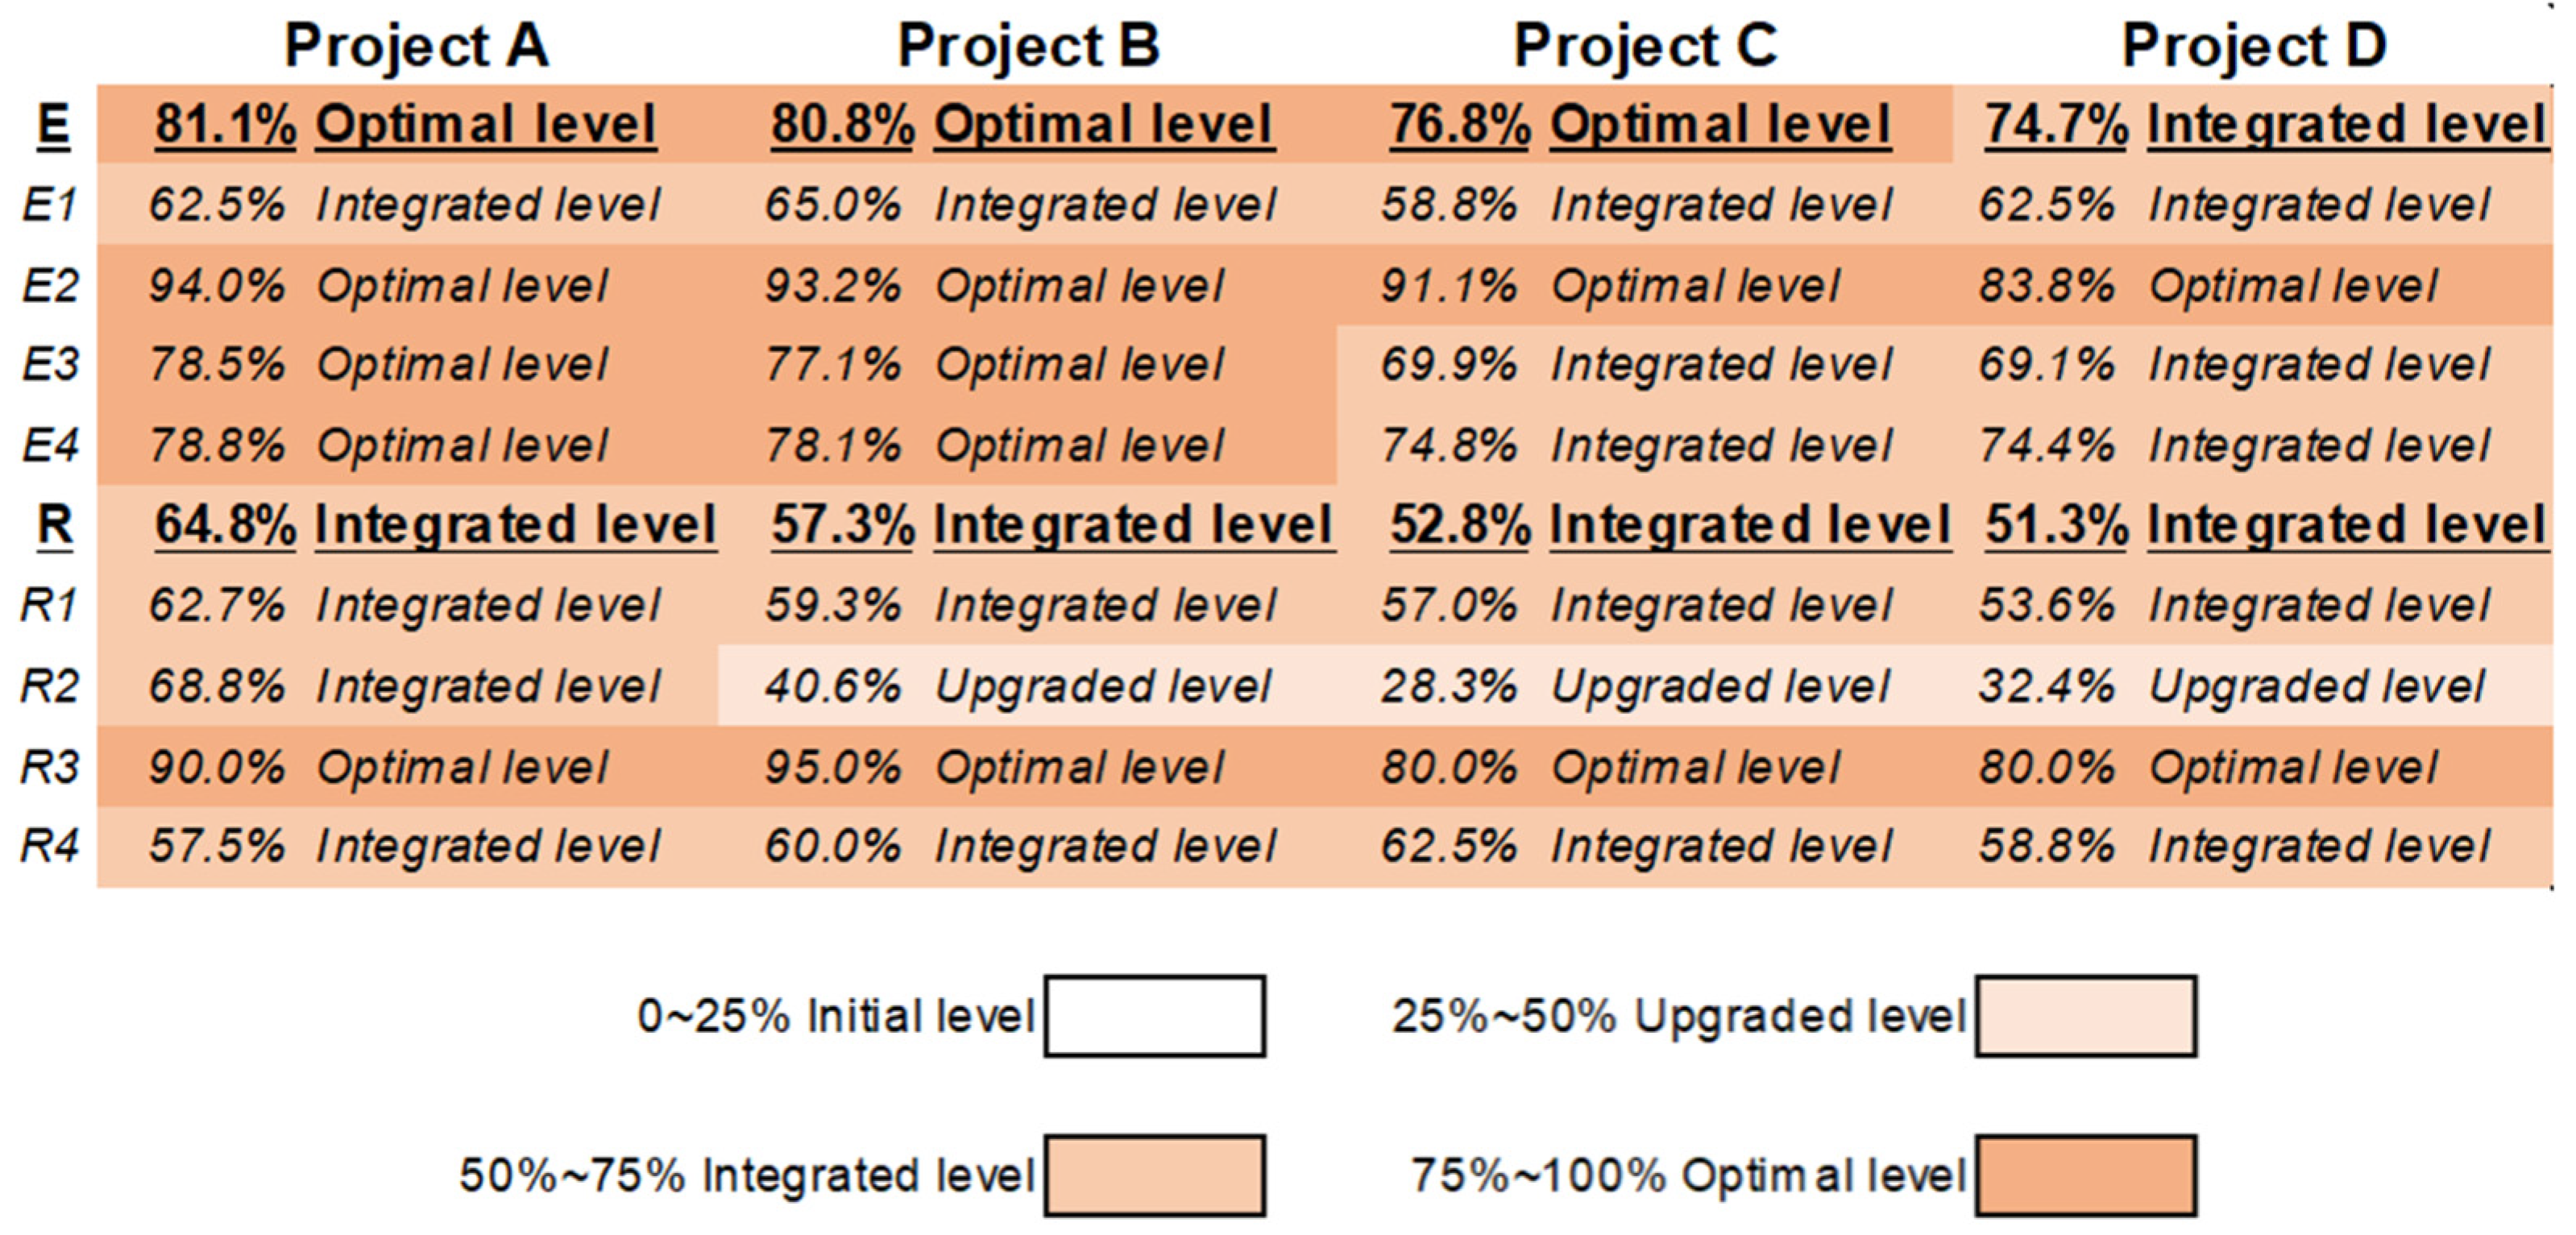
5.3.1. Overview of the Evaluation Results
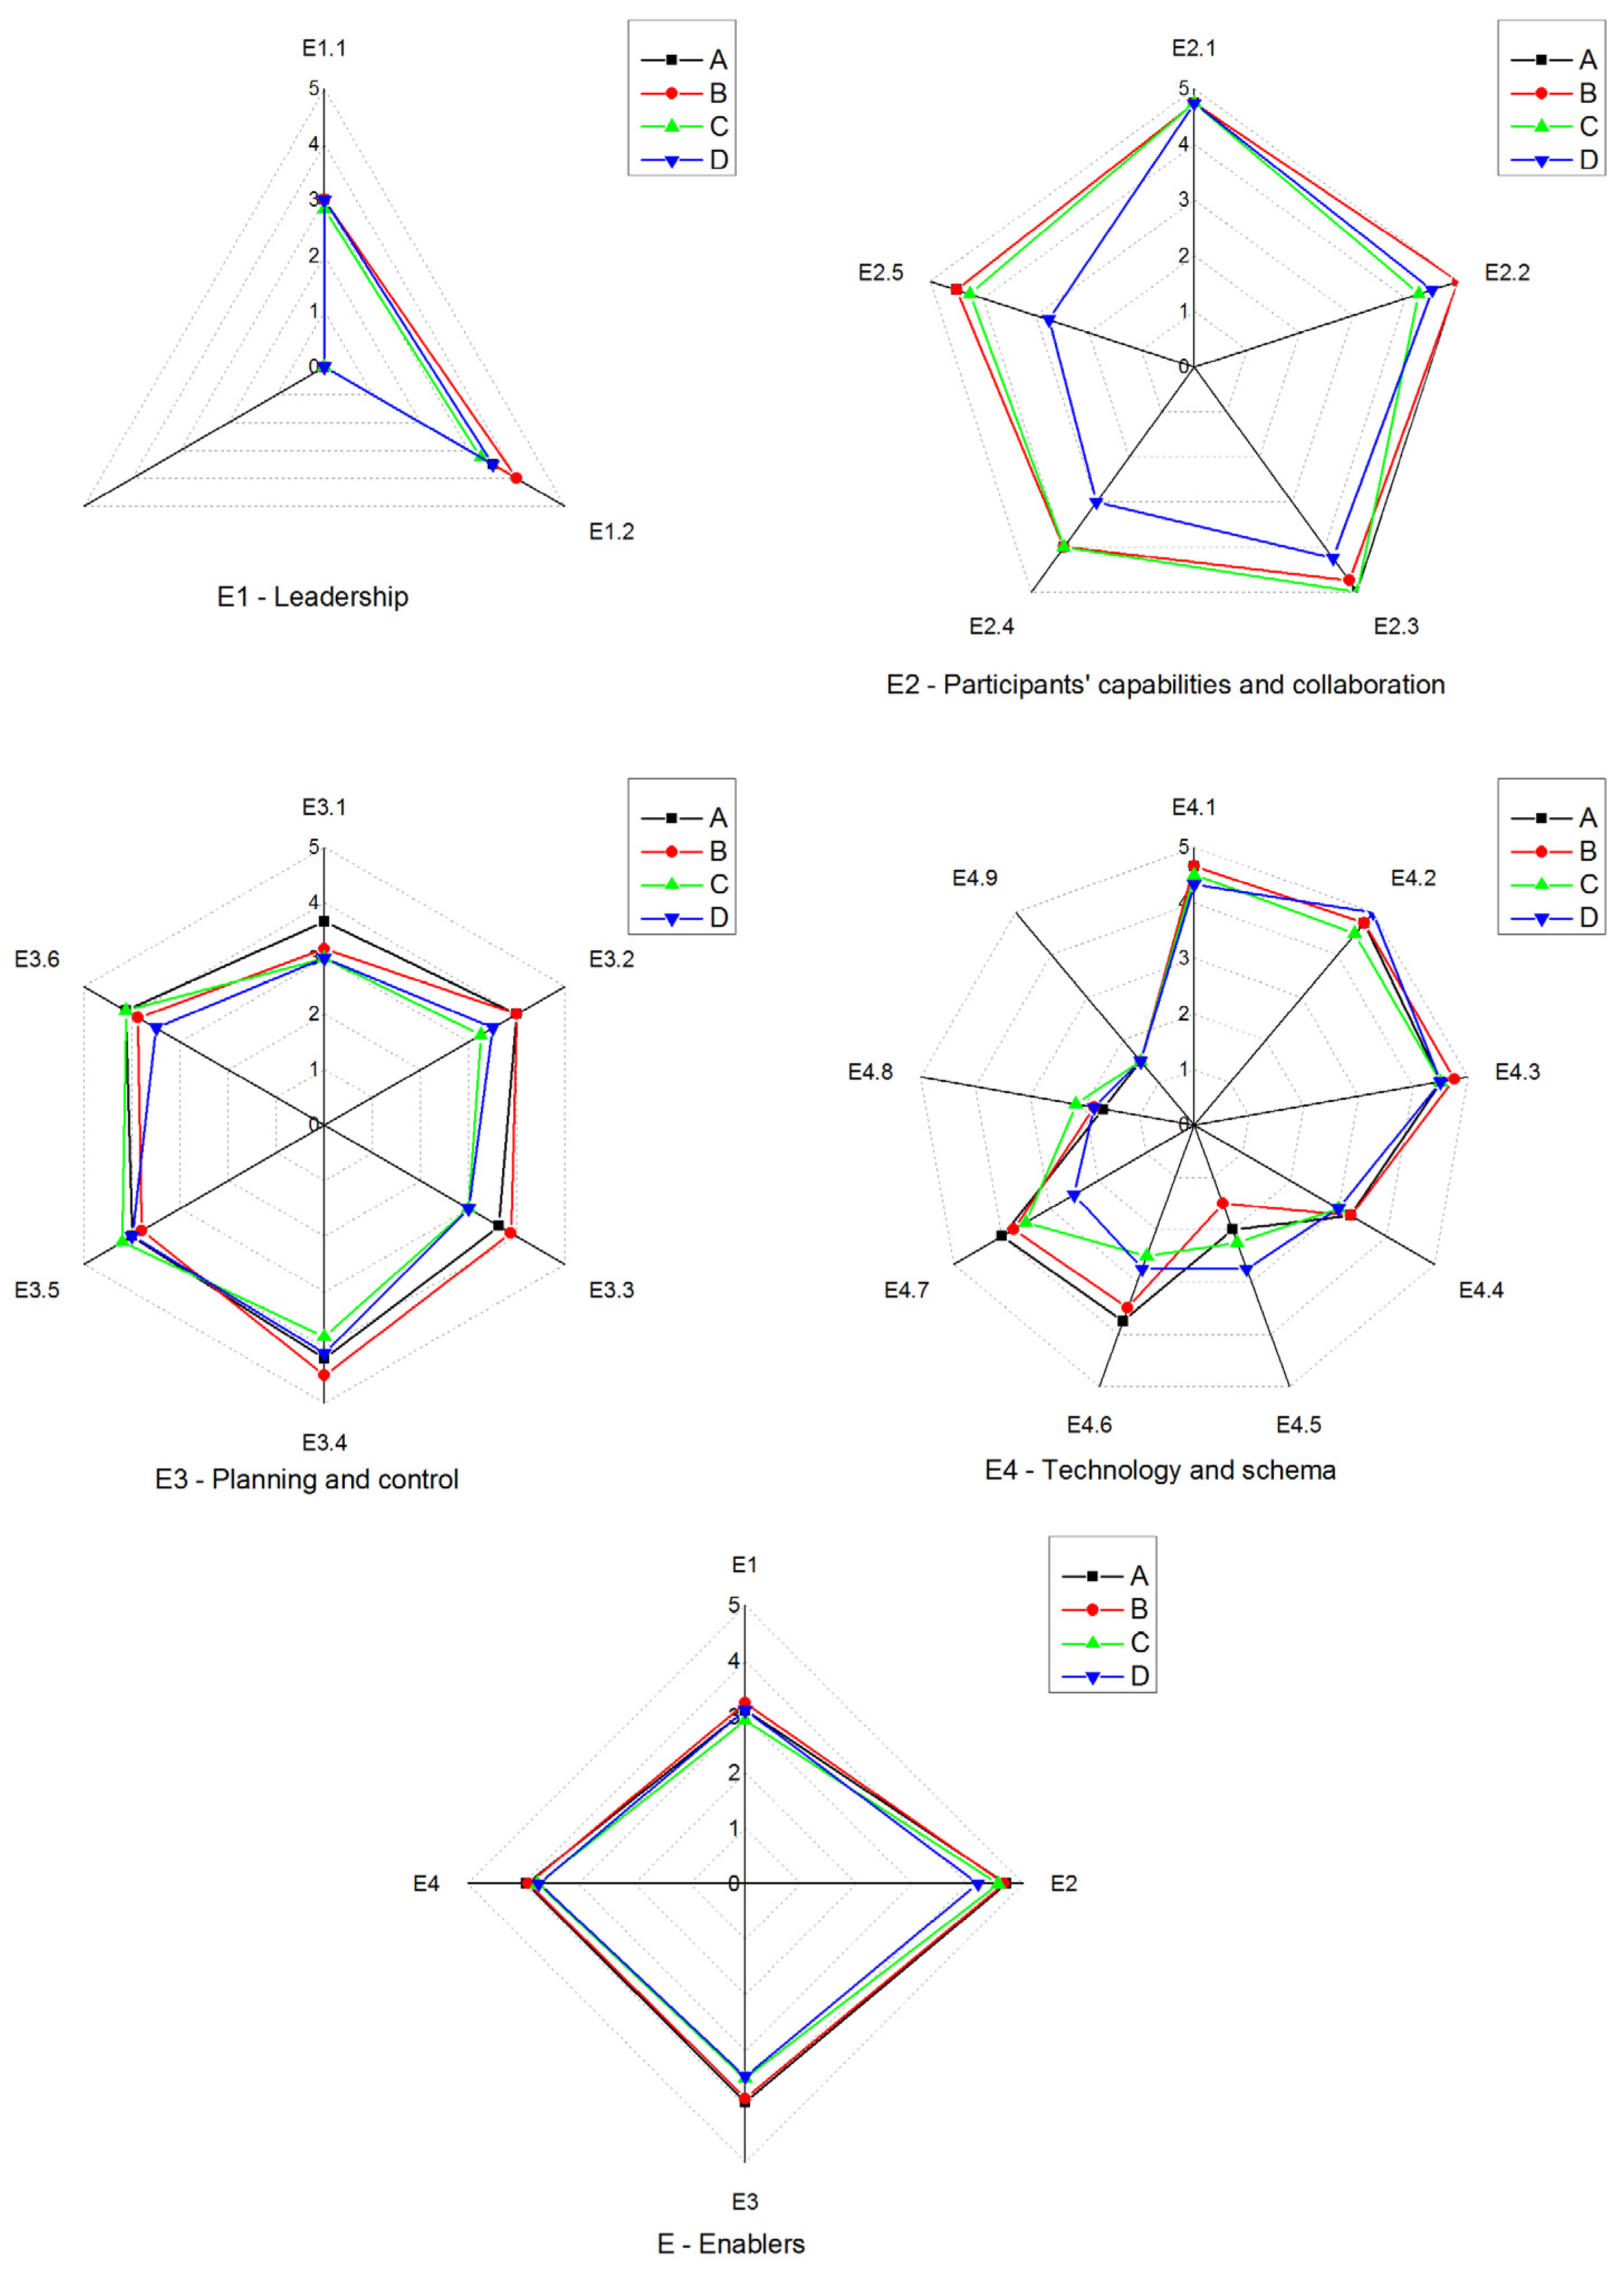
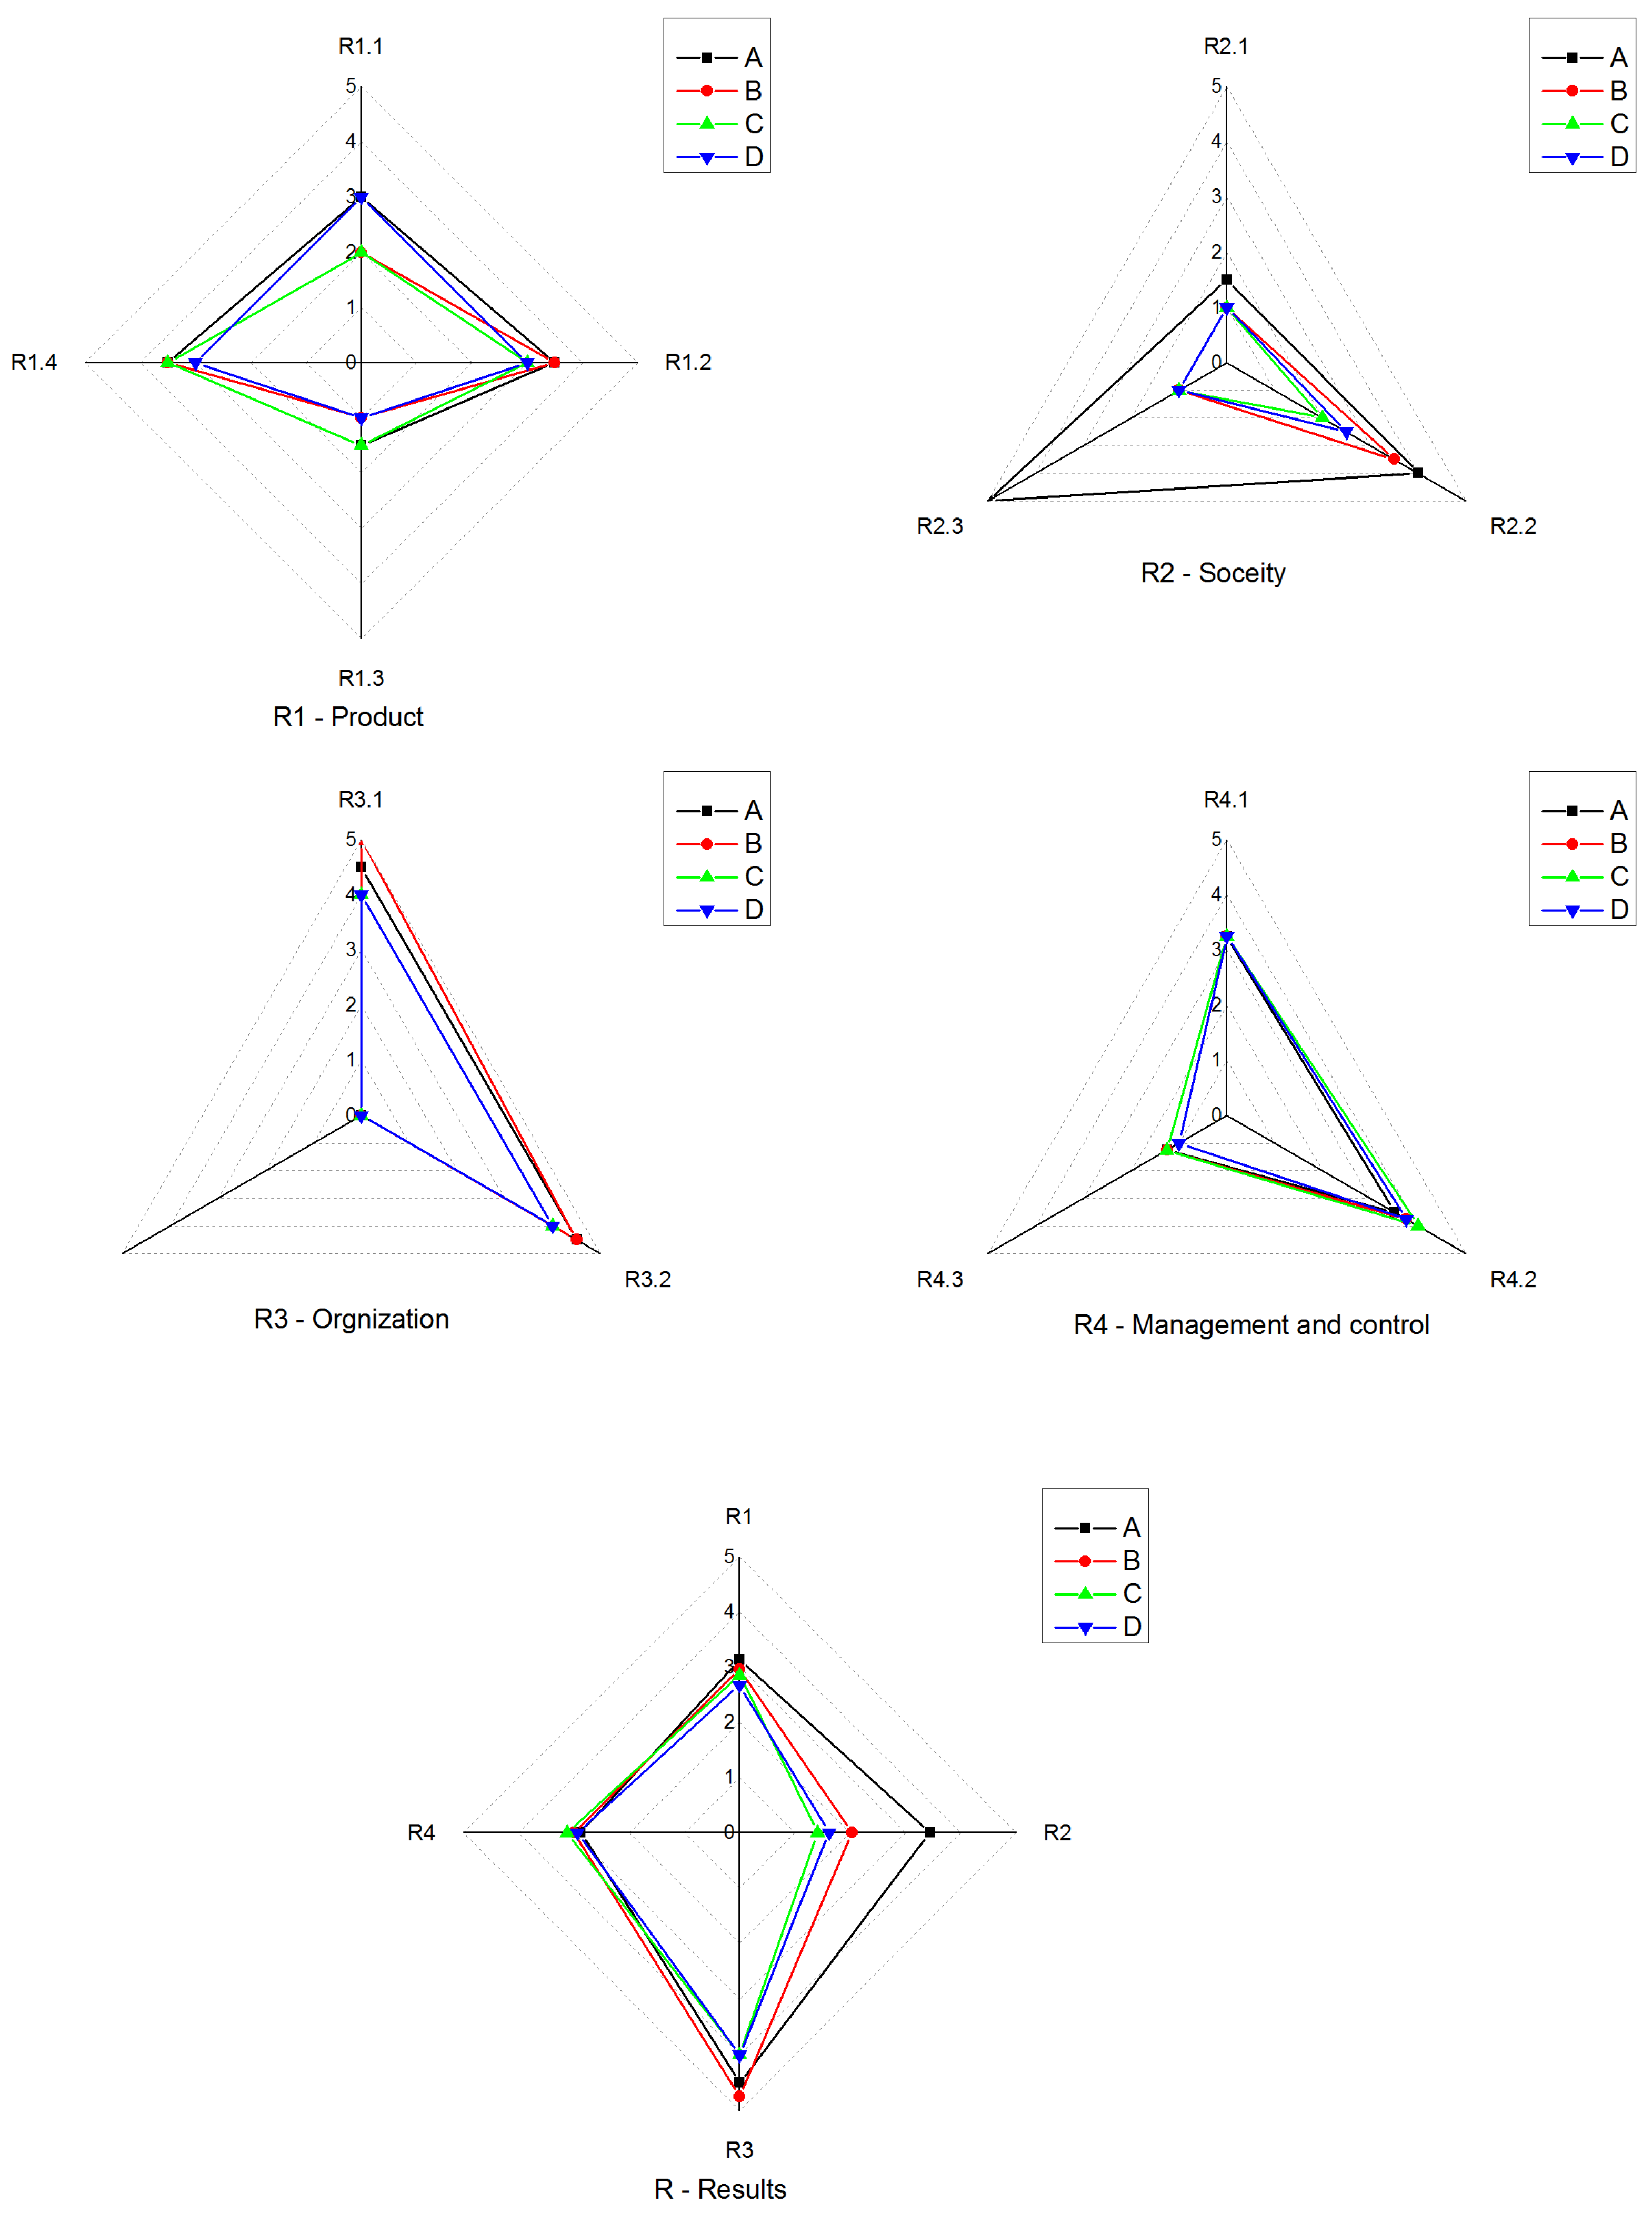
5.3.2. Weak Areas of the Current IC Implementations
6. Discussion
6.1. Overall Maturity Analysis for the General Status of IC Projects in China
6.2. Model Evaluation
7. Conclusions
- The government’s leadership has a strong impact on the attitude of owners and participants, but the cognition of IC and leadership of the participants in IC projects need to be improved (E1).
- Cooperation between participants within a project organization is more adequate than the cross-organization cooperation under the current delivery method and social environment (E2, R3).
- The current management and control process need to be optimized, and the IC mode has no advantage over the traditional mode in cost (E3, R4).
- Compared with the traditional construction mode, the built products have little difference in practical function and the satisfaction of owners, but they have obvious advantages in the environment friendly aspect, which are beneficial to the sustainability of the construction industry (R1, R2).
- The current IC mode still needs to be improved, including many technical problems in the links of design, component supply, and site assembly, which are still developing generally (E4).
Supplementary Materials
Author Contributions
Funding
Acknowledgments
Conflicts of Interest
References
- Jaillon, L.; Poon, C.S. The evolution of prefabricated residential building systems in Hong Kong: A review of the public and the private sector. Autom. Constr. 2009, 18, 239–248. [Google Scholar] [CrossRef]
- Jaillon, L.; Poon, C.S. Life cycle design and prefabrication in buildings: A review and case studies in Hong Kong. Autom. Constr. 2014, 39, 195–202. [Google Scholar] [CrossRef]
- Johnsson, H.; Meiling, J.H. Defects in offsite construction: Timber module prefabrication. Constr. Manag. Econ. 2009, 27, 667–681. [Google Scholar] [CrossRef]
- MHC Construction Prefabrication and Modularization: Increasing Productivity in the Construction Industry; McGraw Hill Construction: New York, NY, USA, 2011.
- Taylor, T.R.B.; Ford, D.N.; Reinschmidt, K.F. Impact of public policy and societal risk perception on USA civilian nuclear power plant construction. J. Constr. Eng. Manag. 2012, 138, 972–981. [Google Scholar] [CrossRef] [Green Version]
- Shen, L.Y.; Li Hao, J.; Tam, V.W.Y.; Yao, H. A checklist for assessing sustainability performance of construction projects. J. Civ. Eng. Manag. 2007, 13, 273–281. [Google Scholar] [CrossRef]
- O’Connor, J.T.; O’Brien, W.J.; Choi, J.O. Critical success factors and enablers for optimum and maximum industrial modularization. J. Constr. Eng. Manag. 2014, 140, 04014012. [Google Scholar] [CrossRef]
- He, D.; Li, Z.; Wu, C.; Ning, X. An e-commerce platform for industrialized construction procurement based on BIM and linked data. Sustainability 2018, 10, 2613. [Google Scholar] [CrossRef] [Green Version]
- Teng, Y.; Mao, C.; Liu, G.; Wang, X. Analysis of stakeholder relationships in the industry chain of industrialized building in China. J. Clean. Prod. 2017, 152, 387–398. [Google Scholar] [CrossRef]
- Xue, X.; Zhang, X.; Wang, L.; Skitmore, M.; Wang, Q. Analyzing collaborative relationships among industrialized construction technology innovation organizations: A combined SNA and SEM approach. J. Clean. Prod. 2018, 173, 265–277. [Google Scholar] [CrossRef] [Green Version]
- Wang, T.; Gao, S.; Li, X.; Ning, X. A meta-network-based risk evaluation and control method for industrialized building construction projects. J. Clean. Prod. 2018, 205, 552–564. [Google Scholar] [CrossRef]
- Zhang, J.; Long, Y.; Lv, S.; Xiang, Y. BIM-enabled modular and industrialized construction in China. Procedia Eng. 2016, 145, 1456–1461. [Google Scholar] [CrossRef] [Green Version]
- Liu, K.; Su, Y.; Zhang, S. Evaluating supplier management maturity in prefabricated construction project-survey analysis in China. Sustainability 2018, 10, 30–46. [Google Scholar] [CrossRef] [Green Version]
- Cooke-Davies, T. Project management maturity models. In The Wiley Guide to Managing Projects; John Wiley & Sons: Hoboken, NJ, USA, 2007. [Google Scholar]
- Paulk, M.C.; Curtis, B.; Chrissis, M.B.; Weber, C.V. Capability Maturity Model for Software, Version 1.1; Tech Report CMUSEI-93TR-24; Software Engineering Institute: Pittsburgh, PA, USA, 1993. [Google Scholar]
- Belvedere, V.; Grando, A.; Legenvre, H. Testing the EFQM model as a framework to measure a company’s procurement performance. Total Qual. Manag. Bus. Excell. 2018, 29, 633–651. [Google Scholar] [CrossRef]
- European Foundation for Quality Management. An Overview of the EFQM Excellence Model. EFQM Off. Page 2013, 1234–1255. [Google Scholar]
- Atkinson, R. Project management: Cost, time and quality, two best guesses and a phenomenon, its time to accept other success criteria. Int. J. Proj. Manag. 1999, 17, 337–342. [Google Scholar] [CrossRef]
- Chan, A.P.C.; Chan, A.P.L. Key performance indicators for measuring construction success. Benchmark. Int. J. 2004, 11, 203–221. [Google Scholar] [CrossRef]
- Kaplan, R.S.; Norton, D.P. Linking the balanced scorecard to strategy. Calif. Manag. Rev. 1996, 39, 53–79. [Google Scholar] [CrossRef]
- Ke, Y.; Liu, X.; Wang, S. Equitable financial evaluation method for public-private partnership projects. Tsinghua Sci. Technol. 2008, 13, 702–707. [Google Scholar] [CrossRef]
- Westerveld, E. The project excellence model®: Linking success criteria and critical success factors. Int. J. Proj. Manag. 2003, 21, 411–418. [Google Scholar] [CrossRef]
- Hong, J.; Shen, G.Q.; Li, Z.; Zhang, B.; Zhang, W. Barriers to promoting prefabricated construction in China: A cost–benefit analysis. J. Clean. Prod. 2018, 172, 649–660. [Google Scholar] [CrossRef]
- Li, L.; Li, Z.; Wu, G.; Li, X. Critical success factors for project planning and control in prefabrication housing production: A China study. Sustainability 2018, 10, 836. [Google Scholar] [CrossRef] [Green Version]
- Jerker, L.; Lars, S.; Anders, E. Industrialised house-building—Development and conceptual orientation of the field. Constr. Innov. 2015, 15, 378–399. [Google Scholar]
- Paulk, M. Capability maturity model for software. In Encyclopedia of Software Engineering; Wiley: New York, NY, USA, 2002. [Google Scholar]
- Finnemore, M.; Sarshar, M.; Haigh, R. Case Studies in Construction Process Improvement; ARCOM Construction Process Workshop: Loughborough, UK, 2002; Volume 16. [Google Scholar]
- Yang, Q.; Pasian, B.L.; Li, D.Y.; Li, Y.K. Review on project management maturity in construction management field. J. Eng. Manag 2013, 27, 65–70. [Google Scholar]
- Willis, C.J.; Rankin, J.H. The construction industry macro maturity model (CIM3): Theoretical underpinnings. Int. J. Product. Perform. Manag. 2012, 61, 382–402. [Google Scholar] [CrossRef]
- Guangshe, J.; Li, C.; Jianguo, C.; Shuisen, Z.; Jin, W. Application of organizational project management maturity model (OPM3) to construction in China: An empirical study. In Proceedings of the International Conference on Information Management, Innovation Management and Industrial Engineering, ICIII, Taipei, China, 19–21 December 2008. [Google Scholar]
- Sarshar, M.; Haigh, R.; Finnemore, M.; Aouad, G.; Barrett, P.; Baldry, D.; Sexton, M. SPICE: A business process diagnostics tool for construction projects. Eng. Constr. Archit. Manag. 2000, 7, 241–250. [Google Scholar] [CrossRef]
- Liang, C.; Lu, W.; Rowlinson, S.; Zhang, X. Development of a multifunctional BIM maturity model. J. Constr. Eng. Manag. 2016, 142, 6016003. [Google Scholar] [CrossRef]
- Arriagada, D.R.E.; Alarcón, C.L.F. Knowledge management and maturation model in construction companies. J. Constr. Eng. Manag. 2013, 140, B4013006. [Google Scholar]
- Hartono, B.; Sulistyo, S.R.; Chai, K.H.; Indarti, N. Knowledge management maturity and performance in a project environment: Moderating roles of firm size and project complexity. J. Manag. Eng. 2019, 35, 4019023. [Google Scholar] [CrossRef]
- Heravi, G.; Gholami, A. The influence of project risk management maturity and organizational learning on the success of power plant construction projects. Proj. Manag. J. 2018, 49, 22–37. [Google Scholar] [CrossRef]
- Jia, G.; Ni, X.; Chen, Z.; Hong, B.; Chen, Y.; Yang, F.; Lin, C. Measuring the maturity of risk management in large-scale construction projects. Autom. Constr. 2013, 34, 56–66. [Google Scholar] [CrossRef]
- Zhao, X.; Hwang, B.-G.; Low, S.P. Investigating enterprise risk management maturity in construction firms. J. Constr. Eng. Manag. 2014, 140, 5014006. [Google Scholar] [CrossRef]
- Zhao, X.; Hwang, B.-G.; Low, S.P. Developing fuzzy enterprise risk management maturity model for construction firms. J. Constr. Eng. Manag. 2013, 139, 1179–1189. [Google Scholar] [CrossRef]
- Meng, X.; Sun, M.; Jones, M. Maturity model for supply chain relationships in construction. J. Manag. Eng. 2011, 27, 97–105. [Google Scholar] [CrossRef]
- Karakhan, A.A.; Rajendran, S.; Gambatese, J.; Nnaji, C. Measuring and evaluating safety maturity of construction contractors: Multicriteria decision-making approach. J. Constr. Eng. Manag. 2018, 144, 4018054. [Google Scholar] [CrossRef]
- Chen, J.; Yu, G.H.; Cui, S.Y.; Feng, Y.R. The maturity model research of construction project management informationization. Appl. Mech. Mater. 2013, 37, 694–704. [Google Scholar] [CrossRef]
- Kang, Y.; O’Brien, W.J.; O’Connor, J.T. Information-integration maturity model for the capital projects industry. J. Manag. Eng. 2013, 31, 4014061. [Google Scholar] [CrossRef]
- Kim, M.-H.; Lee, E.-B.; Choi, H.-S. A forecast and mitigation model of construction performance by assessing detailed engineering maturity at key milestones for offshore epc mega-projects. Sustainability 2019, 11, 1256. [Google Scholar] [CrossRef] [Green Version]
- Jia, G.; Chen, Y.; Xue, X.; Chen, J.; Cao, J.; Tang, K. Program management organization maturity integrated model for mega construction programs in China. Int. J. Proj. Manag. 2011, 29, 834–845. [Google Scholar] [CrossRef]
- Cooke-Davies, T.J.; Arzymanow, A. The maturity of project management in different industries: An investigation into variations between project management models. Int. J. Proj. Manag. 2003, 21, 471–478. [Google Scholar] [CrossRef]
- Zhang, J.; Li, H.; Wang, S. Analysis and potential application of the maturity of growth management in the developing construction industry of a province of china: A case study. Sustainability 2017, 9, 143. [Google Scholar] [CrossRef] [Green Version]
- Vukomanovic, M.; Radujkovic, M.; Nahod, M.M. EFQM excellence model as the TQM model of the construction industry of southeastern Europe. J. Civ. Eng. Manag. 2014, 20, 70–81. [Google Scholar] [CrossRef] [Green Version]
- Mohammad Zadeh, S. Using analysis of variance for measuring excellence in a construction company: Based on the EFQM model. Asian J. Appl. Sci. 2011, 4, 752–761. [Google Scholar]
- Chileshe, N. Validation of the EFQM excellence model within construction organisations: A structural equation modelling (SEM) approach. In Proceedings of the Queensland University of Technology Research Week International Conference, QUT Research Week 2005—Conference Proceedings, Brisbane, Australia, 4–8 July 2005; pp. 427–441. [Google Scholar]
- Oladinrin, O.T.; Ho, C.M.F. Enabling ethical code embeddedness in construction organizations: A review of process assessment approach. Sci. Eng. Ethics 2016, 22, 1193–1215. [Google Scholar] [CrossRef] [PubMed]
- Shanmugapriya, S.; Subramanian, K. Structural equation model to investigate the factors influencing quality performance in Indian construction projects. Sadhana Acad. Proc. Eng. Sci. 2015, 40, 1975–1987. [Google Scholar] [CrossRef]
- Wu, Z.; Yu, A.T.W.; Shen, L. Investigating the determinants of contractor’s construction and demolition waste management behavior in Mainland China. Waste Manag. 2017, 60, 290–300. [Google Scholar] [CrossRef]
- Nesensohn, C.; Bryde, D.; Ochieng, E.; Fearon, D.; Hackett, V. Assessing lean construction maturity. In Proceedings of the 22nd Annual Conference of the International Group for Lean Construction: Understanding and Improving Project Based Production, IGLC, Oslo, Norway, 25–27 June 2014; pp. 1157–1168. [Google Scholar]
- Oakland, J.; Marosszeky, M. Lean quality in construction project delivery—A new model and principles. Pm World J. 2018, 6, 1–12. [Google Scholar]
- Saaty, T.; Vargas, L. Models, Methods, Concepts & Applications of the Analytic Hierarchy Process; Springer: Berlin/Heidelberg, Germany, 2012. [Google Scholar]
- Müller, R.; Pemsel, S.; Shao, J. Organizational enablers for project governance and governmentality in project-based organizations. Int. J. Proj. Manag. 2015. [Google Scholar] [CrossRef]
- Larsson, J.; Eriksson, P.E.; Olofsson, T.; Simonsson, P. Industrialized construction in the Swedish infrastructure sector: Core elements and barriers. Constr. Manag. Econ. 2014, 32, 83–96. [Google Scholar] [CrossRef]
- Rahman, M.M. Barriers of implementing modern methods of construction. J. Manag. Eng. 2014, 30, 69–77. [Google Scholar] [CrossRef] [Green Version]
- Zhai, X.; Reed, R.; Mills, A. Factors impeding the offsite production of housing construction in China: An investigation of current practice. Constr. Manag. Econ. 2014, 32, 40–52. [Google Scholar] [CrossRef]
- Polat, G. Precast concrete systems in developing vs. industrialized countries. J. Civ. Eng. Manag. 2010, 16, 85–94. [Google Scholar] [CrossRef] [Green Version]
- Standard for Assessment of Prefabricated Building (SAPB)_GB/T51129–2017. Available online: http://www.jianbiaoku.com/webarbs/book/76028/3235109.shtml (accessed on 26 March 2020).
- Pan, W.; Dainty, A.R.J.; Gibb, A.G.F. Establishing and weighting decision criteria for building system selection in housing construction. J. Constr. Eng. Manag. 2012, 22, 1193–1215. [Google Scholar] [CrossRef] [Green Version]
- Dahlgaard-Park, S.M. EFQM excellence model. In The SAGE Encyclopedia of Quality and the Service Economy; SAGE Publications: Thousand Oaks, CA, USA, 2015. [Google Scholar]
- Evaluation Standards for Industrialized Housing (ESIH)_DG/TJ08–2198–2016. Available online: http://www.jianbiaoku.com/webarbs/book/86253/2538103.shtml (accessed on 26 March 2020).
- Bai, L.; Wang, H.; Huang, N.; Du, Q.; Huang, Y. An environmental management maturity model of construction programs using the AHP-entropy approach. Int. J. Environ. Res. Public Health 2018, 15, 1317. [Google Scholar] [CrossRef] [Green Version]
- Chen, M.K.; Wang, S.C. The critical factors of success for information service industry in developing international market: Using analytic hierarchy process (AHP) approach. Expert Syst. Appl. 2010, 357–360, 2222–2227. [Google Scholar] [CrossRef]
- McCuen, T.L.; Suermann, P.C.; Krogulecki, M.J. Evaluating award-winning BIM projects using the national building information model standard capability maturity model. J. Manag. Eng. 2012, 28, 224–230. [Google Scholar] [CrossRef]
- Huimin, L.; Zhuofu, W. Grey relational grade decision model for selection of project delivery system. In Proceedings of the 2009 IEEE International Conference on Grey Systems and Intelligent Services (GSIS 2009), Nanjing, China, 10–12 November 2009; IEEE: Piscataway, NJ, USA; pp. 1033–1037. [Google Scholar]
- Cleff, T. Exploratory Data Analysis in Business and Economics: An Introduction Using SPSS, STATA, and Excel; Springer: Cham, Switzerland, 2014. [Google Scholar]


| Assessment Theory | Evaluation Dimensions | Attributes | Ref. | |
|---|---|---|---|---|
| Traditional Theory | Financial Evaluation | Invest Return Rate, Cost-Effective Ratio, etc. | Static, Single Dimensional, Stage | [21] |
| Iron Triangle | Cost, Quality, Schedule | Static, Multi-Dimensional, Stage | [18] | |
| Mordent Theory | Balanced Scorecard Card | Finance, Customer, Internal Processes, Innovative Learning | Dynamic, Multi-Dimensional, Stage | [20] |
| Key Performance Indicators (KPIs) | Finance, Operations, Organization | Dynamic, Multi-Dimensional | [19] | |
| Criteria for Performance Excellence | Leadership, Strategy, Customer and Market Measurement, Analytics and Knowledge Management, Human Resources, Process Management, Business Results | Dynamic, Multi-Dimensional | [22] | |
| Maturity Model | Capability Maturity Level | Dynamic, Multi-Dimensional | [17] | |
| Maturity Model | Number of Levels | Application Area | CMM-Based | Analysis Method | |
|---|---|---|---|---|---|
| Quantitative | Qualitative | ||||
| Capability Maturity Model Integrated (CMMI) [28] | 5 | Software industry | √ | √ | √ |
| Construction Industry Macro Maturity Model (CIM3) [29] | 4 | Construction industry | √ | √ | √ |
| Organizational Project Management Maturity Model (OPM3) [30] | 3 | Project management | √ | √ | |
| Berkley Project Management Process Maturity Model (Berkley PM2) [28] | 4 | Project management | √ | √ | |
| Portfolio, Programme and Project Management Maturity Model (OPM3) [30] | 5 | Project management | √ | √ | √ |
| Standardized Process Improvement for Construction Enterprises (SPICE) [31] | 5 | Construction industry | √ | √ | √ |
| Change Management Maturity Model (CM3) [28] | 5 | Construction industry | √ | √ | √ |
| Maturity Assessment Grid from the Strategic Forum for Construction (MAG) [28] | 5 | Construction industry | √ | ||
| Project Management Maturity Model (PMS-PMMM) [30] | 5 | Project management | √ | √ | √ |
| Kerzner Project Management Maturity Model (K-PMMM) [28] | 5 | Project management | √ | √ | √ |
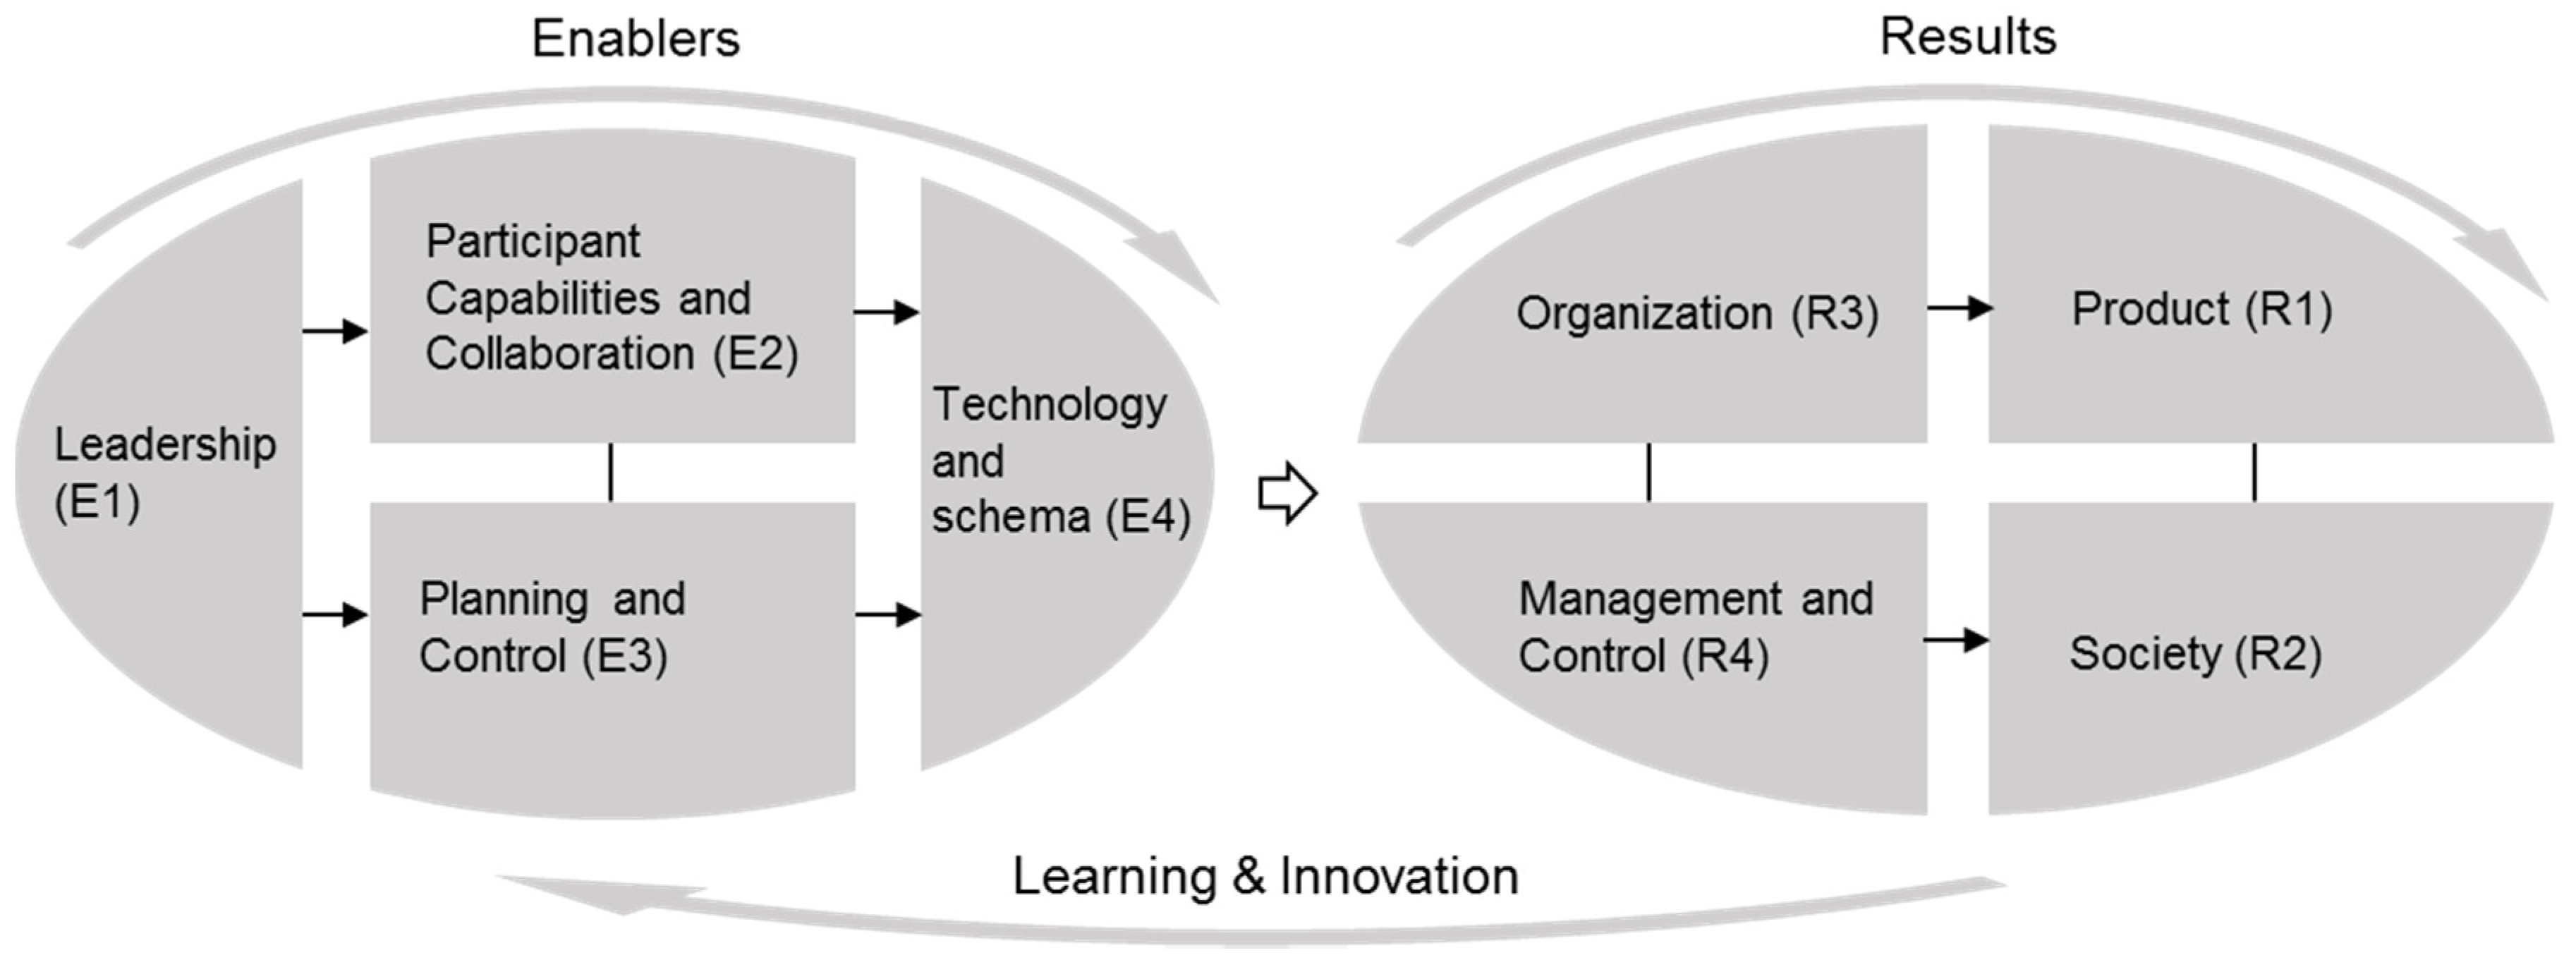
| Code | Dimensions | Organizational Enablers | Justification for Adjustment from the EFQM Excellence Model |
|---|---|---|---|
| E1 | Leadership | Discursive ability (1): Project participants have the basic cognition of the IC mode and are preparing to take practical action to promote performance realization and optimization of IC projects. | All the participants have been integrated into one temporary team, the leaders refer to the project owner and leaders of other participants, who reach the agreements based on a series of contracts. “Leadership” encompasses the cognition and attitudes of the participants to the IC. |
| E2 | Participants’ capabilities and collaboration | Discursive ability (2): The project organization consists of multiple participants, of which capabilities and experience need to meet requirements of project implementation and promote participants to work together efficiently. | Given that project organizational members are not individuals but project participants, the dimension “People” in EFQM is introduced to the ICMM, namely, “Participants’ capabilities and collaboration”. |
| E3 | Planning and control | Process facilitator (1): Project participants should take preparation to promote performance realization and optimization of IC projects. | The dimension of “processes, products, and services” in EFQM is adjusted into “planning and control” to represent the organizational process of IC projects, which involves the project goal setting and process control. |
| E4 | Technology and schema | Process facilitator (2): The project needs to select effective technologies and rational schemas to deal with the industrial obstacles and difficulties of the IC projects in design, production and construction stages. | The organization needs to make decisions for selecting appropriate techniques and schemas to implement the IC mode, and these decisions involving technical management, information, and knowledge management can be comprehensively summarized as the dimension in terms of “technology and schema”. |
| Code | Dimensions | Outcome Factors | Justification for Adjustment from the EFQM Excellence Model |
|---|---|---|---|
| R1 | Product | Project entity: The final building entity for delivery with its associated performance, status. | The owner of an IC project is considered as a customer, and the constructed building entity is the product; given only the construction stages considered in ICMM, “Customer” in EFQM is adjusted to the “product”. |
| R2 | Society | Social performance: Practical benefits to society resulting from project delivery of final products, such as energy conservation and environmental protection, technical innovation, etc. | Given the same meaning of the original evaluation dimension of “Society” in EFQM with that in IC projects, it is unchanged and indicates the practical implications to society. |
| R3 | Organization | Organizational performance: The satisfaction of project participants with communication, cooperation and growth of the organization itself. | The project organization contains both individuals and participants from different companies, after going through a complete project, the organization should have a certain amount of growth. |
| R4 | Management and control | Project process performance: The degree of success of the project to achieve the three objectives (quality, schedule, cost) of construction project management. | Since the ultimate goal of a long-term organization is an achievement on business and the main project objective is to reach the one-off project delivery. The “business” index is adjusted into “management and control”. |
| Dimensions | Code | Indicators | Definitions | Justification |
|---|---|---|---|---|
| Leadership (E1) | E1.1 | Owner’s cognition and attitude | The degree of the project owner to recognize and support the IC mode. | Client skepticism and resistance [59]. Clients suspicious about performance but build a good location for higher prices [58]. |
| E1.2 | Contractors’ cognition and attitude | The degree of project contractors to recognize and support the IC mode. | Lack of confidence in offsite production in the industry [59]. Conservative industry culture [57]. Reluctance of manufacturers to innovate and change to MMCs; Mindset of the industry (cultural problems) [58]. | |
| Participants’ capabilities and collaboration (E2) | E2.1 | Designer’s experience and ability | The experience and ability of the project designer to implement the design of IC projects and deal with the technical problems of the IC mode. | Interview results: The design unit has experience in construction industrialization, and those directly involved in the design have sufficient industrial design experience to ensure the design quality. |
| E2.2 | Construction contractor’s experience and ability | The experience and ability of the project contractor to implement the construction work of IC projects and deal with the on-site process and management problems of the IC mode. | Contractor leadership; Contractor experience [7]. Lack of previous experience and guidance; Higher skill demands for the labor [59]. Lack of experience and skills [58]. Availability of qualified structural engineers specialized in precast concrete systems; Availability of contractors specialized in precast concrete systems; Availability of laborers specialized in precast concrete systems [60]. | |
| E2.3 | Component supplier’s experience and ability | The experience and ability of the component supplier to implement the component production of IC projects and deal with the transportation and site-assembly problems. | Module Fabricator Capability [7]. Manufacturing capacity [59]. Limited capacity of existing manufacturers [58]. | |
| E2.4 | Cooperation willingness | The willingness of participants to collaborate by taking the initiative to share information and communicate with each other. | Alignment on Drivers; Vendor Involvement [7]. Design-bid-build contracts split design and production [57]. Owners’ capability of providing good communication among parties [60]. | |
| E2.5 | Collaboration channels | Effectiveness and diversity of cooperation among participants | Poor integration for the supply chain [59]. Inadequate coordination: procurement, supply chain, site management; Low IT integration in the industry [58]. | |
| Planning and control (E3) | E3.1 | Goal setting | Whether clear and reasonable project goals (schedule, quality, cost, etc.) have been set in advance. | Interview results: In the project process, clear and reasonable prefabricated construction goals are gradually established (application standards, schedule, quality, cost plan). |
| E3.2 | Norms and standards | The current application of IC specifications and standards on the project, and whether project-specific process standards have been developed. | Lack of available codes and standards [59]. STA norms and rules; Governmental rules regarding plans [57]. Fewer codes/standards available; Regulatory authorities: not yet included in planning regulations [58]. | |
| E3.3 | Schedule control | The organization’s control effect on the project progress measured by checking key nodes and taking measures to avoid delays in the construction period. | Early Completion Recognition; Owner Delay Avoidance; Continuity through Project Phases; Transport Delay Avoidance [7]. Longer lead-in time [59]. | |
| E3.4 | Change control | The organization’s control effect on the planning implementation measured by checking the difference between the design schema and construction results. | Timely Design Freeze [7]. The inability to freeze the design early on [59]. Early design freeze, due to the long lead-in time, and extensive planning; Inflexible/not suitable for late design changes [58]. | |
| E3.5 | Quality control | The organization’s control effect on quality monitoring measured by checking the difference between construction results between proven quality criteria in the construction industry. | Less tolerance between factories made components and on-site assembly; Lack of quality assessment tools and accreditation [58]. | |
| E3.6 | Cost control | The organization’s control effect on the project cost by identifying the factors that reduce the cost to insure the total cost within the budget. | Cost Savings Recognition [7]. | |
| Technology and schema (E4) | E4.1 | Prefabricated technology system | The overall technical solution to achieve the purpose of IC includes structural modularization, prefabrication ratio, component design, installation process design, etc. | Owner- Furnished/Long Lead Equipment Specification [7]. Highly restrictive construction tolerances [59]. (Component) lack of large-scale and repetition possibilities [57]. Poor integration and interface performance with traditional method [58]. Variety of precast concrete components; Conformity between different precast concrete systems [60]. |
| E4.2 | Advance work of IC design | The organization’s effect on considering more on-site assembly and construction in the design phase | Interview results: Early design can consider the requirements of component splitting in later design to meet the requirements of industrial building system in production, transportation and construction | |
| E4.3 | Design with component confirmation | The organization’s effect on structural splitting and determination of prefabricated components | Interview results: Structural design can use regular and batch components as much as possible to reduce the appearance of special-shaped components | |
| E4.4 | Detail design and process matching | The organization’s effect on deepening the process design of participants’ cooperation, and deepening the design and construction to meet the requirements of the component production. | Interview results: Relevant parties in detailed design can provide design auxiliary information in time, and detailed design delivery documents meet the production needs of component factories | |
| E4.5 | Component production | The efficiency and quality of producing components in the factories. | Interview results: Component suppliers use a more efficient and environmentally friendly manufacturing process, and component capacity needs to meet project needs | |
| E4.6 | Component transportation | The efficiency and safety of component transportation by considering the distance, component protection, etc. | Module Envelope Limitations; Transport Infrastructure [7]. Transportation [59]. Expensive long-distance transportation for large and heavy loads [58]. Size and load restrictions on transportation [60]. | |
| E4.7 | Construction with component assembly | The efficiency, quality and safety of component assembly and integral construction on site | Heavy Lift/Site Transport Capabilities [7].Specific demands for the site logistics for pre-finished elements protection [59]. Site-specific constraints, e.g., access limitations and space for large loads [58]. | |
| E4.8 | Industrialized decoration | The organization’s effect on considering the modular decorating components to meet users’ demands. | Interview results | |
| E4.9 | Operation preparation | The organization’s effect on preparing for operation and maintenance in the early stage. | Operations and Maintenance (O&M) Provisions [7]. Increase in complexity for maintenance [59]. |
| Dimensions | Code | Sub-Index | Description | Justification |
|---|---|---|---|---|
| Product (E1) | R1.1 | Prefabrication rate | An important indicator for measuring the degree of assembly of a unit’s building structure. | SAPB_GBT51129-2017 [61] |
| R1.2 | Practical performance | The degree to which the completed building meets actual functional needs. | SAPB_GBT51129-2017 [61]; interview results: users’ satisfaction with the project depends on its conformity with the technical standards. | |
| R1.3 | Operating and maintenance savings | The degree of savings achieved by the IC model for the operation and maintenance phase of the completed building. | Pan et al. [62]; interview results: Due to reasonable product design and quality clearance, users save maintenance costs compared to the market average product during long-term use. | |
| R1.4 | Owner’s satisfaction | Owner’s overall satisfaction with the completed project. | EFQM [63] | |
| Society (R2) | R2.1 | Technological innovation | The degree and effect of the project’s efforts in technological innovation during the implementation process. | EFQM [63] |
| R2.2 | Environmentally friendly | The effect of energy-saving, water-saving, material saving, and environmental protection measures in the process of Project Construction. | SAPB_GBT51129-2017 [61] | |
| R2.3 | Honors or awards | The status of the project’s social recognition, such as industrial housing pilot project, demonstration project. | EFQM [63] | |
| Organization (R3) | R3.1 | Participants communication efficiency | Project participants’ effect on information exchange and communication with each other. | EFQM [63] |
| R3.2 | Participants’ long-term cooperation willingness | Project participants’ satisfaction with project cooperation, profit, and willingness to cooperate with other participants again. | EFQM [63]; Interview results: experts suggest that the long-term willingness of the participants to cooperate can better reflect whether the participants are satisfied with the project’s cooperation method and risk and benefit allocation. | |
| Management and control (R4) | R4.1 | Schedule | Used to evaluate the results of schedule control: whether there is a delay compared to the originally planned duration. | ESIH_DG/TJ 08-2198-2016 [64] |
| R4.2 | Quality | Used to evaluate the results of quality control: whether the project quality meets the requirements of the corresponding specifications. | ESIH_DG/TJ 08-2198-2016 [64] | |
| R4.3 | Cost | Used to evaluate the results of cost control: whether the project cost is controlled within the budget. | ESIH_DG/TJ 08-2198-2016 [64] |
| No. | Institution Type | Company Type | Position |
|---|---|---|---|
| 1 | Real estate developer | Private | Project manager |
| 2 | Designer | Public | Department director |
| 3 | Designer | Public | Department deputy director |
| 4 | Designer | Public | Department deputy director |
| 5 | Designer | Public | Department staff |
| 6 | Designer | Public | Department staff |
| 7 | Component factory | Private | Head of the team |
| 8 | Component factory | Public | Head of the team |
| 9 | Construction unit | Public | Head of the assembly building research center |
| 10 | Construction unit | Public | Head of the team |
| 11 | Construction unit | Private | Head of the team |
| 12 | Assembly consulting | Private | Corporate executive director, design director |
| 13 | Site supervisor consulting | Private | Technical specialist |
| 14 | University | Public | Scholar (Ph.D.) |
| 15 | University | Public | Scholar (Ph.D.) |
| Dimensions | Mean Sig. | Code | Indicators | Mean Sig. | C.I. | C.R. |
|---|---|---|---|---|---|---|
| E | 0.000 | 0.000 | ||||
| Leadership (E1) | 4.1538 | E1.1 | Owner’s cognition and attitude | 3.9231 | 0.000 | 0.000 |
| E1.2 | Contractors’ cognition and attitude | 3.5385 | ||||
| Participants’ capabilities and collaboration (E2) | 4.3077 | E2.1 | Designer’s experience and ability | 4.3846 | 0.014 | 0.012 |
| E2.2 | Construction contractor’s experience and ability | 4.0769 | ||||
| E2.3 | Component supplier’s experience and ability | 4.0769 | ||||
| E2.4 | Cooperation willingness | 4.0000 | ||||
| E2.5 | Collaboration channels | 3.9231 | ||||
| Planning and control (E3) | 4.1538 | E3.1 | Goal setting | 4.0000 | 0.016 | 0.013 |
| E3.2 | Norms and standards | 4.0769 | ||||
| E3.3 | Schedule control | 4.0000 | ||||
| E3.4 | Change control | 3.9231 | ||||
| E3.5 | Quality control | 3.8462 | ||||
| E3.6 | Cost control | 4.0000 | ||||
| Technology and schema (E4) | 4.3077 | E4.1 | Prefabricated technology system | 4.2308 | 0.004 | 0.004 |
| E4.2 | Advance work of IC design | 4.1538 | ||||
| E4.3 | Design with component confirmation | 3.9231 | ||||
| E4.4 | Detail design and process matching | 3.7692 | ||||
| E4.5 | Component production | 3.6923 | ||||
| E4.6 | Component transportation | 3.6923 | ||||
| E4.7 | Construction with component assembly | 3.9231 | ||||
| E4.8 | Industrialized decoration | 3.6923 | ||||
| E4.9 | Operation preparation | 3.6923 |
| Dimensions | Mean Sig. | Code | Indicators | Mean Sig. | C.I. | C.R. |
|---|---|---|---|---|---|---|
| R | 0.015 | 0.017 | ||||
| Product (R1) | 4.2308 | R1.1 | Prefabrication rate | 3.6154 | 0.007 | 0.008 |
| R1.2 | Practical performance | 4.3077 | ||||
| R1.3 | Operating and maintenance savings | 3.9231 | ||||
| R1.4 | Owner’s satisfaction | 4.2308 | ||||
| Society (R2) | 3.9231 | R2.1 | Technological innovation | 3.9231 | 0.027 | 0.046 |
| R2.2 | Environmentally friendly | 4.0000 | ||||
| R2.3 | Honors or awards | 3.8462 | ||||
| Organization (R3) | 3.3077 | R3.1 | Participants communication efficiency | 4.3077 | 0.000 | 0.000 |
| R3.2 | Participants’ long-term cooperation willingness | 4.2308 | ||||
| Management and Control (R4) | 3.8462 | R4.1 | Schedule | 4.0769 | 0.000 | 0.000 |
| R4.2 | Quality | 4.3846 | ||||
| R4.3 | Cost | 4.0769 |
| N | 1 | 2 | 3 | 4 | 5 | 6 | 7 | 8 | 9 | 10 |
|---|---|---|---|---|---|---|---|---|---|---|
| R.I. | 0 | 0 | 0.58 | 0.90 | 1.12 | 1.24 | 1.32 | 1.41 | 1.46 | 1.49 |
| Dimensions | Initial Level | Upgraded Level | Integrated Level | Optimal Level |
|---|---|---|---|---|
| Leadership (E1) | Project participants have little cognition of the IC mode and have few willingness to learn to adopt IC technologies. | Project participants have a basic cognition of the IC mode and are willing to explore the IC applications. | Project participants have the basic cognition of the IC mode and are strongly willing to implement the IC applications. | Project participants have sufficient cognition of the IC mode and have a very strong willingness to achieve the IC applications. |
| Participants’’ capabilities and collaboration (E2) | The organization structure hardly meets the IC projects’ requirements and the participants can work together reluctantly. | The organization structure reluctantly meets the IC projects’ requirements and the participants can work together preliminarily. | The organization structure mostly meets the IC projects’ requirements and the participants can work together efficiently. | The organization structure fully meets the IC projects’ requirements and the participants can work together very closely. |
| Planning and control (E3) | Project managers make rough planning for key progress prediction and resource allocation and take a few measurements to control the implementation process of the planning. | Project managers make rough planning for key progress prediction and resource allocation and take some rational measurements by manual to control the implementation process of the planning. | Project managers make detailed planning for key progress prediction and resource allocation and take some rational measurements by manual to control the implementation process of the planning. | Project managers make very detailed planning for key progress prediction and resource allocation and take some information tools (BIM, Integrated information platform, etc.) to control the implementation process of the planning. |
| Technology and schema (E4) | The organization has few experiences in selecting technologies and process schemas to deal with the industrial obstacles and difficulties of the IC mode in components design, production, transportation, and assembly. | The organization has the basic experiences in selecting technologies and process schemas to deal with the industrial obstacles and difficulties of the IC mode in components design, production, transportation, and assembly. | The organization has rich experiences in selecting technologies and process schemas to deal with the industrial obstacles and difficulties of the IC components design, production, transportation, and assembly. | The organization has rich experiences in both implementing risk management measurements and selecting technologies and process schemas to deal with the industrial obstacles and difficulties of the IC components design, production, transportation, and assembly. |
| Dimensions | Initial Level | Upgraded Level | Integrated Level | Optimal Level |
|---|---|---|---|---|
| Product (R1) | The building entity for the final delivery barely meets the owner’s requirements, and the appearance and function of the building reach the design goal and meet the basic needs of practical applications. | The building entity for the final delivery mostly meets the owner’s requirements, and the appearance and function of the building reach the design goal and meet key needs of practical applications reluctantly. | The building entity for the final delivery fully meets the owner’s requirements, and the appearance and function of the building achieved the design goal and meet needs of practical applications exactly. | The building entity for the final delivery fully meets the owner’s requirements, and the appearance and function of the building achieved the design goal very well and meet all needs of practical applications sufficiently. |
| Society (R2) | The benefits of the construction process brought by the IC mode have no difference from the traditional construction mode. | The construction process under the IC mode is more environment-friendly than the traditional construction mode. | The IC mode brings more energy conservation and makes the construction process more environment-friendly than the traditional construction mode. | The IC mode brings more technology innovation and more energy conservation, as well as more environment friendly than the traditional construction mode. |
| Organization (R3) | The inner cooperation of participants can make it possible to reach the IC project objectives reluctantly, but the efficiency of the cooperation process is low. | The inner cooperation of participants can support achieving the project objectives well, and the efficiency of the cooperation process is very smooth. | The inner cooperation of participants can support achieving the project objectives well, the cooperation process is very smooth, and the member within the organization can learn to grow. | The inner cooperation of participants can support achieving the project objectives well, the cooperation process is very smooth, the member within the organization can learn to grow, and the participants have the willingness to establish a long-term cooperative relationship. |
| Management and control (R4) | The management and control of the construction process under the IC mode can barely achieve the three major objectives (quality, schedule, or cost). | The management and control of the construction process under the IC mode make the construction process are equal to the traditional mode in terms of quality, progress, or cost. | The management and control of the construction process under the IC mode make the construction process slightly better in terms of quality, progress, and cost. | The management and control of the construction process under the IC mode make the construction process much better in terms of quality, progress, and cost. |
| 0 | Project Code | A | B | C | D |
|---|---|---|---|---|---|
| 1 | Project Name | *** Middle School | ***Plaza | *** Housing Project | *** resettlement houses |
| 2 | Delivery method | DB | CM-at GC | CM-at GC | DBB |
| 3 | Investment type | Public | Private | Private | Public |
| 4 | Construction scale (m2) | ||||
| 4.1 | Aboveground area | 39,269.07 | 99,793.09 | 69,954.73 | 102,987.00 |
| 4.2 | Underground area | 9924.00 | 49,876.78 | 28,109.97 | 432,020.00 |
| 5 | Structure Type | ||||
| 5.1 | Building Type | Multi-story public building | Multi-story public building | High-rises residence | High-rises residence |
| 5.2 | IC Technology | Precast concrete framework | Precast concrete framework | PC-integral shear wall structure | PC-Composite Shear Wall |
| 6 | Distance from component factory | 150 km | 60 km | 50 km | 3 km |
| 7 | Process standard | √ | |||
| 8 | Informatics techniques | ||||
| 8.1 | BIM application | √ | √ | √ | |
| 8.2 | BIM application stage | Construction | Design and construction | Design | -- |
| 8.3 | Information platform | √ |
| Code | Gender | Age | Position | Participants | Experience* | Rate | Interview Time (min) | ||
|---|---|---|---|---|---|---|---|---|---|
| Year | Count | Scale (km2) | |||||||
| A1 | Male | 35–45 | Scholar | Construction contractor | 10 + | 1 | 49 | √ | 68 |
| A2 | Male | 25–35 | Manager | Construction contractor | 10+ | 3 | 100~200 | √ | 69 |
| B1 | Male | 35–45 | Manager | Construction contractor | 5–10 | 3 | 100~150 | √ | 61 |
| B2 | Male | 35–45 | Manager | Design | 10+ | 3 | 100~150 | √ | 51 |
| C1 | Male | 25–35 | Manager | Owner | 5–10 | 2 | 50~100 | √ | 90 |
| C2 | Female | 25–35 | Manager | Design | 10+ | 9 | 60~200 | √ | 72 |
| C3 | Male | 35–45 | Manager | Construction contractor | 10+ | 1 | 100 | 35 | |
| C4 | Male | 25–35 | Manager | Labor contractor | 5–10 | 5 | 50~100 | 46 | |
| D1 | Male | 35–45 | Manager | Owner | 10+ | 1 | 145 | √ | 92 |
| D2 | Male | 35–45 | Manager | Design | 10+ | 12 | 30~200 | √ | 89 |
| Spearman’s Rho | A1 | A2 | Spearman’s Rho | B1 | B2 | ||
| A1 | Correlation coefficient | 1.000 | 0.702** | B1 | Correlation coefficient | 1.000 | 0.691** |
| Sig. (twin tails) | . | 6.670E-12 | Sig. (twin tails) | . | 1.772E-11 | ||
| N | 72 | 72 | N | 72 | 72 | ||
| A2 | Correlation coefficient | 0.702** | 1.000 | B2 | Correlation coefficient | 0.691** | 1.000 |
| Sig. (twin tails) | 6.670E-12 | . | Sig. (twin tails) | 1.772E-11 | . | ||
| N | 72 | 72 | N | 72 | 72 | ||
| Spearman’s Rho | C1 | C2 | Spearman’s Rho | D1 | D2 | ||
| C1 | Correlation coefficient | 1.000 | 0.769** | D1 | Correlation coefficient | 1.000 | 0.792** |
| Sig. (twin tails) | . | 2.927E-15 | Sig. (twin tails) | . | 1.263E-16 | ||
| N | 72 | 72 | N | 72 | 72 | ||
| C2 | Correlation coefficient | 0.769** | 1.000 | D2 | Correlation coefficient | 0.792** | 1.000 |
| Sig. (twin tails) | 2.927E-15 | . | Sig. (twin tails) | 1.263E-16 | . | ||
| N | 72 | 72 | N | 72 | 72 | ||
| Weak Areas | Project | Improving Path* | Improving Strategy Description | |
|---|---|---|---|---|
| Enablers (How) | E1 | A, B, C, D | Integrated level→Optimal level | Project participants need to have a more clear and overall cognition of IC and enhance their willingness to implement IC. |
| E3 | C, D | Integrated level→Optimal level | The project organization should make more detailed planning for progress prediction and resource applications and attempt to control the planning implementation by adopting the information tools (BIM, information software platform, etc.). | |
| E4 | C, D | Integrated level→Optimal level | The project organization should try to select more efficient and rationale technology and process schemas, so they need to enhance their capability to make decisions and adopt more innovative technologies. | |
| Results (What) | R1 | A, B, C, D | Integrated level→Optimal level | The built entity adopting the IC technique system should be more functional and practical than that built by adopting the conventional method. |
| R2 | A | Integrated level→Optimal level | The IC mode has brought the benefit of environment friendly and energy conservation. However, technology innovation needs to be further explored in the construction process for follow up applications. | |
| B, C, D | Upgraded level→Optimal level | The IC mode has brought the basic benefit of environment friendly, more energy conservation and technology innovation need to be further explored in the construction process. | ||
| R3 | A, B, C, D | Integrated level→Optimal level | The organizations have achieved the project objectives well, participants within the organizations can cooperate smoothly, and the members within the organizations can learn to grow. However, these temporary organizations need to try to establish a long-term cooperative relationship. | |
| Dimension | Code | Indicators | A | B | C | D |
|---|---|---|---|---|---|---|
| Leadership (E1) | E1.1 | Owner’s cognition and attitude | ◕ | ◕ | ◕ | ◕ |
| E1.2 | Contractors’ cognition and attitude | ◕ | ◕ | ◕ | ||
| Participants’ capabilities and collaboration (E2) | E2.1 | Designer’s experience and ability | ||||
| E2.2 | Contractor’s experience and ability | |||||
| E2.3 | Component supplier’s experience and ability | |||||
| E2.4 | Cooperation willingness | ◕ | ||||
| E2.5 | Collaboration channels | ◕ | ||||
| Planning and control (E3) | E3.1 | Goal setting | ◕ | ◕ | ◕ | ◕ |
| E3.2 | Norms and standards | ◕ | ◕ | |||
| E3.3 | Schedule control | ◕ | ◕ | ◕ | ||
| E3.4 | Change control | |||||
| E3.5 | Quality control | |||||
| E3.6 | Cost control | ◕ | ||||
| Technology and schema (E4) | E4.1 | Prefabricated technology system | ||||
| E4.2 | Advance work of IC design | |||||
| E4.3 | Design with component confirmation | |||||
| E4.4 | Detail design and process matching | ◕ | ◕ | ◕ | ◕ | |
| E4.5 | Component production | ◑ | ◑ | ◑ | ◕ | |
| E4.6 | Component transportation | ◕ | ◕ | ◑ | ◕ | |
| E4.7 | Construction with component assembly | ◕ | ◕ | ◑ | ||
| E4.8 | Industrialized decoration | ◑ | ◑ | ◑ | ◑ | |
| E4.9 | Operation preparation | ◑ | ◑ | ◑ | ◑ | |
| Product (R1) | R1.1 | Prefabrication rate | ◕ | ◑ | ◑ | ◕ |
| R1.2 | Practical performance | ◕ | ◕ | ◕ | ◕ | |
| R1.3 | Operating and maintenance savings | ◑ | ◔ | ◑ | ◔ | |
| R1.4 | Owner’s satisfaction | ◕ | ◕ | ◕ | ◕ | |
| Society (R2) | R2.1 | Technological innovation | ◑ | ◔ | ◔ | ◔ |
| R2.2 | Environmentally friendly | ◕ | ◑ | ◑ | ||
| R2.3 | Honors or awards | ◔ | ◔ | ◔ | ||
| Organization (R3) | R3.1 | Participants communication efficiency | ||||
| R3.2 | Participants’ long-term cooperation willingness | |||||
| Management and Control (R4) | R4.1 | Schedule | ◕ | ◕ | ◕ | ◕ |
| R4.2 | Quality | ◕ | ◕ | ◕ | ||
| R4.3 | Cost | ◔ | ◔ | ◔ | ◔ |
© 2020 by the authors. Licensee MDPI, Basel, Switzerland. This article is an open access article distributed under the terms and conditions of the Creative Commons Attribution (CC BY) license (http://creativecommons.org/licenses/by/4.0/).
Share and Cite
Wang, G.; Liu, H.; Li, H.; Luo, X.; Liu, J. A Building Project-Based Industrialized Construction Maturity Model Involving Organizational Enablers: A Multi-Case Study in China. Sustainability 2020, 12, 4029. https://doi.org/10.3390/su12104029
Wang G, Liu H, Li H, Luo X, Liu J. A Building Project-Based Industrialized Construction Maturity Model Involving Organizational Enablers: A Multi-Case Study in China. Sustainability. 2020; 12(10):4029. https://doi.org/10.3390/su12104029
Chicago/Turabian StyleWang, Guangbin, Huan Liu, Heng Li, Xiaochun Luo, and Jiaxi Liu. 2020. "A Building Project-Based Industrialized Construction Maturity Model Involving Organizational Enablers: A Multi-Case Study in China" Sustainability 12, no. 10: 4029. https://doi.org/10.3390/su12104029