Factors Affecting the Dynamics of Community Supported Agriculture (CSA) Membership

1
Food and Resource Economics Department, University of Florida, Gainesville, FL 32611, USA
2
Department of Agricultural and Resource Economics, University of Tennessee, Knoxville, TN 37996, USA
3
Department of Agricultural Sciences, Clemson University, Clemson, SC 29634, USA
*
Author to whom correspondence should be addressed.
Sustainability 2019, 11(15), 4170; https://doi.org/10.3390/su11154170
Submission received: 30 June 2019
/
Revised: 29 July 2019
/
Accepted: 30 July 2019
/
Published: 2 August 2019
(This article belongs to the Special Issue Marketing of Sustainable Food and Drink)
Abstract
:Community supported agriculture (CSA) serves as a platform for local producers, especially for small size farms, to sell fresh, local products directly to its members. CSA is an important approach to promote local economic growth and contribute to sustainable agriculture. Although CSA is widely accepted across the United States, the total number of CSA membership is still very low. It is important to determine the factors that affect the future development of CSA because of its social and environmental benefits. In this study, we analyze how the motivation, barriers, and methods of advertisement influence the participation dynamics of CSA by segmenting consumers based on their past, current, and future CSA participation. Based on a national survey with 795 responses, the results show that the younger generation, high-income families, and people who support sustainable agriculture are more likely to renew their CSA subscription. CSA members are found to be very sensitive to the time of food distribution, the price of products, and the location of CSA farms. Moreover, the impacts of perceived barriers of CSA participation and advertisement method vary based on respondents’ membership status. This paper sheds light on factors that influence various consumer groups and offers a more dynamic analysis of CSA consumer behavior. This analysis enhances understanding of CSA members’ preferences and could help CSA programs expand in the future and to better promote local food systems and sustainable agriculture.
1. Introduction
Community supported agriculture (CSA) is an important model of the alternative food networks (AFNs) and has been developed in response to concerns with industrial agriculture and to guarantee better control over food products [1,2,3]. CSA programs encourage local production and consumption by allowing consumers to subscribe to a membership and, in return, receive food periodically from a group of local farmers during the harvest season [1]. This direct interaction with farmers offers consumers a chance to be involved in the decision-making of what products CSA farmers produce and how [4,5]. Moreover, farmers and consumers both share production and financial risks [6,7,8].
CSA brings various benefits to society and the environment and is therefore considered as one of the essential components of sustainable agriculture. Local food systems, including CSA and other sale outlets such as farmers’ markets, aim to support environmentally and ecologically friendly practices to promote food sustainability in the local community [9,10,11]. Studies show that CSA can facilitate access to local and fresh food and thus promote a healthier diet [12,13,14]. A CSA program is also considered as a method to support local farms and boost the local economy and agriculture production [13,14,15,16,17,18]. Since CSA products are usually delivered within a short distance, the products have short food miles. Therefore, CSA is considered to generate less air pollution and to be more environmentally friendly than traditional agriculture that relies on long supply chains to deliver food from farms to consumers [5,8,17,18,19,20]. In addition to the direct benefits of CSA, CSA participation can also increase the awareness of local farmers and establish direct connections with local farms [4,13,14,17,20,21].
Since the birth of the community supported agriculture (CSA) movement in New England in 1986 [13], CSA has become a popular option for consumers to purchase local food. CSA programs have spread across the United States quickly. There were over 6000 CSA farms in 2012, and the scale of CSA programs continues to expand [22]. A 2015 survey conducted by USDA reported that there were 7398 CSA farms in the United States, which contributed $226 million or 7 percent to the direct-to-consumer sales transactions [23]. Furthermore, the CSA program also witnessed growth in both developing and other developed countries with different focuses [2,5,22]. For example, in China, CSA specializes more in food quality due to food safety concerns and health issues among the general public [3,5], while CSA in the UK aims to set up a transparent relationship between consumers and farmers to share the risks and benefits [24].
Despite of the fast growth of CSA worldwide, CSA participation rate is still low. Research shows that uncertainty in the quality and quantity of products obtained by CSA members is one of the main barriers for CSA participation [25]. Based on the nature of the CSA program, CSA members receive products only in harvesting seasons [8,18]. The seasonality of production and distribution of food can be unpredictable and easily replaced by other regular food shopping venues, such as grocery markets [14,15]. Furthermore, CSA participation is hindered by other factors, such as unfamiliarity and lack of freedom to select products, inability to obtain the food all year round, and inconvenience of the pick-up place or time [4,6,7,15,17,21]. Peterson et al. claimed that CSA is the least convenient way to purchase food products compared with other shopping outlets such as grocery stores and farmers’ markets [17]. Due to the unfamiliarity with CSA products, some people found it cost too much time cooking and preparing once having joined a CSA program [14]. The relatively high price of CSA membership also prevents many members from continuing to subscribe to the service [20].
Because of the increasing interest and trend in sustainable food consumption, a large body of literature has focused on the factors affecting CSA participation. However, previous research often simply divides consumers into non-CSA member versus CSA member based on the current status and examines the heterogeneity between these two groups [18,26,27,28]. These studies did not consider other possible CSA participation status such as being CSA members in the past but having canceled their membership or never having been a member before but would like to try CSA in the future. With the consideration of the various status of CSA membership in the analysis, this study will provide a more holistic understanding of consumer behaviors and intention regarding CSA participation. Research has shown that joining a CSA program can influence consumer choices. Cox et al. concluded that people’s behaviors would change through participation in CSA: when CSA subscribers stay with the program, they tend to eat healthier and be more aware of agricultural and environmental issues [29]. Moreover, CSA members care more about pesticide usage and enjoy the interaction with local farmers [18,30]. CSA members may adjust their purchasing, processing, and eating habits subject to CSA production and distribution constraints [7,16]. In addition, CSA members’ psychological needs may also vary based on different membership status [28].
To fill the gap in the literature regarding CSA participation, we divide consumers into three groups based on following conditions: (i) whether they used to be CSA members; (ii) whether they are current members; and (iii) whether they plan to subscribe in the future. This allows us to classify people into various groups such as those are past, current, and future members or those who were members in the past, but stopped, and so on. Based on the classification, we can determine the factors that affect the dynamics between different membership status. Different from past studies that focus on the investigation of the factors that affect a current or a future CSA membership, the objective of this study is to further determine the important factors such as barriers, motivation, and source of information [17,27] that help regain CSA consumers if they stopped their membership in the past. We also explore the factors that help attract more people to subscribe to the CSA program if they never joined it before. To accomplish the objectives, we designed a consumer survey and applied a multinomial logit model to the survey data. This article contributes to the literature by comparing consumers with multiple membership status and analyzes their behaviors at a more segmented and dynamic level. Results of the study could provide essential information on promoting sustainable food consumption through the growth of CSA participation and further develop food sustainability in the local community.
2. Data
In May of 2015, we designed a survey about consumers’ past, current, and future CSA membership. This survey was distributed by Survey Sampling International (SSI), an international professional market research company, to its nationally representative consumer panels in the United States. SSI applied a quota sampling method to adjust demographics distribution, so that sample demographics closely matched that of the national population [27]. In the survey, we included a trap question (or a validation question). The trap question asked respondents to select a particular answer (e.g., Strongly Agree) for one of the statements (e.g., For this statement, please select “Strongly Agree”.) in a matrix table question. Respondents who didn’t select the answer as guided (e.g., “Strongly Agree”) would be identified as failing the trap question. Those who failed the trap questions were more likely to conduct satisficing behavior in online surveys [31]. This question has been shown to help identify respondents who are careless in answering the survey questions, which can lead to poor data quality [31,32,33]. After removing respondents with missing values and those who failed the trap questions [31,32,33], we included 795 valid responses of the 2264 total samples in the final data analysis (Using the same data, Vassalos et al (2017) determined the factors affecting the current and future CSA membership, which provides useful supplemental information that is not provided in this study [27].)
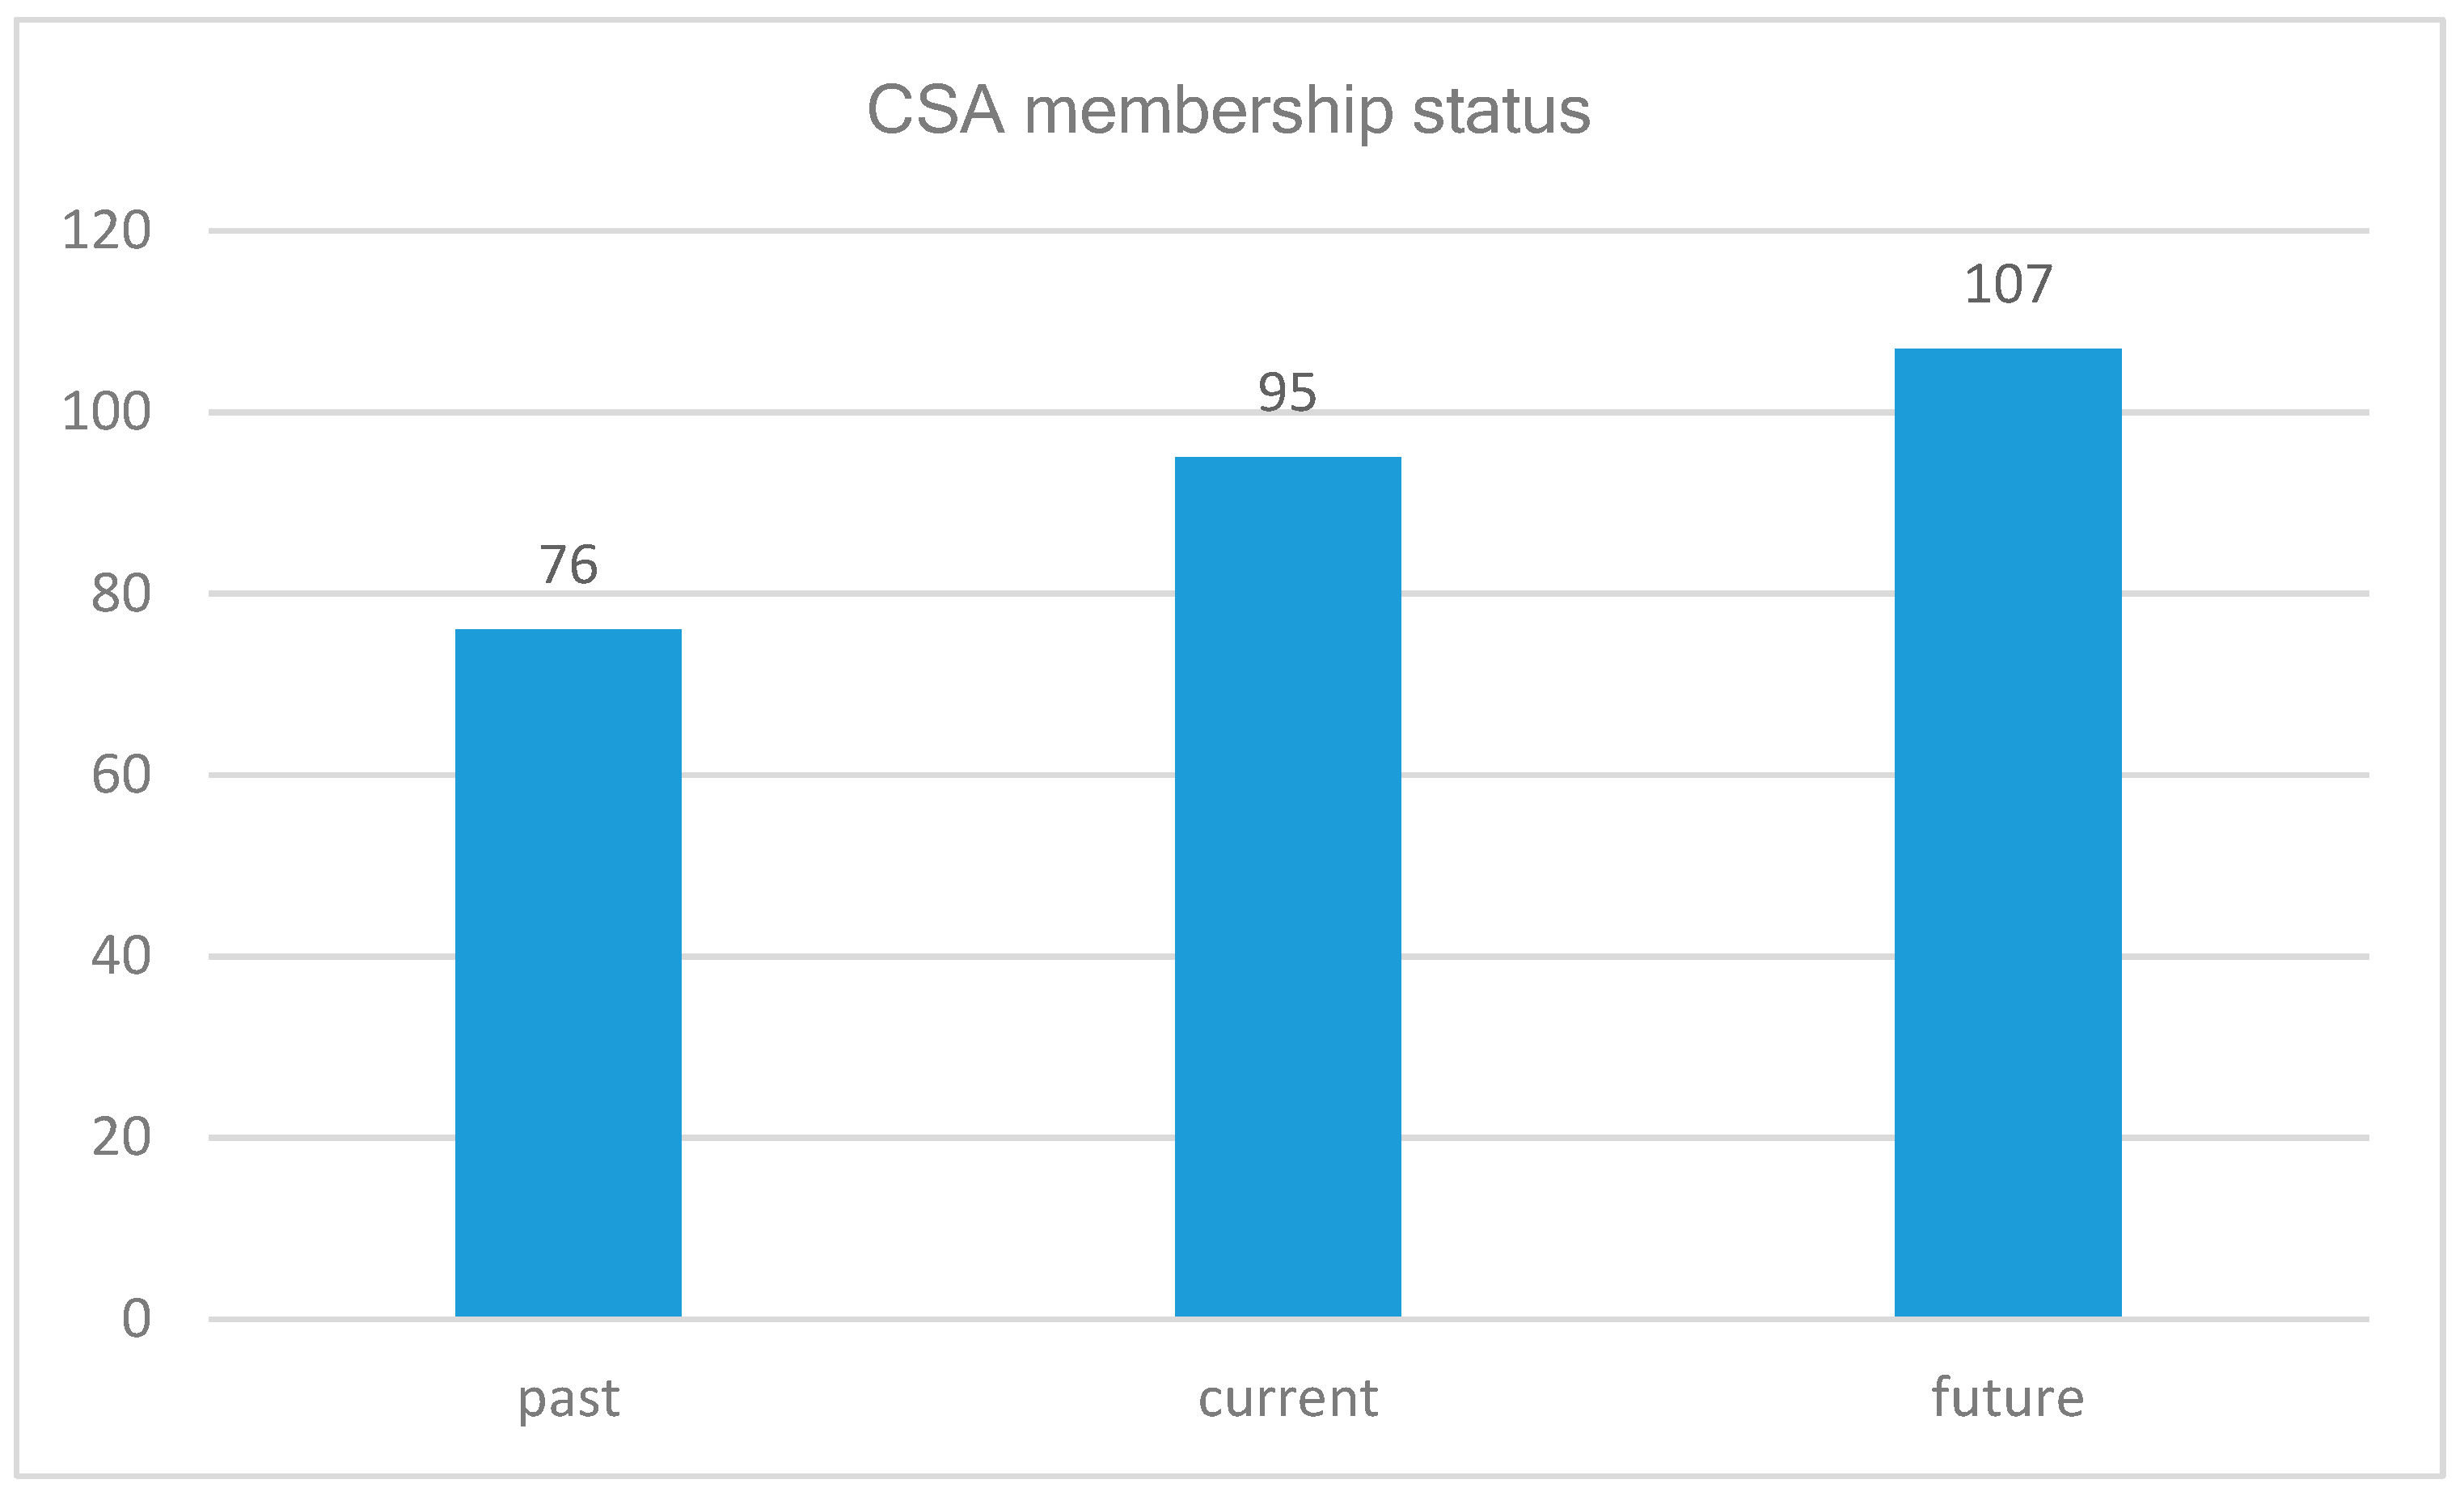
The survey contained questions about respondents’ CSA membership status (past, current, or future). Questions were asked such as “Were you a Community Support Agriculture (CSA) consumer in the past?”, “Are you a current Community Support Agriculture (CSA) consumer?”, and “Are you planning to join the CSA membership in the future?” to identify respondents’ past, current, and potential future CSA membership, respectively. Figure 1 presents the proportion of past, current, and future CSA members in the sample. About 9.6% of total respondents had CSA experience in the past (group 5, 6, 7, and 8 in Table 1), 12% of the respondents were current CSA members (groups 3, 4, 7, and 8 in Table 1), and about 13.5% of respondents were interested in becoming CSA members in the future (groups 2, 4, 6, and 8 in Table 1).
Based on respondents’ answers to the three questions regarding their CSA membership, the respondents could potentially be classified into eight different groups (Table 1). For instance, a respondent could be a person who did not participate in a CSA program in the past, at present, and is also not interested in becoming a CSA member in the future (the first row of Table 1). The participant could also be a person who was a CSA member in the past, at present, and would like to continue the CSA membership in the future (the last row of Table 1). The different classifications of respondents based on their CSA membership imply the complexity of CSA participation status and the importance of considering the dynamics of different CSA membership when analyzing consumers’ participation of CSA.
Depending on the CSA participation status in the past, current, and future, we asked different questions regarding respondents’ motivations and barriers to joining a CSA program. For respondents who had CSA membership experience, both motivation and barrier questions were asked. However, for respondents who had no CSA experience and were not interested in CSA in the future, only the barrier questions were asked. All the questions asked for respondents’ importance rating of several factors related to CSA using five-point Likert scales (1 = Not at all important to 5 =Very important). Motivation questions included ten potential reasons that attract people to become CSA members, while barrier questions consisted of nine factors that discourage people from joining CSA. Table 2 and Table 3 present the results of the importance rating of the factors affecting respondents’ participation/nonparticipation of CSA in a descending order of means of importance. Results in Table 2 indicate that the top two motivations for respondents to be a CSA member were to support sustainable agriculture and support local farms/farmers. The two least important reasons for CSA participation were “products are easier to cook” and “to save time on grocery shopping”.
Regarding the barriers of CSA participation (reasons for nonparticipation of CSA), the top two reasons were “prefer farmers’ markets” and the “cost/value issues” (Table 3). The least important reason was “household issues (moving, donate, cook, etc.)”. Although there was a slight difference in the mean values of the importance ratings of the other reasons such as the problems with pick-up, product quality, and quantity, as well as the processing and storing of products, etc., these differences seemed to be small.
Respondents were also asked about the importance of the sources of information that can help them to try/join a CSA program on a scale of one to five. The source of information included friend/family members, website/internet, roadside signs, and newspapers. Overall, consumers thought that information from friends and family members is the most important way for them to find out about a CSA program (Table 4).
We also collected demographic information from respondents, including age, gender, education level, income, and numbers of children in each household. Overall, the average age of the sample was 43 years old. Regarding education level, about 39% obtained a graduate degree, 38% had a college degree, and 23% got a high school degree. Around 53% of the respondents were female. In each household, there were two adults and around two children on average. The average annual household income in the sample was around $64,000 annually. As for region of residence, the percentages of the total respondents living in Northeast, Midwest, South and West are 20%, 21%, 36%, and 23%, respectively.
3. Method
We applied a multinomial logit model to examine the effect of various factors on consumer decisions about CSA membership. As Table 1 implies, there was a total of eight membership combinations based on past, current, and future membership status. Each combination represented a specific membership case. Since many previous studies have only focused on the changes from one CSA membership status to another (e.g., a current member vs. not; a future CSA member vs. not) [18,26,27,28], in this study, we only focus on the two scenarios that have not been examined in the literature. Scenario 1 mainly examined the case of retaining current CSA consumers, and scenario 2 mainly investigated the case of attracting more new future consumers. To achieve the goals, we estimated two models. Model 1 included three cases, past member only, past and current member, and member all the time, to examine factors that help the retention of CSA members. Model 2 included another three cases, non-member all the time, current and future member, and future member only, to analyze how to attract more people to join CSA in the future.
In the multinomial logit model, the utility of a person i is obtained through factors in a hypothetical scenario:
where is the continuous latent variable with outcome j, xi represents a vector of the influencing factors, including motivation, barriers, information sources, and demographic variables, and is the coefficient related to xi in each model. is an unobserved error term following a standard type-1 extreme value distribution.
i = 1, 2,…, I; j = 0,1,2,…,J
In each model, there are three outcome levels (0, 1, 2) in the y and those outcomes are not ordered, which indicates the unordered categorical property of y. Specifically, the probabilities for different membership status is specified as follows:
where j represents the levels in independent variable (y) in both model 1 and model 2, and indicates respondent i ranking a set of variables k of the reasons that motivate or prevent people from joining CSA, information source to become informed of CSA, and demographic variables such as age, education level, number of children in one household, gender, and income level.
i = 1, 2,…, I; j = 0,1,2.
In model 1, includes the variables that measure the motivation factors for people to join CSA, the information source variables indicating the importance of different outlets for people to get the information to join CSA, and the demographic variables. In model 2, represents the variables that measure the barrier factors preventing people from joining CSA, the information source variables, and the demographic variables. The information source variables were included in the model because past research showed that the source of information on CSA had a significant impact on consumers’ willingness to participant in CSA [27]. Among demographic variables, income, age, education and number of children were treated as numeric variables, while gender was treated as a dummy variable (male = 1, female = 0). The motivation and barrier factors and information source variables were all included in the models as discrete variables because they were all measured using five-point Likert scales.
4. Results
4.1. Statistics of Respondents with Different Membership Status
The results in Table 5 show that the number of respondents in model 1 was relatively small because only a small percentage of respondents in the total sample had CSA membership experiences. For respondents in model 1, those who were members all the time (past, current, and future) accounted for 47.1% of the sample, while those who were past members only and past and current members accounted for 20.0% and 32.86%, respectively. In general, respondents who were past members only had lower mean values for all motivation and barrier factors than respondents in the other two groups. These respondents thought all the information sources were less important for them to get CSA membership information than respondents who were members all the time. The demographics of the respondents did not differ significantly across the three groups.
The results in Table 6 show the statistics of the respondents included in model 2. Since there were many respondents without CSA membership experience, the total number of respondents included in this model is relatively large. The respondents who had no CSA membership experience and were not interested in becoming CSA members accounted for 90.2% of the sample in this model. Respondents who were currently CSA members and would continue the membership in the future accounted for 2.4%; those who were not CSA members in the past and current but were interested in becoming CSA members accounted for 7.3% of the sample in this model. For respondents who were non-members all the time, it was not applicable to ask their motivation to join CSA. Results show that for respondents who were current CSA members and interested in continuing the membership in the future and those who had no member experience but wanted to become CSA members, the mean values for most of the motivation and barrier factors were similar. Respondents who were non-members all the time had lower mean values for all the barrier factors than respondents in the other two groups. This implies that the respondents who were non-members all the time considered all the barriers listed in the study less important than respondents who were interested in future CSA membership. They also thought all the information sources about CSA were less important. In addition, these respondents tended to be older and had fewer children than respondents in the other two groups. Interestingly, respondents who were not current CSA members but were interested in future CSA membership tended to be younger, female, have more children, and a relatively lower income than the other groups. Respondents in the other two groups shared similar demographics.
4.2. Results of the Multinomial Logit Model
In model 1, respondents who were CSA members all the time were used as the base group, so the parameter estimates of the variables in the model indicate the effect of independent variables on the probability of an all-time CSA member becoming a member in the other two groups. Results show that the p-value of model 1 is 0.0024, suggesting that the model is statistically significant (Table 7). For people who were past members only (y = 1), only the coefficient of S_FRN is significantly negative, indicating that the more important respondents considered information on CSA programs from their friends to be, the less likely they were to be past members only and the more likely they were to be all-time CSA members. As for the CSA past and current member (y = 2) group, R_SUS has a significant negative coefficient, suggesting that the more important the respondents considered supporting sustainable agriculture as the motivation of joining a CSA program, the less likely they were to be past and current members, or the more likely they were to be willing to renew their membership in the future. Furthermore, the coefficients of R_TIM, R_EAT, and R_LOC are all positive and significant. This implies that if the past and current CSA members considered saving time on grocery shopping, eating seasonally, or knowing how and where food was grown as more important motivations, the probability of staying in the program in the future is lower. Regarding the effect of information sources, respondents who thought CSA information from newspapers and friends more important, were more likely to renew their membership in the future. Those who thought information from roadside signs more important were less likely to continue their CSA membership (e.g., only being past and current members). Furthermore, the younger generation and families with high incomes were more likely to be all-time CSA members rather than past and current members.
In model 2, respondents who were non-CSA members all the time were used as the base group, so the parameter estimates of the variables in model 2 indicate the effect of independent variables on the probability of all-time none CSA members becoming members in the other two groups (Table 7). The results show that for current and future members (y = 1), the barrier variables N_CST and N_ORG have significantly positive coefficients, and N_QLT has a significant negative correlation at 10% significance level. This implies that respondents who rated cost/values of membership and supporting organic agriculture as the important barriers were more likely to be current and future members than being all-time non-CSA members. However, the more important the respondents considered the quality of food as the barrier, the more likely they were to be all-time non-CSA members than being current and future members. Male respondents were also more likely to be current and future CSA members than being all-time nonmembers. For future CSA members, none of the barrier variables were significant, suggesting the difficulty of identifying the barriers for people who were not interested in CSA at all and the challenges to motivate them to participate in CSA in the future. However, two sources of information significantly affected the future participation of the all-time non-CSA members. Respondents who thought websites and roadside signs were important sources of CSA program information were more likely to change from all-time non-CSA members to future CSA members. Consistent with model 1, younger participants were more likely to participate in CSA in the future. None of the other demographics had a significant impact on the probability for respondents who were non-CSA members all the time to become future CSA members.
5. Discussion
CSA provides a great platform for farmers and consumers to have direct interaction. It is also becoming an important approach to promote sustainable food consumption and sustainable agriculture. Because of the increasing interest in CSA, numerous empirical studies have explored the important factors that affect peoples’ participation in CSA so that a better insight can be obtained for future CSA development. However, most research focuses on the difference between CSA and non-CSA members or the factors affecting current and future CSA membership [18,26,27,28]. Little literature has taken CSA membership into consideration in a more dynamic way and investigated the important factors affecting these dynamics. Based on consumer past, current, and potential future CSA membership, this study segments respondents into more dynamic groups such as those who would never be interested in membership, those who have been a CSA member and stopped, and those who are past and current members and would continue participating in CSA, and so on. Therefore, we can better understand the demands and needs as well as the differences among various groups of consumers. We can also identify the key factors that affect consumers’ decisions to change from one membership status to another. Results from this study provide essential information for regaining past CSA members, retaining current members, and attracting more future CSA members. Therefore, it helps expand the CSA community.
Our models emphasized the motivations that encourage people to stay in a CSA program and barriers that may prevent consumers from renewing their subscription. The results of the model with the motivation variables suggest that the probability for the younger generation and high-income family to renew their CSA subscription is relatively higher. The demographic profile of CSA members in the U.S. is different compared with other countries. For example, households with children are more likely to become a CSA member in China [5], whereas in Germany organic shoppers are more likely to join a CSA program [24]. The most important motivation, which is to support sustainable agriculture, is consistent with the primary goal of the CSA program [8,21,27]. Moreover, current CSA members are found to be sensitive to the time and food expenditure saving aspects of CSA for them to keep their all-time CSA membership. Thus, CSA farmers need to consider reducing the cost of CSA membership and the time for their members receiving their share of CSA. The past and current CSA members also find the information from newspapers and friends about CSA programs more influential on their decision to stay in the CSA program, while none of the information sources regarding CSA has any effect on past members’ enrollment in the future.
The effect of potential barriers of CSA participation and source of information also varies based on membership status. For current and future members, some barrier factors impose a significant impact, while the source of information variables are not significant. However, none of the barrier factors have any influence on the transition from consumer with no CSA experience to potential future consumer, while the source of information has a significant impact. The results imply that CSA farmers need to ensure the quality of the food, find ways to increase the value/cost ratio, and promote the organic aspect of farms to keep the current and future members in the program. The results also suggest that for current CSA consumers who plan to stay, CSA farmers do not need to invest too much in advertising to this group since those members are already familiar with the program. They may use the saved advertising cost to address the barriers that are important to current CSA consumers. In order to attract people without any CSA experience to become future CSA members, more focus should be put on advertising the CSA program on websites and roadside signs.
6. Conclusions
To conclude, by segmenting consumers into different groups, we can better understand the dynamics of different types of CSA members. This paper also sheds light on important factors that help prevent the loss of current CSA members and increase future CSA membership. To expand the CSA community and to better promote local food systems and sustainable agriculture, CSA farmers, stakeholders, and policymakers can develop more efficient programs and marketing strategies to promote CSA based on people’s different CSA membership status.
The limitation of this study is that the sample only contains a small number of respondents who have past or current CSA membership. However, this is consistent with the fact that only a small percentage of the population in the United State have CSA experience. The small sample size may potentially reduce the statistical power to test the difference among the three groups such as those with past membership only, with past and current membership, and with past and current membership and are interested in future CSA membership. Another limitation is that we asked respondents to rank the given factor, which could potentially cause bias since multiple factor ranking could reduce the response efficiency and may not capture their real preferences. Moreover, consumer behavior varies by culture and country. For example, the top reason to join a CSA program in the U.S., as indicated by our study, is to support local farms and farmers. On the other hand, Yan et al. found out that the top motivation for Chinese people to join a CSA program is to reduce food safety concerns and obtain high-quality organic vegetables [2,5]. For future studies that focus on the retaining of CSA members, such as motivating more past members to re-enroll and current members to continue their membership, the respondents with CSA experience (past and current) in different regions and countries could be oversampled so that there is more statistical power to test the hypotheses related to these consumers.
Author Contributions
All authors contributed to the paper. Conceptualization, Z.G. and L.Z.; methodology, J.C. and Z.G.; software, J.C.; validation, J.C, X.C, and L.Z.; formal analysis, J.C. and Z.G.; investigation, X.C; data curation, J.C.; writing—original draft preparation, J.C.; writing—review and editing, Z.G., X.C. and L.Z.; supervision, Z.G.
Funding
This work is/was supported by the USDA National Institute of Food and Agriculture, [HATCH/MULTI-STATE] project [FLA-FRE-005567].
Acknowledgments
This work is/was supported by the USDA National Institute of Food and Agriculture, [HATCH/MULTI-STATE] project [FLA-FRE-005567].
Conflicts of Interest
The authors declare no conflict of interest.
References
- Bazzani, C.; Canavari, M. Alternative agri-food networks and short food supply chains: a review of the literature. Econ. Agro Aliment/Food Economy. 2013, 15, 11–34. [Google Scholar] [CrossRef]
- Krul, K.; Ho, P. Alternative approaches to food: Community supported agriculture in urban China. Sustainability 2017, 9, 844. [Google Scholar] [CrossRef]
- Si, Z.; Schumilas, T.; Scott, S. Characterizing alternative food networks in China. Agric. Hum. Values 2015, 32, 299–313. [Google Scholar] [CrossRef]
- Bougherara, D.; Grolleau, G.; Mzoughi, N. Buy local, pollute less: What drives households to join a community supported farm? Ecol. Econ. 2009, 68, 1488–1495. [Google Scholar] [CrossRef]
- Yan, S.; Cunwang, C.; Peng, L.; Tiejun, W.; Caroline, M. Safe food, green food, good food: Chinese community supported agriculture and the rising middle class. Int. J. Agric. Sustain. 2011, 9, 551. [Google Scholar]
- Farnsworth, R.L.; Thompson, S.R.; Drury, K.A.; Warner, R.E. Community supported agriculture: Filling a niche market. J. Food Distrib. Res. 1996, 90–98. [Google Scholar]
- Cone, C.; Myhre, A. Community-supported agriculture: A sustainable alternative to industrial agriculture? Hum. Org. 2000, 59, 187–197. [Google Scholar] [CrossRef]
- Schnell, S.M. Food with a farmer;s face: Community-supported agriculture in the United States. Geogr. Rev. 2007, 97, 550–564. [Google Scholar] [CrossRef]
- Feenstra, G. Local food systems and sustainable communities. Am. J. Altern. Agric. 1997, 12, 28–36. [Google Scholar] [CrossRef]
- Stagl, S. Local organic food markets: Potentials and limitations for contributing to sustainable development. Empirica 2002, 29, 145–162. [Google Scholar] [CrossRef]
- Gao, Z.; Swisher, M.; Zhao, X. A new look at farmers’ markets: Consumer knowledge and loyalty. HortScience 2012, 47, 1102–1107. [Google Scholar] [CrossRef]
- Brown, C.; Miller, S. The impacts of local markets: A review of research on farmers markets and community supported agriculture (CSA). Am. J. Agric. Econ. 2008, 90, 1296–1302. [Google Scholar] [CrossRef]
- Kolodinsky, J.M.; Pelch, L.L. Factors influencing the decision to join a community supported agriculture (CSA) farm. J. Sust. Agric. 1997, 10, 2–3. [Google Scholar] [CrossRef]
- Landis, B.; Smith, T.E.; Lairson, M.; Mckay, K.; Nelson, H.; O’Briant, J. Community-supported agriculture in the research triangle region of North Carolina: Demographics and effects of membership on household food supply and diet. J. Hunger Environ. Nutr. 2010, 5, 70–84. [Google Scholar] [CrossRef]
- Cooley, J.P.; Lass, D.A. Consumer benefits from community supported agriculture membership. Rev. Agric. Econ. 1998, 20, 227. [Google Scholar] [CrossRef]
- Russell, W.S.; Zepeda, L. The adaptive consumer: Shifting attitudes, behavior change and CSA Membership renewal. Renew. Agric. Food Syst. 2008, 23, 136–148. [Google Scholar] [CrossRef]
- Peterson, H.H.; Taylor, M.R.; Baudouin, Q. Preferences of locavores favoring community supported agriculture in the United States and France. Ecol. Econ. 2015, 119, 64–73. [Google Scholar] [CrossRef]
- O’Hara, S.U.; Stagl, S. Global food markets and their local alternatives: A socio-ecological economic perspective. Popul. Environ. 2001, 22, 533–554. [Google Scholar] [CrossRef]
- Brown, C. Consumers’ preferences for locally produced food: A study in southeast Missouri. Am. J. Altern. Agric. 2003, 18, 213–224. [Google Scholar] [CrossRef]
- Tegtmeier, E.; Duffy, M. Community Supported Agriculture (CSA) in the Midwest United States: A Regional Characterization; Leopold Center Pubs and Papers, Iowa State University: Ames, IA, USA, 2005; pp. 1–23. [Google Scholar]
- Adam, K.L. Community Supported Agriculture; ATTRA—National Sustainable Agriculture Information Service: Butte, MT, USA, 2006; pp. 26–28. [Google Scholar]
- McFadden, S. Unraveling the CSA Number Conundrum. Available online: https://deepagroecology.org/2012/01/09/unraveling-the-csa-number-conundrum/ (accessed on 27 June 2019).
- United States Department of Agriculture. Direct Farm. Sales of Food. Results of the 2015 Local Food Marketing Practices Survey; United States Department of Agriculture: Washington, DC, USA, 2016. Available online: https://www.nass.usda.gov/Publications/Highlights/2016/LocalFoodsMarketingPractices_Highlights.pdf (accessed on 27 June 2019).
- Volz, P.; Cressot, N.; Parot, J.; Weckenbrock, P. Overview of Community Supported Agriculture in Europe; Urgenci: Aubagne, France, 2016; Available online: https://urgenci.net/wp-content/uploads/2016/05/Overview-of-Community-Supported-Agriculture-in-Europe.pdf (accessed on 27 June 2019).
- Galt, R.E.; O’Sullivan, L.; Beckett, J.; Hiner, C.C. Community supported agriculture is thriving in the central valley. Calif. Agric. 2012, 66, 8–14. [Google Scholar] [CrossRef]
- MacMillan Uribe, A.L.; Winham, D.M.; Wharton, C.M. Community supported agriculture membership in Arizona. An exploratory study of food and sustainability behaviours. Appetite 2012, 59, 431–436. [Google Scholar] [CrossRef] [PubMed]
- Vassalos, M.; Gao, Z.; Zhang, L. Factors affecting Current and Future CSA Participation. Sustainability 2017, 9, 478. [Google Scholar] [CrossRef]
- Zepeda, L.; Reznickova, A.; Russell, W.S. CSA membership and psychological needs fulfillment: An application of self-determination theory. Agric. Hum. Values 2013, 30, 605–614. [Google Scholar] [CrossRef]
- Cox, R.; Holloway, L.; Venn, L.; Dowler, L.; Hein, J.R.; Kneafsey, M.; Tuomainen, H. Common ground? Motivations for participation in a community-supported agriculture scheme. Local Environ. 2008, 13, 203–218. [Google Scholar] [CrossRef]
- Lamine, C. Settling shared uncertainties: Local partnerships between producers and consumers. Sociol. Ruralis 2005, 45, 324–345. [Google Scholar] [CrossRef]
- Gao, Z.; House, L.; Bi, X. Impact of satisficing behavior in online surveys on consumer preference and welfare estimates. Food Policy 2016, 64, 26–36. [Google Scholar] [CrossRef]
- Jones, M.S.; House, L.A.; Gao, Z. Respondent screening and revealed preference axioms testing quarantining methods for enhanced data quality in web panel surveys. Public Opin. Q. 2015, 79, 687–709. [Google Scholar] [CrossRef]
- Gao, Z.; House, L.A.; Xie, J. Online survey data quality and its implication for willingness-to-pay: A cross-country comparison. Can. J. Agric. Econ. 2016, 64, 199–221. [Google Scholar] [CrossRef]
Figure 1.
Percentage of CSA members in the Sample.


Table 1.
Classifications based on past, current, and future CSA membership.
| Classifications/Groups | Frequency | Membership | ||
|---|---|---|---|---|
| Past | Current | Future | ||
| non-member all the time (1) | 79.12% (629) | 0 | 0 | 0 |
| future member only (2) | 6.42% (51) | 0 | 0 | 1 |
| current member only (3) | 2.77% (22) | 0 | 1 | 0 |
| current and future member (4) | 2.14% (17) | 0 | 1 | 1 |
| past member only (5) | 1.76% (14) | 1 | 0 | 0 |
| past and future member (6) | 0.75% (6) | 1 | 0 | 1 |
| past and current member (7) | 2.89% (23) | 1 | 1 | 0 |
| member all the time (8) | 4.15% (33) | 1 | 1 | 1 |
Note: 0 indicates not a member, and 1 indicates a member of CSA; numbers in the parentheses are sample size.
Table 2.
Reasons for becoming a CSA member (the number of respondents answering motivation questions is 166).
Table 2.
Reasons for becoming a CSA member (the number of respondents answering motivation questions is 166).
| Variable Name | Description | Mean |
|---|---|---|
| R_LCL | To support local farm/farmers | 3.325 |
| R_SUS | To support sustainable agriculture | 3.313 |
| R_VAR | To have different varieties of food | 3.181 |
| R_SML | To support small or family farms/farmers | 3.181 |
| R_LOC | To know how/where food was grown | 3.139 |
| R_ORG | Products are organic | 3.120 |
| R_EAT | To eat seasonally | 3.090 |
| R_TIM | To save time on grocery shopping | 2.916 |
| R_PRI | To reduce the risk exposes of food prices | 2.880 |
| R_EAC | Products are easier to cook | 2.801 |
Table 3.
Reasons for not being a CSA member. (The number of respondents answering barrier questions is 686).
Table 3.
Reasons for not being a CSA member. (The number of respondents answering barrier questions is 686).
| Variable Name | Description | Mean |
|---|---|---|
| N_FRM | Prefer farmers market | 2.232 |
| N_CST | Cost/value issues | 2.185 |
| N_VAR | Product mix issues | 2.083 |
| N_ORG | Support organic (farms/farmers/agriculture) | 2.063 |
| N_PCK | Pick-up issues | 1.985 |
| N_QNT | Problems with quantity | 1.977 |
| N_STR | Problems processing and storing | 1.971 |
| N_QLT | Problems with quality | 1.964 |
| N_HH | Household issues (moving, donate, cook, etc.) | 1.848 |
Table 4.
Information Sources.
| Variable Name | Description | Mean |
|---|---|---|
| S_FRN | Friend/family members | 2.224 |
| S_WEB | Website/internet | 2.073 |
| S_RDS | Roadside signs | 2.008 |
| S_NWP | Newspapers | 1.935 |
Table 5.
Statistics of Independent Variables for Participants with Different CSA Status in model 1.
| Member All the Time (y = 0) | Past Member Only (y = 1) | Past and Current Member (y = 2) | ||||
|---|---|---|---|---|---|---|
| Observation | 33 | 14 | 23 | |||
| Percentage | 47.14% | 20.00% | 32.86% | |||
| Mean | Std. Err. | Mean | Std. Err. | Mean | Std. Err. | |
| Motivation | ||||||
| R_ORG | 3.152 a | 1.034 | 2.143 b | 1.512 | 3.087 ab | 0.996 |
| R_EAC_ | 3.152 a | 0.795 | 2.000 b | 1.359 | 2.913 ab | 0.996 |
| R_SML | 3.333 a | 0.854 | 2.143 b | 1.167 | 3.174 a | 1.072 |
| R_SUS | 3.424 a | 0.708 | 2.643 a | 1.336 | 3.217 a | 1.204 |
| R_LCL | 3.333 a | 0.890 | 2.429 b | 1.342 | 3.348 a | 1.071 |
| R_TIM | 2.909 a | 1.208 | 2.071 b | 1.328 | 3.043 a | 1.186 |
| R_PRI | 3.152 a | 0.795 | 2.071 b | 1.269 | 3.087 a | 1.041 |
| R_EAT | 2.970 a | 0.847 | 1.857 b | 1.292 | 3.217 a | 0.998 |
| R_LOC | 3.121 a | 0.960 | 2.286 b | 1.204 | 3.261 a | 1.010 |
| R_VAR | 3.121 ab | 0.740 | 2.286 b | 1.490 | 3.304 a | 1.063 |
| Barriers | ||||||
| N_VAR | 3.030 a | 1.075 | 2.143 b | 1.167 | 2.913 a | 1.240 |
| N_QNT | 2.758 a | 1.001 | 1.857 b | 0.770 | 2.565 a | 1.343 |
| N_HH | 2.818 a | 1.103 | 2.286 a | 1.069 | 2.217 a | 1.413 |
| N_CST | 2.879 a | 1.023 | 2.357 a | 1.151 | 2.652 a | 1.191 |
| N_ORG | 3.030 a | 1.132 | 2.286 a | 1.383 | 2.957 a | 1.224 |
| N_PCK | 2.848 a | 1.034 | 2.357 a | 1.151 | 2.739 a | 1.287 |
| N_QLT | 3.061 a | 1.029 | 1.714 b | 0.825 | 2.696 a | 1.329 |
| N_STR | 2.788 a | 1.244 | 2.214 a | 1.122 | 2.783 a | 1.204 |
| N_FRM | 2.909 a | 1.128 | 2.429 a | 1.284 | 3.000 a | 1.044 |
| Information Source | ||||||
| S_WEB | 2.970 a | 1.015 | 2.214 b | 1.051 | 2.913 a | 1.276 |
| S_NWP | 3.091 a | 0.947 | 2.143 b | 1.099 | 2.739 ab | 1.251 |
| S_RDS | 2.879 a | 0.927 | 2.000 b | 1.109 | 3.000 a | 1.206 |
| S_FRN | 3.182 a | 1.014 | 2.071 b | 1.269 | 2.783 ab | 1.043 |
| Demographic | ||||||
| AGE | 33.455 a | 9.878 | 30.286 a | 9.579 | 37.913 a | 14.817 |
| EDU | 3.758 a | 1.062 | 3.357 a | 1.008 | 3.478 a | 1.082 |
| KIDS | 2.121 a | 0.927 | 1.714 a | 0.726 | 2.348 a | 1.301 |
| MALE | 0.727 a | 0.452 | 0.714 a | 0.469 | 0.652 a | 0.487 |
| INC | 9.023 a | 5.704 | 6.768 a | 4.169 | 6.620 a | 5.111 |
Note: Superscripts indicate if the pairwise comparison (using the Kruskal‒Wallis test) is significantly different (p < 0.05) or not. Values sharing the same superscripts mean that the pairwise comparison is not significantly different, and vice versa.
Table 6.
Statistics of Independent Variables for Participants with Different CSA Status in in model 2.
Table 6.
Statistics of Independent Variables for Participants with Different CSA Status in in model 2.
| Non-Member all the Time (y = 0) | Current and Future Member (y = 1) | Future Member Only (y = 2) | ||||
|---|---|---|---|---|---|---|
| Observation | 629 | 17 | 51 | |||
| Percentage | 90.24% | 2.44% | 7.32% | |||
| Mean | Std. Err. | Mean | Std. Err. | Mean | Std. Err. | |
| Motivation | ||||||
| R_ORG | N/A | N/A | 3.647 a | 0.786 | 3.373 a | 0.799 |
| R_EAC_ | N/A | N/A | 3.176 a | 0.951 | 2.725 a | 1.041 |
| R_SML | N/A | N/A | 3.353 a | 0.862 | 3.490 a | 0.644 |
| R_SUS | N/A | N/A | 3.588 a | 0.618 | 3.471 a | 0.612 |
| R_LCL | N/A | N/A | 3.471 a | 0.943 | 3.627 a | 0.528 |
| R_TIM | N/A | N/A | 3.235 a | 0.903 | 3.137 a | 1.114 |
| R_PRI | N/A | N/A | 3.471 a | 0.717 | 3.333 a | 0.739 |
| R_EAT | N/A | N/A | 3.176 a | 1.074 | 3.059 a | 1.085 |
| R_LOC | N/A | N/A | 3.471 a | 0.800 | 3.373 a | 0.871 |
| R_VAR | N/A | N/A | 3.412 a | 0.870 | 3.431 a | 0.728 |
| Barriers | ||||||
| N_VAR | 1.614 a | 1.240 | 2.471 b | 1.375 | 2.118 b | 1.381 |
| N_QNT | 1.566 a | 1.203 | 2.294 b | 1.404 | 1.882 ab | 1.291 |
| N_HH | 1.456 a | 1.182 | 2.000 a | 1.414 | 1.706 a | 1.390 |
| N_CST | 1.749 a | 1.303 | 2.647 b | 1.367 | 2.020 a | 1.288 |
| N_ORG | 1.598 a | 1.229 | 2.529 b | 1.625 | 2.039 b | 1.428 |
| N_PCK | 1.555 a | 1.201 | 2.000 ab | 1.458 | 2.059 b | 1.434 |
| N_QLT | 1.547 a | 1.178 | 1.824 a | 1.510 | 1.922 a | 1.369 |
| N_STR | 1.541 a | 1.173 | 1.882 ab | 1.409 | 2.059 b | 1.406 |
| N_FRM | 1.787 a | 1.339 | 2.412 a | 1.502 | 2.098 a | 1.360 |
| Information Sources | ||||||
| S_WEB | 1.857 a | 1.244 | 2.824 b | 1.334 | 3.157 b | 0.834 |
| S_NWP | 1.749 a | 1.217 | 3.000 b | 1.173 | 2.510 b | 1.271 |
| S_RDS | 1.820 a | 1.202 | 2.941 b | 1.144 | 2.902 b | 0.964 |
| S_FRN | 2.037 a | 1.270 | 3.235 b | 0.970 | 3.176 b | 0.817 |
| Demographic | ||||||
| AGE | 45.432 a | 18.583 | 34.412 b | 12.894 | 32.980 b | 13.447 |
| EDU | 3.248 a | 0.993 | 3.294 a | 0.849 | 3.157 a | 0.946 |
| KIDS | 1.688 a | 1.064 | 2.176 b | 1.074 | 2.314 b | 1.334 |
| MALE | 0.459 ab | 0.499 | 0.706 a | 0.470 | 0.333 b | 0.476 |
| INC | 6.327 a | 4.547 | 6.985 a | 4.874 | 5.353 a | 4.036 |
Note: Superscripts indicate if the pairwise comparison (using the Kruskal‒Wallis test) is significantly different (p < 0.05) or not. Values sharing the same superscripts mean that the pairwise comparison is not significantly different, and vice versa.
Table 7.
Results of the multinomial logit model.
| Model 1 | Model 2 | ||||
|---|---|---|---|---|---|
| Member All the Time is the Base | Non-Member All the Time is the Base | ||||
| Past MemberOnly (y = 1) | Past and CurrentMember (y = 2) | Current and Future Member (y = 1) | Future Member Only (y = 2) | ||
| Variable | Coefficient | Coefficient | Coefficient | Coefficient | |
| Motivation | Barriers | ||||
| R_ORG | −0.565 | −1.757 | N_VAR | 0.548 | 0.263 |
| −0.992 | −1.122 | (0.447) | −0.271 | ||
| R_EAC | −0.735 | −1.256 | N_QNT | 0.146 | −0.204 |
| −1.009 | −0.930 | (0.429) | −0.298 | ||
| R_SML | −1.579 | −0.979 | N_HH | −0.190 | −0.299 |
| −1.297 | −1.170 | −0.364 | −0.223 | ||
| R_SUS | −0.753 | −3.273 ** | N_CST | 0.705 * | −0.364 |
| −1.364 | −1.443 | −0.431 | −0.229 | ||
| R_LCL | 1.648 | 1.675 | N_ORG | 0.716 * | −0.009 |
| −1.293 | −1.230 | −0.396 | −0.269 | ||
| R_TIM | 0.115 | 1.248 * | N_PCK | −0.091 | 0.180 |
| −0.536 | −0.733 | −0.389 | −0.25 | ||
| R_PRI | −1.158 | −1.539 | N_QLT | −0.898 * | 0.076 |
| −0.878 | −1.017 | −0.484 | −0.287 | ||
| R_EAT | −0.223 | 1.322 * | N_STR | −0.014 | 0.501 |
| −0.830 | −0.807 | −0.464 | −0.324 | ||
| R_LOC | 1.825 | 3.240 ** | N_FRM | −0.330 | −0.378 |
| −1.361 | −1.585 | −0.373 | (0.238) | ||
| R_VAR | −0.540 | 0.586 | |||
| −0.778 | −0.912 | ||||
| Information Source | |||||
| S_WEB | 0.651 | 0.199 | −0.334 | 0.813 *** | |
| −1.000 | −0.770 | (0.362) | −0.250 | ||
| S_NWP | −0.039 | −1.083 * | 0.674 | −0.064 | |
| −0.764 | −0.664 | −0.410 | −0.179 | ||
| S_RDS | 1.000 | 3.361 ** | 0.456 | 0.445 ** | |
| −1.056 | −1.400 | −0.512 | −0.222 | ||
| S_FRN | −1.742 * | −2.585 ** | 0.336 | 0.384 | |
| −0.945 | −1.120 | −0.458 | −0.250 | ||
| Demographic | |||||
| AGE | 0.013 | 0.121 ** | −0.029 | −0.030 ** | |
| −0.061 | −0.061 | −0.023 | −0.014 | ||
| EDU | −0.171 | −0.576 | −0.011 | −0.075 | |
| −0.550 | −0.630 | −0.332 | −0.193 | ||
| KIDS | −0.533 | 0.710 | 0.225 | 0.231 | |
| −0.661 | −0.552 | −0.328 | −0.151 | ||
| MALE | 0.264 | −1.309 | 2.331 ** | 0.117 | |
| −1.324 | −1.329 | −0.819 | −0.383 | ||
| INC | −0.154 | −0.334 ** | 0.087 | −0.017 | |
| −0.149 | −0.140 | −0.070 | −0.050 | ||
| N= | 70 | 697 | |||
| Log Likelihood | −39.299903 | −158.22244 | |||
| P-value | 0.0024 | 0.0000 | |||
Note: *, **, and *** indicate significant at 10%, 5%, and 1% level of significance.
© 2019 by the authors. Licensee MDPI, Basel, Switzerland. This article is an open access article distributed under the terms and conditions of the Creative Commons Attribution (CC BY) license (http://creativecommons.org/licenses/by/4.0/).
Share and Cite
MDPI and ACS Style
Chen, J.; Gao, Z.; Chen, X.; Zhang, L. Factors Affecting the Dynamics of Community Supported Agriculture (CSA) Membership. Sustainability 2019, 11, 4170. https://doi.org/10.3390/su11154170
AMA Style
Chen J, Gao Z, Chen X, Zhang L. Factors Affecting the Dynamics of Community Supported Agriculture (CSA) Membership. Sustainability. 2019; 11(15):4170. https://doi.org/10.3390/su11154170
Chicago/Turabian StyleChen, Junhong, Zhifeng Gao, Xuqi Chen, and Lisha Zhang. 2019. "Factors Affecting the Dynamics of Community Supported Agriculture (CSA) Membership" Sustainability 11, no. 15: 4170. https://doi.org/10.3390/su11154170
Note that from the first issue of 2016, this journal uses article numbers instead of page numbers. See further details here.