Article

Contrasting Physiological and Environmental Controls of Evapotranspiration over Kernza Perennial Crop, Annual Crops, and C4 and Mixed C3/C4 Grasslands

by
Caitlyn E. Sutherlin
1,
Nathaniel A. Brunsell
1,
Gabriel de Oliveira
1,*,
Timothy E. Crews
2,
Lee R. DeHaan
2 and
Giulia Vico
3
1
Department of Geography and Atmospheric Science, University of Kansas, 1475 Jayhawk Blvd., Lawrence, KS 66045, USA
2
The Land Institute, 2440 East Well Rd., Salina, KS 67401, USA
3
Department of Crop Production Ecology, Swedish University of Agricultural Sciences, Ulls väg 16, Uppsala 75007, Sweden
*
Author to whom correspondence should be addressed.
Sustainability 2019, 11(6), 1640; https://doi.org/10.3390/su11061640
Submission received: 22 February 2019 / Revised: 8 March 2019 / Accepted: 9 March 2019 / Published: 19 March 2019
(This article belongs to the Section Sustainable Agriculture)

Abstract

:
Perennial grain crops have been suggested as a more sustainable alternative to annual crops. Yet their water use and how they are impacted by environmental conditions have been seldom compared to those of annual crops and grasslands. Here, we identify the dominant mechanisms driving evapotranspiration (ET), and how they change with environmental conditions in a perennial Kernza crop (US-KLS), an annual crop field (US-ARM), a C4 grassland (US-KON), and a mixed C3/C4 grassland (US-KFS) in the Central US. More specifically, we have utilized the omega (Ω) decoupling factor, which reflects the dominant mechanisms responsible for the evapotranspiration (ET) of the canopy. Our results showed that the US-ARM site was the most coupled with the lowest decoupling values. We also observed differences in coupling mechanism variables, showing more sensitivity to the water fluctuation variables as opposed to the radiative flux variables. All of the sites showed their lowest Ω value in 2012, the year of the severe drought in the Central US. The 2012 results further indicate the dependence on the water fluctuation variables. This was especially true with the perennial Kernza crop, which displayed much higher soil moisture values. In this regard, we believe that the ability of perennial Kernza to resist water stress and retain higher soil moisture values is both a result of its deeper roots, in addition to its higher Ω value. Through the analysis of both the site comparison and the comparison of the differences in years, we conclude that the perennial Kernza crop (US-KLS) is more similar in its microclimate effects to the C4 (US-KON) and mixed C3/C4 (US-KFS) grassland sites as opposed to its annual counterpart (US-ARM). This has implications for the role of perennial agriculture for addressing agricultural resilience under changing climate conditions.

1. Introduction

The changing climate has led to issues surrounding the sustainability of certain agricultural resources, and has raised concerns about future food security [1]. These changing climate conditions are accompanied by an increasing global population, which is projected to reach 9 billion by 2050 and 11.2 billion by 2100 [2,3]. At this current population growth rate, an additional 1 billion hectares of land will need to be converted to agricultural use to meet projected food demands [4].
The conversion of natural ecosystems to agriculture involves changes to the microclimate [5,6]. As we move from a natural land area to cropland, there will be an alteration of albedo, increased solar radiation hitting the ground, and an increase in surface temperature and corresponding increase in emitted thermal infrared radiation at night. These changes in ground temperature and heating will alter the turbulent characteristics, which will alter the water (i.e., evapotranspiration (ET) and soil moisture) and carbon fluxes (i.e., net ecosystem exchange (NEE)). Essentially, as we move from a natural ecosystem to cropland, we can expect to change from a system where local canopy structure primarily determines the microclimate to a system in which the microclimate of the canopy is more dictated by larger scale processes [7].
Several studies argue that food security needs to include agroecological approaches, such as the utilization of perennial agriculture [8,9]. Currently, approximately two-thirds of global croplands correspond to annual crops [10,11]. Recent work has shown that perennial agriculture provides a general increase of multiple key ecosystem services in comparison with annual food cropping systems. Perennials characteristically have more ground cover, longer growing seasons, have minimized nutrient leaching, sequester more carbon in the soils, and provide continuous habitats for different wildlife [12,13]. Miscanthus, a perennial grass, has 61% greater annual solar radiation interception efficiency by the plant canopy with 59% greater biomass when compared to an annual maize canopy [3]. Perennial crops are also able to make use of degraded or marginal lands, reduce erosion, and be grown on highly erodible surfaces [4,14]. In addition, perennial plants do not have to be replanted every year, resulting in reduced fertilizer and tillage use [9].
Considering that 10 of the 13 most grown grains or oilseed crops are capable of being hybridized with perennial relatives, including rice, rye, sorghum, sunflowers, and wheat; this has significant implications for the future of global food security [3]. To date, limited research has been conducted in relation to the coupling between these ecosystems and the atmosphere. Here, we examine the interactions between a perennial Kernza intermediate wheatgrass [15,16,17] and the local microclimate and the relative control on the local environment. More specifically, we have utilized the omega (Ω) decoupling factor [18], which reflects the dominant mechanisms responsible for the ET of the canopy. If the canopy is completely coupled to the environment (Ω = 0), then the saturation deficit at the leaf surface is not affected by vapor and heat fluxes, and this saturation deficit is equal to the air outside of the leaf in its boundary layer. ET is then controlled by soil water fluctuations and, thus, stomatal conductance. If the canopy is completely decoupled from its microclimate (Ω = 1) the ET is controlled by the radiative environment and net radiation (Rn). In this case, ET is not affected by stomatal conductance, meaning that a canopy is not directly in control of its water loss. Jarvis and McNaughton [18] provided an example of a coupled plant that experienced a reduction in transpiration by ~1/3 due to water stress which resulted in a 5-fold increase in stomatal resistance. If soil moisture is decreasing, a canopy will experience a larger saturation deficit as the stomata closes to retain water. Therefore, a canopy may be at a greater advantage in situations of water stress if it is less decoupled, since these changes in transpiration will not be driven by stomatal conductance. Some examples of studies analyzing Ω over agricultural areas are Steduto and Hsiao [19], Oguntunde [20], Marin et al. [21], and Spinelli et al. [22].
Perennial grain crops have been suggested as a more sustainable alternative to annual crops. Yet their water use and how it is impacted by environmental conditions have been seldom compared to those of annual crops and grasslands. Here, we identify the dominant mechanisms driving evapotranspiration (ET), and how they change with environmental conditions in a perennial Kernza crop (US-KLS), an annual crop field (US-ARM), a C4 grassland (US-KON), and a mixed C3/C4 grassland (US-KFS) in the Central US. More specifically, we have utilized the omega (Ω) decoupling factor, which reflects the dominant mechanisms responsible for the evapotranspiration (ET) of the canopy. We hypothesize that the perennial crop will have an Ω value that is more similar to the grassland sites, rather than the annual cropland. By increasing our knowledge of the interactions between perennial systems and their environments, we will be able to further our understanding of the potential implications for implementing perennial agriculture worldwide.

2. Materials and Methods
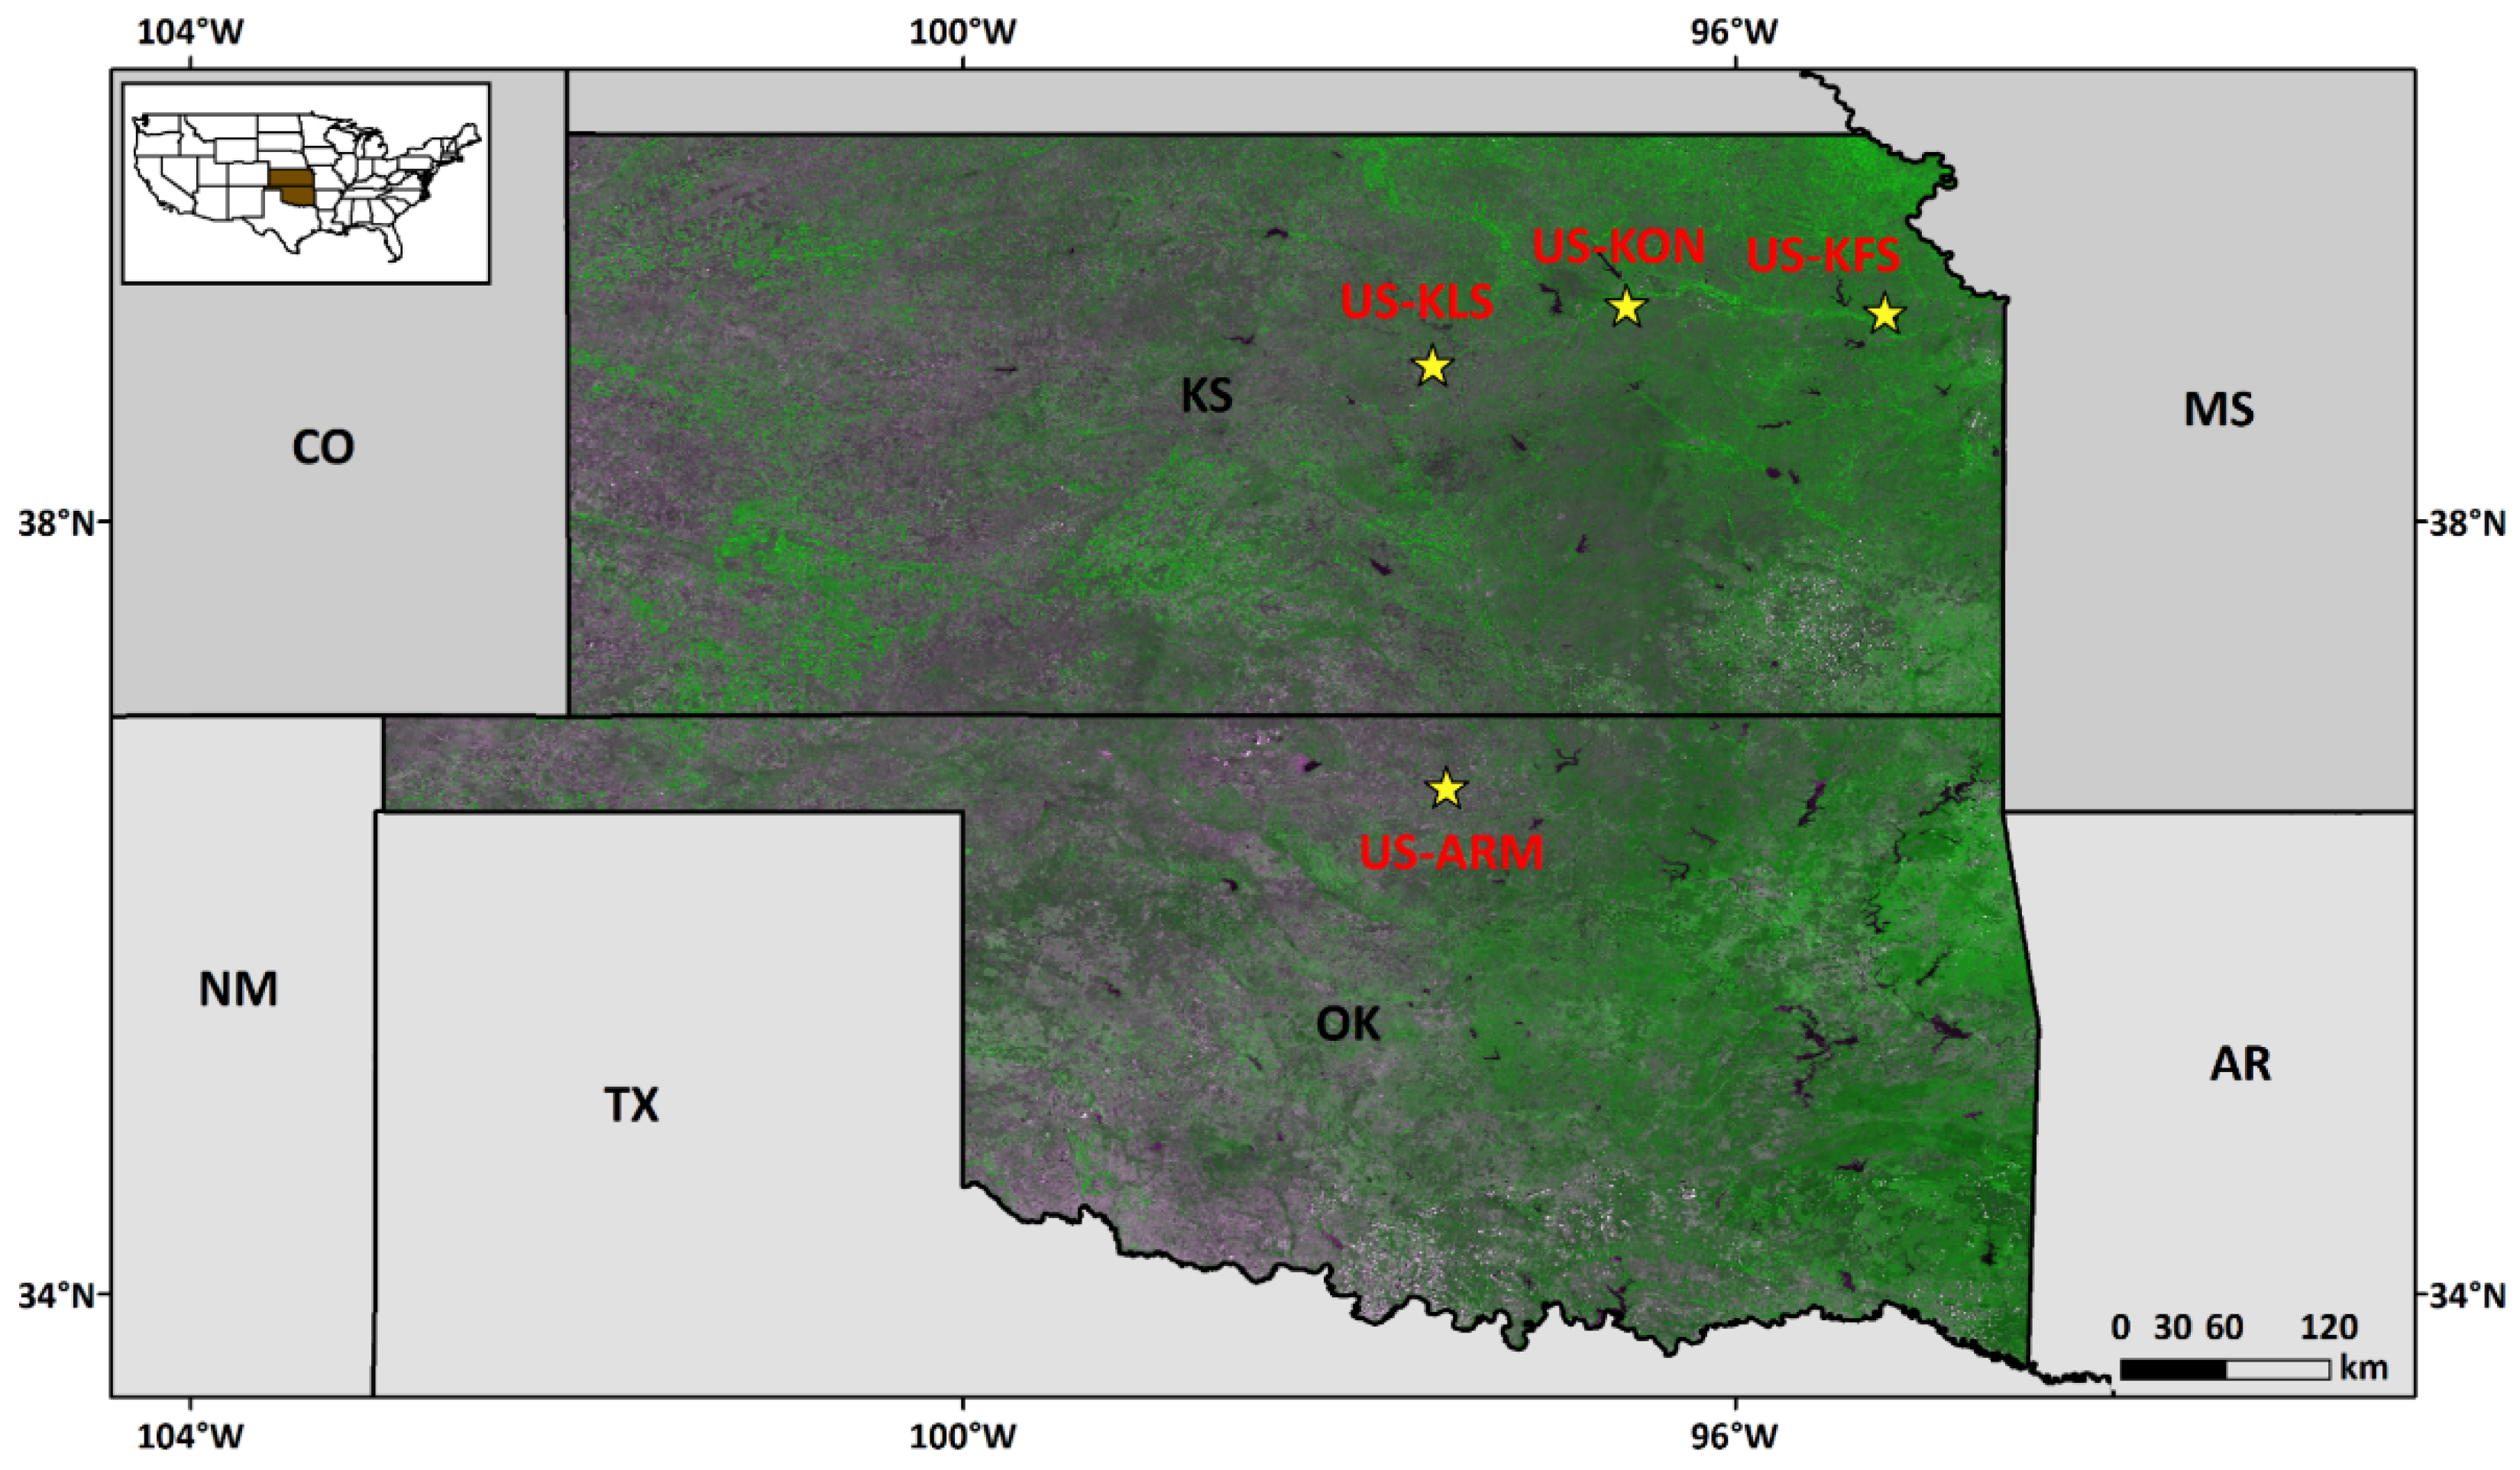
2.1. Sites

We used data from three AmeriFlux sites located in Kansas (US-KLS, US-KON, and US-KFS) and one site located in Oklahoma (US-ARM) (Figure 1). We chose these sites to (1) compare the Ω values and the dominant controlling mechanisms between an annual cropland, perennial cropland, and two different grasslands and (2) examine certain large-scale regional processes that would be experienced by all of them (i.e., the 2012 drought). The methodology applied to process the high frequency data follows standard AmeriFlux processing and is described in Brunsell et al. [23]. Corrections on the 10 Hz data included despiking, frequency response corrections, and sonic temperature-sensible heat flux corrections. Quality control filtering was performed following the methodology outlined in Hammerle et al. [24]. The gaps in the site measurements were filled using the marginal distribution sampling (MDS) method [25]. Fully processed half-hourly data were aggregated into daily, monthly, and annual periods according to AmeriFlux standardized methods [26]. The time series of fluxes were computed for diurnal (24-h) and daytime (9 a.m. to 3 p.m.) periods, varying according to the type of analysis necessary for each variable.
The eddy covariance tower at the Kernza site (US-KLS) was implemented in 2012 [17]. The site is installed in the Smoky Hills Region, which consists of natural prairie vegetation and row crop agriculture [27]. In this analysis, we used data from 2012 to 2016. This was compared against the US-KON site at the Konza Prairie Biological Station (KPBS) in Manhattan, Kansas [28]. We used data for this site from 2008 to 2015. US-KON is a C4 natural grassland that is burned on an annual basis. We also used US-KFS, which is a C3/C4 mixed grassland that was previously agricultural land at the Kansas Field Station outside of Lawrence, Kansas. We used data for this site from 2008 to 2015. Our final site was US-ARM in Lamont, Oklahoma [29]. This is an annual crop site. The tower is positioned over a field that rotates between winter wheat, corn, soy, and alfalfa. We used data for this site from 2008 to 2014. All the stations were active in 2012 and 2013, and were characterized by extreme and different conditions. In particular, we note that in 2012 the central U.S experienced one of the most severe droughts in the past 80 years [30,31].

2.2. Calculation of the Decoupling Coefficient

As previously mentioned, we used the Jarvis and McNaughton [18] approach to calculate Ω:
Ω = 1 1 + ( Γ / Δ + Γ ) ( r c / r a )
where Γ is psychometric constant [kPa T−1], Δ is the slope of saturation vapor pressure versus temperature [kPa T−1], and rc and ra are the stomatal and aerodynamic resistance (s m−1), respectively.
In addition to this equation, we utilized the total transpiration rate (E) equation, also from Jarvis and McNaughton [18], to interpret the dominant controlling mechanisms for the land–atmosphere coupling occurring:
E = Ω E e q + ( 1 Ω ) E i m p
where Eeq is the equilibrium evapotranspiration rate that is controlled by radiative effects and Eimp is the imposed evapotranspiration rate that is controlled by water fluctuations.
We note that it was not possible to calculate Ω for all the years (2008–2016) at the four sites. This occurred due to the existence of gaps or absence of measurements necessary to calculate Ω according Equations (1) and (2).

2.3. Desing of Research

Two different sets of comparisons were made. The first is the site to site comparison. This included the mean of the daylight hours for each site over all of the years with observations. This was done to understand the relationship between different biophysical variables and types of vegetation at the four sites and how they affect the Ω values. The next comparisons conducted were the annual fluctuations for each site. This also took the mean of the daylight hours for all of the days in a given year. The annual fluctuations were monitored for two reasons. The first was to allow for any observations of major differences in trends between the sites. The second was to examine the role of the 2012 drought on the nature of the coupling between the different land cover types and the atmosphere.
A parametric t-test was used in order to compare variation among the biophysical variables. In this analysis, a t-value was generated and statistical significance for the differences between and within groups was established at the probability level of 0.01.

3. Results and Discussion

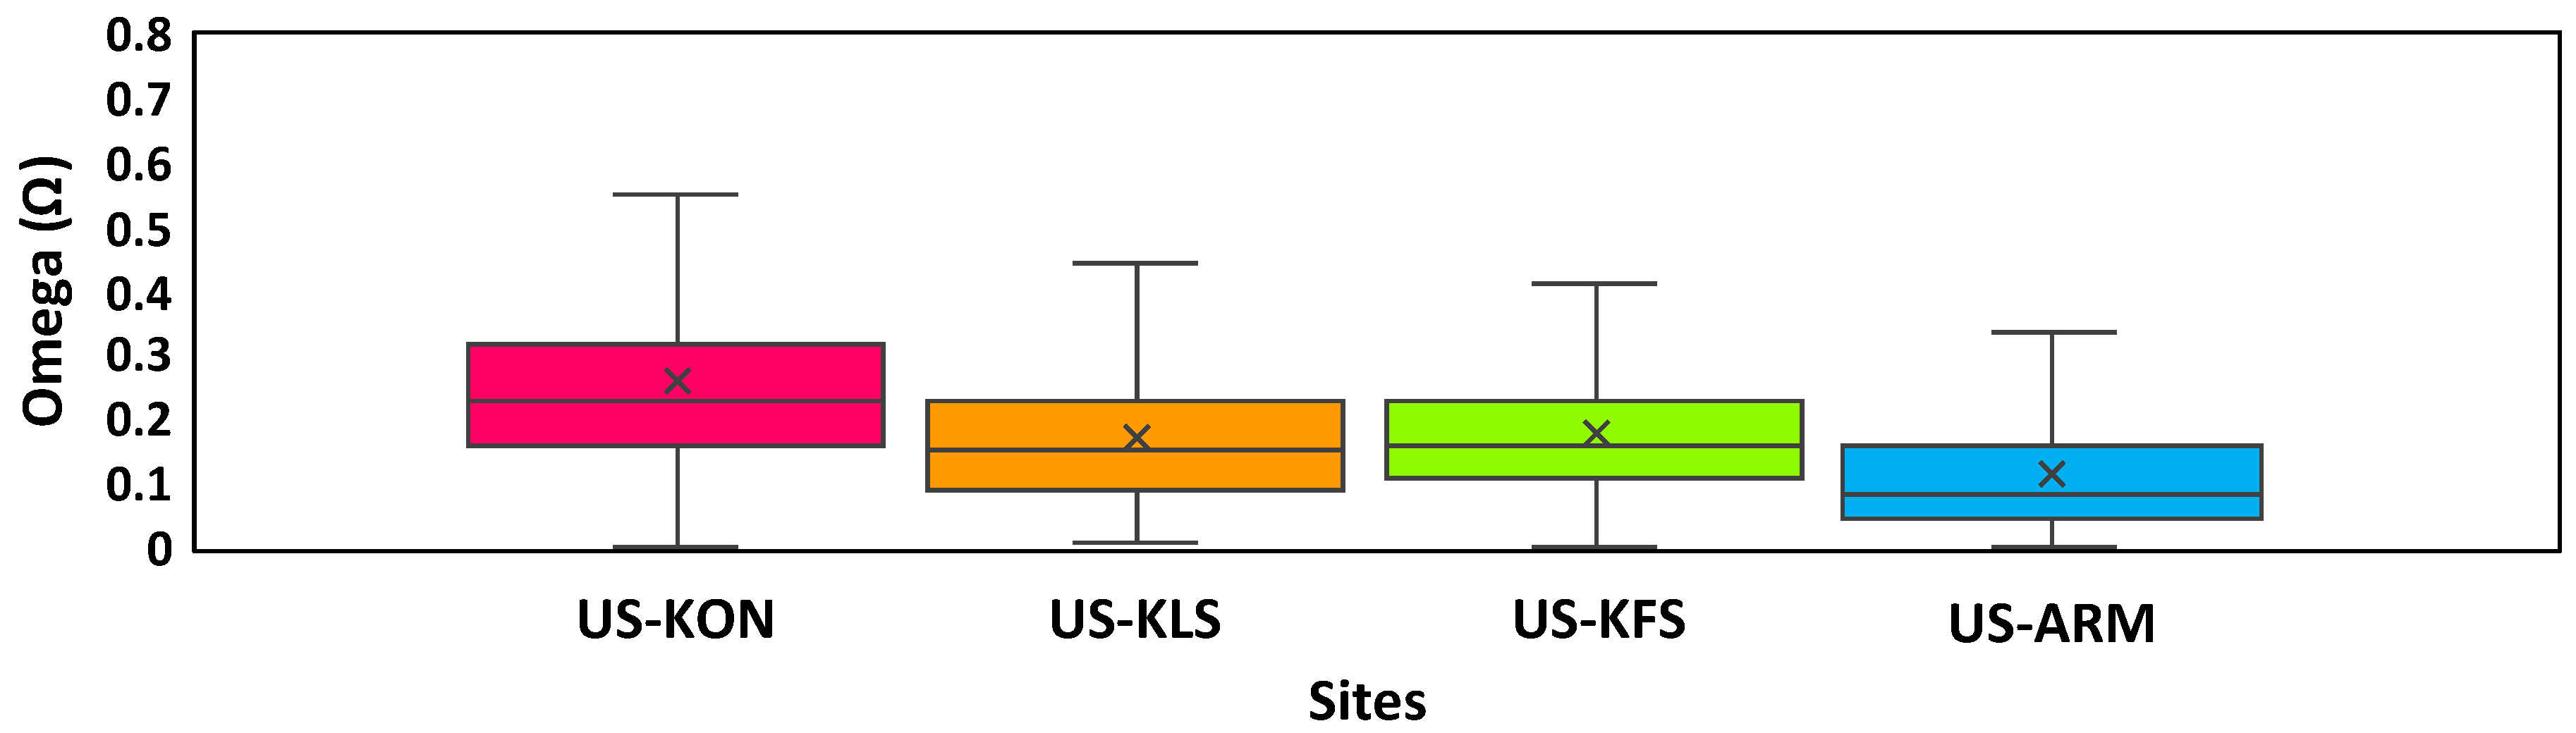
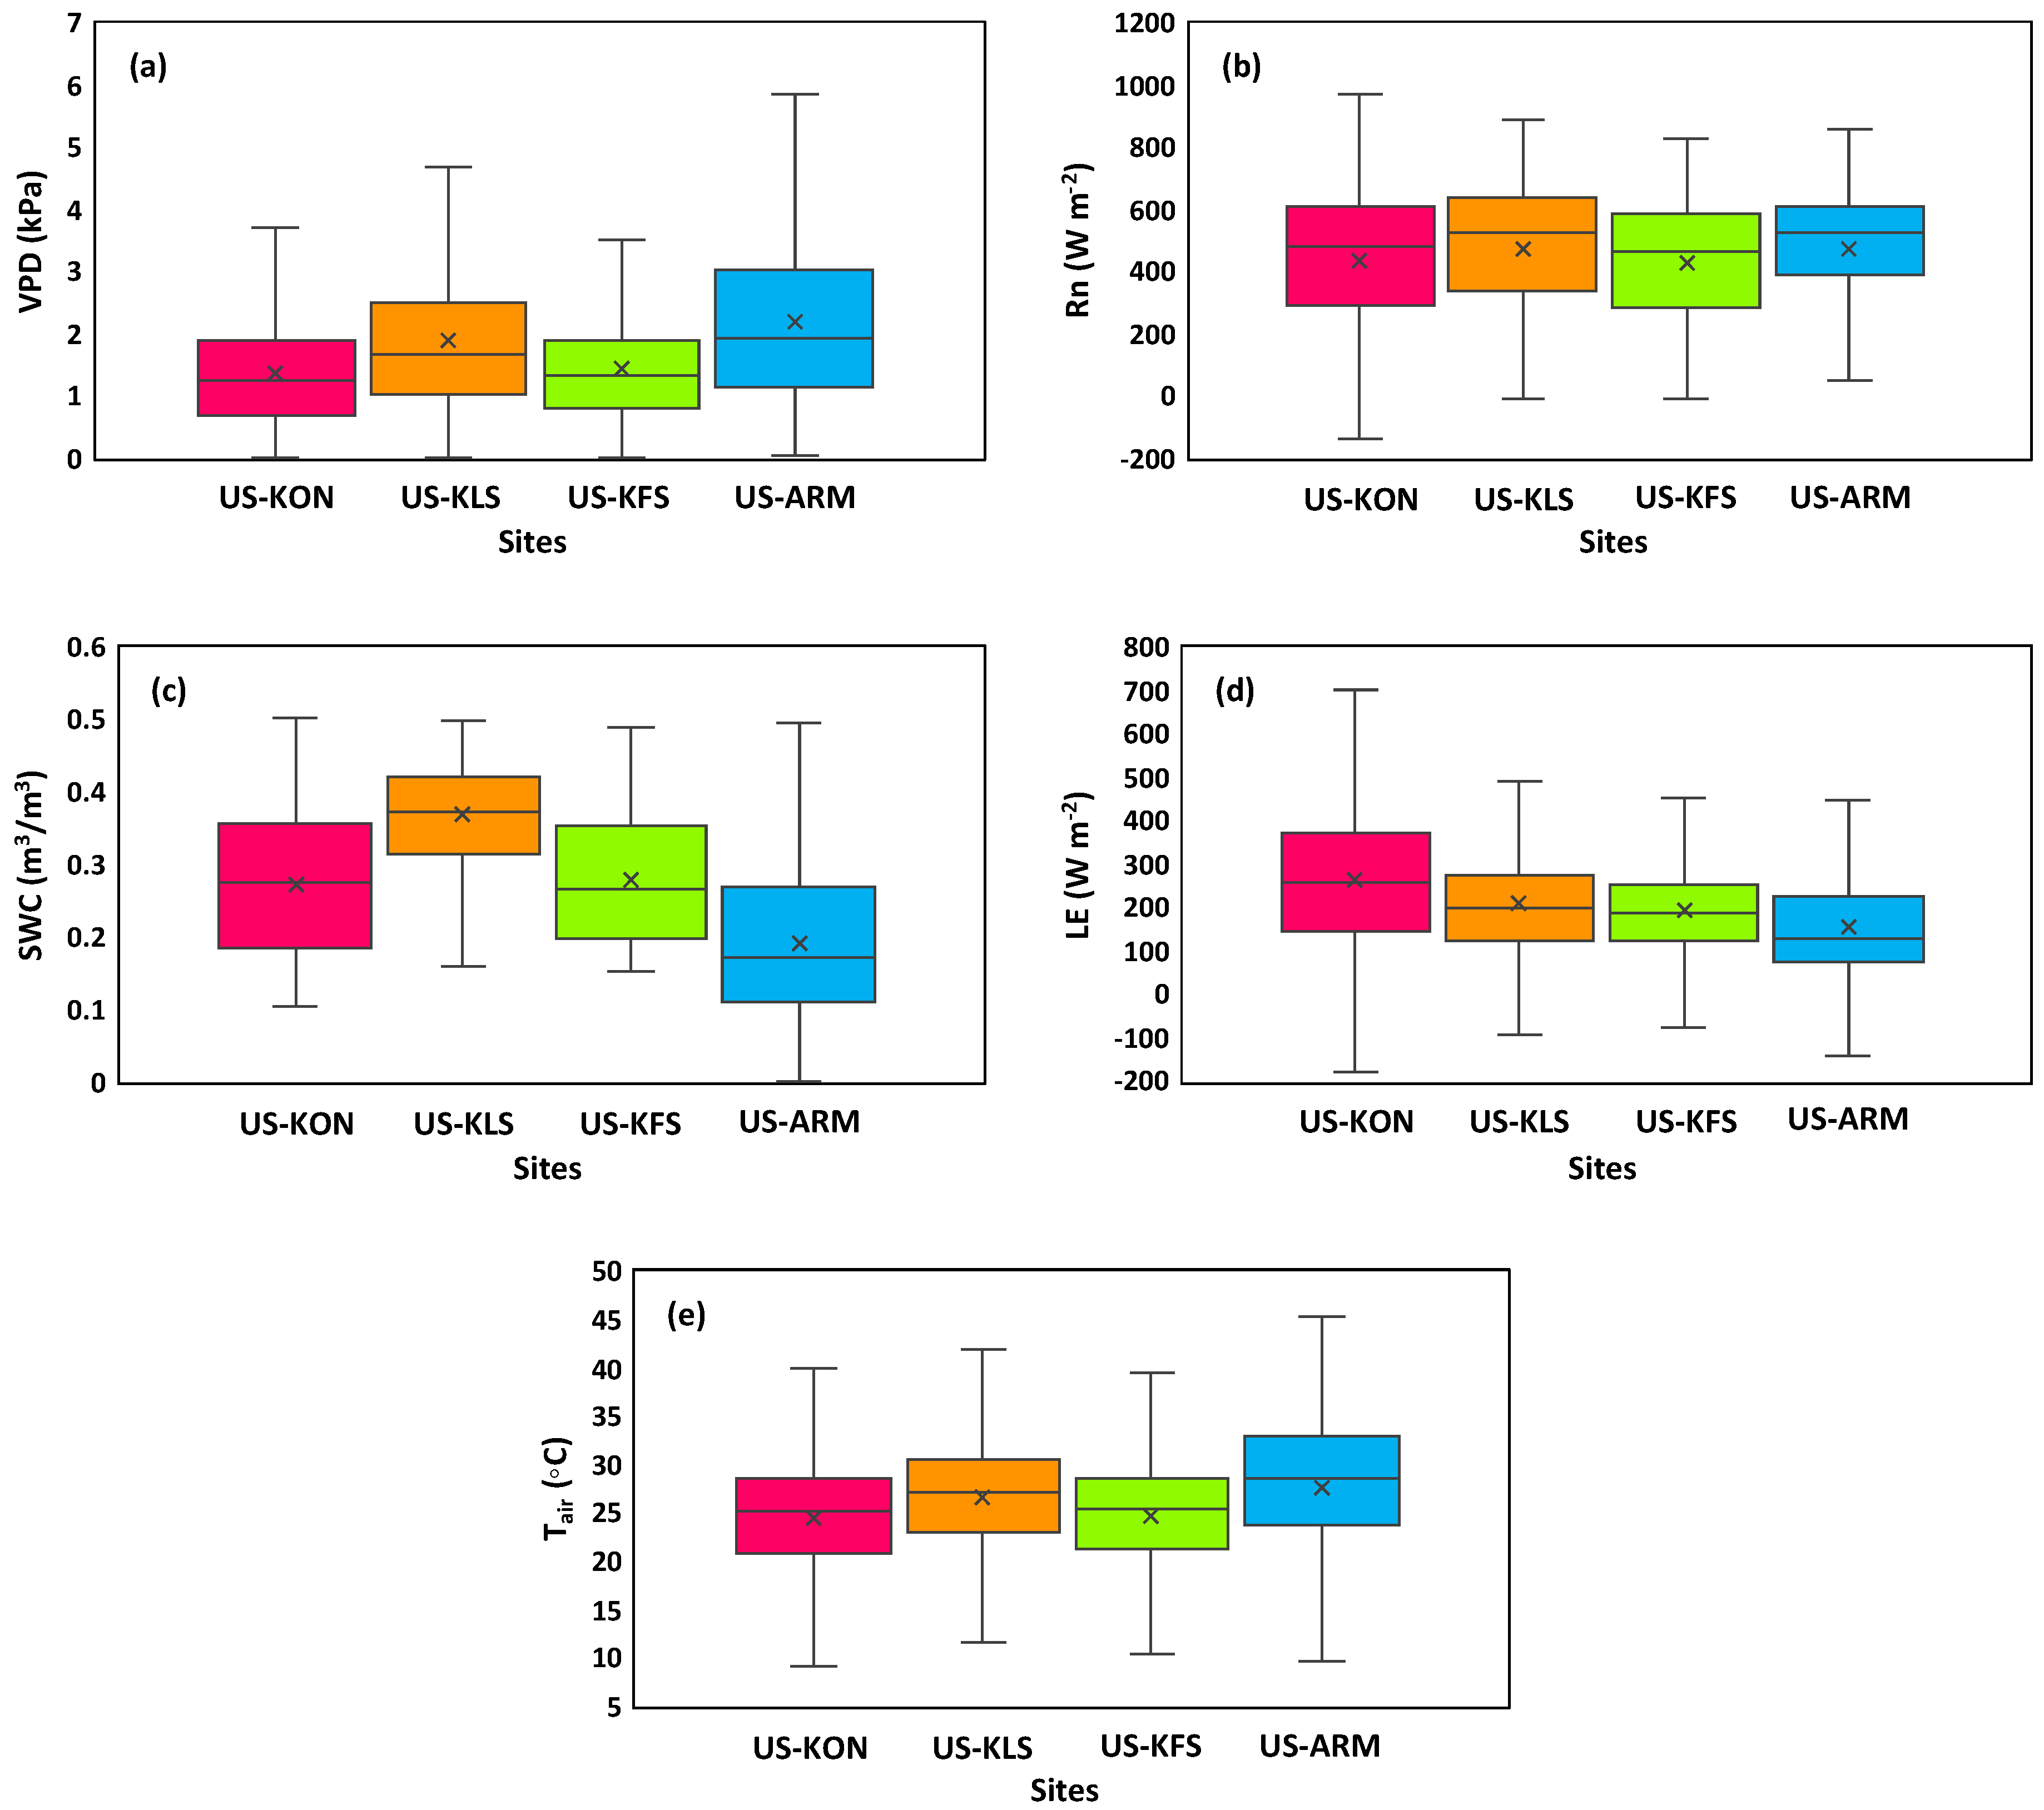
3.1. Site Comparisons

We observed very low decoupling value in US-ARM, and thus stronger coupling at this annual crop site (Figure 2). US-KLS and US-KFS seem to have very similar coupling values, with both of their medians being ~0.2. Research has shown that perennial agroecosystems function more like natural grasslands and thus the results obtained here seem to coincide with our original hypothesis that US-KLS would be more similar to natural grasslands as opposed to the annual cropland [32,33].
In Figure 3 it is possible to observe how the environmental conditions (expressed by vapor pressure deficit (VPD), soil water content (SWC), latent heat flux (LE), net radiation (Rn), and air temperature (Tair)) affect the land–atmosphere coupling. We observe that patterns in Rn and Tair are similar across sites. The median for each site falls within the interquartile range of all of the other sites. Therefore, we see no real differentiation between sites and vegetation type in the radiative fluxes (Rn and Tair). We do, however, see noticeable differences from site to site in the water fluctuation variables (VPD, SWC, and LE). This is especially true when looking at SWC, where US-KLS has much higher soil moisture amounts than the other sites, which is to be expected from the deeper roots associated with the Kernza crop [17]. LE displays a slight decrease as we move from completely natural grassland to annual crop (from left to right). VPD displays an opposite behavior, as expected. VPD is the gradient for the amount of LE occurring as a result of atmospheric demand.
Statistical analyses of the fluctuation variables are shown in Table 1 and Table 2. We see a decrease in Ω as VPD, Tair, and Rn increase. An increase in SWC and LE corresponds to an increase in Ω. However, the water flux variables explain the Ω values by approximately 17% more than the radiative flux variables. Both SWC and LE have a positive correlation with Ω, thus resulting in more decoupling as they increase. Since all of these factors prove to be statistically significant, this demonstrates the relationship between water availability and the degree of coupling occurring in the microclimate. As VPD increases, there is an increase in coupling. Rn was not as significant at affecting Ω as Tair. However, the R2 values for the two sets of atmospheric coupling variables illustrates that the water fluctuation variables have an adjusted R2 of 0.46, whereas the radiation variables only display R2 values of ~0.03. However, it is important to note that the residual standard error of these fluctuation variables is 0.13 as opposed to 0.08 with the water fluctuation variables. These values still do not surpass the R2 of the water fluctuation variables, indicating the dominating force of the water fluctuation variables in these specific sites, which is expected considering they are all relatively short vegetation and thus generally more coupled. These findings illustrate the importance of water in the coupling of a site to its microclimate. In this regard, we suggest that further studies must be conducted to evaluate differences in the water-use efficiency patterns among perennial and annual agroecosystems. This would help to better elucidate the resilience of contrasting agricultural ecosystems considering changing climate conditions.

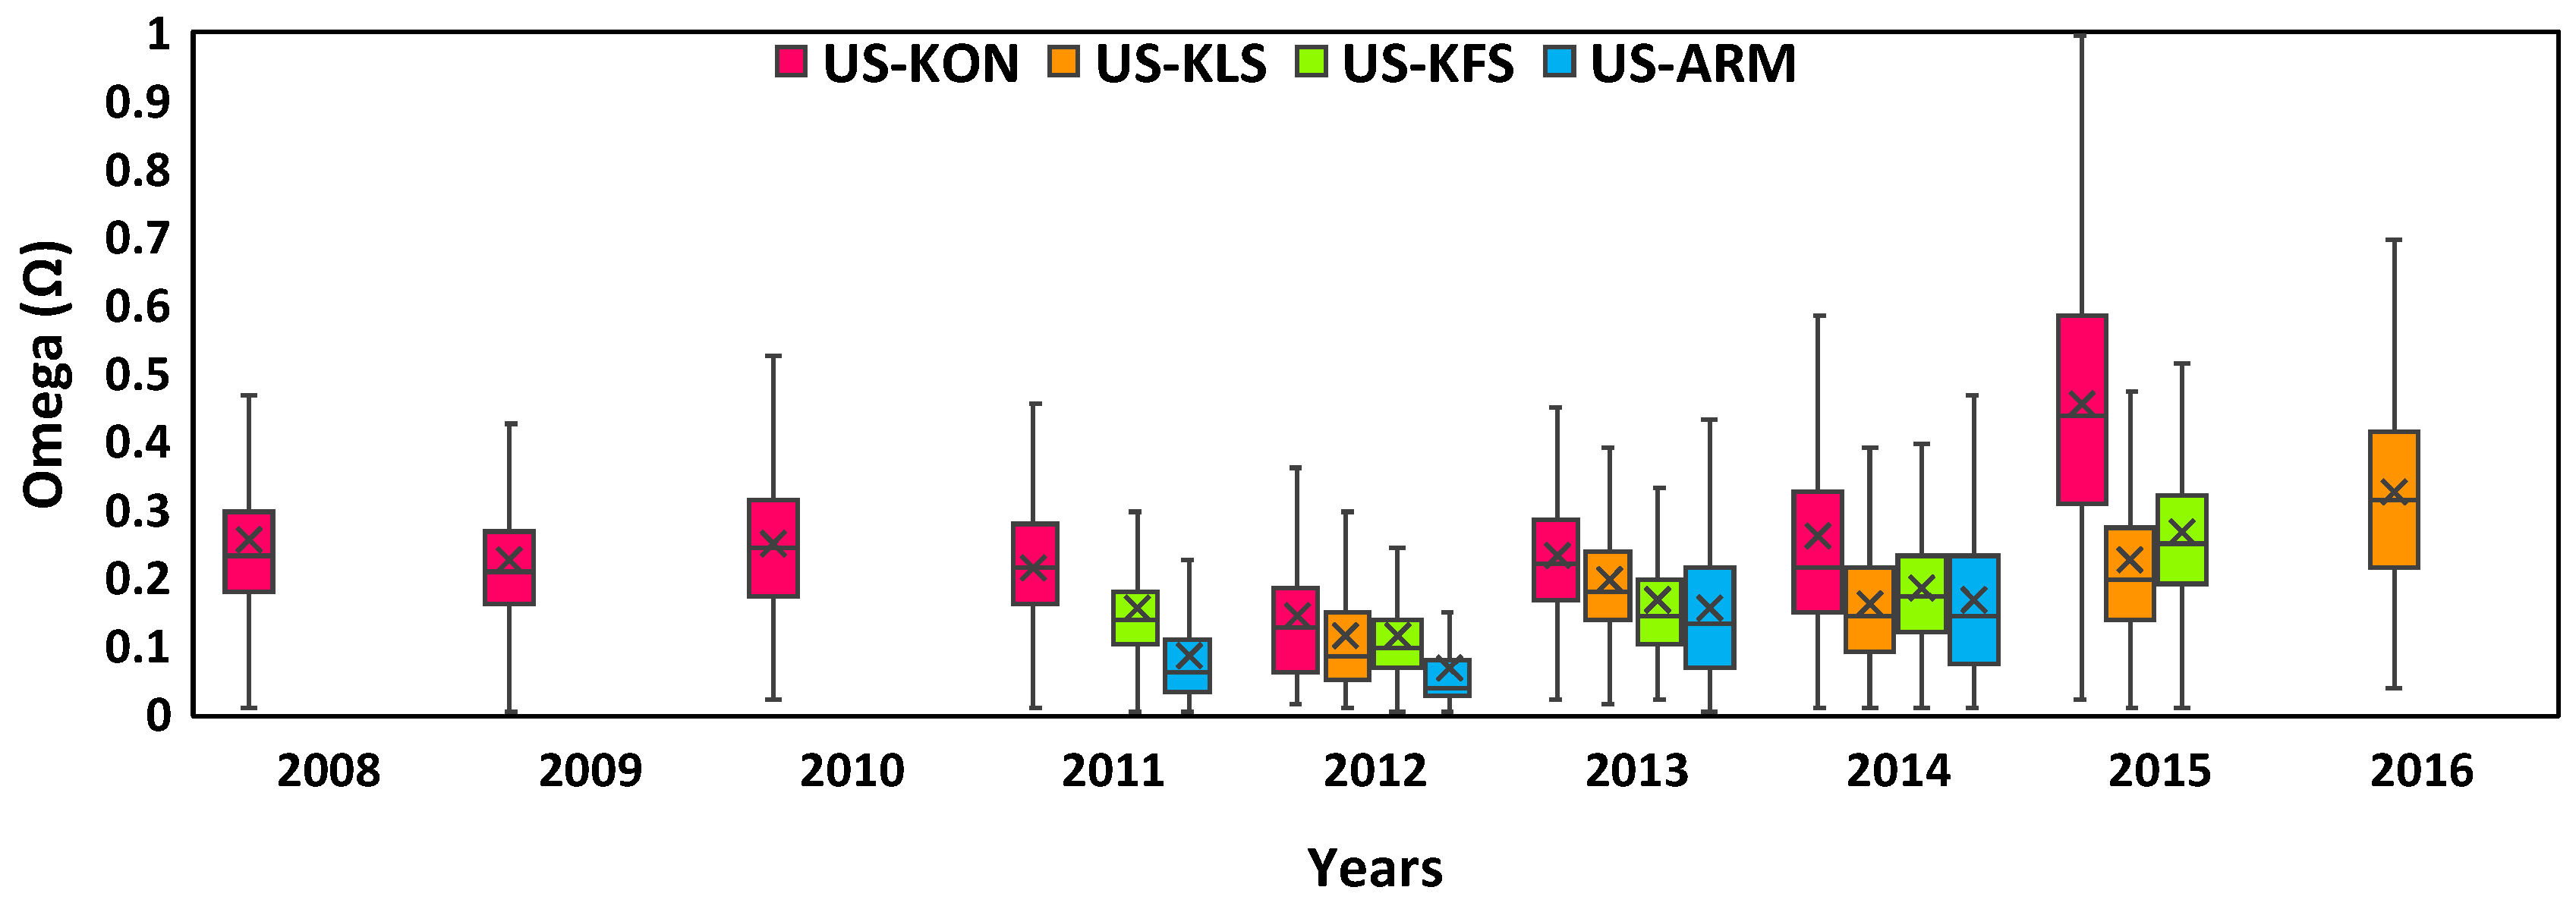
3.2. Annual Fluctuations

All of the sites were most coupled during 2012, the year of the severe drought for the Central U.S (Figure 4) [30,31]. After 2012, we see a steady increase in Ω, as the sites become more decoupled with less water stress. These fluctuations also follow similar trends from year to year. There are no significant differences between the sites in their annual fluctuations. We focus further analysis on the water fluctuation variables since we observed a higher coupling at each site as a result of water stress, and differences in SWC and ET and the radiative fluxes did not differ from site to site (Figure 2).
There are important differences between the sites in terms of SWC (Figure 5). Most notably, we highlight the increased SWC in US-KLS versus other sites in 2012. All sites experienced a reduction in SWC due to 2012 drought. US-KON, US-KFS, and US-KLS showed large increases in SWC in the years after 2012. On the other hand, US-ARM showed a much slower increase in the years proceeding 2012. As expected, we observed that all sites had the highest VPD in 2012. The median VPD varied from 2 to 4 kPa (Figure 6). We also noted that US-KFS had the lowest ET rates overall at roughly 200 W m-2 versus the 300 W m−2 at the other sites (Figure 7).
After examining the correlation of the water fluctuation variables with the Ω values, we wanted to examine the strength of the relationship amongst the four sites (Table 3 and Table 4). US-KLS shows an R2 value of ~0.53; all three of the variables are significant. An increase in LE correlates to the occurrence of more decoupling (as a result of less water stress). We would expect an increase in VPD to correlate to stronger coupling. However, it is interesting to note that an increase in SWC is correlated to stronger coupling, which has so far been associated with more water stress. We acknowledge that the actual contribution is small; however, we find this pattern worthwhile to investigate since perennial crops are reliant on the soil moisture accessed by their roots. The same trends are present in the US-KFS site, but with smaller R2 values, and therefore less of a relationship between this set of variables and Ω. At US-KON, the same trends are once again observed, with more of the Ω value being explained by the water fluctuation variables. However, an increase in soil moisture is not correlated to an increase in coupling at this site. At US-ARM, the same trends exist as they did when we were looking at all of the sites combined. LE increases are related to more decoupling, VPD increases are related to more coupling, and SWC increases are related to more decoupling. The adjusted R2 values are more similar to that of US-KLS.
Since we observed similar trends from site to site, we believe that the more specific differences in numbers are a result of actual site, and therefore vegetation differences. This is also supported by the relatively low Ω values in each site, indicating that the sites are more coupled with their microclimate, rather than each of them being controlled by local more large-scale differences [18]. However, in a study developed by Khatun et al. [34], Ω values similar to the ones we have obtained here were observed. The different Ω values were explained by differences in environmental and vegetation structural attributes, rather than actual differences in vegetation type. It was also observed that Ω was more controlled by aerodynamic resistance and surface conductance rather than stomatal conductance.

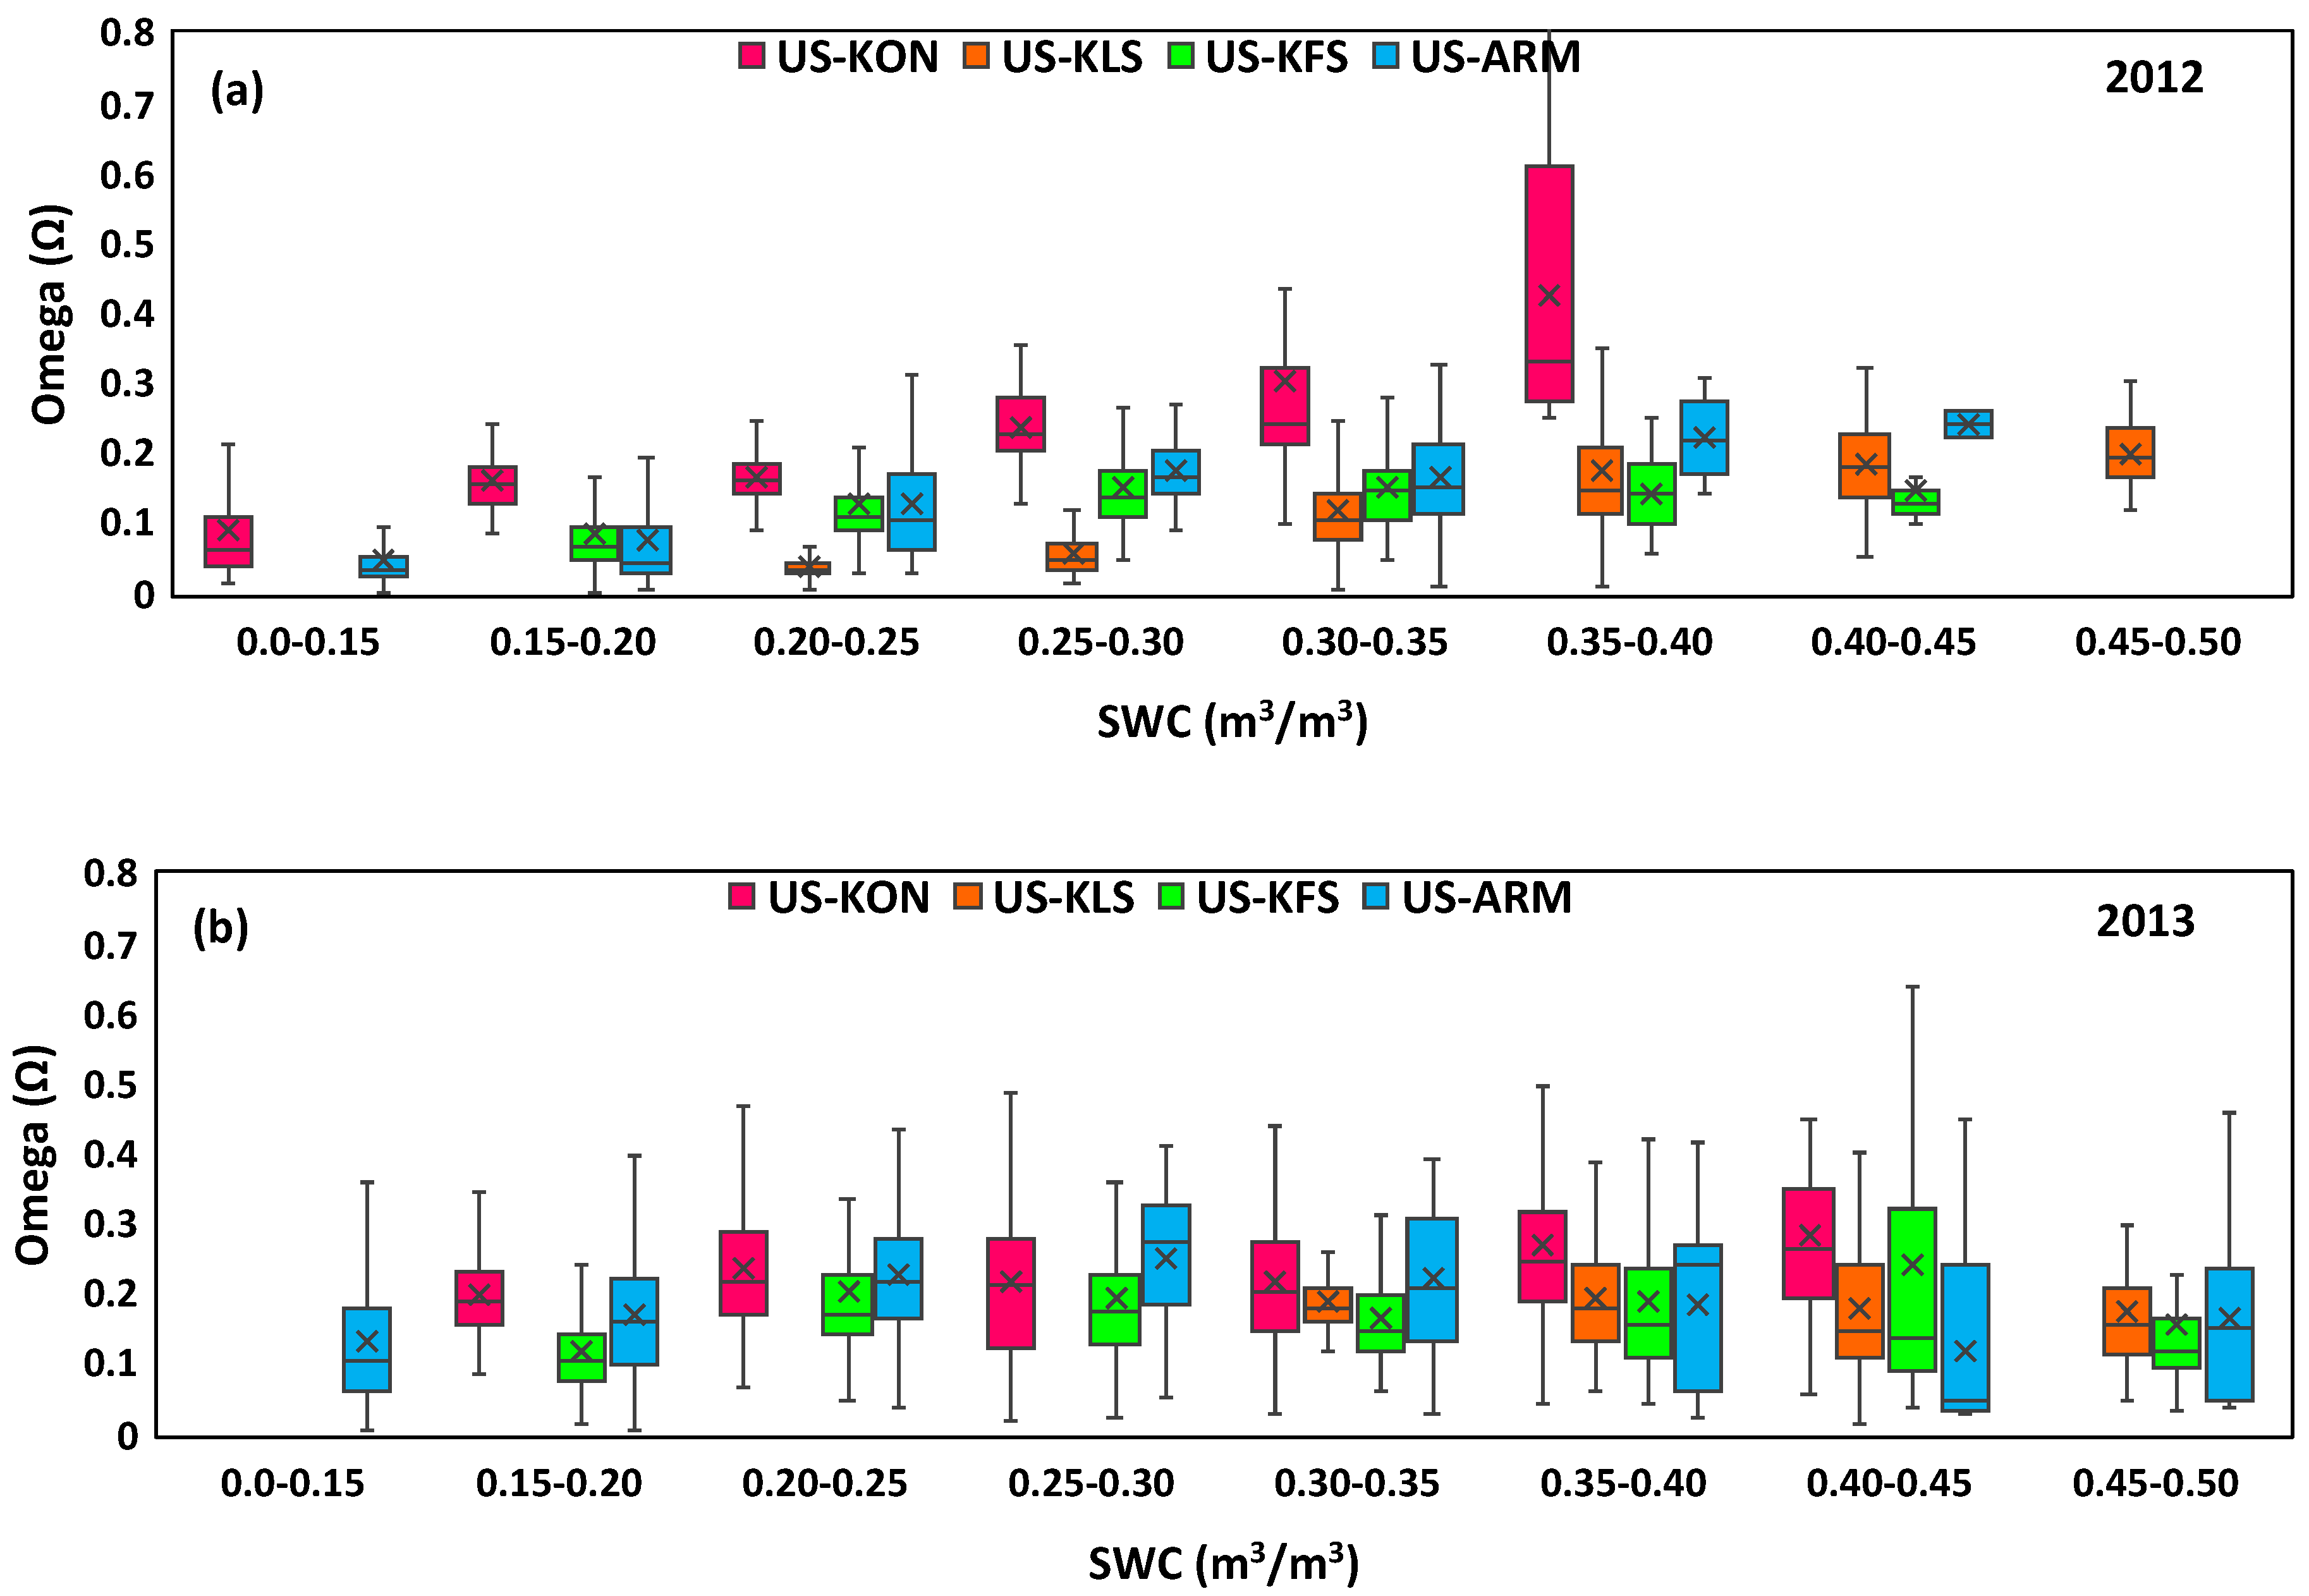
3.3. Water Fluctuation Effects

Next we wanted to examine the impact of a wet (2013) and dry (2012) year on the coupling between the surface and the atmosphere. We did this by examining the correlation between Ω and VPD in the two years. We observed small coupling coefficient values occurring at all of the sites during 2012, and a negative correlation between the two variables, suggesting that Ω decreases (i.e., coupling increases) as VPD increases (Figure 8). 2013 displays these same patterns with more scatter between the different sites. Regarding the correlation between Ω and SWC, we also observed small coupling coefficient values in 2012, with significant site variation (Figure 9). US-KLS site advantage, in terms of soil moisture, is especially apparent here. As SWC increases, this decoupling increases. The same trends exist in 2013, with once again more scatter, like we observed in VPD in 2013. Jarvis and McNaughton [18] also observed this increasing coupling as a result of water stress since canopies with more coupling are going to be more controlled by stomatal conductance and thus water fluctuations. Khatun et al. [34] have also found this increased coupling as a result of water stress, and therefore we believe a less coupled canopy may be more resilient during periods of water stress.
Overall, the results are indicative of a heavy reliance of Ω on soil moisture. There is a correlation of increased water stress with increased coupling (decreasing Ω). However, rather contradictory to our findings is the increased coupling found in US-KLS and US-KFS with an increase in soil moisture (Table 3). We are aware that Kernza specifically has increased ET, and is more resilient in water stress years due to its deeper rooting system [17]. In spite of that, our results show that US-KLS, US-KFS, and US-KON were more decoupled from US-ARM as a natural defense against water stress, being more controlled by radiative fluxes, rather than actual stomatal conductance. However, this coupling increases with US-KLS and US-KFS as soil moisture increases. US-ARM does not show the same pattern, which brings us to question the more resilient nature of natural grasslands and perennials in these water stress situations.
Several studies have looked at the rooting systems and growing seasons of both grasslands and perennial crops. Many of these studies have found that higher biomass production causes an expanded growing season, and deeper roots of these perennial crops results in increased water consumption when compared to annual crops and ultimately a decrease in groundwater recharge [35,36,37]. This is consistent with our findings of an increasing ET as we move from an annual cropland to a completely natural C4 grassland (Figure 3). While this increased ET results in increased carbon storage within these canopies, these deeper rooting systems may actually be a long-term hindrance to avoiding water stress. There is an increasing soil water deficit as a result of this increased biomass production associated with greater soil water access in times of drought [37,38]. Ferchaud et al. [37] found that semiperennials, such as alfalfa, consistently had less soil water content than annual crops like sorghum and triticale. It was also found that even the natural C4 grasses (miscanthus and switchgrass) had minimal soil moisture that was either lower than or equal to that of the annual crops. While miscanthus, switchgrass, alfalfa, and fescue (another semiperennial) all had the ability to uptake soil moisture from deep layers; miscanthus and switchgrass were able to avoid increased soil water depletion due to a lower soil water deficit near the surface as a result of decreased soil evaporation. Our results support this as we see the US-KON (C4 grassland) resulting in more decoupling as soil moisture is increasing, whereas US-KLS (perennial cropland) and US-KFS (former cropland) are actually resulting in stronger coupling (Table 3).
Eichelmann et al. [39], focusing on the relationship between ET and SWC over a switchgrass field in a situation of moderate drought, found no signs of water stress, with ET values even exceeding that of values observed in wetter, more average condition years. According to the authors, this occurred due to the increased soil water access. It is important to note that this soil water access was not only due to the depth of the roots of the crops, but the increasing infiltration rates and field moisture capacity under switchgrass cultivation. This was correlated to short-term drought mitigation benefits of perennial switchgrass cultivation. Abraha et al. [36] observed the influence of soil water that is stored before the growing season and found no short-term changes in the water cycle in a row crop to perennial crop conversion. We emphasize the importance of a short-term timescale here. Both of these studies concluded that this long-term reliance on soil moisture access could lead to soil water depletion and, therefore, that it is not providing a long-term solution to the increasing frequency of droughts that are expected to occur across large portions of North America in the upcoming years.
Growing season differences may also help to explain the discrepancies observed in the natural grassland and perennial crop sites compared to the annual cropland site. In relation to the effects and consequences of a deeper rooting system, increased growing seasons for these canopies influences the root growth rates [40]. While some annual crops may have deeper roots, these roots have less time to take up the same amounts of water than shallow roots may be able to. Ferchaud et al. [37] found that not only were these annual crops falling behind in water withdrawal at depth due to decreased root density as a result of decreased periods of growth, but these decreased growing periods prevented further water extraction due to a lack of time between root arrival and the crop’s maturity. CO2 exchange and biomass production are additional aspects to consider [40].
Although our findings suggested coupling occurring within each site to and with its microclimate, especially in times of water stress, other studies have found that canopy temperatures and leaf-based gas exchanges were consistent from genotype to genotype and in different drought treatments [41]. Thus, it would be of interest in future studies to examine not only the ability of perennial crops versus annual crops in the sequestration of carbon, but also their ability to perform under enhanced atmospheric CO2 concentrations. This has a great relevance in order to predict crop productivity considering the ecological impacts resulting from global warming and conventional agricultural practices that tend to reduce the land area available for agriculture in the near future.

4. Conclusions

Our results showed that the US-ARM site was the most coupled with the lowest decoupling. We also observed differences in coupling mechanism variables, showing more sensitivity to the water fluctuation variables as opposed to the radiative flux variables. All of the sites showed their lowest Ω value in 2012—the year of the severe drought in the Central US. The 2012 results further indicate the dependence on the water fluctuation variables. This was especially true with US-KLS, which displayed much higher SWC values. This is in agreement with the study conducted by de Oliveira et al. [17], where the authors found an increased ability of the Kernza crop to manage water stress. US-KLS was more decoupled than its annual counterpart US-ARM site. In this regard, we believe that the ability of perennial Kernza to resist this water stress and retain higher soil moisture values is both a result of its deeper roots and its higher Ω value.
Although we observed a positive correlation between SWC and Ω, showing this increased decoupling with increased soil moisture, the statistical analyses seemed to stand in slight contrast. In US-KFS and US-KLS, we noted a negative correlation between SWC and Ω. We note that this was a result of possible long-term water depletion as a result of longer growing seasons, deeper roots, and higher soil evaporation. Similar findings regarding the use of water in perennial crops are presented in the studies of Abraha et al. [36], Ferchaud et al. [37], Georgescu et al. [38], and Eichelmann et al. [39]. Through the analysis of both the site comparison and then the comparison of the differences in years, we recognize consistent patterns present in the different years throughout. We also observed that differences in Ω are a result of the site and, therefore, the differences in vegetation type. Finally, we conclude that the perennial Kernza crop (US-KLS) is more similar in its microclimate effects to the C4 (US-KON) and mixed C3/C4 (US-KFS) grassland sites as opposed to its annual counterpart (US-ARM).
These findings elucidate the importance to understand the coupling between perennial agroecosystems and the atmosphere. This has implications for the role of perennial agriculture for addressing agricultural resilience under changing climate conditions. This is also relevant considering the ecological impacts caused by conventional agricultural practices and the reduction of the land area available for food production in the near future. Future research should focus on the study of the water use and carbon allocation above- and belowground between different perennial and annual crops in order to improve the knowledge regarding the environmental benefits and disadvantages between these contrasting agricultural practices as well as the ecosystem services provided by them.

Author Contributions

Conceptualization, N.A.B.; Data Curation, C.E.S. and G.d.O.; Writing—Original Draft, C.E.S.; Writing—Review & Editing, N.A.B., G.d.O., T.E.C., L.R.D., and G.V.

Funding

This research was funded by the University of Kansas Undergraduate Research Center, the Land Institute, through the Malone Foundation Perennial Agriculture Project, the NSF-LTER program at the Konza Prairie Biological Station (DEB-0823341), and the Swedish Research Council for Environment, Agricultural Sciences and Spatial Planning (FORMAS) (Grant No. 2018-00646). The US-KLS, US-KON, and US-KFS Ameriflux sites are sponsored by the US Department of Energy under a subcontract from DE-AC02-05CH11231. The US-ARM site is supported by the US Department of Energy, Office of Science, Office of Biological and Environmental Research, and Atmospheric Measurement and Atmospheric System Research programs under contract number DE-AC02-05CH11231.

Acknowledgments

We thank Jeff Delaroy and Bryan Conrad for assistance with the collection and processing of the field measurements.

Conflicts of Interest

The authors declare no conflict of interest.

References

  1. Pachauri, R.K.; Meyer, L.A. Climate Change 2014: Synthesis Report. Contribution of Working Groups I, II and III to the fifth assessment report of the Intergovernmental Panel on Climate Change; IPCC: Geneva, Switzerland, 2014; 151 pp., ISBN 978-92-9169-143-2. [Google Scholar]
  2. United Nations. World Population Prospects: The 2017 Revision, Key Findings and Advance Tables; United Nations: New York, NY, USA, 2017; 46 p. [Google Scholar]
  3. Zhang, Y.; Li, Y.; Jiang, L.; Tian, C.; Li, J.; Xiao, Z. Potential of perennial crop on environmental sustainability of agriculture. Procedia Environ. Sci. 2011, 10, 1141–1147. [Google Scholar] [CrossRef]
  4. Pimentel, D.; Cerasale, D.; Stanley, R.C.; Perlman, R.; Newman, E.M.; Brent, L.C.; Mullan, A.; Chang, D.T.I. Annual vs. perennial grain production. Agric. Ecosyst. Environ. 2012, 161, 1–9. [Google Scholar] [CrossRef]
  5. Lobell, D.B.; Bala, G.; Duffy, P.B. Biogeophysical impacts of cropland management changes on climate. Geophys. Res. Lett. 2006, 33, 1–4. [Google Scholar] [CrossRef]
  6. Findell, K.L.; Berg, A.; Gentine, P.; Krasting, J.P.; Lintner, B.R.; Malyshev, S.; Santanello, J.A.; Shevliakova, E. The impact of anthropogenic land use and land cover change on regional climate extremes. Nat. Commun. 2017, 8, 1–10. [Google Scholar] [CrossRef] [PubMed]
  7. Saunders, D.A.; Hobbs, R.J.; Margules, C.R. Biological consequences of ecosystem fragmentation: A review. Conserv. Biol. 1991, 5, 18–32. [Google Scholar] [CrossRef]
  8. Schipanski, M.E.; MacDonald, G.K.; Rosenzweig, S.; Chappell, M.J.; Bennett, E.M.; Kerr, R.B.; Blesh, J.; Crews, T.; Drinkwater, L.; Lundgren, J.G.; et al. Realizing resilient food systems. Bioscience 2016, 66, 600–610. [Google Scholar] [CrossRef]
  9. Crews, T.E.; Carton, W.; Olsson, L. Is the future of agriculture perennial? Imperatives and opportunities to reinvent agriculture by shifting from annual monocultures to perennial polycultures. Glob. Sust. 2018, 1, 1–18. [Google Scholar] [CrossRef]
  10. Monfreda, C.; Ramankutty, N.; Foley, J.A. Farming the planet: 2 Geographic distribution of crop areas, yields, physiological types, and net primary production in the year 2000. Glob. Biogeochem. Cycles 2008, 22, 1–19. [Google Scholar] [CrossRef]
  11. Glover, J.D.; Reganold, J.P.; Bell, L.W.; Borevitz, J.; Brummer, E.C.; Buckler, E.S.; Cox, C.M.; Cox, T.S.; Crews, T.E.; Culman, S.W.; et al. Increased food and ecosystem security via perennial grains. Science 2010, 328, 1638–1639. [Google Scholar] [CrossRef]
  12. Zeri, M.; Hussain, M.Z.; Anderson-Teixeira, K.J.; DeLucia, E.; Bernacchi, C.J. Water use efficiency of perennial and annual bioenergy crops in central Illinois. J. Geophys. Res.-Biogeo. 2013, 118, 581–589. [Google Scholar] [CrossRef] [Green Version]
  13. Chimento, C.; Amaducci, S. Characterization of fine root system and potential contribution to soil organic carbon of six perennial bioenergy crops. Biomass Bioenerg. 2015, 83, 116–122. [Google Scholar] [CrossRef]
  14. Glover, J.D.; Culman, S.W.; DuPont, S.T.; Broussard, W.; Young, L.; Mangan, M.E.; Mai, J.G.; Crews, T.E.; DeHaan, L.R.; Buckley, D.H.; et al. Harvested perennial grasslands provide ecological benchmarks for agricultural sustainability. Agric. Ecosyst. Environ. 2010, 137, 3–12. [Google Scholar] [CrossRef]
  15. Crews, T.E.; DeHaan, L.R. The strong perennial vision: A response. Agroecol. Sust. Food. 2015, 39, 500–515. [Google Scholar] [CrossRef]
  16. DeHaan, L.R.; Ismail, B.P. Perennial cereals provide ecosystem benefits. Cereal Foods World 2017, 62, 278–281. [Google Scholar] [CrossRef]
  17. de Oliveira, G.; Brunsell, N.A.; Sutherlin, C.E.; Crews, T.E.; DeHaan, L.R. Energy, water and carbon exchange over a perennial Kernza wheatgrass crop. Agric. Forest Meteorol. 2018, 249, 120–137. [Google Scholar] [CrossRef]
  18. Jarvis, P.G.; McNaughton, K.G. Stomatal control of transpiration: Scaling up from leaf to region. In Advances in Ecological Research; Macfadyen, A., Ford, E.D., Eds.; Academic Press: London, UK, 1986; Volume 15, pp. 1–49. ISBN 0-12-013915-4. [Google Scholar]
  19. Steduto, P.; Hsiao, T.C. Maize canopies under two soil water regimes: III. Variation in coupling with the atmosphere and the role of leaf area index. Agric. Forest Meteorol. 1998, 89, 201–213. [Google Scholar] [CrossRef]
  20. Oguntunde, P.G. Whole-plant water use and canopy conductance of cassava under limited available soil water and varying evaporative demand. Plant Soil 2005, 278, 371–383. [Google Scholar] [CrossRef]
  21. Marin, F.R.; Angelocci, L.R.; Nassif, D.S.; Costa, L.G.; Vianna, M.S.; Carvalho, K.S. Crop coefficient changes with reference evapotranspiration for highly canopy-atmosphere coupled crops. Agric. Water Manag. 2016, 163, 139–145. [Google Scholar] [CrossRef]
  22. Spinelli, G.M.; Snyder, R.L.; Sanden, B.L.; Gilbert, M.; Shackel, K.A. Low and variable atmospheric coupling in irrigated Almond (Prunus dulcis) canopies indicates a limited influence of stomata on orchard evapotranspiration. Agric. Water Manag. 2018, 196, 57–65. [Google Scholar] [CrossRef]
  23. Brunsell, N.A.; Schymanski, S.J.; Kleidon, A. Quantifying the thermodynamic entropy budget of the land surface: Is this useful? Earth Syst. Dynam. 2011, 2, 87–103. [Google Scholar] [CrossRef]
  24. Hammerle, A.; Haslwanter, A.; Schmitt, M.; Bahn, M.; Tappeiner, U.; Cernusca, A.; Wohlfahrt, G. Eddy covariance measurements of carbon dioxide, latent and sensible energy fluxes above a meadow on a mountain slope. Bound.-Lay. Meteorol. 2007, 122, 397–416. [Google Scholar] [CrossRef]
  25. Reichstein, M.; Falge, E.; Baldocchi, D.; Papale, D.; Aubinet, M.; Berbigier, P.; Bernhofer, C.; Buchmann, N.; Gilmanov, T.; Granier, A.; et al. On the separation of net ecosystem exchange into assimilation and ecosystem respiration: Review and improved algorithm. Glob. Change Biol. 2005, 11, 1424–1439. [Google Scholar] [CrossRef]
  26. Boden, T.A.; Krassovski, M.; Yang, B. The AmeriFlux data activity and data system: An evolving collection of data management techniques, tools, products and services. Geosci. Instrum. Meth. 2013, 2, 165–176. [Google Scholar] [CrossRef]
  27. Ganser, C.; Wisely, S.M. Patterns of spatio-temporal distribution, abundance, and diversity in a mosquito community from the eastern Smoky Hills of Kansas. J. Vector Ecol. 2013, 38, 229–236. [Google Scholar] [CrossRef] [Green Version]
  28. Brunsell, N.A.; Nippert, J.B.; Buck, T.L. Impacts of seasonality and surface heterogeneity on water-use efficiency in mesic grasslands. Ecohydrology 2014, 7, 1223–1233. [Google Scholar] [CrossRef]
  29. Raz-Yaseef, N.; Billesbach, D.P.; Fischer, M.L.; Biraud, S.C.; Gunter, S.A.; Bradford, J.A.; Torn, M.S. Vulnerability of crops and native grasses to summer drying in the US Southern Great Plains. Agric. Ecosyst. Environ. 2015, 213, 209–218. [Google Scholar] [CrossRef]
  30. Cook, B.I.; Seager, R.; Smerdon, J.E. The worst North American drought year of the last millennium: 1934. Geophys. Res. Lett. 2014, 41, 7298–7305. [Google Scholar] [CrossRef] [Green Version]
  31. Wolf, S.; Keenan, T.F.; Fisher, J.B.; Baldocchi, D.D.; Desai, A.R.; Richardson, A.D.; Scott, R.L.; Law, B.E.; Litvak, M.E.; Brunsell, N.A.; et al. Warm spring reduced carbon cycle impact of the 2012 US summer drought. Proc. Natl. Acad. Sci. USA 2016, 113, 5880–5885. [Google Scholar] [CrossRef] [Green Version]
  32. Crews, T.E.; Blesh, J.; Culman, S.W.; Hayes, R.C.; Jensen, E.S.; Mack, M.C.; Peoples, M.B.; Schipanski, M.E. Going where no grains have gone before: From early to mid-succession. Agric. Ecosyst. Environ. 2016, 223, 223–238. [Google Scholar] [CrossRef]
  33. Kelemen, A.; Tothmeresz, B.; Valko, O.; Miglecz, T.; Deak, B.; Torok, P. New aspects of grassland recovery in old-fields revealed by trait-based analyses of perennial-crop-mediated succession. Ecol. Evol. 2017, 7, 2432–2440. [Google Scholar] [CrossRef]
  34. Khatun, R.; Ohta, T.; Kotani, A.; Asanuma, J.; Gamo, M.; Han, S.; Hirano, T.; Nakai, Y.; Saigusa, N.; Takagi, K.; et al. Spatial variations in evapotranspiration over East Asian forest sites. I. Evapotranspiration and decoupling coefficient. Hydrol. Res. Lett. 2011, 5, 83–87. [Google Scholar] [CrossRef]
  35. Culman, S.W.; Snapp, S.S.; Ollenburger, M.; Basso, B.; DeHaan, L.R. Soil and water quality rapidly responds to the perennial grain Kernza wheatgrass. Agron. J. 2013, 105, 735–744. [Google Scholar] [CrossRef]
  36. Abraha, M.; Chen, J.; Chu, H.; Zenone, T.; John, R.; Su, Y.J.; Hamilton, S.K.; Robertson, G.P. Evapotranspiration of annual and perennial biofuel crops in a variable climate. Gcb. Bioenergy 2015, 7, 1344–1356. [Google Scholar] [CrossRef]
  37. Ferchaud, F.; Vitte, G.; Bornet, F.; Strullu, L.; Mary, B. Soil water uptake and root distribution of different perennial and annual bioenergy crops. Plant Soil 2015, 388, 307–322. [Google Scholar] [CrossRef]
  38. Georgescu, M.; Lobell, D.B.; Field, C.B. Direct climate effects of perennial bioenergy crops in the United States. Proc. Natl. Acad. Sci. USA 2011, 108, 4307–4312. [Google Scholar] [CrossRef] [Green Version]
  39. Eichelmann, E.; Wagner-Riddle, C.; Warland, J.; Deen, B.; Voroney, P. Evapotranspiration, water use efficiency, and energy partitioning of a mature switchgrass stand. Agric. Forest Meteorol. 2016, 217, 108–119. [Google Scholar] [CrossRef]
  40. Sindhoj, E.; Andrén, O.; Katterer, T.; Marissink, M.; Pettersson, R. Root biomass dynamics in a semi-natural grassland exposed to elevated atmospheric CO2 for five years. Acta Agric. Scand. B-S. P. 2004, 54, 50–59. [Google Scholar]
  41. Hainaut, P.; Remacle, T.; Decamps, C.; Lambert, R.; Sadok, W. Higher forage yields under temperate drought explained by lower transpiration rates under increasing evaporative demand. Eur. J. Agron. 2016, 72, 91–98. [Google Scholar] [CrossRef]
Figure 1. Map showing the spatial location of the four AmeriFlux towers used in this study.
Sustainability 11 01640 g001
Figure 2. Daily averaged omega (Ω) decoupling factor values for all included years at US-KON, US-KLS, US-KFS, and US-ARM.
Sustainability 11 01640 g002
Figure 3. Different atmospheric coupling variables: (a) vapor pressure deficit (VPD) (kPa), (b) net radiation (Rn), (c) soil water content (SWC) (m3/m3), (d) latent heat flux (W m−2) (LE), and (e) air temperature (Tair) (◦C) at US-KON, US-KLS, US-KFS, and US-ARM.
Sustainability 11 01640 g003
Figure 4. Annual fluctuations of the omega (Ω) decoupling factor at US-KON, US-KLS, US-KFS, and US-ARM.
Sustainability 11 01640 g004
Figure 5. Annual fluctuations of soil water content (SWC) (m3/m3) at US-KON, US-KLS, US-KFS, and US-ARM.
Sustainability 11 01640 g005
Figure 6. Annual fluctuations of vapor pressure deficit (VPD) (kPa) at US-KON, US-KLS, US-KFS, and US-ARM.
Sustainability 11 01640 g006
Figure 7. Annual fluctuations of latent heat flux (LE) (W m−2) at US-KON, US-KLS, US-KFS, and US-ARM.
Sustainability 11 01640 g007
Figure 8. Omega (Ω) decoupling factor distributions in vapor pressure deficit (VPD) (kPa) intervals in a (a) dry year (2012) and a (b) wet year (2013) for US-KON, US-KLS, US-KFS, and US-ARM.
Sustainability 11 01640 g008
Figure 9. Omega (Ω) decoupling factor distributions in soil water content (SWC) (m3/m3) intervals in a (a) dry year (2012) and a (b) wet year (2013) for US-KON, US-KLS, US-KFS, and US-ARM.
Sustainability 11 01640 g009
Table 1. Coefficient estimates and Pr (>|t|) of the five atmospheric coupling mechanism variables (latent heat flux (LE), vapor pressure deficit (VPD), soil water content (SWC), net radiation (Rn), and air temperature (Tair)).
VariablesCoefficient EstimatesPr (>|t|)
LE4.827 × 10−4<2 × 10⁻¹⁶
VPD−4.210 × 10⁻²<2 × 10⁻¹⁶
SWC5.688 × 10−2<2 × 10⁻¹⁶
Rn−1.248 × 10−50.00257
Tair−3.306 × 10⁻³<2 × 10⁻¹⁶
Table 2. p-values and R2 values of the two groups of coupling mechanisms, water fluxes (latent heat flux (LE), soil water content (SWC), vapor pressure deficit (VPD)) and radiative fluxes (net radiation (Rn) and air temperature (Tair)).
Coupling Mechanismsp-valuesMultiple R2Adjusted R2
Water Fluxes<2 × 10−160.45560.4555
Radiative Fluxes<2 × 10−160.027530.02747
Table 3. Latent heat flux (LE), vapor pressure deficit (VPD), and soil water content (SWC) (m3/m3) coefficients and R2 values for each individual site for all of the years observed at the site.
SiteUS-KONUS-KLSUS-KFSUS-ARM
LE Coefficient4.897 × 10−46.108 × 10−45.938 × 10−45.030 × 10⁻⁴
VPD Coefficient−6.716 × 10⁻²−4.897 × 10⁻²−6.757 × 10⁻²−2.325 × 10⁻²
SWC Coefficient6.247 × 10−2−1.326 × 10⁻¹−1.020 × 10−11.032 × 10−2
Multiple R20.37720.52870.35270.5436
Adjusted R20.37690.52850.35250.5434
Table 4. Pr (>|t|) values for latent heat flux (LE), vapor pressure deficit (VPD), and soil water content (SWC), and overall p-value for each individual site for all of the years observed at each site.
SiteUS-KONUS-KLSUS-KFSUS-ARM
LE Pr (>|t|)<2 × 10⁻¹⁶<2 × 10⁻¹⁶<2 × 10⁻¹⁶<2 × 10⁻¹⁶
VPD Pr (>|t|)<2 × 10⁻¹⁶<2 × 10⁻¹⁶<2 × 10⁻¹⁶<2 × 10⁻¹⁶
SWC Pr (>|t|)1.99 × 10⁻⁵<2 × 10⁻¹⁶<2 × 10−160.134
Overall p-value<2.2 × 10⁻¹⁶<2.2 × 10⁻¹⁶<2.2 × 10⁻¹⁶<2.2 × 10⁻¹⁶

