Development of Mix Designs for Minimally Refined Reclaimed Asphalt Pavement (RAP) Concrete for Florida Concrete Test Road


Engineering School of Sustainable Infrastructure and Environment, Department of Civil and Coastal Engineering, University of Florida, 365 Weil Hall P.O. Box 116580, Gainesville, FL 32611, USA
*
Author to whom correspondence should be addressed.
Sustainability 2018, 10(8), 2598; https://doi.org/10.3390/su10082598
Submission received: 4 July 2018
/
Revised: 19 July 2018
/
Accepted: 20 July 2018
/
Published: 24 July 2018
(This article belongs to the Section Sustainable Urban and Rural Development)
Abstract
:The main objective was to develop mix designs for concrete incorporating minimally processed reclaimed asphalt pavement (RAP) materials to be used in the Florida Concrete Test Road. The laboratory program was conducted in two phases. Phase I involved testing of twelve (12) trial mixes to identify feasible mixes which could meet the Florida Department of Transportation (FDOT) specification requirements for pavement concrete. Based on the preliminary test results from the trial mixes, ten (10) production mixes were identified and evaluated more extensively in Phase II to establish the optimum concrete mixes incorporating RAP to be recommended. Concrete mixtures, with 0% to 40% RAP as aggregate replacement and using 20% fly ash and 50% slag as cement replacement, were designed using the optimized aggregate gradation (OAG) technique instead of the American Concrete Institute (ACI) method. Among the RAP concrete evaluated, the 20% RAP concrete mixes with 0%, 20% fly ash, and 50% slag as cement replacement were able to meet Florida Department of Transportation’s (FDOT) over-design compressive strength of 29 MPa (4200 psi) at 28 days. Using 20% and 40% RAP in concrete could result in saving in the total cost of aggregate by 9% and 17%, respectively. When the RAP is not refined (e.g., no washing of RAP, and no separating of coarse and fine portions), it is recommended that 20% of RAP can be used as aggregate replacement in pavement concrete.
1. Introduction
1.1. Background
Concrete is the one of the principal materials to be used in pavement construction due to its satisfactory performance as well as its availability. On the other hand, the use of concrete not only consumes the bulk of natural resources but also generates the emission of carbon dioxide (CO2) escalating global warming [1,2]. Thereby, many researchers and engineers have made great efforts to design sustainable concrete mixes by using supplement cementitious materials (SCM) and reclaimed asphalt pavement (RAP). The needs of sustainable concrete mix in pavement system leads to the plan of Florida Department of Transportation (FDOT) to construct a 4 km (2.5 mile) Florida Concrete Test Road to evaluate new and innovative techniques and materials for construction, rehabilitation, and maintenance of concrete pavements. One of the materials to be evaluated is concrete incorporating reclaimed asphalt pavement (RAP) material as aggregate replacement, which has been found from a previous FDOT-sponsored study [3] to offer the possibility of improving the performance of concrete pavement due to its low modulus of elasticity.
Reclaimed asphalt pavement (RAP) is defined as “removed and/or reprocessed pavement materials containing asphalt and aggregates” by the Federal Highway Administration Research and Innovative Technology [4]. Copeland [5] reported that more than 100 million tons of RAP are generated by asphalt pavement rehabilitation and reconstruction every year in the United States. However, Hansen and Copeland [6] reported a recent survey of total estimated amount of RAP in U.S. stockpiles to be 85.1 million tons. Moreover, the disposal of RAP involves huge landfill that could cause secondary pollution on nature. The excessive amount of RAP produced every year leads to a need to use up this material effectively. The possibility of using RAP in concrete pavement has not only environmental benefits but also cost saving by replacing the relatively more expensive virgin aggregates with the less expensive RAP [7].
As the idea of using RAP as an aggregate in concrete pavement has become more and more popular in recent years, there have been several comprehensive studies evaluating the mechanical performance of concrete incorporating RAP. The results of a few early studies have revealed that the concrete incorporating RAP exhibits lower compressive strength, modulus of elasticity, splitting tensile strength, and flexural strength as the percentage of RAP increases in the concrete mixture [8,9,10,11,12,13,14,15]. Reductions in term of strength were observed in aforementioned studies because of cracking propagation along with the aged bituminous layer explained by early studies [16,17]. Despite of the negative effects pertaining to strength development, recently, concrete pavements containing a high volume of RAP were successfully constructed and evaluated through a field demonstration project near Lewistown, Montana. The RAP concrete was batched, placed, and finished using conventional construction methods, and showed satisfactory constructability and serviceability [9]. In another analytical study, the beneficial structural behavior of RAP concrete pavement was evaluated using a finite element (FE) model, and the results indicated that the RAP concrete could have potentially better performance, since the computed stress-to-strength ratio of the RAP concrete under critical stress condition decreases as the RAP content of the mix increases [3,18]. Also, Brand et al. [19] evaluated the effects of RAP on concrete durability performances such as permeability, alkali silica reactivity, and freeze/thaw resistance and reported that the RAP concrete exhibited acceptable results.
The utilization of RAP in concrete mix have produced feasible mixes for use in concrete pavements. Given the circumstance of increasing volume of RAP stockpile and the needs of environmental friendly approach, RAP concrete could be one of the ideal solutions. The potential benefits for the use of RAP in concrete pavement will include not only the utilization of excess RAP, but also cost effectiveness and sustainable approach of concrete pavements in Florida.
1.2. Amount of RAP and Associated Compressive Strength
This study investigates the optimum proportion of minimally refined RAP—no washing of RAP, and no separating of coarse and fine portions—in concrete to produce feasible mixes which would satisfy the required fresh and harden properties in accordance with the FDOT specification [20]. Early studies pertaining to amounts of RAP used in concrete mix has been widely conducted by different researches as did the inclusion of different types of pre-processing RAP (e.g., four different conditions: unrefined RAP—no wash and no separation, washed RAP but no separation, fine RAP only, and coarse RAP only). A brief survey on the replacement percent and associated compressive strength is presented in Table 1. The results of the survey give the guideline to determine the proportion of RAP with respect to compressive strength development.
1.3. Optimized Aggregate Gradation (OAG) for RAP Concrete
In general, the ACI 211.1 [25] mix design method uses two different types of aggregate which include coarse and fine aggregates. When a third aggregate of un-separated RAP was added with coarse and fine aggregate, the ACI procedure is not suitable for use. However, the method of OAG takes advantage of designing concrete mix with three different aggregates by managing the proportion of each aggregate. Moreover, the use of OAG design method provides the densest packing of aggregate, allowing for the use of smaller amount of cementitious materials to achieve good constructability, workability, and economy [26,27]. Since this study aims to use the un-separated RAP, the technique of OAG was used effectively in designing RAP concrete mixes in this study.
1.4. Objective and Scopes of Research
The main objective of this research project was to develop the optimum mix designs for concrete incorporating minimally processed RAPs from the local sources approved by FDOT, to be used in the Florida Concrete Test Road. The following tasks were performed in order to achieve the main objective of this study:
- Design of concrete mixes containing RAP: Concrete mixtures with 0%, 20%, 30%, and 40% RAP as aggregate replacement, and using 20% fly ash and 50% slag as cement replacement were designed using the optimized aggregate gradation (OAG) technique.
- Laboratory evaluation of the designed concrete mixes: The designed concrete mixes were produced and tested in the laboratory. The following properties of fresh concrete were evaluated: (1) Slump, (2) Unit weight, (3) Air content, and (4) Temperature. The following properties of the hardened concrete were evaluated: (1) Compressive strength, (2), Modulus of elasticity, (3) Flexural strength, (4) Coefficient of thermal expansion, and (5) Surface resistivity.
- Evaluation of potential performance of RAP concrete mixes: Critical stress analysis was performed to evaluate the potential performance of a typical concrete pavement in Florida if RAP concretes with the determined properties were used.
- A cost analysis was done to determine the possible cost savings if RAP were to be used as aggregate replacement in concrete mixtures.
2. Laboratory Testing Program
2.1. RAP and Virgin Aggregate Used
All the materials selected were approved by the FDOT materials office in Gainesville, Florida. The fine aggregate used was a silica sand and the coarse aggregates used was a Florida limestone with a nominal maximum size of 19 mm (¾ in). Recycled asphalt pavement (RAP) materials were procured from a local source in Florida. Table 2 shows the specific gravity and water absorption of the aggregates used (AASHTO T84&T85) and Table 3 shows the gradation of the aggregates (AASHTO T27) used in this laboratory testing program. It can be seen that the RAP contains intermediate sizes while the virgin coarse and fine aggregate lack intermediate sizes.
2.2. Preparation of RAP
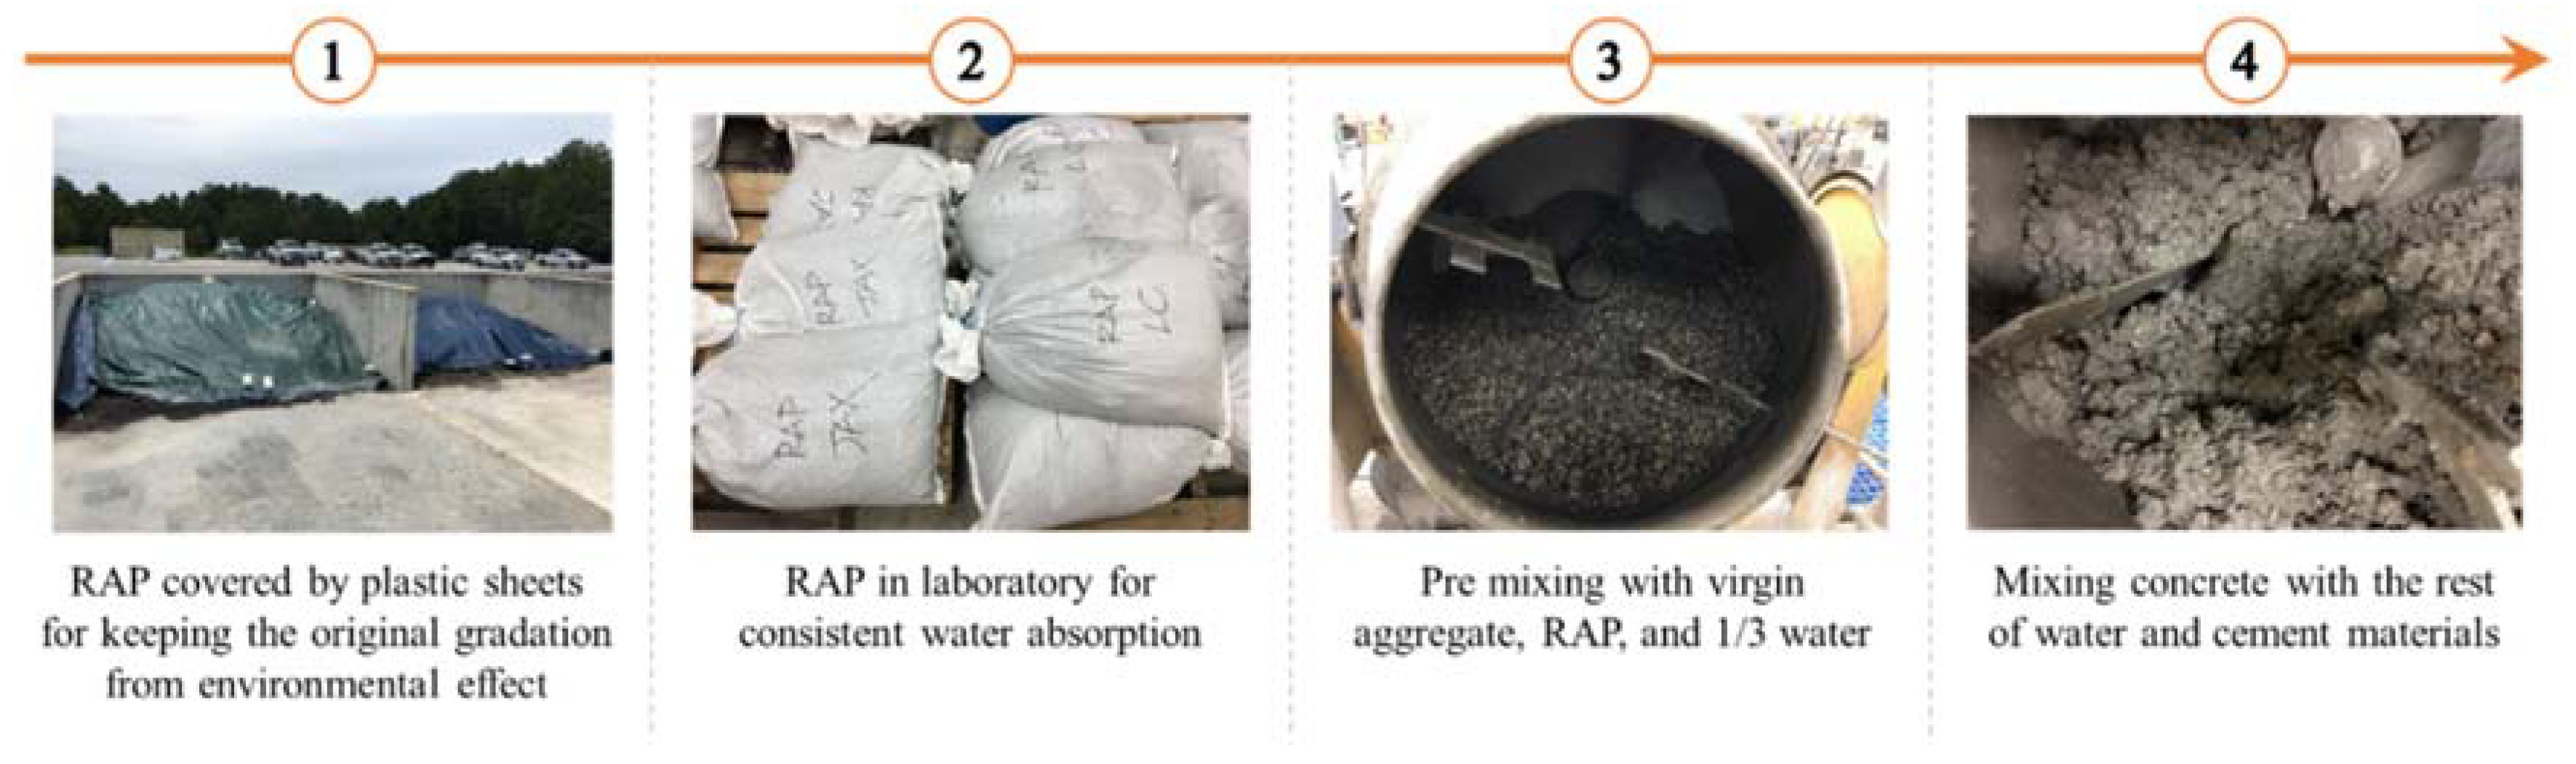
Many studies pertaining to the effects of incorporating RAP on the strength developments reveal regularly that the strength decreases as the replacing proportion of virgin aggregates by RAP increases [8,9,10,11,12,13,14,15,16,22,28,29]. To improve the strength of RAP concrete mix, Singh et al. [30] found a viable solution by eliminating the contaminants layers (e.g., airborne dusts attached to surface of RAP) of RAP aggregate. Moreover, the fine size of RAP aggregate separated from coarse RAP (i.e., the size of aggregate bigger than 2.36 mm) gives rise to deceasing the strength of concrete mix dominantly [31]. The early studies clearly emphasize the importance of pre-processing RAP before mixing with other materials such as removing the contaminants or using only the coarse portion of RAP aggregate. The pre-processing technique, however, generates a burden to the contractor in term of extra time and labor. This study aims to investigate the use of the minimally processed RAP aggregate for practical pavement construction. Thus, the RAP aggregate was not washed or separated into coarse and fine portions in order to simulate how RAP will be used in the practical production of RAP concrete. The whole process of RAP concrete preparation is shown in Figure 1.
2.3. Concrete Mixtures Evaluated
2.3.1. Requirements for Fresh and Hardened Concrete
The main objective of this study was to develop the recommended mix designs incorporating minimally processed RAP which could be used in the Florida Concrete Test Road. These developed concrete mixes must meet the required fresh and hardened properties for pavement concrete as specified in FDOT specifications [20]. Table 4 presents the required fresh and hardened concrete properties for pavement concrete according to FDOT specifications and AASHOTO [32]. The cementitious materials including Type I/II Portland cement (ASTM C150.C150M), fly ash Class F (ASTM C618), and ground blast-furnace slag (ASTM C989/C989M), which were used in this study, satisfied all the requirements in accordance with ASTM specifications for concrete materials.
The laboratory testing program was conducted in two phases. Phase I involves testing of twelve (12) trial mixes to identify feasible mixes which could meet the FDOT specification requirements for pavement concrete. Based on the preliminary test results from the trial mixes, ten (10) production mixes were identified and evaluated more extensively in Phase II to establish the optimum concrete mixes incorporating RAP to be recommended. The following sections present the mix proportions of the trial and production mixes which were evaluated.
2.3.2. Mix Proportions of Trial Mixes
The mixture parameters were incorporated in the twelve (12) trial mixes evaluated. The following mix parameters were incorporated:
- RAP contents—20% and 40%
- Two fly ash contents—0% and 20%
- Four w/c ratios—0.43, 0.45, 0.47, and 0.50
2.3.3. Mix Proportions of Production Mixes
Based on the results of the trial mixes, two feasible mixes were selected for further extensive testing. These selected mixes were concrete mixes containing 20% RAP with 0% fly ash and 20% fly ash. For comparison purpose, eight additional mixes were also tested. These additional mixes to be evaluated include the following:
- Three control mixes with no RAP, using 0%, 20% fly ash and 50% slag
- One mix with 20% RAP using 50% slag
- Two mixes with 30% RAP using 20% fly ash and 50% slag
- Two mixes with 40% RAP using 20% fly ash and 50% slag
The mix parameters for these trial and production mixes are shown in Table 5.
2.4. Designing of Concrete Mixes Containing RAP
2.4.1. Proportioning of Mix Ingredients Using Optimized Aggregate Gradation Technique
In this study, the modified optimized aggregate gradation (OAG) as proposed by Lindquist et al. [33] was used to proportion the virgin coarse aggregate, virgin fine aggregate, and RAP materials to produce the concrete mixes to be evaluated. The coarseness factor chart is a plot of coarseness factor (CF) versus workability factor (WF). The CF of an aggregate blend can be calculated as follows:
where, Q = % retained on 37.5 mm + 25.0 mm + 19.0 mm + 12.5 mm + 9.5 mm and I = % retained on 4.75 mm + 2.36 mm. The WF of a concrete mix can be calculated as follows:
where, W = % retained on 1.18 mm + 0.6 mm + 0.3 mm + 0.15 mm + 0.075 mm + Pan (Sieve) and CCF = 2.5 × (C − 335) + 94 (C is the amount of cement in kg/m3).
The CF and WF of a concrete mix can be plotted on the coarseness factor chart to determine the workability of the concrete mix. A concrete mix with optimum aggregate gradation should be plotted within the Workability Box. The Workability Box is defined by the corners coordinates suggested by early study [34]. The proper combination of CF and WF which plots inside the Workability Box would be desirable and would most likely produce a workable concrete mixture which can be placed and finished easily and will have good long-term performance.
2.4.2. Gradation of the Aggregate Blend Used in the Concrete Mixes Evaluated
Optimized Gradations of the Aggregate Blends by the OAG Procedure
Using the OAG procedure recommended by Lindquist et al. [33], optimized proportions of coarse and fine aggregate were determined for the various concrete mixes with various percentages of RAP, which were to be evaluated in this study. Montana Department of Transportation [34] suggests the ideal target line in percent retained chart (i.e., haystack gradation is the humped curve line based on “8–18” band gradation of percent retained aggregate on sieve) and limited boundary in 0.45 power chart (i.e., ±7% opening is the boundary of variation from 0.45 Power line, which is modified based on Fuller’s equation) for the analysis of the aggregate gradation. Table 6 presents the gradations of the blended aggregates of the concrete using 0%, 20%, 30%, and 40% RAP, respectively. The optimized percentages of coarse and fine aggregates to be used are also shown on the table.
Evaluation of Aggregate Gradation of Concrete Incorporating RAP
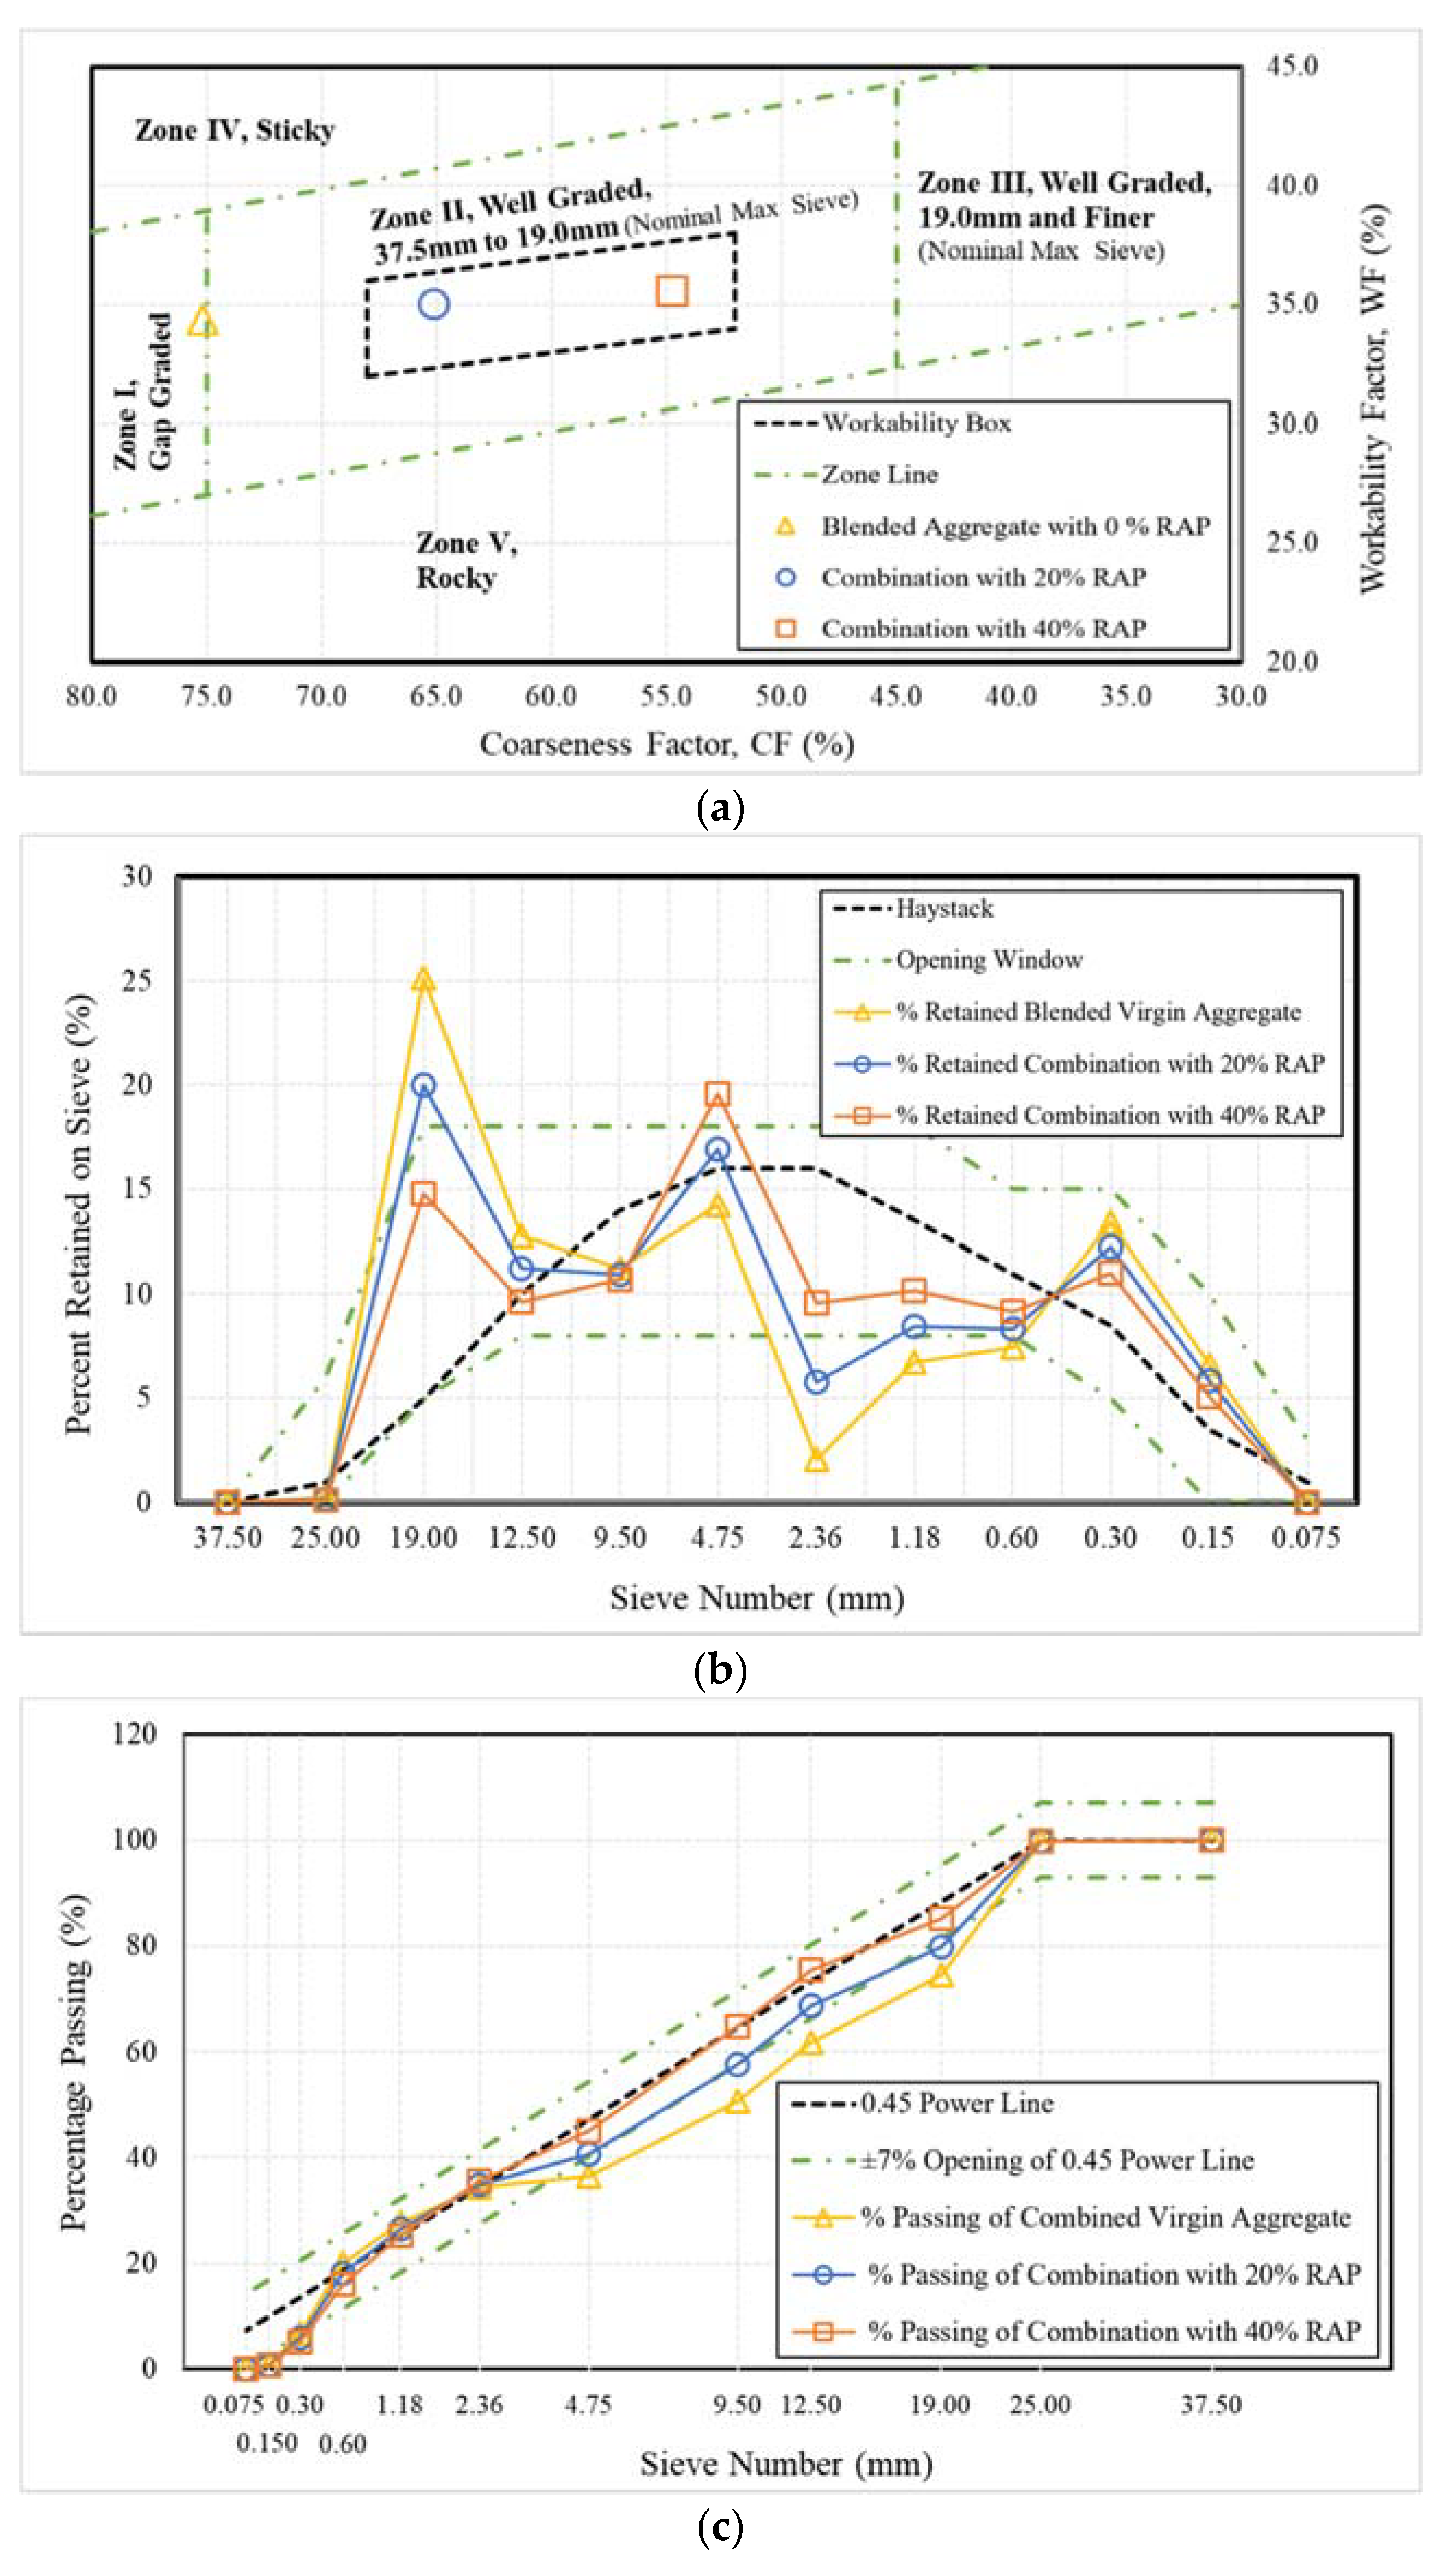
Figure 2a presents the plots of CF and WF on the coarseness factor chart for the aggregate blend of the concrete containing 0%, 20%, and 40% RAP. It can be seen that the aggregated blend of the control concrete without incorporation of RAP is gap-graded, and plots outside of the workability box in the coarseness factor chart. However, with the incorporation of 20% or 40% RAP, the aggregate blend becomes well-graded and plots within the Workability Box.
Figure 2b shows the plots of percent retained for the blends of aggregate for the concrete containing 0%, 20%, and 40% RAP. For the concrete mix with no RAP, there is clearly a lack of intermediate-size materials—2.36 mm, 1.18 mm, and 0.60 mm (#8, #16, and #30 sieves). This deficiency is reduced as the percentage RAP increases. Figure 2c shows the plot of the aggregate gradations of the concrete containing 0%, 20%, and 40% RAP. It can be seen that the aggregate blend of the concrete mix with no RAP is gap graded. Concrete with gap graded aggregate has reduced workability, higher shrinkage, and lower durability as compared with concrete with well graded aggregate [35,36]. Gap graded gradation plots far away from the ideal 0.45 Power line. However, with the incorporation of 20% or 40% RAP, the aggregate blend becomes more well-graded and plots closer to the 0.45 Power line.
The OAG procedure was used to proportion the aggregates used in the concrete mixes containing RAP in this study. The control mix containing no RAP had a gap-graded aggregate which lacked intermediate-size particles. When 20% or 40% RAP materials were incorporated using the OAG procedure, the aggregate blend became significantly more well-graded and the concrete became more workable according to the prediction from the coarseness factor chart.
2.4.3. Comparison of OAG with ACI Procedure
Investigation was also made to see if the ACI 211.1 [25] method of proportioning coarse and fine aggregates could be used in the design of concrete mixes containing RAP. According to the ACI procedure, the values of the coarse aggregates to be used are based on the nominal maximum size of the coarse aggregate and the fineness modulus of the fine aggregate and the table provided by ACI. The volume of the fine aggregate is then determined by the absolute volume method, which is for calculating the required volume of fine aggregate by subtracting from the total volume by the volumes of all other components including water, air, cementitious material, and coarse aggregate. The detailed information and procedure can be found in ACI 211.1 publication. In using the ACI method, when a certain percentage of aggregate was to be replaced by RAP, the amounts of coarse and fine aggregate were then reduced proportionally according to their original proportions without RAP.
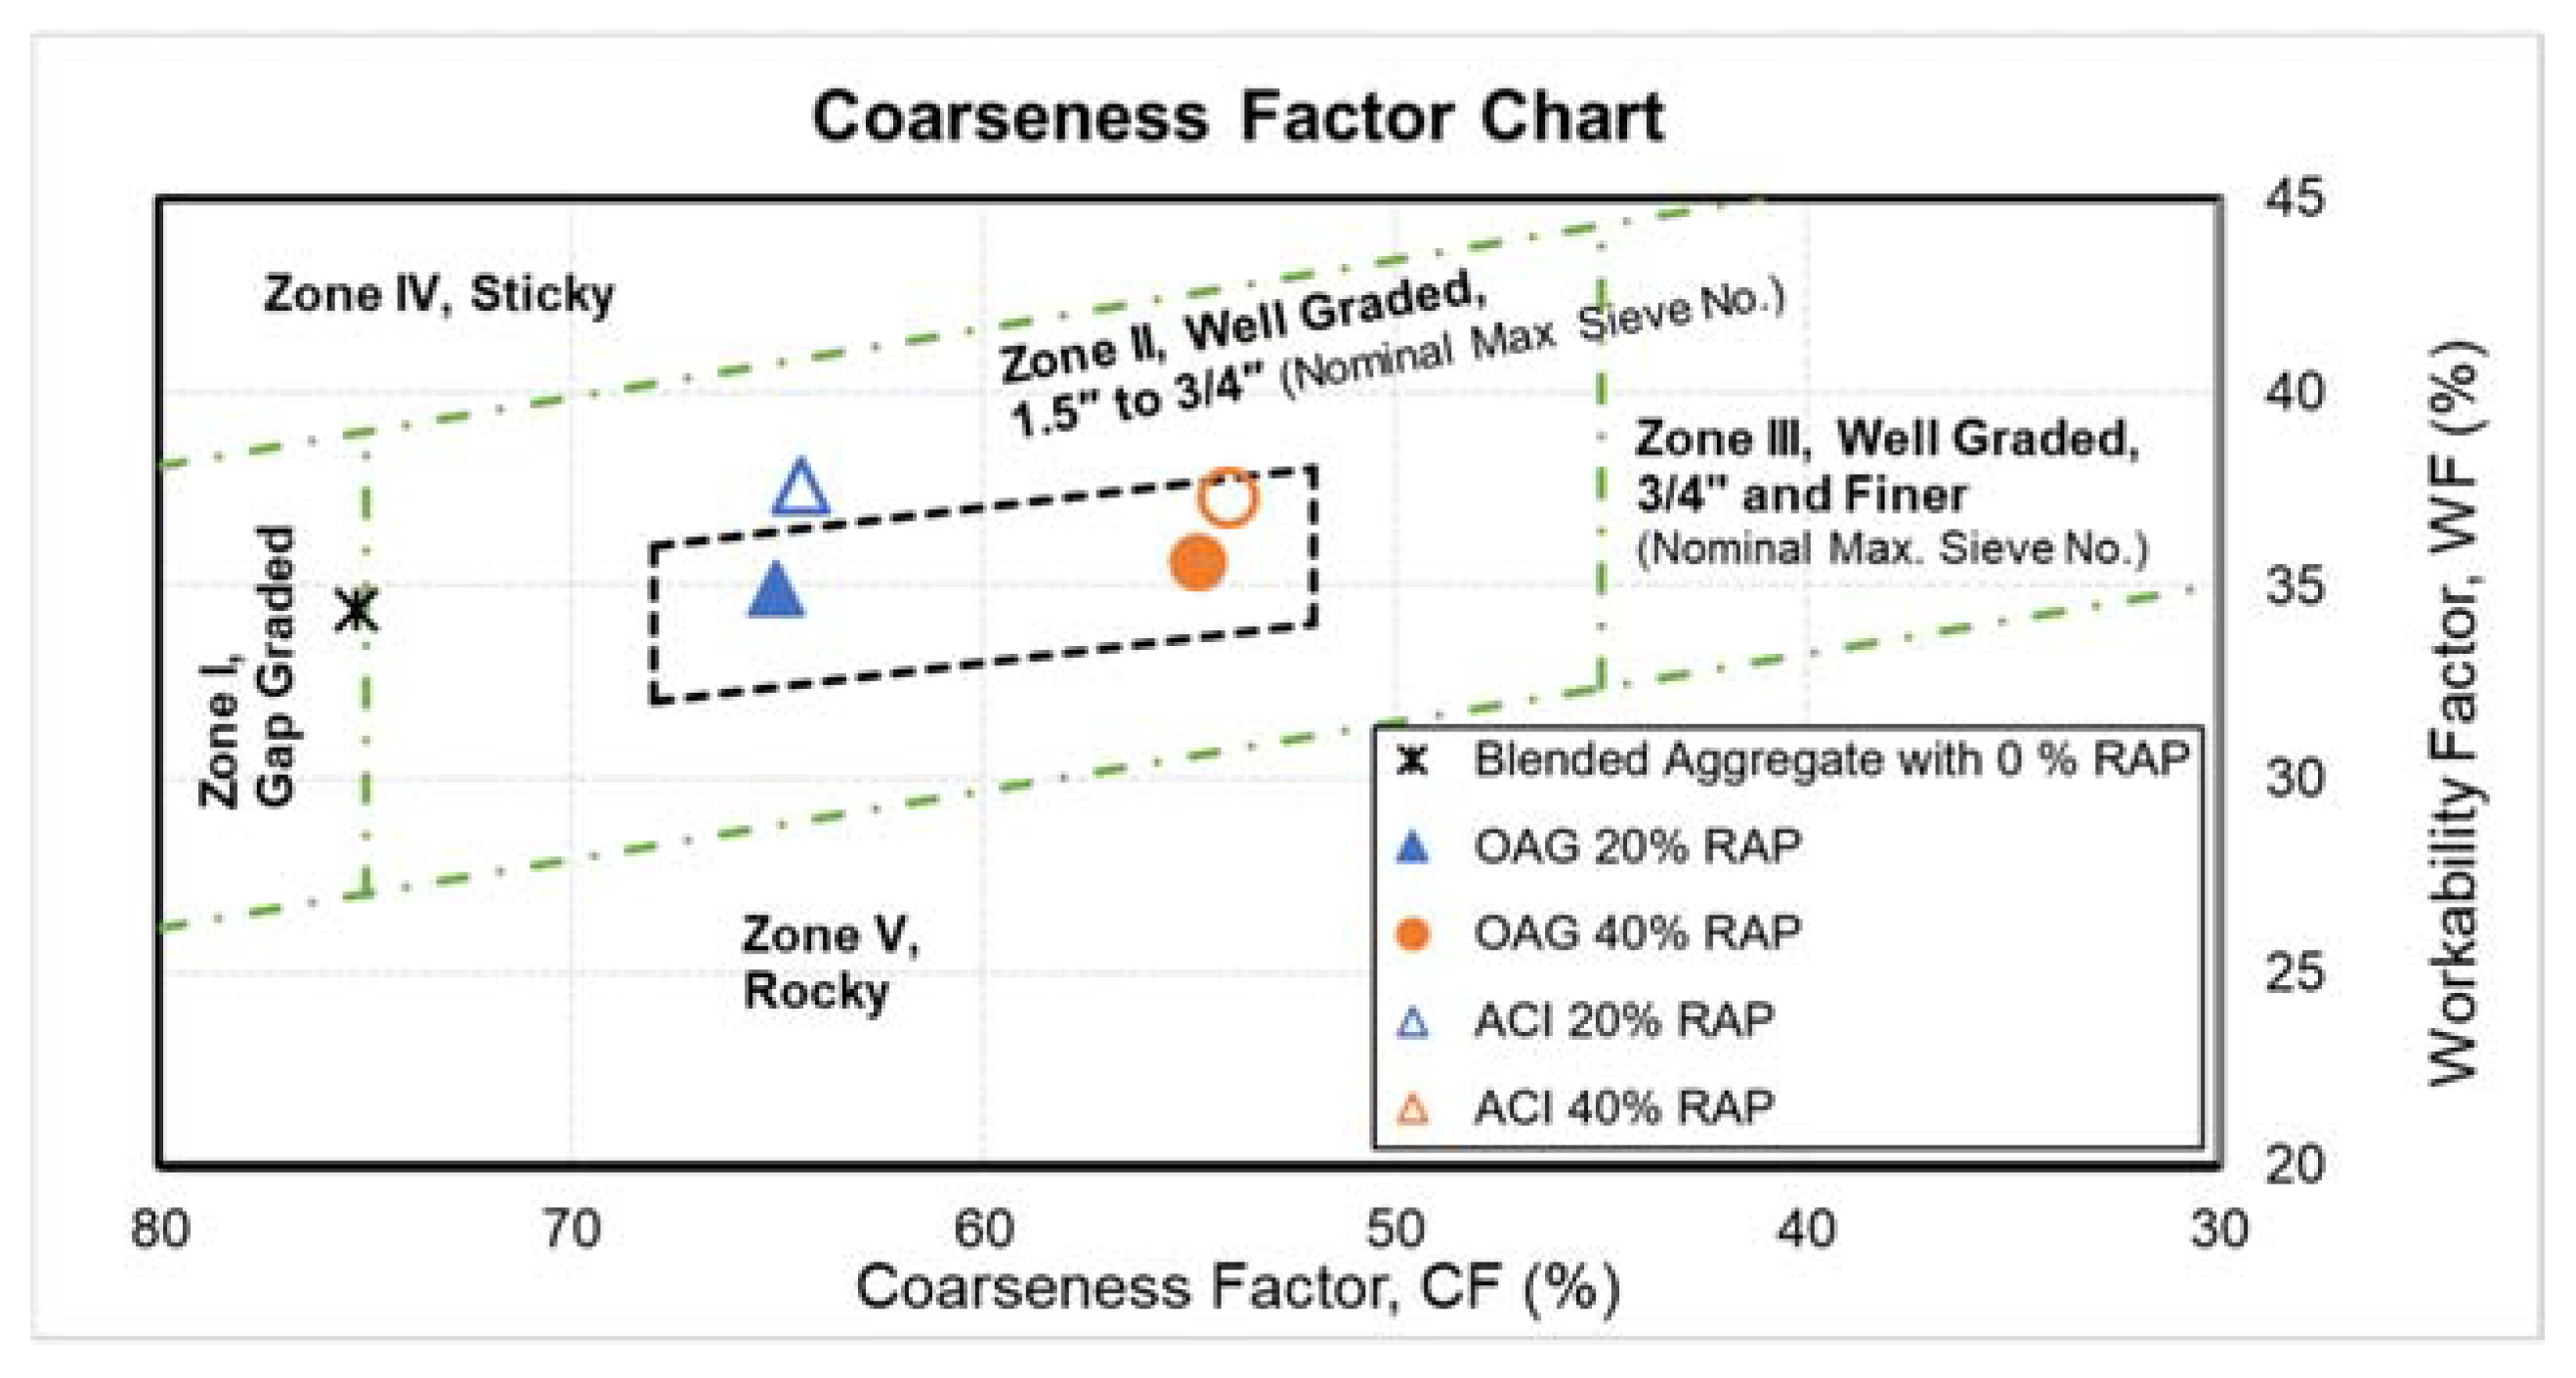
When the ACI method was used to proportion the coarse and fine aggregate, it was difficult to produce a well-graded aggregate blend and a workable mix with respect to the criteria of CF and WF. Figure 3 compares the plots of CF and WF values on the coarseness factor chart for aggregate blends from the OAG versus the ACI procedures. It can be clearly seen that the OAG procedure is superior to the ACI procedure in achieving a well-graded aggregate blend and workable mix.
3. Test Results and Analysis
3.1. Results of Fresh Concrete Tests
The results of fresh concrete tests including slump (ASTM C143), unit weight (ASTM C138), air content (ASTM C173), temperature (ASTM C1064) and bleeding (ASTM C232) evaluated for all the concrete mixtures, are shown in Table 7. All mixture used the needed amounts of Type D (i.e., water-reducing and retarding admixture) defined by ASTM (ASTM C494/C494M) admixture to achieve the target slump between 2.54 to 7.62 cm (1 to 3 in.) All concrete mixtures exhibit slump between 2.54 to 5.08 cm (1 to 2 in.) for RAP mixture and showed good workability without the segregation problem. The needed dosage of water-reducing and retarding admixture increased as the percentage of RAP replacement increased in the mix. This means that the use of RAP decreases the slump of the fresh concrete. The percentage air of the mixture did not exhibit a relationship between the percentage of RAP and air content. The percentage air was within the targeted range of 2% to 5%. The unit weight of the concrete mixtures decreased as the percentage of RAP replacement increased in the Production mixes. The unit weight of the concrete mixtures without RAP was 2283 kg/m3 and the unit weight was between 2230 kg/m3 and 2305 kg/m3 for concrete mixtures with 20%, 30%, and 40% RAP. The temperature of concrete for all the mixtures was between 20 °C and 22 °C. The mixture with RAP produced relatively lower amount of bleeding water as compared with the control mixes without RAP. This is mainly due to the fact that the unsaturated RAP was used in the mixing phase in order to prevent the degradation of RAP.
3.2. Analysis of Strength Test Results
3.2.1. Test Results of Compressive Strength, Modulus of Elasticity, and Flexural Strength
The compressive strength test was performed on 100 mm × 200 mm (4″ × 8″) concrete cylinder specimens in accordance with ASTM C39 standard test method. Three replicate specimens were tested at each of the different curing times of 7 and 28 days for the trial mixes, and 28 and 90 days for the production mixes. The Young’s modulus or modulus of elasticity (MOE) and Poisson’s ratio test was performed on 100 mm × 200 mm (4″ × 8″) concrete cylinder specimens in accordance with ASTM C469 standard test method. Three replicate specimens were tested at each of the different curing times of 28 and 90 days. The flexural strength test was performed on 100 mm × 100 mm × 356 mm (4″ × 4″ × 14″) concrete beam specimens in accordance with the ASTM C78 standard test method. Three replicate specimens were tested at each of the different curing times of 28 and 90 days.
FDOT specifications [20] for pavement concrete require a minimum compressive strength of 21 MPa (3000 psi) at 28 days. Similarly, AASHTO PP84 [32] recommends a minimum concrete compressive strength of 24 MPa (3500 psi) at 28 days. Table 8 summarizes the average compressive strength of the trial mixes containing RAP at 7 and 28 days. For all the concrete mixtures, there is a reduction in compressive strength with increase in the percentage of RAP in the concrete mixtures. From the results of 28-day compressive strength of the trial mixtures versus w/c ratio, for all mixtures with w/c ratio of 0.50, 0.47, 0.45, and 0.43, it can be observed that the minimum required 28-day compressive strength of 21 MPa (3000 psi) set by FDOT and 24 MPa (3500 psi) set by AASHTO are met. However, for the mix with 40% RAP, regardless of w/c ratio, the 28-day compressive strength could not reach the over-design strength of 29 MPa (4200 psi). With 40% RAP, using a lower w/c ratio did not help to increase its strength sufficiently.
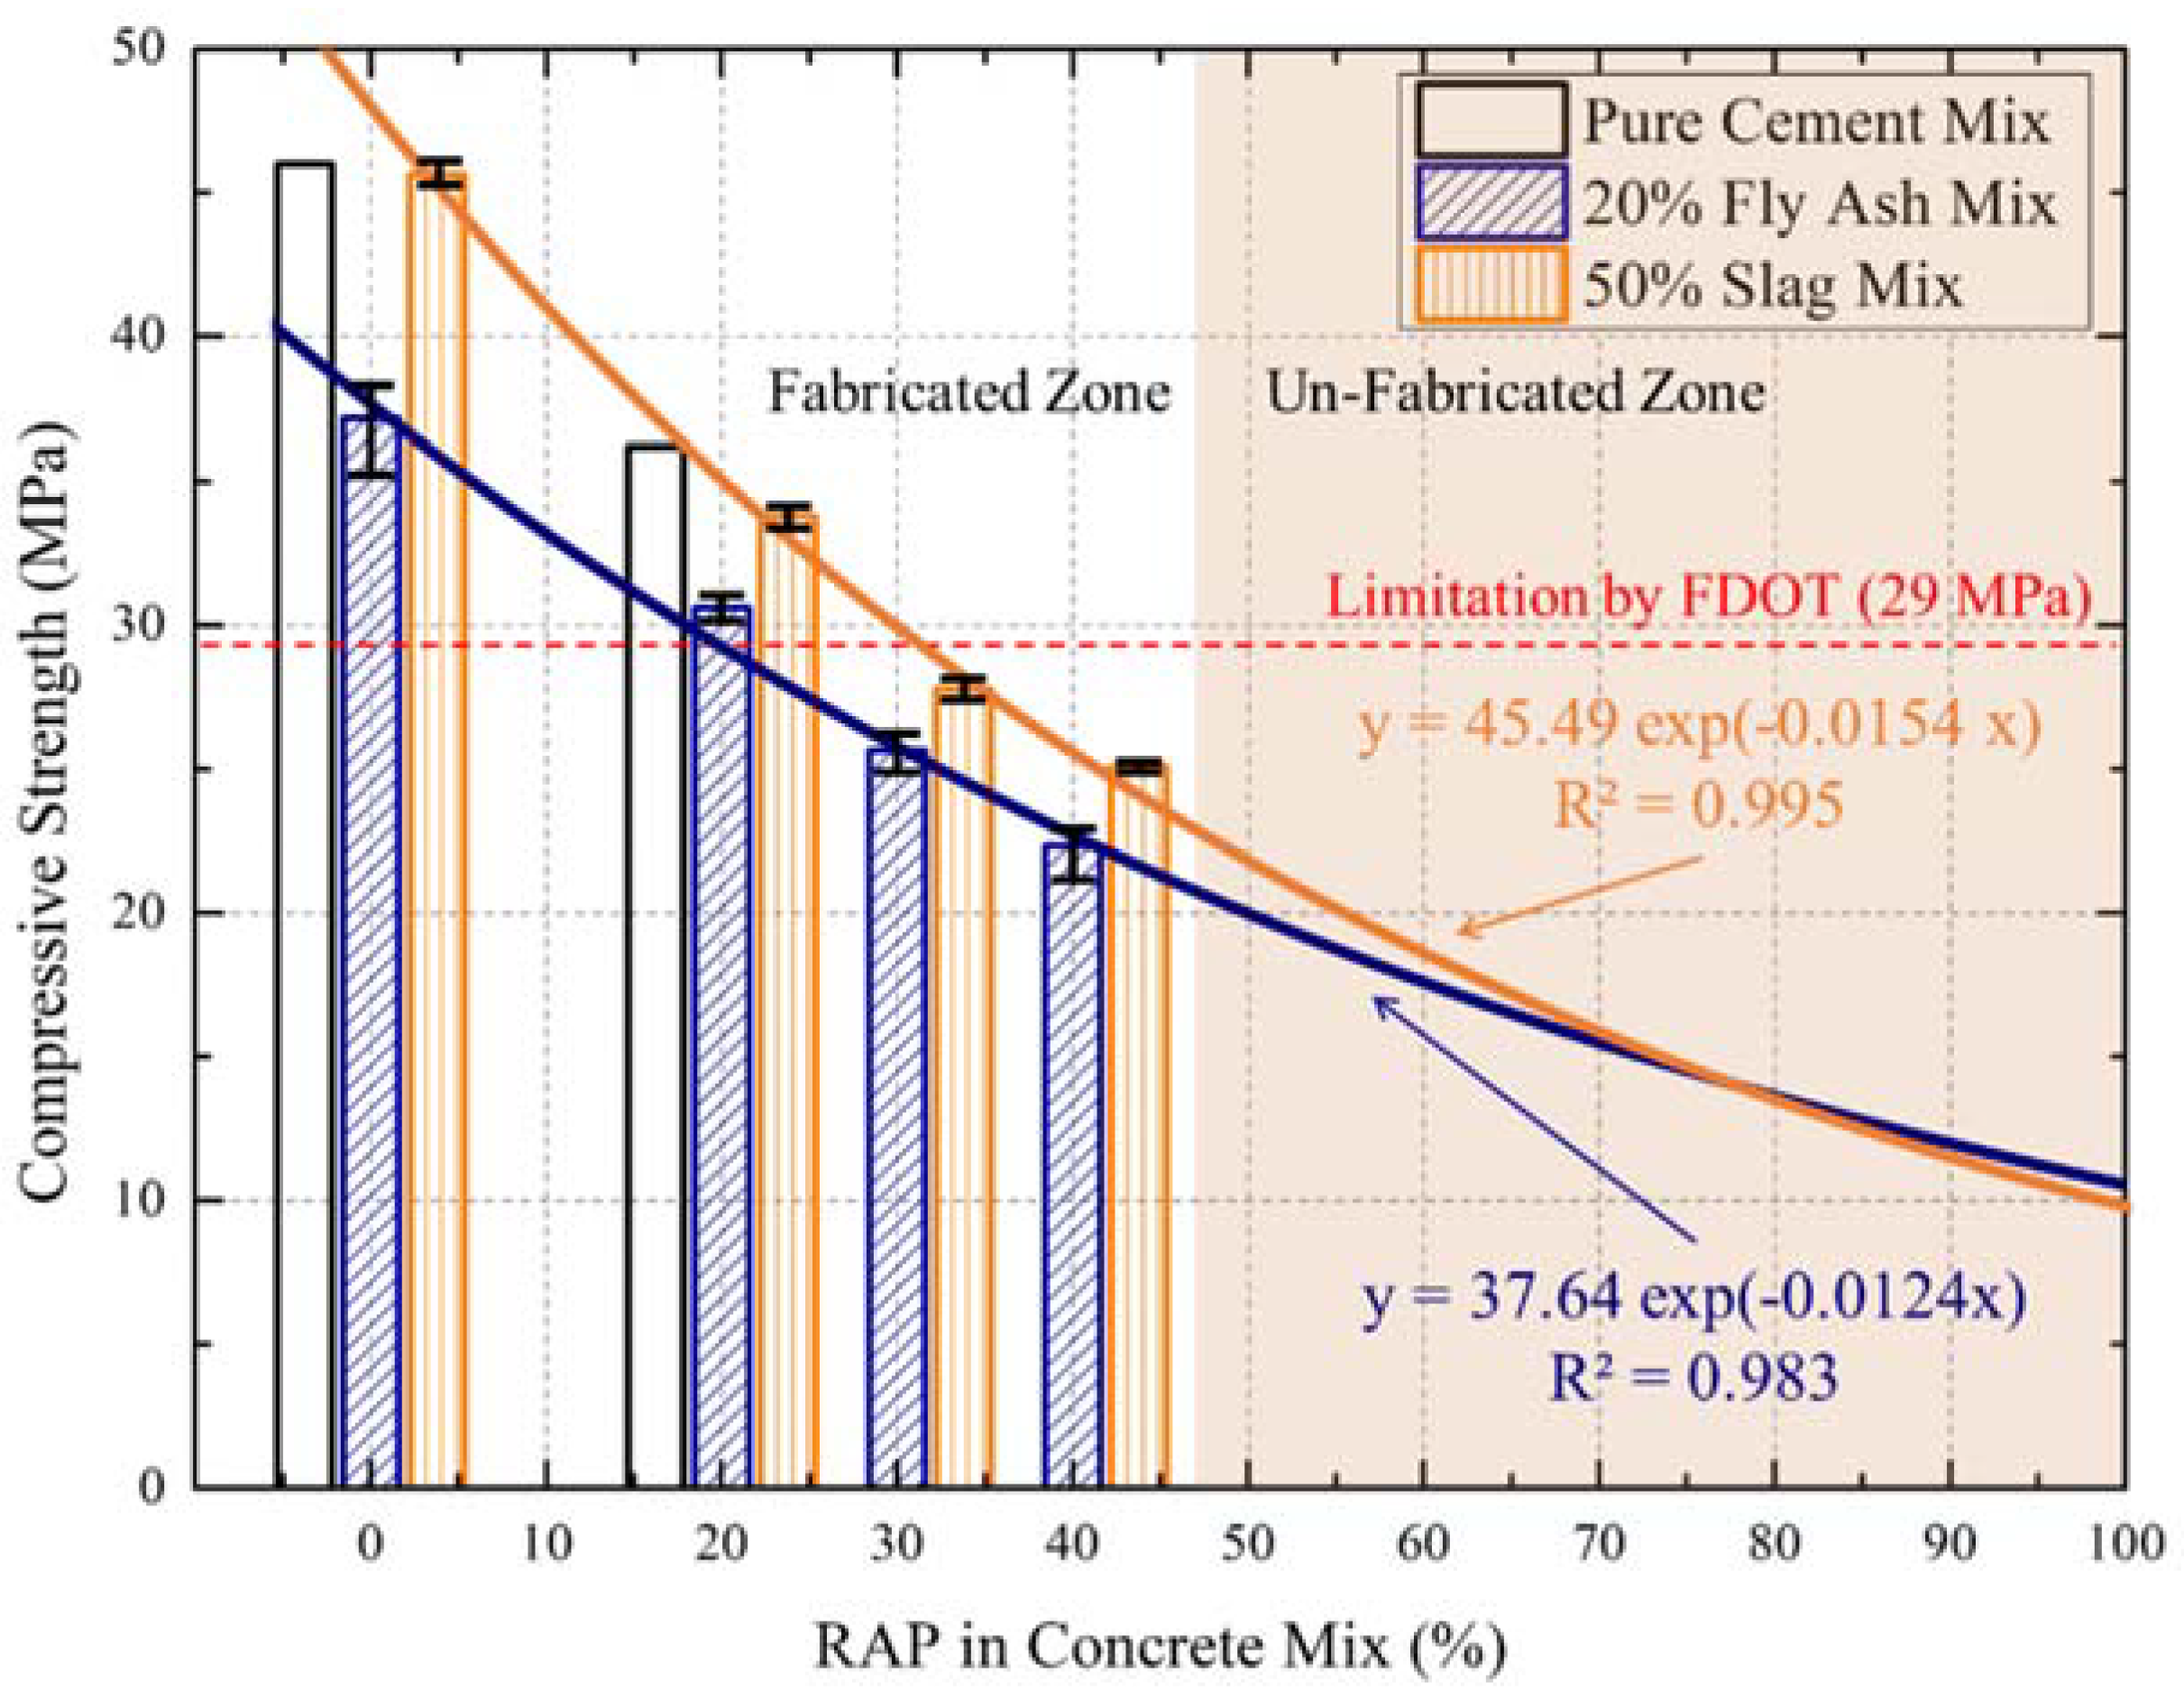
Table 9 presents the development of compressive strength with curing time. For the pure cement mixtures without RAP, the strength development was much higher than any other mixtures, especially for the 40% RAP mixtures. For the 20% fly ash mixtures without RAP, the development of strength was slower at early days. For the mix with 40% RAP, the developed strength did not reach the required compressive strength of 29 MPa (4200 psi) set by FDOT. Figure 4 indicates that the reduction of compressive strength in fly ash and slag concrete mixes evidently increases as the proportion of RAP in concrete increases. The maximum use of 100% RAP will be expected to give a compressive strength of 10.8 MPa for a concrete mix with 20% fly ash and 9.7 MPa for a concrete mix with 50% slag.
There is not any requirement of MOE provided by FDOT or AASHTO for the rigid pavement. However, the MOE plays a pivotal role in developing stresses in concrete slabs. A reduced MOE of RAP concrete mixture will result in lower stresses in the concrete slabs [22]. Table 9 also summarizes the development of MOE and flexural strength of production mixtures at 28 and 90 days. The concrete mixture without RAP indicated the highest values. The concrete mixture with 40% RAP indicated the lowest values in MOE and flexural strength. For all the concrete mixtures, there is a reduction in MOE and flexural strength with increase in the percentage of RAP in the mix.
3.2.2. Test Results of Coefficient of Thermal Expansion
The coefficient of thermal expansion was performed on 100 mm × 200 mm (4″ × 8″) concrete cylinder specimens in accordance with AASHTO TP60 standard test method. Three replicate specimens were tested at each of the different curing times of 28 and 90 days. Coefficient of thermal expansion (CTE) determines the tendency of matter to length change as a function of temperature, which can be used in the analysis of a concrete pavement structure subject to temperature effects. The CTE is one of the significant factors to be considered in the design of concrete pavement. During FE analysis, accurate values of the CTE are needed to predict potential thermal induced-behavior of the concrete pavement. Table 10 summarizes the CTE of the selected production mixes—pure cement and 20% replaced by fly ash concrete only—evaluated in this research study. Average CTE values at 28-day and 90-day curing times are presented. A grand-average CTE value of 7.73 × 10⁻⁶/°C (4.29 × 10⁻⁶/°F) was obtained. This value compared well to the CTE value from an early study using limestone aggregate [37]. There was no strong correlation between the amount of RAP and CTE.
3.2.3. Test Results of Surface Resistivity
The chloride ion penetrability of concrete mixture is one of important factors affecting concrete structure durability. AASHTO T358 was used to determine the chloride ion penetrability of the concrete mixtures incorporating 0%, 20%, 30%, and 40% RAP with pure cement and 20% replaced by fly ash concrete among production mixes. AASHTO provides the level of surface resistivity for likelihood of chloride ion permeability. The results of the surface resistivity (SR) tests are presented in Table 11. According to AASHTO specification of chloride ion penetrability, both the control and RAP concrete mixtures were rated as “Moderate” for possibility of chloride ion penetration issues at 28-day. These concrete mixtures have normal chloride ion penetration performance. Also, the results of surface resistivity exhibited that the resistance of permeability increased as the curing time increased.
3.2.4. Analysis of Modulus of Elasticity and Flexural Strength Reduction
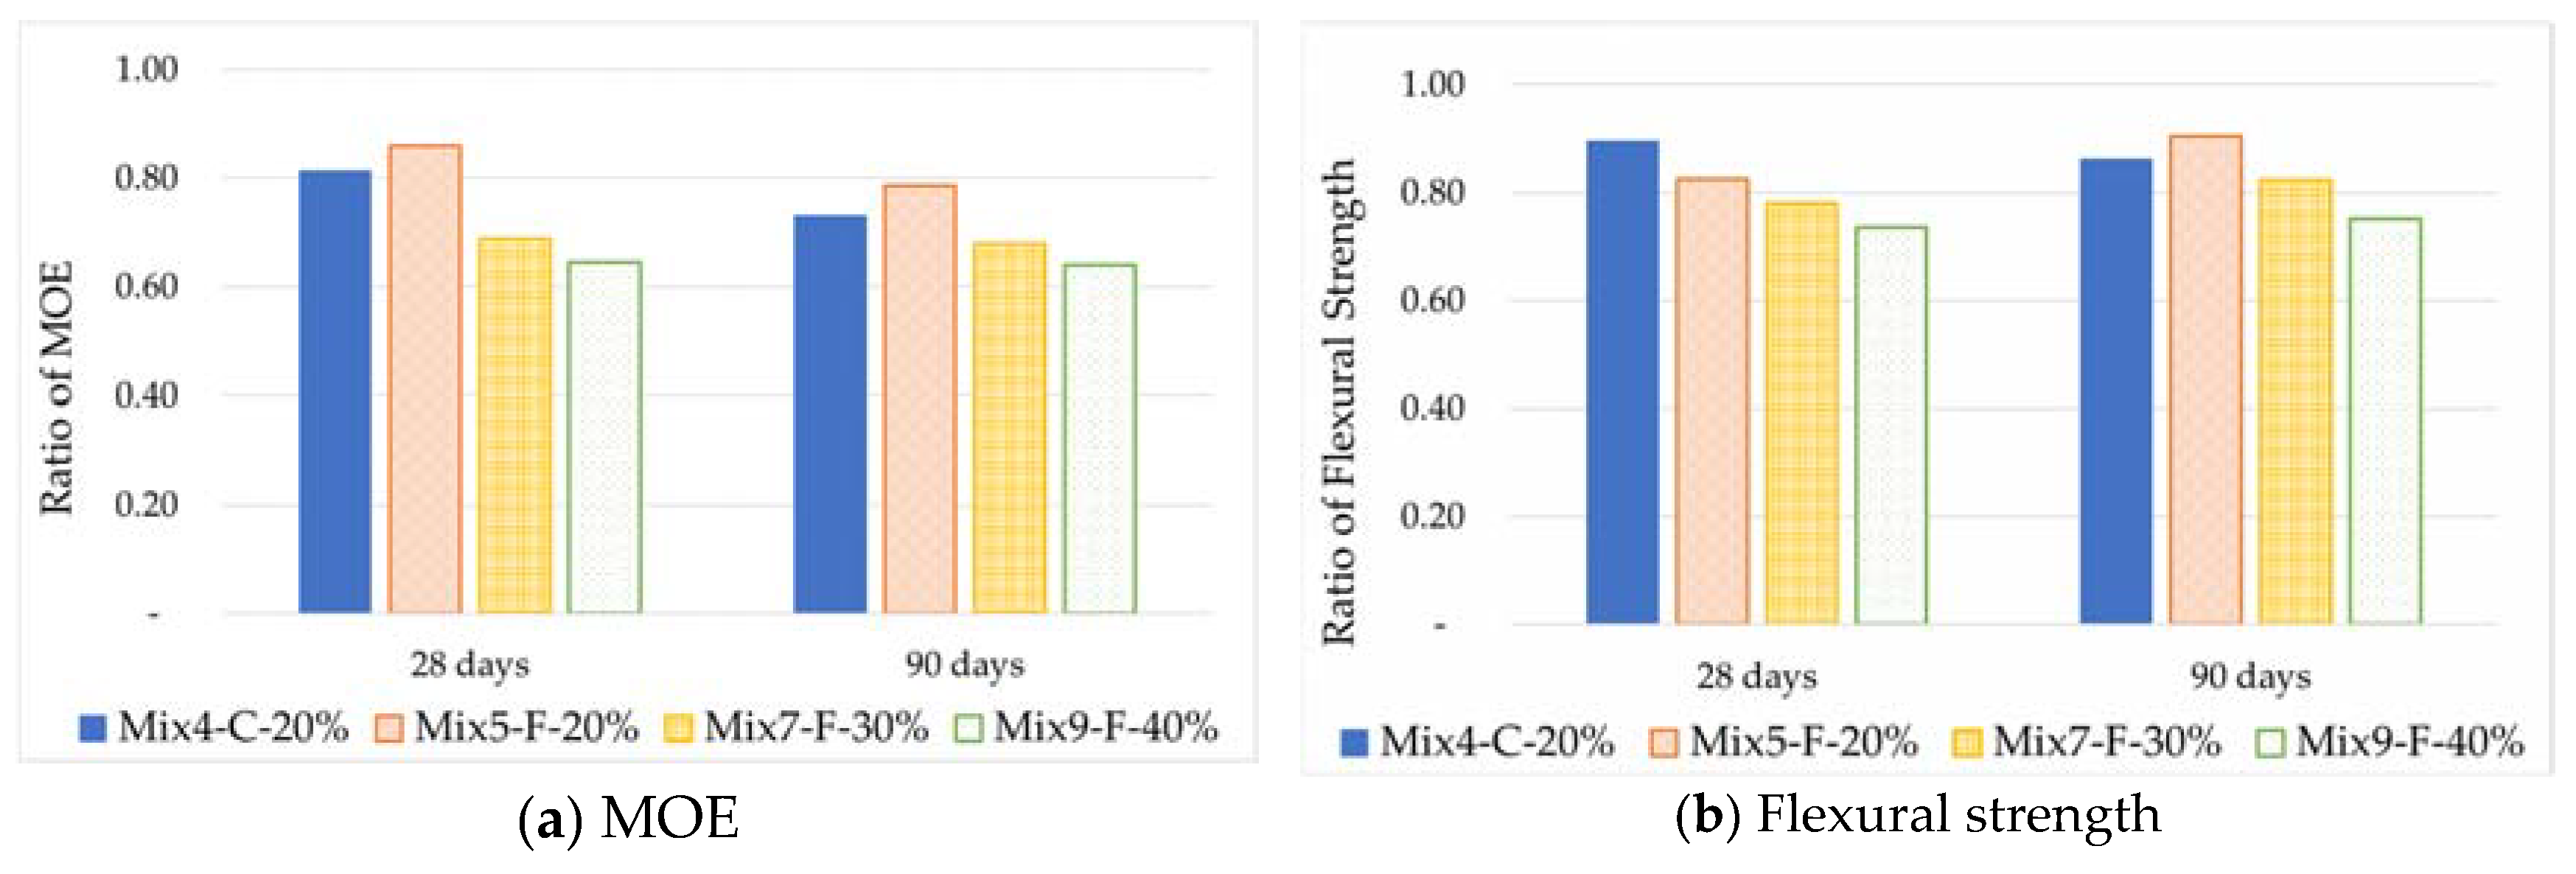
Figure 5a shows the ratio of modulus of elasticity (MOE) of concrete mixtures containing RAP at 28 and 90 days of curing time, relative to that of the normal concrete without RAP. Figure 5b shows the ratio of flexural strength of concrete mixtures containing RAP, relative to the flexural strength of the normal concrete. It can be observed that in general the reduction of flexural strength is less than that of MOE. As a reduction in the MOE of the concrete would reduce the load-temperature induced stresses in the concrete slab, a higher reduction in the MOE of the concrete may compensate for the lower flexural strength of the concrete containing RAP.
4. Evaluation of Potential Performance of RAP Concrete
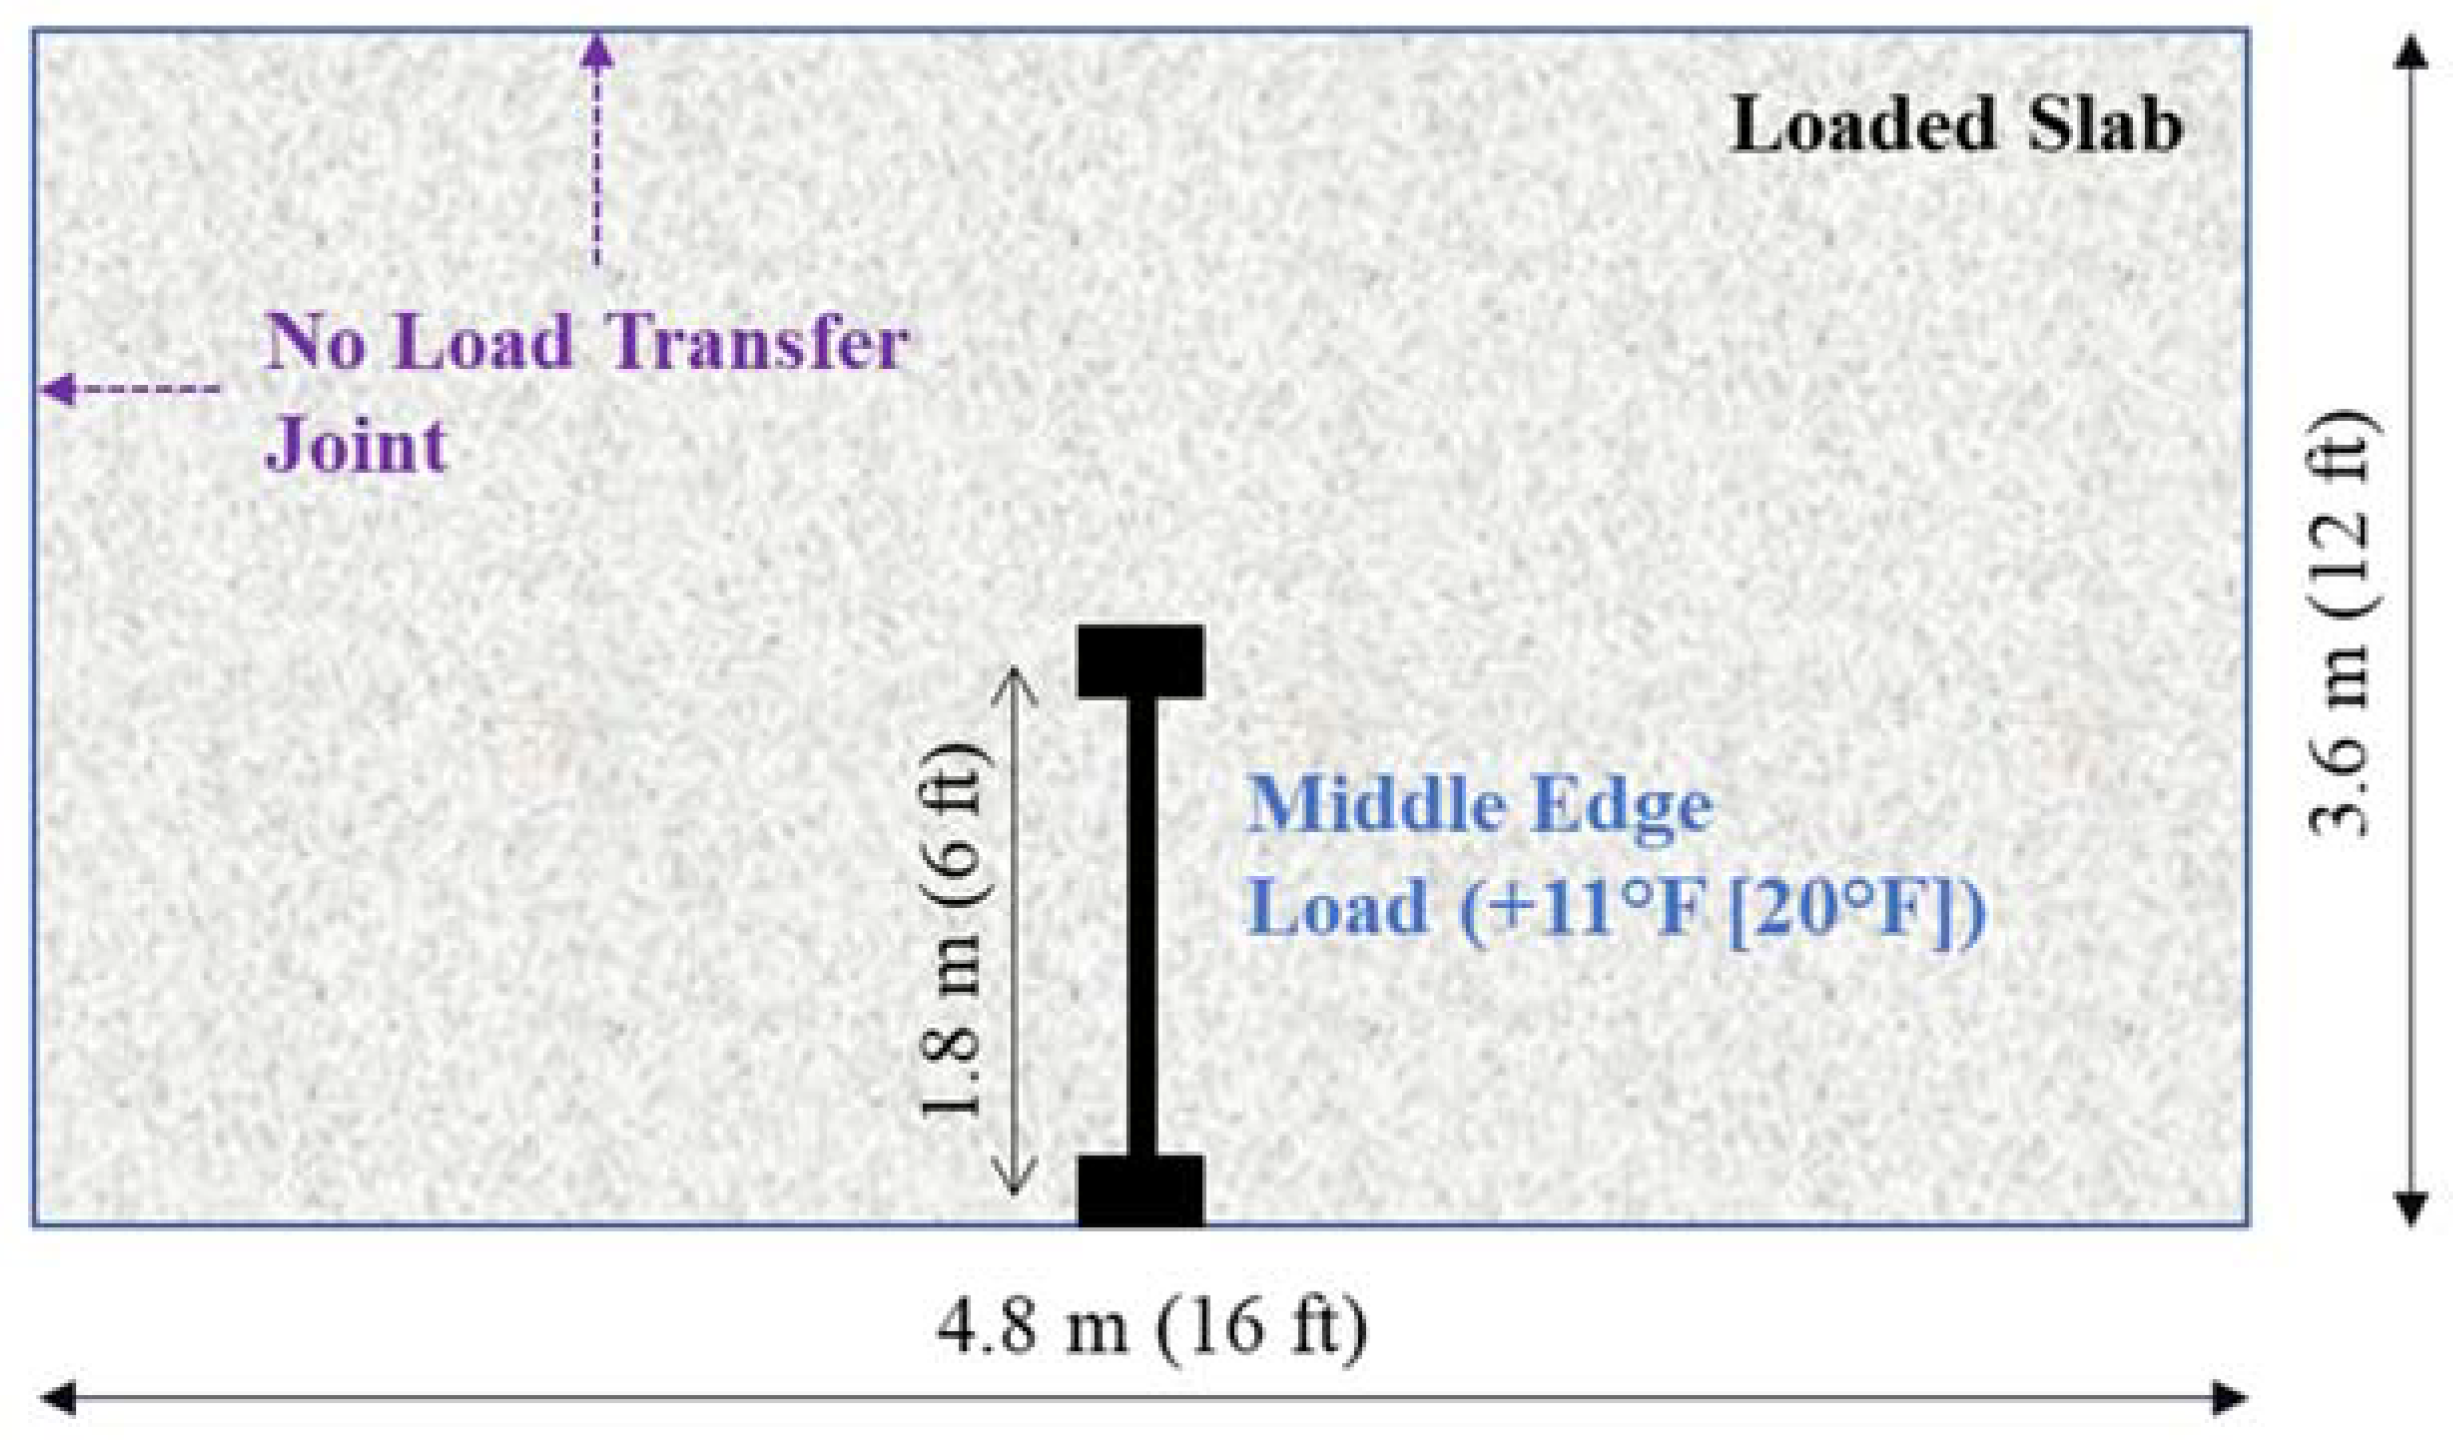
Using the measured elastic modulus and the coefficient of thermal expansion to model the concrete, analysis was performed to determine the maximum stresses in a typical concrete pavement slab if it were under a critical combination of load and temperature condition. An early study conducted by Tia et al. [18] has revealed that a 97.9 kN (22 kip) axle load applied at the middle of the slab edge, when there was a temperature differential of +11.1 °C (+20 °F) in the concrete slab, represents a critical loading condition in Florida. Thus, this loading condition was used in the analysis.
The 3-D finite element (FE) model for jointed concrete pavement which was developed in a prior FDOT-sponsored research study [18] was used to perform the stress analysis. Figure 6 shows the 3-D FE model used to model the pavement slab. The following parameters were used to model the concrete pavement: Slab thickness = 22.9 cm (9 in.); slab length = 4.8 m (16 ft); slab width = 3.6 m (12 ft); elastic modulus of subgrade = 551 MPa (80,000 psi).
Critical stress analyses were performed using the properties of the concrete from the production mixes—pure cement and 20% replaced by fly ash concrete only (all with w/c of 0.50)—at 28-day curing. The maximum stress in the concrete slab under the critical condition was first computed. The maximum computed stress was then divided by the flexural strength of the concrete to obtain the stress to flexural strength ratio, which can indicate the potential performance of the concrete in service. According to fatigue theory, a low stress-to-strength ratio would indicate a higher number of load repetitions to failure and potentially better performance for concrete pavements in the field. The results of this stress analysis are summarized in Table 12.
From the results presented in Table 12, it can be seen that at the critical loading condition, the computed stress-to-strength ratios for Mix1-C-0% (control mix of pure cement), Mix2-F-0% (control mix with 20% fly ash), Mix4-C-20%, Mix5-F-20%, Mix7-F-30%, and Mix9-F-40% are 0.53, 0.50, 0.46, 0.51, 0.46 and 0.44, respectively. Though the two control concretes with 0% RAP had higher flexural strengths than the RAP concrete, the concrete mix with 40% RAP and using pure cement (Mix9-F-40%) had the lowest stress-to-strength ratio of 0.44. The RAP concrete using 20% fly ash and 20%, 30%, and 40% RAP show stress-to-strength ratios which are lower than those for the control mixes with 0% RAP.
5. Cost Analysis
A cost analysis was done to determine the possible cost savings if RAP were to be used as aggregate replacement in concrete mixtures. Table 13 presents the estimated total cost of aggregate in a concrete mixture if 20% and 40% RAP are to be used. The cost figures for a virgin coarse, virgin fine, and local RAP material in Florida were used in this analysis. It can be noted that the total estimated cost of aggregates was USD 51.5, USD 47.1, and USD 42.9 per cubic meter of concrete incorporating 0%, 20%, and 40% RAP, respectively. The saving in aggregate cost is estimated to be 9% and 17% for incorporating 20% and 40% RAP, respectively.
6. Summary of Findings and Conclusion
6.1. Summary of Findings
The main objective of this research project was to develop the mix designs for concrete mixtures incorporating RAP to be used in the Florida Concrete Test Road. The FDOT approved RAP sources were selected and used. Concrete mixtures with 0%, 20%, 30%, and 40% RAP as aggregate replacement, and using 0%, 20% fly ash and 50% slag as cement replacement were designed using optimized aggregate gradation technique. The designed concrete mixes were produced and tested in the laboratory. Critical stress analysis was performed to evaluate the potential performance of a typical concrete pavement in Florida if RAP concretes with the determined properties were used. A cost analysis was also performed to determine the possible saving if RAP materials were used as partial replacement of aggregate in pavement concrete in Florida. The main findings from this study are summarized as follows:
6.1.1. Optimized Aggregate Gradation Procedure
- It was demonstrated that the OAG procedure is superior to the ACI procedure in proportioning aggregates to achieve a well-graded aggregate blend and a workable mix.
- The OAG procedure was used to proportion the aggregates used in the concrete mixes containing RAP in this study. The control mix containing no RAP had a gap-graded aggregate which lacked intermediate-size particles. When 20% or 40% RAP materials were incorporated using the OAG procedure, the aggregate blend became significantly more well-graded and the concrete became more workable.
6.1.2. Properties of Concrete Incorporating RAP
- All the RAP concrete mixture could be produced to achieve a target slump of 2.54 to 5.08 cm (1 to 2 in.) and a target air content of 2% to 5% with an appropriate amount of water-reducing and retarding admixture. The needed dosage of water-reducing admixture increased as the percentage RAP increased.
- The over-design compressive strength of 29 MPa (4200 psi) could not be achieved by the concrete mixes containing 30% or more RAP.
- The compressive strength, modulus of elasticity, and flexural strength decreased as the percentage of RAP increased in the concrete mixture.
- The reduction in flexural strength in the concrete containing RAP was 5% to 15% lower than the corresponding reduction in compressive strength of the concrete containing RAP.
- The rate of reduction in MOE in the concrete containing RAP was slightly lower than the corresponding reduction in compressive strength of the concrete containing RAP.
- The CTE of concrete does not clearly show a strong relationship with the amount of RAP.
- Even though the inclusion of RAP in concrete mix resulted in the reduction of slump and strength, the RAP mixes observed to reduce the MOE, which is the favorable effect to yield the less stress for the pavement material.
6.1.3. Results of Critical Stress Analysis
- The results of critical stress analysis indicate that the RAP concrete using 20% fly ash and 20%, 30%, or 40% RAP with a w/c ratio of 0.50 could have better potential performance than a concrete mix with 0% RAP and using pure cement and the same w/c.
6.1.4. Results of Cost Analysis
- A cost analysis on the replacement of aggregate with RAP indicates that using 20% and 40% RAP in concrete could result in saving in the total cost of aggregate by 9% and 17%, respectively.
6.2. Recommendation
Based on the results of this study, it is recommended that 20% of minimally refined RAP can be used as aggregate replacement in pavement concrete. All specification requirements for pavement concrete should also apply to concrete containing RAP. The RAP material should be used as-is without pre-soaking prior to mixing in concrete production to avoid degradation of the RAP material due to excessive handling. It is recommended that the OAG procedure be used to proportion the aggregates and RAP materials to ensure a well-graded gradation and a workable concrete mix. The recommended testing framework applies to concrete specifications in Florida. The testing framework may have to be adjusted according to the concrete specifications for a particular highway agency.
Author Contributions
Formal Analysis, S.H.; Writing-Original Draft Preparation, S.H.; Investigation, H.-W.C.; Resources, T.S.; Funding Acquisition, M.T.; Writing-Review, M.T.
Funding
This research was funded by Florida Department of Transportation grant number [BDV31-977-80].
Acknowledgments
The Florida Department of Transportation (FDOT) is gratefully acknowledged for providing the financial support that made this study possible (FDOT Project No. BDV31-977-80.) The authors would like to acknowledge the FDOT’s State Materials Office Pavement Materials Section staff for their assistance with data collection, materials testing, and technical advice.
Conflicts of Interest
The authors declare no conflict of interest.
References
- Cao, Z.; Shen, L.; Zhao, J.; Liu, L.; Zhong, S.; Sun, Y.; Yang, Y. Toward a better practice for estimating the CO2 emission factors of cement production: An experience from China. J. Clean. Prod. 2016, 139, 527–539. [Google Scholar] [CrossRef]
- Mukharjee, B.B.; Barai, S.V. Influence of incorporation of nano-silica and recycled aggregates on compressive strength and microstructure of concrete. Comput. Chem. Eng. 2014, 71, 570–578. [Google Scholar] [CrossRef]
- Tia, M.; Hossiney, N.; Su, Y.-M.; Chen, Y.; Do, T.A. Use of Reclaimed Asphalt Pavement in Concrete Pavement Slabs; Florida Department of Transportation: Tallahassee, FL, USA, 2012.
- Federal Highway Administration Research and Innovative Technology. User Guidelines for Waste and Byproduct Materials in Pavement Construction. 2016. Available online: https://www.fhwa.dot.gov/publications/research/infrastructure/structures/97148/rap131.cfm (accessed on 9 September 2017).
- Copeland, A. Reclaimed Asphalt Pavement in Asphalt Mixtures: State of the Practice; FHWA-HRT-11-021; FHWA: Washington, DC, USA, 2011.
- Hansen, K.R.; Copeland, A. Asphalt Pavement Industry Survey on Recycled Materials and Warm-mix Asphalt Usage; NAPA: Lanham, MD, USA, 2017. [Google Scholar]
- Tošić, N.; Marinković, S.; Dašić, T.; Stanić, M. Multicriteria optimization of natural and recycled aggregate concrete for structural use. J. Clean. Prod. 2015, 87, 766–776. [Google Scholar] [CrossRef]
- Al-Oraimi, S.; Hassan, H.F.; Hago, A. Recycling of reclaimed asphalt pavement in Portland cement concrete. J. Eng. Res. 2009, 6, 37–45. [Google Scholar] [CrossRef]
- Berry, M.; Kappes, B.; Kappes, L. Optimization of concrete mixtures containing reclaimed asphalt pavement. ACI Materer. J. 2015, 112, 723–733. [Google Scholar] [CrossRef]
- Brand, A.S.; Roesler, J.R. Ternary concrete with fractionated reclaimed asphalt pavement. ACI Mater. J. 2015, 112, 155–163. [Google Scholar] [CrossRef]
- Delwar, M.; Fahmy, M.; Taha, R. Use of Reclaimed asphalt pavement as an aggregate in portland cement concrete. ACI Mater. J. 1997, 94, 251–256. [Google Scholar]
- Hassan, K.E.; Brooks, J.J.; Erdman, M. The use of reclaimed asphalt pavement (RAP) aggregates in concrete. Waste Manag. Ser. 2000, 1, 121–128. [Google Scholar]
- Modarres, A.; Hosseini, Z. Mechanical properties of roller compacted concrete containing rice husk ash with original and recycled asphalt pavement material. Mater. Des. 2014, 64, 227–236. [Google Scholar] [CrossRef]
- Okafor, F.O. Performance of recycled asphalt pavement as coarse aggregate in concrete. Leonardo Electron. J. Prac. Technol. 2010, 9, 47–58. [Google Scholar]
- Singh, S.; Ransinchung, G.D.R.N.; Kumar, P. Feasibility study of RAP aggregates in cement concrete pavements. Road Mater. Pavement Des. 2017, 629, 1–20. [Google Scholar] [CrossRef]
- Huang, B.; Shu, X.; Li, G. Laboratory investigation of portland cement concrete containing recycled asphalt pavements. Cem. Concr. Res. 2005, 35, 2008–2013. [Google Scholar] [CrossRef]
- Brand, A.S.; Roesler, J.R. Bonding in cementitious materials with asphalt-coated particles: Part I—The interfacial transition zone. Constr. Build. Mater. 2017, 130, 171–181. [Google Scholar] [CrossRef]
- Tia, M.; Kim, K.; Han, S. Improved Analysis Tool for Concrete Pavement; Research Report; Florida Department of Transportation: Tallahassee, FL, USA, 2017.
- Brand, A.S.; Roesler, J.R.; Al-Qadi, I.L.; Shangguan, P. Fractionated Reclaimed Asphalt Pavement (FRAP) as a Coarse Aggregate Replacement in a Ternary Blended Concrete Pavement; Research Report ICT-12-008; Illinois Center for Transportation: Urbana, IL, USA, 2012. [Google Scholar]
- Florida Department of Transportation. Standard Specifications for Road and Bridge Construction; Florida Department of Transportation: Tallahassee, FL, USA, 2017.
- Abdel-Mohti, A.; Shen, H.; Khodair, Y. Characteristics of self-consolidating concrete with RAP and SCM. Constr. Build. Mater. 2016, 102, 564–573. [Google Scholar] [CrossRef]
- Hossiney, N.; Tia, M.; Bergin, M.J. Concrete containing recycled concrete aggregate for use in concrete pavement. Int. J. Pavement Res. Technol. 2010, 3, 251–258. [Google Scholar] [CrossRef]
- Ibrahim, A.; Mahmoud, E.; Khodair, Y.; Patibandla, V.C. Fresh, mechanical, and durability characteristics of self-consolidating concrete incorporating recycled asphalt pavements. J. Mater. Civ. Eng. 2014, 26, 668–675. [Google Scholar] [CrossRef]
- Mahmoud, E.; Ibrahim, A.; El-Chabib, H.; Patibandla, V.C. Self-consolidating concrete incorporating high Volume of fly ash, slag, and recycled asphalt pavement. Int. J. Concr. Struct. Mater. 2013, 7, 155–163. [Google Scholar] [CrossRef]
- ACI Committee 211. 1. Standard Practice for Selecting Proportions for Normal, Heavyweight, and Mass Concrete; ACI 211.1-91; American Concrete Institute: Farmington Hills, MI, USA, 2002. [Google Scholar]
- Cramer, S.M.; Hall, M.; Parry, J. Effect of optimized total aggregate gradation on Portland cement concrete for Wisconsin pavements. Transp. Res. Rec. 1995, 1478, 100–106. [Google Scholar]
- Darwin, D.; Browning, J.; McLeod, H.; Lindquist, W.; Yuan, J. Implementing lessons learned from twenty years of bridge-deck crack surveys. Spec. Publ. 2012, 284, 1–18. [Google Scholar]
- Huang, B.; Shu, X.; Burdette, E.G. Mechanical properties of concrete containing recycled asphalt pavements. Mag. Concr. Res. 2006, 58, 313–320. [Google Scholar] [CrossRef]
- Mathias, V.; Sedran, T.; de Larrard, F. Modelling of mechanical properties of cement concrete incorporating reclaimed asphalt pavement. Road Mater. Pavement Des. 2009, 10, 63–82. [Google Scholar] [CrossRef]
- Singh, S.; Ransinchung, G.D.; Kumar, P. An economical processing technique to improve RAP inclusive concrete properties. Constr. Build. Mater. 2017, 148, 734–747. [Google Scholar] [CrossRef]
- Singh, S.; Ransinchung, G.D.; Debbarma, S.; Kumar, P. Utilization of reclaimed asphalt pavement aggregates containing waste from Sugarcane Mill for production of concrete mixes. J. Clean. Prod. 2018, 174, 42–52. [Google Scholar] [CrossRef]
- AASHTO PP84. Standard Practice for Developing Performance Engineered Concrete Pavement Mixtures; American Association of State Highway and Transportation Officials: Washington, DC, USA, 2017; Available online: https://www.techstreet.com/standards/aashto-pp-84-18?product_id=2012544 (accessed on 23 July 2018).
- Lindquist, W.; Darwin, D.; Browning, J.; McLeod, H.A.K.; Yuan, J.; Reynolds, D. Implementation of concrete aggregate optimization. Constr. Build. Mater. 2015, 74, 49–56. [Google Scholar] [CrossRef]
- MDT Concrete Aggregate Combined Gradation Example; Montana Department of Transportation: Helena, MA, USA, 2016. Available online: https://www.mdt.mt.gov/other/webdata/external/const/manuals_guidelines/combined_gradation_example.pdf (accessed on 23 July 2018).
- Goltermann, P.; Johansen, V.; Palbøl, L. Packing of aggregates: An alternative tool to determine the optimal aggregate mix. ACI Mater. J. 1997, 94, 435–443. [Google Scholar]
- Darwin, D.; Lindquist, W.D.; McLeod, H.A.K.; Browning, J. Mineral Admixtures, Curing, and Concrete Shrinkage—An Update. Concr. Technol. 2007, 1, 56–65. Available online: https://www.researchgate.net/publication/238490627_Mineral_Admixtures_Curing_and_Concrete_Shrinkage_-_An_Update (accessed on 23 July 2018).
- Hall, K.; Tayabji, S. Coefficient of Thermal Expansion in Concrete Pavement Design; FHWA-HIF-09-015; FHWA: Washington, DC, USA, 2011.
Figure 1.
Preparation of RAP and process of concrete mixing.

Figure 2.
(a) Coarseness factor chart for concrete mixtures containing RAP; (b) Percent retained chart for concrete mixtures containing RAP; (c) 0.45 power chart for aggregate gradation of concrete mixtures containing RAP.
Figure 2.
(a) Coarseness factor chart for concrete mixtures containing RAP; (b) Percent retained chart for concrete mixtures containing RAP; (c) 0.45 power chart for aggregate gradation of concrete mixtures containing RAP.

Figure 3.
Coarseness factor chart of aggregate blends using optimized aggregate gradation (OAG) versus American Concrete Institute (ACI) procedure.
Figure 3.
Coarseness factor chart of aggregate blends using optimized aggregate gradation (OAG) versus American Concrete Institute (ACI) procedure.

Figure 4.
Relationship between compressive strength and RAP percentage.

Figure 5.
Ratios of MOE and flexural strength relative to the MOE and flexural strength of the control mix. Note: C and F designate mix using pure Cement and mix using Fly ash, respectively; 20% designates 20% RAP.
Figure 5.
Ratios of MOE and flexural strength relative to the MOE and flexural strength of the control mix. Note: C and F designate mix using pure Cement and mix using Fly ash, respectively; 20% designates 20% RAP.

Figure 6.
3-D FE model for analysis under critical loading condition.


Table 1.
Percent replacement of reclaimed asphalt pavement (RAP) used in various study and associated compressive strength.
Table 1.
Percent replacement of reclaimed asphalt pavement (RAP) used in various study and associated compressive strength.
| Cementitious Proportion (%) | Maximum RAP Replacement (%) | 28-Day Compressive Strength 1 (MPa) | ||||
|---|---|---|---|---|---|---|
| Cement | Fly Ash | Slag | Coarse | Fine | ||
| Berry et al. [9] | 85 | 15 | ‒ | 100 | 50 | 16 |
| Brand and Roesler [10] | 65 | 10 | 25 | 50 | 0 | 28 |
| Huang et al. [16] | 100 | ‒ | ‒ | 100 | 100 | 10 |
| Abdel-Mohti et al. [21] | 100 | ‒ | ‒ | 40 | 0 | 32 |
| Hossiney et al. [22] | 100 | ‒ | ‒ | 40 | 40 | 17 |
| Ibrahim et al. [23] | 100 | ‒ | ‒ | 50 | 0 | 41 |
| Mahmoud et al. [24] | 100 | ‒ | ‒ | 50 | 0 | 41 |
Note: 1 The value of compressive strength is obtained from the concrete sample of 100 mm × 200 mm (4″ × 8″) in accordance with ASTM C39/C39M.
Table 2.
Specific gravity and water absorption of virgin aggregates and RAP.
| Property | Virgin Fine | Virgin Coarse | RAP |
|---|---|---|---|
| Bulk Specific Gravity (SSD) | 2.645 | 2.449 | 2.412 |
| Bulk Specific Gravity (Dry) | 2.638 | 2.361 | 2.391 |
| Apparent Specific Gravity (Dry) | 2.657 | 2.589 | 2.442 |
| Water Absorption (%) | 0.30 | 3.70 | 0.84 |
Table 3.
Results of sieve analysis on the virgin aggregates and RAP.
| Sieve Size No. | Sieve Size (mm) | % Passing | ||
|---|---|---|---|---|
| Virgin Fine | Virgin Coarse | RAP | ||
| 1½″ | 37.500 | ‒ | 100.0 | 100.0 |
| 1″ | 25.000 | ‒ | 99.7 | 100.0 |
| 3/4″ | 19.000 | ‒ | 62.7 | 100.0 |
| 1/2″ | 12.500 | ‒ | 43.9 | 94.7 |
| 3/8″ | 9.500 | ‒ | 27.4 | 84.4 |
| #4 | 4.750 | 99.5 | 6.6 | 56.4 |
| #8 | 2.360 | 96.4 | 5.1 | 35.5 |
| #16 | 1.180 | 87.6 | ‒ | 20.3 |
| #30 | 0.600 | 69.1 | ‒ | 9.0 |
| #50 | 0.300 | 23.7 | ‒ | 2.5 |
| #100 | 0.150 | 1.5 | ‒ | 0.7 |
| #200 | 0.075 | 0.1 | ‒ | 0.2 |
Note: # indicates each sieve number
Table 4.
Fresh and hardened concrete properties for pavement according to Florida Department of Transportation’s (FDOT) specifications.
Table 4.
Fresh and hardened concrete properties for pavement according to Florida Department of Transportation’s (FDOT) specifications.
| Properties | Specification FDOT [20] | Specification AASHOTO PP84 [32] | |
|---|---|---|---|
| Cement Content | kg/m3 (lb/yd3) | Minimum: 278.8 (470) | N/A |
| Fly Ash Content | % replacement | 18–30 | N/A |
| Slump | cm (in.) | 1.27–8.89 (0.5–3.5) | N/A |
| Air Content | % | 1.0–6.0 | N/A |
| w/c | ratio | Maximum: 0.5 | Maximum: 0.5 |
| Volume of Paste | ratio | N/A | Target: 0.25 |
| Compressive Strength | MPa (psi) | Regular Design: 21 (3000) Over-design: 29 (4200) | 24 (3500) |
| Flexural Strength | MPa (psi) | N/A | 4 (600) |
Table 5.
Mix proportions of concrete containing RAP.
| Mix No. | Cement (kg/m3) | Fly Ash (kg/m3) | Slag (kg/m3) | Fine (kg/m3) | RAP (kg/m3) | Coarse (kg/m3) | w/c Ratio | |
|---|---|---|---|---|---|---|---|---|
| Trial Mixes (12) | Mix1-T-20% | 334 | 0 | 0 | 466 | 358 | 968 | 0.43 |
| Mix2-T-20% | 260 | 65 | 0 | 466 | 358 | 968 | 0.43 | |
| Mix3-T-40% | 260 | 65 | 0 | 355 | 711 | 711 | 0.43 | |
| Mix4-T-20% | 326 | 0 | 0 | 466 | 358 | 968 | 0.45 | |
| Mix5-T-20% | 254 | 63 | 0 | 466 | 358 | 968 | 0.45 | |
| Mix6-T-40% | 254 | 63 | 0 | 355 | 711 | 711 | 0.45 | |
| Mix7-T-20% | 318 | 0 | 0 | 465 | 358 | 967 | 0.47 | |
| Mix8-T-20% | 247 | 62 | 0 | 466 | 358 | 968 | 0.47 | |
| Mix9-T-40% | 247 | 62 | 0 | 356 | 712 | 712 | 0.47 | |
| Mix10-T-20% | 306 | 0 | 0 | 465 | 358 | 967 | 0.50 | |
| Mix11-T-20% | 239 | 59 | 0 | 465 | 358 | 967 | 0.50 | |
| Mix12-T-40% | 239 | 59 | 0 | 355 | 711 | 711 | 0.50 | |
| Production Mixes (10) | Mix1-C-0% | 306 | 0 | 0 | 613 | 0 (Control) | 1190 | 0.50 |
| Mix2-F-0% | 239 | 60 | 0 | 613 | 0 (Control) | 1190 | 0.50 | |
| Mix3-S-0% | 150 | 0 | 150 | 613 | 0 (Control) | 1191 | 0.50 | |
| Mix4-C-20% | 306 | 0 | 0 | 484 | 358 | 949 | 0.50 | |
| Mix5-F-20% | 239 | 60 | 0 | 484 | 358 | 949 | 0.50 | |
| Mix6-S-20% | 150 | 0 | 150 | 484 | 358 | 949 | 0.50 | |
| Mix7-F-30% | 239 | 60 | 0 | 428 | 535 | 821 | 0.50 | |
| Mix8-S-30% | 150 | 0 | 150 | 428 | 535 | 820 | 0.50 | |
| Mix9-F-40% | 239 | 60 | 0 | 373 | 710 | 693 | 0.50 | |
| Mix10-S-40% | 150 | 0 | 150 | 373 | 711 | 693 | 0.50 | |
Note: T, C, F, S designate Trial mix, mix using pure Cement, mix using Fly ash, and mix using Slag, respectively; 20% designates 20% RAP.
Table 6.
Gradations of blended aggregates of concrete using RAP.
| % Passing Sieve (mm) | RAP 0% (Control) | RAP 20% | RAP 30% | RAP 40% |
|---|---|---|---|---|
| Corse 68% | Corse 54% | Corse 46% | Corse 40% | |
| Fine 32% | Fine 26% | Fine 24% | Fine 20% | |
| 37.500 | 100.0 | 100.0 | 100.0 | 100.0 |
| 25.000 | 99.8 | 99.8 | 99.9 | 99.9 |
| 19.000 | 74.6 | 79.9 | 82.8 | 85.1 |
| 12.500 | 61.9 | 68.6 | 72.6 | 75.4 |
| 9.500 | 50.6 | 57.7 | 61.9 | 64.7 |
| 4.750 | 36.4 | 40.8 | 43.9 | 45.1 |
| 2.360 | 34.3 | 34.9 | 36.2 | 35.5 |
| 1.180 | 27.6 | 26.5 | 26.8 | 25.4 |
| 0.600 | 20.1 | 18.2 | 17.8 | 16.2 |
| 0.300 | 6.7 | 5.9 | 5.8 | 5.2 |
| 0.150 | 0.7 | 0.7 | 0.8 | 0.7 |
| 0.075 | 0.1 | 0.1 | 0.1 | 0.1 |
Table 7.
Fresh concrete properties of the mixtures evaluated.
| Mix No. | Fly Ash (%) | Slag (%) | RAP (%) | w/c Ratio | Slump (cm) | Unit Weight (kg/m3) | Air Content (%) | Temp. (°C) | Bleeding (mL) |
|---|---|---|---|---|---|---|---|---|---|
| Trial Mixtures with w/c Ratios of 0.50 through 0.43 | |||||||||
| Mix1-T-20% | 0 | 0 | 20 | 0.50 | 2.54 | 2271 | 3.00 | 20 | − |
| Mix2-T-20% | 20 | 0 | 20 | 0.50 | 2.54 | 2300 | 2.75 | 22 | − |
| Mix3-T-40% | 20 | 0 | 40 | 0.50 | 2.54 | 2254 | 3.25 | 21 | − |
| Mix4-T-20% | 0 | 0 | 20 | 0.47 | 3.18 | 2273 | 2.25 | 22 | − |
| Mix5-T-20% | 20 | 0 | 20 | 0.47 | 5.08 | 2265 | 2.50 | 22 | − |
| Mix6-T-40% | 20 | 0 | 40 | 0.47 | 2.54 | 2243 | 3.25 | 21 | − |
| Mix7-T-20% | 0 | 0 | 20 | 0.45 | 3.18 | 2265 | 2.50 | 21 | − |
| Mix8-T-20% | 20 | 0 | 20 | 0.45 | 4.45 | 2267 | 2.25 | 22 | − |
| Mix9-T-40% | 20 | 0 | 40 | 0.45 | 3.18 | 2255 | 3.00 | 21 | − |
| Mix10-T-20% | 0 | 0 | 20 | 0.43 | 3.18 | 2305 | 1.75 | 22 | − |
| Mix11-T-20% | 20 | 0 | 20 | 0.43 | 2.54 | 2278 | 2.50 | 22 | − |
| Mix12-T-40% | 20 | 0 | 40 | 0.43 | 3.18 | 2233 | 3.50 | 22 | − |
| Production Mixtures with the Fixed w/c Ratio of 0.50 | |||||||||
| Mix1-C-0% | 0 | 0 | 0 | 0.50 | 5.08 | 2283 | 3.25 | 22 | 68 |
| Mix2-F-0% | 20 | 0 | 0 | 0.50 | 8.89 | 2283 | 2.00 | 22 | 89 |
| Mix3-S-0% | 0 | 50 | 0 | 0.50 | 3.81 | 2308 | 2.50 | 20 | − |
| Mix4-C-20% | 0 | 0 | 20 | 0.50 | 4.45 | 2252 | 3.50 | 22 | 29 |
| Mix5-F-20% | 20 | 0 | 20 | 0.50 | 3.81 | 2247 | 3.25 | 22 | 36 |
| Mix6-S-20% | 0 | 50 | 20 | 0.50 | 3.81 | 2253 | 3.50 | 20 | − |
| Mix7-F-30% | 20 | 0 | 30 | 0.50 | 3.18 | 2230 | 4.00 | 22 | 32 |
| Mix8-S-30% | 0 | 50 | 30 | 0.50 | 3.81 | 2225 | 4.75 | 20 | − |
| Mix9-F-40% | 20 | 0 | 40 | 0.50 | 3.81 | 2233 | 4.00 | 22 | 36 |
| Mix10-S-40% | 0 | 50 | 40 | 0.50 | 3.81 | 2225 | 4.25 | 20 | − |
Note: T, C, F, S designate Trial mix, mix using pure Cement, mix using Fly ash, and mix using Slag, respectively; 20% designates 20% RAP.
Table 8.
Compressive strength of trial concrete mixes containing RAP.
| Mix No. | Fly Ash (%) | RAP (%) | w/c Ratio | Average Compressive Strength (MPa) | |
|---|---|---|---|---|---|
| 7-Day | 28-Day | ||||
| Mix1-T-20% | 0 | 20 | 0.50 | 30.9 | 38.7 |
| Mix2-T-20% | 20 | 20 | 0.50 | 28.8 | 36.5 |
| Mix3-T-40% | 20 | 40 | 0.50 | 19.2 | 25.0 |
| Mix4-T-20% | 0 | 20 | 0.47 | 31.7 | 37.4 |
| Mix5-T-20% | 20 | 20 | 0.47 | 24.4 | 31.4 |
| Mix6-T-40% | 20 | 40 | 0.47 | 18.7 | 25.3 |
| Mix7-T-20% | 0 | 20 | 0.45 | 33.1 | 41.4 |
| Mix8-T-20% | 20 | 20 | 0.45 | 27.4 | 36.4 |
| Mix9-T-40% | 20 | 40 | 0.45 | 20.1 | 27.2 |
| Mix10-T-20% | 0 | 20 | 0.43 | 37.3 | 43.9 |
| Mix11-T-20% | 20 | 20 | 0.43 | 28.3 | 36.5 |
| Mix12-T-40% | 20 | 40 | 0.43 | 19.9 | 25.6 |
Note: T designates Trial mix; 20% designates 20% RAP.
Table 9.
Compressive strength, modulus of elasticity (MOE), and flexural strength of production concrete mixes.
Table 9.
Compressive strength, modulus of elasticity (MOE), and flexural strength of production concrete mixes.
| Mix No. | Compressive Strength (MPa) | MOE (GPa) | Flexural Strength (MPa) | |||
|---|---|---|---|---|---|---|
| 28-Day | 90-Day | 28-Day | 90-Day | 28-Day | 90-Day | |
| Mix1-C-0% | 46.0 | 51.8 | 35.2 | 38.3 | 5.2 | 5.7 |
| Mix2-F-0% | 37.2 | 41.8 | 32.1 | 35.5 | 5.0 | 5.5 |
| Mix3-S-0% | 45.6 | 55.0 | 33.4 | 38.3 | − | − |
| Mix4-C-20% | 36.2 | 39.0 | 28.6 | 27.9 | 4.7 | 4.9 |
| Mix5-F-20% | 30.6 | 36.9 | 27.6 | 27.9 | 4.1 | 5.0 |
| Mix6-S-20% | 33.8 | 40.2 | 26.2 | 29.3 | − | − |
| Mix7-F-30% | 25.6 | 30.6 | 22.1 | 24.1 | 3.9 | 4.5 |
| Mix8-S-30% | 27.8 | 33.4 | 22.1 | 25.9 | − | − |
| Mix9-F-40% | 22.3 | 27.0 | 20.7 | 22.8 | 3.7 | 4.1 |
| Mix10-S-40% | 25.1 | 30.5 | 20.0 | 24.8 | − | − |
Note: C, F, S designate mix using pure Cement, mix using Fly ash, and mix using Slag, respectively; 20% designates 20% RAP.
Table 10.
Coefficient of thermal expansion (CTE) of concrete mixtures evaluated.
| Mix No. | Fly Ash (%) | RAP (%) | w/c Ratio | Average CTE of RAP Mixtures (10−6/°C) | |
|---|---|---|---|---|---|
| 28-Day | 90-Day | ||||
| Mix1-C-0% | 0 | 0 | 0.50 | 7.96 | 7.49 |
| Mix2-F-0% | 20 | 0 | 0.50 | 8.08 | 7.61 |
| Mix4-C-20% | 0 | 20 | 0.50 | 7.42 | 7.70 |
| Mix5-F-20% | 20 | 20 | 0.50 | 7.80 | 7.81 |
| Mix7-F-30% | 20 | 30 | 0.50 | 7.58 | 7.90 |
| Mix9-F-40% | 20 | 40 | 0.50 | 7.58 | 7.87 |
Note: C and F designate mix using pure Cement and mix using Fly ash, respectively; 20% designates 20% RAP.
Table 11.
Surface resistivity of concrete mixtures evaluated.
| Mix No. | Fly Ash (%) | RAP (%) | w/c Ratio | Average Surface Resistivity of RAP Mixtures (KΩ·cm) | ||
|---|---|---|---|---|---|---|
| 28-Day | 56-Day | 90-Day | ||||
| Mix1-C-0% | 0 | 0 | 0.50 | 7.3 | 8.0 | 8.9 |
| Mix2-F-0% | 20 | 0 | 0.50 | 7.0 | 10.3 | 14.0 |
| Mix4-C-20% | 0 | 20 | 0.50 | 7.1 | 8.0 | 8.6 |
| Mix5-F-20% | 20 | 20 | 0.50 | 7.3 | 10.5 | 21.4 |
| Mix7-F-30% | 20 | 30 | 0.50 | 7.0 | 11.8 | 16.4 |
| Mix9-F-40% | 20 | 40 | 0.50 | 8.2 | 12.6 | 17.3 |
Note: C and F designate mix using pure Cement and mix using Fly ash, respectively; 20% designates 20% RAP.
Table 12.
Computed maximum stresses and stress-to-strength ratios.
| Mix No. | Fly Ash (%) | RAP (%) | CTE (10−6/°C) | MOE (GPa) | Flexural Strength (MPa) | Computed Stress-Strength Ratio |
|---|---|---|---|---|---|---|
| Mix1-C-0% | 0 | 0 | 7.96 | 35.2 | 5.24 | 2.80 (0.53) |
| Mix2-F-0% | 20 | 0 | 8.08 | 32.1 | 5.01 | 2.53 (0.50) |
| Mix4-C-20% | 0 | 20 | 7.42 | 28.6 | 4.69 | 2.14 (0.46) |
| Mix5-F-20% | 20 | 20 | 7.80 | 27.6 | 4.14 | 2.11 (0.51) |
| Mix7-F-30% | 20 | 30 | 7.58 | 22.1 | 3.92 | 1.79 (0.46) |
| Mix9-F-40% | 20 | 40 | 7.58 | 20.7 | 3.69 | 1.64 (0.44) |
Note: C and F designate mix using pure Cement and mix using Fly ash, respectively; 20% designates 20% RAP.
Table 13.
Estimated total cost of aggregate in mixes containing different percentages of RAP.
| Virgin Coarse | Virgin Fine | Local RAP | Total | |||||
|---|---|---|---|---|---|---|---|---|
| Local Price ($/1000 kg) | 27.2 | 31.0 | 17.5 | 25.2 | ||||
| 0% RAP Mix ($/m3) | 32.4 | 66% | 19.0 | 34% | 0.0 | 0% | 51.5 | Control |
| 20% RAP Mix ($/m3) | 25.8 | 54% | 15.0 | 26% | 6.3 | 20% | 47.1 | –9% |
| 40% RAP Mix ($/m3) | 18.9 | 40% | 11.6 | 20% | 12.4 | 40% | 42.9 | –17% |
© 2018 by the authors. Licensee MDPI, Basel, Switzerland. This article is an open access article distributed under the terms and conditions of the Creative Commons Attribution (CC BY) license (http://creativecommons.org/licenses/by/4.0/).
Share and Cite
MDPI and ACS Style
Han, S.; Chung, H.-W.; Subgranon, T.; Tia, M. Development of Mix Designs for Minimally Refined Reclaimed Asphalt Pavement (RAP) Concrete for Florida Concrete Test Road. Sustainability 2018, 10, 2598. https://doi.org/10.3390/su10082598
AMA Style
Han S, Chung H-W, Subgranon T, Tia M. Development of Mix Designs for Minimally Refined Reclaimed Asphalt Pavement (RAP) Concrete for Florida Concrete Test Road. Sustainability. 2018; 10(8):2598. https://doi.org/10.3390/su10082598
Chicago/Turabian StyleHan, Sangyoung, Hung-Wen Chung, Thanachart Subgranon, and Mang Tia. 2018. "Development of Mix Designs for Minimally Refined Reclaimed Asphalt Pavement (RAP) Concrete for Florida Concrete Test Road" Sustainability 10, no. 8: 2598. https://doi.org/10.3390/su10082598
Note that from the first issue of 2016, this journal uses article numbers instead of page numbers. See further details here.