Decision-Making Processes Underlying Pedestrian Behaviors at Signalized Crossing: Part 1. The First to Step off the Kerb


1
Université de Strasbourg, CNRS, IPHC UMR 7178, 67000 Strasbourg, France
2
Center for Nonlinear Phenomena and Complex Systems (Cenoli)-CP 231, Université libre de Bruxelles, 1050 Bruxelles, Belgium
3
Institut Universitaire de France, 75231 Paris, France
*
Author to whom correspondence should be addressed.
Safety 2019, 5(4), 79; https://doi.org/10.3390/safety5040079
Submission received: 11 September 2019
/
Revised: 25 October 2019
/
Accepted: 30 October 2019
/
Published: 31 October 2019
Abstract
:Pedestrians are ideal subjects for the study of decision-making, due to the inter-individual variation in risk taking. Many studies have attempted to understand which environmental factors influence the number of times pedestrians broke the rules at road-crossings, very few focused on the decision-making process of pedestrians according to the different conditions of these variables, that is to say their perception and interpretation of the information they receive. We used survival analyses and modeling to highlight the decision-making process of pedestrians crossing the road at signalized crossings in France and in Japan. For the first pedestrians to step off the kerb, we showed that the probability to cross the road follows three different processes: one at the red signal, one just before the pedestrian signal turns green, and one after the signal has turned green. Globally, the decision of the first pedestrian to cross, whether he or she does so at the green or at the red signal, is influenced by their country of residence. We identify the use of cognitive processes such as risk sensitivity and temporal discounting, and propose new concepts based on the results of this study to decrease the incidence of rule-breaking by pedestrians.
1. Introduction
Human beings have to make numerous decisions every day throughout their lifetime. Most of these decisions are relatively easy: what to eat for breakfast, what to wear, what itinerary they will use to go to school or to work. Whether or not they should marry or have a child are bigger choices to make. Finally, some individuals can change the lives of millions of people with their decisions to vote laws or go to war. Many studies have attempted to understand how decisions are taken and if they are optimal from an evolutionary perspective [1,2]. Decisions usually follow something comparable to an optimal test called SPRT (sequential probability ratio test) and require a sufficient difference of evidence or information between two alternatives in order to choose the most profitable or the less risky of the two options [3,4]. However, without going so far as to claim that these everyday life decisions are suboptimal [5,6] or irrational [7,8,9], human decisions might be biased and influenced by personal, social, and/or environmental variables.
Pedestrians are ideal subjects when studying decision making. Pedestrians need to perceive and integrate a great deal of information compared to other situations they encounter. They have to identify spatial cues about where to go, avoid other pedestrians as they walk in the street [10,11], and cross the roads, which can sometimes be a high-risk behavior [12,13]. Like in other behaviors, pedestrian behavior—and particularly road crossing—displays great variance, which is dependent on many factors [12,14,15,16,17,18,19]. Some pedestrians will take more risks than others when crossing the road, either by crossing at the red signal, or by decreasing the gap acceptance with a car [20,21]. Indeed, a higher rate of risky behaviors has been observed in males or young individuals, particularly adolescents [19,22]. Older persons have sometimes been reported to take more risks than others [23], but this is due to a loss of perceptive and cognitive abilities rather than intentional risk taking [13]. Some people also prefer to base their decision on their personal information instead of trusting the social information [24,25]. This might be particularly advantageous in the case of road crossing, i.e., choosing to not follow pedestrians crossing at the red signal without checking how far away the next car is [26,27]. The use of social information and the probability of rule breaking are strongly correlated with the culture and the country of pedestrians, with each country having its own principles of conformism and social norms [28,29]. Previous studies have shown that the number of illegal crossings is largely dependent on the country where pedestrians live, and its culture [27,30,31]. How a country is developed might be important on how pedestrians cross the road (looking for vehicles for instance, [32,33]) but the culture is also important so far on how people behave. Indeed, citizens of adjacent developed countries may have different pedestrian attitudes due to their culture [34,35]. The majority of these studies made correlational analyses but did not explore the possible presence of assessment mechanisms (cognitive or psychological) underlying the decision-making processes [3,4].
Indeed, whilst many studies tried to understand which factors influence the incidence of rule breaking at road crossings, very few focused on the decision-making process of pedestrians facing the different conditions of these variables, that is to say how their perception and interpretation of the information they receive [36]. Pelé et al. [27] already did an integrative study, taking into account the country, gender, age, etc. on the time to cross. However, this study was only correlative and did not allow to exactly understand the mechanisms underlying decision-making, which mathematical modeling on each factor can do. This study aimed to highlight the decision-making process of pedestrians crossing the road at a signalized crossing. For both signal states (red and green), we decided to separate analyses between the first pedestrian to go and other individuals following him/her, and focused the first part of our study on the first pedestrian to step off the kerb. Indeed, the decisions underlying the departure of a first individual and those of the followers are different, and the departure of the first pedestrians strongly influences the decisions of other individuals [37,38]. The first pedestrian to step off the kerb is also the only one to exclusively follow his/her own personal information, without being influenced by other pedestrians, which could be considered a high-risk behavior.
This study used mathematical modeling combined to survival analysis to understand decision-making processes. Survival analysis is a statistical tool used to predict when one or more events will occur, such as death in biological organisms and failure in mechanical systems [39,40,41]. These analyses are used and sufficient to explain sophisticated collective decision-making [42,43]. In the case of pedestrians crossing the road, survival analysis allows us to understand how the probability that pedestrians will cross is influenced by time according to the imminence of the pedestrian signal changing, whether from red to green or vice versa. It also allows us to calculate the probability of a pedestrian to cross in various conditions [44]. The decrease of the curve provides information about the process underlying the decision, with a sigmoid indicating a threshold similar to that of a diffusion model, whilst an exponential decrease shows that the probability is constant per time unit [2,27,45]. Survival analysis can also be used to test other factors such as the gender or citizenship of pedestrians, the number of traffic lanes or the number of waiting pedestrians.
In this study, these factors are analyzed in order to identify time thresholds to cross the road and pinpoint optimal decision processes involved in pedestrian road-crossing. However, thresholds should differ according to the perceived risk [46]: for instance, it should be lower in men than in women. Similarly, we expected thresholds to increase with the number of lanes, as the perceived risk is higher in this situation. As described above, culture affects the risk perception and the social influence. Therefore, the effect of culture on pedestrian road-crossing behavior was studied in sites in France (Strasbourg) and in Japan (Nagoya). We expected to see a difference between the two countries, with the threshold for Japanese pedestrians occurring closer to the time the signal turned green. This is not due to higher perceived risk, but is rather explained by their known conformism to rules, contrary to pedestrians in Western countries [47].
2. Materials and Methods
2.1. Study Sites
We observed pedestrian behaviors at three sites in Strasbourg, France and at four sites in Nagoya, Japan. Details about each site are given in Table 1. Pictures of the different sites are available in a previous study [27]. These sites all permitted the observation of collective road crossings involving at least 10 pedestrians at a time. The speed of vehicles on each site was limited to 50 km.h−1. There was no difference in pedestrian crossing speed between all sites (permutation test for independent samples: maxT = 2.22, p = 0.168). Cars and pedestrians signals worked in the same way for both countries. At all sites, pedestrians always had the priority when the signal turned green even if, at some sites, vehicles were allowed to turn left or right despite the green signal for pedestrians, but the drivers were aware that crossing pedestrians had priority. This difference did not affect pedestrian behaviors (see Table 1).
Moreover, turning vehicles travel much slower than vehicles that are driving straight ahead. However, the driver of an approaching vehicle may be less careful if pedestrians cross at the red signal, as the driver has the right to pass. The risk to pedestrians is therefore much higher when crossing at the red signal. There was no button for pedestrians to trigger the green pedestrian signal at any of the sites studied.
2.2. Data Scoring
Data were scored over a 6-day period for each site, for 1 h per day per site. We observed during working days, hours, and weeks to ensure that data excluded movements generated by tourism, festivals, etc. This scoring duration is sufficient to provide a large dataset [2,21,26]. Video cameras were set up in order to score the signal state (red or green) and were placed in locations ensuring the visibility of crossing pedestrians at all times. Behavioral sampling was used to score the crossing of pedestrians in one direction only, i.e., that recorded by the camera. Pedestrians were not informed about the purpose of the study. As both cities are touristic, pedestrians are accustomed to seeing tourists taking pictures or videos. We did not observe any difference in the way pedestrians behaved when they saw the camera. We purposely did not take any other equipment such as counters or pocket PCs in order to avoid influencing pedestrian behavior. When the observation of road-crossing behavior was hampered by a visual obstacle (i.e., a car or a truck in front of the video camera), this behavior and the behaviors occurring immediately before and after it were removed from the data set, as were any data recorded when cyclists or tourists were among the pedestrians. Tourists were easily differentiated from local citizens, as they were dressed differently from citizens, often carried specific equipment (guidebook, map, camera, etc.), and/or were in large groups accompanied by a guide. These conditions were double-checked as videos were analyzed by two observers simultaneously.
2.3. Research Ethics
Our methodological approach solely involved anonymous observations and anonymous data scores. Study protocol followed the ethical guidelines of our research institutions (IPHC, Strasbourg, France and PRI, Kyoto University, Japan) and ethical approval was obtained from these institutions to carry out the study. All data were anonymous, and individuals were given sequential numerical identities according to the time of the road crossing and the arrival/departure order of crossing. Pedestrians had the possibility to obtain information about the study via a fact sheet in their language (Japanese or French) we gave them when they could come to ask questions. They were also provided with an email address and phone number to contact our institution at a later date if desired. This happened twice and three times in Japan and France respectively, indicating the non-disturbance of our study on pedestrian behavior. Persons who refused to participate in the study were removed from the data (i.e., we deleted the crossing concerned). However, this never happened.
2.4. Data Analysis
This part one of the study focused solely on the first pedestrian to step off the kerb (at the red or green signal) and not on following pedestrians (see Part 2. Do pedestrians show cultural herding behavior? Pelé et al. submitted), because the processes underlying the two decisions (departing first and following) are quite different [48,49,50]. However, we also selected cases where the first pedestrian to step off the kerb is in the presence of other pedestrians, in order to understand the impact of this variable on decision-making processes. All 6 h of data were analyzed for each site. We scored the behaviors of the first pedestrians to step off the kerb when at least two pedestrians crossed the road at the same time (i.e., when the time difference between the departures of the two pedestrians was lower than the mean road-crossing time).
We scored road crossings for 429 first pedestrians, 244 of whom crossed at the green signal and 185 of whom crossed at the red signal.
For each first pedestrian to step off the kerb, we scored different variables for which an effect was showed or suggested in previous studies (see the introduction for references). We scored the following variables (see [27] for a visual explanation of the different scored variables).
- Quantitative variables:
- -
- The departure period, i.e., the period between the previous signal state change and the moment the pedestrian starts crossing the road. This quantitative variable is positive for pedestrians crossing at the green signal (after the signal state change) but negative for pedestrians crossing at the red signal (before the signal state change) [44,51]. Survival analyses were done on this variable used as a dependent one.
- -
- -
- The waiting time, i.e., the time between the moment a pedestrian stops at the light and the moment he/she starts crossing the road (quantitative variable; [54]).
- -
- Qualitative variables:
- -
- -
- The gender of pedestrians (qualitative variable: male or female [17]).
- -
- The age of individuals, estimated at 10-year intervals from 0–9, 10–19,…, to 70–89, based on physical characteristics. However, the number of data and the analyses we carried out did not permit the analysis of age effect (per interval) on the decision-making processes (considered as quantitative variable; [15,22]). Indeed, we observed less than 10 pedestrians for age categories lower than 20 years old and more than 60 years old.
- -
We also scored the last car time, which is the time elapsed between the passage of the last car on the pelican crossings and the moment when each pedestrian starts to cross. However, as we did not found a significant correlation between the last car time and the departure period (R² = 0.0006 for all crossings and R² = 0.0003 for red light crossings, p > 0.95), we did not include this factor in our next analyses. The number of waiting pedestrians is linked with the waiting time (linear regression, R² = 0.14, p < 0.0001, F = 33).
2.5. Statistical Analyses
Survival analysis [40,41] was used to study the distributions of departure periods for the first pedestrian to step off the kerb. Survival analysis is used to understand how the ratio of observations decreases from 1 (all observations/data) to 0 (none) according to a response variable. First, curve estimation tests were carried out to analyze which type of function these distributions followed, namely linear, exponential, or sigmoid [13,45,56].
Sigmoid curves (Equations (1) and (2)) are generally used to understand decision-making processes [45]. Other curves used for these studies are the linear curve (Equation (3), meaning that probability of crossing depends directly on time, regardless of factors such as the distance to the next car or the number of waiting pedestrians), and the exponential curve (Equation (4), where the probability of crossing is time-constant; see [13]). Sigmoid curves are indicated with two parameters, S and q. q is a sensitivity coefficient. In essence, a higher q value results in a faster transition between resting and departing and therefore also results in higher discrimination or a decreasing in the noise level [45,57,58]. S is a threshold. The higher it is, the longer it will take to reach a decision. In the case of road crossing, the threshold S would be more representative of the risk taken by individuals, whilst q would be more dependent on cognitive aspects (namely perception and interpretation of information, decreasing of the noise level) and individual traits [13]. Indeed, a higher q shows a faster transition between two states (here the decision-making of crossing) due to better performance. This faster transition is observed by a higher steepness of the sigmoid curve slope, whilst a higher threshold makes the curve shifting on the right, towards higher values (here seconds). Therefore the threshold shifts to higher values in order to gain more information about the decision and to decrease the uncertainty. In several studies, this performance is linked to higher cognitive capacity and neuronal activity (or group coordination for collective decisions) is reflected/formulated by a sigmoidal function [43,59,60,61,62]. If the distribution of the departure times corresponds to an exponential distribution, the departure probability of the first pedestrian to step off the kerb is the log gradient b of the corresponding exponential distribution, i.e., the inverse of the mean departure time (1/∆t) if Δt is the mean departure time.
or
where y is survival and x is the departure time or the studied variable.
We also simulated the crossings of pedestrians at the red signal under the hypotheses that the probability to arrive at the kerb and the probability to cross at the red signal is constant. These simulations were stochastic (realized using Fortran) allowed us to compare our observed data to these theoretical data. The survival curve NC(T) following these simulations was:
where F is the time of the red signal; k is the probability to cross at the red signal; and T is the waiting time.
Linear regression was used to analyze the distribution of observed data by comparing it to the distribution of theoretical data with adjusted R². In this way, we used sensitivity analyses, meaning that we simulated different datasets with different values of the parameters. The simulated distributions were compared to the observed distributions and the fitting distributions (linear, sigmoid, and exponential) as well as the best parameters were chosen according to F-statistics. Differences found in the equational parameters between the countries and between the genders were tested using a Wilcoxon sign rank test. Levene’s tests were carried out on transformed data (log(Survival/b) for exponential and Ln((1/Survival) − 1) for sigmoid curves to compare departure times according to the number of lanes and the country. The same approach was applied to compare the waiting times according to country and gender. We followed the parsimony rule: when simple models explained the patterns we observed, we did not increase the complexity of these ones. Increasing the complexity when it is not needed might conduct to false positives and uninterpretable results [63,64,65]. Analyses were performed in R 3.3.2 (R Development Core Team, Vienna, Austria), with α set at 0.05. Sequential Bonferroni correction was used [66,67] for multiple variables analyses. However, given the p-value of our tests, this did not change their significance.
3. Results
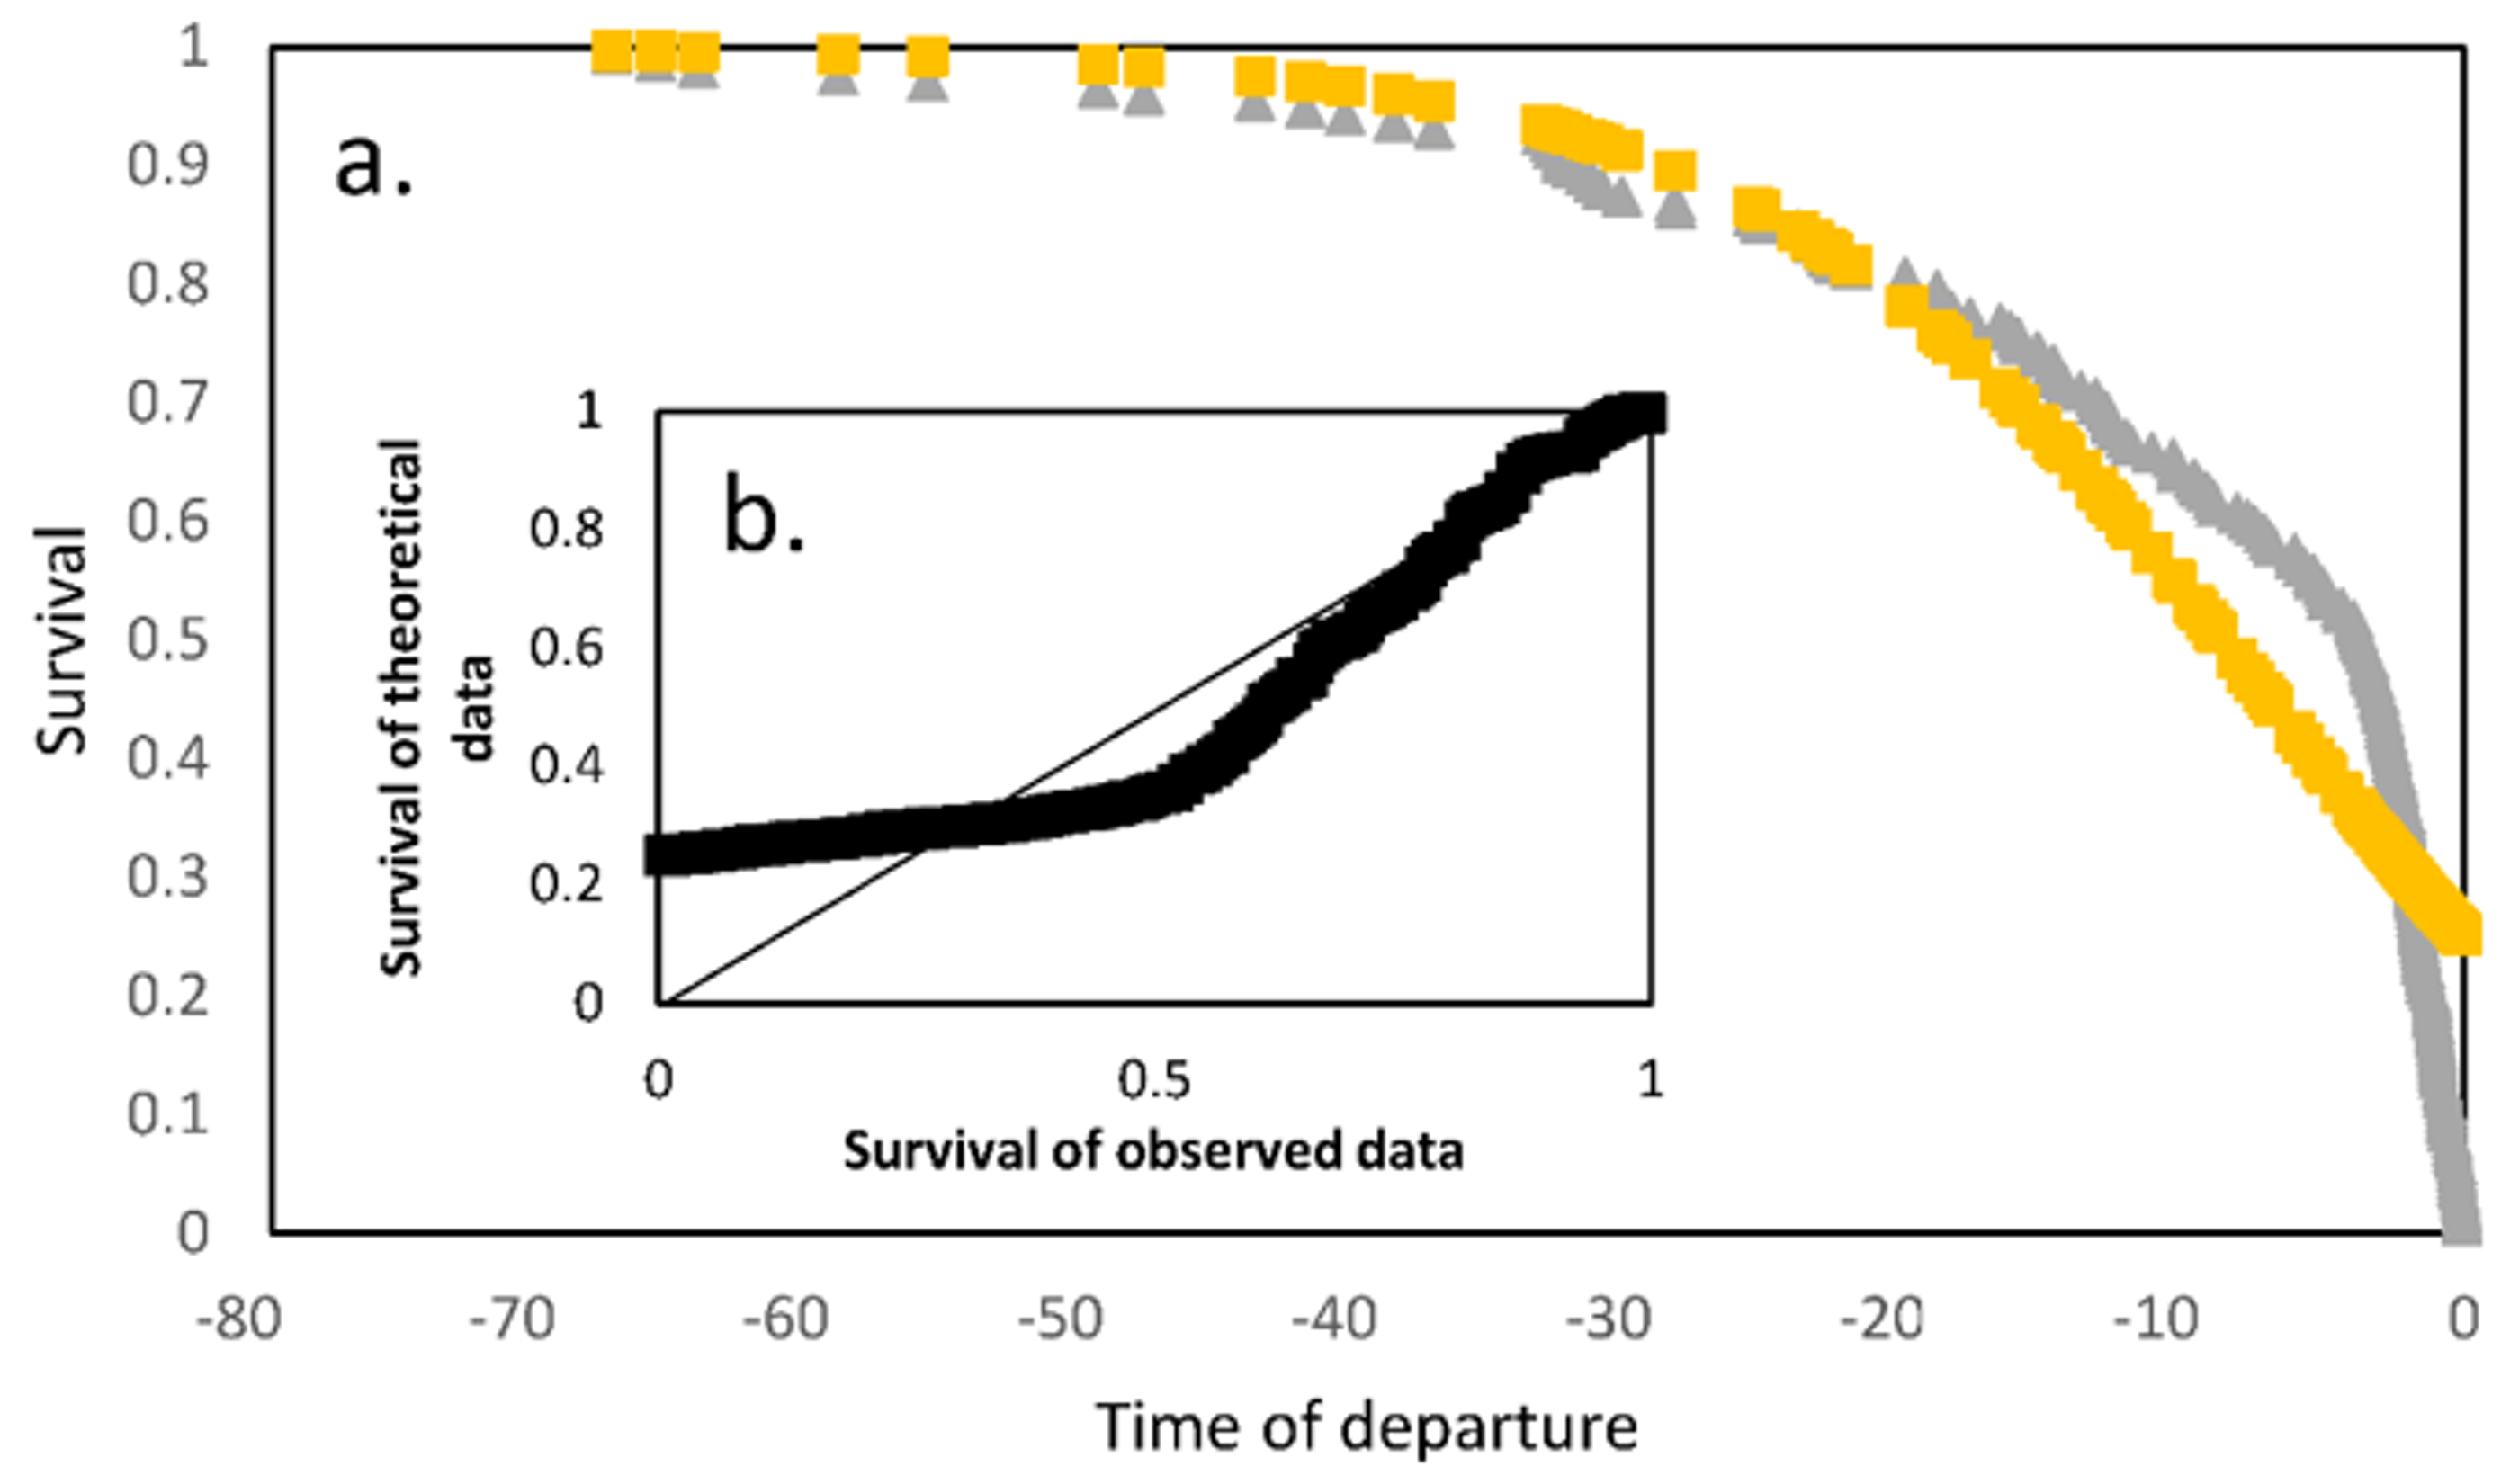
When all data has been analyzed (red and green signals), the distribution of the departure time on Figure 1 is far from perfect as a sigmoid curve, despite being significant (R² = 0.63, df = 427, p < 0.0001, F = 3069, q = 0.3, and S = 73). Among other possibilities, such an imperfect fitting might be caused by the fact that at least two different rules underlie a decision to step off the kerb for the first pedestrians. In order to check this assumption, we then decided to carry out separate analyses of instances where pedestrians departed first at the red signal, and those where pedestrians that departed first at the green signal.
3.1. Analyses of Departure Times at the Red Signal
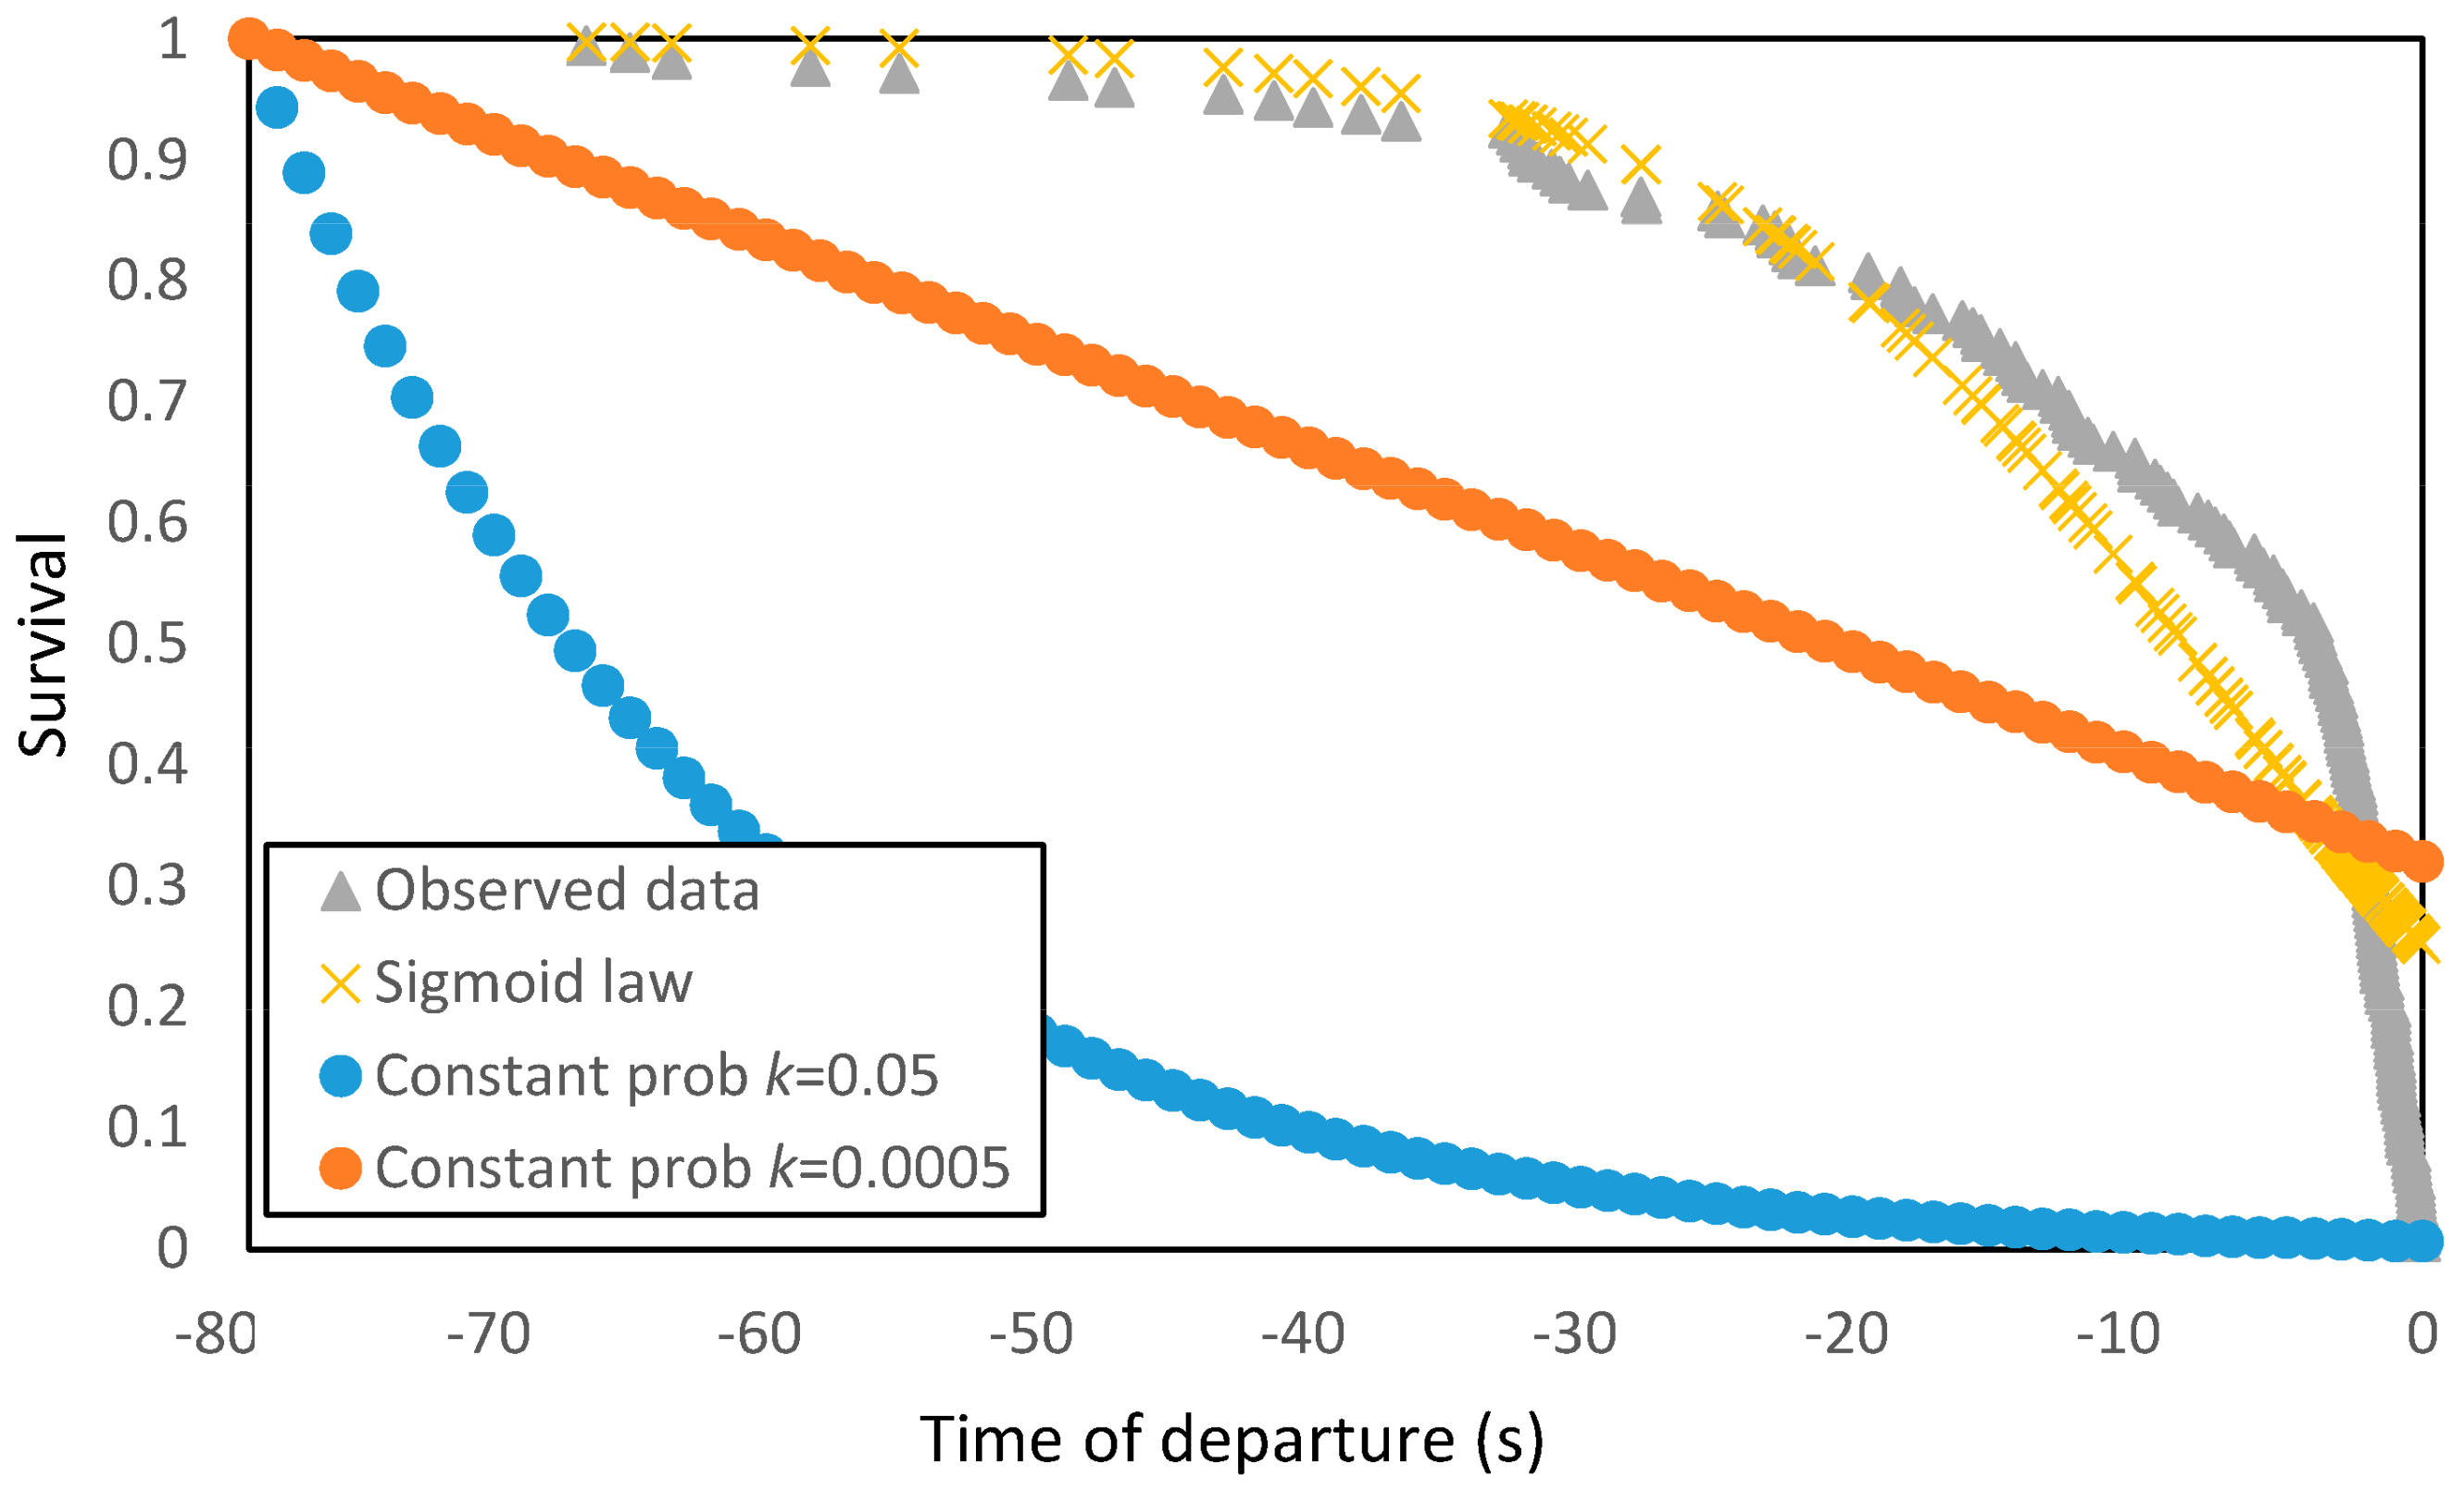
Analyses of departure times at the red signal showed a reliable estimation of observed data using a sigmoid law (Equation (2), R² = 0.87, df = 173, p < 0.0001, F = 1146, q = 10, S = −100). Times of departure follow an asymptote, with a plateau decreasing faster and faster as time approaches 0 (i.e., when the signal turns green). If the probability of departures would be constant per time unit, the survival would be either linear (orange points, k = 0.0005, small probability to cross at the red signal) or exponential-like (blue points, k = 0.05, high probability to cross at the red signal). Therefore our results show that the probability to cross at the red signal is not constant but is almost null when the pedestrian signal goes red and then increases when getting closer and closer to the green pedestrian signal. Indeed, the plateau we observed from the observed data seems to show a kind of refractory phase to depart after the pedestrian signal goes red. This might also be explained by the fact that the time between two cars (gap acceptance) is too low to decide to cross as we showed in a previous study [13]. However, we did not find such an effect in this study (due to high variance of the last car times) and Figure 2 shows different drops in the two asymptotic curves (grey and yellow), suggesting two different processes. Indeed, whilst the two curves are correlated, this correlation is lower and lower getting close from 0 s (signal turning green). Using sensitivity analysis, the curve from observed data has a breaking point at −4 s before turning green, indicating a multi-sigmoid; we consequently used this departure time as a marker to divide our analysis of road crossings at the red signal.
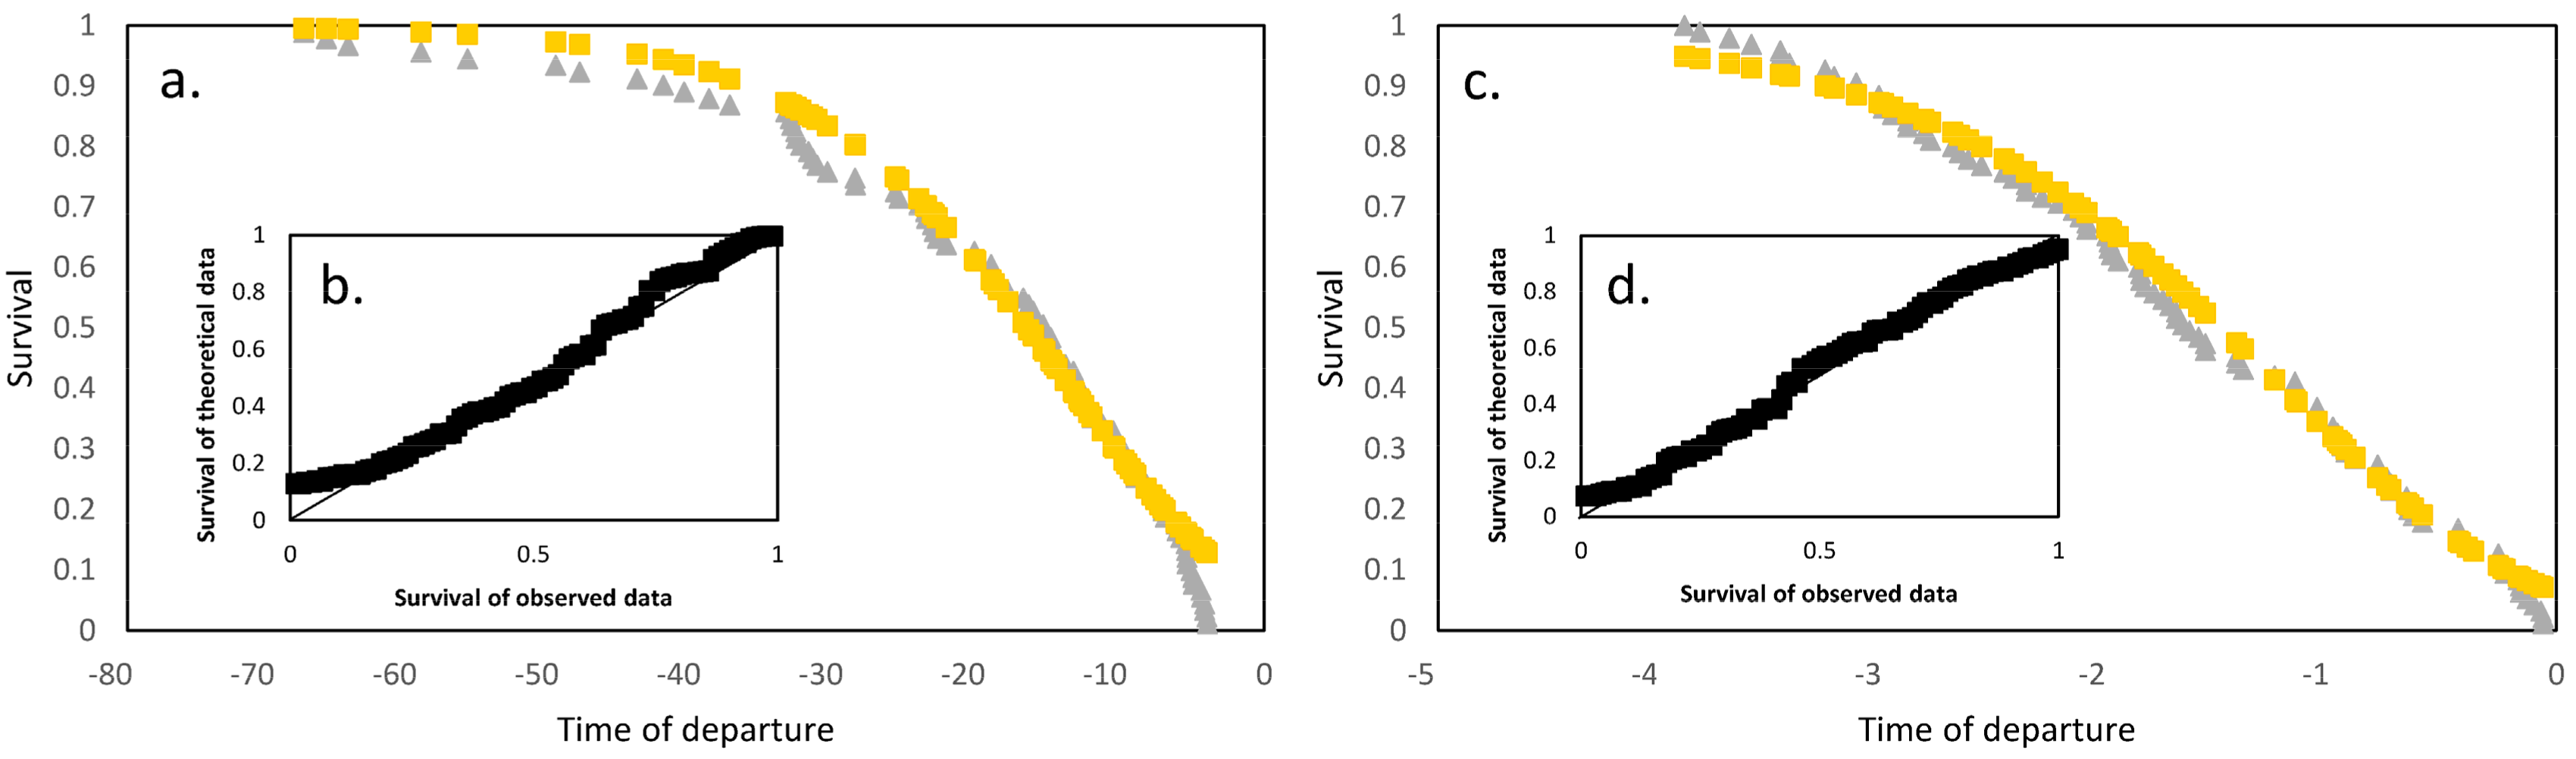
Analyses of departure times at the red time before −4 s turning green showed a reliable estimation of observed data using a sigmoid law (Equation (2), R² = 0.98, df = 88, p < 0.0001, F = 5208, q = 3, S = −300, Figure 3a,b). Times of departure follow an asymptote, with a plateau that decreases faster and faster with the x axis as we approach the −4 s marker. Analyses of departure times at the red time just before turning green ([−4 s; 0 s] showed a reliable estimation of observed data using a sigmoid law (Equation (2), R² = 0.99, df = 93, p < 0.0001, F = 11040, q = 5, S = −180, Figure 3c,d).
3.2. Analyses of Departure Times at the Green Signal
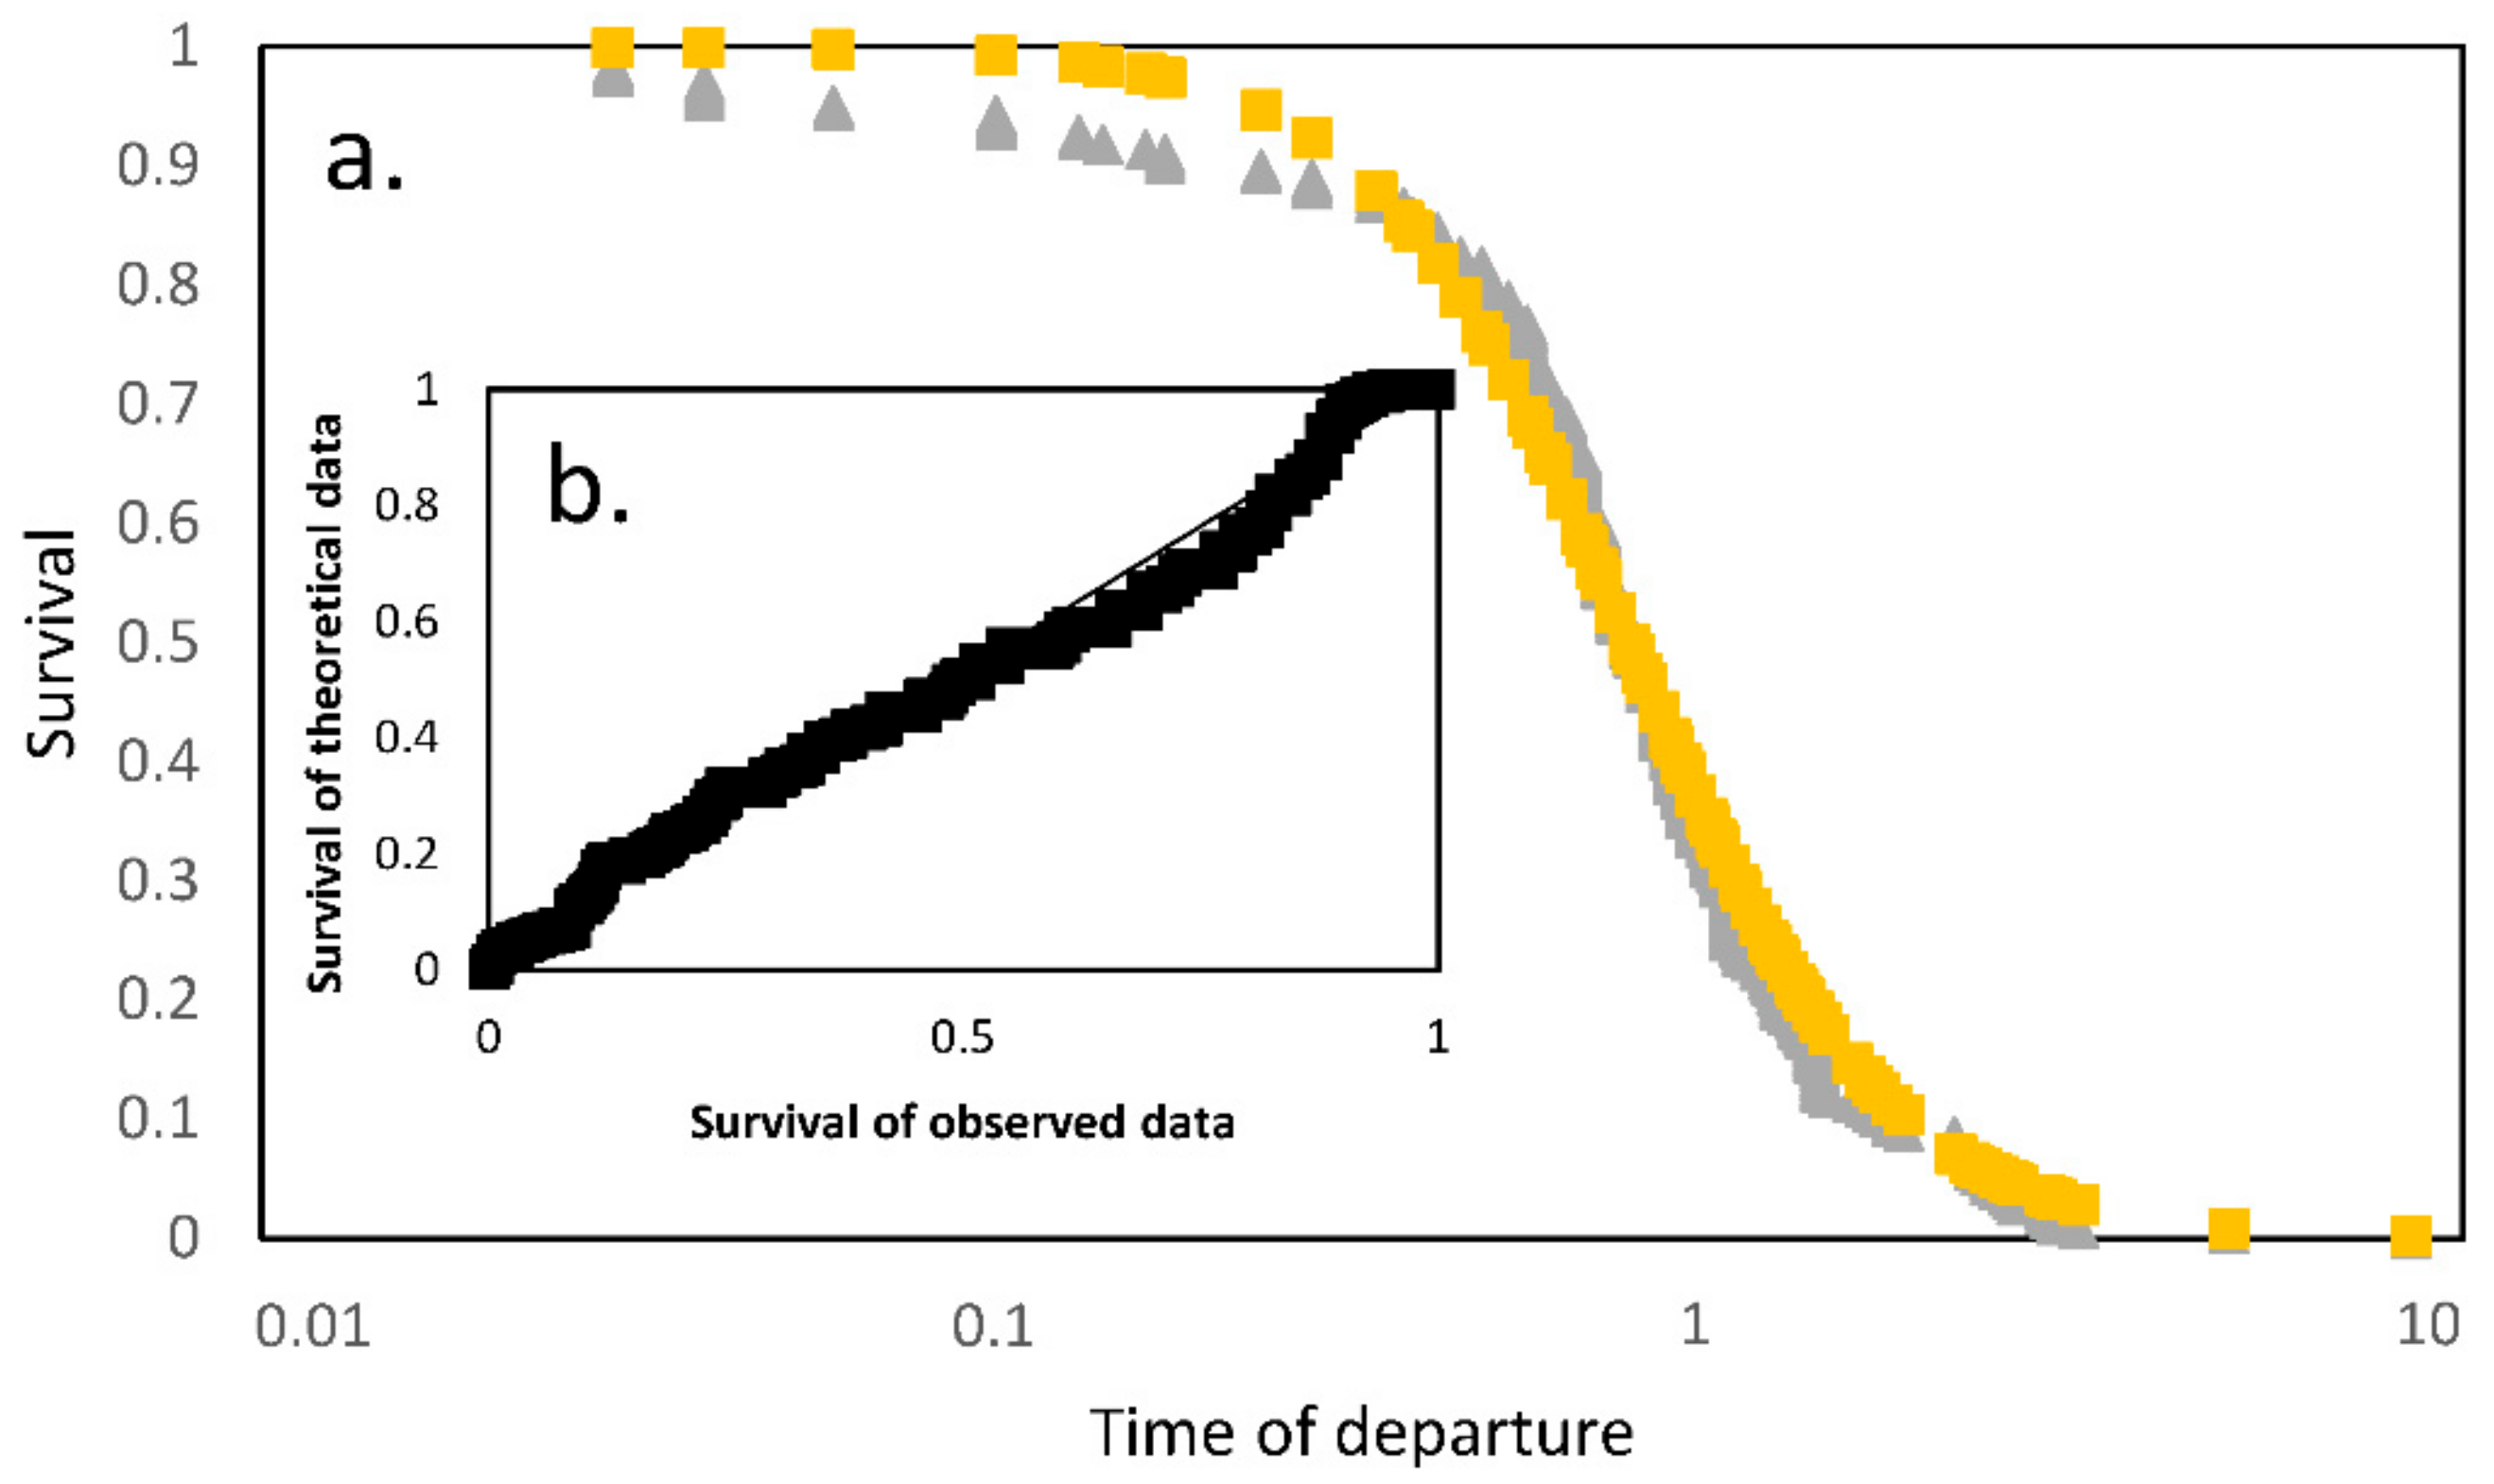
The time between the signal turning green and the departure of the first pedestrian (departure time) follows a sigmoid curve (R² = 0.98, df = 242, p < 0.0001, F = 15670, Equation (1), S = 73, q = 2.5, Figure 4). No further analysis was required at this stage to understand time before departure at the green signal.
3.3. Effect of Country and Gender on the Time of Departure of the First Pedestrian
Here, we used the same procedure as in the previous analyses to evaluate the best parameters of the sigmoid curve explaining the distribution (survival) of the departure time of pedestrians in four categories: man from France, woman from France, man from Japan, and woman from Japan (whatever their age).
The threshold and sensitivity coefficients for each of these four categories are indicated in Table 2. We could not determine the threshold and the sensitivity coefficient for departure times at the red signal in male and female Japanese pedestrians, as only two values were obtained per category, representing 1.47% of total crossings for Japanese men and 0.04% for Japanese women. This was already a result in itself, as the percentage of crossings at the red signal for French men and women were 43.01% and 54.94%, respectively. Japanese pedestrians, whatever the sex, had a threshold closer to 0, i.e., the time at which the signal turns green (sign rank test, v = 21, p = 0.03)—a stark difference with French pedestrians. This was not the case with the sensitivity coefficient (sign rank test, v = 4, p = 0.85). There was no difference between men and women, whatever the country, for the threshold (Sign rank test, v = 5, p = 0.422) or the sensitivity (sign rank test, v = 1, p = 0.197).
3.4. Effect of the Number of Lanes
We then tried to understand the effect of the number of lanes on the probability that a pedestrian would cross. No rule breaking was observed at the site with six lanes in Japan. This was already a result, showing that the number of lanes impacts the probability of crossing at the red signal. Survival curves for crossing at the green signal were sigmoid (2 lanes: R² = 0.98, df = 2133, p < 0.0001, F = 18614; 4 lanes: R² = 0.99, df = 106, p < 0.0001, F = 10010), as found in the first part of results with the same sensitivity (q = 3.5). However, the threshold was higher (S = 0.9 s) for crossings on roads with four lanes than those with two lanes (S = 0.67 s). Survival curves were exponential for crossings at the red signal (two lanes: R² = 0.98, df = 114, p < 0.0001, F = 5765; 4 lanes: R² = 0.98, df = 65, p < 0.0001, F = 3468), indicating that the probability of crossing was constant per time unit. The exponents of these curves made it possible to calculate the average of the departure times at which individuals crossed the road (see Material and Methods), namely −16.66 s (1/Δt = 0.0006) for two lanes and −2.85 s (1/Δt = 0.0035) for four lanes. When we considered crossings at the red signal, the number of lanes and the country both affected the probability that a pedestrian would cross (Table 3). Japanese pedestrians cross closer to the signal change compared to their French counterparts (Levene’s test, df = 1, 176, F = 15.291, p = 0.0001), and the presence of four lanes on roads decreases the probability to cross at any time (Levene’s test, df = 1, 176, F = 4.59, p = 0.033).
3.5. Effect of the Number of Waiting Pedestrians
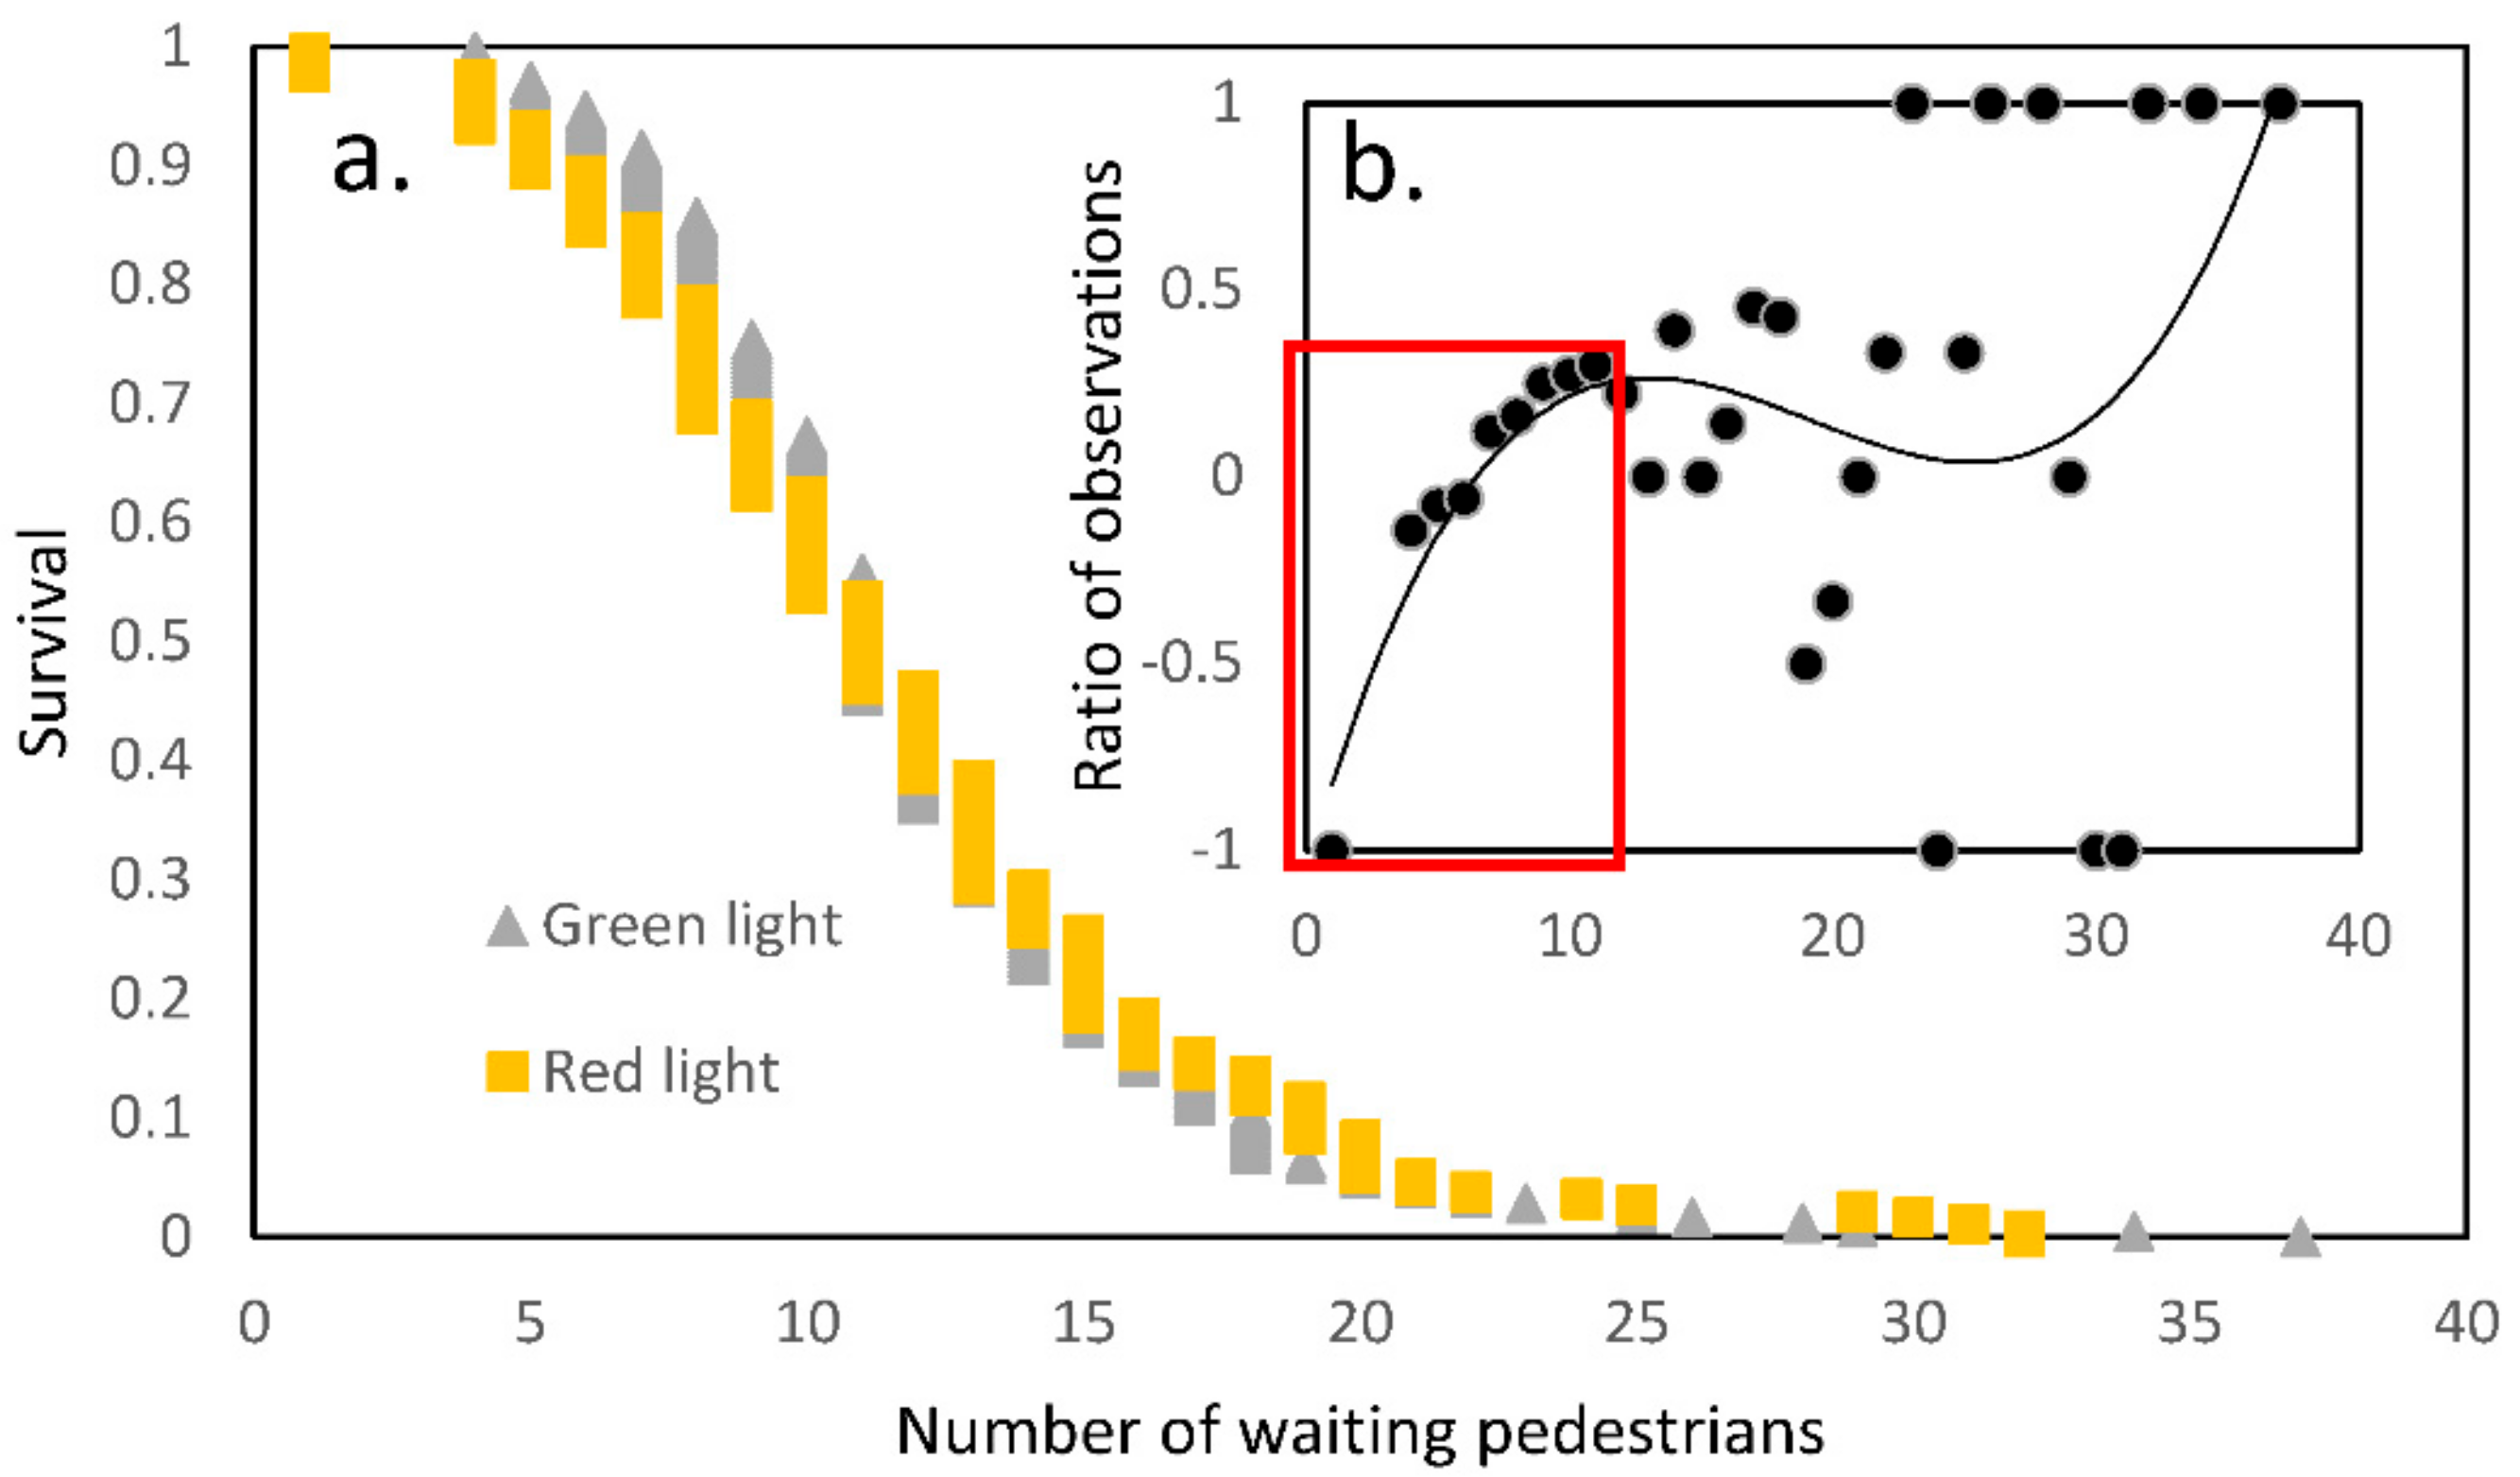
When attempting to understand how pedestrians decide to cross according to the number of waiting pedestrians, we found that survival curves at both the red and the green signal follow sigmoid curves (Green signal: R² = 0.99, df = 242, p < 0.0001, F = 32490, S = 11, q = 5; Red signal: R² = 0.99, df = 183, p < 0.0001, F = 30070, S = 11, q = 3.5; Figure 5a). However, with the exception of a sensitivity coefficient, which seemed to be lower at the red signal, the two curves were quite similar (Levene’s test: df = 1425, F = 0.0034, p = 0.953). This might be explained by the possibility of similar processes underlying the decision to step off the kerb. These may be linked to the number of waiting pedestrians, or to the number of observations decreasing according to the number of pedestrians waiting for the green and the red signal. The latter situation would result in a lower probability of numerous waiting pedestrians, which is quite understandable. To check this hypothesis, another analysis was carried out to measure the ratio (number of observations at the green light-number of observations at the red light)/(total number of observations) for each number of waiting pedestrians during road crossings at the red signal and at the green signal (Figure 5b). The best curve explaining the distribution of data was a cubic curve (R² = 0.22), meaning that we observed a higher rate when there were fewer people waiting. However, the regression analysis was not significant. Only the first part of the graph (red square going from 1 to 11 waiting pedestrians) shows a good fit between observed data and the theoretical curve (R² = 0.97), whilst the remaining numbers of waiting pedestrians displayed huge variations in the ratio of observations.
3.6. Effect of Waiting Time
Waiting time, meaning the time between the arrival of a pedestrian at the kerb and his or her departure, followed an exponential curve (green signal: R² = 0.94, df = 222, p < 0.0001, F = 3670; red signal: R² = 0.99, df = 179, p < 0.0001, F = 15,710). Pedestrians starting at the green and the ones starting at the red signal did not have different waiting times (Levene’s test: df = 1403, F = 0.0021, p = 0.942). This means that some pedestrians crossing at the red signal also waited for a long time before deciding crossing at the red signal. When considering crossings at the red signal alone (at the green signal, the time was influenced by the signal change), the survival curve also followed an exponential law regardless of country and gender (Table 4). Levene’s tests did not reveal any significant difference between genders (Levene’s test: df = 2175, F = 0.047, p = 0.953) and countries (Levene’s test: df = 1176, F = 0.293, p = 0.589).
4. Discussion
In this study, we tried to understand the decision-making processes underlying road crossing behaviors at a signalized crossing. Survival analyses not only show whether variables (signal state, gender, country, number of waiting pedestrians, and number of lanes) impact the way pedestrians cross, but also how pedestrians integrate this information in their decision to cross. We remind that we focused in this study on the first pedestrians cross (and not the following ones) as we thought the two decision-making mechanisms and the variables influencing it were clearly different.
The results show that the probability for the first pedestrians to cross the road followed three different processes: one at the red signal up to four seconds before the signal turns green, one between four and 0 seconds, before the signal turns green, and one after the signal has turned green. These three processes are easy to explain. The first process corresponds to pedestrians who do not pay attention to the signal state and have little fear of risk-taking (or at least are more inclined to this attitude than pedestrians following the two other processes). The probability to cross should also increase with the time the pedestrian signal goes red as the time between two cars (or the gap acceptance) also increases. Indeed, when the cars signal turns green, the distance between cars is very low but this distance increases with time usually, influencing positively the gap acceptance and so the probability to cross at the red light. Whilst previous studies show that the gap acceptance is indeed important in the decision to cross [27], we did not find such an effect here. The second (i.e., intermediary) process is due to the cars signal going from green to orange or red whilst the pedestrian signal is still red. The last process (crossing at the green signal) corresponds to people who pay attention to the signal state and do not take risks. The intermediary process we found might be explained by pedestrians who cross the road just before the signal turns green. The curve analysis of the first process (before −4 s) simply shows an incidence of rule-breaking that increases as the green signal change approaches, or inversely, an incidence of rule-breaking that becomes rarer and rarer as the green signal change approaches. The distributions of the number of rule-breaking we observed in our study according to these three processes looks like the one found in Guo et al. [51], with few individuals crossing at the first 50% of the red light period and the higher rate being after 80% of this red light period.
There are two possible explanations for the first process (crossing before −4 s). The first reason is that early departure times (−70 or −60 s before the green signal) are rare because the flow of cars at this time is dense due to the green signal for cars. As the time to the next pedestrian green signal decreases, the flow of cars diminishes but the number of pedestrians waiting at the kerb increases [55]. The second possible explanation of this process is the probability of seeing a pedestrian departing as a consequence of the increasing number of pedestrians waiting to cross. The increasing number of pedestrians increases the probability of seeing one pedestrian crossing. However, the waiting time of pedestrians also increases their probability to cross. Studies have shown that the longer people wait, the higher the probability is that they will cross at the red signal [54,68]. We observed an effect of country on this rule breaking, with very few pedestrians in Japan crossing at the red signal when it is not close to changing, which is reminiscent of previous studies on the effect of culture on decision making [13,27]. The current results confirm this study with no difference in the distribution of waiting times at the red and the green signal, meaning that pedestrians do not seem to plan crossing at the red signal: they arrive and wait, but will cross illegally if the waiting time is too long.
Our study identified a second/intermediary process, which is quite different to the processes of crossing at the red signal and crossing at the green signal. Indeed, pedestrians crossing just before the signal turns green checked if any car was arriving, or crossed because the signal for cars had turned red a few seconds before the pedestrian signal turned green. This step-by-step signal change is present in most countries, if not all, in order to decrease the risks of accidents between cars and pedestrians, mainly because pedestrians need time to cross the road, especially in the case of old or disabled persons [69]. The survival curve of this process is closer to a linear law than to an asymptote. Usually, linearity in survival analysis indicates that the probability we measured is time dependent [13,70]. In our case, this might be due to pedestrians seeing the risk decreasing with time (Step 1: amber signal for cars, step 2: red signal for cars, and step 3: green signal for pedestrians) and the decision changes over time. This process is similar to temporal discounting, which has already been described in human beings in different situations [2,71]. As for a reward value in behavioral economics, in our study the risk perception seemed to decrease with time; this process may lead to risky and unhealthy choices [13,72].
The last process, i.e., crossing at the green signal, perfectly follows a sigmoid curve. Finding a sigmoid curve here and not an exponential law means that some type of cognitive processes, presumably for decision-making, underlie the choice of departure time [2,3]. In this kind of process and according to the diffusion model [3], individuals need to obtain enough information to take an optimal decision. This shows a speed-accuracy trade-off, and involves a threshold for which an alternative (in this case, crossing or continuing to wait) is chosen. The threshold, set here at 0.73 seconds, shows the necessary time to obtain sufficient information between the signal going green and the time of departure. As this study solely concerns the time the first pedestrian steps off the kerb before any others follow him, the origin of the perceived information is not social but is rather personal/private [26,27]. As we showed in a previous study, this decision time is different from what is usually named the gap acceptance behavior, which is the time a pedestrian evaluates between his/her crossing and the arrival of the next car, i.e., the time of no risk to cross [13]. For instance, two pedestrians may have the same gap acceptance behavior (evaluating a time of six seconds or 40 m between the crossing and the next car) but have different decision times because they do not have the same information or the same perception capacities (as with cognitive decline in elderlies, [73,74]).
Globally, the decision making for a first pedestrian to cross, whether they do so at the green or at the red signal, is influenced by the country of pedestrians but not by their gender. This does not mean that there is no effect of gender on the probability to cross the road at the red or the green signal, but simply indicates that the index measured in this study did not reflect this effect. Indeed, we have already showed an effect of gender and country on risk-taking in a previous publication [13,27]. In Pelé et al. [27], men crossed at the red signal in 40.6% of cases, whilst women only did so in 25.7% of cases. The same difference was found in the present study but only in France and for the first process (before −4 s), since men and women in Japan showed an identical proportion of rule-breaking (about 2.2%). However, the number of data in each condition—i.e., crossing at the red or green signal—is not taken into account in our survival analysis and our curve estimation. These analyses did however reveal that the threshold for crossing the road, whatever the signal state and the sensitivity, is not influenced significantly by the gender but is affected by the country variable. This might mean that fewer women cross at the red signal than men but when they do so they do it in the same way as men. The risk-taking is at two different levels here. Concerning the effect of the country, this factor affects not only the proportion of pedestrians crossing at the red signal (attitudes towards compliance with rules and regulations [13,27]), but also the way they cross the road and their decision-making process (risk-taking and information use). Although there is a lower number of Japanese pedestrians crossing at the red signal because of cultural conformity, they have a lower threshold when they do so—meaning that the time they start to cross is closer to the moment the signal turns green. However, the same shorter threshold was observed for Japanese pedestrians when crossing at the green signal. In this condition, this means that either they are more concerned about watching the pedestrian signal (private or personal information, see [27] for a discussion about this topic), or their motivation is higher than that of French pedestrians as they wait to cross at the green signal. Indeed, waiting time influences the probability to cross at the red signal but also the probability to cross faster and first at the green signal [27]. We did not observe any difference for the sensitivity coefficient for gender or country, possibly because this process is more dependent on cognitive abilities that are not affected by the gender and/or the culture of the individual.
We also checked the influence of two other parameters on the probability to cross: the number of lanes and the number of pedestrians waiting at the time of crossing. Pedestrians tended to cross illegally less when the road had four lanes compared to two lanes. We did not observe any rule-breaking for the site with six lanes. The effect of the number of lanes was amplified for Japanese pedestrians, whose probability to cross closer to the time of the signal change was higher than that of French pedestrians. We also found a global effect of the number of pedestrians on the probability of crossing at the red signal, with the number of pedestrians crossing at the red signal decreasing as the number of waiting pedestrians increased. Whilst this effect was quite clear until about 11 pedestrians were present, a huge variation was then observed for numbers of pedestrians ranging from 11 to 40. This may be explained by two hypotheses. The first hypothesis is that, due to a decreasing number of observations per number of waiting pedestrians when the latter increase, we might have observed contrasted results (for one observation, the ratio is either −1 or 1), leading to this wide variation. The second hypothesis is that even if the probability of crossing at the red signal per individual decreases with the number of pedestrians, the probability of observing one pedestrian crossing at the red signal increases with the number of pedestrians. The variation we observed was also a limitation of our study carried on collective crossings as some first pedestrians to cross may care about the number of waiting pedestrians whilst someone may not care at all. This hypothesis could also lead to wide variation when the number of waiting pedestrians increases. The fact that we studied the first pedestrians to cross but in the context of collective crossings (and not only when these pedestrians are alone to cross) may conduct to some limitations in our study, because these first pedestrians to cross does not rely purely on their personal information (we could not control for some social information they perceived). This limitation may also lead to some confounding factors—such as between the gender and the use of social information—making the results more difficult to interpret. Last but not the least, variation may also be favored by the closeness to the kerb, the queue line exercising a social pressure on first pedestrians crossing. A previous study [27] showed that pedestrians closest to the kerb are indeed the first to cross.
5. Conclusions
This study highlighted the social and environmental variables affecting the decision-making process in road crossing behaviors and for the first pedestrian to cross. Some components of the decision-making process, mainly risk sensitivity and temporal discounting, have already been identified for other behaviors [16,46,71,75]. Whatever the behaviors, these components are affected by both the country and the gender of the individual [17,18,19,22,76]. It is evident that these components cannot be controlled, except by better prevention and education about risk taking. However, these results show that certain other factors influence the probability of crossing at the red signal, and it is possible to manipulate these factors to decrease risk taking and thus prevent accidents. Pedestrians do not like to wait for too long at the red signal, and this increases their probability of crossing illegally. The duration of the pedestrian red signal is important for road safety, and has to be limited [54,68]. Crossing behavior is also influenced by the number of pedestrians waiting to cross. This “audience effect” [14,77] is known to have a strong social influence on human beings. It makes them comply and conform to the people surrounding them [28,52,53], and is strong in Japan [47]. Bateson and colleagues examined the effect of an image of a pair of eyes on contributions to an honesty box used to collect money for drinks in a coffee room [78]. People paid nearly three times as much for their drinks when eyes were displayed compared to when other control images were displayed. We suggest the use of an image just above the pedestrian signal showing the eyes of someone and indicating the risks of crossing at the red signal. According to the study by Bateson et al. (2006), this should decrease the probability of red signal crossing. The way pedestrians and traffic signals change also affected the probability that pedestrians would cross. The sequence of indications given by a traffic signal varied considerably between countries. The Austrian sequence of green–flashing green–amber–red–amber/red (green) can, to our knowledge, only be found in Austria, Slovenia, Israel, Jordan, and Cuba. Spain employs a green/amber indication instead of the flashing green, and a number of countries have abandoned the use of the amber/red combination (France, Italy, Belgium, and Japan). Köll and colleagues showed that the flashing green increases the number of early stops for cars and should reduce the number of accidents [79]. However, according to our results, it could lead to increased numbers of pedestrians crossing at the red signal. Countdowns for cars and pedestrians that are both visible to pedestrians could be a solution to decrease the number of illegal crossings and consequently reduce the number of accidents [80,81]. We then proposed future experimental researches on these three concepts: the use of eyes image above the pedestrian signal and countdowns as well as flashing green signals for both cars and signals to prevent illegal crossings.
Author Contributions
Conceptualization, M.P., J.-L.D. and C.S.; Methodology, M.P., J.-L.D. and C.S.; Formal Analysis, C.S.; Investigation, M.P. and C.S.; Writing—Original Draft Preparation, C.S.; Writing—Review & Editing, M.P., J.-L.D. and C.S.; Funding Acquisition, C.S.
Funding
This research was funded by the French Homeland Ministry (Ref.CNRS190529). CS is member of the French Academic Institut (IUF).
Acknowledgments
We thank Caroline Bellut, Elise Debergue, Charlotte Gauvin, Anne Jeanneret, Thibault Leclere, Lucie Nicolas, Florence Pontier and Diorne Zausa for their help in collecting data. We are grateful to Kunio Watanabe and Hanya Goro (Primate Research Institute, Kyoto University) for their help in obtaining authorization for data collection.
Conflicts of Interest
The authors declare no conflict of interest.
References
- McNamara, J.M.; Houston, A.I. Integrating function and mechanism. Trends Ecol. Evol. 2009, 24, 670–675. [Google Scholar] [CrossRef] [PubMed]
- Pelé, M.; Sueur, C. Decision-making theories: Linking the disparate research areas of individual and collective cognition. Anim. Cogn. 2013, 16, 543–556. [Google Scholar] [CrossRef] [PubMed]
- Bogacz, R. Optimal decision-making theories: Linking neurobiology with behaviour. Trends Cogn. Sci. 2007, 11, 118–125. [Google Scholar] [CrossRef] [PubMed]
- Marshall, J.A.R.; Bogacz, R.; Dornhaus, A.; Planqué, R.; Kovacs, T.; Franks, N.R. On optimal decision-making in brains and social insect colonies. J. R. Soc. Interface 2009, 6, 1065–1074. [Google Scholar] [CrossRef]
- Laude, J.R.; Stagner, J.P.; Zentall, T.R. Suboptimal choice by pigeons may result from the diminishing effect of nonreinforcement. J. Exp. Psychol. Anim. Learn. Cogn. 2014, 40, 12–21. [Google Scholar] [CrossRef]
- Molet, M.; Miller, H.C.; Laude, J.R.; Kirk, C.; Manning, B.; Zentall, T.R. Decision making by humans in a behavioral task: Do humans, like pigeons, show suboptimal choice? Learn. Behav. 2012, 40, 439–447. [Google Scholar] [CrossRef] [Green Version]
- Beck, J.; Forstmeier, W. Superstition and belief as inevitable by-products of an adaptive learning strategy. Hum. Nat. 2007, 18, 35–46. [Google Scholar] [CrossRef]
- Cohen, L.J. Can human irrationality be experimentally demonstrated? Behav. Brain Sci. 1981, 4, 317–331. [Google Scholar] [CrossRef]
- Martino, B.D.; Kumaran, D.; Seymour, B.; Dolan, R.J. Frames, biases, and rational decision-making in the human brain. Science 2006, 313, 684–687. [Google Scholar] [CrossRef]
- Helbing, D.; Molnár, P. Social force model for pedestrian dynamics. Phys. Rev. E 1995, 51, 4282–4286. [Google Scholar] [CrossRef] [Green Version]
- Moussaïd, M.; Helbing, D.; Theraulaz, G. How simple rules determine pedestrian behavior and crowd disasters. Proc. Natl. Acad. Sci. USA 2011, 108, 6884–6888. [Google Scholar] [CrossRef] [PubMed] [Green Version]
- Aoyagi, S.; Hayashi, R.; Nagai, M. Modeling of Pedestrian Behavior in Crossing Urban Road for Risk Prediction Driving Assistance System; SAE International: Warrendale, PA, USA, 2011. [Google Scholar]
- Sueur, C.; Class, B.; Hamm, C.; Meyer, X.; Pelé, M. Different risk thresholds in pedestrian road crossing behaviour: A comparison of French and Japanese approaches. Accid. Anal. Prev. 2013, 58, 59–63. [Google Scholar] [CrossRef] [PubMed]
- Faralla, V.; Innocenti, A.; Venturini, E. Risk Taking and Social Exposure; Social Science Research Network: Rochester, NY, USA, 2013. [Google Scholar]
- Ferenchak, N.N. Pedestrian age and gender in relation to crossing behavior at midblock crossings in India. J. Traffic Transp. Eng. Engl. Ed. 2016, 3, 345–351. [Google Scholar] [CrossRef] [Green Version]
- Nagengast, A.J.; Braun, D.A.; Wolpert, D.M. Risk-sensitive optimal feedback control accounts for sensorimotor behavior under uncertainty. PLoS Comput. Biol. 2010, 6, e1000857. [Google Scholar] [CrossRef] [PubMed]
- Powell, M.; Ansic, D. Gender differences in risk behaviour in financial decision-making: An experimental analysis. J. Econ. Psychol. 1997, 18, 605–628. [Google Scholar] [CrossRef]
- Tse, D.K.; Lee, K.; Vertinsky, I.; Wehrung, D.A. Does culture matter? A cross-cultural study of executives’ choice, decisiveness, and risk adjustment in international marketing. J. Mark. 1988, 52, 81. [Google Scholar]
- Wilson, M.; Daly, M. Competitiveness, risk taking, and violence: The young male syndrome. Ethol. Sociobiol. 1985, 6, 59–73. [Google Scholar] [CrossRef]
- Pawar, D.S.; Patil, G.R. Pedestrian temporal and spatial gap acceptance at mid-block street crossing in developing world. J. Safety Res. 2015, 52, 39–46. [Google Scholar] [CrossRef]
- Yannis, G.; Papadimitriou, E.; Theofilatos, A. Pedestrian gap acceptance for mid-block street crossing. Transp. Plan. Technol. 2013, 36, 450–462. [Google Scholar] [CrossRef]
- Holland, C.; Hill, R. The effect of age, gender and driver status on pedestrians’ intentions to cross the road in risky situations. Accid. Anal. Prev. 2007, 39, 224–237. [Google Scholar] [CrossRef]
- Gorrini, A.; Crociani, L.; Vizzari, G.; Bandini, S. Observation results on pedestrian-vehicle interactions at non-signalized intersections towards simulation. Transp. Res. Part. F Traffic Psychol. Behav. 2018, 59, 269–285. [Google Scholar] [CrossRef]
- Gallup, A.C.; Hale, J.J.; Sumpter, D.J.; Garnier, S.; Kacelnik, A.; Krebs, J.R.; Couzin, I.D. Visual attention and the acquisition of information in human crowds. Proc. Natl. Acad. Sci. USA 2012, 109, 7245–7250. [Google Scholar] [CrossRef] [PubMed] [Green Version]
- Webster, M.M.; Ward, A.J.W. Personality and social context. Biol. Rev. 2011, 86, 759–773. [Google Scholar] [CrossRef] [PubMed]
- Faria, J.J.; Krause, S.; Krause, J. Collective behavior in road crossing pedestrians: The role of social information. Behav. Ecol. 2010, 21, 1236–1242. [Google Scholar] [CrossRef]
- Pelé, M.; Bellut, C.; Debergue, E.; Gauvin, C.; Jeanneret, A.; Leclere, T.; Nicolas, L.; Pontier, F.; Zausa, D.; Sueur, C. Cultural influence of social information use in pedestrian road-crossing behaviours. Open Sci. 2017, 4, 160739. [Google Scholar] [CrossRef] [PubMed] [Green Version]
- Cialdini, R.B.; Goldstein, N.J. Social influence: Compliance and conformity. Annu. Rev. Psychol. 2004, 55, 591–621. [Google Scholar] [CrossRef] [PubMed]
- Henrich, J.; Boyd, R. The evolution of conformist transmission and the emergence of between-group differences. Evol. Hum. Behav. 1998, 19, 215–241. [Google Scholar] [CrossRef]
- Rosenbloom, T. Crossing at a red light: Behaviour of individuals and groups. Transp. Res. Part. F Traffic Psychol. Behav. 2009, 12, 389–394. [Google Scholar] [CrossRef]
- Schmidt, S.; Färber, B. Pedestrians at the kerb—Recognising the action intentions of humans. Transp. Res. Part. F Traffic Psychol. Behav. 2009, 12, 300–310. [Google Scholar] [CrossRef]
- Kareem, A. Review of global menace of road accidents with special reference to Malaysia—A social perspective. Malays. J. Med. Sci. MJMS 2003, 10, 31. [Google Scholar]
- Zhuang, X.; Wu, C. Pedestrians’ crossing behaviors and safety at unmarked roadway in China. Accid. Anal. Prev. 2011, 43, 1927–1936. [Google Scholar] [CrossRef] [PubMed]
- Papadimitriou, E.; Theofilatos, A.; Yannis, G. Patterns of pedestrian attitudes, perceptions and behaviour in Europe. Saf. Sci. 2013, 53, 114–122. [Google Scholar] [CrossRef]
- Pucher, J.; Dijkstra, L. Promoting safe walking and cycling to improve public health: Lessons from the Netherlands and Germany. Am. J. Public Health 2003, 93, 1509–1516. [Google Scholar] [CrossRef] [PubMed]
- Czaczkes, T.J.; Czaczkes, B.; Iglhaut, C.; Heinze, J. Composite collective decision-making. Proc. R Soc. B 2015, 282, 20142723. [Google Scholar] [CrossRef] [PubMed] [Green Version]
- Dyer, J.R.G.; Johansson, A.; Helbing, D.; Couzin, I.D.; Krause, J. Leadership, consensus decision making and collective behaviour in humans. Philos. Trans. R. Soc. B Biol. Sci. 2009, 364, 781–789. [Google Scholar] [CrossRef]
- Kurvers, R.H.J.M.; Wolf, M.; Naguib, M.; Krause, J. Self-organized flexible leadership promotes collective intelligence in human groups. Open Sci. 2015, 2, 150222. [Google Scholar] [CrossRef] [Green Version]
- Fleming, T.R.; Harrington, D.P. Counting Processes and Survival Analysis; John Wiley & Sons: Hoboken, NJ, USA, 2011; ISBN 978-1-118-15066-5. [Google Scholar]
- Klein, J.P.; Goel, P.K. Survival Analysis: State of the Art; Springer: Berlin, Germany, 1992; ISBN 978-0-7923-1634-3. [Google Scholar]
- Miller, R.G.; Gong, G.; Muñoz, A. Survival Analysis; John Wiley & Sons: Hoboken, NJ, USA, 1981. [Google Scholar]
- Robinson, E.J.H.; Franks, N.R.; Ellis, S.; Okuda, S.; Marshall, J.A.R. A simple threshold rule is sufficient to explain sophisticated collective decision-making. PLoS ONE 2011, 6, e19981. [Google Scholar] [CrossRef] [PubMed]
- Sumpter, D.J.T.; Pratt, S.C. Quorum responses and consensus decision making. Philos. Trans. R. Soc. B Biol. Sci. 2009, 364, 743–753. [Google Scholar] [CrossRef]
- Tiwari, G.; Bangdiwala, S.; Saraswat, A.; Gaurav, S. Survival analysis: Pedestrian risk exposure at signalized intersections. Transp. Res. Part F Traffic Psychol. Behav. 2007, 10, 77–89. [Google Scholar] [CrossRef]
- Sueur, C.; Deneubourg, J.-L. Self-organization in primates: Understanding the rules underlying collective movements. Int. J. Primatol. 2011, 32, 1413–1432. [Google Scholar] [CrossRef]
- Sueur, C.; Pelé, M. Risk should be objectively defined: Reply to Zentall and Smith. Anim. Cogn. 2015, 18, 981–983. [Google Scholar] [CrossRef] [PubMed]
- Benedict, R. The Chrysanthemum and the Sword: Patterns of Japanese Culture; Houghton Mifflin Harcourt: Boston, MA, USA, 2005; ISBN 978-0-618-61959-7. [Google Scholar]
- Fernandez, A.A.; Deneubourg, J.L. On following behaviour as a mechanism for collective movement. J. Theor. Biol. 2011, 284, 7–15. [Google Scholar] [CrossRef] [PubMed] [Green Version]
- King, A.J.; Cowlishaw, G. Leaders, followers and group decision-making. Integr. Commun. Biol. 2009, 2, 147–150. [Google Scholar] [CrossRef] [PubMed]
- Van Vugt, M.; Hogan, R.; Kaiser, R.B. Leadership, followership, and evolution: Some lessons from the past. Am. Psychol. 2008, 63, 182–196. [Google Scholar] [CrossRef]
- Guo, H.; Wang, W.; Guo, W.; Jiang, X.; Bubb, H. Reliability analysis of pedestrian safety crossing in urban traffic environment. Saf. Sci. 2012, 50, 968–973. [Google Scholar] [CrossRef]
- Osman, L.M. Conformity or compliance? A study of sex differences in pedestrian behaviour. Br. J. Soc. Psychol. 1982, 21, 19–21. [Google Scholar] [CrossRef]
- Zhou, R.; Horrey, W.J.; Yu, R. The effect of conformity tendency on pedestrians’ road-crossing intentions in China: An application of the theory of planned behavior. Accid. Anal. Prev. 2009, 41, 491–497. [Google Scholar] [CrossRef]
- Brosseau, M.; Zangenehpour, S.; Saunier, N.; Miranda-Moreno, L. The impact of waiting time and other factors on dangerous pedestrian crossings and violations at signalized intersections: A case study in Montreal. Transp. Res. Part F Traffic Psychol. Behav. 2013, 21, 159–172. [Google Scholar] [CrossRef]
- Dommes, A.; Granié, M.-A.; Cloutier, M.-S.; Coquelet, C.; Huguenin-Richard, F. Red light violations by adult pedestrians and other safety-related behaviors at signalized crosswalks. Accid. Anal. Prev. 2015, 80, 67–75. [Google Scholar] [CrossRef] [Green Version]
- Sueur, C.; Petit, O.; Deneubourg, J. Selective mimetism at departure in collective movements of Macaca tonkeana: An experimental and theoretical approach. Anim. Behav. 2009, 78, 1087–1095. [Google Scholar] [CrossRef]
- Guitart-Masip, M.; Duzel, E.; Dolan, R.; Dayan, P. Action versus valence in decision making. Trends Cogn. Sci. 2014, 18, 194–202. [Google Scholar] [CrossRef] [Green Version]
- Kahnt, T.; Grueschow, M.; Speck, O.; Haynes, J.-D. Perceptual learning and decision-making in human medial frontal cortex. Neuron 2011, 70, 549–559. [Google Scholar] [CrossRef] [PubMed]
- Kanakia, A.; Klingner, J.; Correll, N.A.; Klingner, J.; Correll, N. A response threshold sigmoid function model for swarm robot collaboration. In Distributed Autonomous Robotic Systems; Springer: Berlin, Germany, 2016; pp. 193–206. [Google Scholar]
- Lempert, R.J.; Collins, M.T. Managing the Risk of Uncertain Threshold Responses: Comparison of Robust, Optimum, and Precautionary Approaches. Risk Anal. 2007, 27, 1009–1026. [Google Scholar] [CrossRef]
- Philiastides, M.G.; Sajda, P. Temporal characterization of the neural correlates of perceptual decision making in the human brain. Cereb. Cortex 2006, 16, 509–518. [Google Scholar] [CrossRef] [PubMed]
- Sueur, C.; Deneubourg, J.-L.; Petit, O. Sequence of quorums during collective decision making in macaques. Behav. Ecol. Sociobiol. 2010, 64, 1875–1885. [Google Scholar] [CrossRef]
- Nicolis, G.; Prigogine, I. Exploring Complexity: An Introduction; W.H. Freeman: New York, NY, USA, 1989; ISBN 0-7167-1859-6. [Google Scholar]
- Sueur, C.; Perony, N.; Amblard, F.; Guillaume, J.-L. Modélisation des réseaux sociaux. In Analyse des Réseaux Sociaux Appliquée à l’Ethologie et à l’Ecologie; Editions Matériologiques: Paris, France, 2015; pp. 423–444. [Google Scholar]
- Todd, P.M.; Gigerenzer, G. Précis of simple heuristics that make us smart. Behav. Brain Sci. 2000, 23, 727–741. [Google Scholar] [CrossRef]
- García, L.V. Escaping the Bonferroni iron claw in ecological studies. Oikos 2004, 105, 657–663. [Google Scholar] [CrossRef] [Green Version]
- Holm, S. A Simple sequentially rejective multiple test procedure. Scand. J. Stat. 1979, 6, 65–70. [Google Scholar]
- Gårder, P. Pedestrian safety at traffic signals: A study carried out with the help of a traffic conflicts technique. Accid. Anal. Prev. 1989, 21, 435–444. [Google Scholar] [CrossRef]
- Lachapelle, U.; Cloutier, M.-S. On the complexity of finishing a crossing on time: Elderly pedestrians, timing and cycling infrastructure. Transp. Res. Part Policy Pract. 2017, 96, 54–63. [Google Scholar] [CrossRef]
- Amé, J.-M.; Halloy, J.; Rivault, C.; Detrain, C.; Deneubourg, J.L. Collegial decision making based on social amplification leads to optimal group formation. Proc. Natl. Acad. Sci. USA 2006, 103, 5835–5840. [Google Scholar] [CrossRef] [PubMed] [Green Version]
- Green, L.; Myerson, J. Exponential versus hyperbolic discounting of delayed outcomes: Risk and waiting time. Am. Zool. 1996, 36, 496–505. [Google Scholar] [CrossRef]
- Story, G.W.; Vlaev, I.; Seymour, B.; Darzi, A.; Dolan, R.J. Does temporal discounting explain unhealthy behavior? A systematic review and reinforcement learning perspective. Front. Behav. Neurosci. 2014, 8, 76. [Google Scholar] [CrossRef] [PubMed]
- Iosa, M.; Fusco, A.; Morone, G.; Paolucci, S. Development and decline of upright gait stability. Front. Aging Neurosci. 2014, 6, 14. [Google Scholar] [CrossRef]
- Yaffe, K.; Barnes, D.; Nevitt, M.; Lui, L.-Y.; Covinsky, K. A Prospective study of physical activity and cognitive decline in elderly women: Women who walk. Arch. Intern. Med. 2001, 161, 1703–1708. [Google Scholar] [CrossRef] [PubMed]
- Gould, J.P. Risk, stochastic preference, and the value of information. J. Econ. Theory 1974, 8, 64–84. [Google Scholar] [CrossRef]
- Mihet, R. Effects of Culture on Firm Risk-Taking: A Cross-Country and Cross-Industry Analysis; International Monetary Fund: Washington, DC, USA, 2012. [Google Scholar]
- Zuberbühler, K. Audience effects. Curr. Biol. 2008, 18, R189–R190. [Google Scholar] [CrossRef] [Green Version]
- Bateson, M.; Nettle, D.; Roberts, G. Cues of being watched enhance cooperation in a real-world setting. Biol. Lett. 2006, 2, 412–414. [Google Scholar] [CrossRef] [Green Version]
- Köll, H.; Bader, M.; Axhausen, K.W. Driver behaviour during flashing green before amber: A comparative study. Accid. Anal. Prev. 2004, 36, 273–280. [Google Scholar] [CrossRef]
- Keegan, O.; O’Mahony, M. Modifying pedestrian behaviour. Transp. Res. Part A Policy Pract. 2003, 37, 889–901. [Google Scholar] [CrossRef]
- Lipovac, K.; Vujanic, M.; Maric, B.; Nesic, M. The influence of a pedestrian countdown display on pedestrian behavior at signalized pedestrian crossings. Transp. Res. Part F Traffic Psychol. Behav. 2013, 20, 121–134. [Google Scholar] [CrossRef]
Figure 1.
Survival analysis of departure time at the red light for the observed data (grey). Yellow points indicate theoretical survival following a sigmoid law (non constant probability of departures). Orange and blue points indicate theoretical survival following constant probability of departure (blue: k = 0.05, high probability to cross at the red light; orange: k = 0.0005, low probability to cross at the red light).

Figure 2.
(a) Survival analysis of departure time (s) for the total dataset, i.e., at the red light (negative values) and at the green light (positive value) for the observed data (grey) and for the theoretical data (yellow); (b) Survival values of theoretical data according to survival values of observed data. The thin black line represents the correlation we should observe between the two survivals if the rule underlying the departure of a pedestrian follows only one rule (here a sigmoid curve, Equation (1)). For Figure 2a, 0 indicates the time at which the light turns green.

Figure 3.
Survival analysis of departure time(s) at the red light for the observed data (grey) and for the theoretical data (yellow) (a) before −4 s and (c) between −4 and 0 s. Survival curves of theoretical data compared to survival of observed data; (b) before −4 s and (d) between −4 and 0 s. The thin black line represents the correlation we should observe between the two survivals if the rule underlying the departure of a pedestrian follows only one rule (here, a sigmoid curve, Equation (1)). For Figure 3a,c, 0 indicates the time at which the light turns green.

Figure 4.
(a) Survival analysis of departure time (as log. scale(s)) at the green light for the observed data (grey) and for the theoretical data (yellow); (b) Survival values of theoretical data compared to survival values of observed data. The thin black line represents the correlation we should observe between the two survival values if the rule underlying the departure of a pedestrian follows only one rule (here, a sigmoid curve, Equation (1)). For Figure 4a, 0 (1; as log scale) indicates the time at which the light turns green.

Figure 5.
(a) Survival analysis of the number of waiting pedestrians at the time of crossing at the green light (grey) and the red light (yellow); (b) Ratio of observations for crossings according to the number of waiting pedestrians. -1 indicates that all crossings were made at the red light. 1 indicates that all crossings were made at the green light. 0 means that half of the observations were made at the green light (and, of course, half at the red light). A red square indicates data that can only be significantly explained (p < 0.05).


Table 1.
Information about the studied sites in France and in Japan. Road-crossing speed was estimated by scoring the crossing speed of 20 random pedestrians for each site.
Table 1.
Information about the studied sites in France and in Japan. Road-crossing speed was estimated by scoring the crossing speed of 20 random pedestrians for each site.
| France-Strasbourg | ||||
| Sites | Train Station | Pont des Corbeaux | Place Broglie | |
| Coordinates | 48.584474, 7.736135 | 48.579509, 7.750745 | 48.584559, 7.748628 | |
| Lanes | 2 * 1 | 2 * 2 | 2 * 1 | |
| Mean pedestrian flow per hour | 667 | 612 | 850 | |
| Mean road crossing speed (m.s−1) | 0.96 ± 0.05 | 1.11 ± 0.29 | 1.01 ± 0.16 | |
| Dates of scoring | 2–7 July 2014 | 1–25 October 2014 | 15 February–9 March 2015 | |
| Japan-Nagoya | ||||
| Sites | Train Station | Maruei | Excelco | Osu-Kannon |
| Coordinates | 35.170824, 136.884328 | 35.168638, 136.905740 | 35.166891, 136.907284 | 35.159316, 136.901697 |
| Lanes | 2 * 3 | 1 * 1 | 2 * 1 | 2 * 1 |
| Mean pedestrian flow per hour | 480 | 645 | 869 | 814 |
| Mean road crossing speed (m.s−1) | 1.10 ± 0.22 | 1.15 ± 0.21 | 0.98 ± 0.21 | 1.07 ± 0.18 |
| Dates of scoring | 13 June–5 July 2011 | 27 January–5 February 2015 | ||
Table 2.
Values of threshold S and sensitivity q from the sigmoid curves fitting with the observed data for each category (country-gender) as well as statistical values. All p-values are <0.00001.
Table 2.
Values of threshold S and sensitivity q from the sigmoid curves fitting with the observed data for each category (country-gender) as well as statistical values. All p-values are <0.00001.
| France-Man | France-Woman | Japan-Man | Japan-Woman | ||
|---|---|---|---|---|---|
| Red light (up to 4 s) | Threshold S | −8 s | −5.7 s | Non-applicable due to small dataset (two points per condition) | |
| Sensitivity q | 2.86 | 5.56 | |||
| R² | 0.98 | 0.98 | |||
| F | 1882 | 2242 | |||
| Light still red, but change approaching (between 4 and 0 s) | Threshold S | −2.3 s | −1 s | −0.6 s | −0.6 s |
| Sensitivity q | 2.5 | 2.2 | 2 | 2 | |
| R² | 0.99 | 0.97 | 0.98 | 0.98 | |
| F | 3196 | 571 | 1656 | 734 | |
| Green light | Threshold S | 0.8 s | 0.9 s | 0.7 s | 0.7 s |
| Sensitivity q | 2.5 | 3 | 3 | 3.5 | |
| R² | 0.99 | 0.99 | 0.98 | 0.99 | |
| F | 1727 | 1319 | 6902 | 14,890 | |
Table 3.
Equation and statistical values of survival curves for departure time according to the country and the number of lanes. The six lanes condition in Japan does not appear here as no illegal crossings were observed. All p-values are <0.00001.
Table 3.
Equation and statistical values of survival curves for departure time according to the country and the number of lanes. The six lanes condition in Japan does not appear here as no illegal crossings were observed. All p-values are <0.00001.
| Country | Number of Lanes | Equation (y = a * e−bx) | Log Gradient −(1/b) | R² | F |
|---|---|---|---|---|---|
| France | 2 | y = 0.954 * e−0.0006x | −1666.67 | 0.99 | 8032 |
| Japan | 2 | y = 0.9 * e−0.009x | −1000 | 0.82 | 67 |
| France | 4 | y = 1.0012 * e−0.003x | −333.33 | 0.99 | 3128 |
| Japan | 4 | y = 1.340 * e−0.007x | −142.86 | 0.90 | 269 |
Table 4.
Equation and statistical values of survival curves for waiting time according to the country and the gender of crossing pedestrians. All p-values are <0.00001.
Table 4.
Equation and statistical values of survival curves for waiting time according to the country and the gender of crossing pedestrians. All p-values are <0.00001.
| Country | Gender | Equation (y = a * e−bx) | Log Gradient (1/b) | R² | F |
|---|---|---|---|---|---|
| France | Man | y = 0.852 * e−0.0008x | 1250 | 0.98 | 3663 |
| Japan | Man | y = 1.143 * e−0.0003x | 3333.3 | 0.96 | 620 |
| France | Woman | y = 0.942 * e−0.0006x | 1666.7 | 0.99 | 5556 |
| Japan | Woman | y = 1.048 * e−0.0003x | 3333.3 | 0.94 | 220 |
© 2019 by the authors. Licensee MDPI, Basel, Switzerland. This article is an open access article distributed under the terms and conditions of the Creative Commons Attribution (CC BY) license (http://creativecommons.org/licenses/by/4.0/).
Share and Cite
MDPI and ACS Style
Pelé, M.; Deneubourg, J.-L.; Sueur, C. Decision-Making Processes Underlying Pedestrian Behaviors at Signalized Crossing: Part 1. The First to Step off the Kerb. Safety 2019, 5, 79. https://doi.org/10.3390/safety5040079
AMA Style
Pelé M, Deneubourg J-L, Sueur C. Decision-Making Processes Underlying Pedestrian Behaviors at Signalized Crossing: Part 1. The First to Step off the Kerb. Safety. 2019; 5(4):79. https://doi.org/10.3390/safety5040079
Chicago/Turabian StylePelé, Marie, Jean-Louis Deneubourg, and Cédric Sueur. 2019. "Decision-Making Processes Underlying Pedestrian Behaviors at Signalized Crossing: Part 1. The First to Step off the Kerb" Safety 5, no. 4: 79. https://doi.org/10.3390/safety5040079
Note that from the first issue of 2016, this journal uses article numbers instead of page numbers. See further details here.