Modified iButtons: A Low-Cost Instrument to Measure the Albedo of Landscape Elements
by
 ,
,
Jane Loveday
1,* ,
,
Grant K. Loveday
2,
Joshua J. Byrne
1, 
Boon-lay Ong
3 and
Gregory M. Morrison
1 1
School of Design and the Built Environment, Curtin University Sustainability Policy Institute, Curtin University, Bentley 6102, Australia
2
Independent Researcher, Booragoon 6154, Australia
3
School of Design and the Built Environment, Curtin University, Bentley 6102, Australia
*
Author to whom correspondence should be addressed.
Sustainability 2019, 11(24), 6896; https://doi.org/10.3390/su11246896
Submission received: 21 October 2019
/
Revised: 20 November 2019
/
Accepted: 29 November 2019
/
Published: 4 December 2019
(This article belongs to the Section Sustainable Urban and Rural Development)
Abstract
:Urban infill can lead to increased urban air and surface temperatures. Landscape elements (LEs) which can maintain cooler surface temperatures also reduce night-time re-emission of heat; however, reflected solar radiation (albedo) from these LEs during the day potentially increases heat loads on nearby objects, pedestrians or buildings. Albedo is traditionally measured using two pyranometers, however their expense can be prohibitive for researchers and landscape professionals. A low cost albedometer was developed consisting of a pair of black- and white-painted temperature sensors (Thermochron® iButtons). The albedos of 14 LEs typically found in suburban landscapes in Perth, Western Australia, were measured. Three approaches were tested: The first two used white-painted polystyrene (WPP) as a reference (one taking view factors into account, and one ignoring the albedo of the background material), whilst the third approach used upwards-facing iButtons as a reference, similar to conventional pyranometer methods. The WPP approaches controlled for weather effects, providing a consistent albedo over a longer daytime period than recommended by the standard ASTM-E1918-16. Measured albedos were similar to literature values. This instrument could be used as an alternative to more expensive pyranometers and could assist landscape professionals to design for, and manage, urban heat.
1. Introduction
In the context of climate change and global warming, our urban air and surface temperatures are increasing [1,2]. Urban warming leads to increased cooling costs [3,4], predicted to rise even more in the coming decades due to the increased uptake of air conditioning units as global incomes rise [5]. Urban infill has decreased the size of residential gardens or landscapes, leading to increased impermeable surfaces and overall loss of vegetation [6].
Improved design of urban spaces, with consideration for interactions between buildings and landscapes, has the potential to reduce urban heat and to increase human thermal comfort [7]. An inverse relationship has been demonstrated between measures taken to reduce UHI and adverse health effects [8]. Building and pavement materials, as well as outdoor green spaces, have been identified as being important considerations for reducing heat [8,9]. The use of green infrastructure has been studied for its ability to manage increased ambient and surface temperatures [10,11,12,13], for saving energy through reduced cooling costs [9], and has also been shown to reduce human thermal stress [12,14]. However, an urban environment cannot consist only of green infrastructure. Landscape designs are based on spatial organisation and the morphology of materials [15], hence research into material properties and how they affect heat in the urban environment is important.
Surface treatments or landscape elements (LEs) which are able to maintain cooler surface temperatures, can reduce the amount of thermal energy re-emitted during the night (through application of the Stefan–Boltzmann law [16]), thus reducing the night-time surface urban heat island (UHI). However in urban environments where sky view factors are lower, there are many radiative exchanges between buildings, infrastructure, people and landscapes, and more highly reflective materials have been shown to cause both increases in building energy use [17] and decreases in human thermal comfort [18,19,20]. Higher albedo surfaces have also recently been associated with increased levels of ozone and PM10 (particulate matter less than 10 µm), although they reduce the UHI intensity [21]. When designing urban landscapes, it is important that landscape professionals understand, and can quantify, the effect of this radiation from LEs.
Solar reflectance, or albedo, is a measure of the proportion of reflected solar radiation (SR) from an object to the total incident SR, where the solar spectrum ranges from 0.3 to 2.5 μm. The albedo of an object depends on its surface properties and can vary with the wavelength of the incident radiation. Albedo is the integration of the reflectivity of an object across all SR wavelengths [22]. It is also a temporal measurement and can be given as an integration across the multiple sun angles which occur over a specific time period. It can vary significantly with wavelength, in particular if the atmosphere is cloudy, contains water vapour or dust, or if the Sun is at a low angle in the sky. Albedo is a dimensionless number between 0 and 1, where 0 represents total absorption of all SR, and 1 represents complete reflection of all SR. Spectral albedo is the albedo at a specific wavelength, while diffuse albedo is the albedo across all solar wavelengths, the latter is referred to in this study.
Because a large proportion of the Sun’s energy falls in the visible spectrum, high albedo objects appear light or white and low albedo ones as dark or black. Researchers have found that albedo is generally high in the early morning and late afternoon but lower and more consistent during the middle of the day [23,24]. Albedo is also greatly affected by the solar radiation intensity and incident angle, as well as the surrounding environment, which decreases the accuracy of field measurements [25]. Consequently, most reported albedos are usually measured at solar midday [23,25] or during a few hours in the middle of the day [26,27]. Albedo changes as surfaces age and this response should be recognised, especially for modelling purposes [28].
A few methods can be used to measure albedo on the local scale. In the field, back to back pyranometers [29] directly compare the incident and reflected radiation. Single pyranometers can also be used by following standard ASTM-E1918-16 [30] where the pyranometer alternately measures incident and reflected radiation. In the laboratory a spectrometer and standard ASTM-E903-12 [31] can be used. However, these commercial albedometers are expensive, being over A$3000 for the back-to-back, not including the required data readers or loggers.
Due to these costs, one researcher has investigated a low-cost option to measure the albedo of snow and ice at 15 locations [32]. They used two low-cost illuminance sensors and determined an albedo index which was later compared with actual albedo values. Similarly, in this study a low-cost temperature sensor (under A$50) was modified in order to detect reflected solar radiation. Other researchers have improved on existing standard measurement methods for finding the albedo of smaller LEs, although still using expensive pyranometers. One used a shade ring to remove the effect of surrounding radiation and performed accurate calculations of view factors and of the effect of albedometer shade on the albedo result [26]. Others have used white and black reference masks to prevent surrounding radiation from being measured [33,34], whilst another used baffles for the same reason [35,36]. Whilst these methods appear to be successful, they are relatively labour intensive, involving adding and removing masks, baffles or shade rings in order to obtain one measurement. In this study, a simpler methodology for using the low-cost instrument to measure albedo will be developed, with three approaches being considered. In order to validate this instrument, the albedo of a number of LEs typical of urban landscapes in Perth, Western Australia, were measured concurrently. The results are compared with literature values for similar materials. The test work was undertaken as a part of a larger study exploring the total emitted and reflected radiation from the same LEs. This instrument could be used to measure and monitor albedo in the field for long time periods and/or over many LEs, providing comprehensive data for landscape professionals.
2. Materials and Methods
2.1. Instrumentation
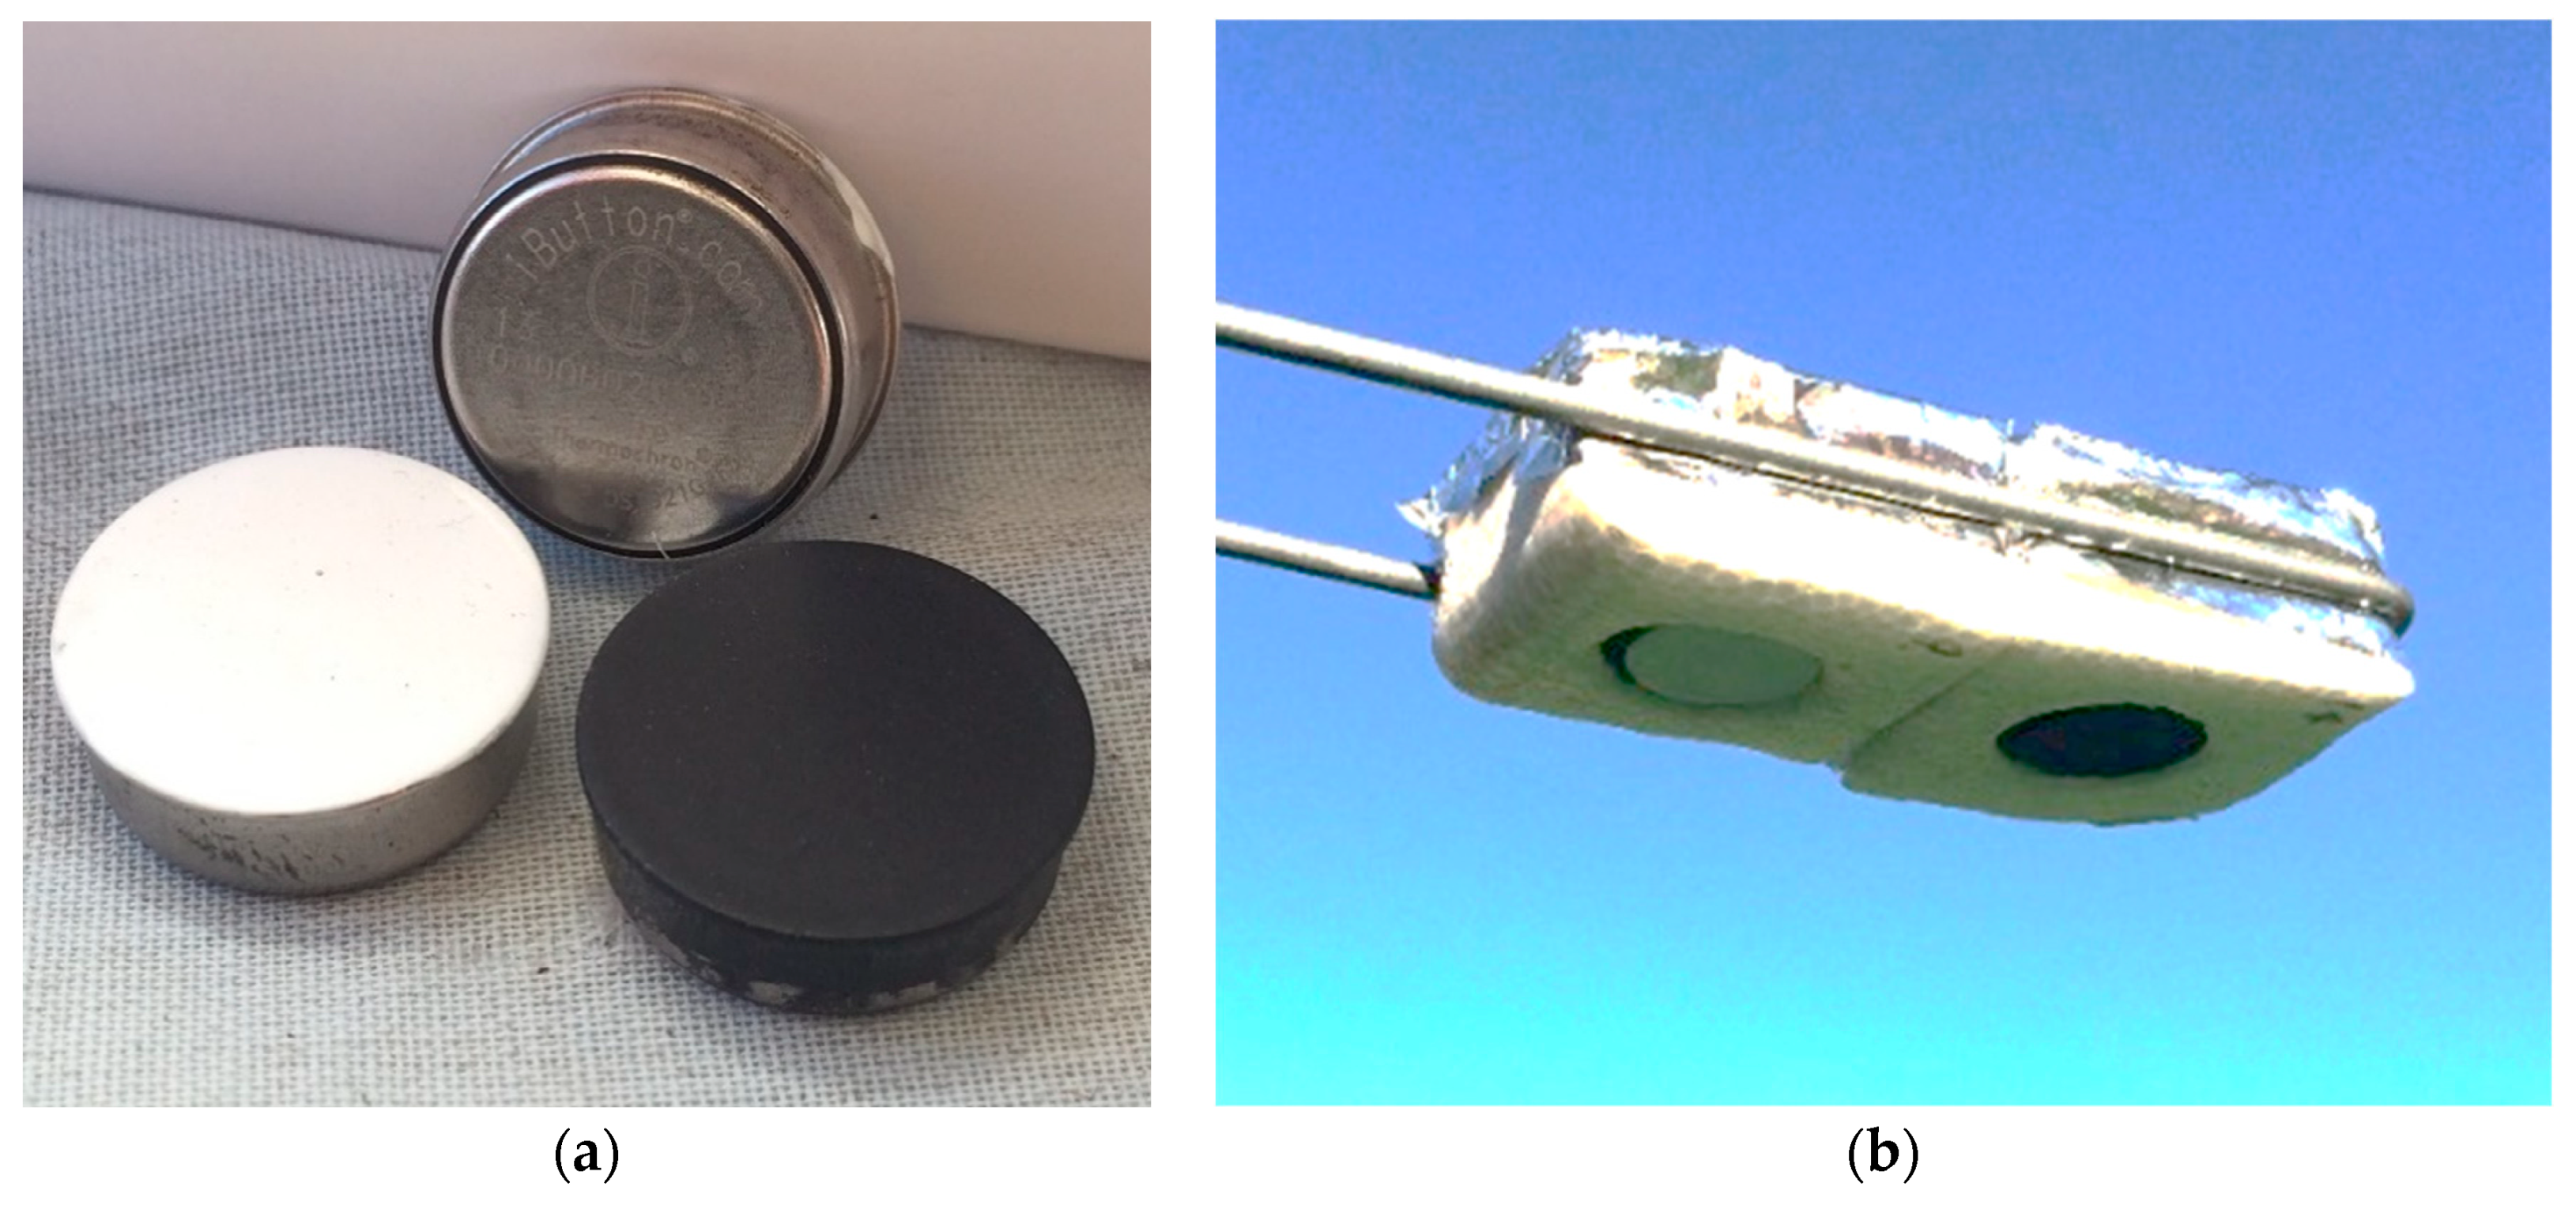
The low-cost temperature sensor and logger is called a Thermochron, and is a type of iButton [37] (Figure 1a). It consists of a silicon chip contained in a stainless steel can (17 mm in diameter and 6 mm high), which it uses as a communications interface. Communication is via a 1-Wire protocol through a probe connected to a computer. A mix of three iButton types were used, the DS1921G low temperature iButtons (−40 to +85 °C, accuracy ±1.0 °C), the DS1922T, high temperature iButtons (0 to +125 °C, accuracy ±0.5 °C) and one DS1923 Hygrochron, temperature and relative humidity iButton (−20 to +85 °C, accuracy ±0.5 °C, 0% to 100%). Data can be logged at user set intervals from 1 min to 255 min for the DS1921G, and from 1 s to 273 h for the DS1922T. The different iButton types were chosen randomly to be painted with either a matt black or a gloss white acrylic paint. They were each inset into a small polystyrene block of dimensions 40 mm × 40 mm × 20 mm and held in place within the block by insertion of a small piece of soft foam. Their surfaces were recessed by approximately 1 mm into the surface of the block (Figure 1b).
Based on the absorptivity measurements of black acrylic paint by [38], black iButtons could be expected to have a consistent absorptivity of around 0.95 for wavelengths from 0.3 μm to 8 μm. In the longwave spectrum, where most LEs emit radiation (from 8 μm to 14 μm), both white and black paint also have a high absorptivity, (white paint and black paint on aluminium are 0.91 and 0.88, respectively [39]). Because albedo is measured for solar wavelengths only, any temperature rise due to longwave radiation will be removed when the white iButton temperature is subtracted from the black iButton temperature. The reason pyranometers do not measure this longwave radiation is because they have a glass dome over the black paint which cuts off radiation above 2.8 μm.
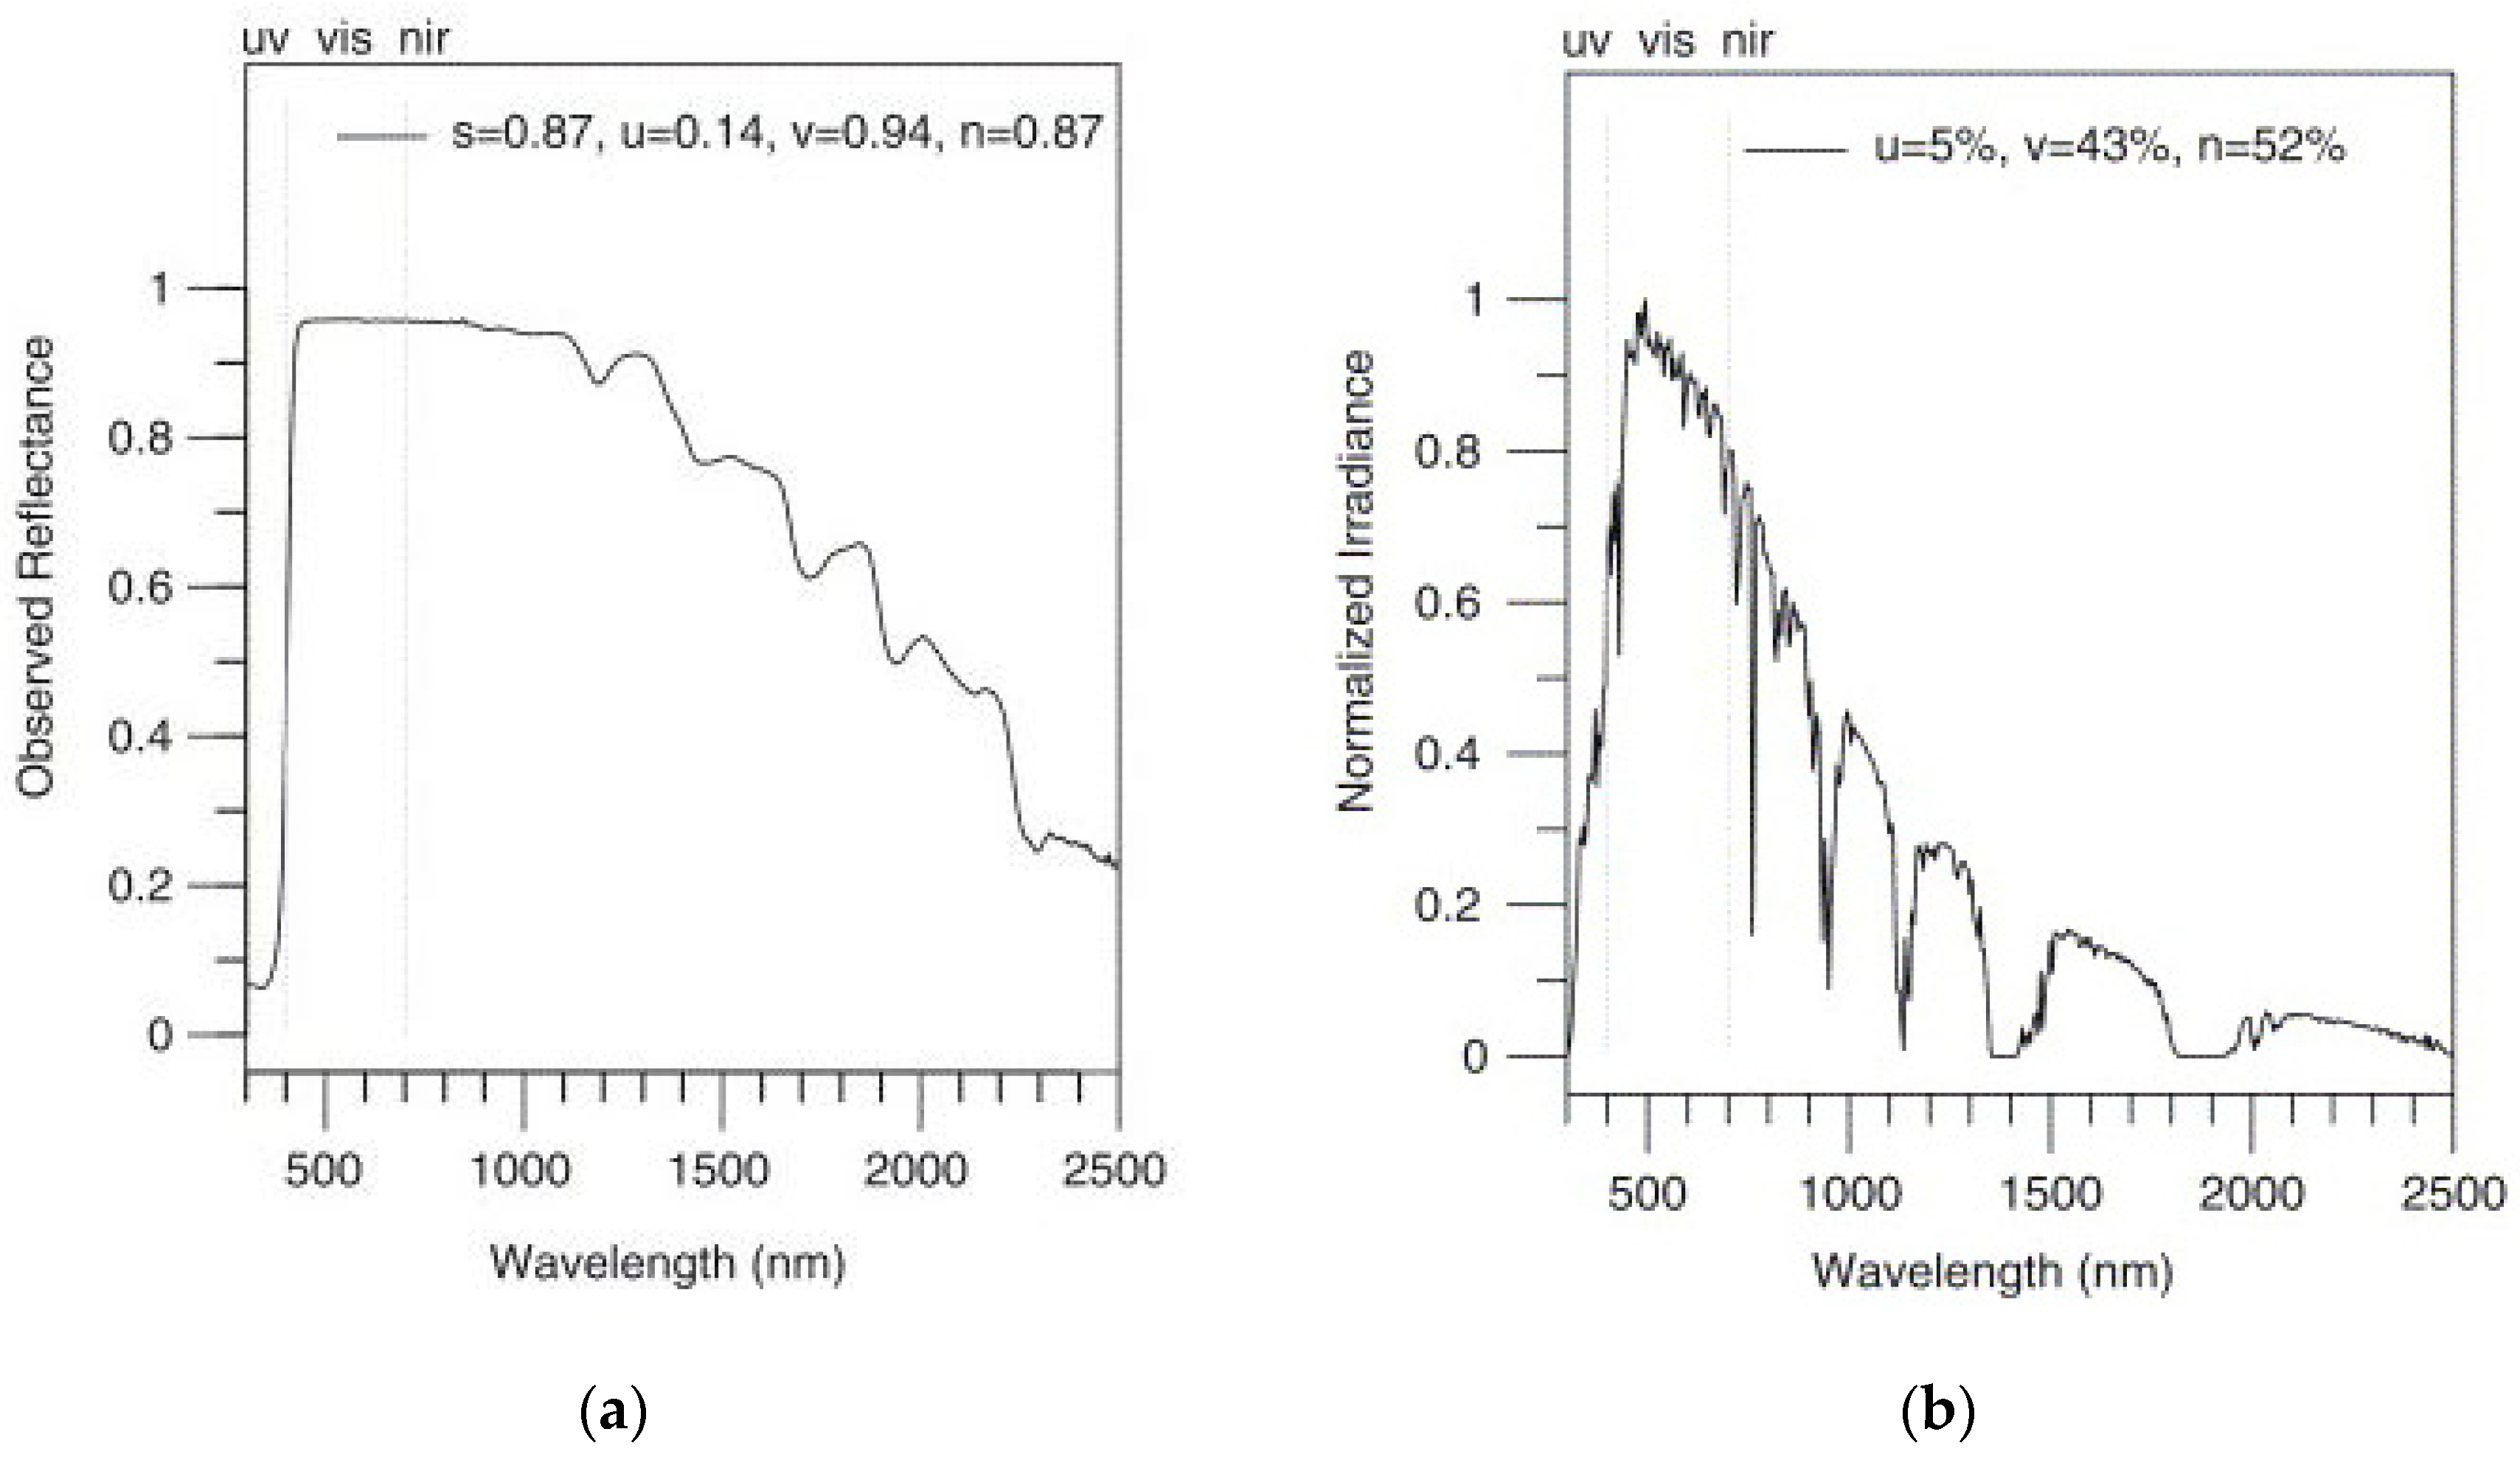
In terms of the solar spectrum, the observed spectral reflectance of white acrylic paint given by [40], shows reflectance is consistently 0.95 across the visible spectrum (vis, 0.4–0.7 μm). In the near infra-red spectrum (NIR, 0.7–2.5 μm), reflectance ranges from 0.95 down to 0.90 over wavelengths from 0.7 μm to 1.35 μm, and then drops from 0.9 at 1.35 μm to ~0.25 at 2.5 μm (Figure 2a). The solar spectrum, however, peaks at around 0.5 μm and decreases to around 20% of the peak by 1.30 μm (equivalent to 1300 nm in Figure 2b). The spectral intensity over the range 1.30 μm to 2.5 μm is less than ~20% of the peak and cumulatively comprises an estimated 25% of the energy in the total NIR range (Figure 2b). Hence, the effect of the reduction in white paint reflectance after 1.30 μm, on the total amount of energy reflected, is very small, and the spectral response of the white painted iButton can be said to be linear.
The temperature difference measured between a matt-black-painted iButton and a glossy-white-painted iButton (TB − TW), is thus projected to be consistent over the solar spectrum. This was observed in a study by [41], where TB − TW was found to have a linear relationship with the SR measured using a pyranometer.
A reference pair of iButtons were used facing upwards to measure the incident SR. They were covered with a thin layer of polyethylene, which reduced convective losses but was a good transmitter of both short- and longwave radiation [42]. For the other iButtons, which were facing downwards, polyethylene layers were not used, as natural convection is very small for this configuration and tests were performed under low wind (forced convection) conditions. To reduce heat loss through the top of the polystyrene block, the upward facing back of each block was covered in aluminium foil (Figure 1b), which reflects well at all wavelengths.
2.2. LEs and Location
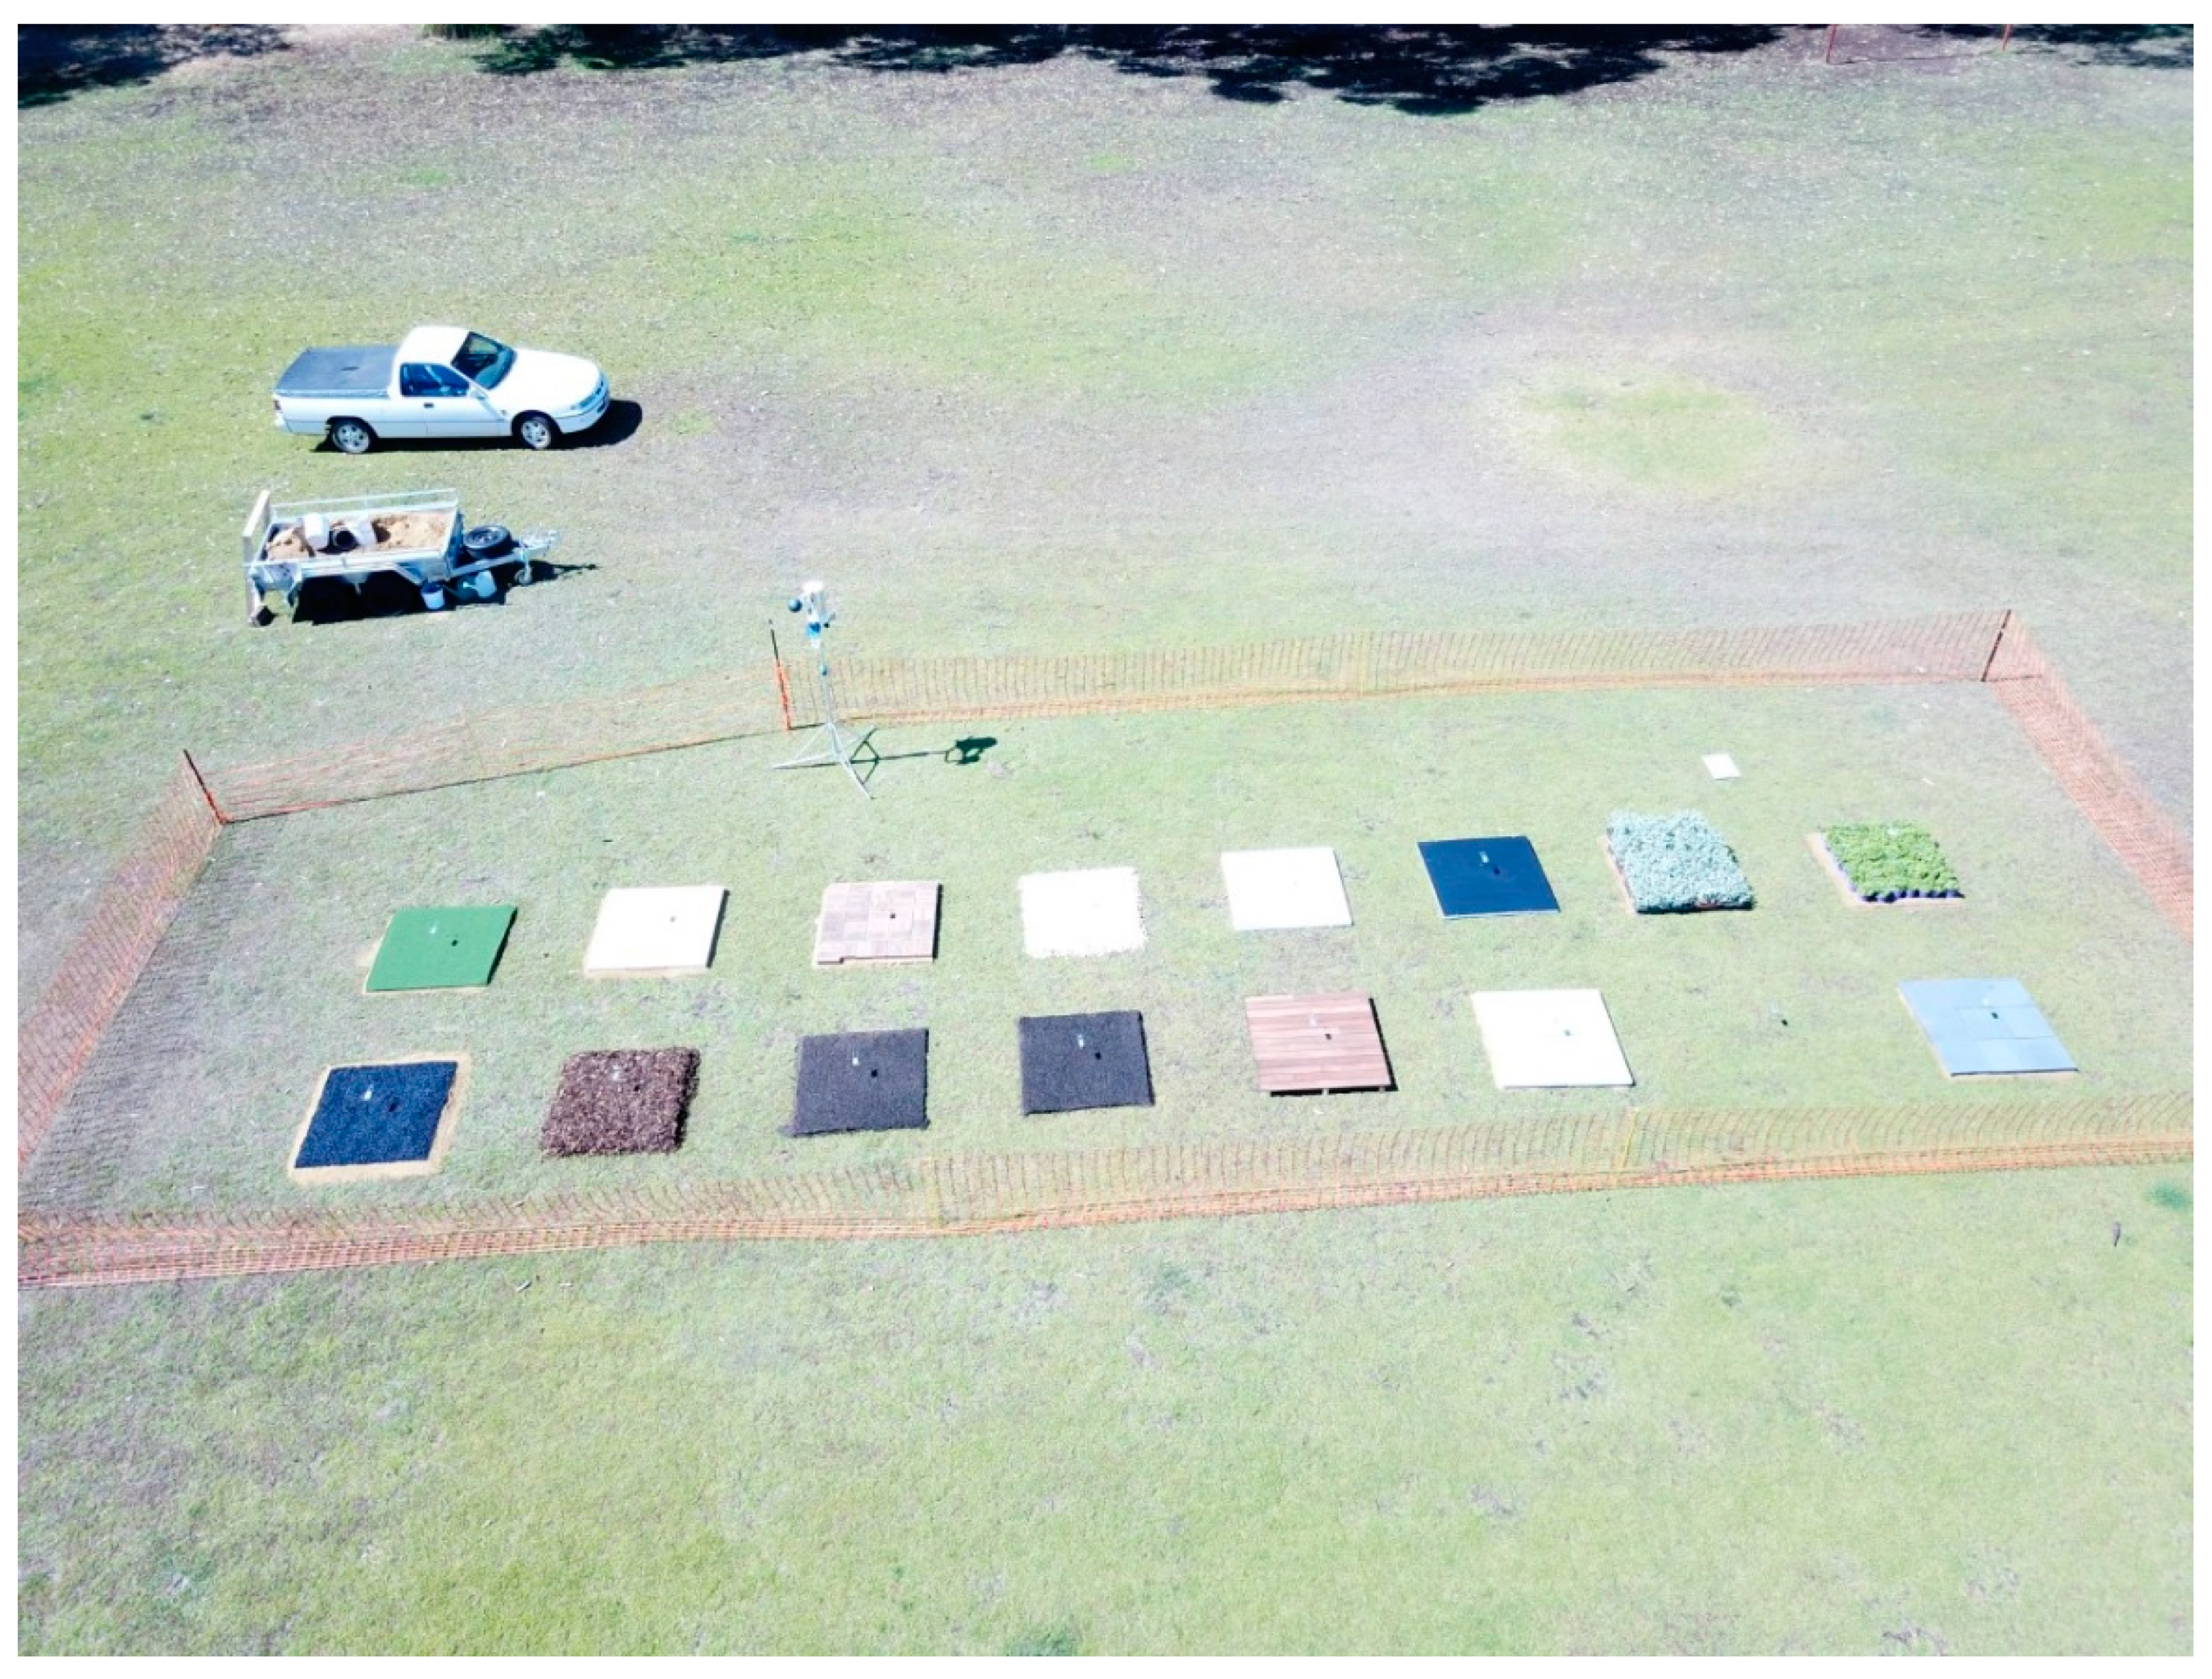
Fourteen LEs, typical of residential and urban landscapes in the Perth area, were measured. A reference material of white-painted polystyrene (WPP) was also measured, and a black-painted polystyrene material was included for comparison with literature values. The LEs used were those described in a previous study [43] and are listed in Table 1. They were all 1200 mm × 1200 mm and were either thermally coupled to the ground on a 50-mm-thick layer of yellow sand, or placed directly onto the turf grass. Each were separated by 1 m of managed and irrigated turf grass of type kikuyu (Pennisetum clandestinum) (Figure 3).
The non-native plants were petunias (Petunia x hybrida) and were in 100 mm pots closely packed together to give nearly 100% coverage of the sand. The native plants were saltbush seedlings (Atriplex nummularia) and were in 50 mm × 50 mm containers and similarly closely packed together.
Weather conditions were monitored via a nearby weather station at Murdoch University [44].
2.3. Test Procedure
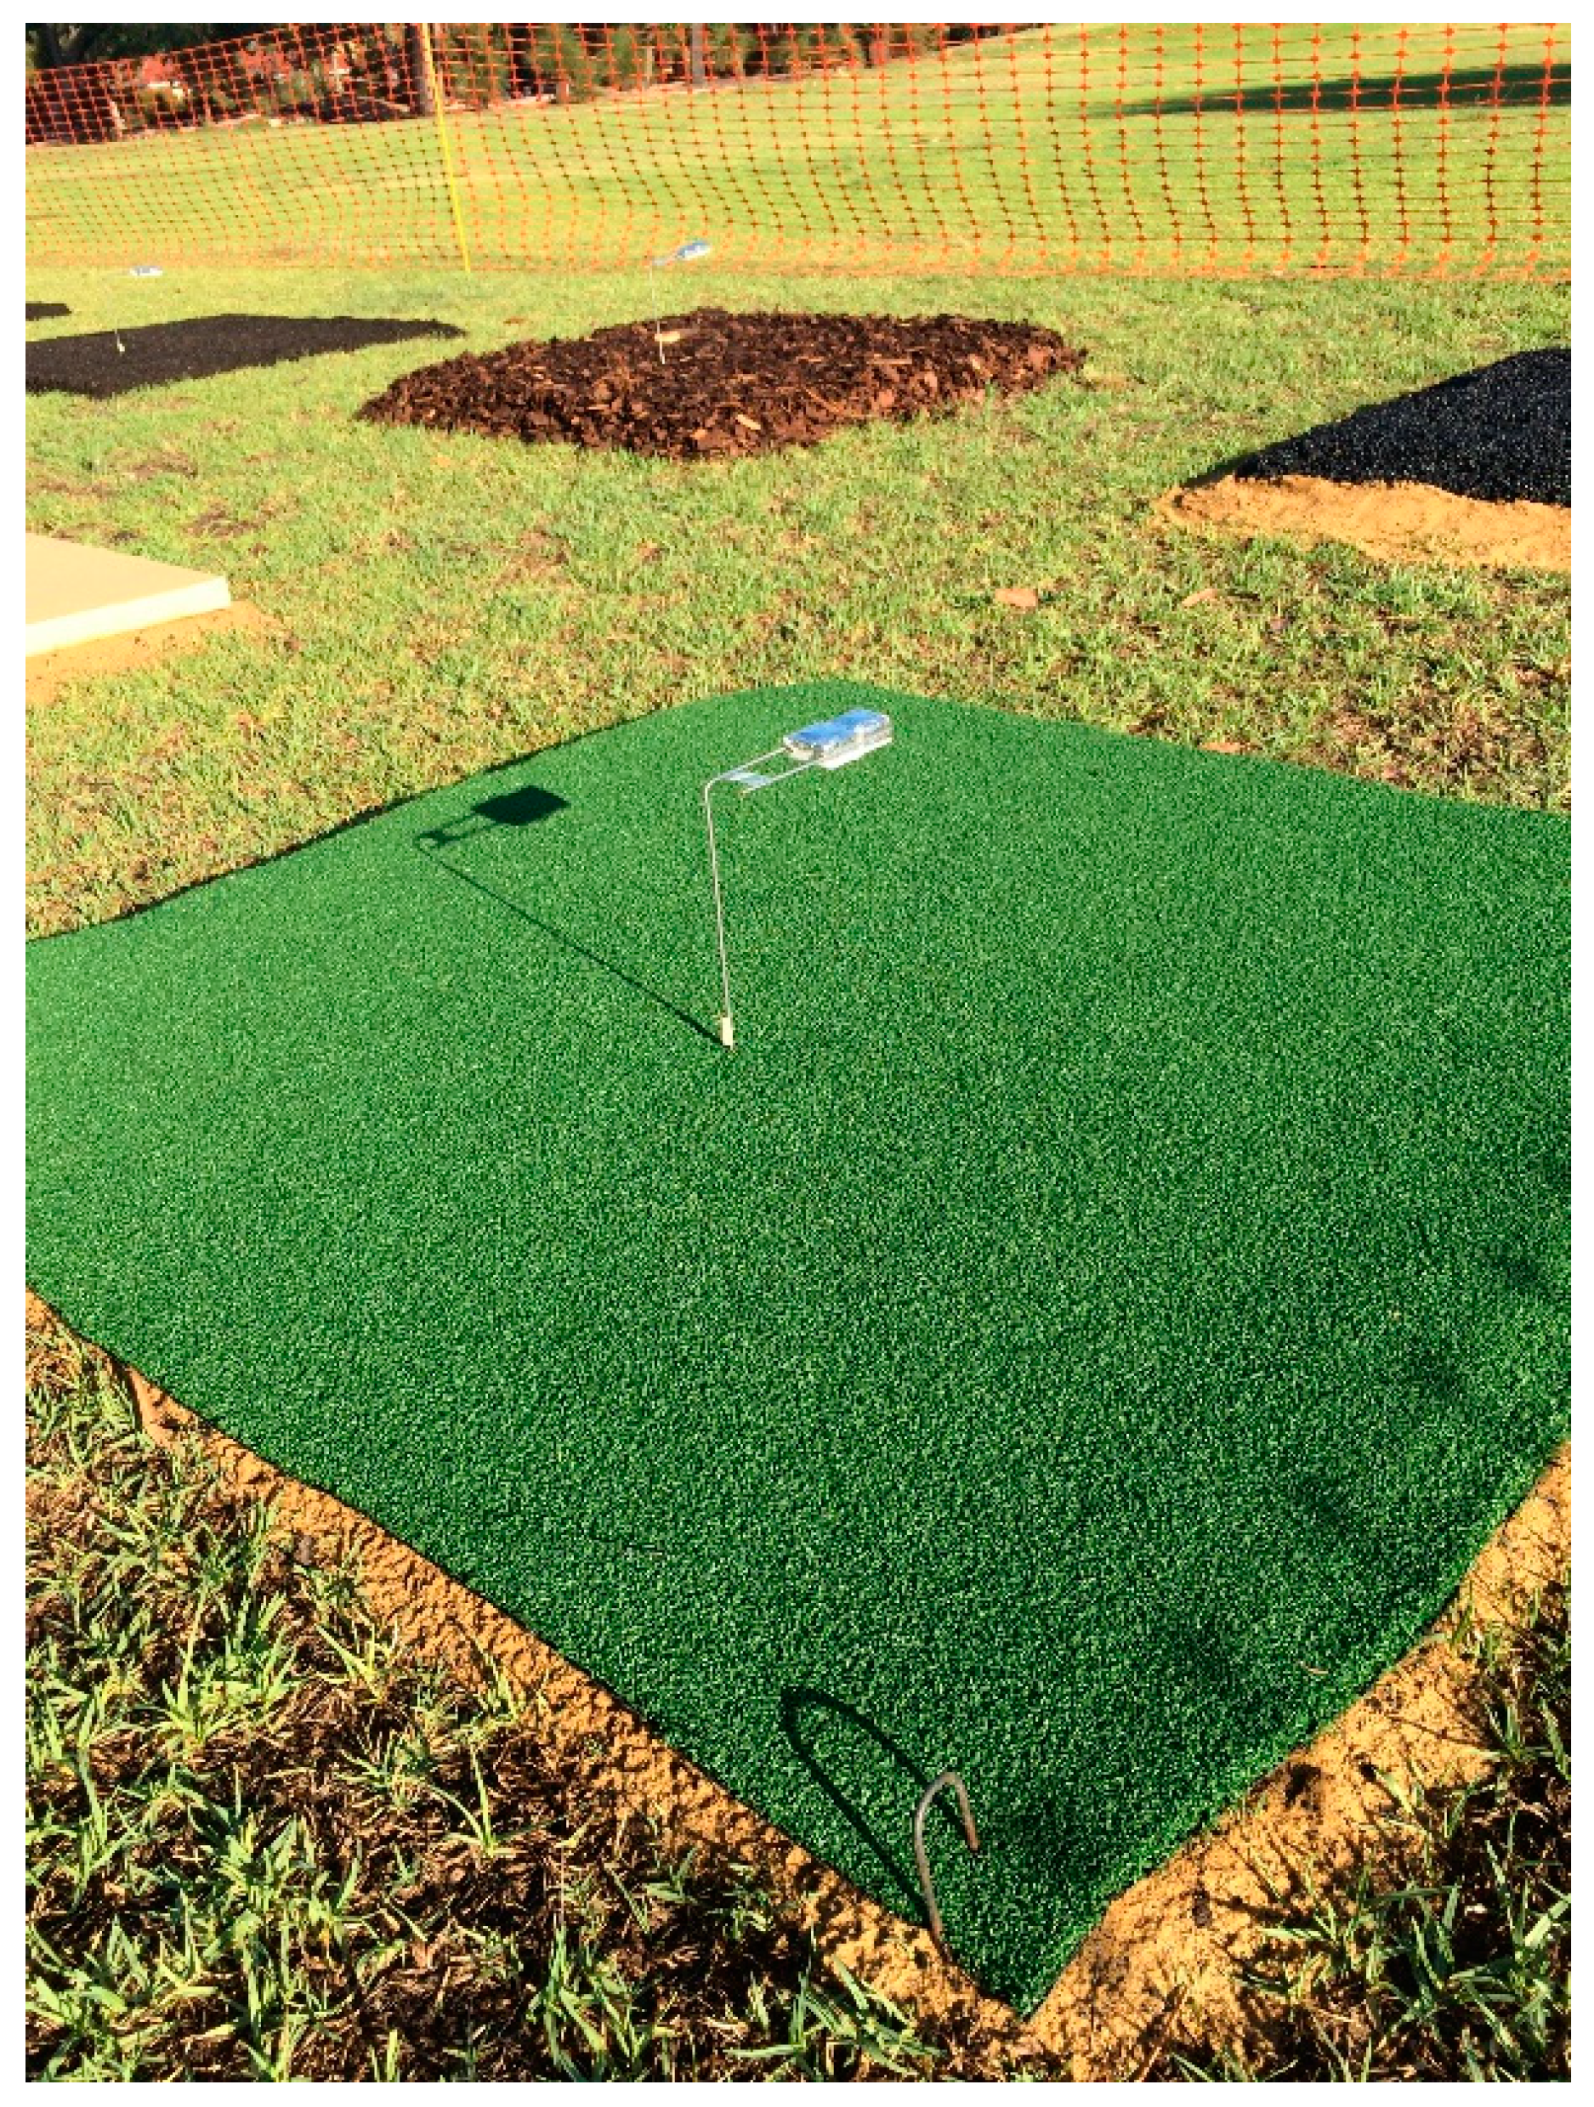
Each black and white iButton pair was suspended 200 mm above the centre of each LE using a thin metal L-shaped rod (Figure 4). This height was chosen as a balance between minimising the amount of shadow the iButton cast onto the LE and maximising the exposure of the iButton to the LE, hence minimising its exposure to the surrounding grass.
The LEs and iButtons were set up from 17:00 on 19 January 2019 to 21:00 on 21 January 2019, on an oval at the Booragoon Primary School (−32.035918°, 115.826655°). The logging intervals of the iButtons for all tests were set to 600 s. Data were analysed for 20 and 21 January. A comparison was made between the days of the 20th and the 21st.
Three approaches to determine the albedos of each LE were undertaken. The first two both examined the reflected radiation from the LEs compared with that from the WPP, whilst the third compared this with the incident SR. In the first approach (Approach 1), the amount of radiation from the background material upon which the LEs were situated (in this case, grass) was taken into account. In the second approach (Approach 2), this background radiation was assumed to be insignificant. The third approach (Approach 3), assumed there was a linear relationship between TB − TW of each iButton pair facing downwards over the LEs, with the TB − TW of the reference iButtons facing the sky. Approach 3 would be an easier method to employ for future tests, hence it was investigated as an alternative to the WPP methods. Albedos from all three approaches were compared with the literature values of albedo for similar materials. All temperatures were measured in °C, and SR and radiant exitance from the iButtons were given in W·m−2.
2.3.1. Uncertainty in iButton Pair Readings
Three types of iButtons were used throughout this study; three high-temperature Thermochrons (0–125 °C) with accuracy ±0.5 °C; one Hygrochron (measures temperature and relative humidity) with accuracy ±0.5 °C; and 30 low-temperature Thermochrons (−40–85 °C) with accuracy ±1 °C. The types of iButtons were arbitrarily assigned to be painted either black or white, and the pairs were randomly allocated to each LE. The uncertainty in TB − TW due to instrument error alone could therefore be up to ±2 °C. A test was conducted to discover the actual uncertainty. From 15:10 on the 19th to 04:40 on 20 January 2019, the iButtons were kept at the same ambient conditions and away from SR sources. The differences in measured temperature were calculated and compared.
2.3.2. View Factors
The view factor (VF) is an important parameter as the iButton temperature is caused by what is in its field of view (FOV). The VF is a dimensionless number representing the fraction of the iButtons FOV which contains the LE. This is a function of the both the height and FOV of the iButton, and of the size of the LE. The FOV of the iButton is estimated to be around 150°. Ideally, the iButton would receive radiation from the LE only, however, depending on the physical configuration, it can measure both the LE plus the background material on which the LE is placed.
The VF for the LEs were calculated using an online tool by Howell [45] (using the rectangle-to-rectangle in a parallel plane function). For ease of calculation, the iButton was assumed to be a square with side lengths of 7.5 mm. This square gave a similar area to that of the actual circular iButton face, which has a radius of 8.5 mm.
2.3.3. Albedo Found Using WPP as a Reference—Approach 1
When measuring LEs under real world conditions, it is difficult to control for varying weather conditions. Under these circumstances a reference material could be used which would be subject to the same ambient conditions as the tested LEs. In this study, the reference used was the WPP. The albedo of white paint could be expected to be higher than the albedo of any of the other LEs, thus making it an ideal reference material.
The albedo of each LE was determined by comparing temperatures logged by a pair of black- and white-painted iButtons facing directly downwards above a large sheet of white-painted polystyrene (WPP), with a similar pair of iButtons above each LE.
Let the ratio of the difference between the black and white iButtons over the LE, divided by the difference between the black and white iButtons over the WPP, be called the Delta iButton Ratio (DiR), and this is given in Equation (1):
where and are the temperatures of the black and white iButtons above the LE plus background, respectively; and and are the temperatures of the black and white iButtons above the WPP plus background, respectively. These are the actual logged temperatures for each iButton.
is the ratio of the reflected radiations based on the incident radiant energy to the iButtons being linearly proportional to TB − TW, [41]. This can also be written as a ratio of albedos (Equation (2)):
where and are the albedos of the LE plus background and the WPP plus background, respectively.
The total reflected radiation is comprised of the amount reflected by both the LE and the background, depending on the relevant VFs. Hence can be written in terms of the VFs as in Equation (3):
where and are the albedos of the LE and the background around the LE, respectively; and and are the view factors of the LE and the background around the LE, respectively.
Similarly, can be written as Equation (4):
where and are the albedos of the WPP and the background around the WPP, respectively; and and are the view factors of the WPP and the background around the WPP, respectively.
For a background which extends for a reasonable distance away from the LE, VF terms for the background can also be approximated as Equation (5):
and, similarly, for WPP as Equation (6):
Substituting Equations (3), (4), (5) and (6) into Equation (2), and solving for gives Equation (7):
Equation (7) can be used to find the albedo of a LE if the albedos of the WPP and the backgrounds surrounding both the WPP and the LE are known. In this study the backgrounds for both the LE and the WPP were the same turf grass, and the literature value of 0.26 [46] was used. It is worth noting that if the albedo of the background is unknown, it may be measured using iButtons and the equation from the following section (Approach 2). The albedo used for WPP was 0.75, which was that of the white-coated smooth polyurethane foam given by Reagan and Acklam (1979) as cited in [39], and similar to the 0.77 for white paint given by [47]. When using Approaches 1 and 2, the value of the albedo chosen for WPP will determine the values for all the other albedos. Hence, although their relative albedos will remain the same, the absolute albedos for each LE may differ depending on the value of that is chosen.
2.3.4. Assumption of Negligible Background Radiation—Approach 2
If the LEs are relatively large compared with the height of the iButtons, then the radiation from the background material would be minimal, and it may be possible to neglect it in the calculations. This is done by assuming both and are large and close to a value of 1. is then approximately equal to , and hence is approximately equal to and approximately equal to zero. Equation (7) then becomes Equation (8):
Equation (8) can then be used to provide a close approximation of given the literature value of and the measured iButton temperatures over the LE and the WPP.
2.3.5. Albedo Found Using Direct Incident Solar Radiation as a Reference—Approach 3
A simpler way to determine albedo would be to directly compare the TB − TW for reference iButtons facing directly upwards (receiving full SR), with TB − TW for pairs of black- and white-painted iButtons facing directly downwards over each LE (receiving the reflected SR). By converting the temperature difference of these pairs into a radiation (in W·m−2), the albedo is calculated from the ratio of these two radiations. This is the same approach used for determining albedo using back-to-back pyranometers.
The time period over which albedo measurements can reliably be taken using Approach 3 was based on the field measurement standard ASTM-E1918_16 [30]. This specifies that albedo should be measured when the angle of the Sun is less than 45° from the normal, or when solar radiation is at least 70% of that occurring at solar midday. On 20 and 21 January 2019, the altitude of the Sun was greater than 45° between 09:13 and 15:40. The time over which albedo measurements were averaged was chosen to be between 09:10 and 15:40.
Before a comparison between the temperatures of the reference and the LE iButton pairs could be made, the temperature data needed to be converted into a radiation flux or radiant exitance. This is because the calibration of reference iButtons undertaken by [41] found there was a non-zero intercept in the linear regression. The SR from the weather station from 09:10 to 15:40 on 21 January 2019 was used to calibrate the reference iButtons using a linear regression, giving two coefficients equivalent to the slope and intercept of the data. The radiant exitance for each measured TB − TW, for the reference iButtons, was then calculated.
This same calibration equation, however, could not be used for the downwards facing iButtons, as heat loss due to convection from upwards and downwards facing surfaces are different [48]. Unlike the reference iButtons, the downwards iButton surfaces were also unprotected from the elements. A new calibration curve was found by forcing the average measured WPP albedo to be equal to 0.75, for data from 21 January. This was done by using the calculated reference iButtons radiation as the incident radiation, and then solving for new coefficients for a linear regression of the WPP TB − TW data. The Microsoft Excel linear regression tool, Solver, was used to determine these coefficients.
The albedo was the ratio of these two radiations and was calculated for each LE. The standard deviation (SD) of the data for each LE was found.
A commercial albedometer was not available to compare with this new instrument, hence resultant albedos were compared with the literature values only.
3. Results and Discussion
3.1. Weather Data for the Test Period
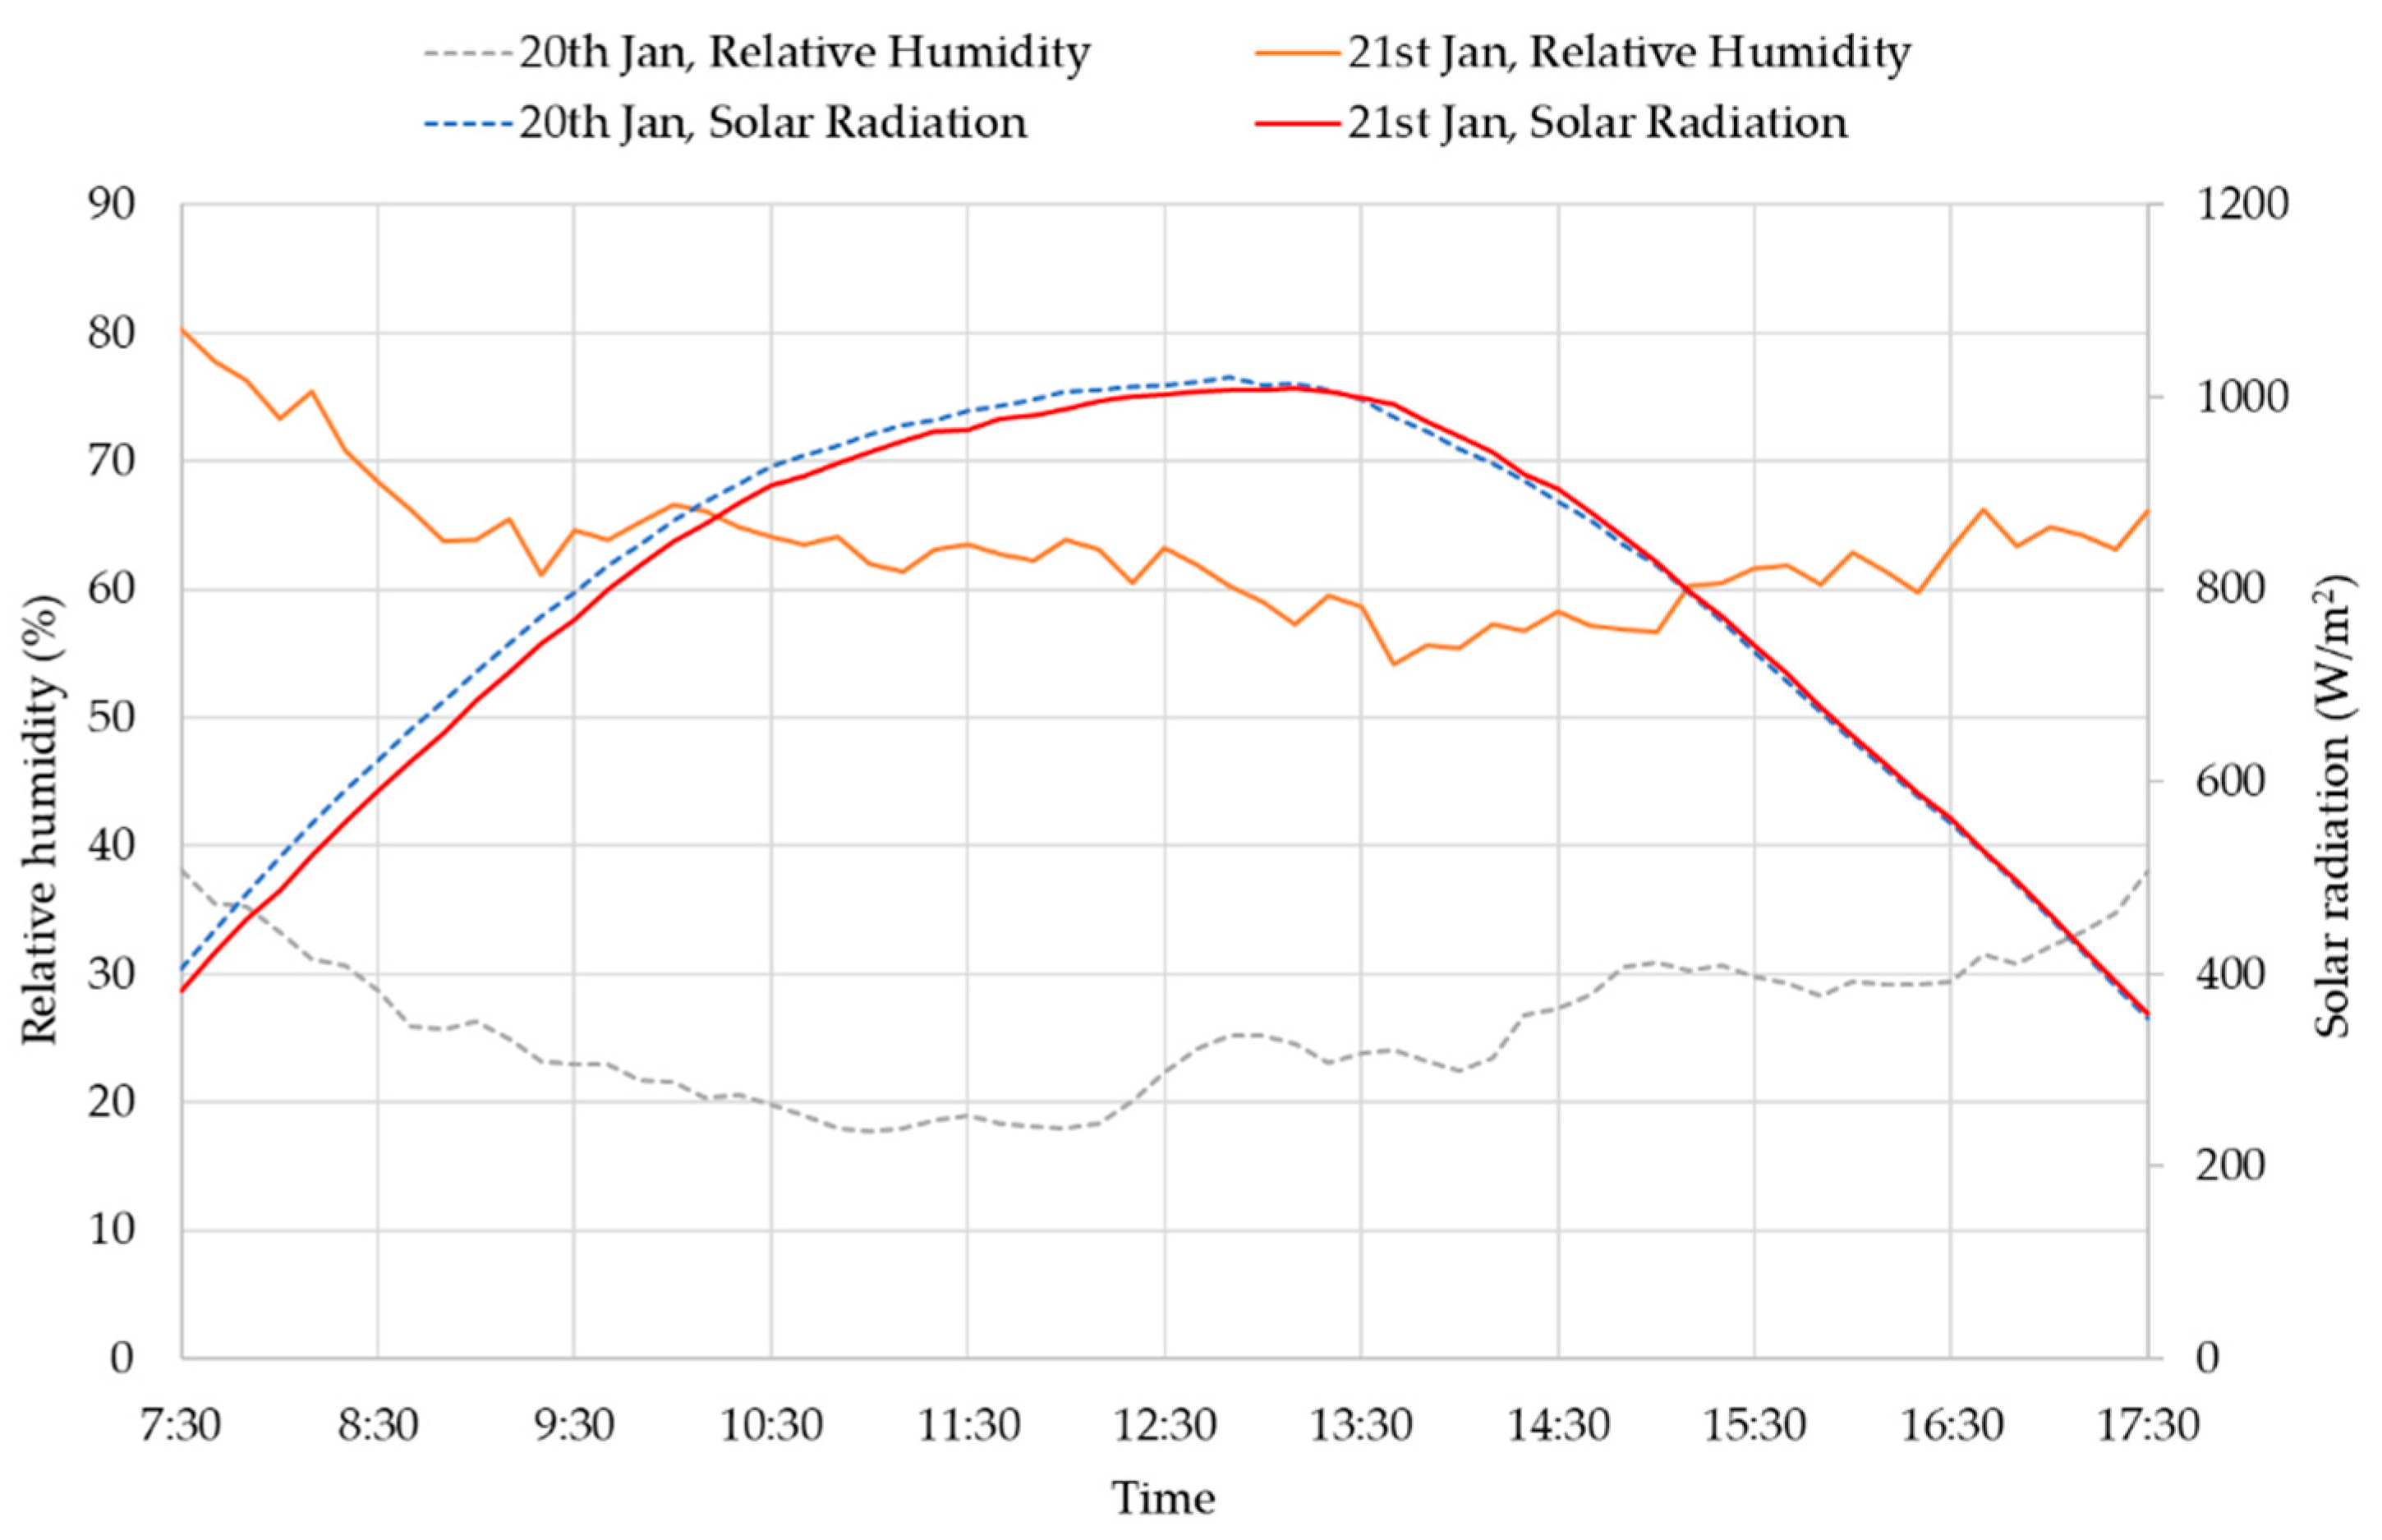
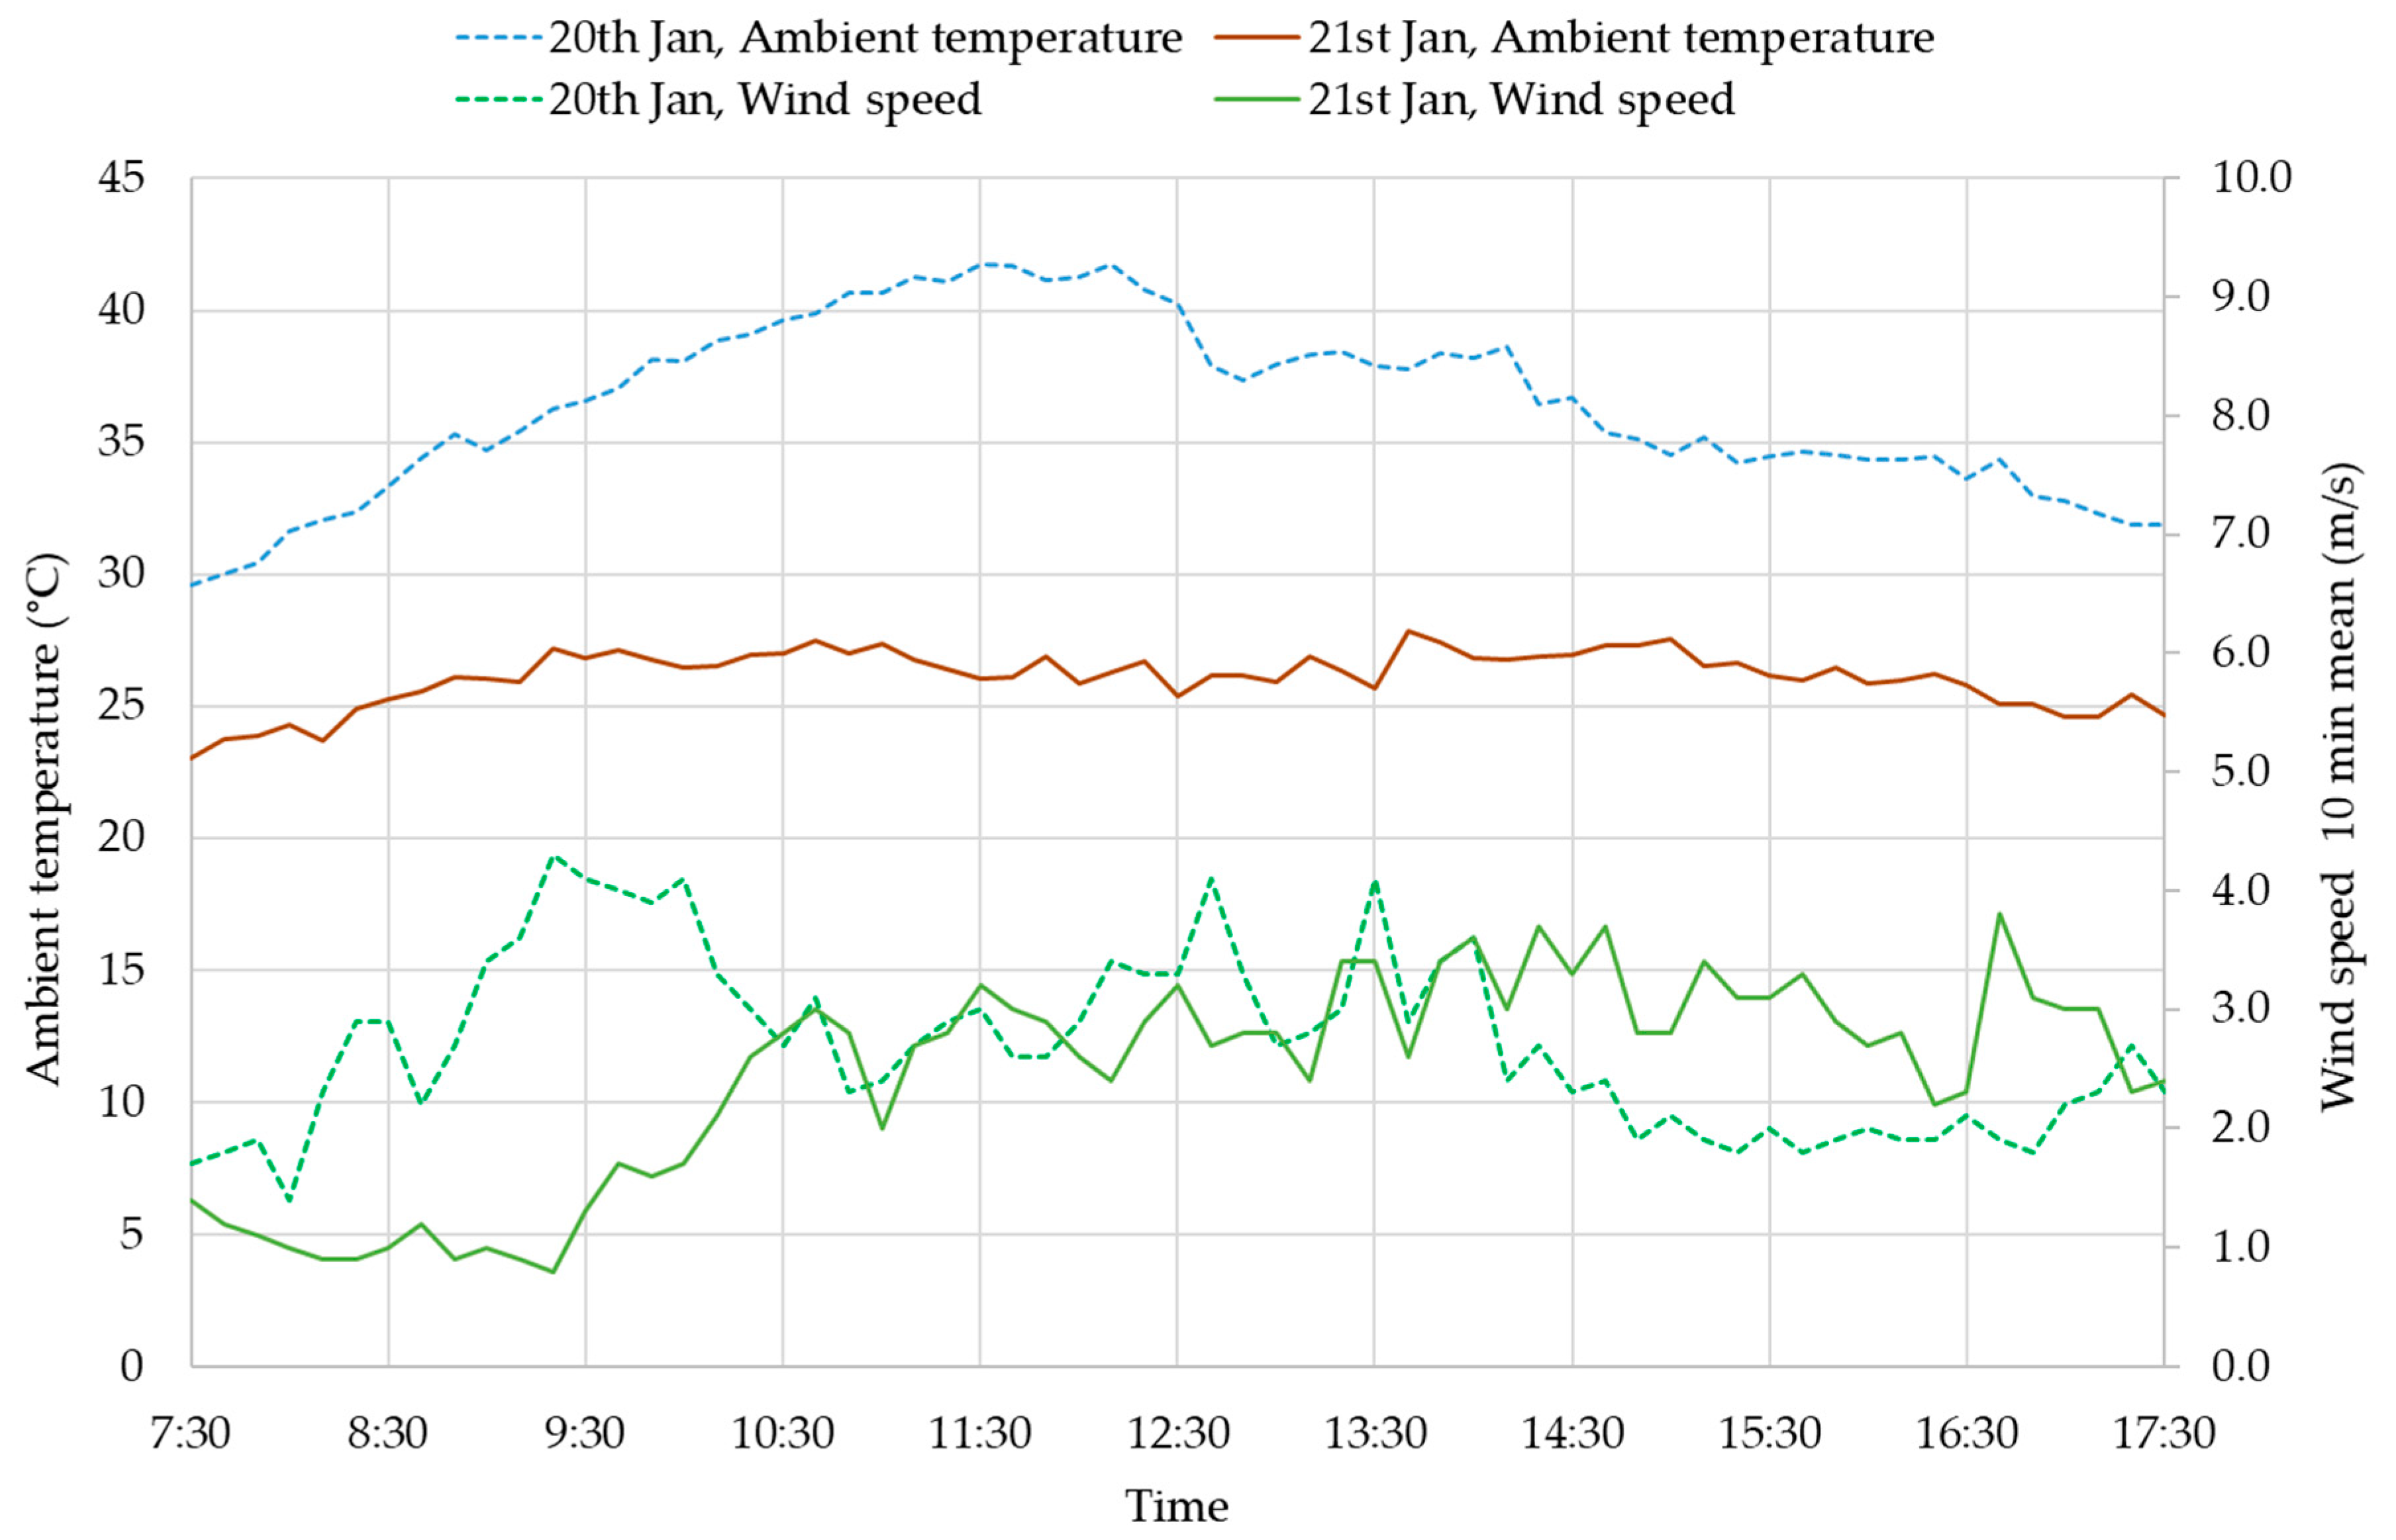
The wind speed, ambient temperature, relative humidity and solar radiation during the measurement period over the two days are shown in Figure 5 and Figure 6. Wind speed and solar radiation were similar on both days, with wind speed being minimal and SR being typical for that time of year in Perth. Sunrise was at 05:30 and sunset at 19:25. The ambient temperature and relative humidity varied significantly between days. The maximum temperatures were 41.7 °C and 27.8 °C, and relative humidity 38% and 80% on 20 and 21 January, respectively, whilst the minimum temperatures were 29.6 °C and 23.1 °C, and relative humidity 18% and 54% on 20 and 21 January, respectively. This variation provided a good opportunity to test the consistency of the iButtons’ ability to measure albedo under different conditions.
3.2. iButton Pair Uncertainty
The average measured uncertainty in TB − TW for each iButton pair is shown in Figure 7. Error bars are the SD of the data. Variations were slightly less than expected, based on the manufacturer’s error data. These uncertainties were used to correct the paired data before the albedo calculations.
3.3. View Factor Results
The VF of each LE was found to be 0.92. The VF of the LE plus the surrounding grass (1 m around all sides of the LE) was 0.99. The 1% of radiation from sources beyond the grass was assumed to be negligible. Thus, when calculating the amount of radiation received by the iButton from the LE only, 8% of the iButtons readings were attributable to grass, leaving the remaining 92% being attributable to the LE only.
3.4. Albedo with WPP Reference and Using VFs—Approach 1
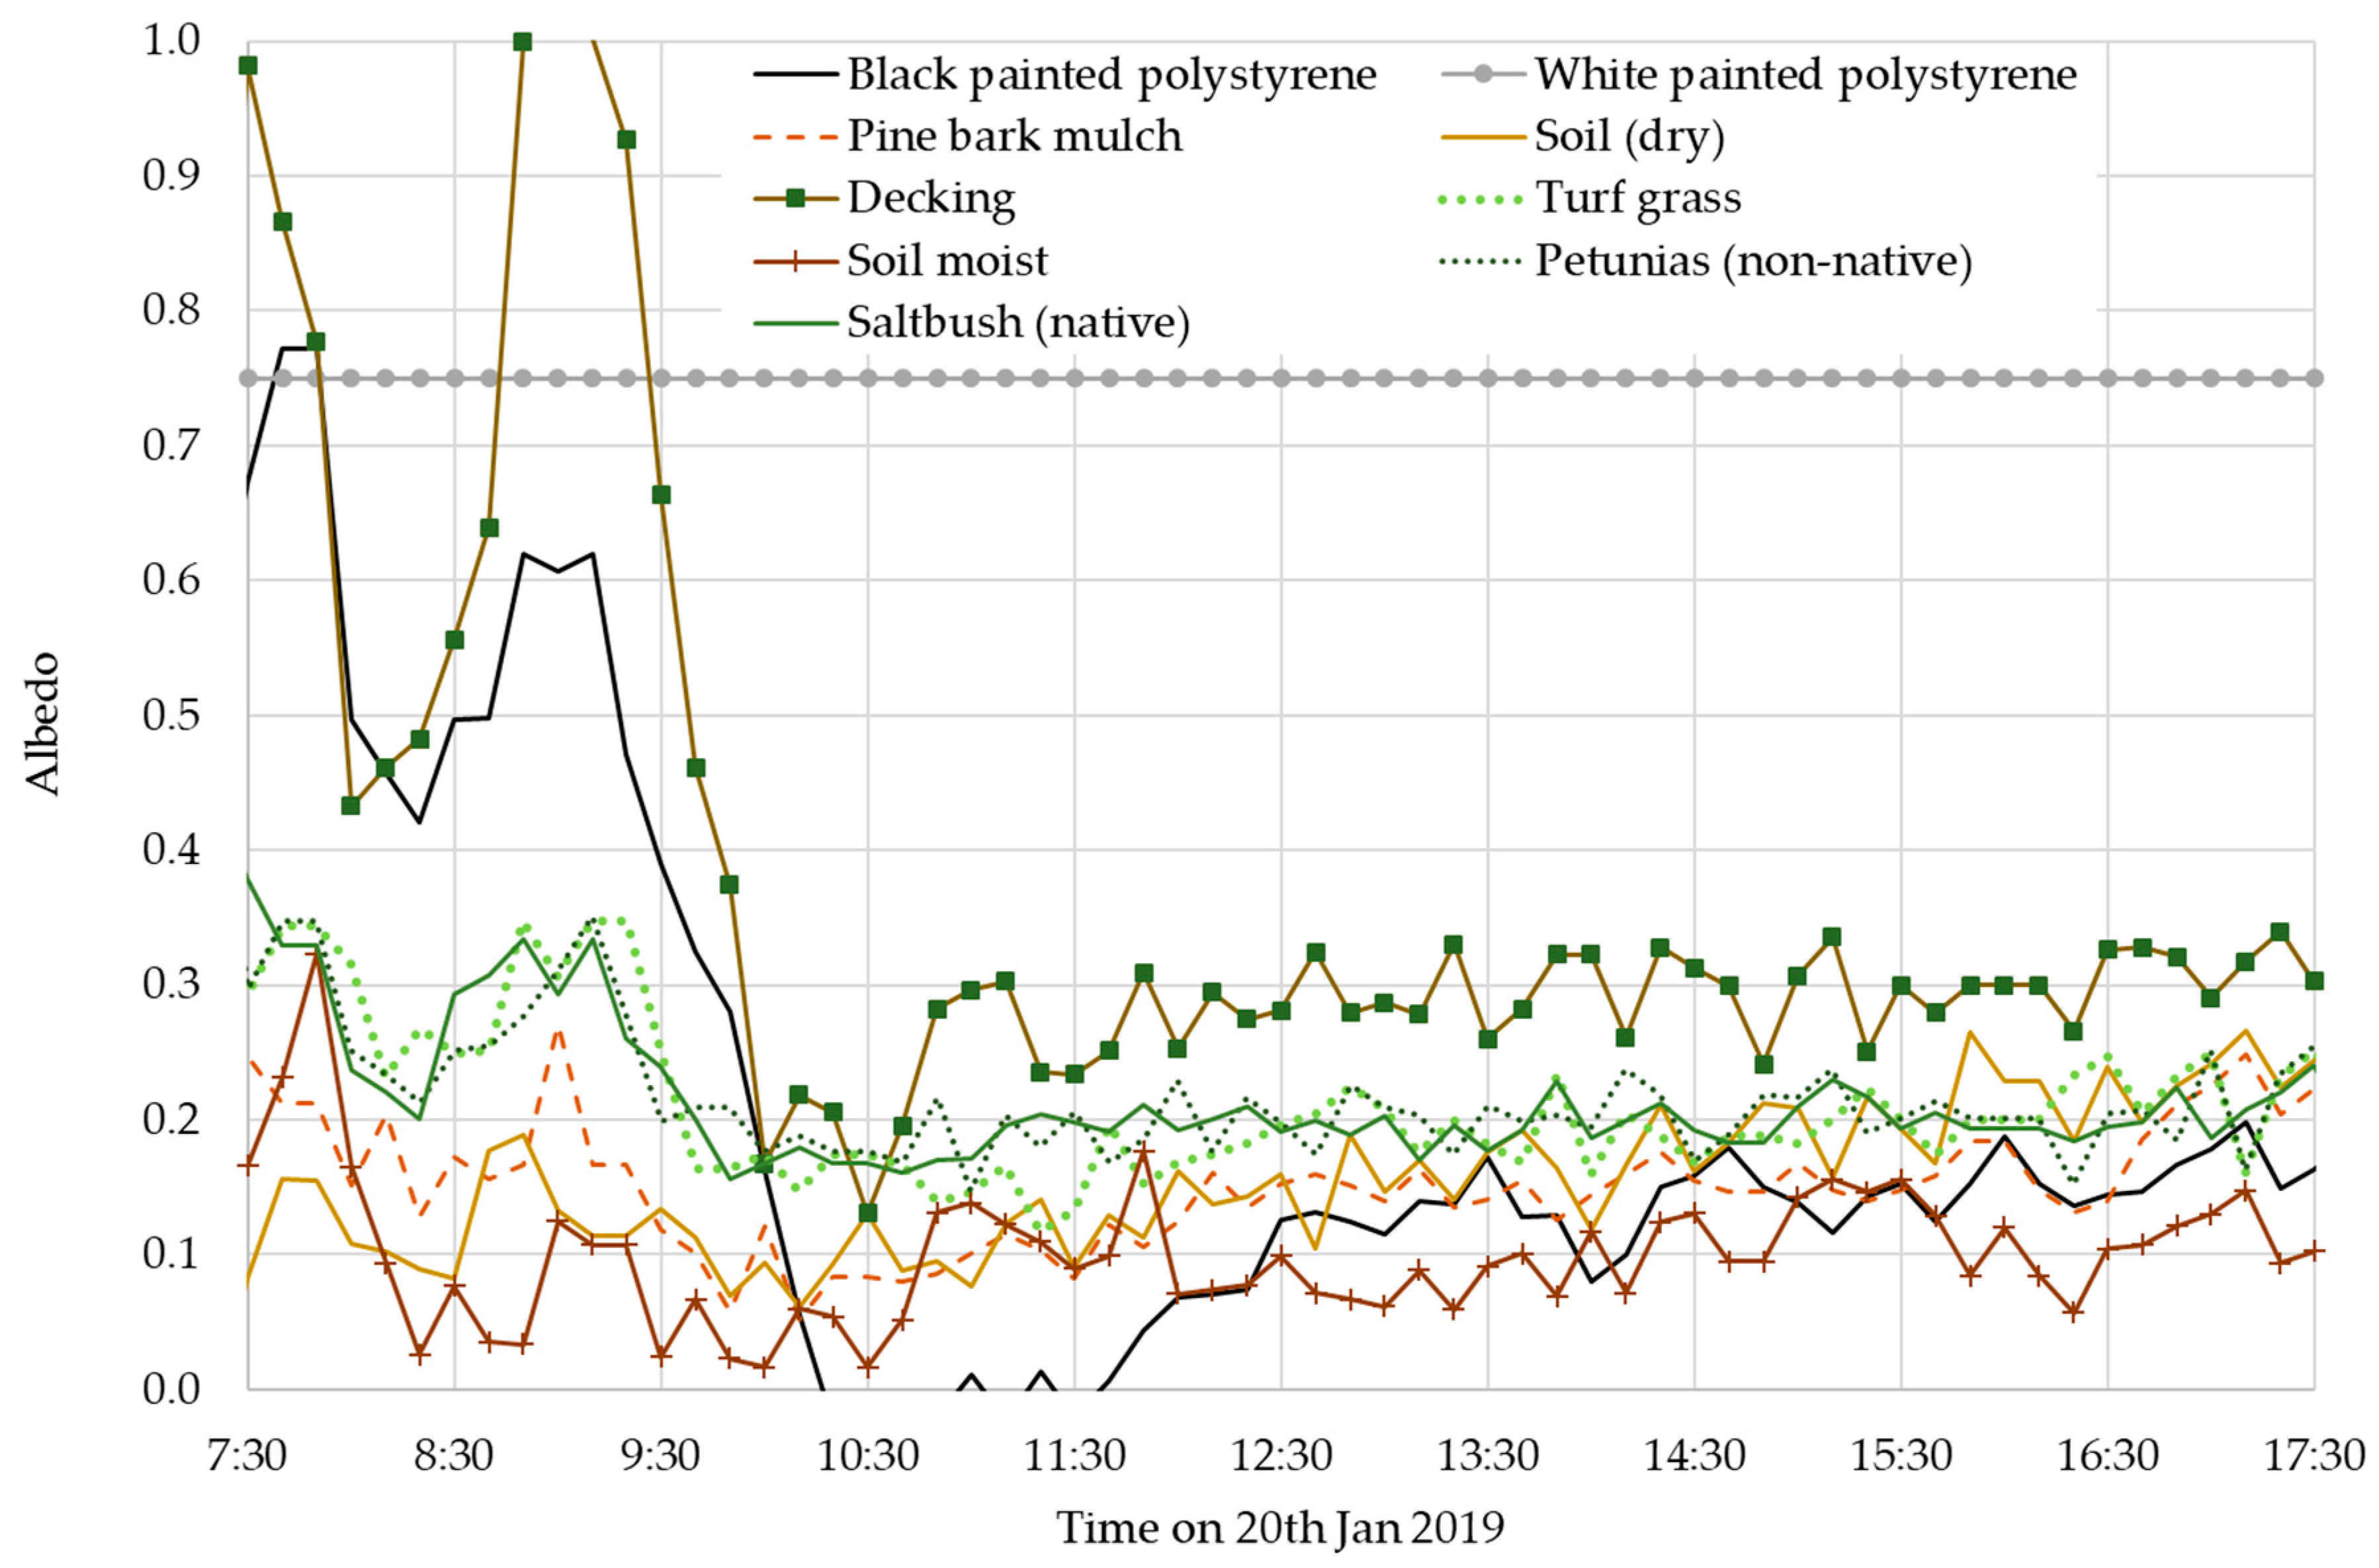
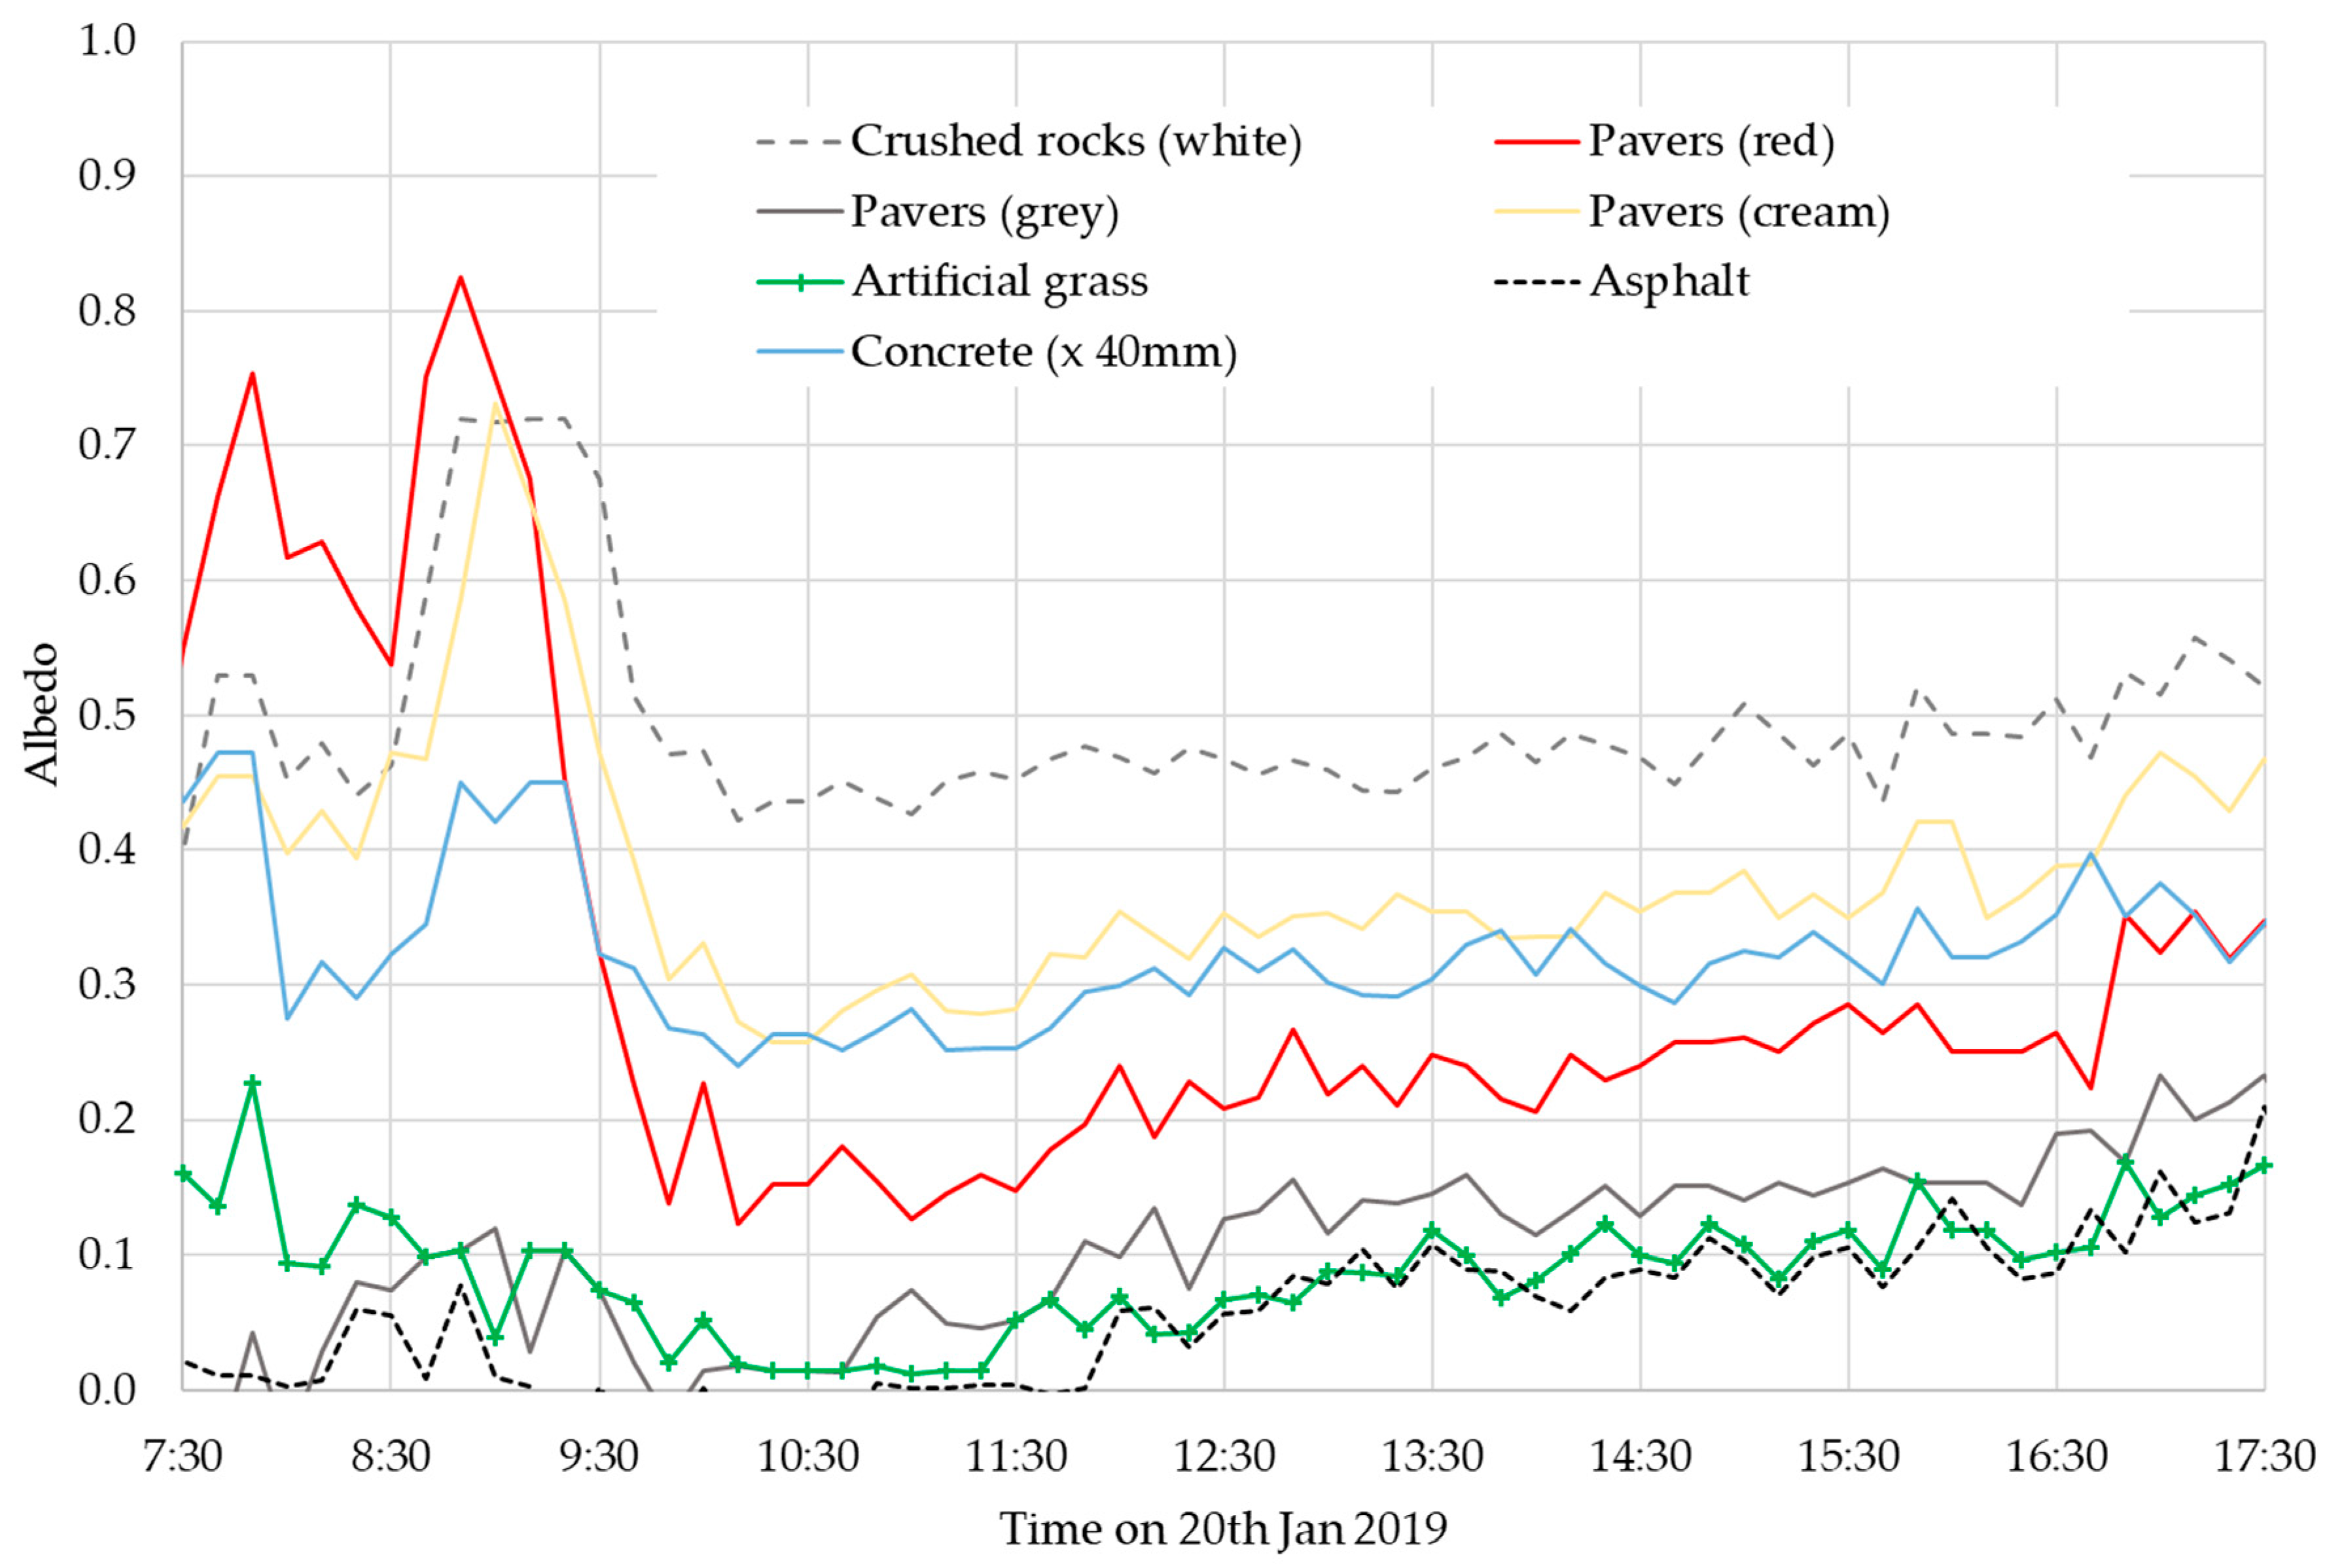
On the morning of 20 January, the irrigation system for the oval came on at around 04:30 for an hour, which thoroughly wet all of the LEs. However, this gave the opportunity to investigate how albedo was affected by moisture. Data from 07:30 to 17:30 on 20 January were analysed, and the effect of moisture on the measurements was observed up until around 13:30 as seen in Figure 8 for the soft LEs, and in Figure 9 for the hard LEs. Hence to determine the albedo of the dry LEs, this day’s data was truncated for analysis from 13:30 to 17:30. A wet surface can be very reflective depending on the angle of the incident radiation and on the viewing angle. The reflective ability of a surface, such as wood for example, can also vary depending on the quantity of moisture. When very wet, planed wood can be shiny. As it dries, the absorbed moisture in the wood causes it to become a darker and duller colour, until finally when dry, it returns to its original colour and reflectiveness. This process is seen clearly in the variation of the decking albedo shown in Figure 8. Therefore, when measuring albedo, researchers must be aware that moisture may drastically affect the data.
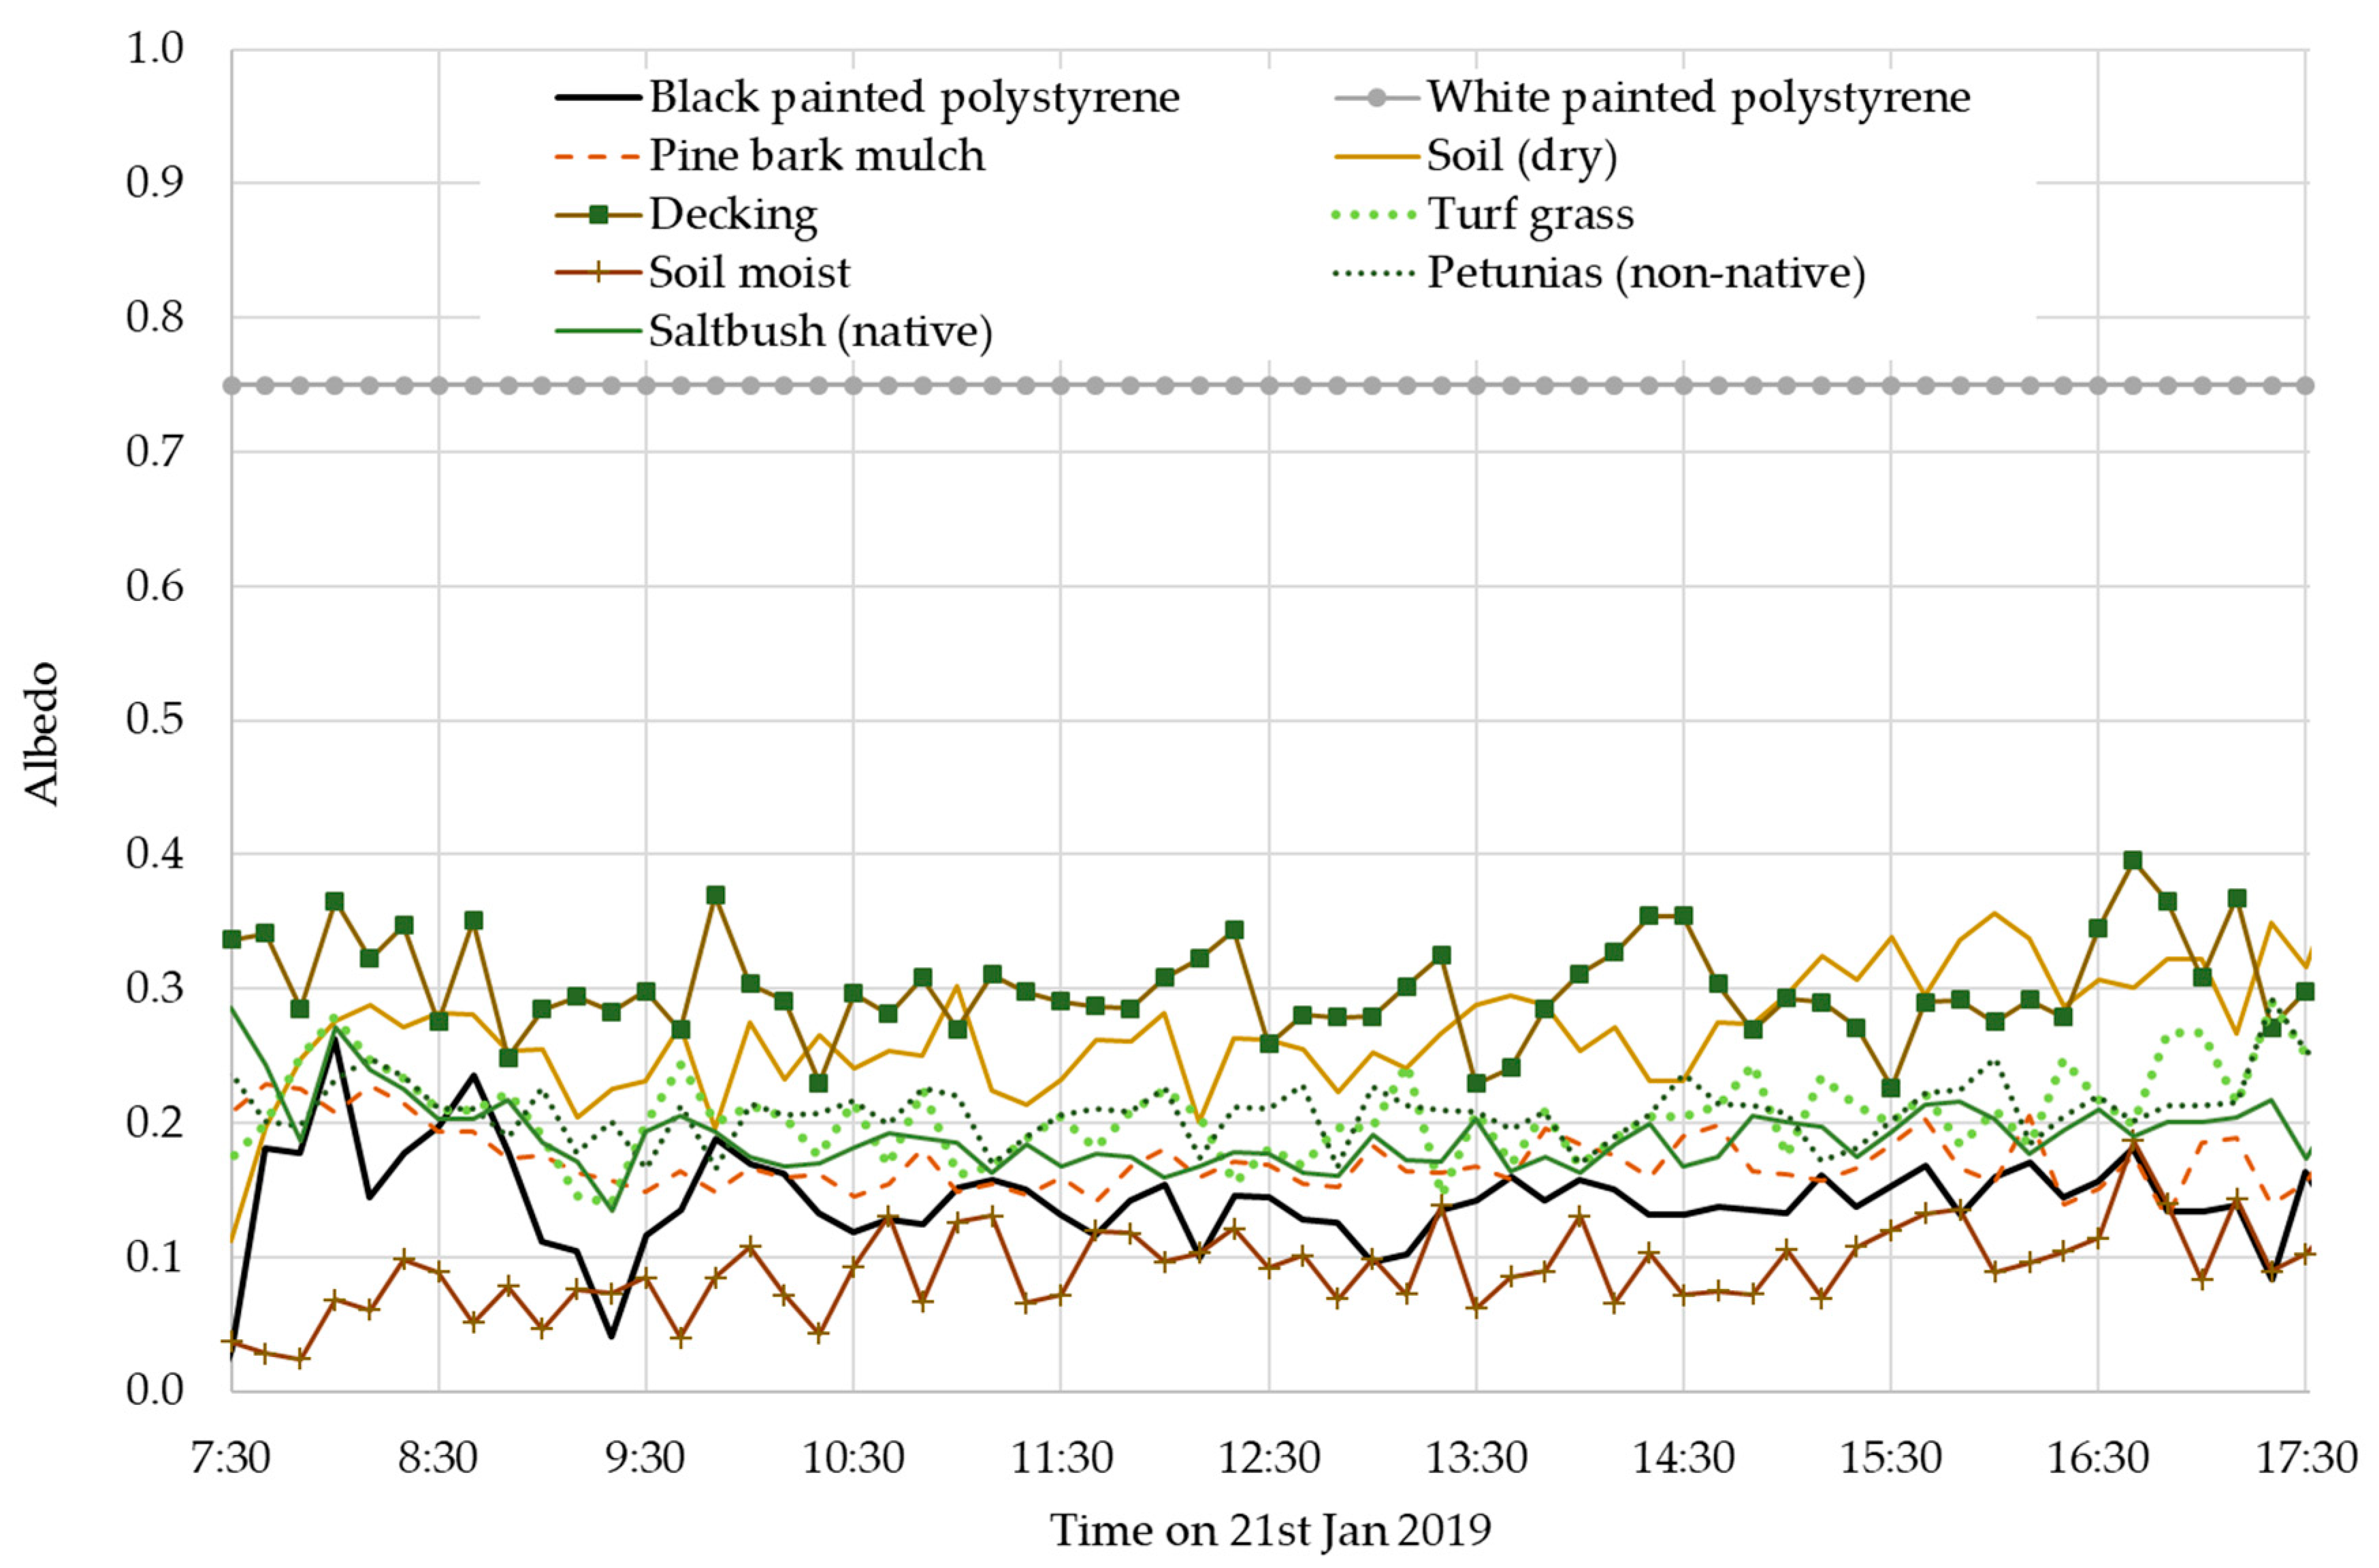
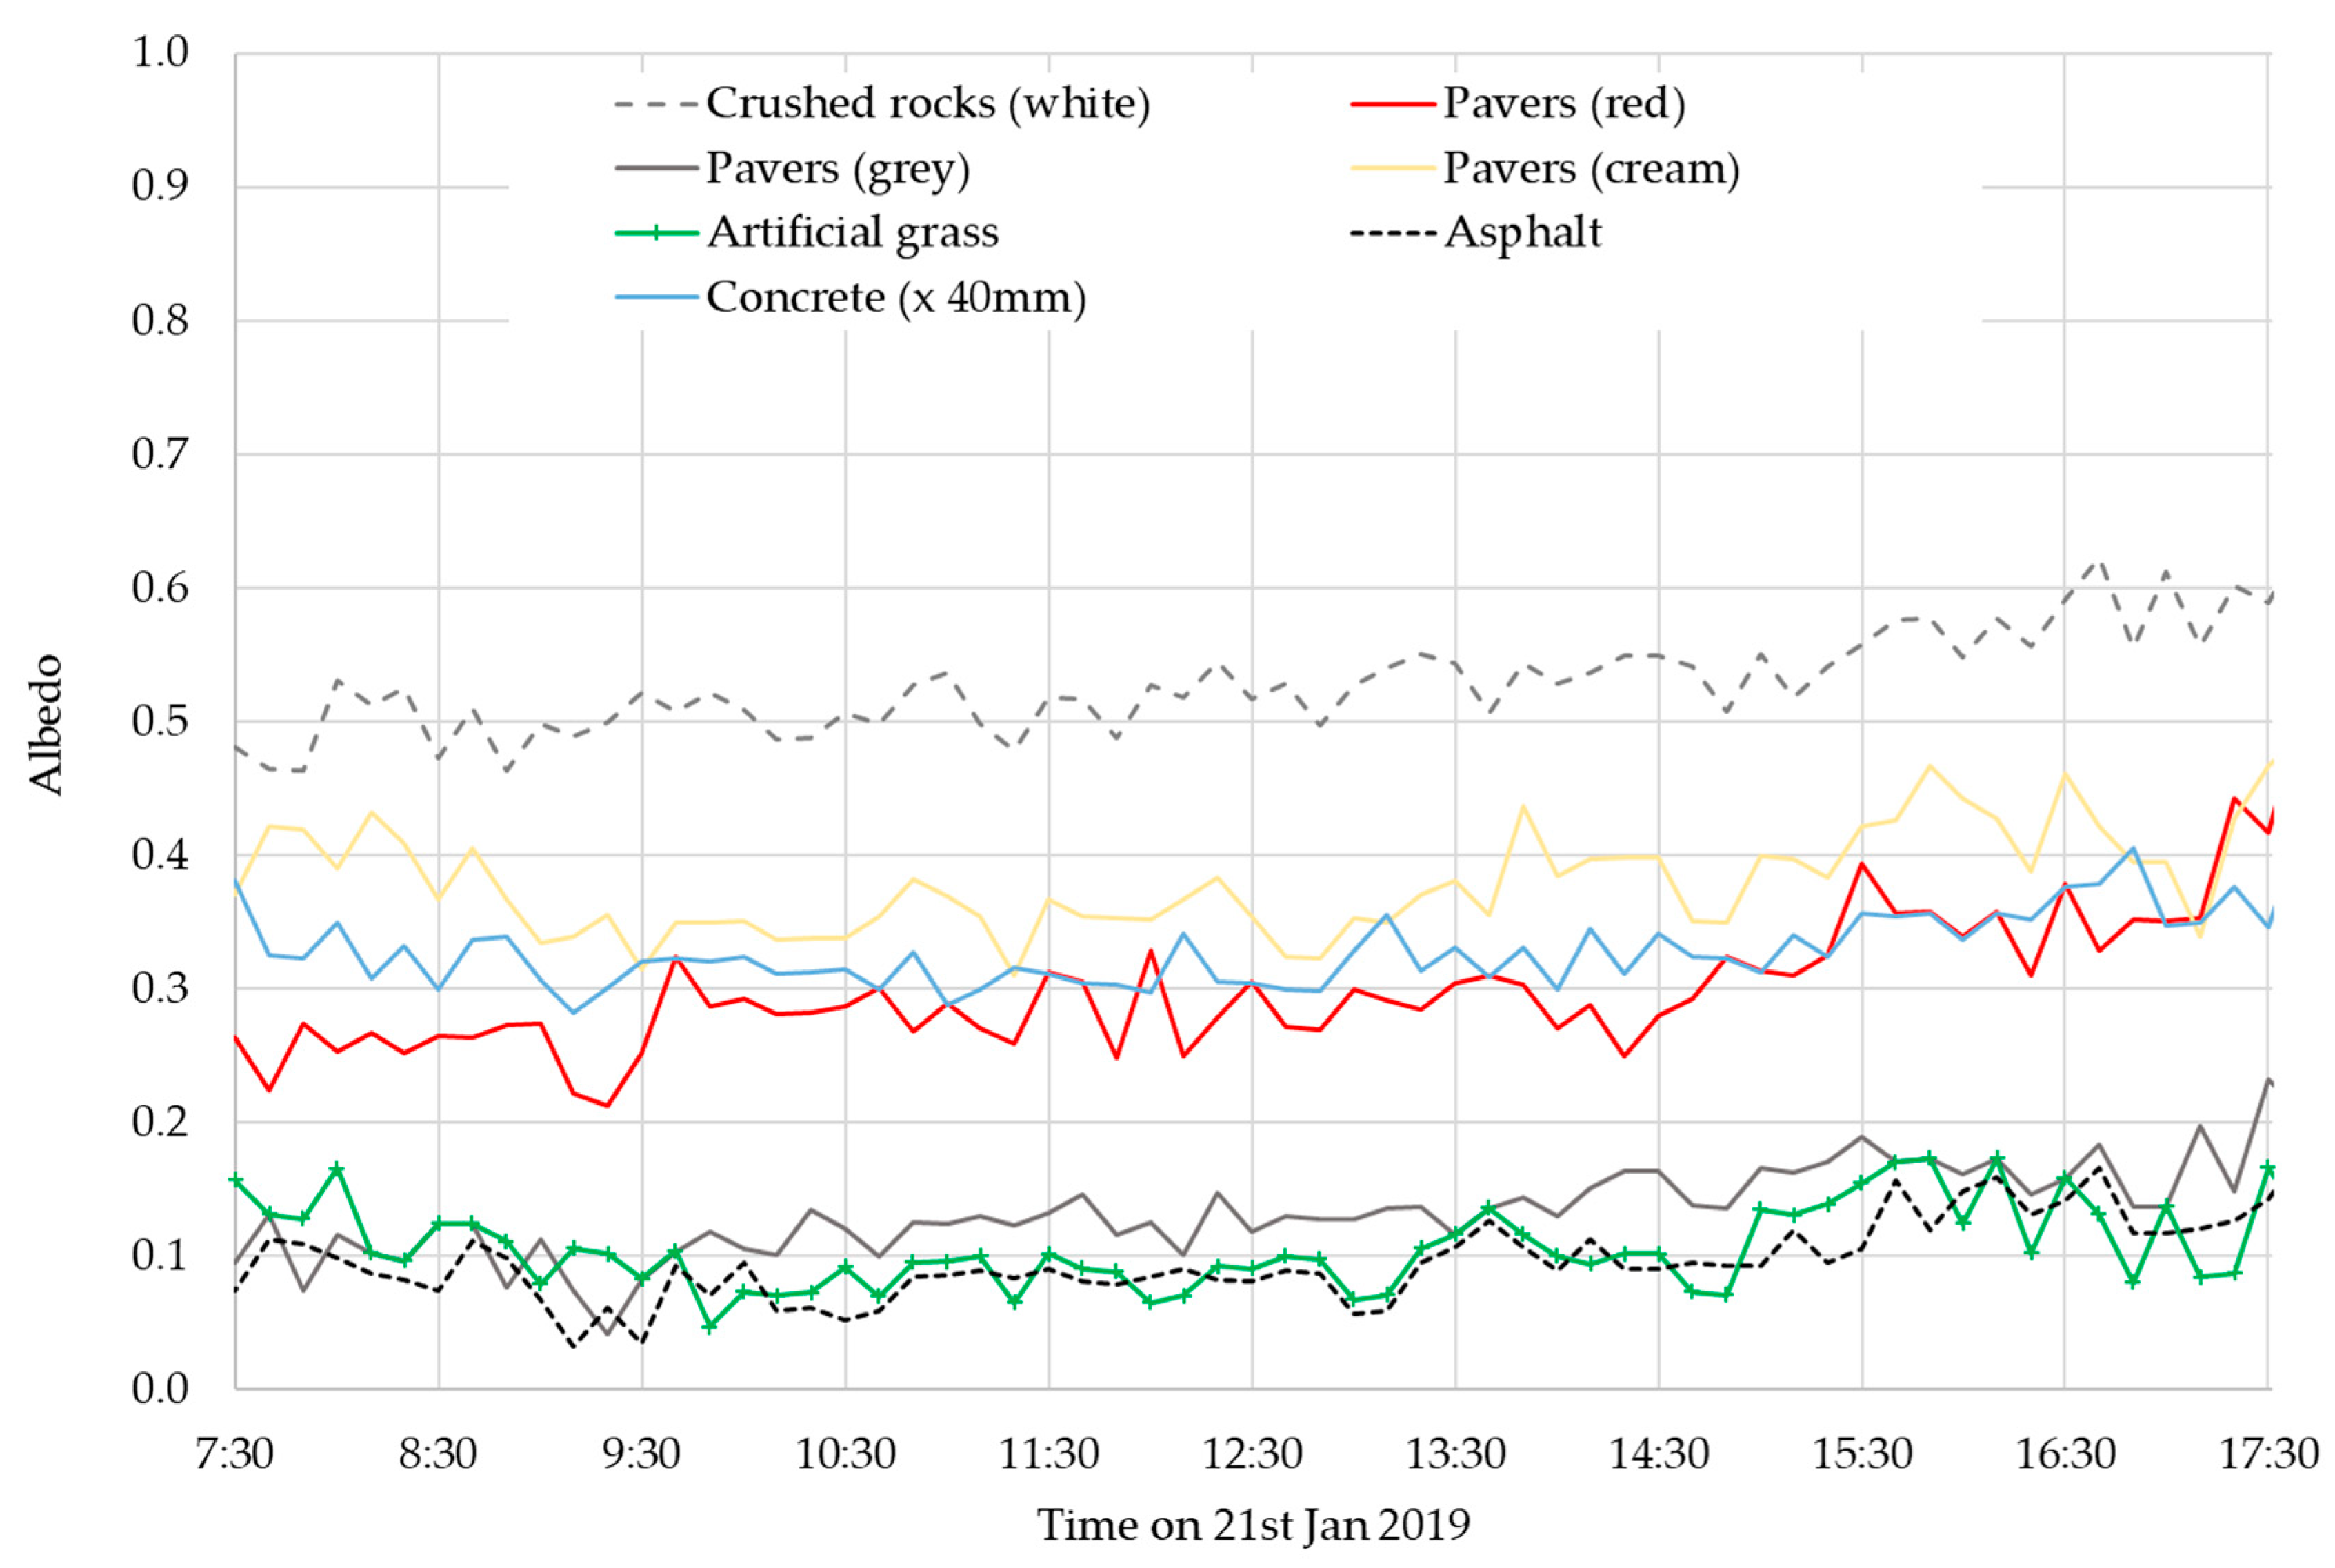
The iButtons above the LE and WPP are subject to the same fluctuations in weather. The individual TB − TW values varied noticeably as weather conditions changed, but the ratio of these differences is reasonably consistent, effectively cancelling out the effect of weather. This is beneficial for two situations: Firstly, for measuring across days, where ambient conditions may differ, such as in this study where the ambient temperatures were quite different from 20 to 21 January; and secondly, to counteract the changes in weather conditions across the day. Hence, where previous researchers found the albedo to be higher in the morning and the afternoon, but lower and more consistent during the middle of the day, Approach 1 showed albedo varied only slightly throughout the day as seen in Figure 10 for soft (natural) LEs, and Figure 11 for hardscape LEs. This approach thus allows albedo to be measured with reasonable precision, at almost any time of the day.
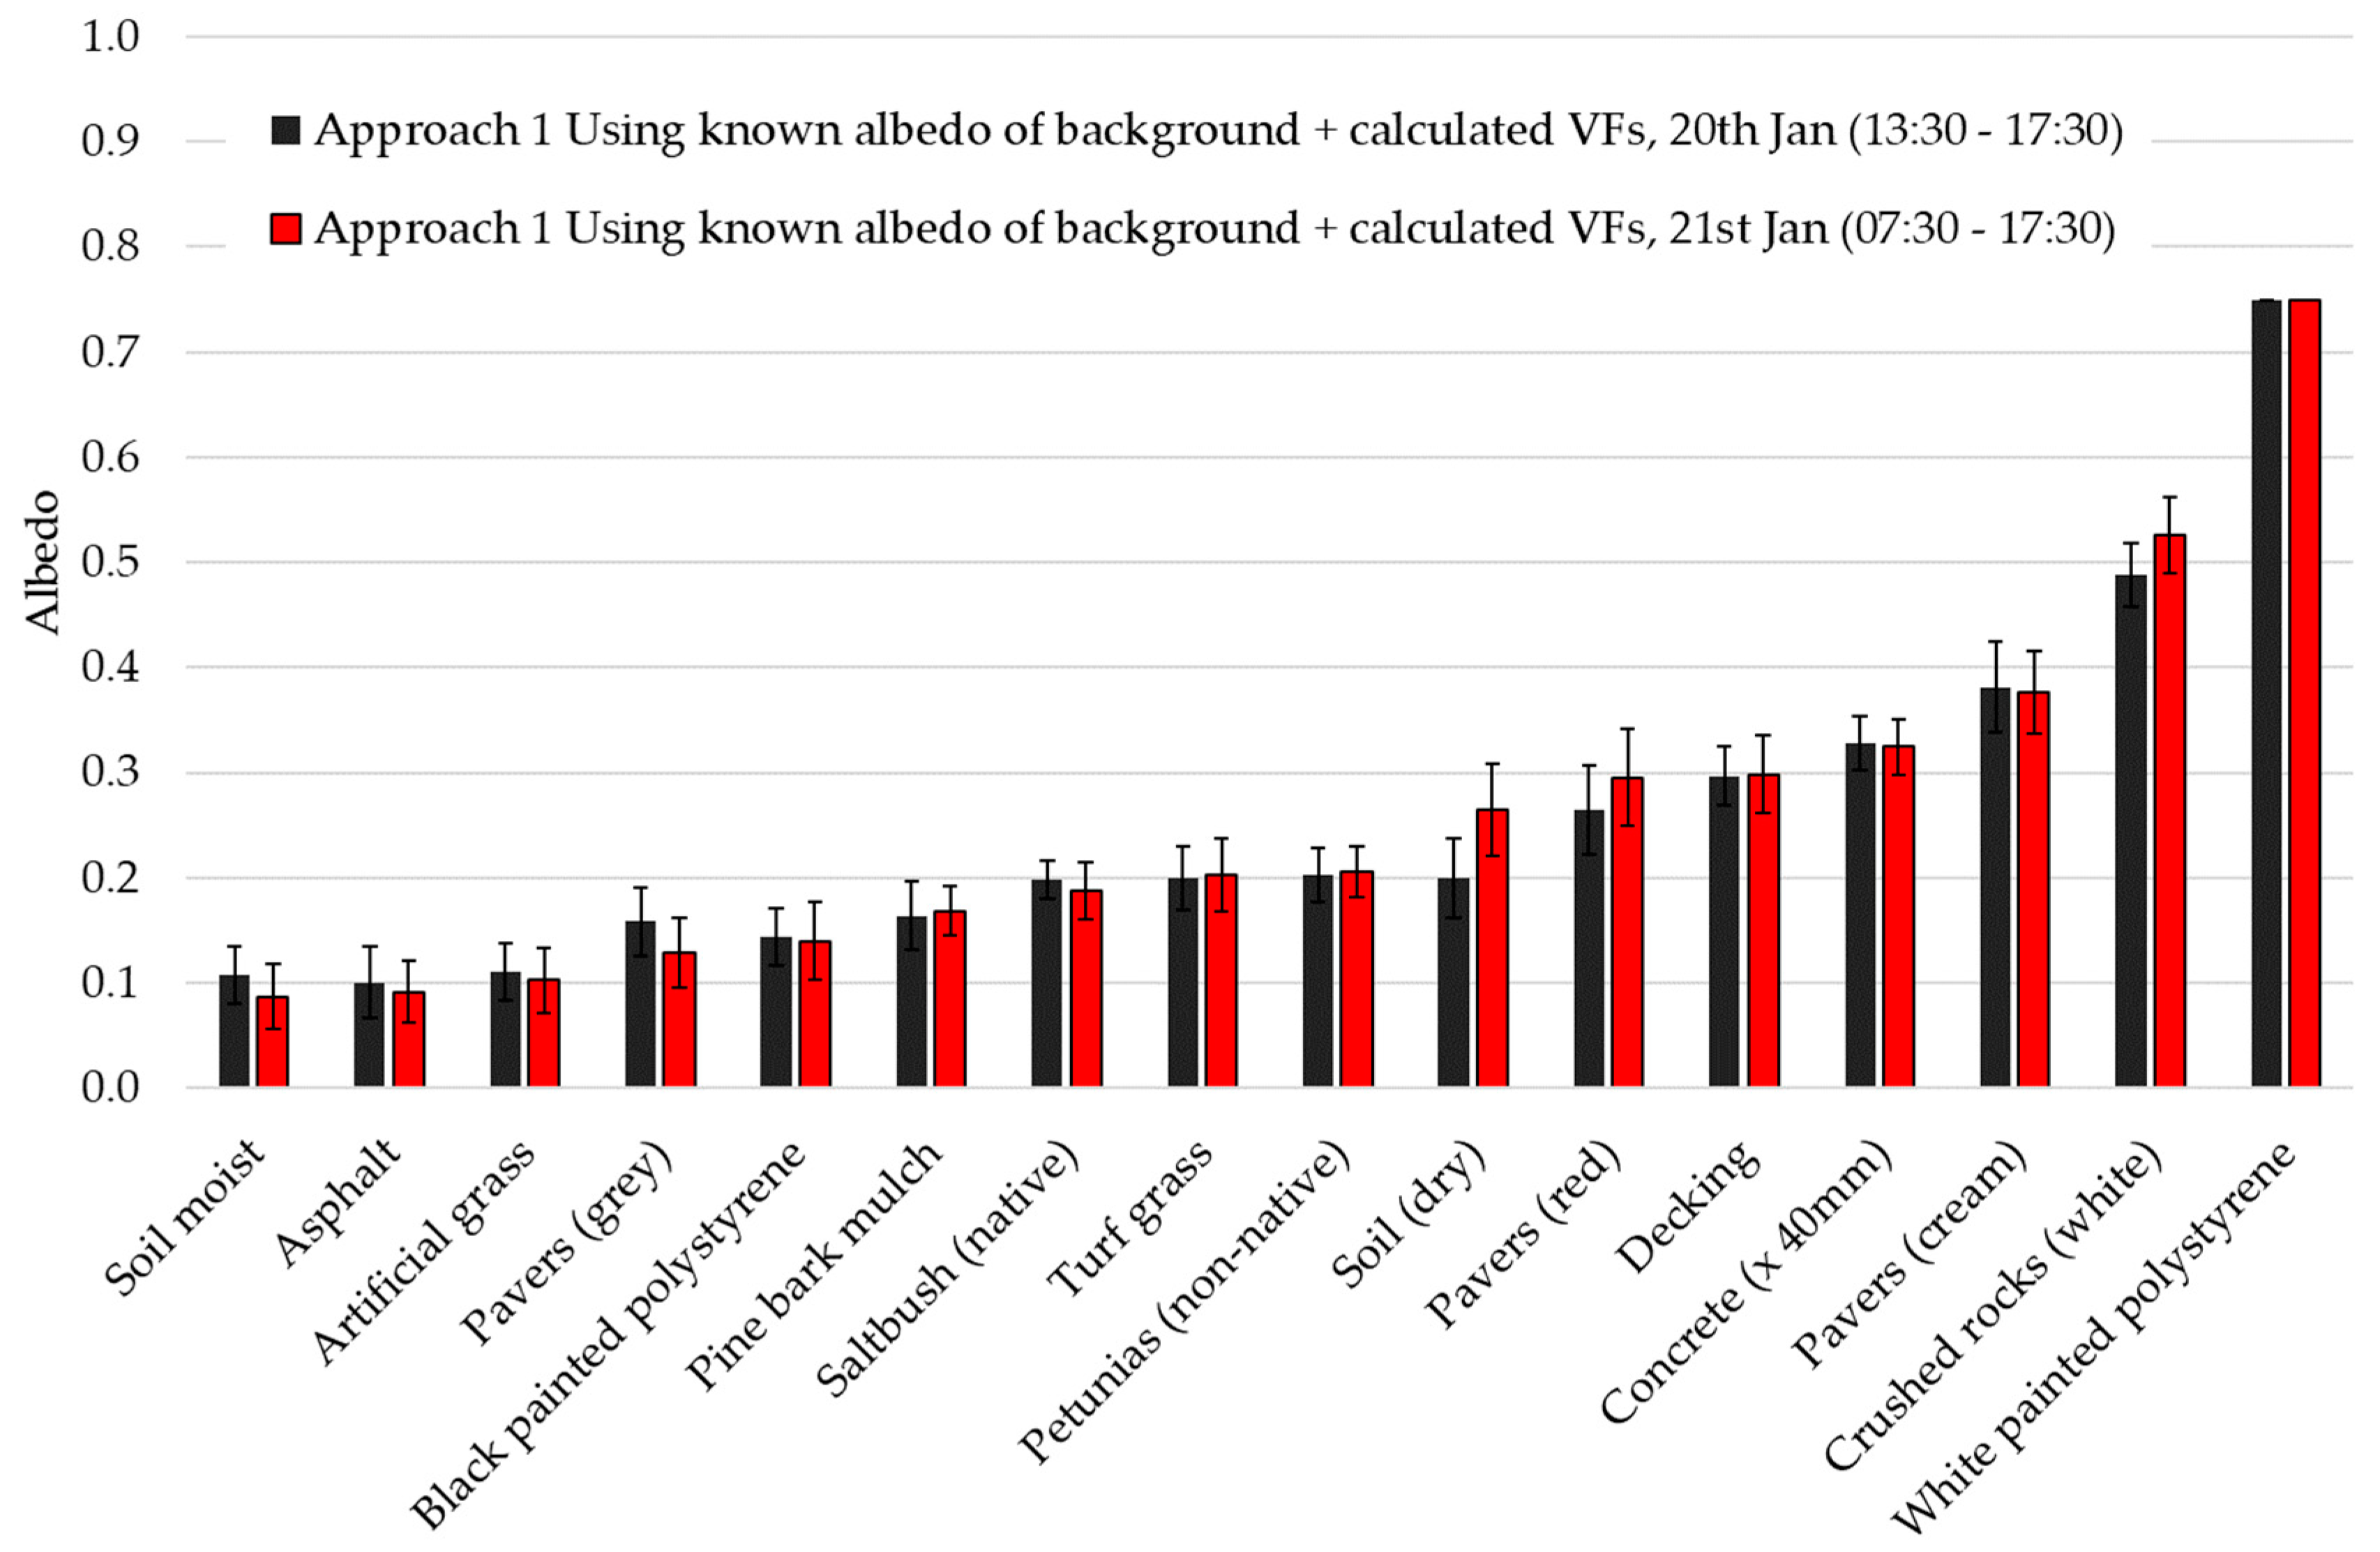
Figure 12 compares the average albedos calculated for the afternoon of 20 January, and for the whole day of 21 January. The error bars are the SD of the data for each LE. Within the uncertainties, the albedos are the same for each LE. Hence, the large change in both temperature and humidity between days appears to have had no effect on the measured albedos. These results are similar to [23] who found no effect on albedo due to changes in air temperature or wind speed.
3.5. Albedo with WPP Reference But Negligible Background—Approach 2
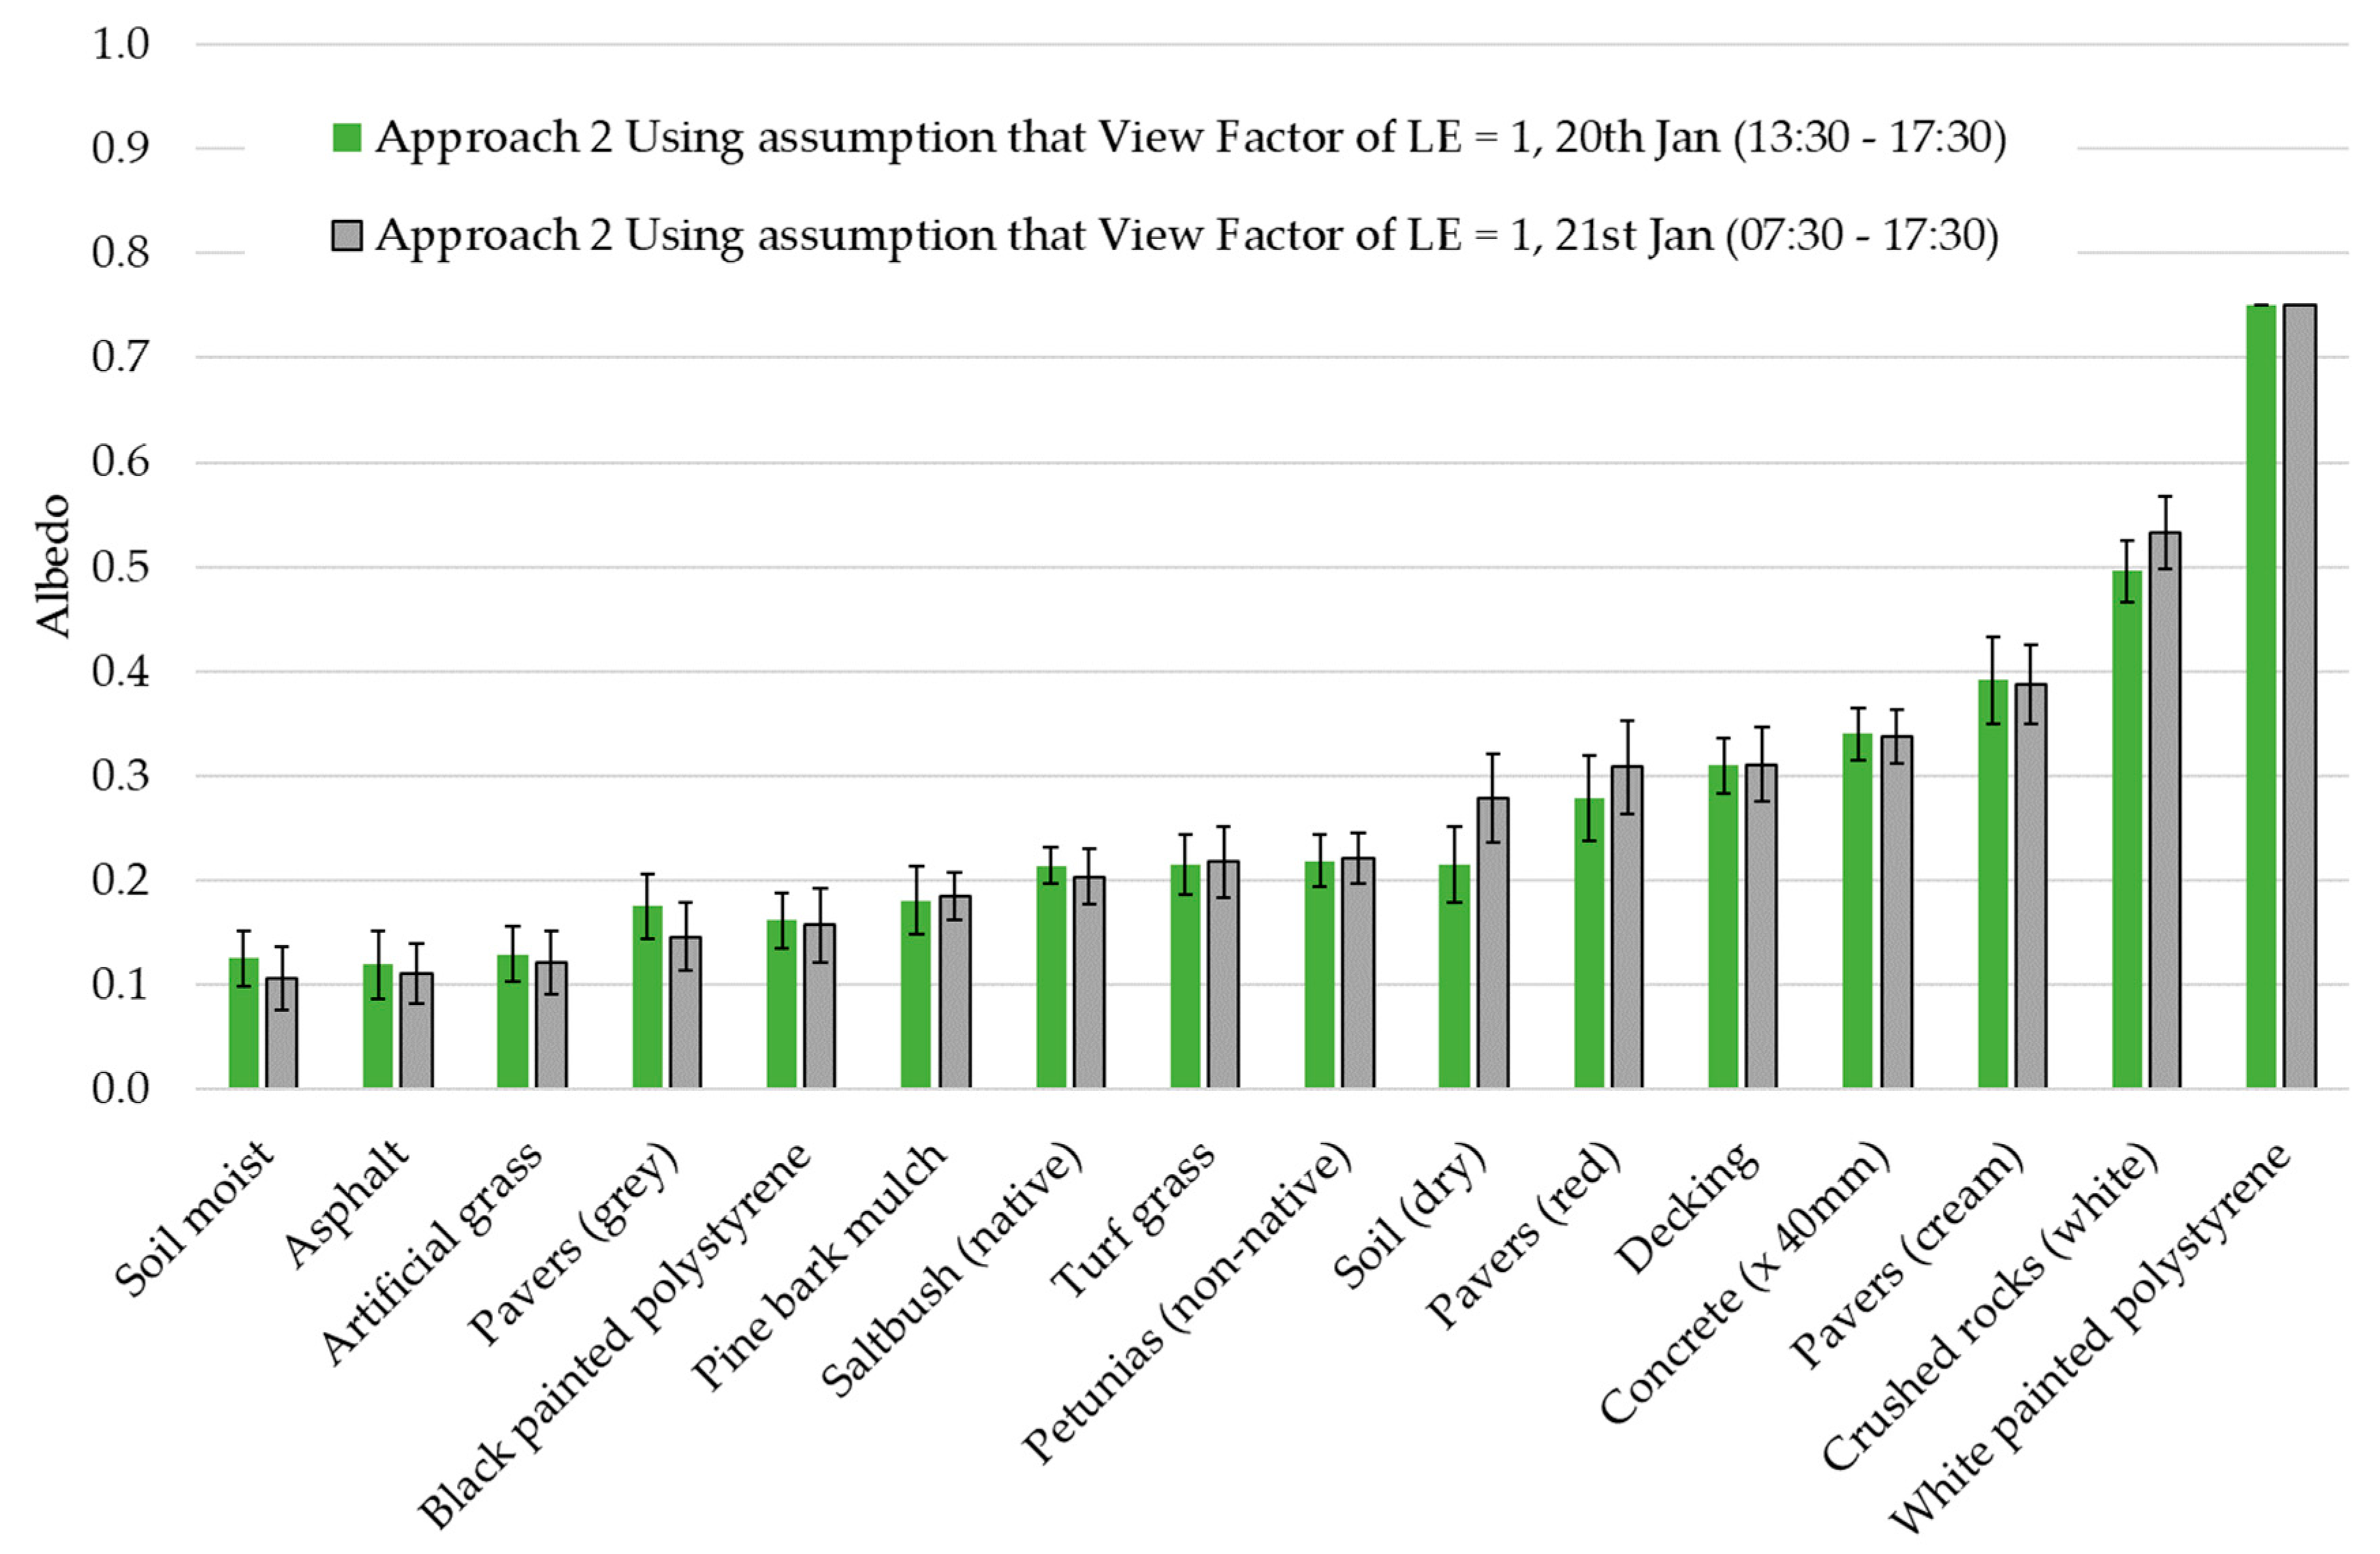
If the LE is relatively large when compared with the height of the iButton, such that the VF is quite large, then it may be acceptable to ignore the effect of the radiation from the background material. A VF of 0.95 has been suggested by [26] as being effective for albedo measurements. Equation (8) was used to investigate whether the VF of 0.92 in this study, was large enough for the background of turf grass to be considered negligible. Results comparing the two days are shown in Figure 13. Similar to Approach 1, Approach 2 shows no significant difference between days.
3.6. Albedo Using Incident SR Reference—Approach 3
The reference iButton data were calibrated against the Murdoch weather station SR to give the relationship shown in Equation (9):
Equation (9) was then used to find the equivalent radiation or radiant exitance from the sky facing reference iButtons for each measurement time. The radiant exitance for each of the downwards facing iButton pairs over the LEs was found using Equation (10), where the coefficients of the linear regression were derived by forcing the average albedo of WPP to be 0.75:
where Rad is the radiant exitance from the iButtons in W·m−2.
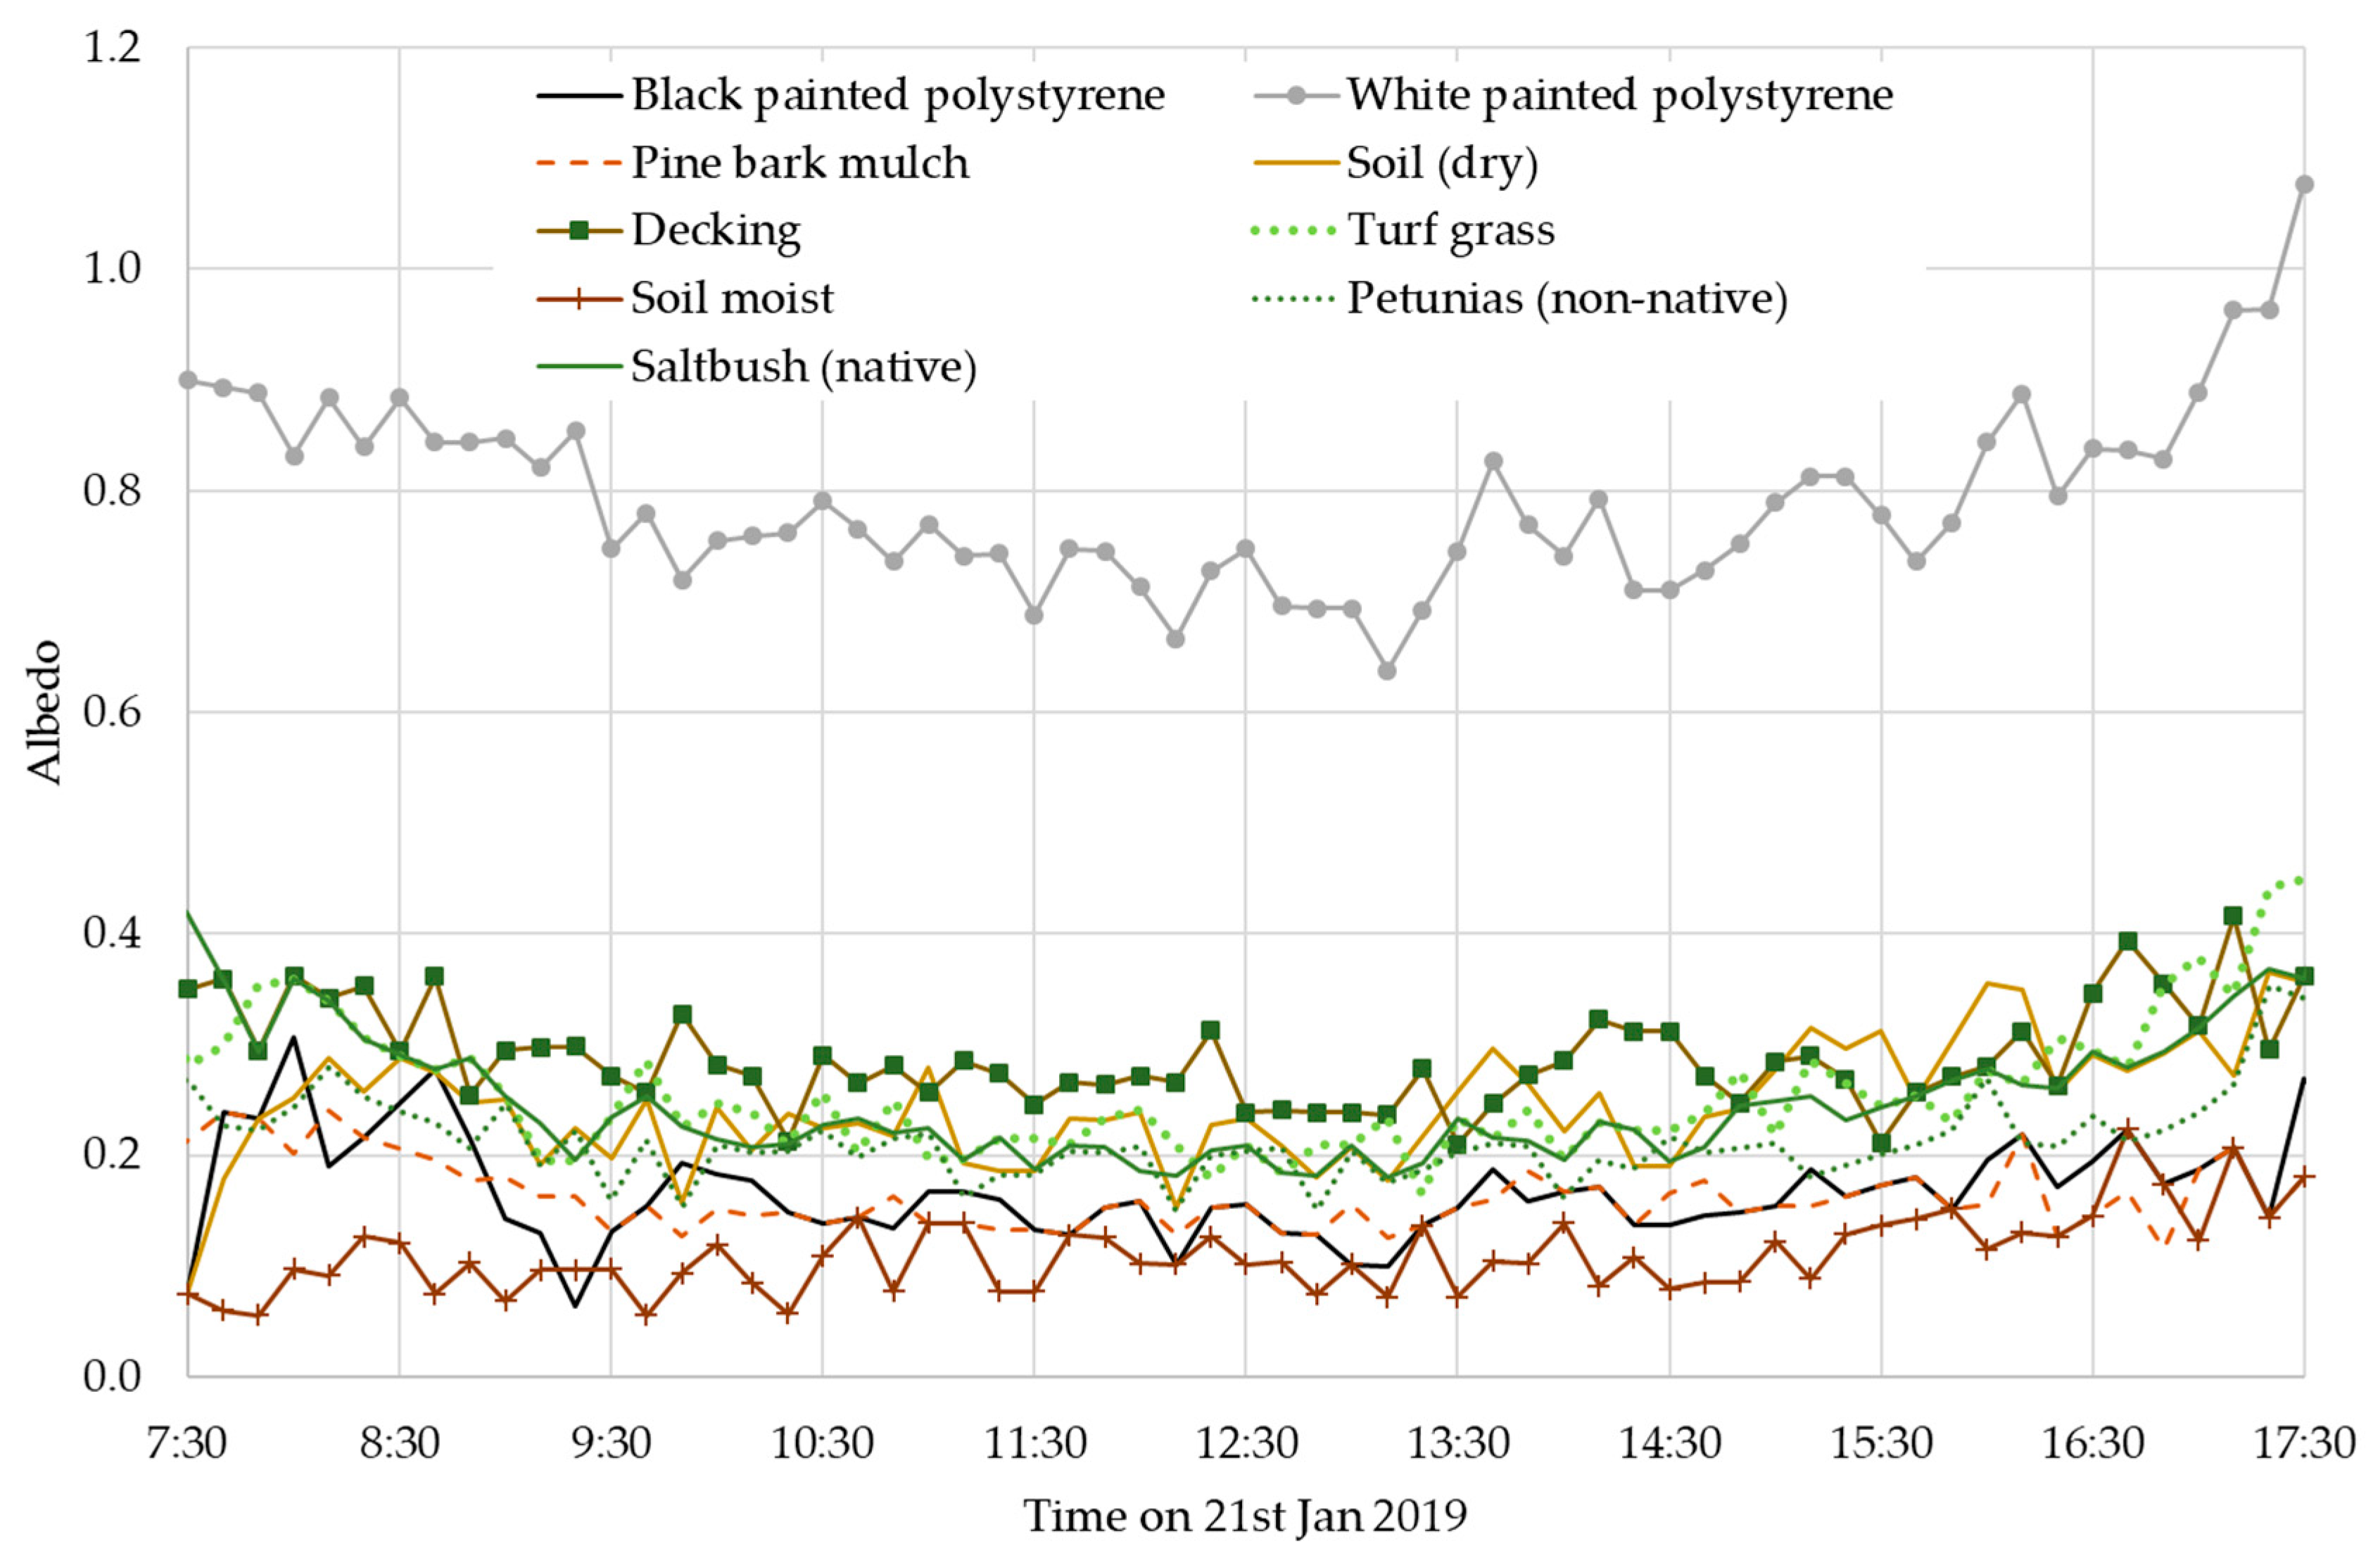
Both Equations (9) and (10) take into account the heat lost from the iButtons due to convection. Data from Approach 3 is shown in Figure 14 for soft (natural) LEs and in Figure 15 for hardscape LEs. The data looks similar to that from other researchers, where the albedo is higher at the beginning and end of the day, and lower and more consistent during the middle. This effect is more noticeable in the LEs with higher albedo like the WPP and the white rocks. It is also more apparent at the end of the day for the denser LEs, such as the pavers and the concrete. This curvature may be related to the shadow of the measurement device, which is corrected for in Approach 1 and 2 as both the LE and WPP experience the same shadowing.
Another way to compare the consistency of the results from all of the approaches was to fit the data for each LE with a second order polynomial. The coefficient of the x2 term is a measure of how much the data deviates from a horizontal line, i.e., a measure of the data’s curvature. The closer the x2 term is to zero, the more linear is the data. The average second order coefficient across all LEs for Approach 3 was 2.65 (SD 1.27), whilst for Approach 1 it was 0.78 (SD 0.47), and for Approach 2 0.76 (SD 0.46). Hence the coefficient values confirm that Approaches 1 and 2 provide a fairly consistent albedo through the day from 07:30 to 17:30.
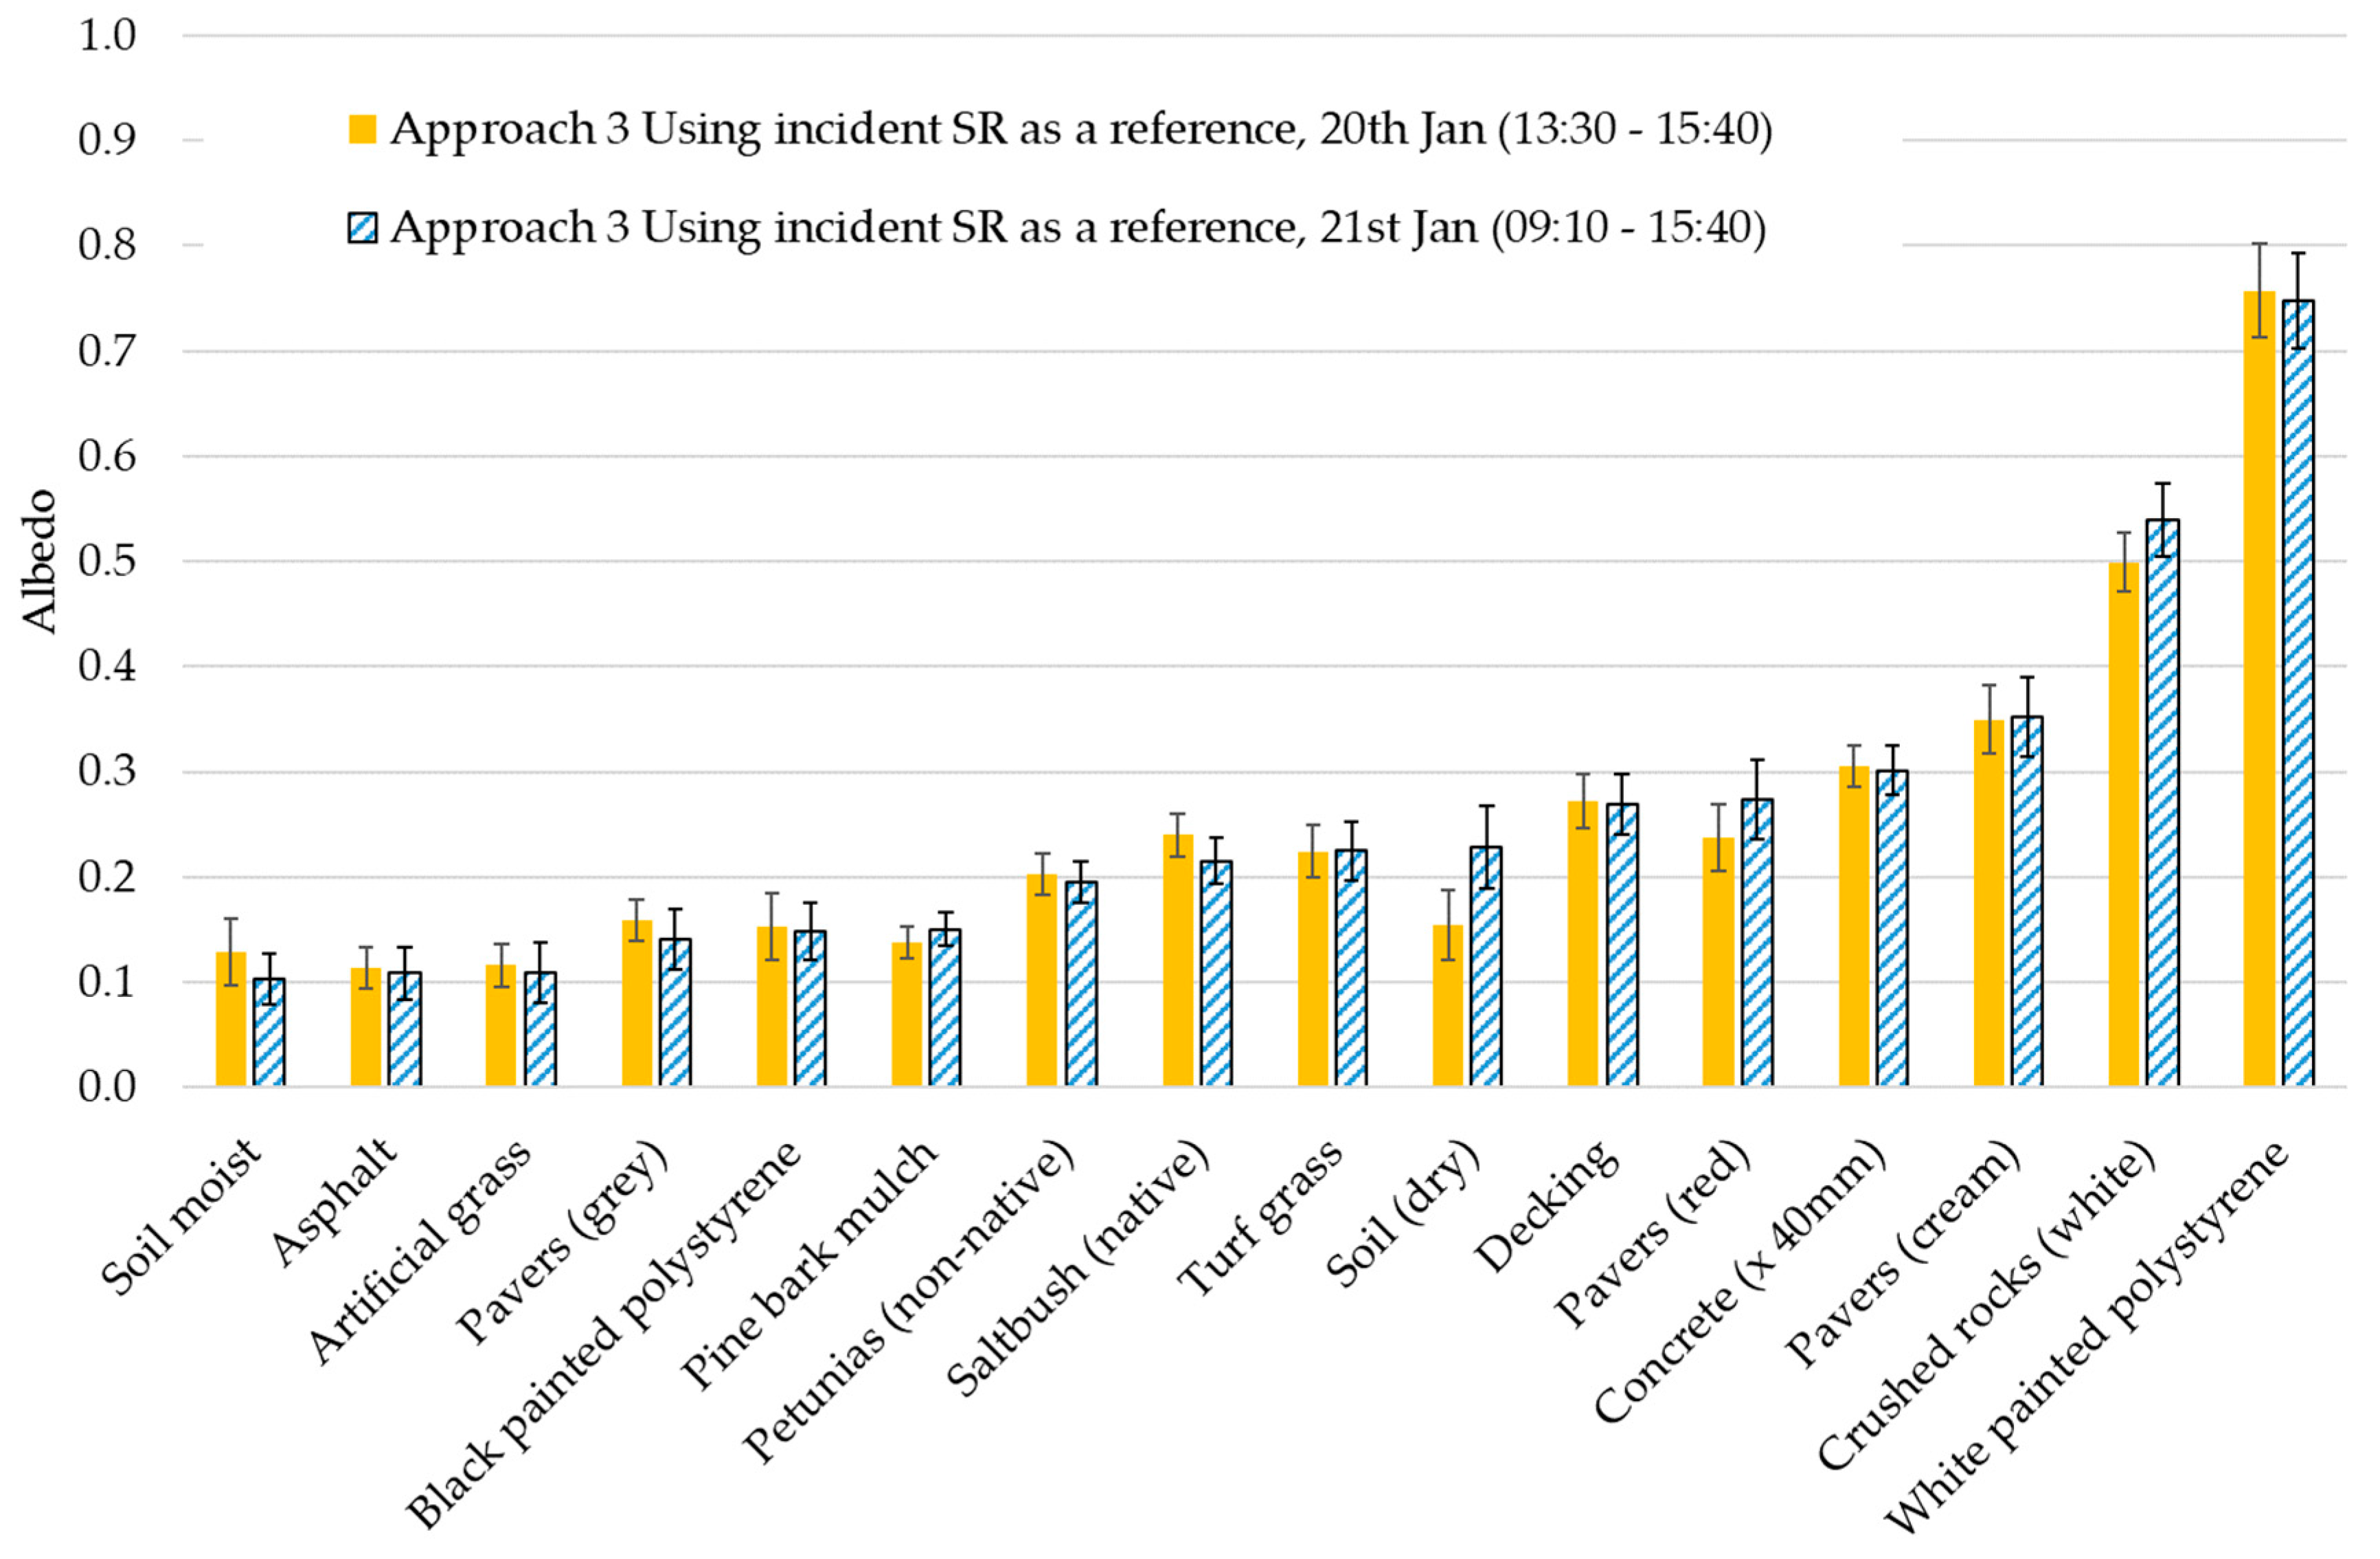
Figure 16 shows a comparison of the average albedos for each LE, between the two measurement days. Similar to the other approaches, the albedos are the same between the days, within the uncertainties, however the exception in this case is dry soil. The average value of dry soil was consistently lower on 20 compared with 21 January across all three approaches; however, this was still within the uncertainties in the first two approaches. There are two possible reasons for this. Firstly, although the wet soil was thought to have dried out by 13:30, it is possible that it was still damp and continued drying out over the rest of the day, becoming extremely dry by 21 January. Figure 8 supports this as the dry soil albedo trend is still slightly upwards from 13:30 to 17:30 on 20 January. The higher moisture content would have darkened its surface colour and hence lowered its albedo. Whilst the soil beneath the turf grass and the plants may also not have dried out completely, the surfaces which were being measured were the blades of grass and the leaves, and not the underlying soil. Hence, the effect of moisture cannot be seen in their albedo values. Secondly, the uncertainties used are the standard deviations of the data; however, for Approach 3, these standard deviations may not have been large enough to take into account the error in the calculation of the calibration coefficients. Thus, uncertainties for Approach 3 may be slightly undervalued.
3.7. Comparison of the Three Approaches
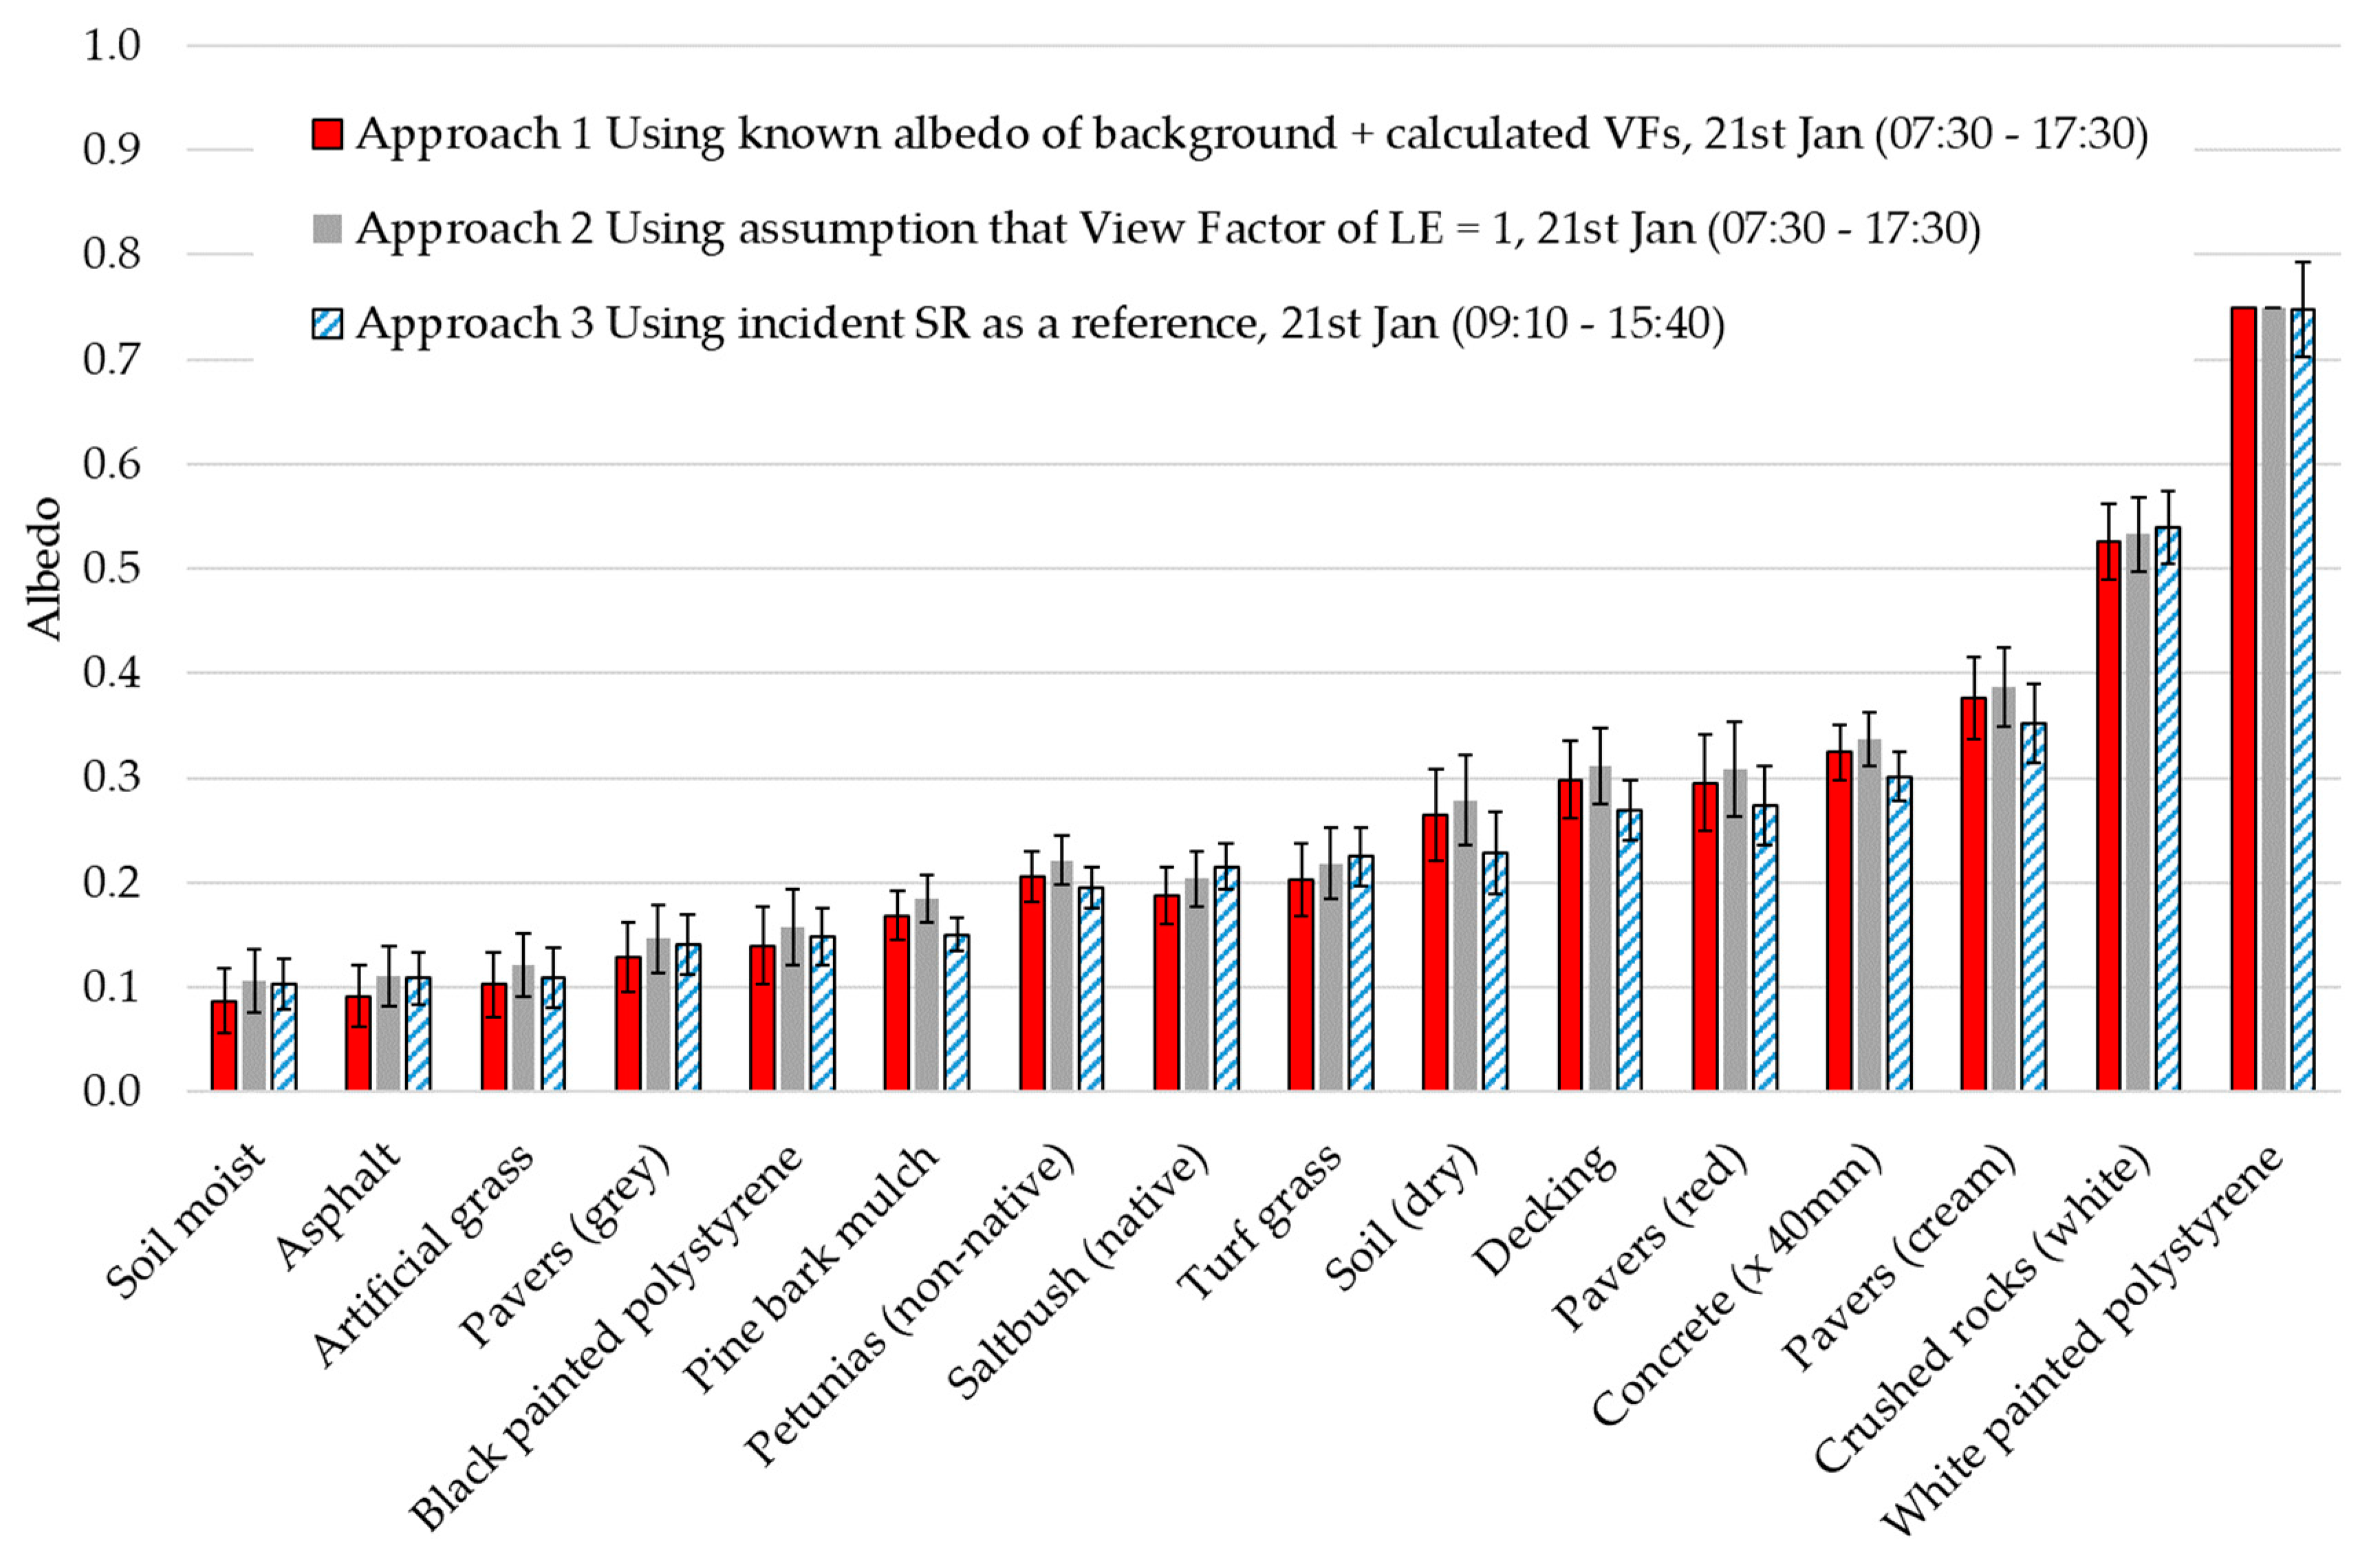
Figure 17 shows the data from the three approaches for 21 January 2019. The error bars are the SD of the data for each LE. These results show that there is an insignificant difference in the measured albedo between Approaches 1 and 2, once the VF is 0.92 or above. The actual albedo of the background material, however, is an important factor in these results. The background material in this study was turf grass with an albedo of 0.26. This would naturally have less of an effect where the albedo of the LE was higher, and more of an effect where the albedo of the LE was lower. For future measurements, if the albedo of the background material is considerably larger than that of the LE, its effect on the iButtons would be much more significant, regardless of the VF. Conversely, if the albedo of the LE is much greater than that of the background, the average albedos from Approach 2 would become closer to the values from Approach 1.
Hence, further study of the background albedo and the VFs is recommended before using Approach 2 and this simpler equation (Equation (8)). However, understanding the conditions where Approach 2 applies, would enable more flexibility in future field measurements where instrument height, LE size and VFs may be restricted or difficult to determine.
For all the LEs, values of albedo calculated using Approach 3 were the same as those measured using the WPP approaches (Figure 17). This direct approach however, relied on determining the calibration coefficients of the iButtons for a downward orientation, which implies knowledge of the albedo of the WPP. Assuming the calibration coefficients for the iButtons are a fixed value, this approach is relatively easy to use, however data must be collected only during the limited times of day as per ASTM-E1918_16 [30]. Approach 3 is similar to that used by [32] who used two low cost illuminance sensors, one facing up and one facing down. Their results were within ±0.1 of the albedos measured with commercial instrumentation. However, their sensor had a more limited FOV (55°) than the iButtons (~150°), which restricted the times and latitudes over which it could be used.
3.8. Comparison with Literature Values
The albedo of numerous common materials has been measured by other researchers using the more standard pyranometers. A selection of these albedos is given in Table 2 along with the data from this study for 21 January 2019 for comparison. It is worth noting that because albedo is affected by surface properties, the same type of LE may provide a range of albedo values due to surface aging, colour variation or difference in surface roughness. This is seen in the range of literature values given for commonly measured LEs such as concrete, which ranged from 0.17 [22] up to 0.39 [27], and asphalt which ranged from 0.05 [22] up to 0.19 [27]. Table 2 shows that all three of the methods used in this study yield albedos which lie within the ranges given in the literature, for those LEs where literature values were found. Literature values were not found for grey pavers nor for white crushed rocks. Whilst the iButtons and this methodology may not be as precise as a commercial albedometer, they are not intended to replace it but rather to provide a reasonable value for albedo, both easily, and at a low cost.
3.9. Limitations and Benefits of the iButtons and Their Methodology
3.9.1. Benefits
Although both an instrument and a methodology to measure albedo already exist, the purpose of this study was to develop a low-cost instrument which would potentially be accessible to more researchers and enable multiple units to be purchased in order to measure the albedo of many LEs concurrently. The simpler method developed in this study is less labour intensive than both the standard method [30], and the methods developed by other researchers [26,33,35,36], because multiple LEs can be measured over long time periods without user input. The high FOV of the iButtons will permit measurements to be taken at most latitudes and times of year, in contrast to the illuminance sensors used by [32], which were limited by their low FOV.
Where measurements need to be taken in low sky view factor (SVF) areas, the iButtons will measure reflected radiation from the surroundings. The method developed by [26] removes this effect by including a shading ring—a curtain of black fabric of albedo 0.05—around the LE. Similarly [36], uses a baffle around the albedometer itself to block out surrounding radiation. White and black masks of known albedo are used by [35], with the user required to physically cover and uncover the test material with first a black mask, and then a white mask, before testing again with no mask. However, the surrounding radiation does not need to be considered when using the methodology developed in this study, i.e., a comparison with WPP, as it merely adds to the incoming radiation to both the WPP and the LE, and is thus automatically incorporated in the albedo calculation. Future work using the iButtons method, however, should include measurements of albedo in low SVF areas, to confirm that SVF is accounted for in this methodology. Similar to the effect of reflected radiation from the surroundings, it was not necessary to take into account the reduced reflected radiation due to the shadows of the iButtons and the supporting arm on the LEs. These shadows were equivalent on both the WPP and the LEs, hence the comprehensive calculations done by [26] to remove this effect were not required in this study.
3.9.2. Limitations
The accuracy of a more expensive pyranometer albedometer is expected to be greater than the iButtons, as it would be compliant with the specifications set out in ISO 9060:2018 [52] and therefore have been subject to more rigorous and robust testing. Consequently, the iButtons are not designed to replace this instrument but rather to provide a best estimate of the albedo under real world conditions. The consistency of the iButton albedometer has not been tested over a long period of time. The selection of paint type and its quality may affect the longevity of the instrument. Hence, frequent calibration of the iButtons with a commercial pyranometer may be required. The iButtons have an irreplaceable internal battery which is not ideal if frequent measurements are required over a long time period. Battery life is dependent on sampling frequency and external temperatures. In contrast, pyranometers do not require external power or batteries, however they do require an external data logger. The measurement surface of a pyranometer is protected by a glass dome, while sun shields protect the body from solar heat gain [29]. Modifications such as these could be made to the iButtons, however these would increase the cost, defeating the intended purpose of this study. Without a protective dome, the iButton is more susceptible to heat loss via convection, hence is best used by comparison with measurements of a reference material such as the WPP.
This test work was undertaken in a high SVF area, and although this method should also be applicable to low SVF areas as mentioned in Section 3.9.1, this should be confirmed in future work. Measurements were taken under clear skies only, so the methodology has not been tested under cloudy conditions.
4. Conclusions
Material properties of urban landscape elements (LEs) can affect the amount of solar radiation present in the environment, and have the potential to affect urban heat, building energy use and the thermal comfort of pedestrians. A low-cost temperature sensor was modified to detect incident and reflected solar radiation. A methodology was developed to use this sensor to measure the albedo of LE samples placed in an open field. This methodology was validated by testing different LEs, typically found in residential and urban environments of Perth, Western Australia, and through comparison of results with literature albedo values for similar materials. Temperature data from black- and white-painted iButtons suspended over the LEs were compared with those over a reference material of white painted polystyrene (WPP). The albedos measured using this approach were more consistent across a longer period of the day (07:30 to 17:30) than were found using an approach more in line with ASTM E1918-16 [30], where reference iButtons measured the incident solar radiation and were compared with radiation from those over each LE. The implication is that using the WPP approach, albedo can be measured with reasonable precision at any time within these hours, compared to the hours required for the ASTM (09:10 to 15:40 in this case).
The effect of the albedo of the background material can be ignored when the view factor of the LE from the iButton is 0.92 or greater. This is less than the 0.95 suggested by [26] as being an effective view factor. However, these results may not apply where the albedo of the background material is significantly higher than that of the LE. Further investigation of this is recommended.
Changes in ambient temperature or relative humidity between test days had no effect on the measured albedo values. Measurements in other seasons, and on cloudy days, are recommended in order to capture the effects of lower angle and quantity of solar radiation, respectively. Using the low-cost instruments and the approaches developed in this study, the albedo of LEs can be measured successfully in outside areas with high SVF. In low SVF areas where reflected radiation from nearby objects would be a problem for standard albedometer measurements, the albedos of LEs are expected to be the same as those measured in high SVF areas when the WPP approach is used. Tests should be undertaken to confirm this, providing the potential for albedo to be measured in situ using this method. If confirmed, the albedo of aging and aged materials could thus be more easily monitored on site. The presence of moisture on the LEs dramatically affects the albedo, so surface conditions should be checked before measurements are taken. Albedo is an important factor for both pedestrian comfort and building energy use in residential and urban areas. Hence, knowledge of the albedo of LEs in situ will assist landscape professionals to both design for, and manage, urban heat.
Author Contributions
Conceptualization, J.L., G.K.L., J.J.B. and B.-l.O.; data curation, J.L.; formal analysis, J.L. and G.K.L.; funding acquisition, J.L. and J.J.B.; investigation, J.L.; methodology, J.L. and G.K.L.; project administration, J.L. and J.J.B.; resources, J.L.; supervision, J.J.B., B.-l.O. and G.M.M.; visualization, J.L.; writing—original draft, J.L.; writing—review and editing, J.L., G.K.L., J.J.B., B.-l.O. and G.M.M.
Funding
This research was supported by an Australian Government Research Training Program Scholarship and a Curtin University Postgraduate Scholarship top up. This research was also partly funded by the CRC for Low Carbon Living Ltd. supported by the Cooperative Research Centres program, an Australian Government initiative.
Acknowledgments
Appreciation to Bruce Ivers for his assistance in purchasing some LEs and for the use of his vehicle and trailer. Also thanks to the Booragoon Primary school for the use of their oval.
Conflicts of Interest
The authors declare no conflict of interest.
References
- IPCC. Summary for Policymakers. In Global Warming of 1.5°C. An IPCC Special Report on the Impacts of Global Warming of 1.5 °C above Pre-Industrial Levels and Related Global Greenhouse Gas Emission Pathways, in the Context of Strengthening the Global Esponse to the Threat of Climate Change, Sustainable Development, and Efforts to Eradicate Poverty; Masson-Delmotte, V.P., Zhai, H.O., Pörtner, D., Roberts, J., Skea, P.R., Shukla, A., Pirani, W., Moufouma-Okia, C., Péan, R., Pidcock, S., Eds.; World Meteorological Organization: Geneva, Switzerland, 2018; p. 32. [Google Scholar]
- Santamouris, M.; Ding, L.; Fiorito, F.; Oldfield, P.; Osmond, P.; Paolini, R.; Prasad, D.; Synnefa, A. Passive and active cooling for the outdoor built environment—Analysis and assessment of the cooling potential of mitigation technologies using performance data from 220 large scale projects. Sol. Energy 2017, 154, 14–33. [Google Scholar] [CrossRef]
- Santamouris, M.; Cartalis, C.; Synnefa, A.; Kolokotsa, D. On the impact of urban heat island and global warming on the power demand and electricity consumption of buildings—A review. Energy Build. 2015, 98, 119–124. [Google Scholar] [CrossRef]
- Santamouris, M.; Haddad, S.; Saliari, M.; Vasilakopoulou, K.; Synnefa, A.; Paolini, R.; Ulpiani, G.; Garshasbi, S.; Fiorito, F. On the energy impact of urban heat island in Sydney: Climate and energy potential of mitigation technologies. Energy Build. 2018, 166, 154–164. [Google Scholar] [CrossRef]
- Davis, L.W.; Gertler, P.J. Contribution of air conditioning adoption to future energy use under global warming. Proc. Natl. Acad. Sci. USA 2015, 112, 5962–5967. [Google Scholar] [CrossRef] [Green Version]
- Mohajerani, A.; Bakaric, J.; Jeffrey-Bailey, T. The urban heat island effect, its causes, and mitigation, with reference to the thermal properties of asphalt concrete. J. Environ. Manag. 2017, 197, 522–538. [Google Scholar] [CrossRef]
- Kazak, J.K. The use of a decision support system for sustainable urbanization and thermal comfort in adaptation to climate change actions—The case of the Wrocław larger urban zone (Poland). Sustainability 2018, 10, 1083. [Google Scholar] [CrossRef] [Green Version]
- Wong, L.P.; Alias, H.; Aghamohammadi, N.; Aghazadeh, S.; Nik Sulaiman, N.M. Urban heat island experience, control measures and health impact: A survey among working community in the city of Kuala Lumpur. Sustain. Cities Soc. 2017, 35, 660–668. [Google Scholar] [CrossRef]
- Wong, N.H.; Jusuf, S.K.; Syafii, N.I.; Chen, Y.X.; Hajadi, N.; Sathyanarayanan, H.; Manickavasagam, Y.V. Evaluation of the impact of the surrounding urban morphology on building energy consumption. Sol. Energy 2011, 85, 57–71. [Google Scholar] [CrossRef]
- Gill, S.E.; Handley, J.F.; Ennos, A.R.; Pauleit, S. Adapting cities for climate change: The role of the green infrastructure. Built Environ. 2007, 33, 115–133. [Google Scholar] [CrossRef] [Green Version]
- Hunter Block, A.; Livesley, S.J.; Williams, N.S.G. Responding to the Urban Heat Island: A Review of the Potential of Green Infrastructure; University of Melbourne, Burnley Campus and Victorian Centre for Climate Change Adaptation: Melbourne, Australia, 2012. [Google Scholar]
- Yang, W.; Lin, Y.; Li, C.-Q. Effects of landscape design on urban microclimate and thermal comfort in tropical climate. Adv. Meteorol. 2018, 2018, 13. [Google Scholar] [CrossRef]
- Huang, M.; Cui, P.; He, X. Study of the cooling effects of urban green space in harbin in terms of reducing the heat island effect. Sustainability 2018, 10, 1101. [Google Scholar] [CrossRef] [Green Version]
- Vieira de Abreu-Harbich, L.V.; Labaki, L.C.; Matzarakis, A. Effect of tree planting design and tree species on human thermal comfort in the tropics. Landsc. Urban Plan. 2015, 138, 99–109. [Google Scholar] [CrossRef]
- Xing, H.; Meng, Y. Measuring urban landscapes for urban function classification using spatial metrics. Ecol. Indic. 2019, 108, 105722. [Google Scholar] [CrossRef]
- Tipler, P.A. Physics; Worth Publishers, Inc.: New York, NY, USA, 1982; p. 1078. [Google Scholar]
- Yaghoobian, N.; Kleissl, J. Effect of reflective pavements on building energy use. Urban Clim. 2012, 2, 25–42. [Google Scholar] [CrossRef] [Green Version]
- Taleghani, M. The impact of increasing urban surface albedo on outdoor summer thermal comfort within a university campus. Urban Clim. 2018, 24, 175–184. [Google Scholar] [CrossRef]
- Erell, E.; Pearlmutter, D.; Boneh, D.; Kutiel, P.B. Effect of high-albedo materials on pedestrian heat stress in urban street canyons. Urban Clim. 2014, 10, 367–386. [Google Scholar] [CrossRef]
- Hardin, A.W.; Vanos, J.K. The influence of surface type on the absorbed radiation by a human under hot, dry conditions. Int. J. Biometeorol. 2018, 62, 43–56. [Google Scholar] [CrossRef]
- Falasca, S.; Curci, G. Impact of highly reflective materials on meteorology, PM10 and ozone in urban areas: A Modeling study with WRF-CHIMERE at high resolution over Milan (Italy). Urban Sci. 2018, 2, 18. [Google Scholar] [CrossRef] [Green Version]
- Goward, S.N. Albedo and reflectivity. In Encyclopedia of World Climatology; Oliver, J.E., Ed.; Springer: Dordrecht, The Netherlands, 2005; pp. 32–35. [Google Scholar] [CrossRef]
- Li, H.; Harvey, J.; Kendall, A. Field measurement of albedo for different land cover materials and effects on thermal performance. Build. Environ. 2013, 59, 536–546. [Google Scholar] [CrossRef]
- Ao, X.; Grimmond, C.S.B.; Liu, D.; Han, Z.; Hu, P.; Wang, Y.; Zhen, X.; Tan, J. Radiation fluxes in a business district of Shanghai, China. J. Appl. Meteorol. Climatol. 2016, 55, 2451–2468. [Google Scholar] [CrossRef]
- Chen, J.; Zhou, Z.; Wu, J.; Hou, S.; Liu, M. Field and laboratory measurement of albedo and heat transfer for pavement materials. Constr. Build. Mater. 2019, 202, 46–57. [Google Scholar] [CrossRef]
- Sailor, D.J.; Resh, K.; Segura, D. Field measurement of albedo for limited extent test surfaces. Sol. Energy 2006, 80, 589–599. [Google Scholar] [CrossRef]
- Montague, T.; Kjelgren, R. Energy balance of six common landscape surfaces and the influence of surface properties on gas exchange of four containerized tree species. Sci. Hortic. 2004, 100, 229–249. [Google Scholar] [CrossRef]
- Sen, S.; Roesler, J. Aging albedo model for asphalt pavement surfaces. J. Clean. Prod. 2016, 117, 169–175. [Google Scholar] [CrossRef]
- Kipp, Z. Instruction Manual CMP Series Pyranometer CMA Series Albedometer. Available online: https://cn.kippzonen.com/Download/72/Manual-Pyranometers-CMP-series-English (accessed on 7 October 2019).
- ASTM. ASTM-E1918-16: Standard Test Method for Measuring Solar Reflectance of Horizontal and Low-Sloped Surfaces in the Field; ASTM International: West Conshohocken, PA, USA, 2016. [Google Scholar] [CrossRef]
- ASTM. ASTM-E903-12: Standard Test Method for Solar Absorptance, Reflectance, and Transmittance of Materials Using Integrating Spheres; ASTM International: West Conshohocken, PA, USA, 2012. [Google Scholar] [CrossRef]
- Condom, T.; Dumont, M.; Mourre, L.; Sicart, J.E.; Rabatel, A.; Viani, A.; Soruco, A. Technical note: A low-cost albedometer for snow and ice measurements—Theoretical results and application on a tropical mountain in Bolivia. Geosci. Instrum. Method. Data Syst. 2018, 7, 10. [Google Scholar] [CrossRef] [Green Version]
- Akbari, H.; Levinson, R.; Stern, S. Procedure for measuring the solar reflectance of flat or curved roofing assemblies. Sol. Energy 2008, 82, 648–655. [Google Scholar] [CrossRef] [Green Version]
- Qin, Y.; Tan, K.; Meng, D.; Li, F. Theory and procedure for measuring the solar reflectance of urban prototypes. Energy Build. 2016, 126, 44–50. [Google Scholar] [CrossRef]
- Qin, Y.; He, H. A new simplified method for measuring the albedo of limited extent targets. Sol. Energy 2017, 157, 1047–1055. [Google Scholar] [CrossRef]
- Qin, Y.; Luo, J.; Chen, Z.; Mei, G.; Yan, L.-E. Measuring the albedo of limited-extent targets without the aid of known-albedo masks. Sol. Energy 2018, 171, 971–976. [Google Scholar] [CrossRef]
- Maxim Integrated. What Is an iButton Device? Available online: https://www.maximintegrated.com/en/app-notes/index.mvp/id/3808 (accessed on 19 August 2019).
- Hu, M.; Zhao, B.; Ao, X.; Feng, J.; Cao, J.; Su, Y.; Pei, G. Experimental study on a hybrid photo-thermal and radiative cooling collector using black acrylic paint as the panel coating. Renew. Energy 2019, 139, 1217–1226. [Google Scholar] [CrossRef]
- Taha, H.; Sailor, D.; Akbari, H. High-Albedo Materials for Reducing Building Cooling Energy Use; DE-AC0376SF00098; Lawrence Berkeley Laboratory University of California Berkeley: Alameda County, CA, USA, 1992. [Google Scholar]
- Levinson, R.; Berdahl, P.; Akbari, H. Solar spectral optical properties of pigments—Part I: Model for deriving scattering and absorption coefficients from transmittance and reflectance measurements. Sol. Energy Mater. Sol. Cells 2005, 89, 319–349. [Google Scholar] [CrossRef]
- Loveday, J.; Loveday, G.K.; Byrne, J.; Ong, B.L.; Newman, P. A technique for quantifying the reduction of solar radiation due to cloud and tree cover. Procedia Eng. 2017, 180, 403–412. [Google Scholar] [CrossRef]
- Krimm, S.; Liang, C.Y.; Sutherland, G.B.B.M. Infrared spectra of high polymers. II. polyethylene. J. Chem. Physcis 1956, 25, 549–562. [Google Scholar] [CrossRef] [Green Version]
- Loveday, J.; Loveday, G.; Byrne, J.J.; Ong, B.-L.; Morrison, G.M. Seasonal and diurnal surface temperatures of urban landscape elements. Sustainability 2019, 11, 5280. [Google Scholar] [CrossRef] [Green Version]
- Murdoch University. Murdoch University Weather Station. Available online: http://wwwmet.murdoch.edu.au/downloads (accessed on 21 June 2019).
- Howell, J.R. A Catalog of Radiation Heat Transfer Configuration Factors. Available online: http://www.thermalradiation.net/calc/sectionc/C-13.html (accessed on 20 March 2018).
- Yaghoobian, N.; Kleissl, J.; Krayenhoff, E.S. Modeling the thermal effects of artificial turf on the urban environment. J. Appl. Meteorol. Climatol. 2009, 49, 332–345. [Google Scholar] [CrossRef]
- Alucobond Architectural. Solar & Light Reflectivity Values for Alucobond Colours & Finishes. Available online: http://www.ecospecifier.com/media/448015/130319_new%20alucobond%20solar_%20light%20reflectivity%20values.pdf (accessed on 2 September 2019).
- Vliet, G.C.; Ross, D.C. Turbulent natural convection on upward and downward facing inclined constant heat flux surfaces. J. Heat Transf. 1975, 97, 549–554. [Google Scholar] [CrossRef]
- Cueto, R.G.; Soto, N.S.; Rincón, Z.H.; Benítez, S.O.; Morales, G.B. Parameterization of net radiation in an arid city of northwestern Mexico. Atmósfera 2015, 28, 71–82. [Google Scholar] [CrossRef]
- Santamouris, M. Environmental Design of Urban Buildings: An Integrated Approach; Routledge: London, UK, 2006. [Google Scholar]
- Kotthaus, S.; Smith, T.E.L.; Wooster, M.J.; Grimmond, C.S.B. Derivation of an urban materials spectral library through emittance and reflectance spectroscopy. ISPRS J. Photogramm. Remote Sens. 2014, 94, 194–212. [Google Scholar] [CrossRef] [Green Version]
- International Organization for Standardization. Solar Energy—Specification and Classification of Instruments for Measuring Hemispherical Solar and Direct Solar Radiation; Technical Committee ISO/TC 180, Solar energy, Subcommittee SC 1, Climate—Measurement and Data, ISO9060:2018; ISO: Geneva, Switzerland, 2018. [Google Scholar]
Figure 1.
(a) Black- and white-painted iButtons showing the top and back (unpainted) surfaces; and (b) iButtons inset into polystyrene blocks with the upwards facing surface covered in aluminium foil.
Figure 1.
(a) Black- and white-painted iButtons showing the top and back (unpainted) surfaces; and (b) iButtons inset into polystyrene blocks with the upwards facing surface covered in aluminium foil.

Figure 2.
These figures have been reproduced from [40]: (a) spectral reflectance of 1.5 mm thick TiO2-white acrylic paint; (b) normalized irradiance across the solar spectrum typical of North American insolation (originally from ASTM G 173-03).
Figure 2.
These figures have been reproduced from [40]: (a) spectral reflectance of 1.5 mm thick TiO2-white acrylic paint; (b) normalized irradiance across the solar spectrum typical of North American insolation (originally from ASTM G 173-03).

Figure 3.
Aerial view of LEs on the oval.

Figure 4.
iButtons in their polystyrene casing suspended on a thin metal rod above the centre of the artificial grass. The edges of the 50-mm-thick sand layer are visible.
Figure 4.
iButtons in their polystyrene casing suspended on a thin metal rod above the centre of the artificial grass. The edges of the 50-mm-thick sand layer are visible.

Figure 5.
Relative humidity and solar radiation for the two-day test period.

Figure 6.
Ambient temperature and wind speed for the two-day test period.

Figure 7.
The average uncertainty in TB − TW for each iButton pair.

Figure 8.
Effect of moisture on the albedo of soft (natural) landscape elements (LEs) found by reference to white-painted polystyrene (WPP) and using calculated view factors (Approach 1)–20 January 2019.
Figure 8.
Effect of moisture on the albedo of soft (natural) landscape elements (LEs) found by reference to white-painted polystyrene (WPP) and using calculated view factors (Approach 1)–20 January 2019.

Figure 9.
Effect of moisture on the albedo of hardscape LEs found by reference to WPP and using calculated view factors (Approach 1)–20 January 2019.
Figure 9.
Effect of moisture on the albedo of hardscape LEs found by reference to WPP and using calculated view factors (Approach 1)–20 January 2019.

Figure 10.
The albedo of soft (natural) LEs found by reference to WPP and using calculated view factors (Approach 1)–21 January 2019.
Figure 10.
The albedo of soft (natural) LEs found by reference to WPP and using calculated view factors (Approach 1)–21 January 2019.

Figure 11.
The albedo of hardscape LEs found by reference to WPP and using calculated view factors (Approach 1)–21 January 2019.
Figure 11.
The albedo of hardscape LEs found by reference to WPP and using calculated view factors (Approach 1)–21 January 2019.

Figure 12.
Comparison of average albedos from 20 and 21 January 2019, found using known background albedo plus calculated view factors (Approach 1). Data are sorted by 21 January. Error bars are the standard deviation of the data for each LE (range 0.02–0.05).
Figure 12.
Comparison of average albedos from 20 and 21 January 2019, found using known background albedo plus calculated view factors (Approach 1). Data are sorted by 21 January. Error bars are the standard deviation of the data for each LE (range 0.02–0.05).

Figure 13.
Comparison of average albedos from 20 and 21 January 2019, found using known background albedo plus calculated view factors (Approach 2). Data are sorted by 21 January. Error bars are the standard deviation of the data for each LE (range 0.02–0.04).
Figure 13.
Comparison of average albedos from 20 and 21 January 2019, found using known background albedo plus calculated view factors (Approach 2). Data are sorted by 21 January. Error bars are the standard deviation of the data for each LE (range 0.02–0.04).

Figure 14.
Albedo of soft (natural) LEs calculated by reference to the incident solar radiation.

Figure 15.
Albedo of hardscape LEs calculated by reference to the incident solar radiation.

Figure 16.
Comparison of average albedos from 20 and 21 January 2019, found using known background albedo plus calculated view factors (Approach 3). Data are sorted by 21 January. Error bars are the standard deviation of the data for each LE (range 0.02–0.05).
Figure 16.
Comparison of average albedos from 20 and 21 January 2019, found using known background albedo plus calculated view factors (Approach 3). Data are sorted by 21 January. Error bars are the standard deviation of the data for each LE (range 0.02–0.05).

Figure 17.
Comparison of albedos found using the three approaches, measured on 21 January 2019. Ranked by order of incident solar radiation as a reference. Data are sorted by Approach 3 on 21 January. Error bars are the standard deviation of the data for each LE (range 0.02–0.05).
Figure 17.
Comparison of albedos found using the three approaches, measured on 21 January 2019. Ranked by order of incident solar radiation as a reference. Data are sorted by Approach 3 on 21 January. Error bars are the standard deviation of the data for each LE (range 0.02–0.05).


Table 1.
Landscape element description.
| LE Name | Description (Total Surface Area Dimensions of All LEs Are 1200 mm × 1200 mm) | Depth (mm) | Sub Layer * |
|---|---|---|---|
| Artificial turf grass | Synthetic Tuff turf Multi, 1200 mm × 1200 mm, pile 12 mm | 12 | sand |
| Asphalt | Westbuild, asphalt pack 20 kg, quantity 5 | 50 | sand |
| Black-painted polystyrene | Polystyrene sheet (1200 mm × 1200 mm × 40 mm) painted with exterior low sheen black (4 Seasons, British paints), and then spray painted with flat black enamel (Rust guard, White Knight) | 40 | turf grass |
| Concrete (×40 mm) | Grey concrete slab 600 mm × 600 mm × 38 mm, quantity 4 | 38 | sand |
| Crushed rock (white) | Tuscan path pebbles, snow white 20–25 mm, 20 kg, quantity 4 | 50 | sand |
| Decking | Decking Merbau 90 mm × 19 mm, (13 lengths mounted on 3 pine joists height 90 mm) | 19 | turf grass |
| Petunias (non-native) | Annual ground cover (Petunia x hybrid), 150 mm diameter pots, quantity 65 | 100–150 | |
| Pine bark mulch | Richgro pinebark, 70 L, quantity 2 | 50 | sand |
| Pavers (grey) | Paver MyPave, charcoal 400 mm × 400 mm × 40 mm, quantity 9 | 40 | sand |
| Pavers (red) | Ezi-Pave Burnished Red (Midland Brick) 232 mm × 153 mm × 50 mm, quantity to make up 1200 mm × 1200 mm | 60 | sand |
| Pavers (sandstone) | Paver MyPave, cream 400 mm × 400 mm × 40 mm, quantity 9 | 40 | sand |
| Saltbush (native) | Old man saltbush seedlings (Atriplex nummularia), 50 mm diameter pots, quantity lots | 100–150 | |
| Soil (dry) | Richgro Professional base mix (soil), 25 L, quantity 6 | 50 | turf grass |
| Soil (moist) | Richgro Professional base mix (soil), 25 L, quantity 6 | 50 | turf grass |
| Turf grass | Kikuyu (Pennisetum clandestinum), managed and irrigated | NA | turf grass |
| White-painted polystyrene | Polystyrene sheet (1200 mm × 1200 mm × 40 mm) painted with exterior gloss white (4 Seasons, British paints) | 40 | turf grass |
* sand = 50 mm of yellow sand on top of turf grass.
Table 2.
A selection of common literature LE albedos, compared with albedos found in this study. Approach 1 is albedo using WPP reference and calculated VFs; Approach 2 is albedo using WPP reference and assumption VF = 1; Approach 3 is albedo using incident SR reference.
Table 2.
A selection of common literature LE albedos, compared with albedos found in this study. Approach 1 is albedo using WPP reference and calculated VFs; Approach 2 is albedo using WPP reference and assumption VF = 1; Approach 3 is albedo using incident SR reference.
| LE | Albedo | Albedo Approach 1 | Albedo Approach 2 | Albedo Approach 3 |
|---|---|---|---|---|
| Literature Values | ||||
| Artificial grass | 0.08 b, 0.05–0.1 g | 0.10 | 0.12 | 0.11 |
| Asphalt | 0.19 a,c, 0.18 b, 0.05–0.10 e | 0.09 | 0.11 | 0.11 |
| Black paint | 0.070 f, 0.02–0.15 g | 0.14 | 0.16 | 0.15 |
| Black-painted polystyrene | ||||
| Cement brick (yellow) | 0.30 h, | 0.38 | 0.39 | 0.35 |
| Sandstone (yellow) | 0.40 h | |||
| Pavers (cream) | ||||
| Concrete | 0.39 a, 0.35 b, 0.27 c, 0.30 d, 0.17–0.27 e | 0.32 | 0.34 | 0.30 |
| Crops | 0.15–0.25 e | |||
| Vegetated fields | 0.10 d | |||
| Deciduous plants | 0.2–0.3 g | |||
| Petunia | 0.21 | 0.22 | 0.20 | |
| Saltbush | 0.19 | 0.20 | 0.22 | |
| Crushed rocks (white) | 0.53 | 0.53 | 0.54 | |
| Pavers (grey) | 0.13 | 0.15 | 0.14 | |
| Pine bark mulch | 0.18 a | 0.17 | 0.18 | 0.15 |
| Plywood | 0.30 b | 0.30 | 0.31 | 0.27 |
| Wood (freshly planed) | 0.40 d | |||
| Decking | ||||
| Polystyrene painted with white elastomeric paint | 0.69 c | 0.75 | 0.75 | 0.75 |
| White paint | 0.596 f, 0.5–0.9 g | |||
| White pigment | 0.85 d | |||
| Smooth white coated polyurethane foam | 0.75 d | |||
| Pure white paint | 0.77 i | |||
| White-painted polystyrene | ||||
| Red brick | 0.30 d | 0.30 | 0.31 | 0.27 |
| Brick clay with cement (red) | 0.31 h | |||
| Pavers (red) | ||||
| Soil (dry clay or gray) | 0.20–0.35 e | 0.26 | 0.28 | 0.23 |
| Soil (dry) | ||||
| Soil (moist gray) | 0.10–0.20 e | 0.09 | 0.11 | 0.10 |
| Soil (moist) | ||||
| Turf grass | 0.22 a, 0.26 b,c | 0.20 | 0.22 | 0.22 |
© 2019 by the authors. Licensee MDPI, Basel, Switzerland. This article is an open access article distributed under the terms and conditions of the Creative Commons Attribution (CC BY) license (http://creativecommons.org/licenses/by/4.0/).
Share and Cite
MDPI and ACS Style
Loveday, J.; Loveday, G.K.; Byrne, J.J.; Ong, B.-l.; Morrison, G.M. Modified iButtons: A Low-Cost Instrument to Measure the Albedo of Landscape Elements. Sustainability 2019, 11, 6896. https://doi.org/10.3390/su11246896
AMA Style
Loveday J, Loveday GK, Byrne JJ, Ong B-l, Morrison GM. Modified iButtons: A Low-Cost Instrument to Measure the Albedo of Landscape Elements. Sustainability. 2019; 11(24):6896. https://doi.org/10.3390/su11246896
Chicago/Turabian StyleLoveday, Jane, Grant K. Loveday, Joshua J. Byrne, Boon-lay Ong, and Gregory M. Morrison. 2019. "Modified iButtons: A Low-Cost Instrument to Measure the Albedo of Landscape Elements" Sustainability 11, no. 24: 6896. https://doi.org/10.3390/su11246896
Note that from the first issue of 2016, this journal uses article numbers instead of page numbers. See further details here.