A Mapping Review on Urban Landscape Factors of Dengue Retrieved from Earth Observation Data, GIS Techniques, and Survey Questionnaires

 , , , , , , , , , ,
Abstract
:1. Introduction
- (i)
- identify the landscape factors according to various sources and geographical units of production;
- (ii)
- map co-occurrence networks associated with the landscape factors, in order to identify the potential underlying structure of fields;
- (iii)
- evaluate qualitatively the respective importance of the above for the mapping of the dengue risk.
2. Material and Methods
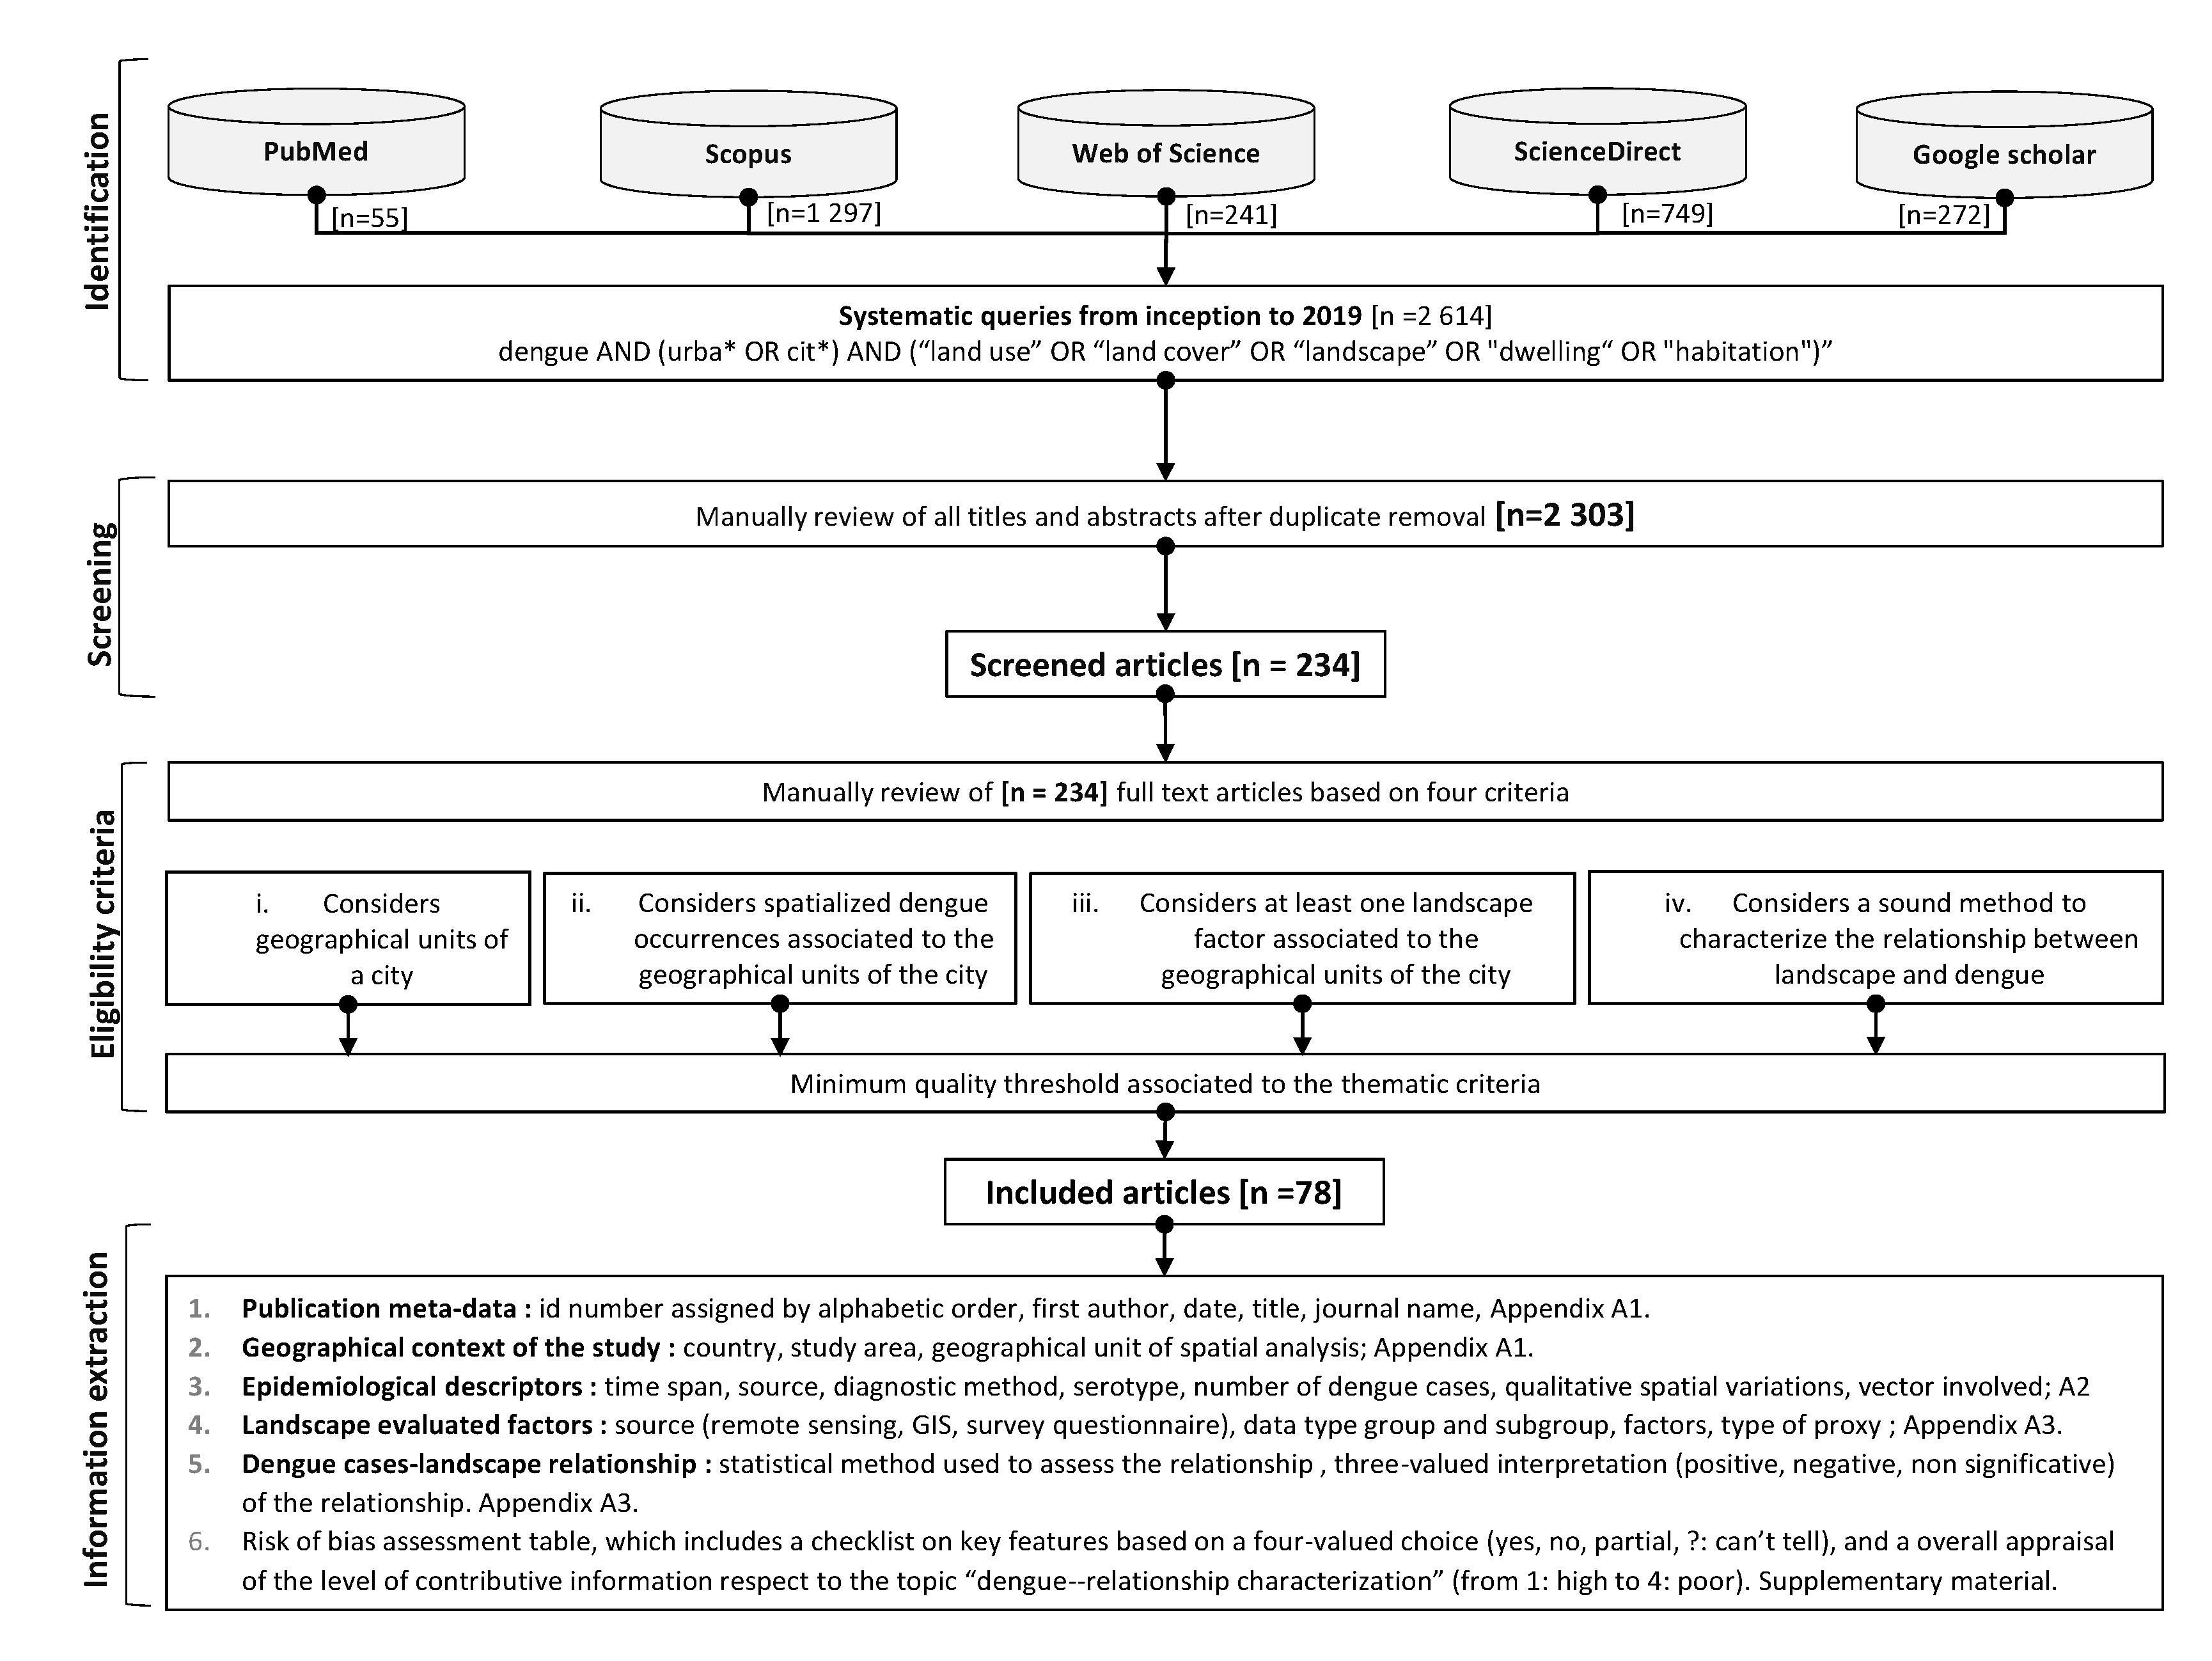
2.1. Systematic Search of Articles
- Science Direct: e.g., Annals of Epidemiology, of Global Health, of Tropical Biomedicine, International Journal for Parasitology, Acta Tropica, Infectious Disease Clinics of North America, etc.;
- Web of Science: e.g., International Journal of Environmental Research and Public Health, Asian Pacific Journal of Tropical Medicine, Environment Development and Sustainability, International Journal of Environmental Research and Public Health, Journal of Medical Entomology, etc.;
- PubMed: e.g., International Journal of Health Geographics, PLOS Neglected Tropical Diseases, The Brazilian Journal of Infectious Diseases, etc.;
- Scopus: e.g., e.g., Asia Pacific Journal of Public Health, BMC Infectious Diseases, Epidemiology and Infection, Geocarto International, etc.;
- (i)
- dengue AND (urba* OR cit*) AND (“land use” OR “land cover” OR landscape OR dwelling OR habitation)
2.2. Screening, Selection Criteria, Risk of Bias, and Contribution of the Articles
- (i)
- they consider geographical units within a city;
- (ii)
- they included spatialized dengue cases, collected by passive notification systems or by serological surveys;
- (iii)
- they identified and characterized the influence of landscape factors on dengue occurrences in an urban context;
- (iv)
- they described the explicit relationships between landscape classes and dengue data.
- (i)
- consider rural areas, or include large part uncovered by urban areas;
- (ii)
- do not consider dengue occurrences, but solely Aedes mosquitoes as proxy of dengue presence;
- (iii)
- do not include any explicit landscape feature, for example, solely consider meteorological variables (temperature, wind speed etc.) or socio-economic variables (income, status etc.);
- (iv)
- do not bring any evidence or information on the used models to perform the relationship between dengue occurrences and landscape features;
2.3. Structuring of the Information Extracted from the Included Articles
- (i)
- the geographical context: country, study area (city), geographical unit of spatial analysis (Table 1 and Appendix A);
- (ii)
- the epidemiological descriptors: start and end years of an outbreak or survey, dengue data type (incidence, prevalence, case number), medical analysis to confirm the diagnosis (clinical signs, laboratory analysis), number of dengue cases (and incidence rate when available), spatial variation and pattern(s) observed, vector species involved (Table 2 and Appendix A);
- (iii)
- the landscape factors: data source according to three subcategories: remote sensing images (sensor name), Geographic Information System (GIS) layers, and survey questionnaires. We also extrapolated the type of proxy associated (i.e., the element of the transmission cycle represented, for example, “exposure to Aedes bite”), and the type of data (e.g., land use or housing type and characteristics) according to a two-level classification, called data group and sub-group, respectively (Table 3 and Appendix A);
- (iv)
- the search of a relationship between urban determinants and dengue cases: type of statistical and spatial methods used to quantify the relationship between dengue cases and environmental determinants, interpretation of the relationship through a three-valued index: positive (+), negative (−), or non-significant (NS) (Table 3 and Appendix A).
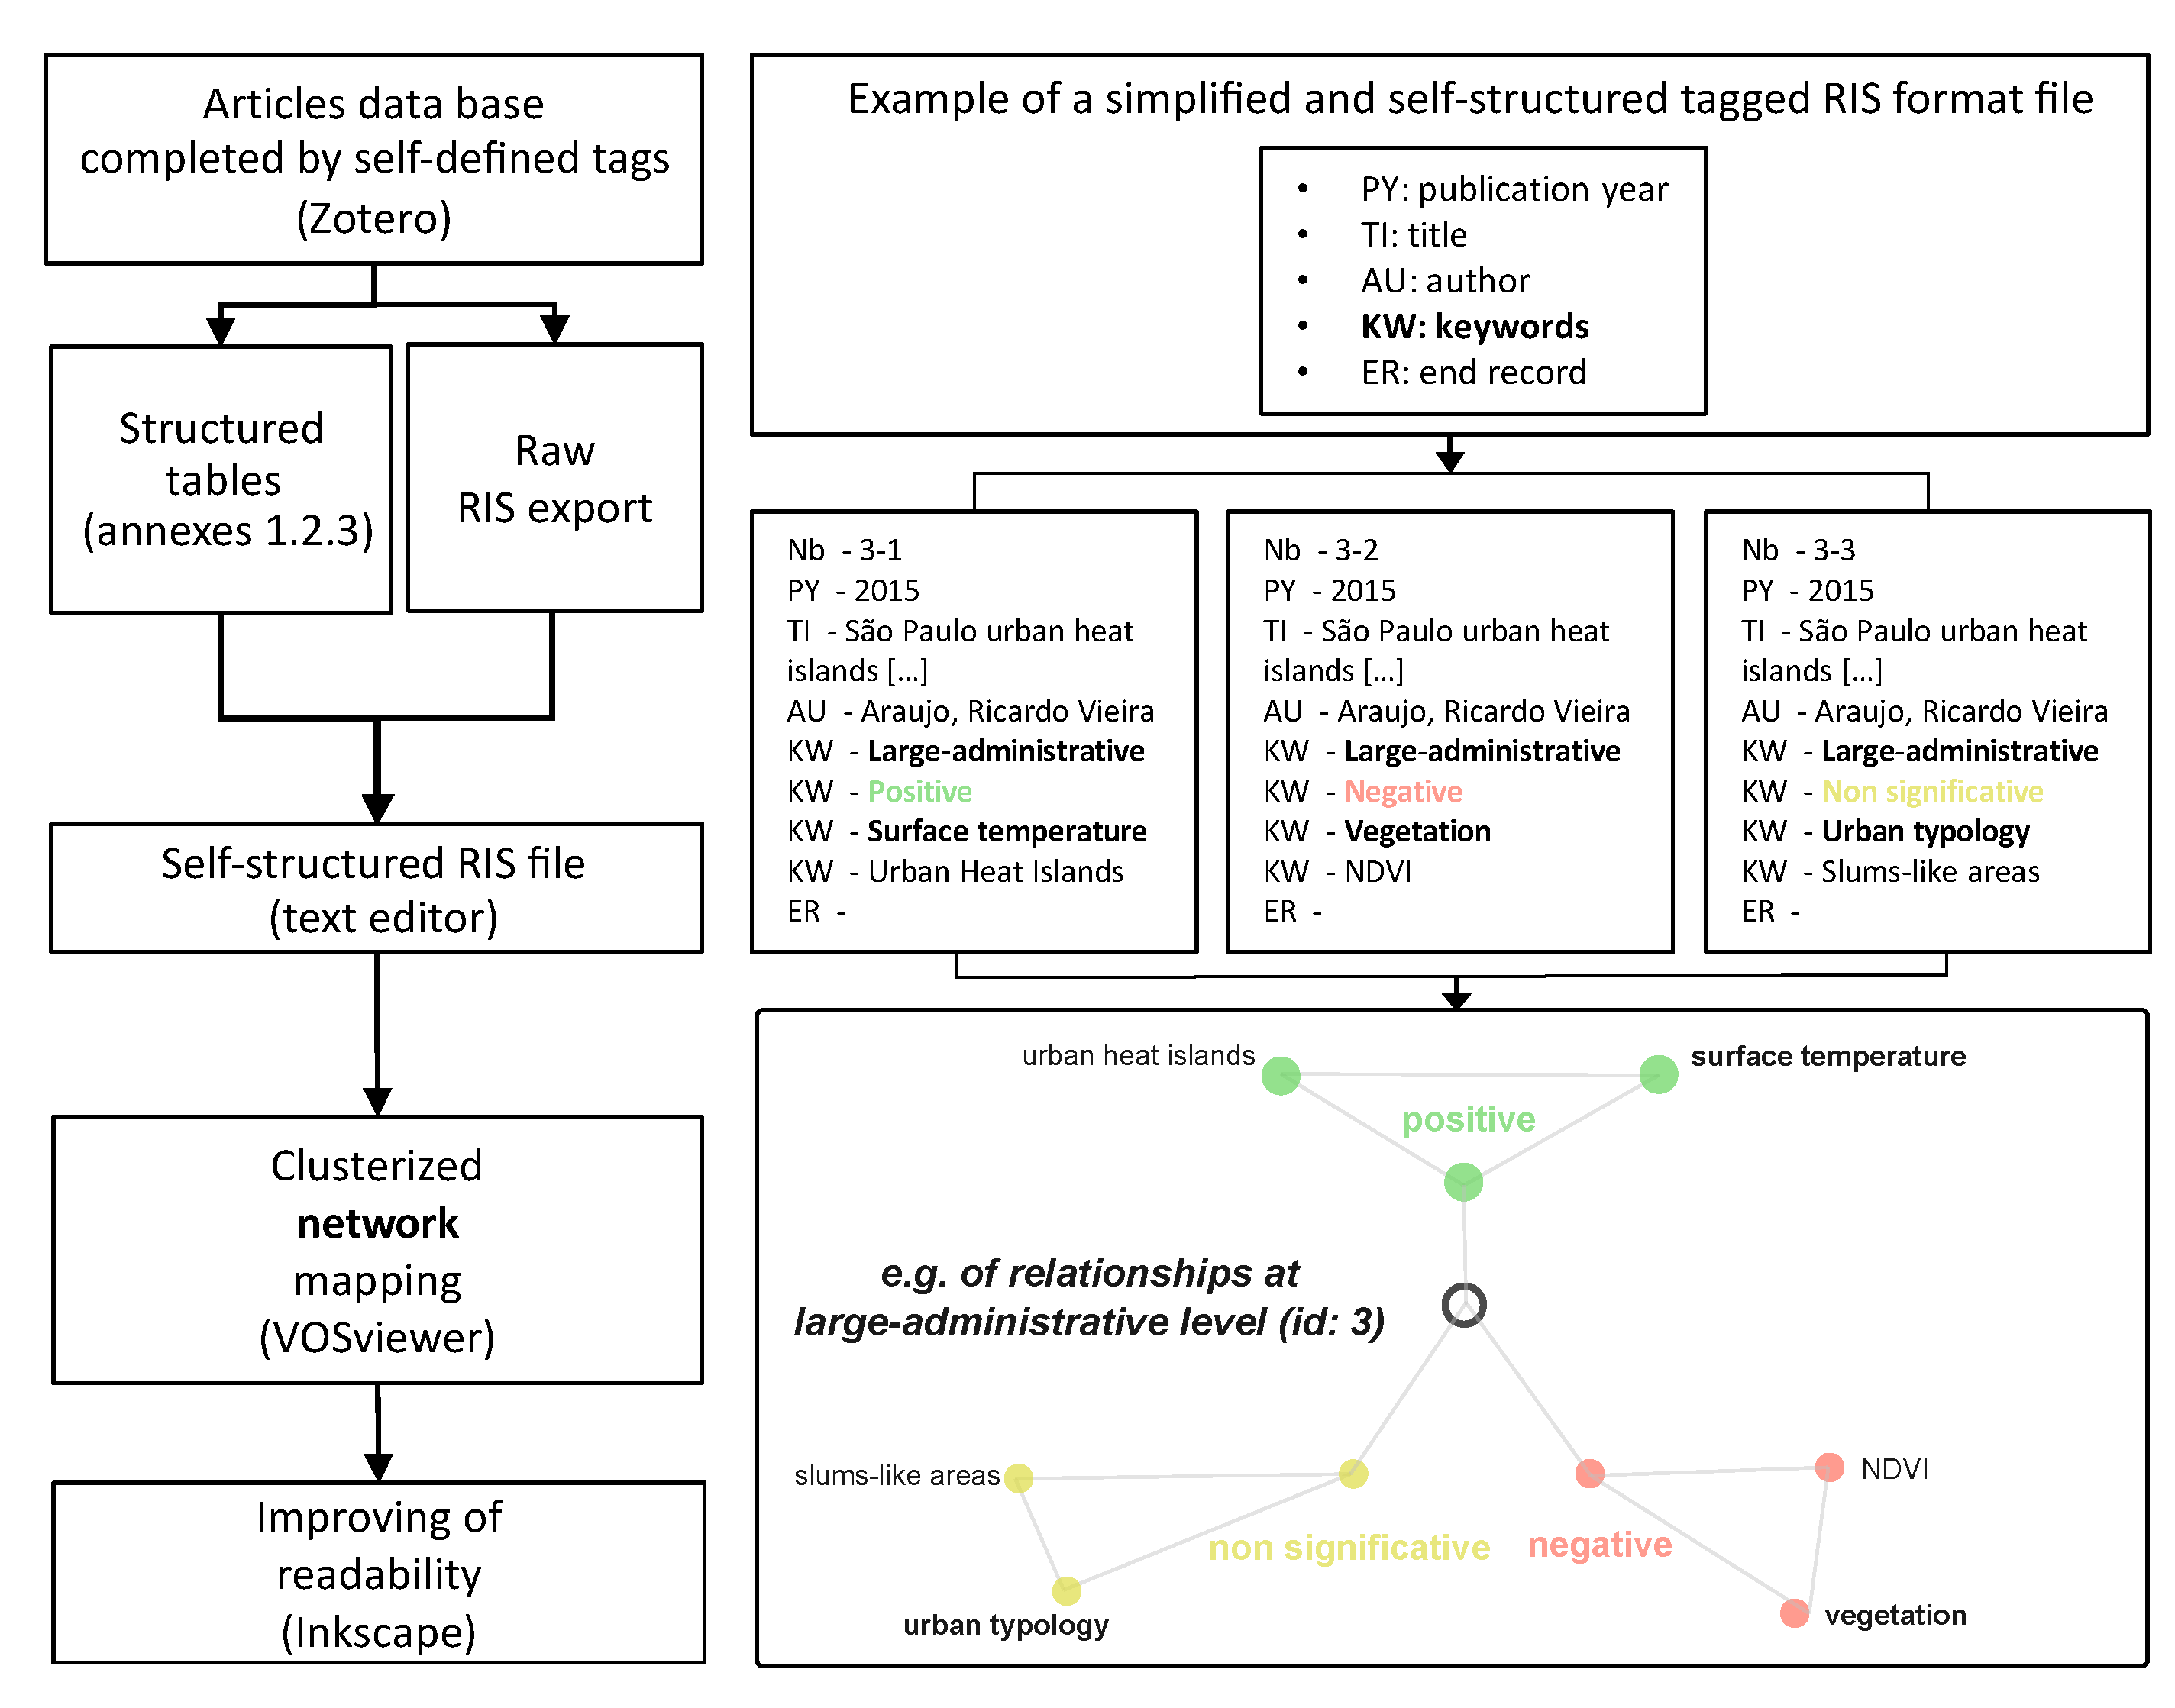
2.4. Analysis and Representation of the Information
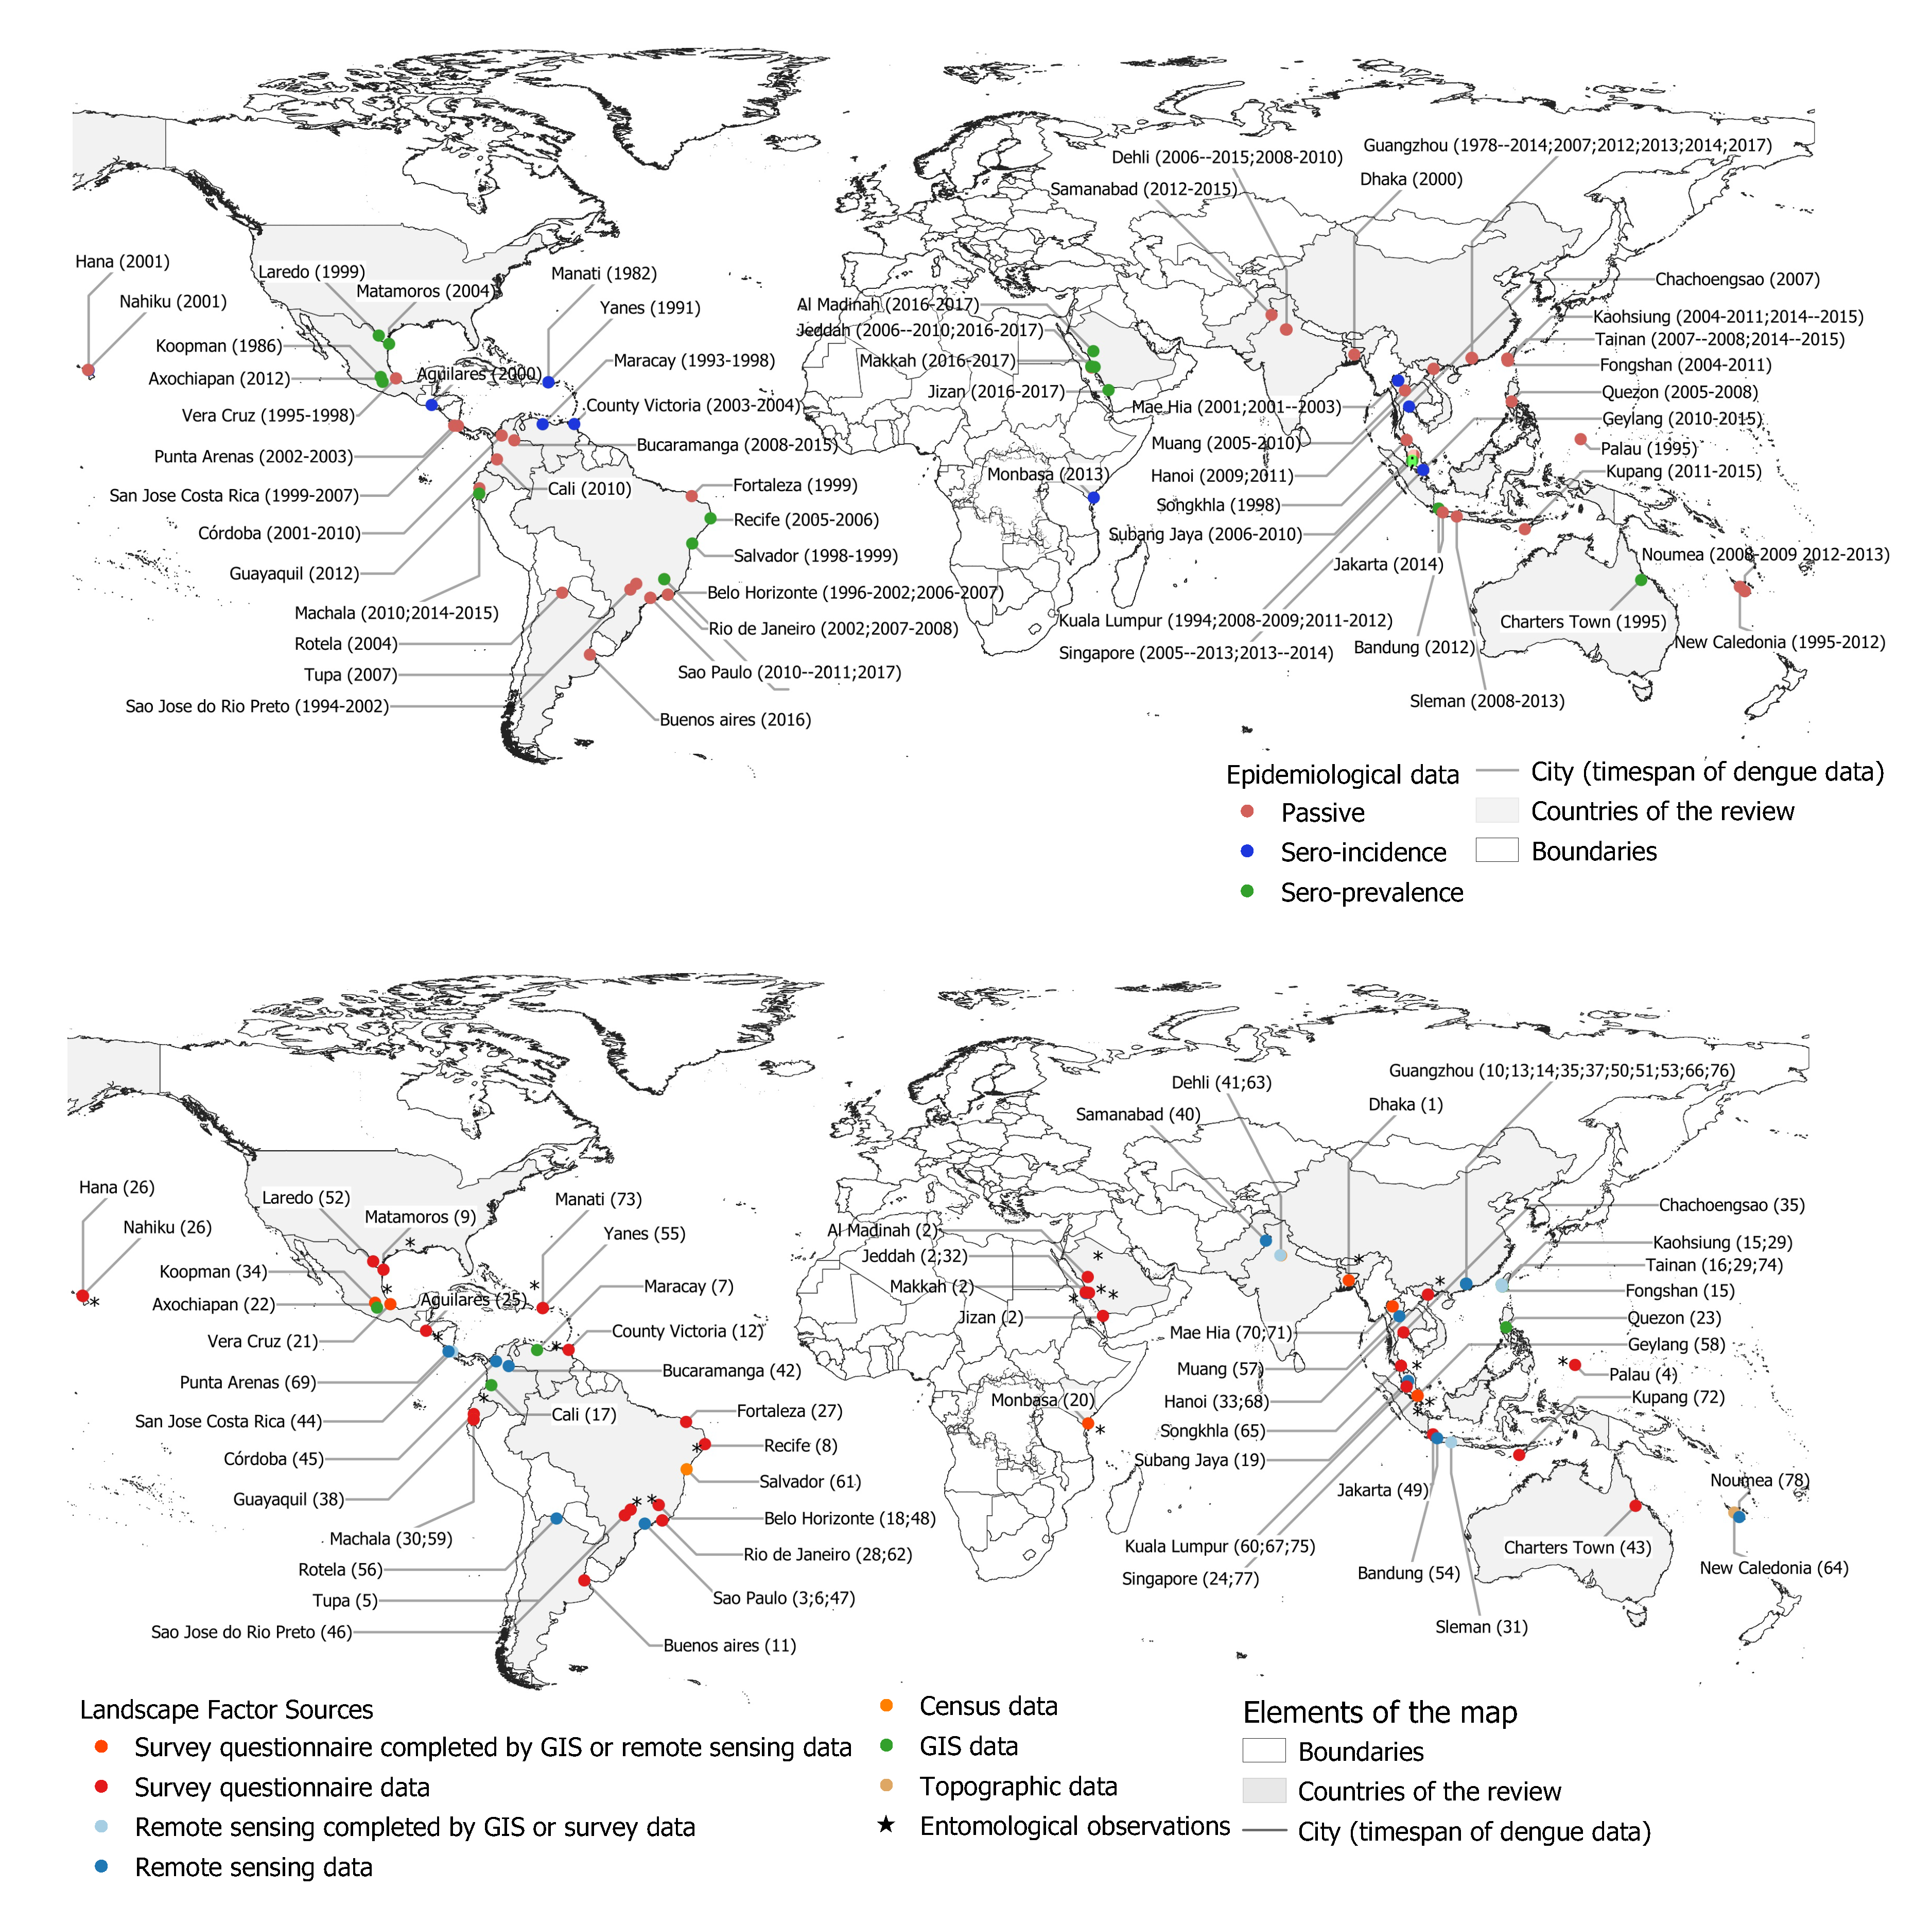
2.4.1. Cartographic Representation
2.4.2. Co-Word Analysis through Self-Defined Tags Co-Occurrences
3. Results from Information Extraction
3.1. Geographical and Epidemiological Contexts
- The oldest article was published in 1986, and refers to a dengue transmission episode observed in two Puerto Rican communities which occurred in 1982 (id: 73). Four articles were published in the 1990s, and refer to putative determinants and predictors of infection in Mexico (id: 34), risk factors observed in Puerto Rico (id: 55), determinants of dengue-2 infection in Australia (id: 43), and relationship between Breteau, House index (HI), and occurrences of dengue in Malaysia (id: 60);
- Twenty articles were published between 2000 and 2009, mainly in Brazil (ids: 18, 27, 28, 46, 61, 62), Central America (ids: 7, 9, 12, 21, 25, 52, 69), South America (id: 56), South and East Asia, Bangladesh (id: 1), and Thailand (ids: 65, 70, 71). Two articles were published in West and Central Pacific, Palau (id: 4), and Hawaii (id: 26);
- From 2010 and before 2015, we identified 16 articles, which were concerned principally with Central and South America: Costa Rica (id: 44), Colombia (id: 45), Ecuador (id: 59), and Brazil (ids: 5, 6, 8, 48), East Asia: in China (ids: 15, 36, 74), in Malaysia (id: 19, 75), in Thailand (ids: 35, 57), and in the Philippines (id: 23). One of the two articles published in the Middle East (Saudi Arabia) was from 2011 (id: 32);
- Since 2015, the majority of the thirty-seven study sites were located in South Asia, mainly in China (ids: 10, 13, 14, 16, 29, 37, 39, 50, 51, 53, 66, 76), India (id: 41, 63) and Pakistan (id: 40), and South East Asia: Vietnam (ids: 33, 68), Singapore (ids: 24, 58, 77), Malaysia (id: 67), and Indonesia (ids: 31, 49, 54, 72). Five articles since 2105 related to Central and South America: Mexico (id: 22), Brazil (ids: 3, 47), Argentina (id: 11), Colombia (ids: 17, 42), and Ecuador (ids: 30, 38). We found only one article concerning Africa (Kenya), published in 2016 (id: 20), and the second article of the Middle East (Saudi Arabia) which was from 2019 (id: 2);
- Various articles concern urban areas located in an insular context: Palau in the western Pacific (id: 4), Puerto Rico (id: 55), Hawaii (id: 26), Singapore (ids: 24, 77), Taiwan (Province of China) (ids: 15, 16, 74), Trinidad (id: 12) and New Caledonia (ids: 64, 78). Two studies make a cross-border comparison, between USA and Mexico border-cities (ids: 9, 52 );
- Most study sites are limited to a unique city, excepted in some cases, which consider various urban areas (id: 2, multi-stage stratified cluster sampling in four cities of Saudi Arabia), (id: 34, serosurvey in 70 localities of Mexico), (id: 44, correlational epidemiological study conducted in the country’s 81 cantons of Costa Rica), (id: 45, 30 selected municipalities of Colombia’s Córdoba Department), (id:50, seven cities of the Guangdong province, located at the Pearl River estuary) (id: 67, various degrees of urbanization between cities in Malaysia), (id: 64, different elevation levels in New Caledonia);
- Ten articles focused on the city of Guangzhou, located in the south-central part of Guangdong Province in China (ids: 10, 13, 14, 36, 37, 39, 51, 53, 66, 76). Guangzhou is considered as “the center of transportation, finance, industry and trade in southern China and has frequent economic and cultural communication with the nations of Southeast Asia and Africa” (id: 14). If historically, dengue fever has re-emerged in China in 1978 from its first appearance in Foshan city (Guangdong province), Guangzhou, with its 14.49 millions resident population, has “always been the hardest hit area of [dengue fever] DF in Guangdong Province and China”, with epidemic episodes that have “gradually intensified” (ids: 14, 39);
- The dengue virus can cause a large range of symptoms, ranging from an asymptomatic form, which includes the vast majority of infections, and may be associated with various degrees of infection: dengue fever (DF), dengue hemorrhagic fever (DHF) to the potentially fatal dengue shock syndrome (DSS) [52]. Generally, most articles refer to dengue cases that include a broad interpretation of the disease expression, especially fever (DF). Twelve studies in the method section refer explicitly to DHF cases (ids: 7, 12, 17, 25, 31, 38, 49, 59, 60, 65, 75, 68), and two to DSS (id: 31, 65). In Indonesia for example, only DHF cases are mandatorily reported (id: 49);
- We identified 23 articles based on serological surveys performed by the authors (ids: 2, 7, 8, 9, 20, 22, 26, 28, 30, 34, 35, 43, 48, 49, 52, 55, 61, 67, 70, 71, 73, 75, and 77). In such approaches, based on fieldwork, household location is used to spatially identify the dengue cases. Fifty-five other articles were based on passive notification of cases collected by local and national health agencies. Such databases may collect the patient address or refer to an administrative division to locate the cases, without further information on a potential place of transmission (ids: 15, 16, 19, 23, 32, 35, 57, 64, 66, 78). A geocoding step is necessary where patients home addresses are available to associate (X, Y) coordinates in a GIS;
- Geocoding was performed manually (ids: 3, 54, 65, 67, 69) or probably manually (ids: 11, 18, 17, 31), and in 5 cases by an automatic method (id: 42 R script-ArcGIS server, ids: 37 and 53 http://www.gpsspg.com/xGeocoding/) or probably automatic method (id: 46 MapInfo, id: 76 not described method). The authors may decide to spatially aggregate the dengue cases at a coarser resolution to perform the association with other data sources (id: 10, “Gross Domestic Product” at township/street level; id 38, census block);
- Considering the temporal aspect, 26 articles use datasets, which cover at most three years. The longest time series of dengue cases was an uninterrupted 22 years dataset in the city of Guangzhou, China, from 1978 to 2014 (id: 66). Most publications aggregated dengue data and calculated the yearly average incidence rate;
- Almost all of the 78 publications included articles which confirmed a highly non-uniform spatial distribution in the urban context, regardless of the spatial scale of analysis. Global or focal cluster detection are commonly based on global/local Moran’s index to detect the presence of overdispersion based on autocorrelation analysis [53], and is based on either a sliding circular window (cylinder, if the time dimension is considered), or consider each spatial unit towards contiguous neighbor units (ids: 10, 16, 17, 18, 38, 46, 54, 58, 65, 78). Its value comprises between [-1,+1], and reflects the assumptions about the spatial phenomenon in question to detect negative or positive spatial auto-correlation. In the articles of this review, a local Moran’s index often highlights the presence of a spatial correlation at fine scale. Various articles identify clusters (ids: 1, 3, 10, 16, 17, 18, 24, 31, 36, 37, 38, 39, 46, 51, 53, 58, 63, 65, 70, 71, 74, 78), hotspots (ids: 10, 19, 50, 56, 59) and coldspots (id: 10, 50). In one study (id: 42), the authors tested several structures of spatially explicit Bayesian models in order to estimate the relative risk (RR) of dengue.
- The majority of the articles only mention the implication of the Aedes vector in the introduction and/or the discussion sections, and exclude entomological consideration in the method or in the data acquisition. Nineteen articles performed entomological observations of: Aedes aegypti (ids: 1, 4, 5, 6, 9, 24, 26, 28, 34, 52, 55, 58, 60, 61, 73), Ae. albopictus (ids: 1, 4, 9, 26, 58, 60, 66), or of Ae. (Stegomya) genus (ids: 12, 25, 65) without distinction between both species;
- Thirty-six articles mentioned Aedes aegypti as the main or exclusive vector, six mentioned Ae. albopictus as the main or exclusive vector (ids: 10, 13, 39, 50, 51, 53), and ten mention both or just the Ae. (Stegomya) genus as responsible for the dengue transmission process (ids: 14, 16, 36, 41, 49, 54, 57, 67, 74, 75). Only one study dispensed with an entomological database prior to the survey, made available by the infectious disease surveillance system (id: 66, Notifiable Infectious Disease Report System (NIDRS), Guangzhou);
- The potential heterogeneous nature of the spatial dispersion of mosquito density has been analysed in some studies (in relation withe dengue occurrences), through, notably (i) the intensity of larvae-positive breeding sites by properties inspected in each block, unsing the kernel estimator method (id: 5), parameterized with a flight distance of 280 m which is associated with the Aedes aegypti female [54], (ii) the extrapolation by ordinary kriging of entomological indicators associated with the four life stages of Ae. aegypti: (absolute) number of A. aegypti eggs in the block, and number of positive buildings for Ae. aegypti larvae-pupae and adults in the block, divided by the number of buildings surveyed in the block (id: 6).
3.2. Production of the Landscape Factors Associated to Dengue Cases
- (i)
- Survey questionnaire, including census data;
- (ii)
- in situ entomological observation;
- (iii)
- Geographical Information system (GIS) data;
- (iv)
- Topographical measurements;
- (v)
- Remote sensing data (RS data), originated from satellite images.
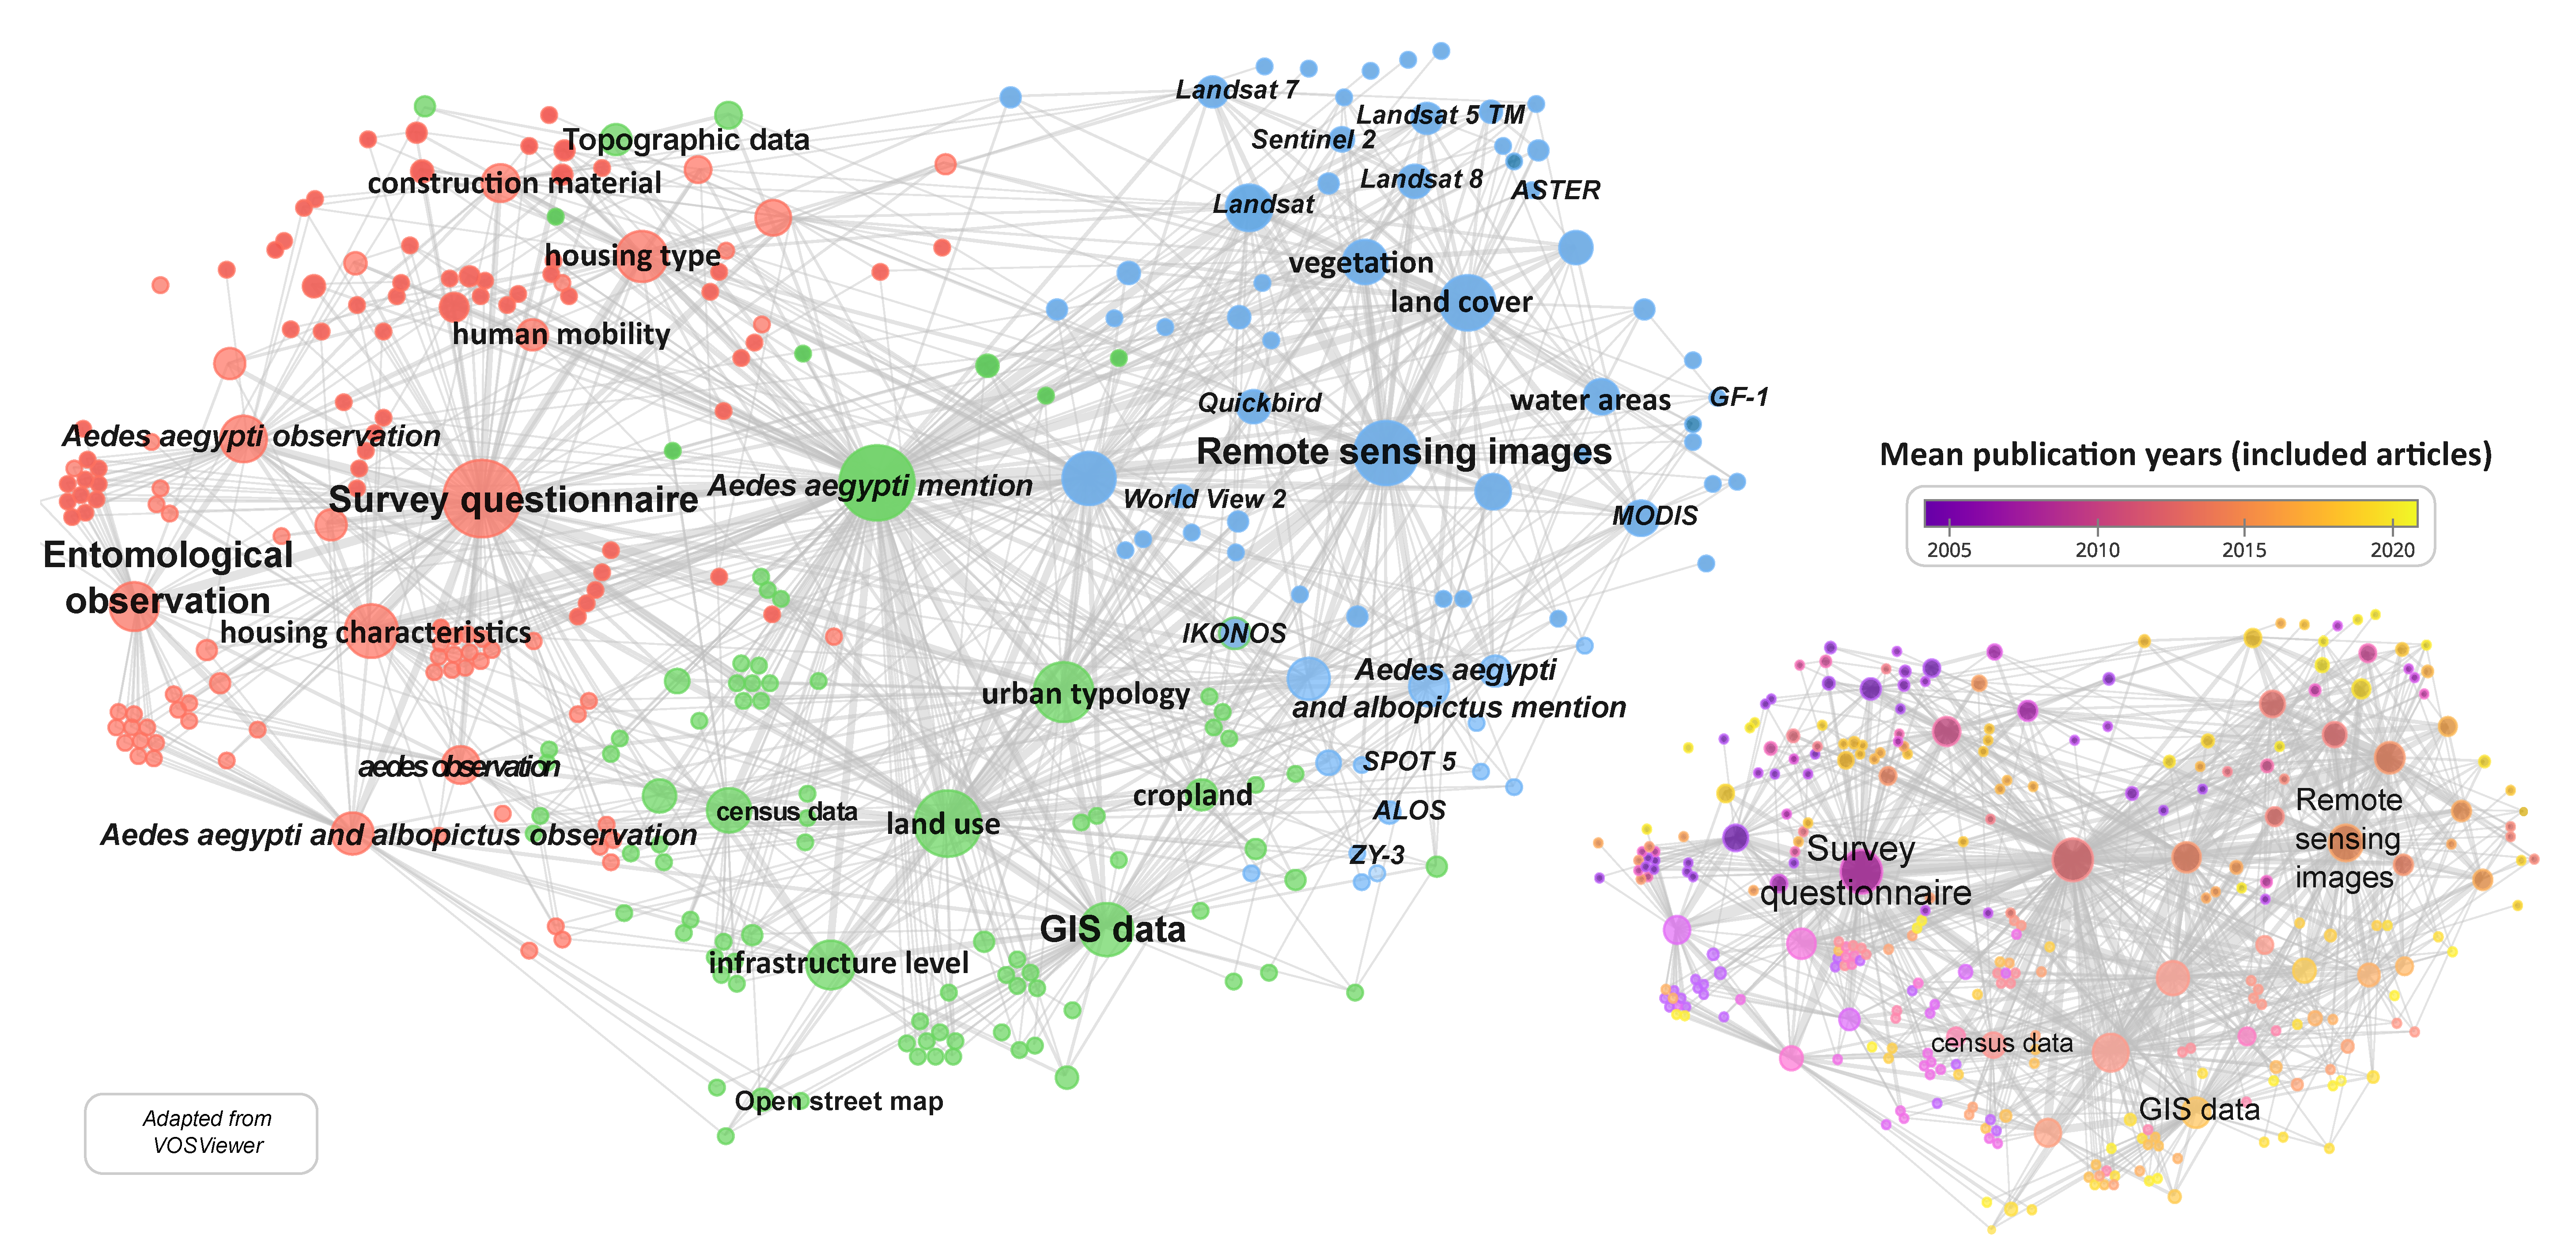
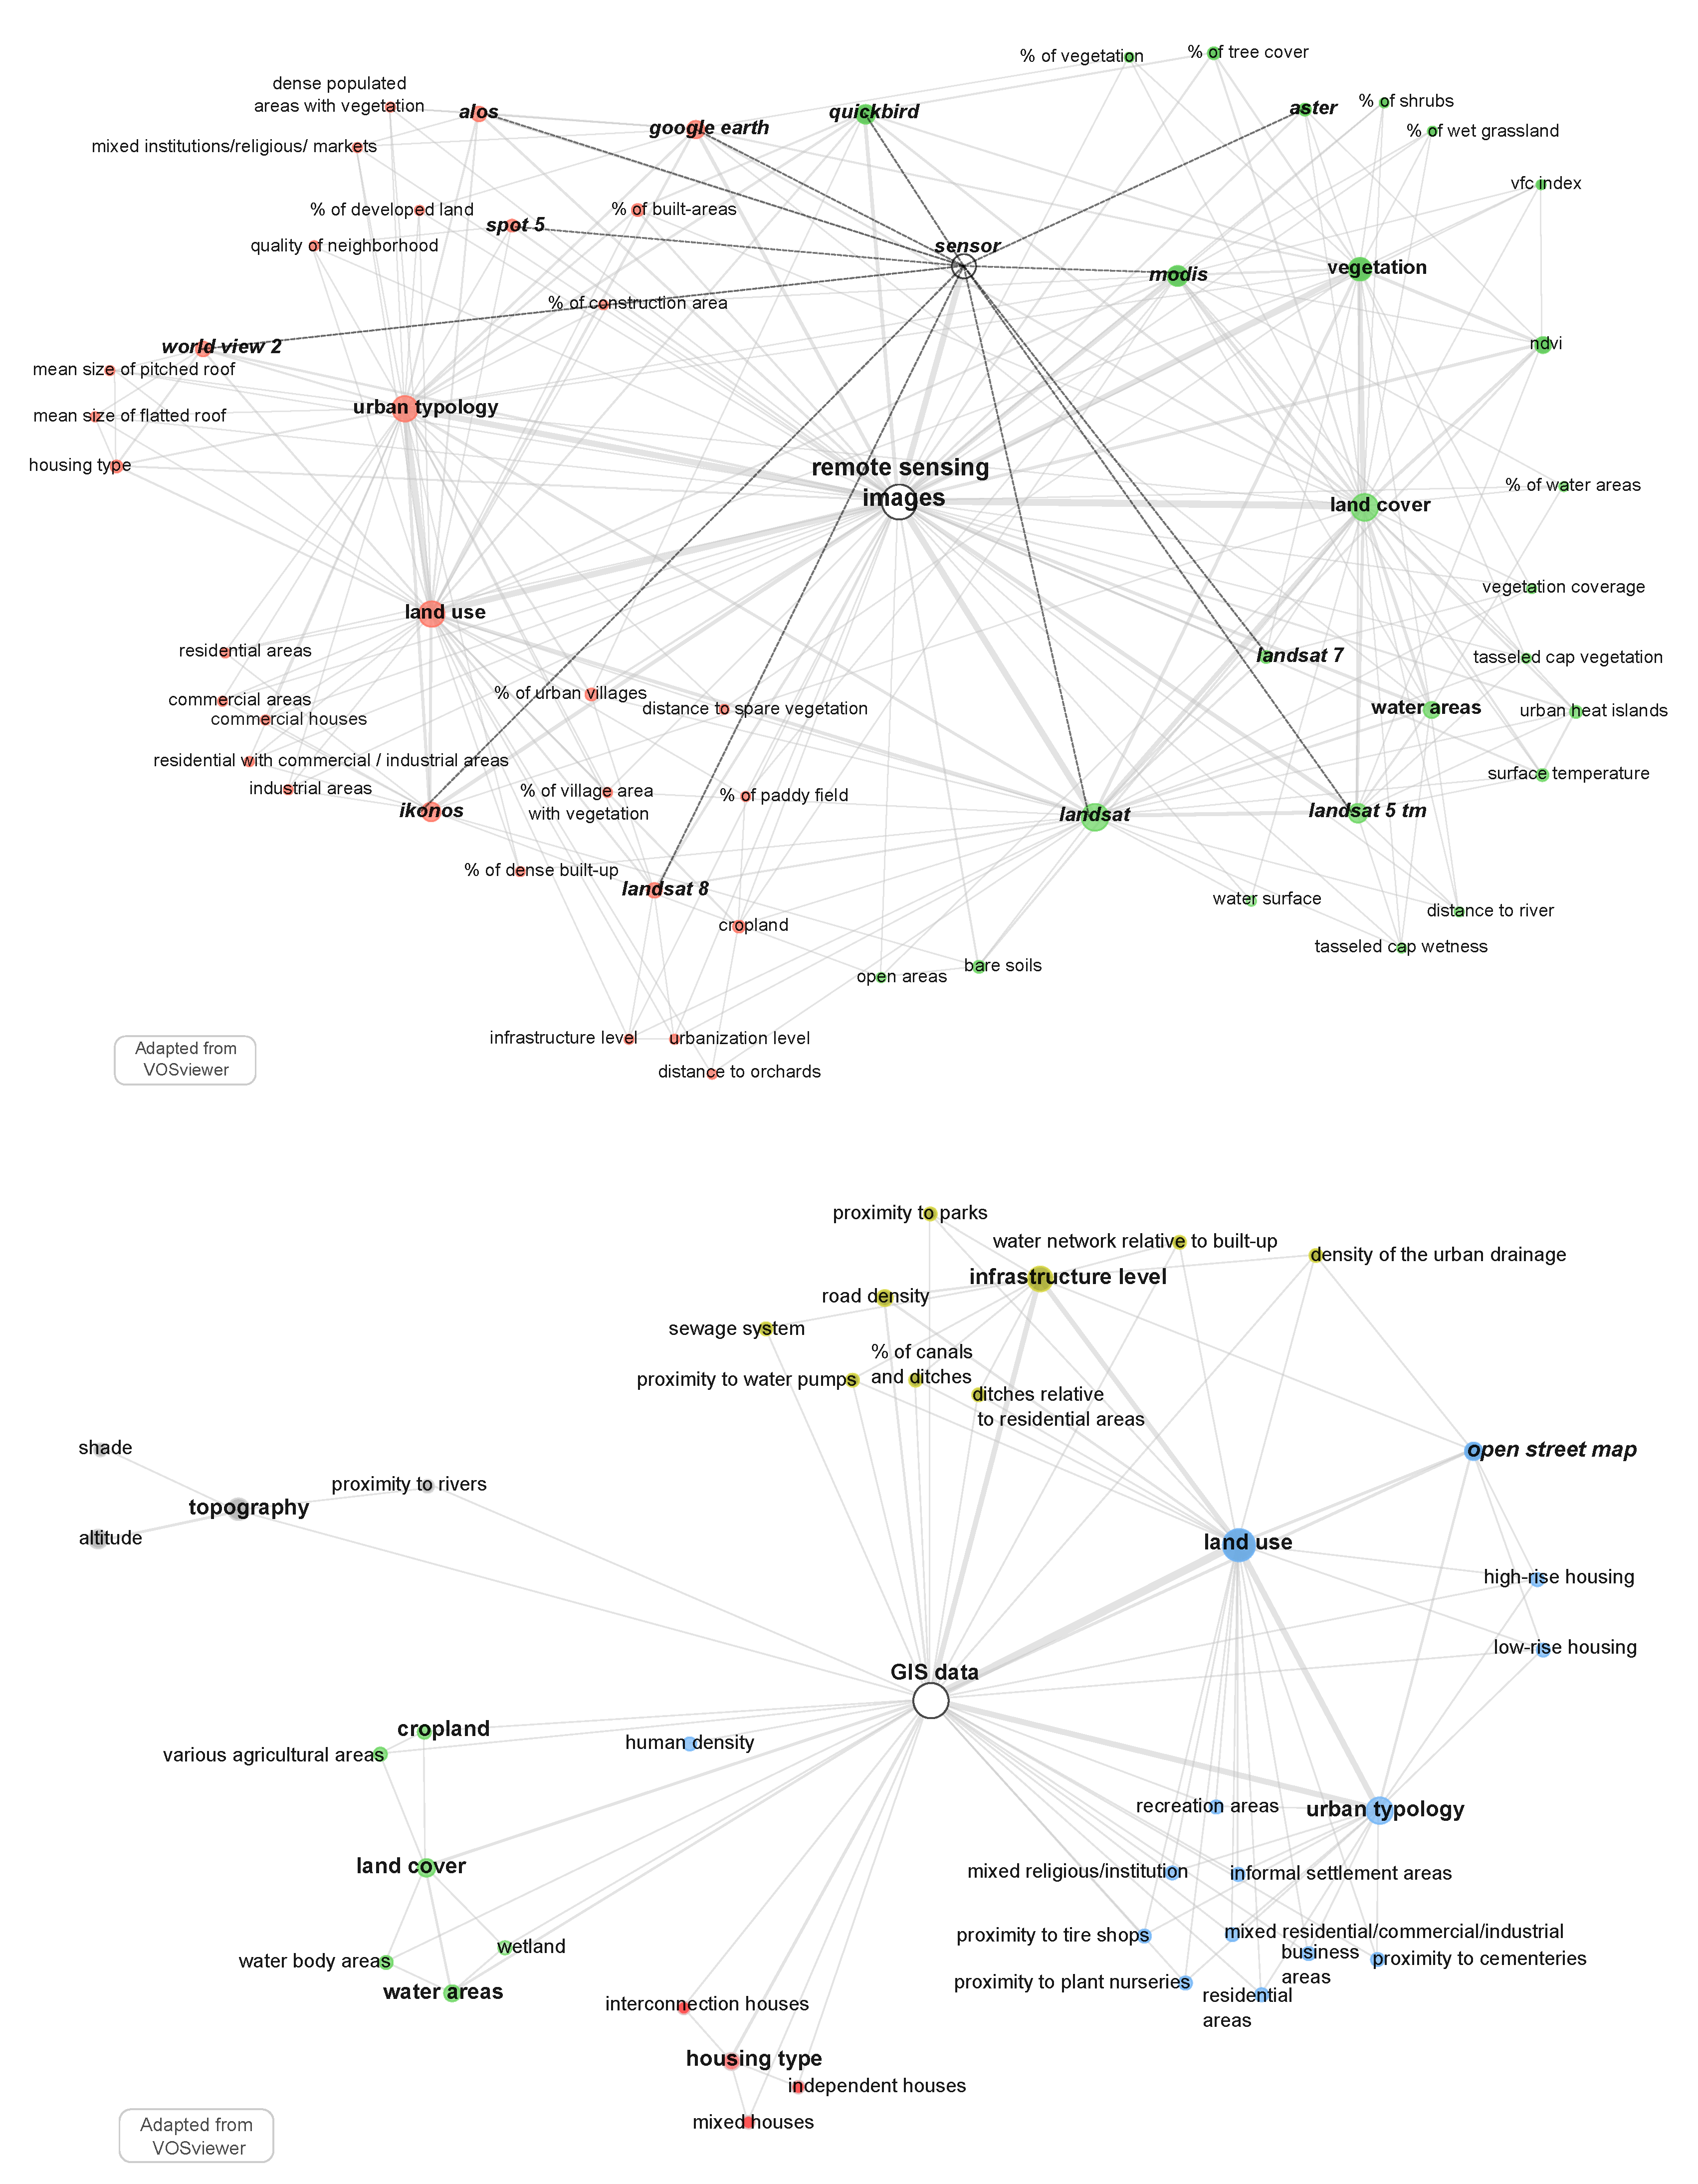
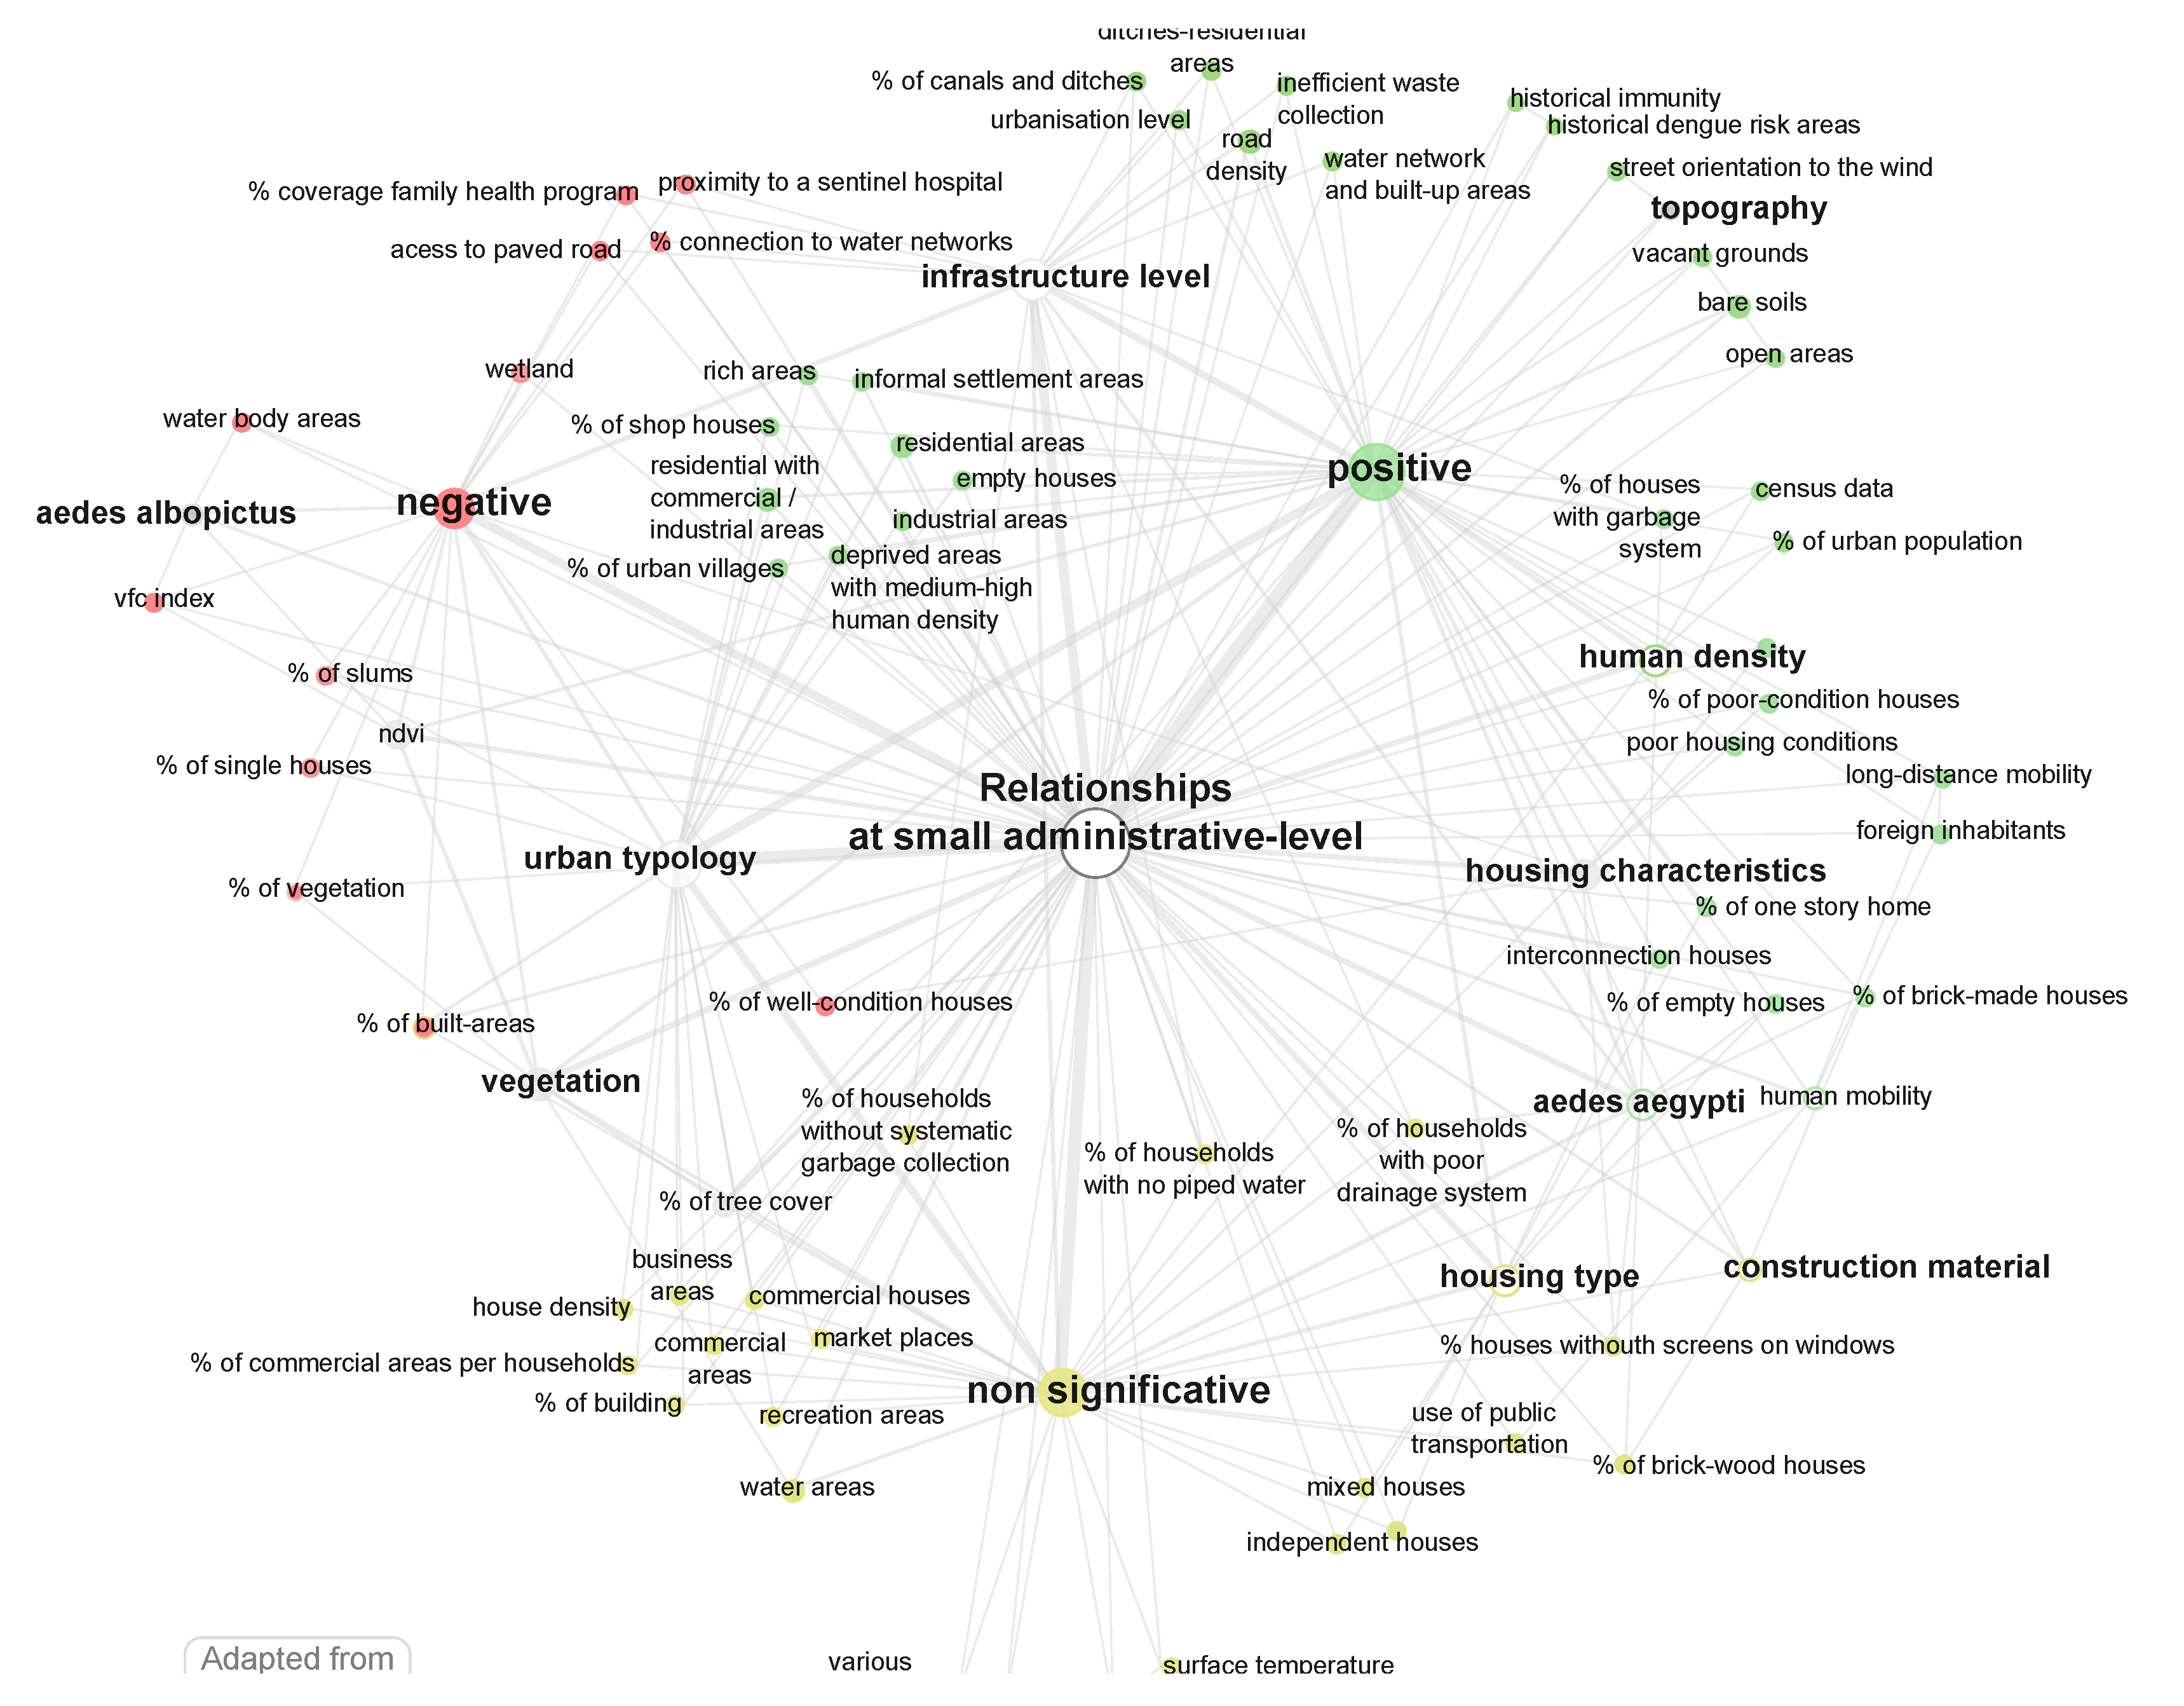
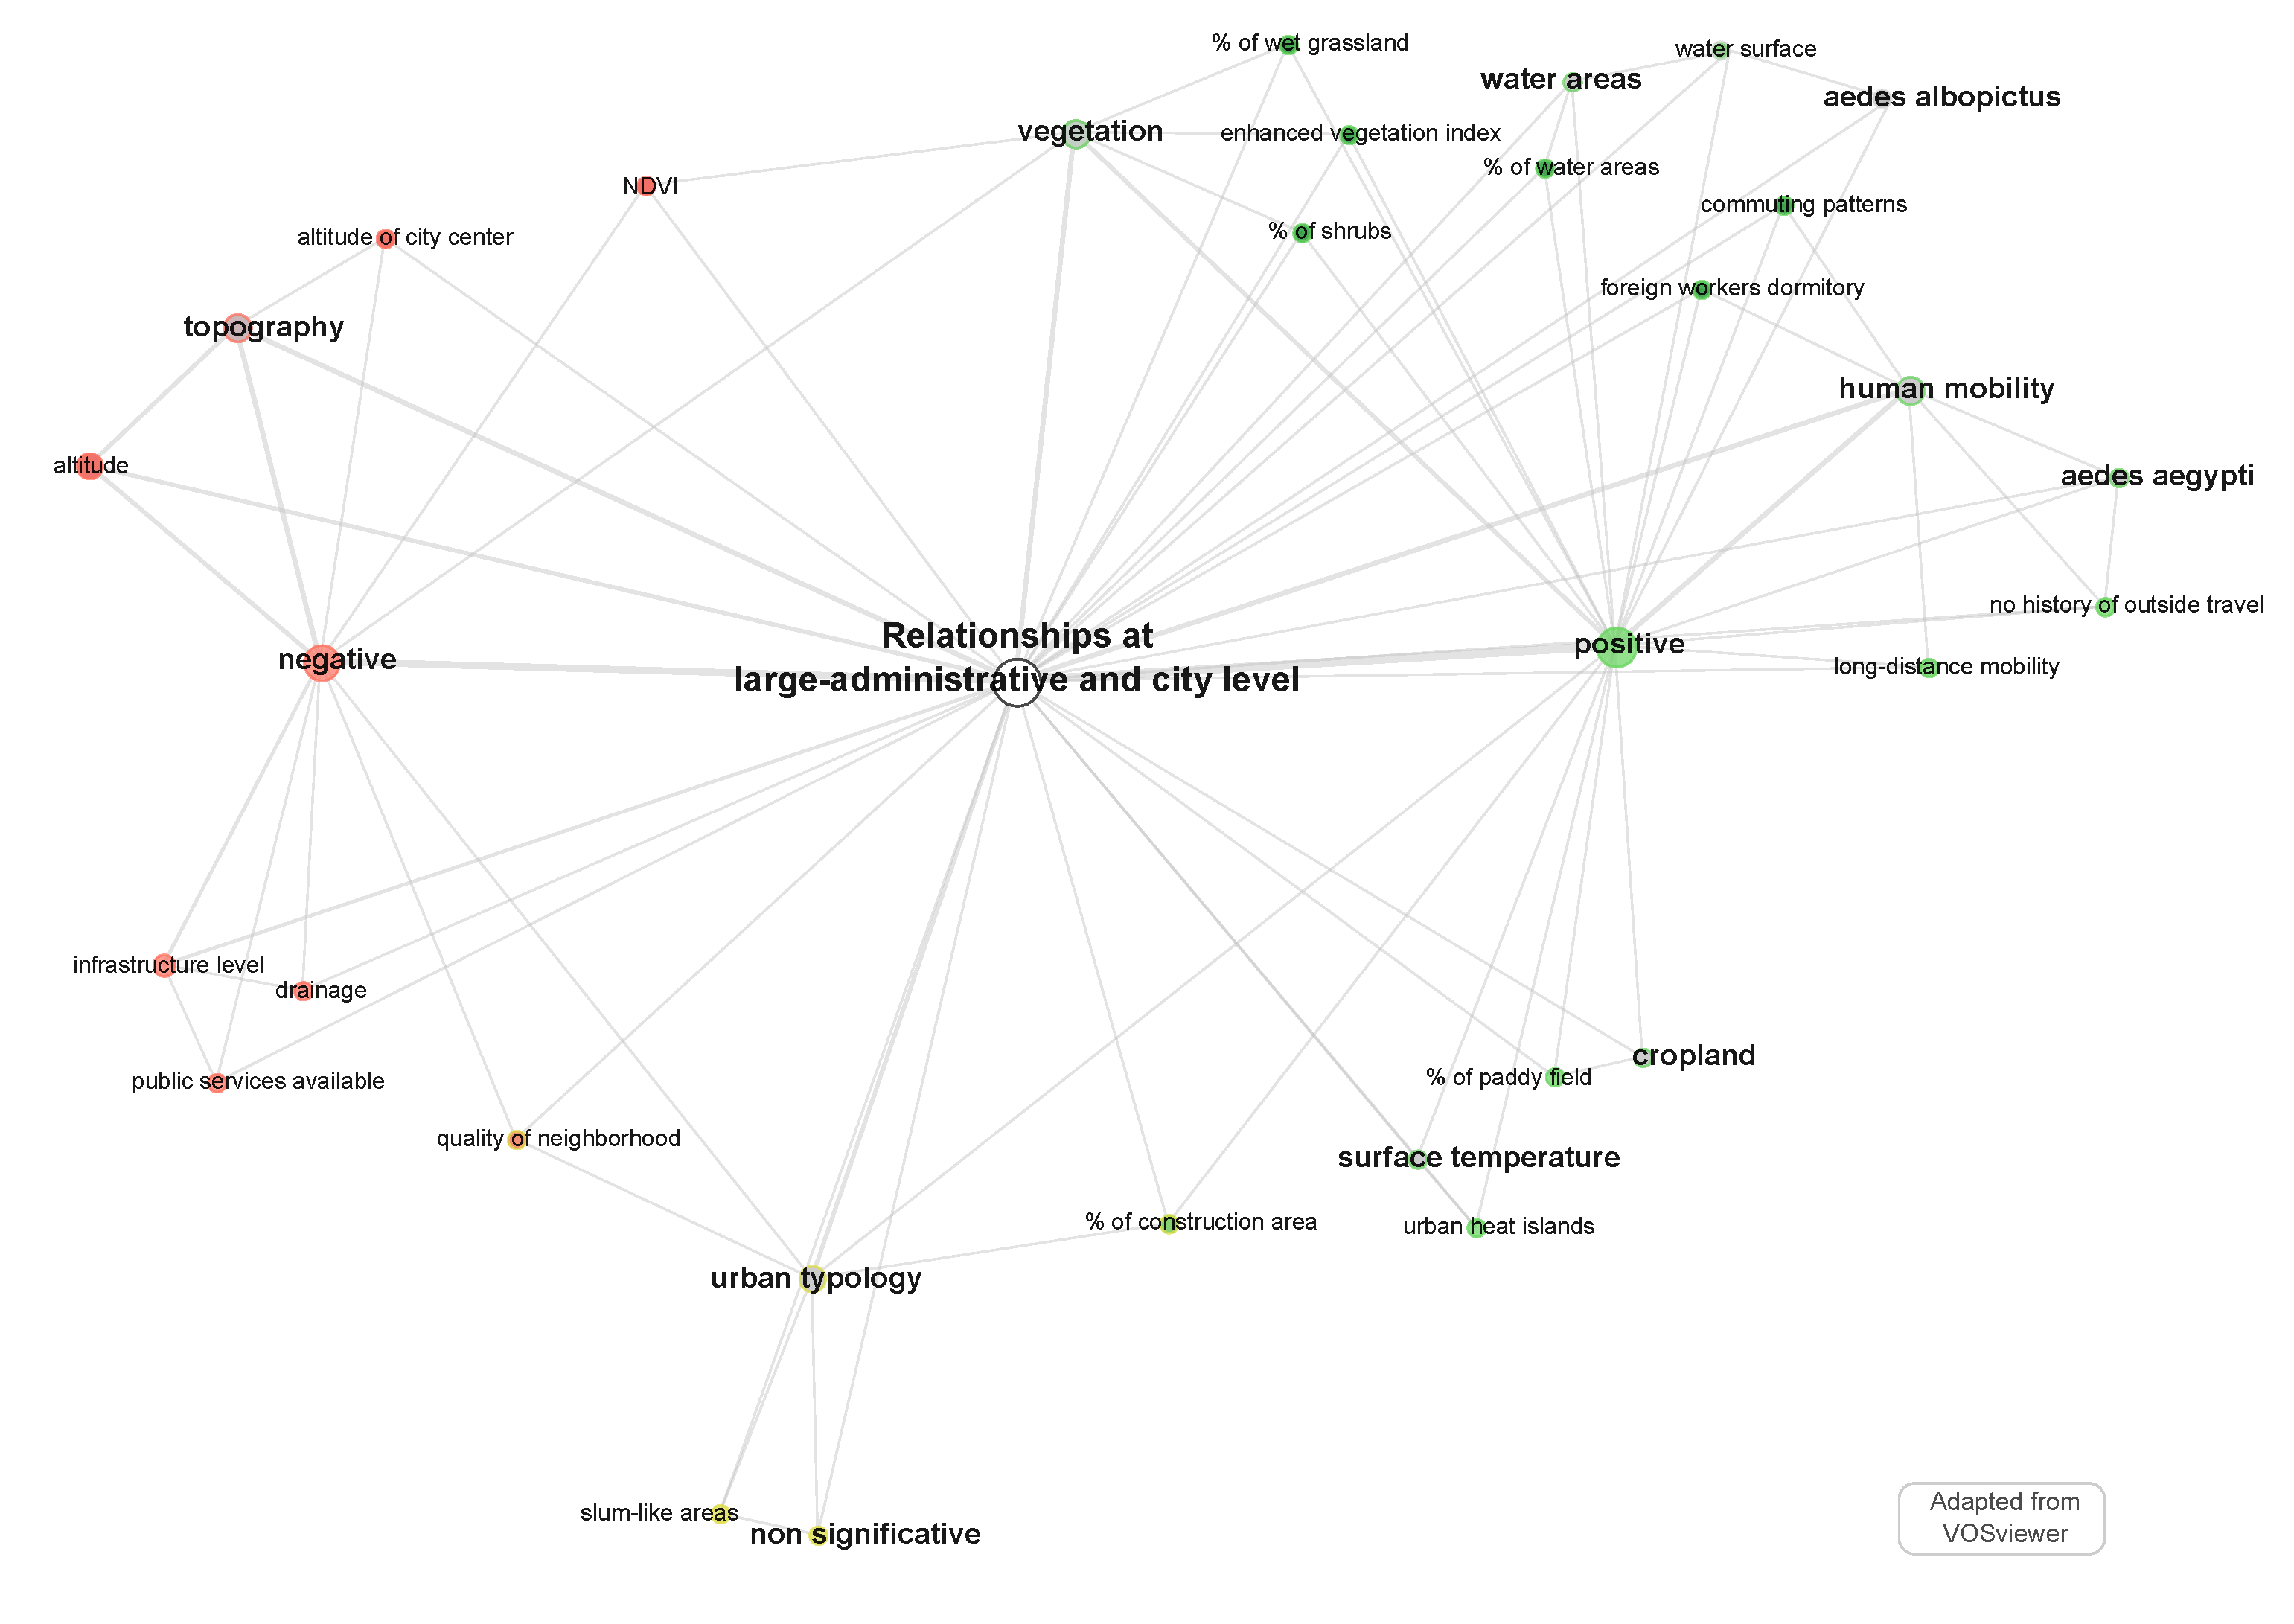
- “RS images” are strongly connected to the “land cover” properties of the environment, while “survey questionnaire” is strongly connected to “housing characteristics”, “housing type”, “construction material” and “entomological observation”. “GIS data” sources are both connected to “remote sensing images” and “survey questionnaire”, highlighting its interface position as a bridge between human geography approaches and digital geography (e.g., [55]);
- “GIS data” connect well to the “land use” characteristics of the environment, the “infrastructure level” and the “typology” of the urban area. It is noteworthy that the node “Aedes aegypti mention” is at the centre of the network, which shows that entomologist information relative to the 78 included studies, centred on observed dengue cases, are coming from a knowledge base of the mosquitoes rather than direct observations. Entomological observations concerning Aedes aegypti and albopictus, considered together or separately, belong to the “survey questionnaire” cluster, while Aedes aegypti and Ae. albopictus mentions belong to “remote sensing image” or “GIS data” clusters (Figure 4);
- Considering the publication year associated with the data source (Figure 4), it is noteworthy that “survey questionnaire” and “entomological observations” are associated with the oldest publications, and “remote sensing” and “GIS data” with the most recent. However, the “remote sensing images” cluster is associated with the 2000–2015 period satellite missions (Landsat 5–7, MODIS, IKONOS, ALOS), and not to the most recent ones (e.g., Sentinel missions, except for id: 41). Satellite imagery and GIS data have been used to complete and contextualize some survey questionnaires in multi-sources studies, e.g., Google Earth images used for photo-interpretation (ids: 20, 57), normalized difference vegetation index (NDVI) index and urban characteristics (id: 50), or GIS data used to localize entomological observations (ids: 24, 58) or altitude associated with the mosquitoes’ environment (ids: 21, 34, 44, 64);
- By jointly using remote sensing and GIS data sources, some authors were able to describe both land use and land cover properties of the study area, e.g., vegetation index and urbanization level (id: 10), road network density and aging infrastructure (id: 14), bare soil detection and building type (id: 19), urban typology (“Urban Park”) and vegetation cover through NDVI index (id: 29), “urban village” and NDVI index (id: 51).
- “Land cover” is characterized by:
- -
- surface temperature (ids: 3, 42, 47, 76);
- -
- detection of buildings through the brightness index (id: 56);
- -
- vegetation cover through NDVI and VFC (ids: 3, 10, 29, 36, 42, 44, 45, 47, 51, 56, 69, 76, 78);
- -
- water areas (ids: 14, 36, 41, 47, 56, 66, 67), and cropland (id: 36).
- “Building” is characterized by roof shape (id: 54), density (ids: 31, 41, 57, 69, 70), and surroundings based on density and distance from other land cover/use classes, e.g., vegetation (ids: 31, 56, 57, 67, 69, 70, 71), bare soil (ids: 19, 71), water-areas (ids: 56, 67, 71), cropland (ids: 36, 70), or road density (id: 36);
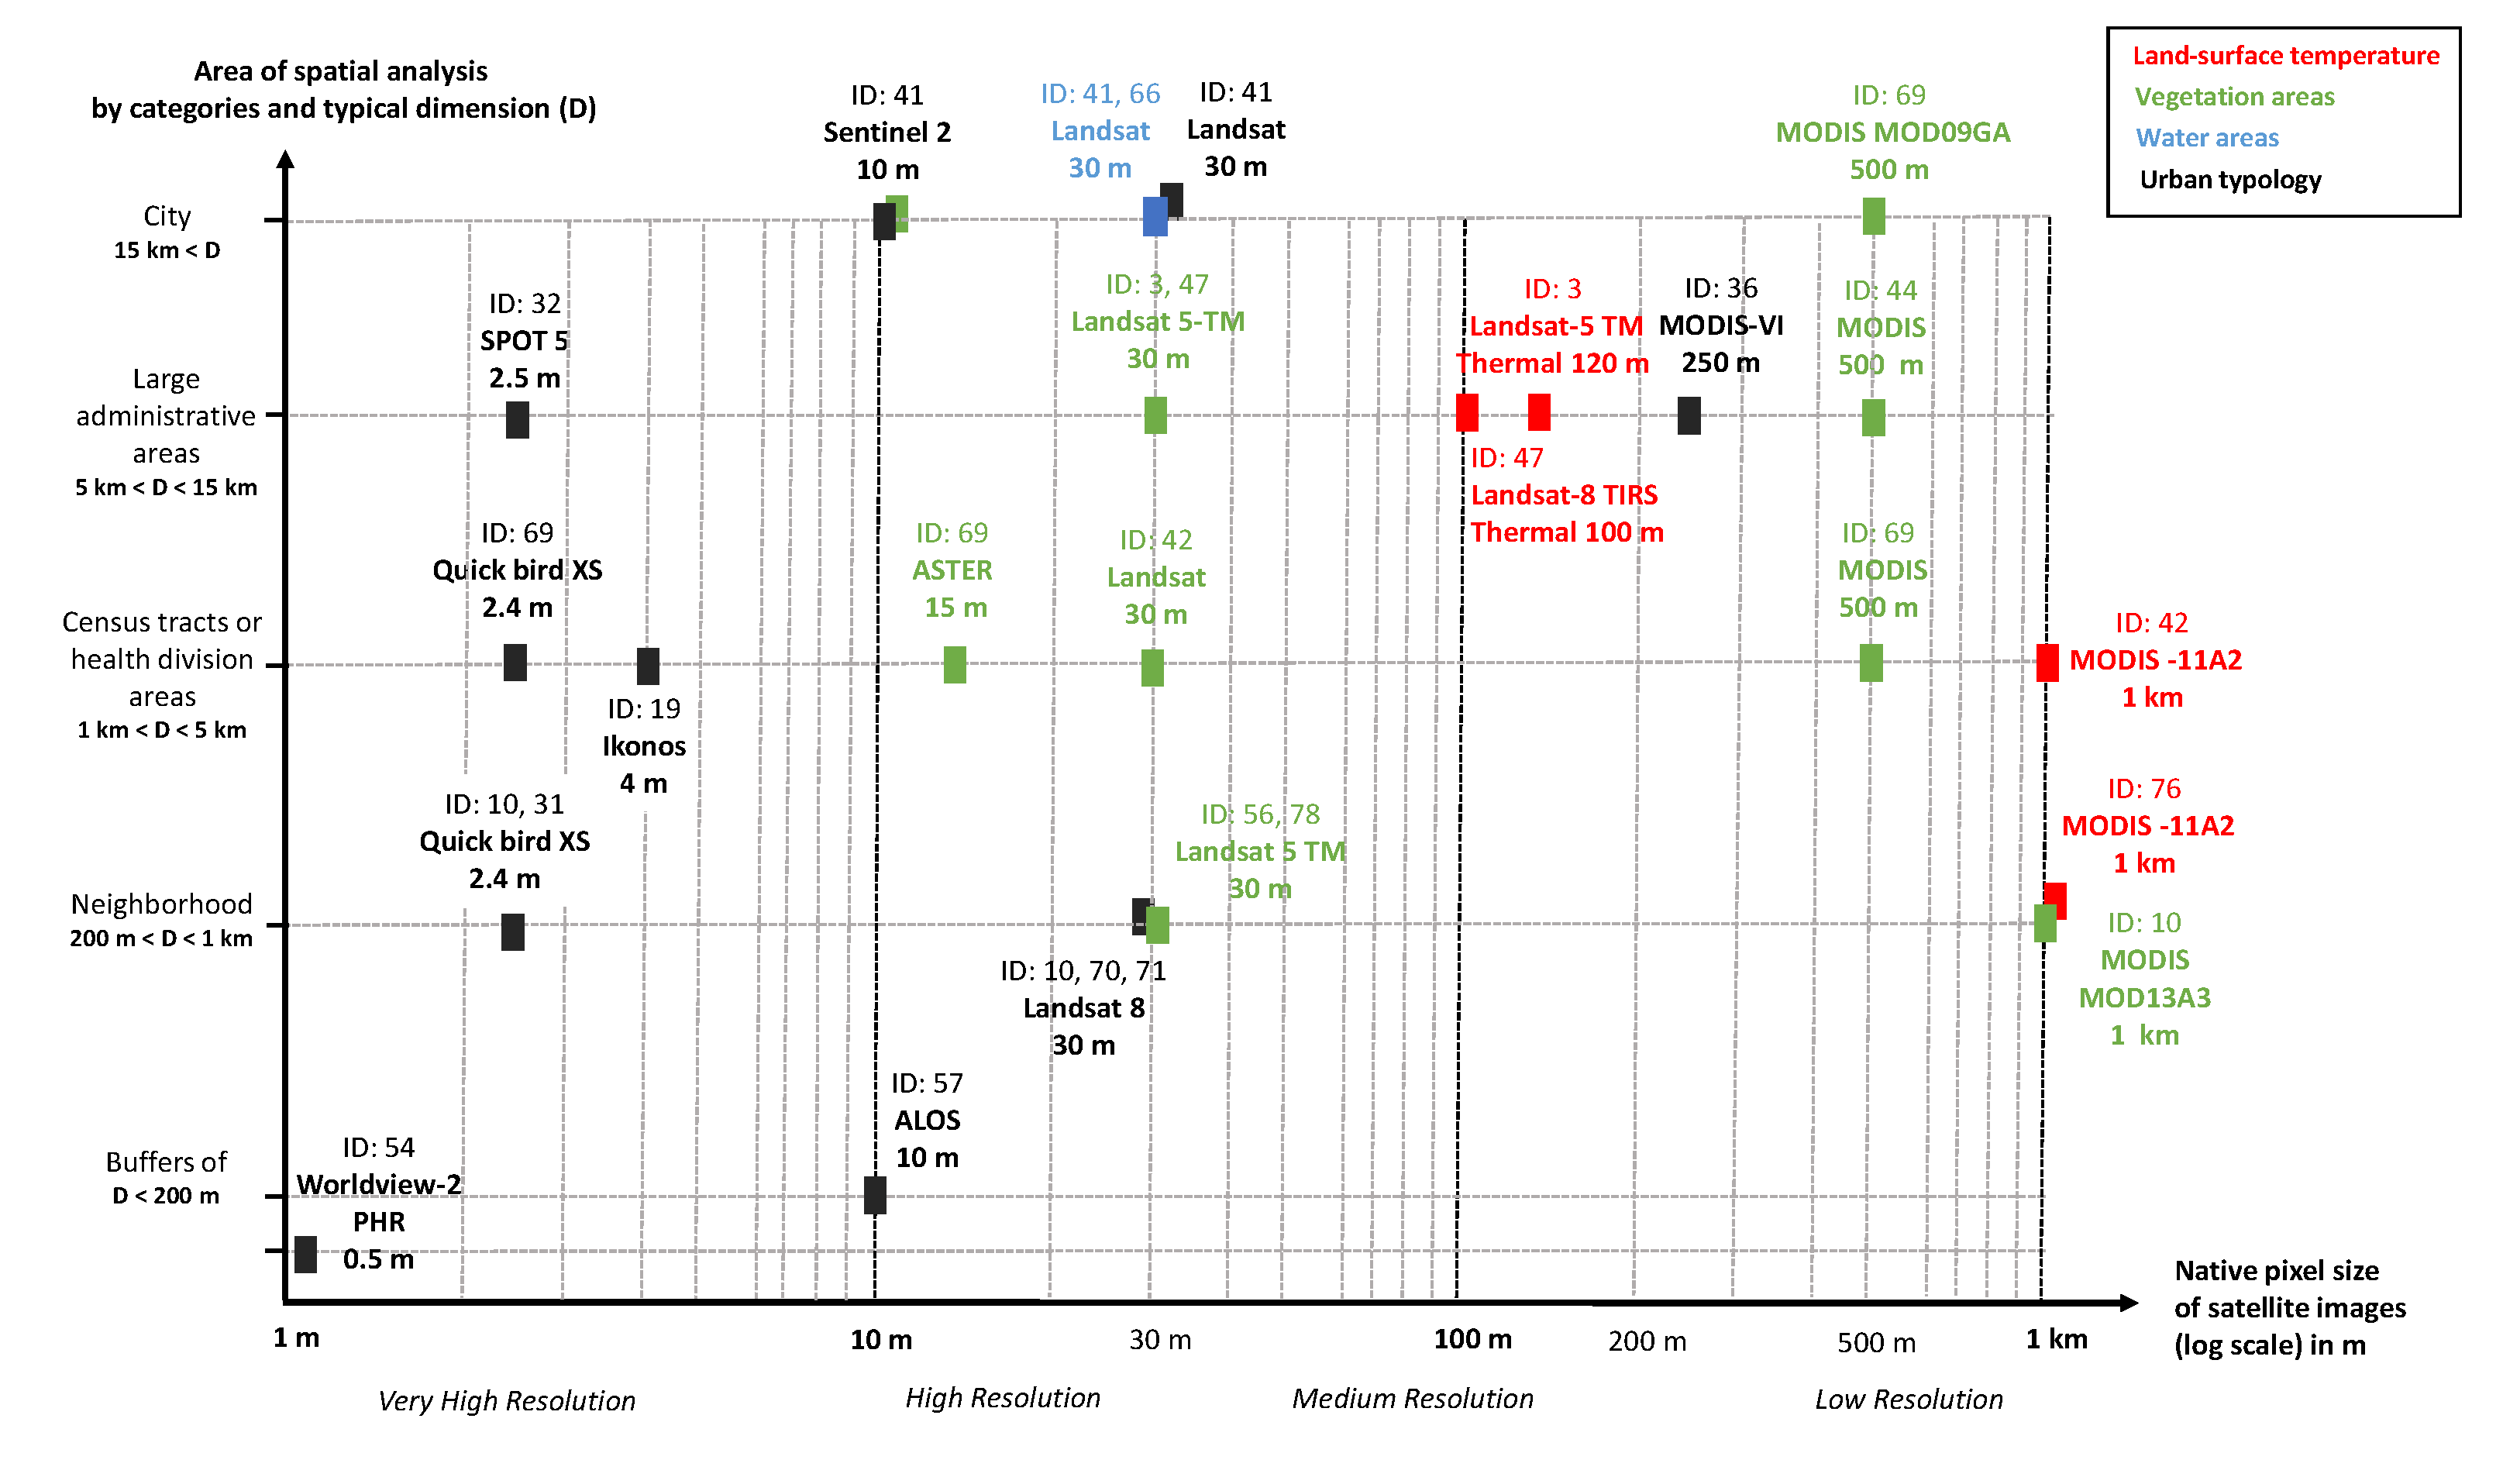
- “Land use” characterization is associated with high resolution sensors like Landsat 8 (30 m XS, id: 10) and ALOS (10 m XS, id: 57), and overall with very high resolution sensors like Ikonos (4 m XS, id: 19), Quickbird (2.4 mm XS, id: 10, 31, 69), WorldView 2 (0.46 m PAN, id: 54), Google Earth (Digital globe imagery, id: 20, 40) images, and Spot 5 (2.5 m PAN, id: 14, 32);
- “Land use” is thematically associated with “urban typology” and refers to the buildings function, e.g., residential, commercial, religious, industrial, or temporary construction (ids: 10, 19, 20, 57). Some authors define a local spatial index associated with the degree of urbanization and infrastructure of the area, e.g. the “percentage of urban villages” (ids: 10, 53), the percentage of “village area with vegetation” (id: 71), or the “quality of neighborhood” (id: 32).
- “urban typology” associated with (i) urban morphology with construction height, e.g. “high or low-rise housing” (id: 58), (ii) building function, e.g., “tire repair shops” (id: 18) (ii) area functions, e.g., “residential/commercial/recreation” areas (ids: 19, 23, 57), “informal settlement” areas (id: 23, 51), “Park” (id: 29) “cemeteries” (id: 18);
- “infrastructure level”, e.g., proximity to the hospitals (id: 1), water network connection (ids: 15, 18, 23), canal and ditches (id: 15), “road density” or “parks area”(ids: 10, 18, 37, 50, 51);
- “housing type”, e.g., connections between houses. Some authors also considered topographic data, like shade or altitude, which influence the Aedes presence;
- GIS Land cover data indicates the presence of water areas and wetland (id: 16), and cropland (id: 16, 29);
- “Human presence” is characterized by geocoded density (id: 7);
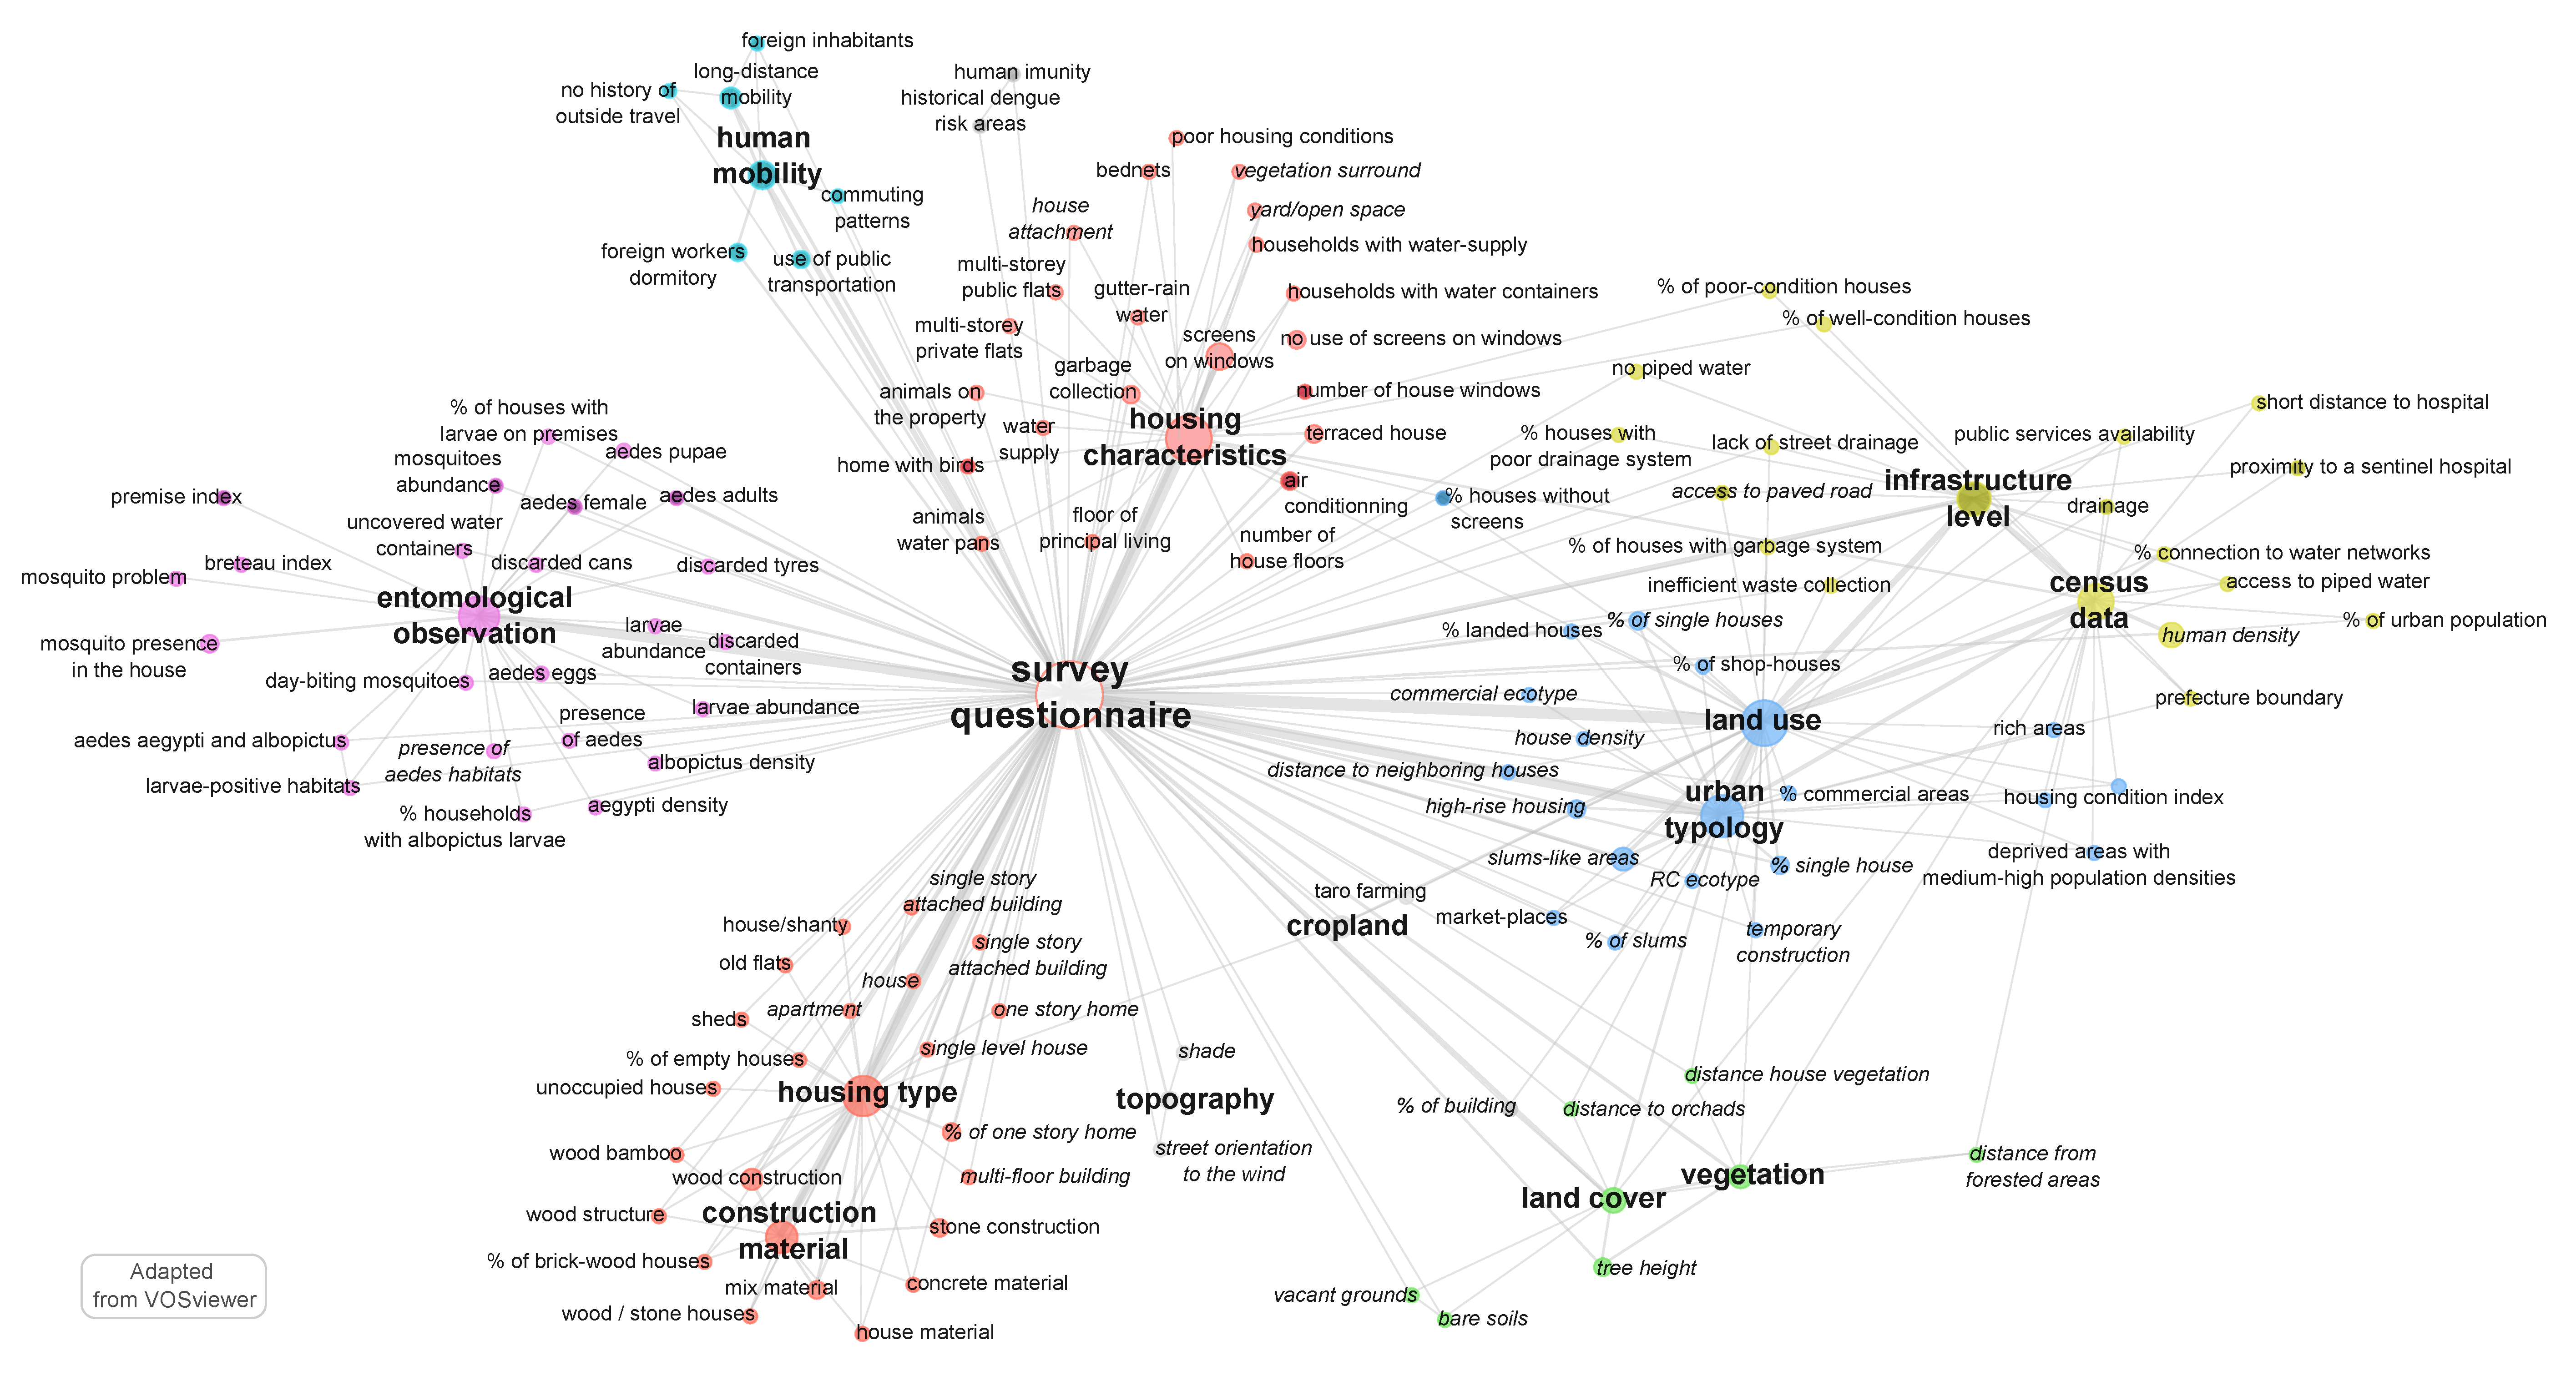
- housing type, with distinction between apartment, house, empty house, poor-condition house, old flat, sheds, shanty, villa with or without garden (ids: 2, 8, 13, 30, 38, 44, 48, 65, 74, 77), the number of storeys (ids: 26, 35, 46, 75, 77), and the construction material used to build the house: wood, stone, concrete, brick-wood, bamboo, or mixed material (ids: 4, 35, 55, 70, 71, 72, 73, 77);
- housing characteristics, by observing the presence/absence of: screens on the windows (ids: 4, 13, 26, 30, 35, 43, 65, 70, 73), shade in the patio (id: 30) house windows (id: 35), bednets (id: 71) air conditioning system (id: 9, 43), gutter rain water (id: 27), the connection to the water network or the presence of water containers (id: 8, 30, 43), the connection to a sewage system (ids: 8, 18, 68) or the collection of garbage and waste (ids: 8, 27, 30).
- land use through the characterization of (i) the urban typology, e.g., slum-like areas (ids: 3, 28, 65, 73), distinction between commercial, residential, landmarks (ids: 17, 35, 65, 74), neighbor proximity (id: 26) (ii) the infrastructure level, often derived from “census data”, e.g., street drainage (ids: 9, 21, 65), water network (ids: 17, 59, 62), garbage collection (ids: 17, 65), public services availability (ids: 21, 61, 62, 63), and access to paved road (id: 38);
- some scarce information about the land cover in the surroundings: (i) the presence and characteristics of the vegetation, e.g., distance to “vegetation”, “tree height”, or “forested areas” (ids: 26, 63, 71, 73, 75) (ii) the presence of “bare soil” or cropland (id: 4);
- the topography of the urban site with the observation of the shade (ids: 26, 73), or the orientation of the street relative to the prevailing wind (id: 27);
- human density (ids: 17, 44, 61, 62, 74, 77), in some cases associated to some socio-economic characteristics (id: 63), human mobility (ids: 11, 77), or commuting patterns (ids: 28, 74).
- direct mosquito observation at the different stages, through classical entomological (Breteau/house/container) index or self-defined index such as “number of females Aedes aegypti per person” (ids: 1, 4, 5, 6, 12, 24, 26, 28, 33, 34, 58, 59, 60, 68, 73);
- breeding and resting sites, e.g., discarded container, uncovered water container, standing water in various recipients (ids: 9, 20, 25, 30, 34), or premises index (id: 61).
4. Dengue–Landscape Relationship Modeling
4.1. Proxies According to the Geographical Units of Spatial Analysis
- ecological factors favorable to Aedes presence and development through direct entomological observations, or elements of the landscape favoring the presence of breeding-resting sites;
- probabilities of human exposure to Aedes bites at household-level through small-scale proxies associated to the housing type or its characteristics;
- probabilities of human-vector encounter considered at neighborhood, small and large administrative levels;
- virus conservation and diffusion through human mobility.
4.2. Statistical Models
5. Qualitative Relationships between Landscape Factors and Dengue Cases
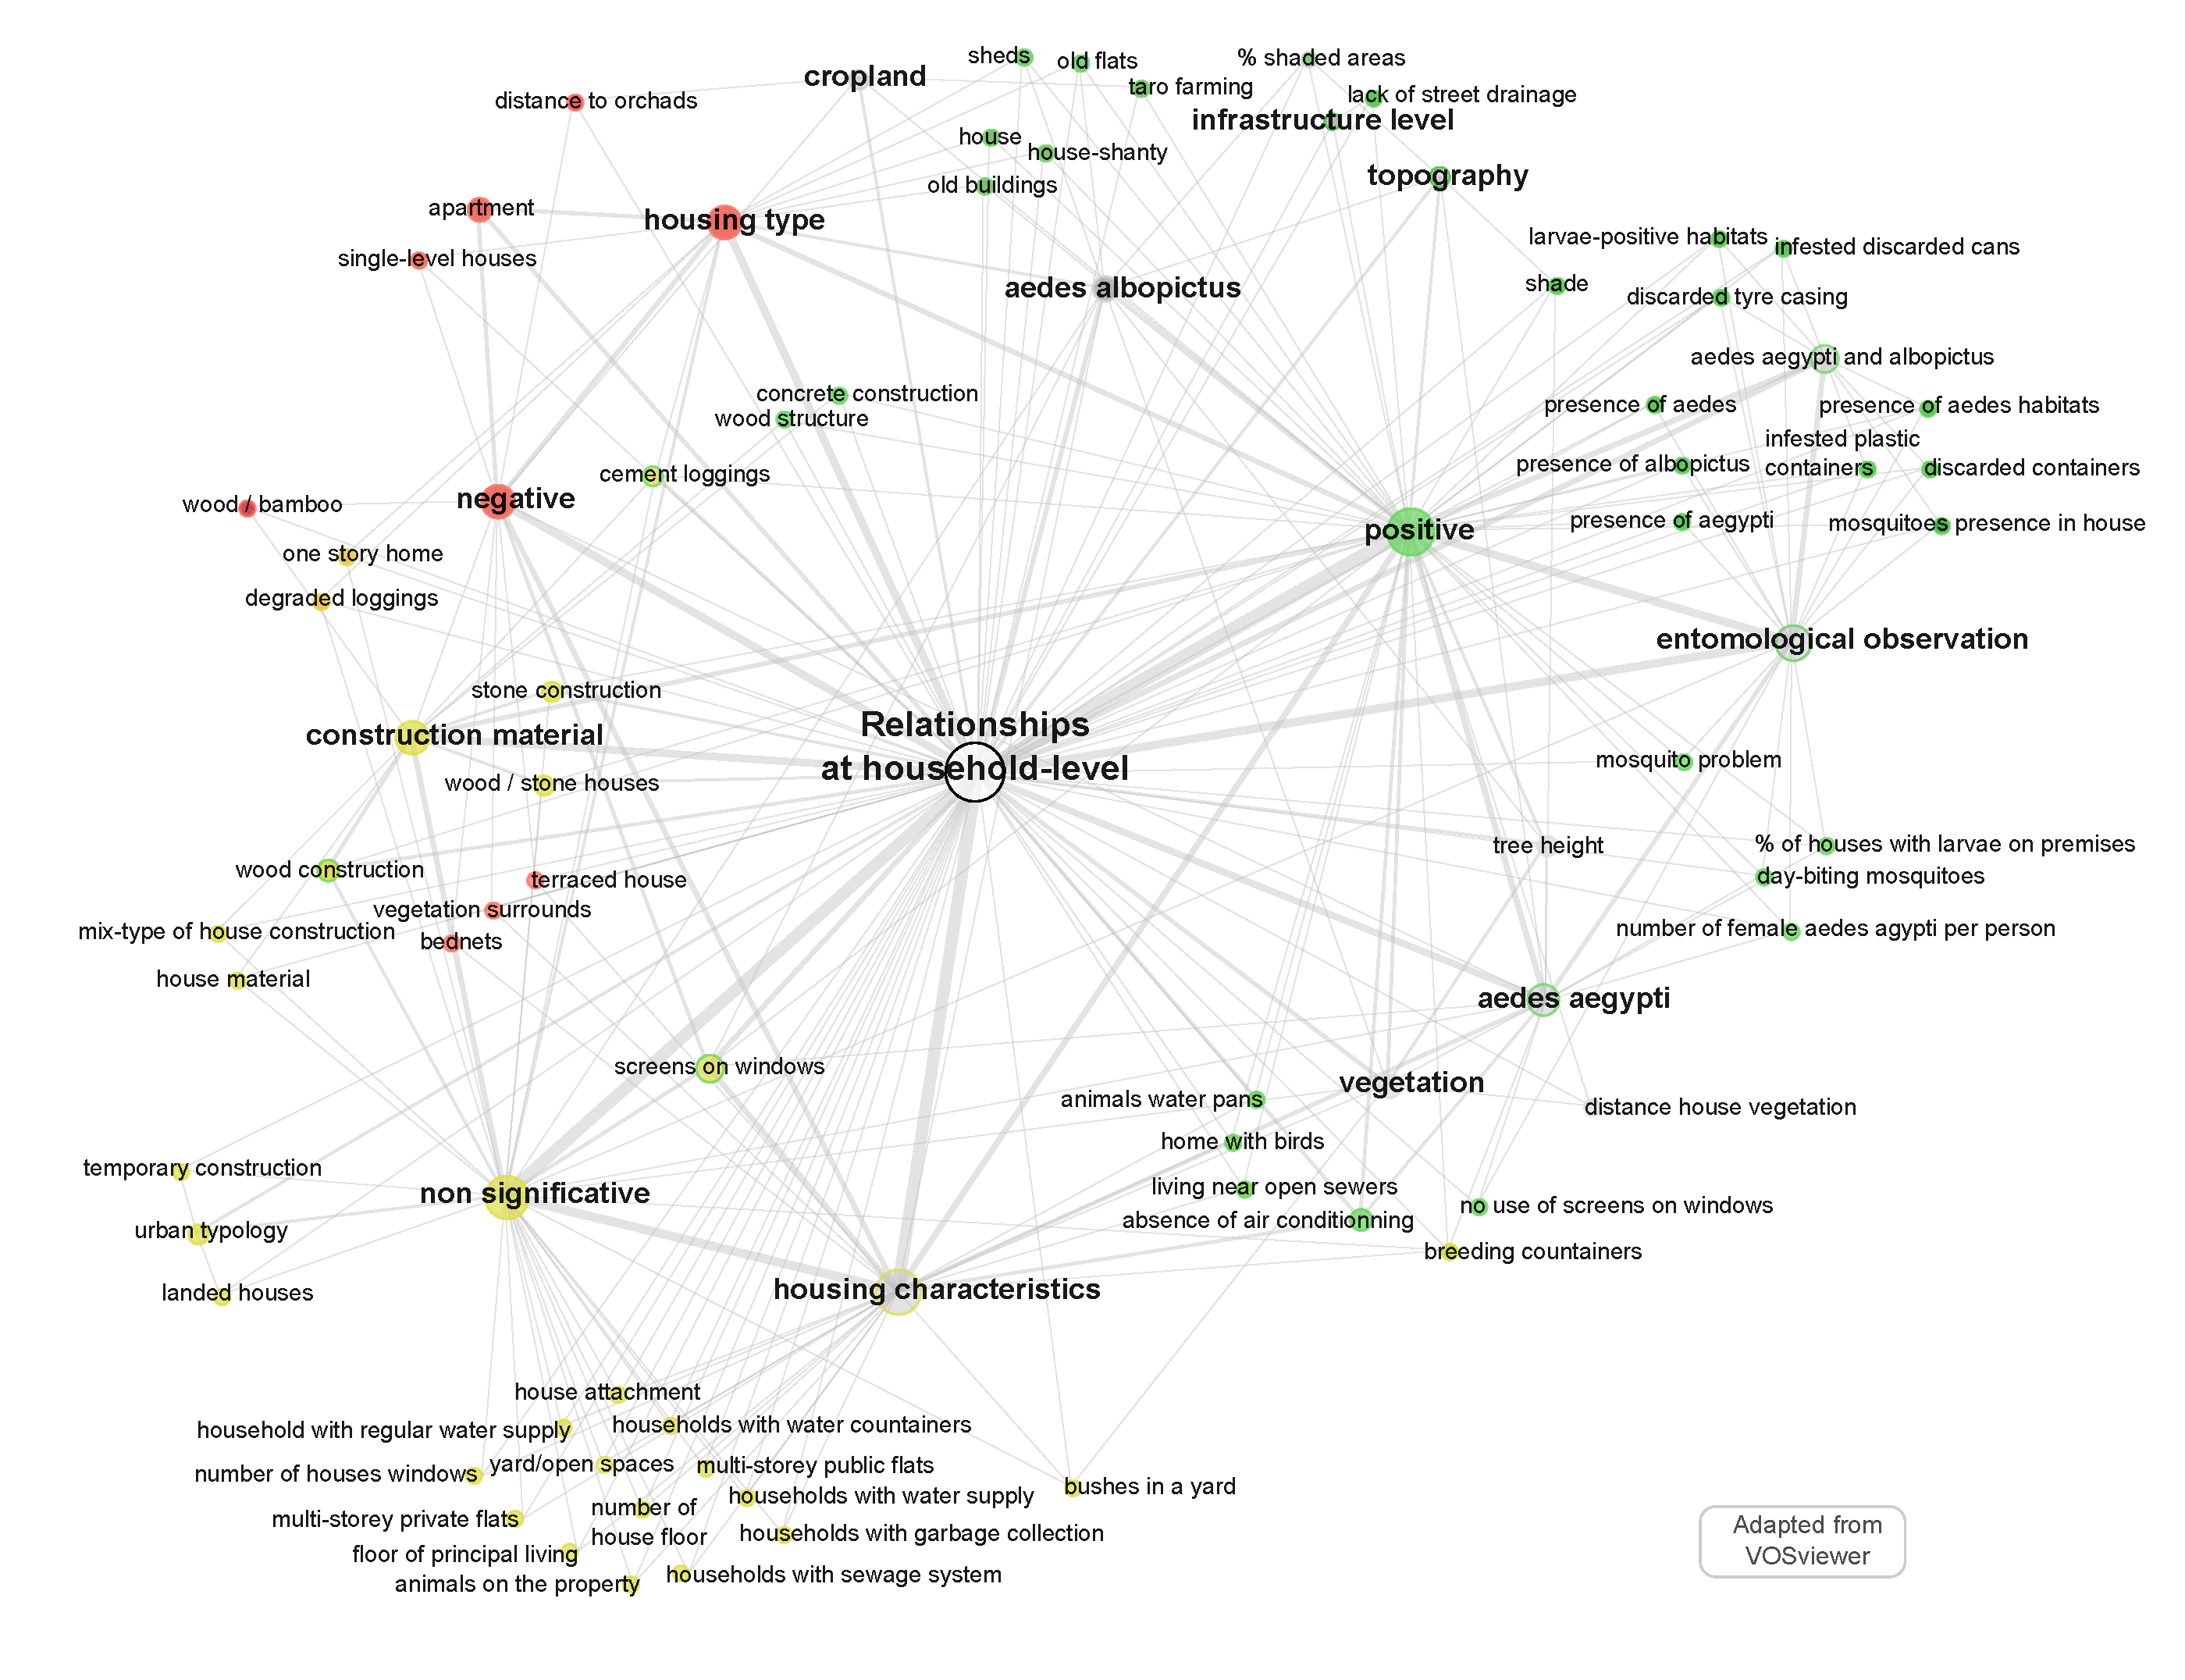
5.1. Mapping of Relationships at Household-Level
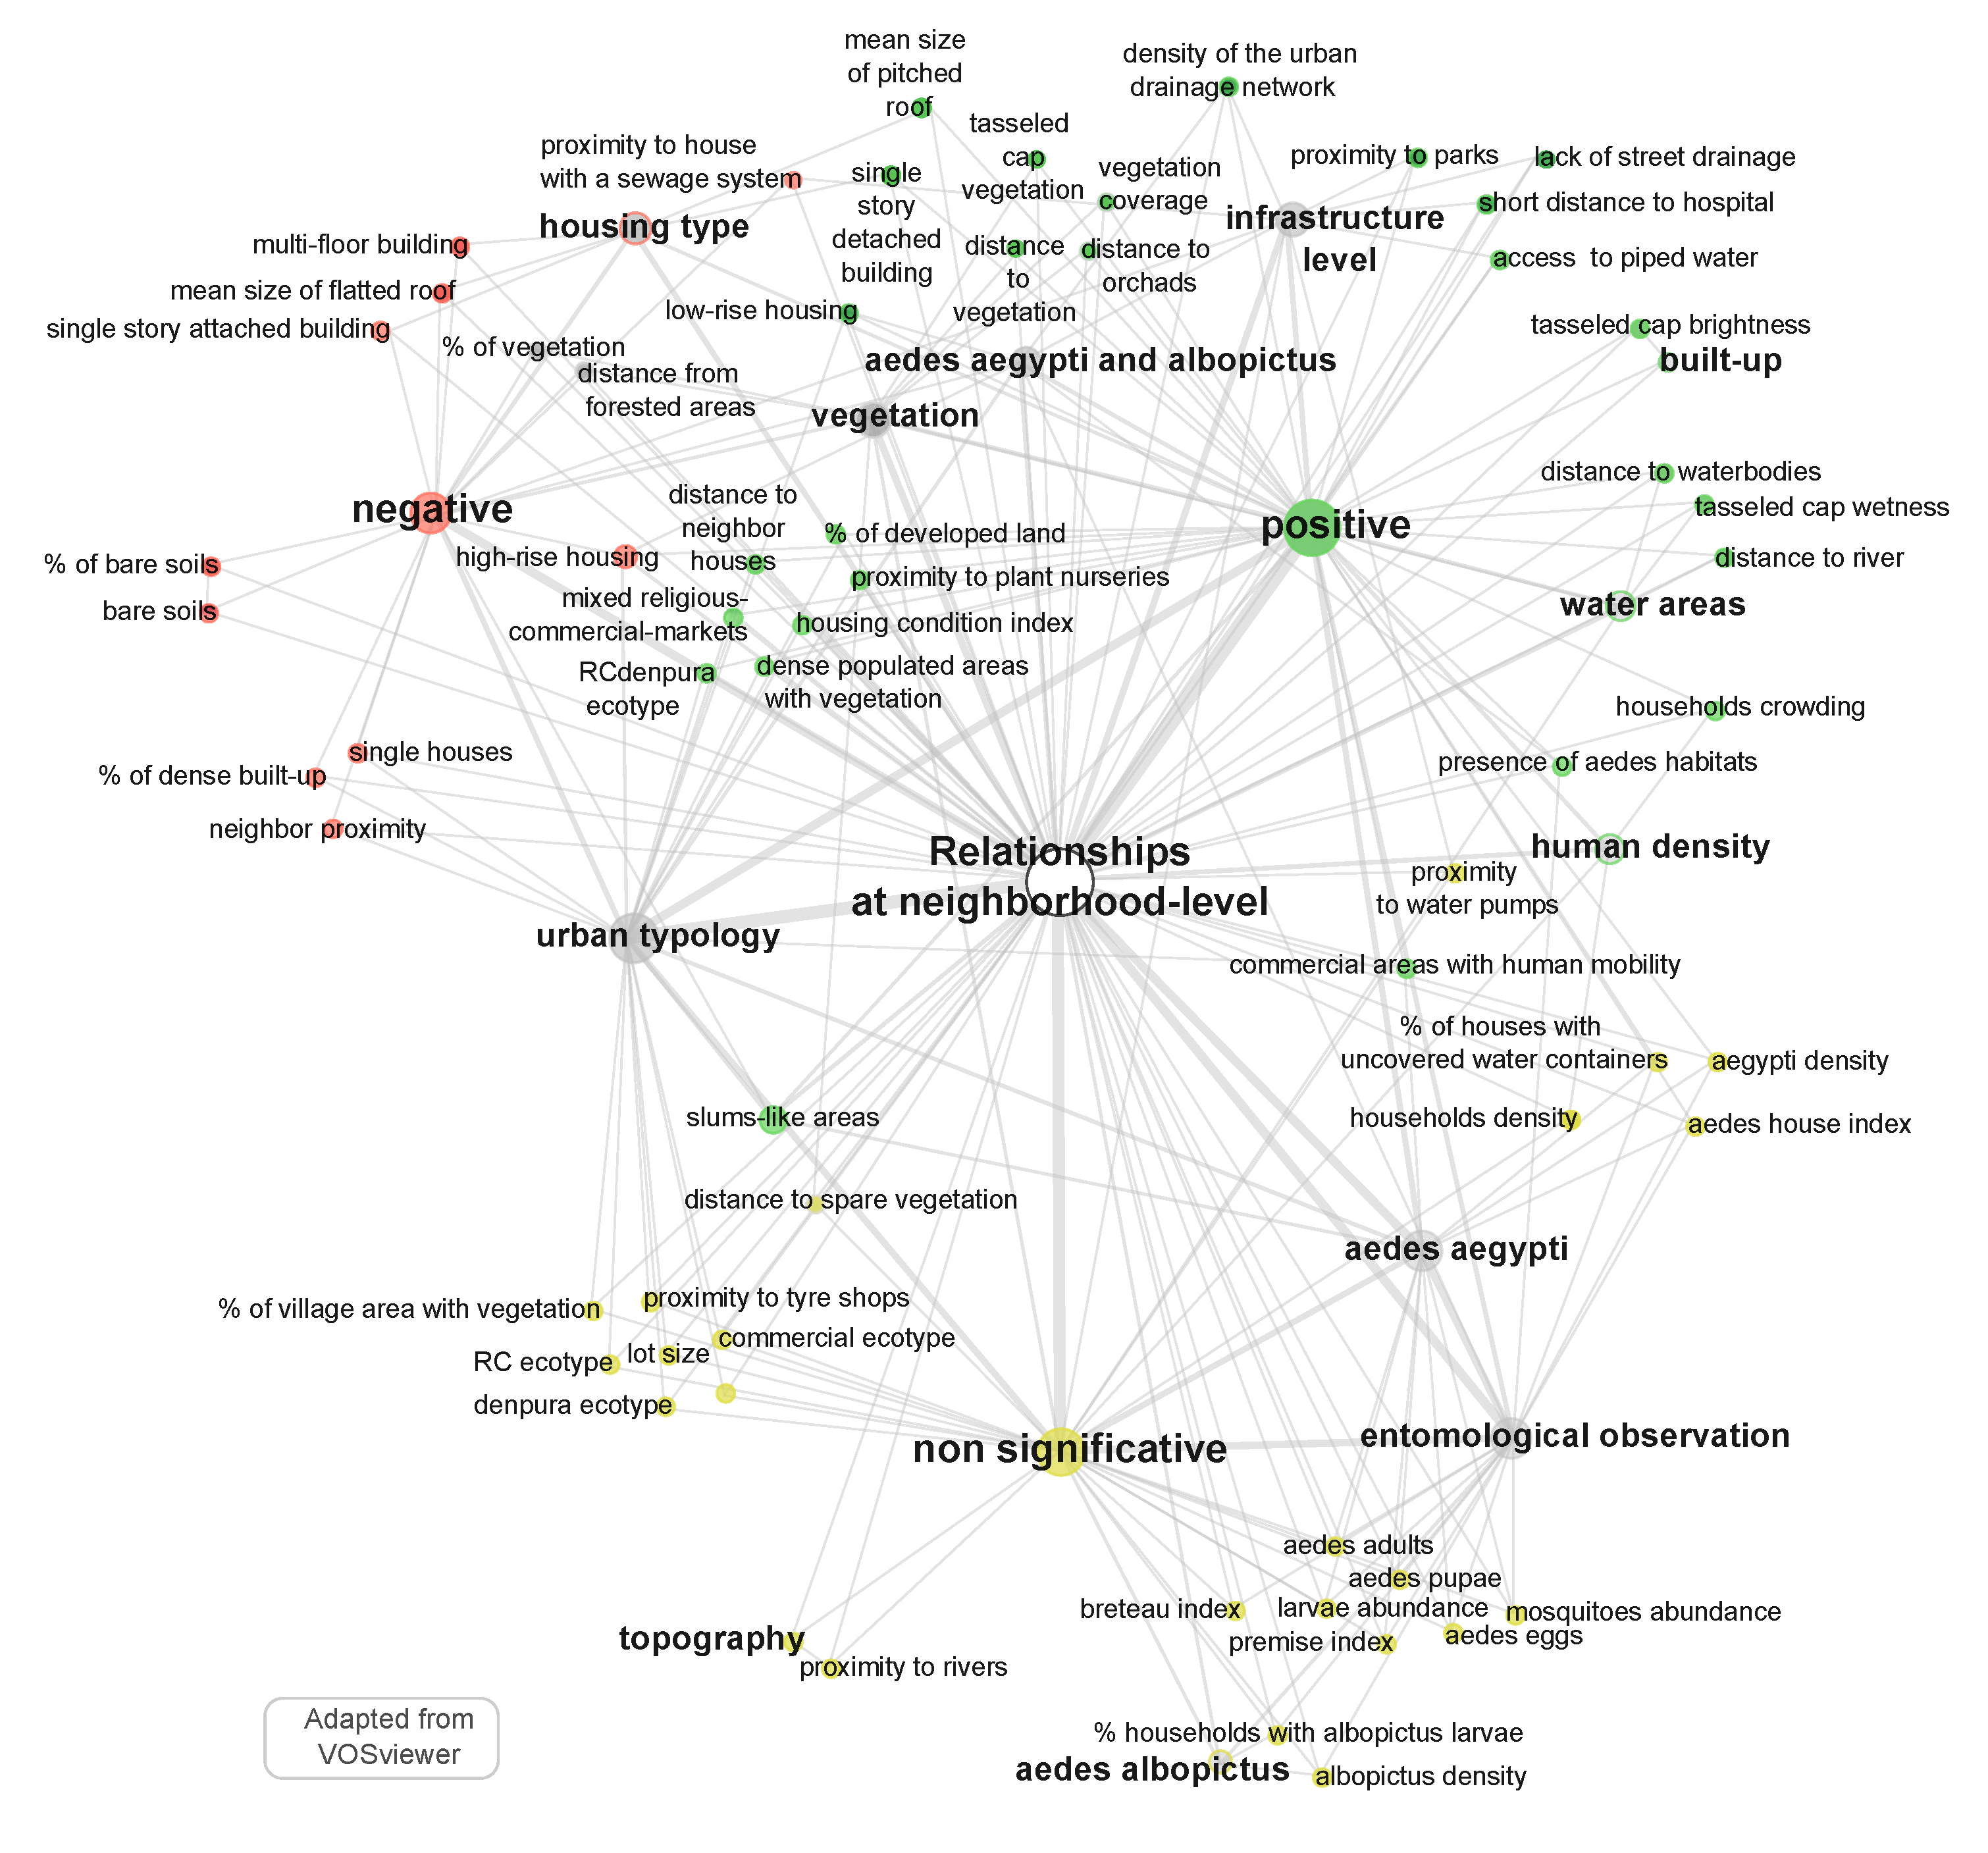
5.2. Mapping of Relationships at Neighborhood Level
5.3. Relationships at Administrative Units
6. Discussion
6.1. Methodological Considerations
6.2. Potential limitations in Dengue-Landscape Studies
6.2.1. Limitations Associated with Epidemiological and Entomological Data
6.2.2. The Difficulty in Defining a Geographical Unit of Spatial Analysis
6.3. Highlights and Perspectives to Improve the Frame of Urban Dengue-Landscape Relationships Studies
- the native pixel resolutions were often aggregated at a coarser resolution during the mapping production (Figure 11). Recent satellite missions should bring greater possibilities to fit spatial resolution and temporal windows over urban areas, for example the Copernicus Sentinel program ([103], Monitoring Urban Areas with Sentinel-2A Data), or on demand very high-resolution sensors ([104], Pléiades satellite potential for urban tree mapping);
- image processing was previously limited to spectral indices (NDVI, VFC), or some supervised pixel-based classifications mostly based on the maximum likelihood algorithm (ids: 57, 69, 70, 71). Only one study considered object-based classification for building extraction purposes (id: 77). Such approaches could benefit from methodological advances, especially from the urban mapping community—([105], Comparison of Deep Neural Networks, Ensemble Classifiers, and Support Vector Machine Algorithms) ([106], “Compared with the traditional rule-based and ML [Machine Learning] methods, the DL [Deep learning]-based classification method has significant advantages in terms of classification accuracy, especially in complex urban areas”) ([47], Google Earth Engine Platform), ([107], VHR and landscape-structure heterogeneity), ([108], Urban change detection), ([109], Street-level imageries) ([110], VHR images and slums detection);
- two studies have exploited the thermal sensors from Landsat-TM and MODIS instruments, and used them to retrieve land surface temperature (LST) parameters (ids: 3, 19). This is particularly useful to detect urban heat islands that could indicate improved conditions for Aedes viability and dengue virus replication, due to the potentially amplified higher temperatures (typically greater than 30 C), and resulting in a reduction of the extrinsic incubation period from 12–14 days to 7 days ([111], id: 3). New thermal sensors with higher spatial resolution may promote consideration of thermal sensors, such as the CNES-TRISHNA mission [112,113], even if methodological issues remain: that is, hotspot effects, separation of temperature and emissivity parameter.
- dengue is often spread in tropical or subtropical regions, where the presence of clouds and cloud shadows result in missing data in optical images. Synthetic aperture radar SAR images could penetrate such barriers and might be combined with optical sensors for overcoming this issue. Such an approach to optical and SAR fusion has been applied in the studies of malaria [114,115];
- from high-resolution built-up area detection, population growth estimation due to urbanization could be assessed, improving the estimation of census and incidence rates [120,121]. In this regard, only one article proposed a proxy for a spatially-corrected population density by digitizing and excluding inhabited areas (id: 24). To improve the population density assessment, cities should be considered in their verticality and volume, through the use of a digital height model, potentially generated from unmanned or satellite remote sensing stereo imagery [122,123,124];
7. Conclusions
Supplementary Materials
Author Contributions
Funding
Acknowledgments
Conflicts of Interest
Appendix A. Raw Descriptive Tables of the 58 Included Articles
Appendix A.1. Identification and Localization Table of the 58 Included Articles

| ID [Ref.] | Publication Meta-Data | Geographical Context | |||||
|---|---|---|---|---|---|---|---|
| First Author | Date | Title | Journal | Country | City | Geographic Units of Spatial Analysis | |
| 1 [135] | Ali | 2003 | Use of a geographic information system for definin | The American journal of tropical medicine and hygiene | Bangladesh | Dhaka | 8820 Households (within 90 wards) |
| 2 [136] | Al-Raddadi | 2019 | Seroprevalence of dengue fever and the associated | Acta Tropica | Saudi Arabia | 4 cities:Makkah, Al Madinah, Jeddah, and Jizan | 6397 Households |
| 3 [137] | Araujo | 2015 | Sao Paulo urban heat islands have a higher incidence of dengue than other urban areas | The Brazilian Journal of Infectious Diseases | Brazil | Sao Paulo | Districts |
| 4 [138] | Ashford | 2003 | Outbreak of dengue fever in Palau, western pacific: risk factors for infection | The American Journal of Tropical Medicine and Hygiene | Palau | 5 hamlets of Palau | (270) Households |
| Koror and five hamlets of Palau | (189 of 865) Households | ||||||
| 5 [139] | Barbosa | 2010 | Spatial Distribution of the Risk of Dengue and the Entomological Indicators in Sumaré, State of Sao Paulo, Brazil | Revista da Sociedade Brasileira de Medicina Tropical | Brazil | Tupa | Neighborhoods |
| 6 [140] | Barbosa | 2014 | Spatial Distribution of the Risk of Dengue and the Entomological Indicators in Sumaré, State of São Paulo, Brazil | PLOS Neglected Tropical Diseases | Brazil | Sumare Sao Paulo state | Neighborhoods |
| 7 [141] | Barrera | 2000 | Estratificación de una ciudad hiperendémica en dengue hemorrágico | Revista Panamericana de Salud Pública | Venezuela | Maraquay | (349) Neighborhoods |
| 8 [142] | Braga | 2010 | Seroprevalence and risk factors for dengue infection in socio-economically distinct areas of Recife, Brazil | Acta Tropica | Brazil | Recife | Households |
| 9 [143] | Brunkard | 2007 | Dengue Fever Seroprevalence and Risk Factors, Texas–Mexico Border, 2004 | Emerging Infectious Diseases | USA Mexico | Brownsville, Texas Matamoros, Tamaulipas | (300) Households Neighborhoods |
| 10 [144] | Cao | 2017 | Individual and Interactive Effects of Socio-Ecological Factors on Dengue Fever at Fine Spatial Scale: A Geographical Detector-Based Analysis | International Journal of Environmental Research and Public Health | China | Guangzhou | (167) Townships-streets |
| 11 [145] | Carbajo | 2018 | The largest dengue outbreak in Argentina and spatial analyses of dengue cases in relation to a control program in a district with sylvan and urban environments | Asian Pacific Journal of Tropical Medicine | Argentina | Tigre | Census tracts |
| 12 [146] | Chadee | 2009 | Dengue cases and Aedes aegypti indices in Trinidad | Acta Tropica | Trinidad | County Victoria | (50) Households |
| 13 [147] | Chen | 2016 | Who Is Vulnerable to Dengue Fever? A Community Survey of the 2014 Outbreak in Guangzhou, China | International Journal of Environmental Research and Public Health | China | Guangzhou | Households |
| 14 [148] | Chen | 2019 | Spatiotemporal Transmission Patterns and Determinants of dengue fever: a case study of Guangzhou, China | International Journal of Environmental Research and Public Health | China | Guangzhou city | Grid-level 1km |
| 15 [149] | Chiu | 2014 | A Probabilistic Spatial Dengue Fever Risk Assessment by a Threshold-Based-Quantile Regression Method | PLoS ONE | China | Kaohsiung Fongshan | Li (Smallest Administrative Unit) |
| 16 [150] | Chuang | 2018 | Epidemiological Characteristics and Space-Time Analysis of the 2015 Dengue Outbreak in the Metropolitan Region of Tainan City, Taiwan | International Journal of Environmental Research and Public Health | China | Tainnan | BSA, village (Small Admnistrative newline Unit) |
| 17 [151] | Delmelle | 2016 | A spatial model of socioeconomic and environmental determinants of dengue fever in Cali, Colombia | Acta Tropica | Colombia | Cali | (323) Neighborhoods |
| 18 [152] | De Mattos | 2007 | Spatial Vulnerability to Dengue in a Brazilian Urban Area During a 7-Year Surveillance | Journal of Urban Health | Brazil | Belo Horizonte | (2548) census tracts |
| 19 [153] | Dom | 2013 | Coupling of remote sensing data and environmental-related parameters for dengue transmission risk assessment in Subang Jaya, Malaysia | Geocarto International | Malaysia | Subang Jaya | Locality (Small Admnistrative Unit) |
| 20 [154] | Ellis | 2015 | A Household Serosurvey to Estimate the Magnitude of a Dengue Outbreak in Mombasa, Kenya, 2013 | PLOS Neglected Tropical Diseases | Kenya | Monbasa | (701) Households |
| 21 [155] | Escobar-Mesa | 2003 | Determinantes de la transmisión de dengue en Veracruz: un abordaje ecológico para su control | Salud Pública de México | Mexico | Veracruz | (1249) Localities |
| 22 [156] | Falcon-Lezama | 2017 | Analysis of spatial mobility in subjects from a Dengue endemic urban locality in Morelos State, Mexico | PloS one | Mexico | Axochiapan city | Trajectory in and out of the city |
| 23 [157] | Garcia | 2011 | An examination of the spatial factors of dengue cases in Quezon City, Philippines A Geographic Information-System GLS based approach 2005 2008 | Acta Medica Philippina | Philippines | Quezon | Barrangay (Small Admnistrative Unit) |
| 24 [158] | Hapuarachchi | 2016 | Epidemic resurgence of dengue fever in Singapore in 2013–2014: A virological and entomological perspective | BMC Infectious Diseases | Singapore | Singapore | 150 m buffer around clusterized cases |
| 25 [159] | Hayes | 2003 | Risk factors for infection during a severe dengue outbreak in el Salvador in 2000 | The American Journal of Tropical Medicine and Hygiene | Salvador | Aguilares (Las Pampitas) | (106) Households |
| 26 [160] | Hayes | 2006 | Risk factors for infection during a dengue-1 outbreak in Maui, Hawaii, 2001 | Transactions of The Royal Society of Tropical Medicine and Hygiene | USA | Hawaii Hana | Households |
| 27 [161] | Heukelbach | 2001 | Risk factors associated with an outbreak of dengue fever in a favela in Fortaleza, north-east Brazil | Tropical Medicine & International Health | Brazil | Fortaleza Favela Serviluz | Self-defined districts |
| 28 [162] | Honorio | 2009 | Spatial Evaluation and Modeling of Dengue Seroprevalence and Vector Density in Rio de Janeiro, Brazil | PLoS Neglected Tropical Diseases | Brazil | Rio de Janeiro | (3) Neighborhoods |
| 29 [163] | Huang | 2018 | Spatial Clustering of Dengue Fever Incidence and Incidence and its association with surrounding greeness | International Journal of Environmental Research and Public Health | China | Tainan Kaohsiung | Districts |
| 30 [164] | Kennesson | 2019 | Social-ecological factors and preventive actions decrease the risk of dengue infection | PLOS Neglected Tropical Diseases | Ecuador | Machala | Households |
| 31 [165] | Kesetyaningsi | 2018 | Determination of environmental factors affecting dengue incidence in Sleman District | African Journal of Infectious Diseases | Indonesia | Sleman District | 200 m buffer |
| 32 [166] | Khormi | 2011 | Modeling dengue fever risk based on socioeconomic parameters, nationality and age groups: GIS and remote sensing based case study | Science of The Total Environment | SaudiArabia | Jeddah | (111) Districts |
| 33 [167] | Kim | 2015 | Role of Aedes aegypti and Aedes albopictus during the 2011 dengue fever epidemics in Hanoi, Vietnam | Asian Pacific Journal of Tropical Medicine | Vietnam | Hanoi | (8) Districts (1200) 50 m-buffers around Households |
| 34 [168] | Koopman | 1991 | Determinants and Predictors of Dengue Infection in Mexico | American Journal of Epidemiology | Mexico | 70 localities under 50,000 inhabitants | (3408) Households |
| 35 [169] | Koyadun | 2012 | Ecologic and Sociodemographic Risk Determinants for Dengue Transmission in Urban Areas in Thailand | Interdisciplinary Perspectives on Infectious Diseases | Thailand | Chachoengsao’s province cities | (1200) Households considering (4) ecotypes |
| 36 [170] | Li | 2013 | Abiotic Determinants to the Spatial Dynamics of Dengue Fever in Guangzhou | Asia Pacific Journal of Public Health | China | Guangzhou | (12) Districts |
| 37 [171] | Li | 2018 | Spatiotemporal responses of dengue fever transmission to the road network in an urban area | Acta Tropica | China | Guangzhou Fushan | 500 m distance from roads |
| 38 [172] | Lippi | 2018 | The social and spatial ecology of dengue presence and burden during an outbreak in Guayaquil, Ecuador, 2012 | International Journal of Environmental Research and Public Health | Ecuador | Guayaquil | Census tract |
| 39 [173] | Liu | 2018 | Dynamic spatiotemporal analysis of indigenous dengue fever at street-level in Guangzhou city, China | PLOS Neglected Tropical Diseases | China | Guangzhou | Street-level |
| 40 [174] | Mahmood | 2019 | Spatiotemporal analysis of dengue outbreaks in Samanabad town, Lahore metropolitan area, using geospatial techniques | Environmental Monitoring and Assessment | Pakistan | Samanabad | Union Council |
| 41 [175] | Mala | 2019 | Implications of meteorological and physiographical parameters on dengue fever occurrences in Delhi | Science of The Total Environment | India | Delhi city | City |
| 42 [176] | Martinez | 2017 | Relative risk estimation of dengue disease at small spatial scale | International Journal of Health Geographics | Colombia | Bucaramanga | (293) Census tracts |
| 43 [177] | McBride | 1998 | Determinants of dengue 2 infection among residents of Charters Towers, Queensland, Australia | American journal of epidemiology | Australia | Charters Towers | 1000 Households |
| 44 [178] | Mena | 2011 | Factores asociados con la incidencia de dengue en Costa Rica | Revista Panamericana de Salud Pública | Costa Rica | Various cities | (81) Cantones |
| 45 [179] | Meza-Ballesta | 2014 | The influence of climate and vegetation cover on the occurrence of dengue cases (2001-2010) | Revista de Salud Pública | Colombia | Various cities | (30) Municipios |
| 46 [180] | Mondini | 2008 | Spatial correlation of incidence of dengue with socioeconomic, demographic and environmental variables in a Brazilian city | Science of The Total Environment | Brazil | Sao Jose do Rio Preto | Census tract |
| 47 [181] | Ogashawara | 2019 | Spatial-Temporal Assessment of Environmental Factors related to dengue outbreaks in Sao Paulo, Brazil | GeoHealth | Brazil | Sao Paulo | District-level |
| 48 [182] | Pessanha | 2010 | Dengue em três distritos sanitários de Belo Horizonte, Brasil: inquérito soroepidemiológico de base populacional, 2006 a 2007 | Revista Panamericana de Salud Pública | Brazil | Belo Horizonte | Households |
| 49 [183] | Prayitno | 2017 | Dengue seroprevalence and force of primary infection in a representative population of urban dwelling Indonesian children | PLOS Neglected Tropical Diseases | Indonesia | 26 cities | Neighborhoods |
| 50 [184] | Qi | 2015 | The Effects of Socioeconomic and Environmental Factors on the Incidence of Dengue Fever in the Pearl River Delta, China, 2013 | PLoS neglected tropical diseases | China | 7 mains cities of Pearl River Delta, Guangdong | (402) streets and towns |
| 51 [185] | Qu | 2018 | Effects of socio-economic and environmental factor | Geospatial Health | China | Guangzhou city | Township-level |
| 52 [186] | Reiter | 2003 | Texas Lifestyle Limits Transmission of Dengue Virus | Emerging Infectious Diseases | USA-Mexico | Laredo, Texas Nuevo Laredo Taumalipas | (622) Households |
| 53 [187] | Ren | 2019 | Urban villages as transfer stations for dengue fever epidemic: a case study in the Guangzhou, China | Emerging Infectious Diseases | China | Guangzhou city | 1 km square grid |
| 54 [188] | Rinawan | 2015 | Pitch and Flat Roof Factors’ Association with Spatiotemporal Patterns of Dengue Disease Analysed Using Pan-Sharpened Worldview 2 Imagery | ISPRS International Journal of Geo-Information | Indonesia | Bandung | Buffer 50 m |
| 55 [189] | Rodriguez | 1995 | Risk Factors for Dengue Infection during an Outbreak in Yanes, Puerto Rico in 1991 | The American Journal of Tropical Medicine and Hygiene | Puerto Rico | Yanes (Florida) | 65 households |
| 56 [190] | Rotela | 2007 | Space–time analysis of the dengue spreading dynamics in the 2004 Tartagal outbreak, Northern Argentina | Acta Tropica | Argentina | Tartagal | Residential block addresses |
| 57 [191] | Sarfraz | 2014 | Near real-time characterisation of urban environments: a holistic approach for monitoring dengue fever risk areas | International Journal of Digital Earth | Thailand | Muang | Buffer 200 m |
| 58 [192] | Seidahmed | 2018 | Patterns of Urban Housing Shape Dengue Distribution in Singapore at Neighborhood and Country Scales | GeoHealth | Singapore | Singapore Geylang | 200 m-grid 1 km-block |
| 59 [193] | Stewart-Ibarra | 2014 | Spatiotemporal clustering, climate periodicity, and social-ecological risk factors for dengue during an outbreak in Machala, Ecuador, in 2010 | BMC Infectious Diseases | Ecuador | Machala | (253) Neighborhoods |
| 60 [194] | Sulaiman | 1996 | Relationship between Breteau and house indices and cases of dengue/dengue hemorrhagic fever in Kuala Lumpur, Malaysia | Journal of the American Mosquito Control Association | Malaysia | Kuala Lumpur | 6 zones of 1 million inhabitants |
| 61 [195] | Teixera | 2002 | Dynamics of dengue virus circulation: a silent epidemic in a complex urban area | Tropical Medicine & International Health | Brazil | Salvador | (30) Neighborhoods |
| 62 [196] | Teixera | 2008 | Socio-demographic factors and the dengue fever epidemic in 2002 in the State of Rio de Janeiro, Brazil | Cadernos de Saúde Pública | Brazil | Rio state | (90) Municipios |
| 63 [197] | Telle | 2016 | The Spread of Dengue in an Endemic Urban Milieu–The Case of Delhi, India | PLOS ONE | India | Dehli | (1280) Colonies |
| 64 [198] | Teurlai | 2015 | Socio-economic and Climate Factors Associated with Dengue Fever Spatial Heterogeneity: A Worked Example in New Caledonia | PLOS Neglected Tropical Diseases | New Caled. | Various cities | City |
| 65 [199] | Thammapolo | 2008 | Environmental factors and incidence of dengue fever and dengue haemorrhagic fever in an urban area, Southern Thailand | Epidemiology and Infection | Thailand | Songkhla | Enumeration district |
| 66 [200] | Tian | 2016 | Surface water areas significantly impacted 2014 dengue outbreaks in Guangzhou, China | Environmental Research | China | Guangzhou | City |
| 67 [201] | Tiong | 2015 | Evaluation of land cover and prevalence of dengue in Malaysia | Tropical Biomedicine | Malaysia | 15 cities | Buffer 10 m |
| 68 [202] | Toan | 2014 | Risk factors associated with an outbreak of dengue fever/dengue haemorrhagic fever in Hanoi, Vietnam | Epidemiology & Infection | Vietnam | Hanoi | (73) Households |
| 69 [203] | Troyo | 2009 | Urban structure and dengue incidence in Puntarenas, Costa Rica | Singapore Journal of Tropical Geography | Costa Rica | Punta-renas | Health region |
| 70 [204] | Van Benthem | 2005 | Spatial patterns of and risk factors for seropositivity for dengue infection | The American journal of tropical medicine and hygiene | Thailand | (Ban Pa Nai Ban Pang) Mae Hia | Buffer 200 m |
| 71 [205] | Vanwambeke | 2006 | Multi-level analyses of spatial and temporal determinants for dengue infection | International Journal of Health Geographics | Thailand | (Ban Pa Nai Ban Pang) Mae Hia | Buffer 200 m |
| 72 [206] | Wanti | 2019 | Dengue Hemorrhagic Fever and House Conditions in Kupang City, East Nusa Tenggara Province | Kesmas: National Public Health Journal | Indonesia | Kupang | Households |
| 73 [207] | Waterman | 1985 | Dengue Transmission in Two Puerto Rican Communities in 1982 | The American Journal of Tropical Medicine and Hygiene | Puerto Rico | Manati Salinas communities | (60) blocks of 6 households |
| 74 [208] | Wen | 2012 | Population Movement and Vector-Borne Disease Transmission: Differentiating Spatial—Temporal Diffusion Patterns of Commuting and Noncommuting Dengue Cases | Annals of the Association of American Geographers | China | Tainan city | 266 “Villages” (smallest administrative division) |
| 75 [209] | Wong | 2014 | Community Knowledge, Health Beliefs, Practices and Experiences Related to Dengue Fever and Its Association with IgG Seropositivity | PLOS Neglected Tropical Diseases | Malaysia | Various cities | 1400 Households at 3 km of the schools |
| 76 [210] | Yue | 2018 | Spatial analysis of dengue fever and exploration of its environmental and socio-economic risk factors using ordinary least squares | International Journal of Infectious Diseases | China | Guangzhou city | 1 km square Grid |
| 77 [211] | Yung | 2016 | Epidemiological risk factors for adult dengue in Singapore: an 8-year nested test negative case control study | BMC Infectious Diseases | Singapore | Singapore | Households |
| 78 [212] | Zellweger | 2017 | Socioeconomic and environmental determinants of dengue transmission in an urban setting: An ecological study in Nouméa, New Caledonia | PLOS Neglected Tropical Diseases | New Caledonia | New Noumea | (36) Neighborhoods |
Appendix A.2. Epidemiological Characteristics and Vectors Mention (M) or Observation (O) in the 58 Included Articles
| ID [Ref.] | Epidemiological Context | ||||||
|---|---|---|---|---|---|---|---|
| Start–End Years | DATA Source | Diagnostic Method | DENV-Type | Number of Cases | Spatial Variation | Vectors Mention | |
| 1 [135] | 2000 | Self-reported dengue cases | NA | NA | NA | Clustered in the southern part (hospitals location) | Aedes aegypti and Aedes Albopictus (O) |
| 2 [136] | Sep 2016–Jan 2017 | Sero-prevalence survey | IgG (ELISA) | NA | % by city | NA | Mosquitoes (M) |
| 3 [137] | 2010–2011 | Passive notification (COVISA) | IgG (ELISA) | NA | N=7415 | Heterogeneous | Aedes aegypti (M) |
| 4 [138] | 1995 | Passive notification (Palau Hospital) | Clinical and IgM and IgG | NA | N = 254 | Heterogeneous | Aedes aegypti albopictus, and hensilli (O) |
| Jan–Jun 1995 | Passive notification (PHD) and cross-survey | IgM (ELISA) and Virus isolation | N = 817 P = 75% | ||||
| 5 [139] | Jan–2004–Dec–2007 | Passive notification (PCD) | Clinical and Lab. confirmed | NA | I = 281 per 100,000 | NA | Aedes aegypti (O) |
| 6 [140] | Jan–Sep–2011 | Passive notification (SINAN) | Clinical and Lab. confirmed | DENV-1 DENV-2 DENV-3 | N = 195 | Heterogeneous | Aedes aegypti (O) |
| 7 [141] | 1993–1998 | Sero-incidence | Clinical signs | NA | N = 10,576 N = 2593 (DHF) N = 8 (Death) | Observed Patterns | Aedes aegypti (M) |
| 8 [142] | 2005–2006 | Sero-prevalence survey | IgG (ELISA) | NA | P = 91% P = 87% P = 74% | Socio-eco stratified | Aedes aegypti (M) |
| 9 [143] | Oct–Nov 2004 | Sero-prevalence survey | Double IgM-IgG (ELISA), and PRNT | DENV-2 DENV-1 | N = 6 (Recent), N = 119 (Past) N = 22 (Recent), and N = 235 (Past) | NA | Aedes aegypti, albopictus, Culex quinque, fasciatus (O) |
| 10 [144] | 2014 | Passive notification (CDCP) | Clinical, IgM, and PCR | NA | N = 37,322 | 4 clusters 1 Hotspot 3 cold spots (Moran’s I) | Aedes albopictus (aegypti) (M) |
| 11 [145] | 2016 | Passive notification (CDCP) | Ns1 IgM | NA | N = 83 | Mild | Aedes aegypti (albopictus) (M) |
| 12 [146] | 2003–2004 | Sero-prevalence | Clinical signs IgM Seroconversion | NA | N = 33 | NA | Aedes agypti (O) |
| 13 [147] | Jul–Aug 2014 | Passive notification (NNIDRIS) | Clinical IgG PCR | NA | N = 165 | NA | Aedes albopictus (aegypti) (M) |
| 14 [148] | Jan–Dec 2014 | Passive notification China CDC | Clinical or laboratory diagnosis | NA | 37 386 | Spatially clusted in central districts | Aedes (M) |
| 15 [149] | 2004–2011 | Passive notification (CDC) | IgM | NA | NA | Heterogeneous | Aedes aegypti (albopictus) (M) |
| 16 [150] | 2015 | Passive notification (CDC) | IgM | NA | N = 22,740 P = 12.06 per 1000 | 3 Clusters (Moran’s I) | Aedes aegypti and albopictus (M) |
| 17 [151] | 2010 | Passive notification (SIVIGILA) | Clinical signs | NA | N = 9287 | 3 Clusters Heterogeneous (Moran’s I) | Aedes aegypti (M) |
| 18 [152] | 1996–2002 | Passive notification (SINAN) (SISVE) | Clinical | NA | N = 89,607 | Heterogeneous | Aedes aegypti (M) |
| 19 [153] | 2006–2010 | Passive notification (DHO) (SJMC) | NA | NA | NA | 5 Hotspots | Aedes (aegypti) (M) |
| 20 [154] | 3–11 May 2013 | Sero-incidence | IgM RT-PCR | DENV-1 DENV-2 DENV-3 | N = 210 of 1500 | No clustering | Aedes aegypti (M) |
| 21 [155] | 1995–1998 | Passive notification (IPEEDP) | NA | DENV-3 and co-circulation | N = 26,423 I = 112.7 per 100,000 (1997) | Heterogeneous | Aedes aegypti (M) |
| 22 [156] | May-Sep 2012 | Sero-prevalence survey | IgM or IgG capture ELISA | NA | 37 386 | 42 cases, 42 intradomestic, and 42 population controls | Aedes (M) |
| 23 [157] | 2005–2008 | Passive notification (DOH) | NA | NA | N = 8812 | Heterogeneous | Aedes (M) |
| 24 [158] | 2013–2014 | Passive notification (MOH) | Clinical NS1 or RNA-PCR | DENV-1 (dominant) and DENV-2 | N = 22,170 I = 410 (2013) N = 18,338 I = 335 (2014) | NA | Aedes aegypti (albopictus) (O) |
| 25 [159] | 18–19 Aug 2000 | Primo and secondary Sero-incidence | IgM IgG | DENV-2 | I = 98 per 1000 | NA | Aedes (O) |
| 26 [160] | Oct 2001 | Sero-incidence | Clinical IgM IgG | DENV-1 | I = 389 per 1000 | Confined area | Aedes albopictus (O) |
| 27 [161] | 1 Jun–31 Jul 1999 | Passive notification (PHCC) | Clinical IgM | DENV-1 DENV-2 | N = 34 clinical N = 16 IgM | NA | Aedes aegypti (M) |
| 28 [162] | Jul–Nov 2007 Apr 2008 | Sero-prevalence and recent cases survey | Clinical IgM IgG | DENV-2 | NA | Hotspots patterns | Aedes aegypti (albopictus) (O) |
| 29 [163] | 2014–2015 | Passive notification Taiwan Centers for Disease Control (CDC) | IgM, nucleotide sequence, viral isolation | NA | 15 394 for 2014, 42 932 for 2015 | Hotspots of dengue epidemic in urban areas | Aedes aegypti and Ae. albopitus (M) |
| 30 [164] | Jan–Sep 2014, Mar–Jun 2015 | Sero-prevalence | RT-PCR, NS1 test, ELISA and IgM | NA | 72 | Heterogeneous | Aedes aegypti (M) |
| 31 [165] | 2008–2013 | Passive notification DF and DHF cases, HD of Sleman district, and PHC | NA | NA | 1150 | Dengue incidents are clustered for each year | Aedes aegypti (M) |
| 32 [166] | 2006–2010 | Passive notification (JHA) | Clinical | NA | NA | Heterogeneous | Aedes aegypti (M) |
| 33 [167] | 1 Aug–21 Dec 2011 | Passive notification (NHTD) | Clinical signs RT-PCR | DENV-2 DENV-1 | N = 140 | 24 infectious foci | Aedes (O) (95%) aegypti (5%) albopictus |
| 34 [168] | March–Oct 1986 | National sero-prevalence survey | Antigens test | NA | NA (age < 25) | Stratified | Aedes aegypti (O) |
| 35 [169] | Aug–Oct 2007 | Sero-incidence (Hospital and PHO) | IgM, IgG, and clinical signs | NA | 1200 | NA | Aedes (aegypti) (M) |
| 36 [170] | May–Nov 2002 | Passive notification (CDCPG) | NA | NA | N = 1069 | 2 clusters | Aedes aegypti and albopictus (M) |
| 37 [171] | 2014 | Passive notification China CDC | NA | NA | 40 379 | Spatio-temporal dengue kernels | Aedes aegypti (M) |
| 38 [172] | 2012 | Passive notification | Clinical signs | NA | P = ? per | Heterogeneous. | Aedes aegypti (albopictus) (M) |
| 39 [173] | 2006–2014 | Passive notification China CDC | Clinical signs, and lab. confirmed | NA | NA | Spatio-temporal clustering | Aedes albopictus (M) |
| 40 [174] | 2012–2015 | Passive notification, the Punjab Health Department | NA | NA | 377 for 2012, 871 for 2013, 133 for 2014 and 49 for 2015 | NA | Aedes aegypti and Ae. albopictus (M) |
| 41 [175] | 2006–2015 | The Health Department of Municipal Corporation of Delhi | NA | NA | NA | NA | Aedesmosquitoes (M) |
| 42 [176] | 2008–2015 | Passive notification (SIVIGLIA) | Clinical signs | NA | N = 27,301 P = 1359 per | NA | Aedes aegypti (M) |
| 43 [177] | May–Sept 1995 | Serosuvey | Hemagglutination inhibition assay, Clark and Cassals | DENV-2 | [n = 203] | Foci | Aedes aegypti (M) |
| 44 [178] | 1999–2007 | Passive notification Ministerio de Salud | Clinical and serologic | NA | N = 137,719 | Heterogeneous. | Aedes aegypti (M) |
| 45 [179] | 2001–2010 | Passive notification SIVIGILA | NA | NA | NA | NA | Aedes aegypti (M) |
| 46 [180] | 1994–1998 1998–2002 | Passive notification A.L. | NA | NA | N = 13,998 | Heterogeneous, clusters (Moran’s I) | Aedes aegypti (M) |
| 47 [181] | 2011–Aug 2017 | The State Secretariat of Health | NA | NA | From 475 to 43,359 yearly | NA | Aedes aegypti (M) |
| 48 [182] | Jun–2006 Mars 2007 | Sero-prevalence survey | SN | NA | 709 11.9% | Heterogeneous | NA |
| 49 [183] | Oct–Nov 2014 | Sero-prevalence survey | IgG ELISA | NA | N = 3194 children I = 69.4% | NA | Aedes (M) |
| 50 [184] | 2013 | Passive notification China CDC | Clinic IgG PCR | NA | I = 28,896 per | Highly clustered Hot and cold spot | Aedes albopictus (aegypti) (M) |
| 51 [185] | 2014 | Passive notification China CDC | NA | NA | 37,380 | Space-time clustering | Aedes albopictus (M) |
| 52 [186] | 1999 | Sero-prevalence | IgM | NA | Prevalence(IgM) P = 1.3% (Laredo) P = 16% (Nuevo Laredo) | Across the boarder | Aedes aegypti (O) |
| 53 [187] | 2012, 2013, 2014, and 2017 | Passive notification China CDC | Clinical or laboratory diagnosis | NA | 36 344 for 2014, NA for other years | Spatially clusted for the each year | Aedes albopictus (M) |
| 54 [188] | Jan–Dec 2012 | Passive notification | NA | NA | 1058 | Hotspots patterns | Aedes (M) |
| 55 [189] | Nov 1991 | Sero-incidence survey (primary and secondary cases) | IgM IgG | NA | I = 18% (N = 59 of 331) | Agglomerated | Aedes aegypti (O) |
| 56 [190] | 24 Jan 11 May 2004 | Passive notification (SiNaVE) | PCR IgM IgG | NA | N = 487 | Hot spots | Aedes aegypti (M) |
| 57 [191] | 2005–2010 | Passive notification (DOH) | NA | NA | NA | Heterogeneity | Aedes (M) |
| 58 [192] | 2010–2015 (Geylang) 2013–2015 (Singapore) | Passive notification Ministry of Health | NA | DENV 1-2-3-4 | N = 353 (Geylang, 2014–2015) | 13 Clusters in Geylang (Moran’s Index) | Aedes aegypti and albopictus (O) |
| 59 [193] | 2010 | Passive notification (NIMH) | NA | DENV-1 | N = 2019 I = 84 per | Hotspots patterns | Aedes aegypti (M) |
| 60 [194] | 1994 | All hospitals notifications | Hemagglutination inhibition test of Clarke and Casals | NA | 0 to 21 cases monthly | All areas | Aedes aegypti and albopictus (O) |
| 61 [195] | May–Jun 1998 | Sero-prevalence | NA | DENV-1 and 2 | P = 68.7% | NA | Aedes aegypti (O) |
| 1998-1999 | Sero-incidence | I = 70.6% | |||||
| 62 [196] | 2002 | Passsive notification SINAN | Clinical signs | DENV-1 DENV-2 | N = 368,460 | Highly Heterogeneous | Aedes aegypti (M) |
| 63 [197] | 2008–2009–2010 | Passive Delhi surveillance system | IgM | NA | N = 5998 (2010) | Spatio-temporal clusters | Aedes aegypti (M) |
| 64 [198] | 1995–2012 | Passive notification (DASS) | Clinical signs Lab. confirmed | NA | N = 24,272 | Highly Heterogeneous | Aedes aegypti (M) |
| 65 [199] | Jan–Dec 1998 | Passive notification (Health Department) | WHO criteria | NA | N = 287 DH/DHF | Some points clustering (Moran’s I) | Aedes (O) |
| 66 [200] | 1978–2014 | Passive notification (NIDRS-CDC) | Phylo-genetic. | DENV-1 | NA | NA | Aedes albopictus (O) |
| 67 [201] | 2008–2009 | Sero-prevalence survey (Malaya University) | IgG ELISA | NA | N = 1,410 childrens | NA | Aedes (M) |
| 68 [202] | 2009 | Passive notification Hanoi Hospital | Clinical signs | NA | N = 73 DF/DHF | NA | Mosquitoes (O) |
| 69 [203] | 2002 | Passive notification (Health Department) | Clinical signs | NA | N = 1,434 | NA | Aedes aegypti (M) |
| 2003 | N = 2017 | ||||||
| 70 [204] | May–Sep 2001 | Sero-incidence survey | IgM (ELISA) | NA | N = 1750 I = 6.5% and I = 3.1% | One Sero-Positive cluster | Aedes aegypti (M) |
| 71 [205] | 2001–2003 | Sero-incidence survey | IgM | NA | NA | 4 clusters | Aedes (M) |
| 72 [206] | 2011–2015 | Sero-prevalence | NA | NA | 240 DHF patient cases | NA | Aedes (M) |
| 73 [207] | July 1982 | Sero-incidence survey | Hemagglutination | DENV-1 DENV-4 | I = 35% (Salinas) I = 26% (Manati) | NA | Aedes aegypti (O) |
| 74 [208] | Jun 2007–Jan 2008 | Passive notification (Taiwan-CDC) | Clinical signs Lab. confirmed | NA | N = 1403 | Various space-time clusters | Aedes aegypti and albopictus (M) |
| 75 [209] | Mar 2011–May 2012 | Sero-prevalence survey | IgG | NA | N = 156 school children (age 7–18) | 3 clusters | Aedes mosquitoes (M) |
| 76 [210] | Jan–Dec 2014 | Passive notification China CDC | Clinical sign, lab. or viral isolation | NA | 30,553 | High density in several districts | Aedes albopictus (M) |
| 77 [211] | Apr 2005–Feb 2013 | Sero-incidence survey | RT-PCR IgM-IgG conversion | DENV-1 DENV-2 suspected | N = 395 of 1703 (age ≥ 18) | Spatial gradient | Aedes aegypti (M) |
| 78 [212] | Sep 2008–Aug 2009 | Passive notification (DASS) | Clinical signs IgM PCR NS1 analyses | (DENV-1) DENV-4 | N = 2310 I = 23.7 per 1000 | North to South gradient clusters (Moran’s I) | Aedes aegypti (M) |
| 2012–2013 | DENV-1 | N = 3369 I = 34.5 per | Widely homogeneous | ||||
Appendix A.3. Landscape Factor Production and Landscape-Dengue Relationships Table
| ID [Ref.] | Landscape Factors Production | Dengue-Landscape Relationship | |||||
|---|---|---|---|---|---|---|---|
| Data Source | Data Group | Data Sub-Group | Landscape Factors | Three-Valued Interpretation | Potential Proxy of (at Unit Level) | Statistical Method | |
| 1 [135] | Survey questionnaire | Entomological observation | Aedes albopictus larvae | + | Vector breeding sites (at household level) | Correlation and simple regression model | |
| Aedes aegypti larvae | NS | ||||||
| GIS data | Land use | Infrastructure level | Proximity to the hospitals | + | Virus screening (at wards level) | ||
| 2 [136] | Survey questionnaire | Housing type and chracteristics | Housing type | Villa w/o garden | NS | Human–Vector encounter (at household-level) | Odds ration Multivariate logistic regression |
| Villa with garden | NS | ||||||
| Apartment | − | ||||||
| Land use | Infrastrucutre level | Presence of a sewage network | − | Vector breeding sites (at household-level) | |||
| Entomological observations | Presence of mosquitoes at home | + | Exposure to mosquitoes bite (at household-level) | ||||
| Human immunity | Previous history of Dengue | + | Virus Exposition (at household-level) | ||||
| 3 [137] | Landsat 5 TM image | Land cover | Surface Temperature | Urban heat islands | + | Vectors resting sites and virus replication (at large-admin level) | Multiple cluster analysis |
| Vegetation | Normalized Difference Vegetation Index (NDVI) | − | Vectors breeding and resting sites (at large-admin level) | ||||
| Survey questionnaire | Land use | Urban Typology | Slums-like areas | NS | Human-Vector encounter (at large-admin-level) | ||
| 4 [138] | Survey questionnaire | Housing type and characteristics | Housing characteristics | Screens on windows | NS | Vectors exposure (at household-level) | Univariate and Multivariate Analysis |
| Land use | Construction material | Mixed type of house construction | NS | Vector breeding site (at neighborhood-level) | |||
| Cropland | Taro farming | + | |||||
| Entomological observation | Presence of Aedes albopictus | + | Vector exposure (at household-level) | ||||
| Presence of Aedes aegypti | + | ||||||
| Larvae-positive habitats | + | ||||||
| Housing type and characteristics | House characteristics | Animals water pans | + | Vector breeding site (at household-level) | |||
| Entomological observation | Presence of Aedes | + | Vector exposure (at household-level) | ||||
| 5 [139] | Survey questionnaire | Entomological observation | Larvae abundance | NS | Vector breeding site (at neighborhood-level) | Cross-lagged correlation | |
| 6 [140] | Survey questionnaire | Entomological observation | Aedes Eggs indicators | NS | Vector breeding site (at neighborhood-level) | Generalized additive model | |
| Aedes Pupae indicators | NS | ||||||
| Aedes Adults indicators | NS | Vector exposure (at neighborhood-level) | |||||
| 7 [141] | GIS data | Human density | Human density | + | Human exposure to virus (at neighborhood-level) | Linear statistic stratification | |
| 8 [142] | Survey questionnaire | Housing type and characteristics | Housing type | Apartment | − | Vector exposure (at household-level) | GLMM GAM |
| House | + | ||||||
| House characteristics | Households with water supply | NS | Vector breeding site (at household-level) | ||||
| Households with regular water supply | |||||||
| Households with water containers | |||||||
| Households with a sewage system | |||||||
| Households with a garbage collection | |||||||
| 9 [143] | Survey questionnaire | Housing type and characteristics | House characteristics | Absence of air conditioning | + | Vector exposure (at household-level) | Multivariate logistic regression |
| Land use | Infrastructure level | Lack of street drainage | + | Vector breeding site (at neighborhood-level) | |||
| Entomological observation | Presence of Aedes habitats | + | |||||
| 10 [144] | Landsat 8 image | Land use | Infrastructure level | Urbanization level | + | Human-Vector encounter (at small-admin level) | Linear correlations, and Coefficient of Geographical detector |
| GIS data | Road density | + | Human mobility at small-admin level | ||||
| MODIS image | Land cover | Vegetation | NDVI and VFC | − | Vectors breeding and resting sites (at small-admin level) | ||
| GIS data | Water-areas | Water-body areas | − | ||||
| Landsat 8 and Quickbird images | Land use | Urban Typology | % of urban villages | + | Human-Vector encounter (at small-admin level) | ||
| 11 [145] | Survey questionnaire | Human mobility | Long-distance human mobility | Foreign inhabitants | + | Human and Virus mobility (at small-admin level) | GLM |
| 12 [146] | Survey questionnaire | Entomological observations | Adults and immatures Aedes | + | Exposure to mosquitoes bite (at household-level) | G-test on contingency tables | |
| Rate of Aedes pupae per person | + | ||||||
| 13 [147] | Tele-interview survey questionnaire | Housing type and characteristics | Housing type | Old flats | + | Vector exposure at household-level | Logistic regression models and Odds Ratio (OR) |
| Sheds | + | ||||||
| Housing characteristics | Screens on windows | NS | |||||
| 14 [148] | 2.5m SPOT 5 image GIS data (Baidu map) | Land use | Infrastructure level | Road network density | + | Human-vector encounter (at neighborhood level) | Geographical detector |
| Subway lines network density | + | ||||||
| Aging infrastructure | + | ||||||
| Water-areas | Ponds area | + | Vector breeding site (at neighborhood level) | ||||
| Human density | Number of the people on the building | + | Human exposure to virus (at neighborhood level) | ||||
| 15 [149] | GIS data | Land use | Infrastructure level | % of canals and ditches | + | Vectors breeding sites (at small admin-level) | Quantile regression |
| Interaction ditches- residential areas | + | Human-Vector encounter (at small admin-level) | |||||
| 16 [150] | GIS data | Land use | Urban Typology | Residential area | + | Human-Vector encounter (at small admin-level) | Quantile regression |
| Recreation area | NS | ||||||
| Business area | NS | ||||||
| Land cover | Cropland | Agriculture area | NS | Vectors breeding sites (at small-admin level) | |||
| Water areas | Wetland | − | |||||
| Water areas | NS | ||||||
| 17 [151] | GIS data | Land use | Infrastructure level | Proximity to parks | + | Human-Vector encounter (at neighborhood-level) | GWR |
| Topography | Proximity to rivers | NS | |||||
| Land use | Urban Typology | Proximity to tyre shops | NS | ||||
| Infrastructure level | Proximity to water pumps | NS | |||||
| Urban Typology | Proximity to cemeteries | NS | |||||
| Proximity to plant nurseries | + | ||||||
| Infrastructure level | Proximity to houses with a sewage system | − | |||||
| 18 [152] | Survey questionnaire | Land use | Infrastructure level | % of households with no piped water | NS | Vectors breeding sites (at small-admin level) | Multivariate regression |
| % of households without systematic garbage collection | NS | ||||||
| Human density | Population density | NS | Human exposure to virus (at small-admin level) | ||||
| Land use | Urban Typology | Ratio (Nb commercial) (Nb Households) | NS | Human-Vector encounter (at small-admin level) | |||
| 19 [153] | IKONOS image GIS data | Land use | Urban Typology | Residential areas | + | Human-Vector encounter (at small-admin level) | Layers super-imposition |
| Industrial areas | + | ||||||
| Commercial areas | NS | ||||||
| Land cover | Bare soils | Open areas | + | ||||
| Housing type and characteristics | Housing type | Interconnection houses | + | ||||
| Independent houses | NS | ||||||
| Mixed houses | NS | ||||||
| Land use | Urban Typology | Commercial houses | NS | ||||
| Residential with commercial and industrial areas | + | ||||||
| 20 [154] | Survey questionnaire (assisted by Google Earth imagery) | Human mobility | Long-distance mobility | + | Human and virus mobility (at regional-level) | OR (95 % CI) Logistic regression | |
| Housing type and characteristics | Housing type | One story home | NS | Vector exposure (at household-level) | |||
| Land use | Urban Typology | Temporary construction | NS | ||||
| Housing type and characteristics | Housing characteristics | Screens on windows | NS | ||||
| Entomological observation | Breeding containers | NS | |||||
| 21 [155] | Topographic data | Topography | Altitude | − | Vector mobility (at regional-level) | Bivariate statistics | |
| Census data | Land use | Infrastructure level | Drainage | − | Vector breeding sites (at large-admin level) | ||
| Public services availability | − | Human-Vector encounter (at large-admin level) | |||||
| 22 [156] | GIS data (GPS data logger) | Human mobility | Number of visits out of the municipality’s administrative limits | + | Human and virus mobility (at city level) | Conditionnal and multiple logistic regression | |
| 23 [157] | GIS data | Land use | Urban Typology | Residential with commercial industrial areas | + | Human-Vector encounter (at small-admin level) | Layers super-imposition |
| Infrastructure level | Water network and built-up areas | + | |||||
| Urban Typology | Informal settlements areas | + | |||||
| 24 [158] | Survey questionnaire GIS data | Entomological observation | Aedes house index | + | Vector exposure (at neighborhood-level) | Linear correlation (Spearmann) | |
| 25 [159] | Survey questionnaire | Entomological observation | Discarded containers | + | Vector breeding sites (at household-level) | Univariate and Multivariate analysis (Odds Ratio) | |
| Discarded tire casings | + | ||||||
| Infested discarded plastic containers | + | ||||||
| Infested discarded cans | + | ||||||
| 26 [160] | Survey questionnaire | Housing type and characteristics | Construction material | Wood-construction | NS | Vectors exposure (at household-level) | Multiple logistic regression (Odds ratios) |
| Housing type | Single-level houses | − | |||||
| Land cover | Vegetation | Tree height | + | Vectors resting sites (at household-level) | |||
| Topography | % Shaded | + | |||||
| Land use | Urban Typology | Lot size | NS | Human density (at neighborhood-level) | |||
| Neighbor proximity | − | ||||||
| Land cover | Vegetation | Distance house-vegetation | + | Vector exposure (at household-level) | |||
| Entomological observation | % households with Aedes albopictus larvae | NS | Vector breeding sites (at neighborhood-level) | ||||
| Housing type and characteristics | Housing characteristics | Home with birds | + | Vector exposure (at household-level) | |||
| Screens on windows | − | ||||||
| 27 [161] | Survey questionnaire | Topography | Street orientation to the wind | + | Vectors mobility (at small-admin level) | Odds ratios | |
| Housing type and characteristics | Housing characteristics | Gutter-rain water | + | Vector breeding sites (at small-admin level) | |||
| Land use | Infrastructure level | Inefficient waste collection | + | ||||
| 28 [162] | Survey questionnaire | Land use | Urban Typology | Slum area | + | Human-Vector encounter (at neighborhood-level) | Generalized Additive Model (GAM) |
| Entomological observation | Mosquito abundance | NS | Vector exposure (at neighborhood-level) | ||||
| Land use | Urban Typology | Commercial activity areas with human movements | + | Human-Vector encounter at neighborhood-level | |||
| 29 [163] | MODIS image | Land cover | Vegetation | NDVI | − | Vector breeding and resting sites (at city level) | Spearman correlation GLMM |
| GIS data | Forest | − | |||||
| Grassland | − | ||||||
| Land use | Cropland | Agricultural areas | − | ||||
| Urban typology | Park | + | |||||
| 30 [164] | Survey questionnaire | Housing type and characteristics | Housing characteristics | Highly shaded patio | + | Vector breeding site (at household level) | Bivariate analysis using Chi-square, Fisher’s Exact or t-tests |
| Proximity to abandoned property | + | ||||||
| Lack of piped water inside the house | + | ||||||
| Daily garbage collection | − | ||||||
| Standing water in various recipient types | NS | ||||||
| Screens on all windows | NS | Vector exposure (at household level) | |||||
| 31 [165] | Quickbird image | Land cover | Urban typology | % of built-up area with vegetation surrounding | + | Human-vector encounter (at neighborhood-level) | Spearman and Pearson correlation |
| Only built-up area | − | ||||||
| Topographic data | Topography | Altitude | − | Vector mobility (at large admnistrative-level) | |||
| 32 [166] | SPOT 5 image | Land use | Urban Typology | Quality of neighborhood | − | Human-Vector encounter (at large-admin level) | GWR |
| 33 [167] | Survey questionnaire | Entomological observation | Aedes aegypti population density | + | Vector exposure (at neighborhood-level) | Spearman correlation coefficient | |
| Aedes albopictus population density | NS | ||||||
| 34 [168] | Survey questionnaire | Entomological observation | % of houses with larva on the premises | + | Vector exposure (at household-level) | Odds ratios | |
| % of houses with uncovered water containers | + | Vector breeding sites (at neighborhood level) | |||||
| Topographic data | Topography | Altitude | − | Vector mobility (at regional level) | |||
| 35 [169] | Survey questionnaire | Land use | Urban Typology | Commercial ecotype | NS | Human-Vector encounter (at neigborhood-level) | Uni, multi-variate hierarchical logistic regression |
| DENPURA ecotype | NS | ||||||
| RCDENPURA ecotype | + | ||||||
| RC ecotype | NS | ||||||
| Human immunity | Historical dengue risk areas | + | Virus exposition (at small-admin level) | ||||
| Housing type and characteristics | Housing characteristics | Number of house floors | NS | Vector exposure (at household-level) | |||
| Floor of principal living | NS | ||||||
| Construction material | Construction material of house | NS | |||||
| Housing characteristics | Number of house windows | NS | |||||
| Having screens for house windows | + | ||||||
| Having a yard/open space | NS | ||||||
| Having bushes in a yard/ open space | NS | ||||||
| House attachment | NS | ||||||
| 36 [170] | MODIS-VI image | Land use | Urban Typology | % of construction area | + | Human-Vector encounter (at large-admin level) | Generalized linear model logistic regression |
| Land cover | Vegetation | % of shrubs | + | Vector resting and breeding sites (at large-admin level) | |||
| Water-areas | % of wet grassland | + | |||||
| % of water area | + | ||||||
| Land use | Cropland | % of paddy field | + | ||||
| 37 [171] | GIS data | Land use | Infrastructure level | High-density road networks | + | Human and virus mobility (at neighborhood-level) | Analysis of Variance (ANOVA) |
| Proximity to narrow roads | + | ||||||
| 38 [172] | Survey questionnaire | Housing type and characteristics | Housing characteristics | Poor housing condition | + | Human-Vector encounter (at small-admin level) | (Moran’s I) Negative binomial model |
| Land use | Infrastructure level | Access to paved road | − | ||||
| Housing type and characteristics | Housing type | Unoccupied houses | NS | ||||
| 39 [173] | Survey questionnaire (the National Bureau of Statistics of China) | Land use | Urban typology | Urban, urban-rural and rural communities | NS | Human-vector encounter (at neighborhood-level) | Univariate logistic regression Stepwise logistic regression |
| 40 [174] | Google earth | Land cover | Urban Typology | % of built-up area | + | Human-vector encounter (at large admin-level) | Descriptive statistical analysis |
| 41 [175] | Landsat 7, Landsat 8, IRS-P6, and Sentinel-2 | Land cover | Urban typology | Built-up density | + | Human-vector encounter (at city-level) | Poisson regression |
| Water areas | Distance from water bodies | − | Vector breeding site (at city-level) | ||||
| Vegetation | Vegetation density | − | Vector resting site (at city-level) | ||||
| Topography data and high resolution satellite images | Land use | Infrastructure level | Distance from drainage networks | − | Vector breeding site (at city-level) | ||
| 42 [176] | Landsat | Land cover | Vegetation | Normalized difference vegetation index (NDVI) | + | Vectors breeding and resting sites (at small-admin level) | Pearson coefficient Bayesian model |
| MODIS | Surface Temperature | Urban heat islands (UHI) | NS | Vectors and Virus replication (at small-admin level) | |||
| 43 [177] | Survey questionnaire | Housing type and characteristics | Housing characteristics | Presence of house screening | − | Human-Vector encounter (at household-level) | Stepwise logisticregression analysis (odds ratio) |
| Presence of rainwater tanks on the property/two residential blocks | + | ||||||
| Presence of evaporative cooling units | NS | ||||||
| Human immunity | Presence of a suspected case of dengue household / two residential blocks | + | |||||
| 44 [178] | Census data | Human density | Human density | + | Human-Vector encounter (at small-admin level) | Pearson, Spearmann, and multiple analysis | |
| Housing type and characteristics | Housing characteristics | % of well-condition house | − | ||||
| % of poor-condition house | + | ||||||
| MODIS | Land cover | Vegetation | Enhanced Vegetation Index | + | Vectors breeding and resting sites (at large scale) | ||
| Topographic data | Topography | Altitude of city center | − | Vector mobility (at large scale) | |||
| 45 [179] | Landsat image | Land cover | Vegetation | NDVI | − | Vector breeding and resting sites (at city level) | Simple linear regression |
| 46 [180] | Survey questionnaire | Housing type and characteristics | Housing type | % of one-story home | + | Vector exposure (at small-admin level) | Spatial regression |
| 47 [181] | Landsat 8-OLI TIRS | Land cover | Vegetation | NDVI | NS | Vector breeding or resting sites (at large amnistrative-level) | Linear stepwise regression |
| Water areas | NDWI | NS | |||||
| Urban typology | NDBI | NS | Human-vector encounter (at large amnistrative-level) | ||||
| Surface temperature | LST | NS | Vectors and virus replication (at large amnistrative-level) | ||||
| 48 [182] | Survey questionnaire | Housing type and characteristics | Housing type | Apartment | − | Vector exposure (at household-level) | OR (95% CI) Logistic regression |
| House/shanty | + | ||||||
| 49 [183] | Survey questionnaire | Land use | Urban Typology | Temporary/unplanned/slum | − | Human-Vector encounter (at neighborhood-level) | Uni, multi-variate hierarchical logistic regression |
| Housing type and characteristics | Housing type | Multi-floor building | − | ||||
| Single story attached building | − | ||||||
| Single story detached building | + | ||||||
| 50 [184] | Census data | Infrastructure level | Urban Typology | Prefectural boundary | + | Human-Vector encounter (at small-admin level) | GAM |
| Land use | Urban and rural | + | |||||
| Human density | Human density | + | Human exposure to virus (at small-admin level) | ||||
| GIS data | Land use | Infrastructure level | Road density | + | Human mobility (at small-admin level) | ||
| Remote sensing images (unknow sensor) | Land cover | Vegetation | Normalized Difference Vegetation Index (NDVI) | + | Vectors breeding and resting sites (at small-admin level) | ||
| 51 [185] | GIS data | Land use | Urban typology | Urban village | + | Human-vector encounter (at large amnistrative-level) | Generalized additive model (GAM) |
| Urban-rural fringe areas | + | ||||||
| Infrastructure level | Road density | + | Human mobility (at large amnistrative-level) | ||||
| Remote sensing images (not clear) | Land cover | Vegetation | NDVI | − | Vector breeding or resting sites (at large amnistrative-level) | ||
| 52 [186] | Survey questionnaire | Housing type and characteristics | Housing characteristics | Absence of air conditioning | + | Vector exposure (at household-level) | Univariate and Multivariate analyis |
| Human mobility | No history of outside-travel | + | Human mobility (at regional-level) | ||||
| Land use | Urban Typology | Distances to neighboring houses | + | Human-Vector encounter (at neighborhood-level) | |||
| 53 [187] | GF-2 satellite image ? | Land use | Urban typology | Urban villages associated to public transport | + | Human-vector encounter (at large amnistrative-level) | Pearson correlation and Geographically weighted regression (GWR) |
| 54 [188] | World View 2 image | Land use | Urban typology | Mean size of pitched roof | + | Vectors breeding and resting sites (at neighborhood-level) | (Moran’s I) GWR |
| Mean size of flatted roof | − | ||||||
| 55 [189] | Survey questionnaire | Entomologic observations | Number of female Aedes aegypti per person | + | Vector exposure (at household-level) | Univariate and multivariate logistic regression methods | |
| Housing type and characteristics | Construction material | Concrete construction | + | ||||
| Wood construction | NS | ||||||
| Housing characteristics | Animals on the property | NS | |||||
| No air conditioner device | + | ||||||
| No use of screens on windows | + | ||||||
| 56 [190] | LANDSAT 5 TM satellite image | Land cover | Water-areas | Distance to river | + | Human-Vector encounter (at neigborhood-level) | Visual interpretation Pearson correlation coefficient |
| Vegetation | Distance to Vegetation | + | |||||
| Vegetation | Tasseled cap vegetation | + | Vectors breeding and resting sites (at neighborhood-level) | ||||
| Water-areas | Tasseled cap wetness | + | |||||
| Built-up | Tasseled cap brightness | + | Human presence (at neighborhood-level) | ||||
| 57 [191] | ALOS Google Earth GIS data | Land use | Urban Typology | Dense populated areas surrounded by vegetation | + | Vector exposure (at neighborhood-level) | Geo-spatial analysis |
| Institutions 40%, religious places (18%) market (15%) | + | Human-Vector encounter (at neighborhood-level) | |||||
| 58 [192] | Census, OSM and GIS data | Land use | Urban Typology | High-rise housing | − | Human-Vector encounter (at neighborhood-level) | Chi-square test |
| Low-rise housing | + | ||||||
| Infrastructure level | Density of the urban drainage network | + | Vectors breeding sites (at neighborhood-level) | ||||
| Entomological survey | Entomological observation | Pupal density per 1000 population | NS | Vectors breeding sites (at neighborhood-level) | Pearson Coefficient | ||
| 59 [193] | Census data | Land use | Urban Typology | Composite normalized housing condition index | + | Human-Vector encounter (at neighborhood-level) | Global linear model |
| Infrastructure level | Short distance from hospital | + | Dengue reporting (at neighborhood-level) | ||||
| Access to piped water | + | Vectors breeding sites (at neighborhood-level) | |||||
| Entomological survey | Entomological observation | Breteau Index | NS | Vectors breeding sites (at neighborhood-level) | |||
| 60 [194] | Entomological survey | Entomological observation | Breteau index | NS | Vectors breeding sites at household-level | Correlation coefficient | |
| House index | NS | ||||||
| 61 [195] | Census data | Human density | Human density | + | Human exposure to virus (at neighborhood-level) | Pearson cooefficients | |
| Entomological survey | Entomological observation | Premise index | NS | Vectors breeding sites at neighborhood-level | Risk ratio | ||
| 62 [196] | Census data | Human density | % of urban population | + | Human exposure to virus (at small-admin level) | Spearmann coefficient Multi-linear regression | |
| Land use | Infrastructure level | % of population connected to water network | − | Vectors breeding sites (at small-admin level) | |||
| % of coverage by Family health program | − | Human exposure to virus (at small-admin level) | |||||
| 63 [197] | Census data | Land cover | Vegetation | Distance from forested areas | − | Human-Vector encounter (at neighborhood-level) | |
| Land use | Infrastructure level | Proximity to a sentinel hospital | − | Virus observation (at small-admin level) | |||
| Urban Typology | Deprived areas with medium-high human densities | + | Human-Vector encounter (at small-admin level) | ||||
| Rich areas | + | ||||||
| 64 [198] | Topographic survey | Topography | Mean Altitude | − | Vector mobility (at city-level) | Pearson Coefficient | |
| 65 [199] | Survey questionnaire | Land use | Urban Typology | House density | NS | Human-Vector encounter (at small-admin level) | Pearson coefficient |
| % of shop-houses | + | ||||||
| % of single houses | − | ||||||
| Land cover | % of building | NS | |||||
| Land use | % of slum | − | |||||
| Housing type and characteristics | Housing type | % of empty houses | + | ||||
| Construction material | % of brick-made houses | + | |||||
| % of brick-made/wood houses | NS | ||||||
| Land use | Infrastructure level | % of houses with garbage system | + | ||||
| % of houses with poor drainage system | NS | ||||||
| Housing type and characteristics | Housing characteristics | % of houses without window screens | NS | ||||
| 66 [200] | Landsat image | Land cover | Water-areas | Water surface | + | Vector breeding sites and vector mobility (at city-level) | Linear correlation |
| 67 [201] | Google Earth | Land use | Urban Typology | % of developed land | + | Human-Vector encounter (at neighborhood-level) | Spearman correlation coefficient |
| Land cover | Vegetation | % of Vegetation | − | ||||
| Water-areas | % of water surface | NS | |||||
| 68 [202] | Survey questionnaire | House type and characteristics Entomological observation | House characteristics | Living near open sewers | + | Vector exposure (at household-level) | Odds ratios |
| Mosquitoes presence in the house | + | ||||||
| 69 [203] | MODIS-ASTER | Land cover | Vegetation | EVI-NDVI | − | Vectors breeding and resting sites (at small-admin level) | Pearson coefficient |
| Quickbird | Land cover | Urban Typology | % Built area | NS | Human-Vector encounter (at small-admin level) | ||
| Vegetation | % Tree area | NS | Vectors breeding and resting sites (at small-admin level) | ||||
| Urban Typology | % Built area | − | Human-Vector encounter (at small-admin level) | ||||
| Vegetation | % Tree cover | + | Vectors breeding and resting sites (at small-admin level) | ||||
| 70 [204] | Survey questionnaire | Housing type and characteristics | Construction material | Wood Households | + | Vector exposure (at household-level) | Logistic regression |
| Stone and concrete | NS | ||||||
| Combination of stone and wood | NS | ||||||
| Housing characteristics | Screened windows | − | |||||
| Landsat image | Land use | Cropland | Distance to orchards | + | Human-Vector encounter (at neighborhood-level) | ||
| Vegetation | Distance to sparely Vegetation | NS | |||||
| Land cover | Urban Typology | % of densely built area in 200 m | − | ||||
| 71 [205] | Survey questionnaire | Housing type and characteristics | Construction material | Wood/bamboo Households | − | Vector exposure (at household-level) | Logistic regression |
| Stone Households | + | ||||||
| Combination of stone and wood | + | ||||||
| Housing characteristics | Bednets | − | |||||
| Land use | Cropland | Distance to orchards | − | Human-Vector encounter (at neighborhood-level) | |||
| Landsat 5 image and GIS data | Land cover | Water-areas | Distance to waterbodies | + | |||
| Bare soils | % of bare soil in 200 m-buffer | − | |||||
| Land use | Urban Typology | % of village area with Vegetation | NS | ||||
| 72 [206] | Survey questionnaire | Housing type and characteristics | Housing characteristics | Housing size | NS | Vector exposure (at household-level) | Bivariate analysis using t-test (ratio scale) and chi square (test nominal) scale |
| Non permanent wall | + | Vector breeding site (at household-level) | |||||
| 73 [207] | Survey questionnaire | Land use | Urban Typology | Slum housing | + | Human-Vector encounter (at neighborhood-level) | Univariate and Multivariate analysis |
| Land cover | Vegetation | Tree height | + | Vectors resting sites (at household-level) | |||
| Topography | Shade | + | |||||
| Housing type and characteristics | Housing Characteristics | Screens on windows | − | Vector exposure (at household-level) | |||
| Construction material | Wood structure | + | |||||
| Entomological observations | Day-biting mosquitoes | + | |||||
| 74 [208] | Survey questionnaire | Land cover | Bare soils | Vacant grounds | + | Vectors breeding and resting sites (at small-admin level) | Univariate and Multivariate analysis |
| Land use | Urban Typology | Empty house | + | ||||
| Markets-parks | NS | Human-Vector encounter (at small-admin level) | |||||
| Human density | Population density | + | |||||
| Human mobility | Commuting patterns | + | Human and virus mobility (at regional level) | ||||
| 75 [209] | Survey questionnaire | Land use | Urban Typology | High rise residential apartment | + | Human-Vector encounter (at neighborhood-level) | t-test analysis analysis of variance, chi square, Uni-variate and multivariate logistic regression |
| Housing type and characteristics | Housing characteristics | Terraced house | − | Vectors breeding and resting sites (at household-level) | |||
| Vegetation surround | − | ||||||
| Land use | Urban Typology | Single house | − | Human-Vector encounter (at neighborhood-level) | |||
| Entomological observation | Mosquito problem | + | Vector exposure (at household-level) | ||||
| 76 [210] | GF-1 image | Land cover | Water | NDWI | + | Vector breeding and resting sites (at neighborhood-level) | Spearman rank correlation and Ordinary least square (OLR) |
| MODIS image | Surface water | LST day | + | Vector resting site and virus replication (at neighborhood-level) | |||
| LST night | + | ||||||
| 77 [211] | Survey questionnaire | Housing type and characteristics | Housing characteristics | Multi-storey public flats | NS | Vector exposure (at household-level) | Multi-level logistic regression |
| Multi-storey private flats | NS | ||||||
| Land use | Urban Typology | Landed houses | NS | ||||
| Human mobility | Use of public transportation | NS | Human mobility (at small-admin level) | ||||
| Foreign workers dormitory or hostel | + | Human mobility (at regional level) | |||||
| 78 [212] | Landsat 7 ETM+ image | Land cover | Vegetation | Vegetation coverage | + | Vectors breeding and resting sites (at neighborhood-level) | Univariable and multivariable generalized linear model |
| Census data | Housing type and characteristics | Human density | Households crowding | + | Human-Vector encounter (at neighborhood-level) | ||
| Households density | NS | ||||||
| Housing type and characteristics | Housing type | Old buildings | + | Vector exposure (at household-level) | |||
| Degraded loggings | NS | ||||||
| Apartment 2008–2009 | − | ||||||
| Apartment 2012–2013 | − | ||||||
| Construction material | Cement loggings 2008–2009 | NS | |||||
| Cement loggings 2012–2013 | + | ||||||
References
- World Health Organization. Global Strategy for Dengue Prevention and Control, 2012–2020; World Health Organization: Geneva, Switzerland, 2012. [Google Scholar]
- Bhatt, S.; Gething, P.W.; Brady, O.J.; Messina, J.P.; Farlow, A.W.; Moyes, C.L.; Drake, J.M.; Brownstein, J.S.; Hoen, A.G.; Sankoh, O.; et al. The global distribution and burden of dengue. Nature 2013, 496, 504–507. [Google Scholar] [CrossRef]
- Gubler, D.J. Dengue, Urbanization and Globalization: The Unholy Trinity of the 21(st) Century. Trop. Med. Health 2011, 39, 3–11. [Google Scholar] [CrossRef] [Green Version]
- Li, Y.; Kamara, F.; Zhou, G.; Puthiyakunnon, S.; Li, C.; Liu, Y.; Zhou, Y.; Yao, L.; Yan, G.; Chen, X.G. Urbanization Increases Aedes albopictus Larval Habitats and Accelerates Mosquito Development and Survivorship. PLoS Negl. Trop. Dis. 2014, 8. [Google Scholar] [CrossRef] [Green Version]
- Zahouli, J.; Koudou, B.; Müller, P.; Malone, D.; Tano, Y.; Utzinger, J. Urbanization is a main driver for the larval ecology of Aedes mosquitoes in arbovirus-endemic settings in south-eastern Côte d’Ivoire. PLoS Negl. Trop. Dis. 2017, 11. [Google Scholar] [CrossRef] [Green Version]
- Neiderud, C.J. How urbanization affects the epidemiology of emerging infectious diseases. Infect. Ecol. Epidemiol. 2015, 5, 27060. [Google Scholar] [CrossRef] [PubMed]
- Rodrigues, M.; Marques, G.; Serpa, L.; Arduino, M.; Voltolini, J.; Barbosa, G.; Andrade, V.; de Lima, V. Density of Aedes aegypti and Aedes albopictus and its association with number of residents and meteorological variables in the home environment of dengue endemic area, São Paulo, Brazil. Parasites Vectors 2015, 8, 115. [Google Scholar] [CrossRef] [PubMed] [Green Version]
- Kraemer, M.; Sinka, M.; Duda, K.; Mylne, A.; Shearer, F.; Barker, C.; Moore, C.; Carvalho, R.; Coelho, G.; Van Bortel, W.; et al. The global distribution of the arbovirus vectors Aedes aegypti and Ae. Albopictus. eLife 2015, 4. [Google Scholar] [CrossRef]
- Powell, J.R.; Tabachnick, W.J.; Powell, J.R.; Tabachnick, W.J. History of domestication and spread of Aedes aegypti—A Review. Memórias Inst. Oswaldo Cruz 2013, 108, 11–17. [Google Scholar] [CrossRef] [PubMed]
- Sallam, M.F.; Fizer, C.; Pilant, A.N.; Whung, P.Y. Systematic Review: Land Cover, Meteorological, and Socioeconomic Determinants of Aedes Mosquito Habitat for Risk Mapping. Int. J. Environ. Res. Public Health 2017, 14, 1230. [Google Scholar] [CrossRef] [PubMed] [Green Version]
- Waldock, J.; Chandra, N.L.; Lelieveld, J.; Proestos, Y.; Michael, E.; Christophides, G.; Parham, P.E. The role of environmental variables on Aedes albopictus biology and chikungunya epidemiology. Pathog. Glob. Health 2013, 107, 224–241. [Google Scholar] [CrossRef] [PubMed] [Green Version]
- Carrington, L.B.; Simmons, C.P. Human to Mosquito Transmission of Dengue Viruses. Front. Immunol. 2014, 5. [Google Scholar] [CrossRef] [PubMed] [Green Version]
- Scott, T.W.; Morrison, A. Aedes aegypti density and the risk of dengue-virus transmission. Frontis 2004, 2, 187–206. [Google Scholar]
- Kuno, G. Factors Influencing the Transmission of Dengue Viruses; Gubler, D.J., Kuno, G., Eds.; CABI: New York, NY, USA, 1997; Volume 1. [Google Scholar]
- Recker, M.; Blyuss, K.B.; Simmons, C.P.; Hien, T.T.; Wills, B.; Farrar, J.; Gupta, S. Immunological serotype interactions and their effect on the epidemiological pattern of dengue. Proc. R. Soc. Lond. B Biol. Sci. 2009. [Google Scholar] [CrossRef] [PubMed]
- Salje, H.; Lessler, J.; Endy, T.P.; Curriero, F.C.; Gibbons, R.V.; Nisalak, A.; Nimmannitya, S.; Kalayanarooj, S.; Jarman, R.G.; Thomas, S.J.; et al. Revealing the microscale spatial signature of dengue transmission and immunity in an urban population. Proc. Natl. Acad. Sci. USA 2012, 109, 9535–9538. [Google Scholar] [CrossRef] [PubMed] [Green Version]
- Ferraguti, M.; Martínez-de la Puente, J.; Roiz, D.; Ruiz, S.; Soriguer, R.; Figuerola, J. Effects of landscape anthropization on mosquito community composition and abundance. Sci. Rep. 2016, 6. [Google Scholar] [CrossRef] [Green Version]
- Achee, N.L.; Gould, F.; Perkins, T.A.; Reiner, R.C., Jr.; Morrison, A.C.; Ritchie, S.A.; Gubler, D.J.; Teyssou, R.; Scott, T.W. A Critical Assessment of Vector Control for Dengue Prevention. PLoS Negl. Trop. Dis. 2015, 9, e0003655. [Google Scholar] [CrossRef]
- Pérez, S.; Laperrière, V.; Borderon, M.; Padilla, C.; Maignant, G.; Oliveau, S. Evolution of research in health geographics through the International Journal of Health Geographics (2002–2015). Int. J. Health Geogr. 2016, 15. [Google Scholar] [CrossRef] [Green Version]
- Favier, C.; Schmit, D.; Müller-Graf, C.D.M.; Cazelles, B.; Degallier, N.; Mondet, B.; Dubois, M.A. Influence of Spatial Heterogeneity on an Emerging Infectious Disease: The Case of Dengue Epidemics. Proc. Biol. Sci. 2005, 272, 1171–1177. [Google Scholar] [CrossRef]
- Oliveira, M.A.d.; Ribeiro, H.; Castillo-Salgado, C. Geospatial analysis applied to epidemiological studies of dengue: A systematic review. Rev. Bras. Epidemiol. 2013, 16, 907–917. [Google Scholar] [CrossRef] [Green Version]
- Guo, C.; Zhou, Z.; Wen, Z.; Liu, Y.; Zeng, C.; Xiao, D.; Ou, M.; Han, Y.; Huang, S.; Liu, D.; et al. Global Epidemiology of Dengue Outbreaks in 1990–2015: A Systematic Review and Meta-Analysis. Front. Cell. Infect. Microbiol. 2017, 7. [Google Scholar] [CrossRef]
- Reiner, R.C.; Stoddard, S.T.; Scott, T.W. Socially structured human movement shapes dengue transmission despite the diffusive effect of mosquito dispersal. Epidemics 2014, 6, 30–36. [Google Scholar] [CrossRef] [PubMed] [Green Version]
- LaDeau, S.L.; Allan, B.F.; Leisnham, P.T.; Levy, M.Z. The ecological foundations of transmission potential and vector-borne disease in urban landscapes. Funct. Ecol. 2015, 29, 889–901. [Google Scholar] [CrossRef] [Green Version]
- Ostfeld, R.S.; Glass, G.E.; Keesing, F. Spatial epidemiology: An emerging (or re-emerging) discipline. Trends Ecol. Evol. 2005, 20, 328–336. [Google Scholar] [CrossRef] [PubMed]
- Jacquez, G.M. Spatial analysis in epidemiology: Nascent science or a failure of GIS? J. Geogr. Syst. 2000, 2, 91–97. [Google Scholar] [CrossRef]
- Lawson, A.B. Statistical Methods in Spatial Epidemiology; John Wiley & Sons: Hoboken, NJ, USA, 2013. [Google Scholar]
- Rezaeian, M.; Dunn, G.; St Leger, S.; Appleby, L. Geographical epidemiology, spatial analysis and geographical information systems: A multidisciplinary glossary. J. Epidemiol. Community Health 2007, 61, 98–102. [Google Scholar] [CrossRef] [PubMed] [Green Version]
- Stevens, K.B.; Pfeiffer, D.U. Sources of spatial animal and human health data: Casting the net wide to deal more effectively with increasingly complex disease problems. Spat. Spatio-Temporal Epidemiol. 2015, 13, 15–29. [Google Scholar] [CrossRef] [PubMed]
- Kalluri, S.; Gilruth, P.; Rogers, D.; Szczur, M. Surveillance of Arthropod Vector-Borne Infectious Diseases Using Remote Sensing Techniques: A Review. PLoS Pathog. 2007, 3, e116. [Google Scholar] [CrossRef] [PubMed]
- Marechal, F.; Ribeiro, N.; Lafaye, M.; Güell, A. Satellite imaging and vector-borne diseases: The approach of the French National Space Agency (CNES). Geospat. Health 2008, 3, 1. [Google Scholar] [CrossRef] [Green Version]
- Machault, V.; Vignolles, C.; Borchi, F.; Vounatsou, P.; Pages, F.; Briolant, S.; Lacaux, J.P.; Rogier, C. The use of remotely sensed environmental data in the study of malaria. Geospat. Health 2011, 5, 151–168. [Google Scholar] [CrossRef] [Green Version]
- Viana, J.; Santos, J.; Neiva, R.; Souza, J.; Duarte, L.; Teodoro, A.; Freitas, A. Remote Sensing in Human Health: A 10-Year Bibliometric Analysis. Remote Sens. 2017, 9, 1225. [Google Scholar] [CrossRef] [Green Version]
- Herbreteau, V.; Salem, G.; Souris, M.; Hugot, J.P.; Gonzalez, J.P. Thirty years of use and improvement of remote sensing, applied to epidemiology: From early promises to lasting frustration. Health Place 2007, 13, 400–403. [Google Scholar] [CrossRef] [PubMed]
- Herbreteau, V.; Kassié, D.; Roux, E.; Marti, R.; Catry, T.; Attoumane, A.; Révillion, C.; Commins, J.; Dessay, N.; Mangeas, M.; et al. Observer la Terre pour appréhender spatialement les inégalités de santé : regard historique et prospectif sur l’utilisation de la télédétection dans le domaine de la santé. Confins 2018, 37. [Google Scholar] [CrossRef]
- Louis, V.R.; Phalkey, R.; Horstick, O.; Ratanawong, P.; Wilder-Smith, A.; Tozan, Y.; Dambach, P. Modeling tools for dengue risk mapping—A systematic review. Int. J. Health Geogr. 2014, 13, 50. [Google Scholar] [CrossRef] [PubMed] [Green Version]
- Morin, C.W.; Comrie, A.C.; Ernst, K. Climate and Dengue Transmission: Evidence and Implications. Environ. Health Perspect. 2013. [Google Scholar] [CrossRef]
- Beale, L.; Abellan, J.J.; Hodgson, S.; Jarup, L. Methodologic Issues and Approaches to Spatial Epidemiology. Environ. Health Perspect. 2008, 116, 1105–1110. [Google Scholar] [CrossRef] [Green Version]
- Brady, O.J.; Gething, P.W.; Bhatt, S.; Messina, J.P.; Brownstein, J.S.; Hoen, A.G.; Moyes, C.L.; Farlow, A.W.; Scott, T.W.; Hay, S.I. Refining the global spatial limits of dengue virus transmission by evidence-based consensus. PLoS Negl. Trop. Dis. 2012, 6, e1760. [Google Scholar] [CrossRef]
- Grant, M.J.; Booth, A. A typology of reviews: an analysis of 14 review types and associated methodologies. Health Inf. Libr. J. 2009, 26, 91–108. [Google Scholar] [CrossRef]
- Arksey, H.; O’Malley, L. Scoping studies: Towards a methodological framework. Int. J. Soc. Res. Methodol. 2005, 8, 19–32. [Google Scholar] [CrossRef] [Green Version]
- Munn, Z.; Peters, M.D.J.; Stern, C.; Tufanaru, C.; McArthur, A.; Aromataris, E. Systematic review or scoping review? Guidance for authors when choosing between a systematic or scoping review approach. BMC Med. Res. Methodol. 2018, 18, 143. [Google Scholar] [CrossRef]
- Liberati, A.; Altman, D.G.; Tetzlaff, J.; Mulrow, C.; Gøtzsche, P.C.; Ioannidis, J.P.A.; Clarke, M.; Devereaux, P.J.; Kleijnen, J.; Moher, D. The PRISMA Statement for Reporting Systematic Reviews and Meta-Analyses of Studies That Evaluate Health Care Interventions: Explanation and Elaboration. PLoS Med. 2009, 6, e1000100. [Google Scholar] [CrossRef]
- Parr, J.B. Spatial Definitions of the City: Four Perspectives. Urban Stud. 2007, 44, 381–392. [Google Scholar] [CrossRef]
- Pesaresi, M.; Corbane, C.; Julea, A.; Florczyk, A.J.; Syrris, V.; Soille, P. Assessment of the Added-Value of Sentinel-2 for Detecting Built-up Areas. Remote Sens. 2016, 8, 299. [Google Scholar] [CrossRef] [Green Version]
- Esch, T.; Bachofer, F.; Heldens, W.; Hirner, A.; Marconcini, M.; Palacios-Lopez, D.; Roth, A.; Üreyen, S.; Zeidler, J.; Dech, S.; et al. Where We Live—A Summary of the Achievements and Planned Evolution of the Global Urban Footprint. Remote Sens. 2018, 10, 895. [Google Scholar] [CrossRef] [Green Version]
- Liu, X.; Hu, G.; Chen, Y.; Li, X.; Xu, X.; Li, S.; Pei, F.; Wang, S. High-resolution multi-temporal mapping of global urban land using Landsat images based on the Google Earth Engine Platform. Remote Sens. Environ. 2018, 209, 227–239. [Google Scholar] [CrossRef]
- Voss, P.H.; Rehfuess, E.A. Quality appraisal in systematic reviews of public health interventions: An empirical study on the impact of choice of tool on meta-analysis. J. Epidemiol. Community Health 2013, 67, 98–104. [Google Scholar] [CrossRef]
- Knutas, A.; Hajikhani, A.; Salminen, J.; Ikonen, J.; Porras, J. Cloud-based Bibliometric Analysis Service for Systematic Mapping Studies. In Proceedings of the 16th International Conference on Computer Systems and Technologies, Dublin, Ireland, 25–26 June 2015; ACM: New York, NY, USA, 2015; pp. 184–191. [Google Scholar]
- Aria, M.; Cuccurullo, C. bibliometrix: An R-tool for comprehensive science mapping analysis. J. Inf. 2017, 11, 959–975. [Google Scholar] [CrossRef]
- Van Eck, N.J.; Waltman, L. Software survey: VOSviewer, a computer program for bibliometric mapping. Scientometrics 2010, 84, 523–538. [Google Scholar] [CrossRef] [Green Version]
- Rigau-Pérez, J.G.; Clark, G.G.; Gubler, D.J.; Reiter, P.; Sanders, E.J.; Vance Vorndam, A. Dengue and dengue haemorrhagic fever. Lancet 1998, 352, 971–977. [Google Scholar] [CrossRef]
- Moran, P.A.P. Notes on Continuous Stochastic Phenomena. Biometrika 1950, 37, 17–23. [Google Scholar] [CrossRef]
- Maciel-de Freitas, R.; Lourenço-de Oliveira, R. Presumed unconstrained dispersal of Aedes aegypti in the city of Rio de Janeiro, Brazil. Rev. Saúde Pública 2009, 43, 8–12. [Google Scholar] [CrossRef] [Green Version]
- Longley, P.A. Geographical Information Systems: Will developments in urban remote sensing and GIS lead to ‘better’ urban geography? Prog. Hum. Geogr. 2002, 26, 231–239. [Google Scholar] [CrossRef]
- Schmidt, W.P.; Suzuki, M.; Thiem, V.D.; White, R.G.; Tsuzuki, A.; Yoshida, L.M.; Yanai, H.; Haque, U.; Tho, L.H.; Anh, D.D.; et al. Population density, water supply, and the risk of dengue fever in Vietnam: cohort study and spatial analysis. PLoS Med. 2011, 8, e1001082. [Google Scholar] [CrossRef] [PubMed]
- Mota, F.B.; Galina, A.C.; Silva, R.M.D. Mapping the dengue scientific landscape worldwide: a bibliometric and network analysis. Memórias Inst. Oswaldo Cruz 2017, 112, 354–363. [Google Scholar] [CrossRef] [PubMed] [Green Version]
- Malone, R.W.; Homan, J.; Callahan, M.V.; Glasspool-Malone, J.; Damodaran, L.; Schneider, A.D.B.; Zimler, R.; Talton, J.; Cobb, R.R.; Zika Response Working Group; et al. Zika Virus: Medical Countermeasure Development Challenges. PLoS Negl. Trop. Dis. 2016, 10, e0004530. [Google Scholar] [CrossRef] [PubMed] [Green Version]
- Shragai, T.; Tesla, B.; Murdock, C.; Harrington, L.C. Zika and chikungunya: mosquito-borne viruses in a changing world. Ann. N. Y. Acad. Sci. 2017, 1399, 61–77. [Google Scholar] [CrossRef] [PubMed] [Green Version]
- Lim, J.K.; Carabali, M.; Lee, J.S.; Lee, K.S.; Namkung, S.; Lim, S.K.; Ridde, V.; Fernandes, J.; Lell, B.; Matendechero, S.H.; et al. Evaluating dengue burden in Africa in passive fever surveillance and seroprevalence studies: protocol of field studies of the Dengue Vaccine Initiative. BMJ Open 2018, 8. [Google Scholar] [CrossRef] [PubMed]
- Amarasinghe, A.; Kuritsk, J.N.; Letson, G.W.; Margolis, H.S. Dengue virus infection in Africa. Emerg. Infect. Dis. 2011, 17, 1349–1354. [Google Scholar] [CrossRef] [PubMed]
- Messina, J.P.; Brady, O.J.; Golding, N.; Kraemer, M.U.G.; Wint, G.R.W.; Ray, S.E.; Pigott, D.M.; Shearer, F.M.; Johnson, K.; Earl, L.; et al. The current and future global distribution and population at risk of dengue. Nat. Microbiol. 2019, 4, 1508–1515. [Google Scholar] [CrossRef]
- Were, F. The dengue situation in Africa. Paediatr. Int. Child Health 2012, 32, 18–21. [Google Scholar] [CrossRef]
- Rodenhuis-Zybert, I.A.; Wilschut, J.; Smit, J.M. Dengue virus life cycle: Viral and host factors modulating infectivity. Cell. Mol. Life Sci. 2010, 67, 2773–2786. [Google Scholar] [CrossRef]
- Standish, K.; Kuan, G.; Avilés, W.; Balmaseda, A.; Harris, E. High Dengue Case Capture Rate in Four Years of a Cohort Study in Nicaragua Compared to National Surveillance Data. PLoS Negl. Trop. Dis. 2010, 4, e633. [Google Scholar] [CrossRef] [PubMed] [Green Version]
- Runge-Ranzinger, S.; McCall, P.J.; Kroeger, A.; Horstick, O. Dengue disease surveillance: An updated systematic literature review. Trop. Med. Int. Health 2014, 19, 1116–1160. [Google Scholar] [CrossRef] [PubMed]
- Vong, S.; Goyet, S.; Ly, S.; Ngan, C.; Huy, R.; Duong, V.; Wichmann, O.; Letson, G.W.; Margolis, H.S.; Buchy, P. Under-recognition and reporting of dengue in Cambodia: A capture–recapture analysis of the National Dengue Surveillance System. Epidemiol. Infect. 2012, 140, 491–499. [Google Scholar] [CrossRef] [PubMed] [Green Version]
- Salje, H.; Lessler, J.; Berry, I.M.; Melendrez, M.C.; Endy, T.; Kalayanarooj, S.; A-Nuegoonpipat, A.; Chanama, S.; Sangkijporn, S.; Klungthong, C.; et al. Dengue diversity across spatial and temporal scales: Local structure and the effect of host population size. Science 2017, 355, 1302–1306. [Google Scholar] [CrossRef] [PubMed] [Green Version]
- Openshow, S. A Million or So Correlation Coefficients, Three Experiments on the Modifiable Areal Unit Problem; Pion: London, UK, 1979. [Google Scholar]
- Arsenault, J.; Michel, P.; Berke, O.; Ravel, A.; Gosselin, P. How to choose geographical units in ecological studies: Proposal and application to campylobacteriosis. Spat. Spatio-Temporal Epidemiol. 2013, 7, 11–24. [Google Scholar] [CrossRef] [Green Version]
- Kienberger, S.; Hagenlocher, M. Spatial-explicit modeling of social vulnerability to malaria in East Africa. Int. J. Health Geogr. 2014, 13. [Google Scholar] [CrossRef] [Green Version]
- Lambin, E.F.; Tran, A.; Vanwambeke, S.O.; Linard, C.; Soti, V. Pathogenic landscapes: Interactions between land, people, disease vectors, and their animal hosts. Int. J. Health Geogr. 2010, 9, 54. [Google Scholar] [CrossRef] [Green Version]
- Mulligan, K.; Elliott, S.J.; Schuster-Wallace, C.J. Global public health policy transfer and dengue fever in Putrajaya, Malaysia: A critical discourse analysis. Crit. Public Health 2012, 22, 407–418. [Google Scholar] [CrossRef]
- Sagna, A.B.; Yobo, M.C.; Elanga Ndille, E.; Remoue, F. New Immuno-Epidemiological Biomarker of Human Exposure to Aedes Vector Bites: From Concept to Applications. Trop. Med. Infect. Dis. 2018, 3, 80. [Google Scholar] [CrossRef] [Green Version]
- Li, Z.; Catry, T.; Dessay, N.; Roux, E.; Mahé, E.; Seyler, F. Multi-sensor data fusion for identifying malaria environmental features. In Proceedings of the 2016 IEEE International Geoscience and Remote Sensing Symposium (IGARSS), Beijing, China, 10–15 July 2016; pp. 2529–2532. [Google Scholar]
- Li, Z.; Catry, T.; Dessay, N.; da Costa Gurgel, H.; Aparecido de Almeida, C.; Barcellos, C.; Roux, E. Regionalization of a Landscape-Based Hazard Index of Malaria Transmission: An Example of the State of Amapá, Brazil. Data 2017, 2, 37. [Google Scholar] [CrossRef] [Green Version]
- Albrieu-Llinás, G.; Espinosa, M.O.; Quaglia, A.; Abril, M.; Scavuzzo, C.M. Urban environmental clustering to assess the spatial dynamics of Aedes aegypti breeding sites. Geospat. Health 2018, 13. [Google Scholar] [CrossRef] [PubMed]
- Kassié, D.; Roudot, A.; Dessay, N.; Piermay, J.L.; Salem, G.; Fournet, F. Development of a spatial sampling protocol using GIS to measure health disparities in Bobo-Dioulasso, Burkina Faso, a medium-sized African city. Int. J. Health Geogr. 2017, 16. [Google Scholar] [CrossRef] [PubMed] [Green Version]
- Lang, S.; Hagenlocher, M.; Pernkopf, L.; Kienberger, S.; Tiede, D. Object-based multi-indicator representation of complex spatial phenomena. South-Eastern Eur. J. Earth Obs. Geomat. 2014, 3, 625–628. [Google Scholar]
- Sarfraz, M.; Tripathi, N.; Tipdecho, T.; Thongbu, T.; Kerdthong, P.; Souris, M. Analyzing the spatio-temporal relationship between dengue vector larval density and land-use using factor analysis and spatial ring mapping. BMC Public Health 2012, 12. [Google Scholar] [CrossRef] [PubMed] [Green Version]
- Cromwell, E.A.; Stoddard, S.T.; Barker, C.M.; Van Rie, A.; Messer, W.B.; Meshnick, S.R.; Morrison, A.C.; Scott, T.W. The relationship between entomological indicators of Aedes aegypti abundance and dengue virus infection. PLoS Negl. Trop. Dis. 2017, 11. [Google Scholar] [CrossRef]
- Bowman, L.R.; Donegan, S.; McCall, P.J. Is Dengue Vector Control Deficient in Effectiveness or Evidence? Systematic Review and Meta-analysis. PLoS Negl. Trop. Dis. 2016, 10, e0004551. [Google Scholar] [CrossRef] [Green Version]
- Roiz, D.; Wilson, A.L.; Scott, T.W.; Fonseca, D.M.; Jourdain, F.; Müller, P.; Velayudhan, R.; Corbel, V. Integrated Aedes management for the control of Aedes-borne diseases. PLoS Negl. Trop. Dis. 2018, 12, e0006845. [Google Scholar] [CrossRef] [Green Version]
- Khormi, H.M.; Kumar, L. Modeling dengue fever risk based on socioeconomic parameters, nationality and age groups: GIS and remote sensing based case study. Sci. Total. Environ. 2011, 409, 4713–4719. [Google Scholar] [CrossRef]
- Khormi, H.M.; Kumar, L. Assessing the risk for dengue fever based on socioeconomic and environmental variables in a geographical information system environment. Geospat. Health 2012, 6, 171–176. [Google Scholar] [CrossRef] [Green Version]
- Khormi, H.M.; Kumar, L. The importance of appropriate temporal and spatial scales for dengue fever control and management. Sci. Total. Environ. 2012, 430, 144–149. [Google Scholar] [CrossRef]
- Tran, A.; L’Ambert, G.; Lacour, G.; Benoît, R.; Demarchi, M.; Cros, M.; Cailly, P.; Aubry-Kientz, M.; Balenghien, T.; Ezanno, P. A rainfall- and temperature-driven abundance model for Aedes albopictus populations. Int. J. Environ. Res. Public Health 2013, 10, 1698–1719. [Google Scholar] [CrossRef] [PubMed] [Green Version]
- Tran, A.; Fall, A.G.; Biteye, B.; Ciss, M.; Gimonneau, G.; Castets, M.; Seck, M.T.; Chevalier, V. Spatial Modeling of Mosquito Vectors for Rift Valley Fever Virus in Northern Senegal: Integrating Satellite-Derived Meteorological Estimates in Population Dynamics Models. Remote Sens. 2019, 11, 1024. [Google Scholar] [CrossRef] [Green Version]
- Tran, A.; Mangeas, M.; Demarchi, M.; Roux, E.; Degenne, P.; Haramboure, M.; Goff, G.L.; Damiens, D.; Gouagna, L.C.; Herbreteau, V.; et al. Complementarity of empirical and process-based approaches to modelling mosquito population dynamics with Aedes albopictus as an example—Application to the development of an operational mapping tool of vector populations. PLoS ONE 2020, 15, e0227407. [Google Scholar] [CrossRef] [PubMed]
- Maneerat, S.; Daude, E. A spatial agent-based simulation model of the dengue vector Aedes aegypti to explore its population dynamics in urban areas. Ecol. Model. 2016, 333, 66–78. [Google Scholar] [CrossRef]
- Misslin, R.; Daudé, E. An environmental suitability index based on the ecological constraints of Aedes aegypti, vector of dengue. Rev. Int. Géomatique 2017, 27, 481–501. [Google Scholar] [CrossRef]
- Scavuzzo, J.M.; Trucco, F.; Espinosa, M.; Tauro, C.B.; Abril, M.; Scavuzzo, C.M.; Frery, A.C. Modeling Dengue vector population using remotely sensed data and machine learning. Acta Trop. 2018, 185, 167–175. [Google Scholar] [CrossRef] [PubMed] [Green Version]
- Champagne, C.; Cazelles, B. Comparison of stochastic and deterministic frameworks in dengue modelling. Math. Biosci. 2019, 310, 1–12. [Google Scholar] [CrossRef]
- Gloster, J.; Jones, A.; Redington, A.; Burgin, L.; Sørensen, J.H.; Turner, R.; Dillon, M.; Hullinger, P.; Simpson, M.; Astrup, P.; et al. Airborne spread of foot-and-mouth disease—Model intercomparison. Vet. J. 2010, 183, 278–286. [Google Scholar] [CrossRef] [Green Version]
- Tompkins, A.M.; Caporaso, L. Assessment of malaria transmission changes in Africa, due to the climate impact of land use change using Coupled Model Intercomparison Project Phase 5 earth system models. Geospat. Health 2016, 11. [Google Scholar] [CrossRef]
- Alirol, E.; Getaz, L.; Stoll, B.; Chappuis, F.; Loutan, L. Urbanisation and infectious diseases in a globalised world. Lancet Infect. Dis. 2011, 11, 131–141. [Google Scholar] [CrossRef]
- Pautasso, M. Ten Simple Rules for Writing a Literature Review. PLoS Comput. Biol. 2013, 9. [Google Scholar] [CrossRef] [PubMed]
- Tonne, C.; Basagaña, X.; Chaix, B.; Huynen, M.; Hystad, P.; Nawrot, T.S.; Slama, R.; Vermeulen, R.; Weuve, J.; Nieuwenhuijsen, M. New frontiers for environmental epidemiology in a changing world. Environ. Int. 2017, 104, 155–162. [Google Scholar] [CrossRef] [PubMed] [Green Version]
- Fritzell, C.; Rousset, D.; Adde, A.; Kazanji, M.; Kerkhove, M.D.V.; Flamand, C. Current challenges and implications for dengue, chikungunya and Zika seroprevalence studies worldwide: A scoping review. PLoS Negl. Trop. Dis. 2018, 12, e0006533. [Google Scholar] [CrossRef] [PubMed] [Green Version]
- Tjaden, N.B.; Caminade, C.; Beierkuhnlein, C.; Thomas, S.M. Mosquito-Borne Diseases: Advances in Modelling Climate-Change Impacts. Trends Parasitol. 2018, 34, 227–245. [Google Scholar] [CrossRef] [PubMed]
- Vega-Almeida, R.L.; Carrillo-Calvet, H.; Arencibia-Jorge, R. Diseases and vector: A 10 years view of scientific literature on Aedes aegypti. Scientometrics 2018, 115, 1627–1634. [Google Scholar] [CrossRef]
- Parselia, E.; Kontoes, C.; Tsouni, A.; Hadjichristodoulou, C.; Kioutsioukis, I.; Magiorkinis, G.; Stilianakis, N.I. Satellite Earth Observation Data in Epidemiological Modeling of Malaria, Dengue and West Nile Virus: A Scoping Review. Remote Sens. 2019, 11, 1862. [Google Scholar] [CrossRef] [Green Version]
- Lefebvre, A.; Sannier, C.; Corpetti, T. Monitoring Urban Areas with Sentinel-2A Data: Application to the Update of the Copernicus High Resolution Layer Imperviousness Degree. Remote Sens. 2016, 8, 606. [Google Scholar] [CrossRef] [Green Version]
- Pu, R.; Landry, S.; Yu, Q. Assessing the potential of multi-seasonal high resolution Pléiades satellite imagery for mapping urban tree species. Int. J. Appl. Earth Obs. Geoinf. 2018, 71, 144–158. [Google Scholar] [CrossRef]
- Jozdani, S.E.; Johnson, B.A.; Chen, D. Comparing Deep Neural Networks, Ensemble Classifiers, and Support Vector Machine Algorithms for Object-Based Urban Land Use/Land Cover Classification. Remote Sens. 2019, 11, 1713. [Google Scholar] [CrossRef] [Green Version]
- Yuan, Q.; Shen, H.; Li, T.; Li, Z.; Li, S.; Jiang, Y.; Xu, H.; Tan, W.; Yang, Q.; Wang, J.; et al. Deep learning in environmental remote sensing: Achievements and challenges. Remote Sens. Environ. 2020, 241, 111716. [Google Scholar] [CrossRef]
- Zheng, Z.; Du, S.; Wang, Y.C.; Wang, Q. Mining the regularity of landscape-structure heterogeneity to improve urban land-cover mapping. Remote Sens. Environ. 2018, 214, 14–32. [Google Scholar] [CrossRef]
- He, Q.; Zeng, C.; Xie, P.; Tan, S.; Wu, J. Comparison of urban growth patterns and changes between three urban agglomerations in China and three metropolises in the USA from 1995 to 2015. Sustain. Cities Soc. 2019, 50, 101649. [Google Scholar] [CrossRef]
- Zhang, F.; Wu, L.; Zhu, D.; Liu, Y. Social sensing from street-level imagery: A case study in learning spatio-temporal urban mobility patterns. ISPRS J. Photogramm. Remote. Sens. 2019, 153, 48–58. [Google Scholar] [CrossRef]
- Mahabir, R.; Croitoru, A.; Crooks, A.; Agouris, P.; Stefanidis, A. A Critical Review of High and Very High-Resolution Remote Sensing Approaches for Detecting and Mapping Slums: Trends, Challenges and Emerging Opportunities. Urban Sci. 2018, 2, 8. [Google Scholar] [CrossRef] [Green Version]
- Watts, D.M.; Burke, D.S.; Harrison, B.A.; Whitmire, R.E.; Nisalak, A. Effect of Temperature on the Vector Efficiency of Aedes aegypti for Dengue 2 Virus. Am. J. Trop. Med. Hyg. 1987, 36, 143–152. [Google Scholar] [CrossRef] [PubMed]
- Lagouarde, J.P.; Bhattacharya, B.; Crébassol, P.; Gamet, P.; Adlakha, D.; Murthy, C.; Singh, S.; Mishra, M.; Nigam, R.; Raju, P.; et al. Indo-French High-resolution Thermal Infrared Space Mission for Earth Natural Resources Assessment and Monitoring-Concept and Definition of TRISHNA. In Proceedings of the Joint International Workshop on Earth Observations for Agricultural Monitoring, New Delhi, India, 18–20 February 2019. [Google Scholar]
- Granero-Belinchon, C.; Michel, A.; Lagouarde, J.P.; Sobrino, J.A.; Briottet, X. Multi-Resolution Study of Thermal Unmixing Techniques over Madrid Urban Area: Case Study of TRISHNA Mission. Remote Sens. 2019, 11, 1251. [Google Scholar] [CrossRef] [Green Version]
- Catry, T.; Pottier, A.; Marti, R.; Li, Z.; Roux, E.; Herbreteau, V.; Mangeas, M.; Demagistri, L.; Gurgel, H.; Dessay, N. Apports de la combinaison d’images satellites optique et RADAR dans l’étude des maladies à transmission vectorielle: Cas du paludisme à la frontière Guyane française—Brésil. Confins 2018, 37. [Google Scholar] [CrossRef]
- Catry, T.; Li, Z.; Roux, E.; Herbreteau, V.; Gurgel, H.; Mangeas, M.; Seyler, F.; Dessay, N. Wetlands and Malaria in the Amazon: Guidelines for the Use of Synthetic Aperture Radar Remote-Sensing. Int. J. Environ. Res. Public Health 2018, 15, 468. [Google Scholar] [CrossRef] [Green Version]
- Wang, J.; Zhou, W.; Qian, Y.; Li, W.; Han, L. Quantifying and characterizing the dynamics of urban greenspace at the patch level: A new approach using object-based image analysis. Remote Sens. Environ. 2018, 204, 94–108. [Google Scholar] [CrossRef]
- Corbane, C.; Pesaresi, M.; Politis, P.; Syrris, V.; Florczyk, A.J.; Soille, P.; Maffenini, L.; Burger, A.; Vasilev, V.; Rodriguez, D.; et al. Big earth data analytics on Sentinel-1 and Landsat imagery in support to global human settlements mapping. Big Earth Data 2017, 1, 118–144. [Google Scholar] [CrossRef] [Green Version]
- Kuffer, M.; Pfeffer, K.; Sliuzas, R. Slums from Space—15 Years of Slum Mapping Using Remote Sensing. Remote Sens. 2016, 8, 455. [Google Scholar] [CrossRef] [Green Version]
- Wurm, M.; Taubenböck, H. Detecting social groups from space—Assessment of remote sensing-based mapped morphological slums using income data. Remote Sens. Lett. 2018, 9, 41–50. [Google Scholar] [CrossRef]
- Wu, S.S.; Qiu, X.; Wang, L. Population Estimation Methods in GIS and Remote Sensing: A Review. Gisci. Remote Sens. 2005, 42, 80–96. [Google Scholar] [CrossRef]
- Karume, K.; Schmidt, C.; Kundert, K.; Bagula, M.E.; Safina, B.F.; Schomacker, R.; Ganza, D.; Azanga, O.; Nfundiko, C.; Karume, N.; et al. Use of Remote Sensing for Population Number Determination. Open Access J. Sci. Technol. 2017, 5. [Google Scholar] [CrossRef] [PubMed]
- Bachofer, F. Assessment of building heights from pléiades satellite imagery for the Nyarugenge sector, Kigali, Rwanda. Rwanda J. 2016, 1. [Google Scholar] [CrossRef] [Green Version]
- Peng, F.; Gong, J.; Wang, L.; Wu, H.; Liu, P. A New Stereo Pair Disparity Index (SPDI) for Detecting Built-Up Areas from High-Resolution Stereo Imagery. Remote Sens. 2017, 9, 633. [Google Scholar] [CrossRef] [Green Version]
- Vanhuysse, S.; Grippa, T.; Lennert, M.; Wolff, E.; Idrissa, M. Contribution of nDSM derived from VHR stereo imagery to urban land-cover mapping in Sub-Saharan Africa. In Proceedings of the 2017 Joint Urban Remote Sensing Event (JURSE), Dubai, United Arab Emirates, 6–8 March 2017. [Google Scholar]
- Chuang, T.W.; Henebry, G.; Kimball, J.; VanRoekel-Patton, D.; Hildreth, M.; Wimberly, M. Satellite microwave remote sensing for environmental modeling of mosquito population dynamics. Remote Sens. Environ. 2012, 125, 147–156. [Google Scholar] [CrossRef] [Green Version]
- Sharma, K.D.; Mahabir, R.S.; Curtin, K.M.; Sutherland, J.M.; Agard, J.B.; Chadee, D.D. Exploratory space-time analysis of dengue incidence in Trinidad: A retrospective study using travel hubs as dispersal points, 1998–2004. Parasites Vectors 2014, 7, 341. [Google Scholar] [CrossRef] [Green Version]
- Lana, R.M.; da Costa Gomes, M.F.; de Lima, T.F.M.; Honorio, N.A.; Codeco, C.T. The introduction of dengue follows transportation infrastructure changes in the state of Acre, Brazil: A network-based analysis. PLoS Negl. Trop. Dis. 2017, 11, e0006070. [Google Scholar] [CrossRef]
- Barmak, D.; Dorso, C.; Otero, M. Modelling dengue epidemic spreading with human mobility. Phys. A Stat. Mech. Its Appl. 2016, 447, 129–140. [Google Scholar] [CrossRef]
- Adams, B.; Kapan, D.D. Man Bites Mosquito: Understanding the Contribution of Human Movement to Vector-Borne Disease Dynamics. PLoS ONE 2009, 4, e6763. [Google Scholar] [CrossRef] [PubMed] [Green Version]
- Vazquez-Prokopec, G.M.; Stoddard, S.T.; Paz-Soldan, V.; Morrison, A.C.; Elder, J.P.; Kochel, T.J.; Scott, T.W.; Kitron, U. Usefulness of commercially available GPS data-loggers for tracking human movement and exposure to dengue virus. Int. J. Health Geogr. 2009, 8, 68. [Google Scholar] [CrossRef] [PubMed] [Green Version]
- Mao, L.; Yin, L.; Song, X.; Mei, S. Mapping intra-urban transmission risk of dengue fever with big hourly cellphone data. Acta Trop. 2016, 162, 188–195. [Google Scholar] [CrossRef] [PubMed]
- Aziz, K.; Tarapiah, S.; Ismail, S.H.; Atalla, S. Smart real-time healthcare monitoring and tracking system using GSM/GPS technologies. In Proceedings of the 2016 3rd MEC International Conference on Big Data and Smart City (ICBDSC), Muscat, Oman, 15–16 March 2016. [Google Scholar]
- Rani, S.; Ahmed, S.H.; Shah, S.C. Smart Health: A Novel Paradigm to Control the Chickungunya Virus. IEEE Internet Things J. 2019, 6, 1306–1311. [Google Scholar] [CrossRef]
- Kamel Boulos, M.N.; Peng, G.; VoPham, T. An overview of GeoAI applications in health and healthcare. Int. J. Health Geogr. 2019, 18, 7. [Google Scholar] [CrossRef]
- Ali, M.; Wagatsuma, Y.; Emch, M.; Breiman, R.F. Use of a geographic information system for defining spatial risk for dengue transmission in Bangladesh: Role for Aedes albopictus in an urban outbreak. Am. J. Trop. Med. Hyg. 2003, 69, 634–640. [Google Scholar] [CrossRef] [Green Version]
- Al-Raddadi, R.; Alwafi, O.; Shabouni, O.; Akbar, N.; Alkhalawi, M.; Ibrahim, A.; Hussain, R.; Alzahrani, M.; Al Helal, M.; Assiri, A. Seroprevalence of dengue fever and the associated sociodemographic, clinical, and environmental factors in Makkah, Madinah, Jeddah, and Jizan, Kingdom of Saudi Arabia. Acta Trop. 2019, 189, 54–64. [Google Scholar] [CrossRef]
- Araujo, R.V.; Albertini, M.R.; Costa-da Silva, A.L.; Suesdek, L.; Franceschi, N.C.S.; Bastos, N.M.; Katz, G.; Cardoso, V.A.; Castro, B.C.; Capurro, M.L.; et al. São Paulo urban heat islands have a higher incidence of dengue than other urban areas. Braz. J. Infect. Dis. 2015, 19, 146–155. [Google Scholar] [CrossRef] [Green Version]
- Ashford, D.A.; Savage, H.M.; Hajjeh, R.A.; Mcready, J.; Bartholomew, D.M.; Spiegel, R.A.; Vorndam, V.; Clark, G.G.; Gubler, D.G. Outbreak of dengue fever in palau, western pacific: Risk factors for infection. Am. J. Trop. Med. Hyg. 2003, 69, 135–140. [Google Scholar] [CrossRef] [Green Version]
- Barbosa, G.L.; Lourenço, R.W.U. Análise da distribuição espaço-temporal de dengue e da infestação larvária no município de Tupã, Estado de São Paulo. Rev. Soc. Bras. Med. Trop. 2010, 43, 145–151. [Google Scholar] [CrossRef] [Green Version]
- Barbosa, G.L.; Donalísio, M.R.; Stephan, C.; Lourenço, R.W.; Andrade, V.R.; de Brito Arduino, M.; de Lima, V.L.C. Spatial Distribution of the Risk of Dengue and the Entomological Indicators in Sumaré, State of São Paulo, Brazil. PLoS Negl. Trop. Dis. 2014, 8, e2873. [Google Scholar] [CrossRef] [PubMed] [Green Version]
- Barrera, R.; Delgado, N.; Jiménez, M.; Villalobos, I.; Romero, I. Estratificación de una ciudad hiperendémica en dengue hemorrágico. Rev. Panam. Salud Pública 2000, 8, 225–233. [Google Scholar] [CrossRef] [PubMed] [Green Version]
- Braga, C.; Luna, C.F.; Martelli, C.M.; de Souza, W.V.; Cordeiro, M.T.; Alexander, N.; Albuquerque, M.d.F.P.M.d.; Júnior, J.C.S.; Marques, E.T. Seroprevalence and risk factors for dengue infection in socio-economically distinct areas of Recife, Brazil. Acta Trop. 2010, 113, 234–240. [Google Scholar] [CrossRef] [PubMed] [Green Version]
- Brunkard, J.M.; López, J.L.R.; Ramirez, J.; Cifuentes, E.; Rothenberg, S.J.; Hunsperger, E.A.; Moore, C.G.; Brussolo, R.M.; Villarreal, N.A.; Haddad, B.M. Dengue Fever Seroprevalence and Risk Factors, Texas–Mexico Border, 2004. Emerg. Infect. Dis. 2007, 13, 1477–1483. [Google Scholar] [CrossRef]
- Cao, Z.; Liu, T.; Li, X.; Wang, J.; Lin, H.; Chen, L.; Wu, Z.; Ma, W. Individual and Interactive Effects of Socio-Ecological Factors on Dengue Fever at Fine Spatial Scale: A Geographical Detector-Based Analysis. Int. J. Environ. Res. Public Health 2017, 14, 795. [Google Scholar] [CrossRef] [Green Version]
- Carbajo, A.; Rubio, A.; Viani, M.; Colombo, M. The largest dengue outbreak in Argentina and spatial analyses of dengue cases in relation to a control program in a district with sylvan and urban environments. Asian Pac. J. Trop. Med. 2018, 11, 227. [Google Scholar] [CrossRef]
- Chadee, D. Dengue cases and Aedes aegypti indices in Trinidad, West Indies. Acta Trop. 2009, 112, 174–180. [Google Scholar] [CrossRef]
- Chen, B.; Yang, J.; Luo, L.; Yang, Z.; Liu, Q. Who Is Vulnerable to Dengue Fever? A Community Survey of the 2014 Outbreak in Guangzhou, China. Int. J. Environ. Res. Public Health 2016, 13, 712. [Google Scholar] [CrossRef] [Green Version]
- Chen, S.; Whiteman, A.; Li, A.; Rapp, T.; Delmelle, E.; Chen, G.; Brown, C.L.; Robinson, P.; Coffman, M.J.; Janies, D.; et al. An operational machine learning approach to predict mosquito abundance based on socioeconomic and landscape patterns. Landsc. Ecol. 2019, 34, 1295–1311. [Google Scholar] [CrossRef]
- Chiu, C.H.; Wen, T.H.; Chien, L.C.; Yu, H.L. A Probabilistic Spatial Dengue Fever Risk Assessment by a Threshold-Based-Quantile Regression Method. PLoS ONE 2014, 9, e106334. [Google Scholar] [CrossRef] [Green Version]
- Chuang, T.W.; Ng, K.C.; Nguyen, T.; Chaves, L. Epidemiological Characteristics and Space-Time Analysis of the 2015 Dengue Outbreak in the Metropolitan Region of Tainan City, Taiwan. Int. J. Environ. Res. Public Health 2018, 15, 396. [Google Scholar] [CrossRef] [PubMed] [Green Version]
- Delmelle, E.; Hagenlocher, M.; Kienberger, S.; Casas, I. A spatial model of socioeconomic and environmental determinants of dengue fever in Cali, Colombia. Acta Trop. 2016, 164, 169–176. [Google Scholar] [CrossRef] [PubMed]
- De Mattos Almeida, M.C.; Caiaffa, W.T.; Assunção, R.M.; Proietti, F.A. Spatial Vulnerability to Dengue in a Brazilian Urban Area During a 7-Year Surveillance. J. Urban Health 2007, 84, 334–345. [Google Scholar] [CrossRef] [PubMed] [Green Version]
- Dom, N.C.; Ahmad, A.H.; Latif, Z.A.; Ismail, R.; Pradhan, B. Coupling of remote sensing data and environmental-related parameters for dengue transmission risk assessment in Subang Jaya, Malaysia. Geocarto Int. 2013, 28, 258–272. [Google Scholar] [CrossRef]
- Ellis, E.M.; Neatherlin, J.C.; Delorey, M.; Ochieng, M.; Mohamed, A.H.; Mogeni, D.O.; Hunsperger, E.; Patta, S.; Gikunju, S.; Waiboic, L.; et al. A Household Serosurvey to Estimate the Magnitude of a Dengue Outbreak in Mombasa, Kenya, 2013. PLoS Negl. Trop. Dis. 2015, 9, e0003733. [Google Scholar] [CrossRef] [Green Version]
- Escobar-Mesa, J.; Gómez-Dantés, H. Determinantes de la transmisión de dengue en Veracruz: Un abordaje ecológico para su control. Salud Pública México 2003, 45, 43–53. [Google Scholar] [CrossRef] [Green Version]
- Falcon-Lezama, J.A.; Santos-Luna, R.; Roman-Pérez, S.; Martinez-Vega, R.A.; Herrera-Valdez, M.A.; Kuri-Morales, A.F.; Adams, B.; Kuri-Morales, P.A.; Lopez-Cervantes, M.; Ramos-Castañeda, J. Analysis of spatial mobility in subjects from a Dengue endemic urban locality in Morelos State, Mexico. PLoS ONE 2017, 12, e0172313. [Google Scholar] [CrossRef]
- Garcia, F.J.; de las Llagas, L.A. An examination of the spatial factors of dengue cases in Quezon City, Philippines: A geographic information system (GIS)-based approach, 2005–2008. Acta Med. Philipp. 2011, 45, 53–62. [Google Scholar]
- Hapuarachchi, H.C.; Koo, C.; Rajarethinam, J.; Chong, C.S.; Lin, C.; Yap, G.; Liu, L.; Lai, Y.L.; Ooi, P.L.; Cutter, J.; et al. Epidemic resurgence of dengue fever in Singapore in 2013–2014: A virological and entomological perspective. BMC Infect. Dis. 2016, 16, 300. [Google Scholar] [CrossRef] [Green Version]
- Hayes, J.M.; García-Rivera, E.; Flores-Reyna, R.; Suárez-Rangel, G.; Rodríguez-Mata, T.; Coto-Portillo, R.; Baltrons-Orellana, R.; Mendoza-Rodríguez, E.; Garay, B.F.D.; Jubis-Estrada, J.; et al. Risk factors for infection during a severe dengue outbreak in el Salvador in 2000. Am. J. Trop. Med. Hyg. 2003, 69, 629–633. [Google Scholar] [CrossRef] [Green Version]
- Hayes, J.M.; Rigau-Pérez, J.G.; Reiter, P.; Effler, P.V.; Pang, L.; Vorndam, V.; Hinten, S.R.; Mark, K.E.; Myers, M.F.; Street, K.; et al. Risk factors for infection during a dengue-1 outbreak in Maui, Hawaii, 2001. Trans. R. Soc. Trop. Med. Hyg. 2006, 100, 559–566. [Google Scholar] [CrossRef] [PubMed]
- Heukelbach, J.; Oliveira, F.A.S.D.; Kerr-Pontes, L.R.S.; Feldmeier, H. Risk factors associated with an outbreak of dengue fever in a favela in Fortaleza, north-east Brazil. Trop. Med. Int. Health 2001, 6, 635–642. [Google Scholar] [CrossRef] [PubMed]
- Honório, N.A.; Nogueira, R.M.R.; Codeço, C.T.; Carvalho, M.S.; Cruz, O.G.; de Avelar Figueiredo Mafra Magalhães, M.; de Araújo, J.M.G.; de Araújo, E.S.M.; Gomes, M.Q.; Pinheiro, L.S.; et al. Spatial Evaluation and Modeling of Dengue Seroprevalence and Vector Density in Rio de Janeiro, Brazil. PLoS Negl. Trop. Dis. 2009, 3, e545. [Google Scholar] [CrossRef] [PubMed]
- Huang, C.C.; Tam, T.Y.T.; Chern, Y.R.; Lung, S.C.C.; Chen, N.T.; Wu, C.D. Spatial Clustering of Dengue Fever Incidence and Its Association with Surrounding Greenness. Int. J. Environ. Res. Public Health 2018, 15, 1869. [Google Scholar] [CrossRef] [Green Version]
- Kenneson, A.; Beltrán-Ayala, E.; Borbor-Cordova, M.J.; Polhemus, M.E.; Ryan, S.J.; Endy, T.P.; Stewart-Ibarra, A.M. Social-ecological factors and preventive actions decrease the risk of dengue infection at the household-level: Results from a prospective dengue surveillance study in Machala, Ecuador. PLoS Negl. Trop. Dis. 2017, 11, e0006150. [Google Scholar] [CrossRef]
- Kesetyaningsih, T.W.; Andarini, S.; Sudarto, S.; Pramoedyo, H. Determination of environmental factors affecting dengue incidence in Sleman District, Yogyakarta, Indonesia. Afr. J. Infect. Dis. 2018, 12, 13–25. [Google Scholar] [CrossRef]
- Khormi, H.M.; Kumar, L.; Elzahrany, R.A. Modeling spatio-temporal risk changes in the incidence of dengue fever in Saudi Arabia: A geographical information system case study. Geospat. Health 2011, 6, 77. [Google Scholar] [CrossRef] [Green Version]
- Kim Lien, P.T.; Duoc, V.T.; Gavotte, L.; Cornillot, E.; Nga, P.T.; Briant, L.; Frutos, R.; Duong, T.N. Role of Aedes aegypti and Aedes albopictus during the 2011 dengue fever epidemics in Hanoi, Vietnam. Asian Pac. J. Trop. Med. 2015, 8, 543–548. [Google Scholar] [CrossRef]
- Koopman, J.S.; Prevots, D.R.; Mann, M.A.V.; Dantes, H.G.; Aquino, M.L.Z.; Longini, I.M.; Amor, J.S. Determinants and Predictors of Dengue Infection in Mexico. Am. J. Epidemiol. 1991, 133, 1168–1178. [Google Scholar] [CrossRef]
- Koyadun, S.; Butraporn, P.; Kittayapong, P. Ecologic and Sociodemographic Risk Determinants for Dengue Transmission in Urban Areas in Thailand. Interdiscip. Perspect. Infect. Dis. 2012, 2012. [Google Scholar] [CrossRef]
- Li, S.; Tao, H.; Xu, Y. Abiotic Determinants to the Spatial Dynamics of Dengue Fever in Guangzhou. Asia Pac. J. Public Health 2013, 25, 239–247. [Google Scholar] [CrossRef] [PubMed]
- Li, Q.; Cao, W.; Ren, H.; Ji, Z.; Jiang, H. Spatiotemporal responses of dengue fever transmission to the road network in an urban area. Acta Trop. 2018, 183, 8–13. [Google Scholar] [CrossRef] [PubMed]
- Lippi, C.; Stewart-Ibarra, A.M.; Muñoz, C.; Borbor-Cordova, M.J.; Mejía, R.; Rivero, K.; Castillo, K.; Cárdenas, W.B.; Ryan, S.J. The Social and Spatial Ecology of Dengue Presence and Burden during an Outbreak in Guayaquil, Ecuador, 2012. Int. J. Environ. Res. Public Health 2018, 15, 827. [Google Scholar] [CrossRef] [PubMed] [Green Version]
- Liu, K.; Zhu, Y.; Xia, Y.; Zhang, Y.; Huang, X.; Huang, J.; Nie, E.; Jing, Q.; Wang, G.; Yang, Z.; et al. Dynamic spatiotemporal analysis of indigenous dengue fever at street-level in Guangzhou city, China. PLoS Negl. Trop. Dis. 2018, 12, e0006318. [Google Scholar] [CrossRef] [PubMed] [Green Version]
- Mahmood, S.; Irshad, A.; Nasir, J.M.; Sharif, F.; Farooqi, S.H. Spatiotemporal analysis of dengue outbreaks in Samanabad town, Lahore metropolitan area, using geospatial techniques. Environ. Monit. Assess. 2019, 191, 55. [Google Scholar] [CrossRef]
- Mala, S.; Jat, M.K. Implications of meteorological and physiographical parameters on dengue fever occurrences in Delhi. Sci. Total. Environ. 2019, 650, 2267–2283. [Google Scholar] [CrossRef]
- Martínez-Bello, D.A.; López-Quílez, A.; Torres Prieto, A. Relative risk estimation of dengue disease at small spatial scale. Int. J. Health Geogr. 2017, 16. [Google Scholar] [CrossRef]
- McBride, W.J.H.; Mullner, H.; Muller, R.; Labrooy, J.; Wronski, I. Determinants of dengue 2 infection among residents of Charters Towers, Queensland, Australia. Am. J. Epidemiol. 1998, 148, 1111–1116. [Google Scholar] [CrossRef]
- Mena, N.; Troyo, A.; Bonilla-Carrión, R.; Calderón-Arguedas, O. Factores asociados con la incidencia de dengue en Costa Rica. Rev. Panam. Salud Pública 2011, 29, 234–242. [Google Scholar] [CrossRef] [Green Version]
- Meza-Ballesta, A.; Gónima, L. The influence of climate and vegetation cover on the occurrence of dengue cases (2001–2010). Rev. Salud Pública 2014, 16, 293–306. [Google Scholar] [CrossRef] [Green Version]
- Mondini, A.; Chiaravalloti-Neto, F. Spatial correlation of incidence of dengue with socioeconomic, demographic and environmental variables in a Brazilian city. Sci. Total Environ. 2008, 393, 241–248. [Google Scholar] [CrossRef] [PubMed]
- Ogashawara, I.; Li, L.; Moreno-Madriñán, M.J. Spatial-Temporal Assessment of Environmental Factors Related to Dengue Outbreaks in São Paulo, Brazil. GeoHealth 2019, 3, 202–217. [Google Scholar] [CrossRef] [PubMed]
- Pessanha, J.E.M.; Caiaffa, W.T.; Kroon, E.G.; Proietti, F.A. Dengue em três distritos sanitários de Belo Horizonte, Brasil: Inquérito soroepidemiológico de base populacional, 2006 a 2007. Rev. Panam. Salud Pública 2010, 27. [Google Scholar] [CrossRef] [PubMed]
- Prayitno, A.; Taurel, A.F.; Nealon, J.; Satari, H.I.; Karyanti, M.R.; Sekartini, R.; Soedjatmiko, S.; Gunardi, H.; Medise, B.E.; Sasmono, R.T.; et al. Dengue seroprevalence and force of primary infection in a representative population of urban dwelling Indonesian children. PLoS Negl. Trop. Dis. 2017, 11, e0005621. [Google Scholar] [CrossRef] [Green Version]
- Qi, X.; Wang, Y.; Li, Y.; Meng, Y.; Chen, Q.; Ma, J.; Gao, G.F. The Effects of Socioeconomic and Environmental Factors on the Incidence of Dengue Fever in the Pearl River Delta, China, 2013. PLoS Negl. Trop. Dis. 2015, 9, e0004159. [Google Scholar] [CrossRef]
- Qu, Y.; Shi, X.; Wang, Y.; Li, R.; Lu, L.; Liu, Q. Effects of socio-economic and environmental factors on the spatial heterogeneity of dengue fever investigated at a fine scale. Geospat. Health 2018, 13. [Google Scholar] [CrossRef] [Green Version]
- Reiter, P.; Lathrop, S.; Bunning, M.; Biggerstaff, B.; Singer, D.; Tiwari, T.; Baber, L.; Amador, M.; Thirion, J.; Hayes, J.; et al. Texas Lifestyle Limits Transmission of Dengue Virus. Emerg. Infect. Dis. 2003, 9, 86–89. [Google Scholar] [CrossRef]
- Ren, H.; Wu, W.; Li, T.; Yang, Z. Urban villages as transfer stations for dengue fever epidemic: A case study in the Guangzhou, China. PLoS Negl. Trop. Dis. 2019, 13, e0007350. [Google Scholar] [CrossRef] [Green Version]
- Rinawan, F.; Tateishi, R.; Raksanagara, A.; Agustian, D.; Alsaaideh, B.; Natalia, Y.; Raksanagara, A. Pitch and Flat Roof Factors’ Association with Spatiotemporal Patterns of Dengue Disease Analysed Using Pan-Sharpened Worldview 2 Imagery. ISPRS Int. J. Geo-Inf. 2015, 4, 2586–2603. [Google Scholar] [CrossRef] [Green Version]
- Rodriguez-Figueroa, L.; Rigau-Perez, J.G.; Suarez, E.L.; Reiter, P. Risk Factors for Dengue Infection during an Outbreak in Yanes, Puerto Rico in 1991. Am. J. Trop. Med. Hyg. 1995, 52, 496–502. [Google Scholar] [CrossRef]
- Rotela, C.; Fouque, F.; Lamfri, M.; Sabatier, P.; Introini, V.; Zaidenberg, M.; Scavuzzo, C. Space–time analysis of the dengue spreading dynamics in the 2004 Tartagal outbreak, Northern Argentina. Acta Trop. 2007, 103, 1–13. [Google Scholar] [CrossRef] [PubMed]
- Sarfraz, M.S.; Tripathi, N.K.; Kitamoto, A. Near real-time characterisation of urban environments: A holistic approach for monitoring dengue fever risk areas. Int. J. Digit. Earth 2014, 7, 916–934. [Google Scholar] [CrossRef]
- Seidahmed, O.M.; Lu, D.; Chong, C.S.; Ng, L.C.; Eltahir, E.A. Patterns of Urban Housing Shape Dengue Distribution in Singapore at Neighborhood and Country Scales. GeoHealth 2018, 2, 54–67. [Google Scholar] [CrossRef] [PubMed]
- Stewart-Ibarra, A.; Muñoz, A.; Ryan, S.; Ayala, E.; Borbor-Cordova, M.; Finkelstein, J.L.; Mejía, R.; Ordoñez, T.; Recalde-Coronel, G.; Rivero, K. Spatiotemporal clustering, climate periodicity, and social-ecological risk factors for dengue during an outbreak in Machala, Ecuador, in 2010. BMC Infect. Dis. 2014, 14, 610. [Google Scholar] [CrossRef] [PubMed] [Green Version]
- Sulaiman, S.; Pawanchee, Z.A.; Arifin, Z.; Wahab, A. Relationship between Breteau and house indices and cases of dengue/dengue hemorrhagic fever in Kuala Lumpur, Malaysia. J. Am. Mosq. Control Assoc. 1996, 12, 494–496. [Google Scholar]
- Teixeira, M.D.G.; Barreto, M.L.; Costa, M.D.C.N.; Ferreira, L.D.A.; Vasconcelos, P.F.C.; Cairncross, S. Dynamics of dengue virus circulation: A silent epidemic in a complex urban area. Trop. Med. Int. Health 2002, 7, 757–762. [Google Scholar] [CrossRef] [Green Version]
- Teixeira, T.R.; Medronho, A.R. Socio-demographic factors and the dengue fever epidemic in 2002 in the State of Rio de Janeiro, Brazil. Cad. Saúde Pública 2008, 24, 2160–2170. [Google Scholar] [CrossRef] [Green Version]
- Telle, O.; Vaguet, A.; Yadav, N.K.; Lefebvre, B.; Daudé, E.; Paul, R.E.; Cebeillac, A.; Nagpal, B.N. The Spread of Dengue in an Endemic Urban Milieu—The Case of Delhi, India. PLoS ONE 2016, 11, e0146539. [Google Scholar] [CrossRef] [Green Version]
- Teurlai, M.; Menkès, C.E.; Cavarero, V.; Degallier, N.; Descloux, E.; Grangeon, J.P.; Guillaumot, L.; Libourel, T.; Lucio, P.S.; Mathieu-Daudé, F.; et al. Socio-economic and Climate Factors Associated with Dengue Fever Spatial Heterogeneity: A Worked Example in New Caledonia. PLoS Negl. Trop. Dis. 2015, 9, e0004211. [Google Scholar] [CrossRef] [Green Version]
- Thammapalo, S.; Chongsuvivatwong, V.; Geater, A.; Dueravee, M. Environmental factors and incidence of dengue fever and dengue haemorrhagic fever in an urban area, Southern Thailand. Epidemiol. Infect. 2008, 136. [Google Scholar] [CrossRef]
- Tian, H.; Huang, S.; Zhou, S.; Bi, P.; Yang, Z.; Li, X.; Chen, L.; Cazelles, B.; Yang, J.; Luo, L.; et al. Surface water areas significantly impacted 2014 dengue outbreaks in Guangzhou, China. Environ. Res. 2016, 150, 299–305. [Google Scholar] [CrossRef] [PubMed] [Green Version]
- Tiong, V.; Abd-Jamil, J.; Zan, M.H.; Abu-Bakar, R.S.; Ew, C.L.; Jafar, F.L.; Nellis, S.; Fauzi, R.; AbuBakar, S. Evaluation of land cover and prevalence of dengue in Malaysia. Trop. Biomed. 2015, 32, 587–597. [Google Scholar]
- Toan, D.T.T.; Hoat, L.N.; Hu, W.; Wright, P.; Martens, P. Risk factors associated with an outbreak of dengue fever/dengue haemorrhagic fever in Hanoi, Vietnam. Epidemiol. Infect. 2015, 143, 1594–1598. [Google Scholar] [CrossRef] [PubMed] [Green Version]
- Troyo, A.; Fuller, D.O.; Calderón-Arguedas, O.; Solano, M.E.; Beier, J.C. Urban structure and dengue incidence in Puntarenas, Costa Rica. Singap. J. Trop. Geogr. 2009, 30, 265–282. [Google Scholar] [CrossRef] [PubMed]
- Van Benthem, B.H.; Vanwambeke, S.O.; Khantikul, N.; Burghoorn-Maas, C.; Panart, K.; Oskam, L.; Lambin, E.F.; Somboon, P. Spatial patterns of and risk factors for seropositivity for dengue infection. Am. J. Trop. Med. Hyg. 2005, 72, 201–208. [Google Scholar] [CrossRef] [PubMed] [Green Version]
- Vanwambeke, S.O.; van Benthem, B.H.B.; Khantikul, N.; Burghoorn-Maas, C.; Panart, K.; Oskam, L.; Lambin, E.F.; Somboon, P. Multi-level analyses of spatial and temporal determinants for dengue infection. Int. J. Health Geogr. 2006, 5, 5. [Google Scholar] [CrossRef] [Green Version]
- Wanti, W.; Yudhastuti, R.; Notobroto, H.B.; Subekti, S.; Sila, O.; Kristina, R.H.; Dwirahmadi, F. Dengue Hemorrhagic Fever and House Conditions in Kupang City, East Nusa Tenggara Province. Kesmas-Natl. Public Health J. 2019, 13, 176–181. [Google Scholar] [CrossRef] [Green Version]
- Waterman, S.H.; Novak, R.J.; Sather, G.E.; Bailey, R.E.; Rios, I.; Gubler, D.J. Dengue Transmission in Two Puerto Rican Communities in 1982. Am. J. Trop. Med. Hyg. 1985, 34, 625–632. [Google Scholar] [CrossRef]
- Wen, T.H.; Lin, M.H.; Fang, C.T. Population Movement and Vector-Borne Disease Transmission: Differentiating Spatial—Temporal Diffusion Patterns of Commuting and Noncommuting Dengue Cases. Ann. Assoc. Am. Geogr. 2012, 102, 1026–1037. [Google Scholar] [CrossRef]
- Wong, L.P.; AbuBakar, S.; Chinna, K. Community Knowledge, Health Beliefs, Practices and Experiences Related to Dengue Fever and Its Association with IgG Seropositivity. PLoS Negl. Trop. Dis. 2014, 8, e2789. [Google Scholar] [CrossRef] [Green Version]
- Yue, Y.; Sun, J.; Liu, X.; Ren, D.; Liu, Q.; Xiao, X.; Lu, L. Spatial analysis of dengue fever and exploration of its environmental and socio-economic risk factors using ordinary least squares: A case study in five districts of Guangzhou City, China, 2014. Int. J. Infect. Dis. 2018, 75, 39–48. [Google Scholar] [CrossRef] [PubMed] [Green Version]
- Yung, C.F.; Chan, S.P.; Thein, T.L.; Chai, S.C.; Leo, Y.S. Epidemiological risk factors for adult dengue in Singapore: An 8-year nested test negative case control study. BMC Infect. Dis. 2016, 16. [Google Scholar] [CrossRef] [PubMed] [Green Version]
- Zellweger, R.M.; Cano, J.; Mangeas, M.; Taglioni, F.; Mercier, A.; Despinoy, M.; Menkès, C.E.; Dupont-Rouzeyrol, M.; Nikolay, B.; Teurlai, M. Socioeconomic and environmental determinants of dengue transmission in an urban setting: An ecological study in Nouméa, New Caledonia. PLoS Negl. Trop. Dis. 2017, 11, e0005471. [Google Scholar] [CrossRef] [PubMed]


| ID | Publication Meta-Data | Geographical Context | |||||
|---|---|---|---|---|---|---|---|
| Author | Date | Title | Journal | Country | City | Geographical Unit of Spatial Analysis | |
| 3 | Araujo | 2015 | Sao Paulo urban heat islands have a higher incidence of dengue than other urban areas | The Brazilian Journal of Infectious Diseases | Brazil | Sao Paulo | Districts |
| ID | Epidemiological Context | ||||||
|---|---|---|---|---|---|---|---|
| Start–End Years | DATA Source | Diagnostic Method | DENV-Type | Number of Cases | Spatial Variation | Vectors Mention | |
| 3 | 2010–2011 | Passive notification (COVISA) | IgG (ELISA) | NA | N = 7415 | Heterogeneous | Aedes aegypti (M) |
| ID | Landscape Factors Production | Dengue-Landscape Relationship | |||||
|---|---|---|---|---|---|---|---|
| Data Source | Data Group | Data Sub-Group | Landscape Factors | Three-valued Interpretation | Potential Proxy of (at Unit Level) | Statistical Method | |
| 3 | Landsat 5 TM image | Land cover | Surface Temperature | Urban heat islands | + | Vectors resting sites and virus replication (at large-admin level) | Multiple cluster analysis |
| Landscape Factors | Proxies of | Geographic Level |
|---|---|---|
| Housing characteristics: Animal water pans, Households with water supply, regular water supply, water containers, sewage system, garbage collection | Aedes breeding or resting site | Household level |
| Entomological observation: Larvae-positive habitats, Breeding, discarded, infested discarded plastic containers, Discarded tire casings, Infested discarded cans, uncovered water containers | ||
| Urban tyopology: Slum-housing | ||
| Land cover and use: tree height | ||
| Topography: shade | ||
| Housing characteristics: Screens on windows, absence of air conditioning, Home with birds, house floors, Floor of principal living, Number of house windows, screens for house windows, yard/open space, shanty, Animals on the property, Living near open sewers, Bednets | Exposure to Aedes bite | |
| Housing type: Apartment, house, old flats, sheds, one storey homes | ||
| Entomological observation: Presence of adult Aedes albopictus and Ae. aegypti, Aedes aegypti and Ae. albopictus population density, % of houses with larva on the premises, Number of female Aedes aegypti per person, Mosquito presence in the house | ||
| , Breteau and house indexes Construction material: Wood, concrete, stone and concrete construction | ||
| Urban typology: Temporary construction, % of village area with vegetation | ||
| Distance of house to vegetation, to river, Distance to waterbodies, % of bare soil | ||
| in 200 m-buffer zone | ||
| Land cover land use: Distance house to vegetation, to river, Distance to waterbodies, % of bare soil in 200 m-buffer | ||
| Human Long-distance mobility | Human-virus mobility | |
| Entomological observation: Larvae abundance, Breteau Index, Premise index, Mosquito abundance, Aedes Adults indicators | Aedes presence, breeding or resting site | Neighborhood level |
| Housing type: Mean size of pitched and flatted roof. | ||
| Urban typology: Slum housing | ||
| Infrastructure level: Density of the urban drainage network, Access to piped water | ||
| Land cover land use: Taro farming, Tasseled cap vegetation, wetness, brightness, vegetation coverage | ||
| Housing type: Multi-floor building, Single story attached and detached building | Human-Aedes encounter | |
| Construction material: Brick-made, wood houses | ||
| Urban typology: Dense populated areas surrounded by vegetation, | ||
| Ratios on residential, industrial, commercial areas, slums-unplanned areas, Distances to neighboring houses % of developed land, distance to roads | ||
| Land cover land use: Distance from forested areas, % of vegetation, % of water areas, % of bare soil in 200 m-buffer | ||
| Infrastructure level: Short distance from hospital. Human household density, Commercial activity with human movements | Human-virus mobility | Neighborhood level |
| Housing characteristics: Gutter rain | Aedes presence, breeding or resting site | Small administrative level |
| Infrastructure level: % of households with no piped water, without systematic or inefficient garbage collection | ||
| Topography: Street orientation to the wind | ||
| Land cover: NDVI, VFC, Water-body areas, Agriculture, Wetland, Urban heat islands, % of tree cover | ||
| Housing characteristics: Poor housing condition, houses without windows screens | Human-Aedes encounter | |
| Housing type: Independent, mixed, unoccupied houses | ||
| Urban typology: % of urban villages, of single and empty houses, of building, of slums. Ratios on residential, industrial, commercial areas, Informal, deprived or wealthy areas, house density, Markets place, Landmarks, Urbanisation level | ||
| Land cover: Open areas, Vacant ground | ||
| Infrastructure level: Human density, Road density, Use of public transportation | Human-virus mobility | |
| Infrastructure level: Drainage | Human-Aedes encounter | Large administrative level |
| Land cover: Urban heat islands, NDVI, % of shrubs, wet grassland, water area, paddy field | ||
| Urban typology: Quality of neighborhood, % of construction area | Aedes presence, breeding or resting site | |
| Infrastructure level: Public services availability |
© 2020 by the authors. Licensee MDPI, Basel, Switzerland. This article is an open access article distributed under the terms and conditions of the Creative Commons Attribution (CC BY) license (http://creativecommons.org/licenses/by/4.0/).
Share and Cite
Marti, R.; Li, Z.; Catry, T.; Roux, E.; Mangeas, M.; Handschumacher, P.; Gaudart, J.; Tran, A.; Demagistri, L.; Faure, J.-F.; et al. A Mapping Review on Urban Landscape Factors of Dengue Retrieved from Earth Observation Data, GIS Techniques, and Survey Questionnaires. Remote Sens. 2020, 12, 932. https://doi.org/10.3390/rs12060932
Marti R, Li Z, Catry T, Roux E, Mangeas M, Handschumacher P, Gaudart J, Tran A, Demagistri L, Faure J-F, et al. A Mapping Review on Urban Landscape Factors of Dengue Retrieved from Earth Observation Data, GIS Techniques, and Survey Questionnaires. Remote Sensing. 2020; 12(6):932. https://doi.org/10.3390/rs12060932
Chicago/Turabian StyleMarti, Renaud, Zhichao Li, Thibault Catry, Emmanuel Roux, Morgan Mangeas, Pascal Handschumacher, Jean Gaudart, Annelise Tran, Laurent Demagistri, Jean-François Faure, and et al. 2020. "A Mapping Review on Urban Landscape Factors of Dengue Retrieved from Earth Observation Data, GIS Techniques, and Survey Questionnaires" Remote Sensing 12, no. 6: 932. https://doi.org/10.3390/rs12060932