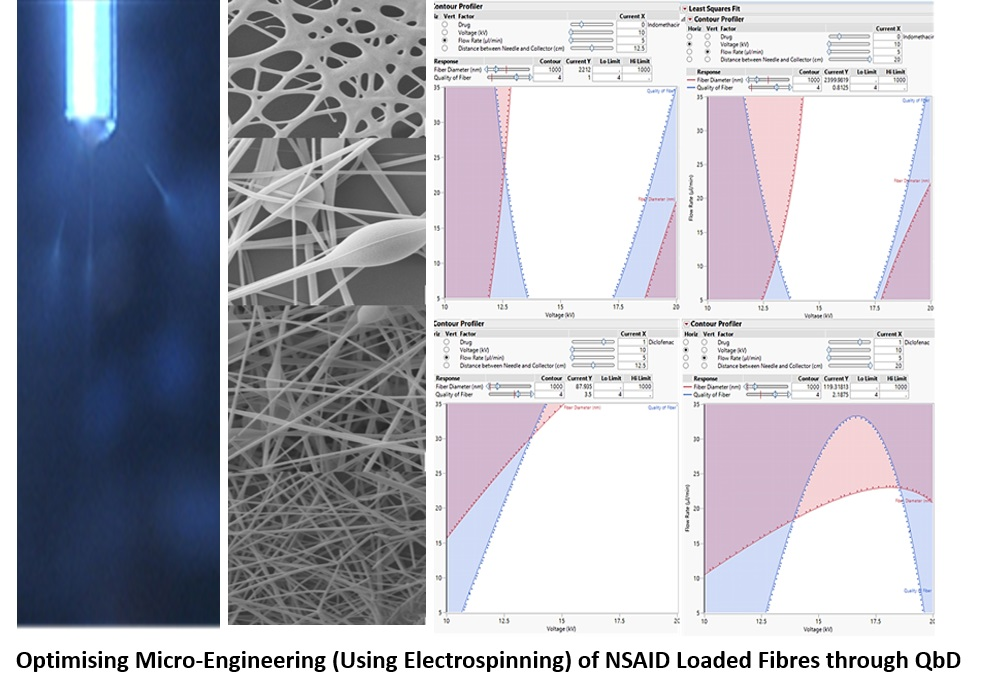
Quality by Design Micro-Engineering Optimisation of NSAID-Loaded Electrospun Fibrous Patches

 , ,
, ,
Abstract
:
1. Introduction
2. Materials and Methods
2.1. Materials
2.2. Methods
2.2.1. Applying QbD
- Drug: Indomethacin (INDO) and diclofenac sodium (DICLO) (categorical factor)
- Voltage: 10–20 ± 0.2 kV (continuous numerical factor)
- Flow rate: 5–35 µL/min (continuous numerical factor)
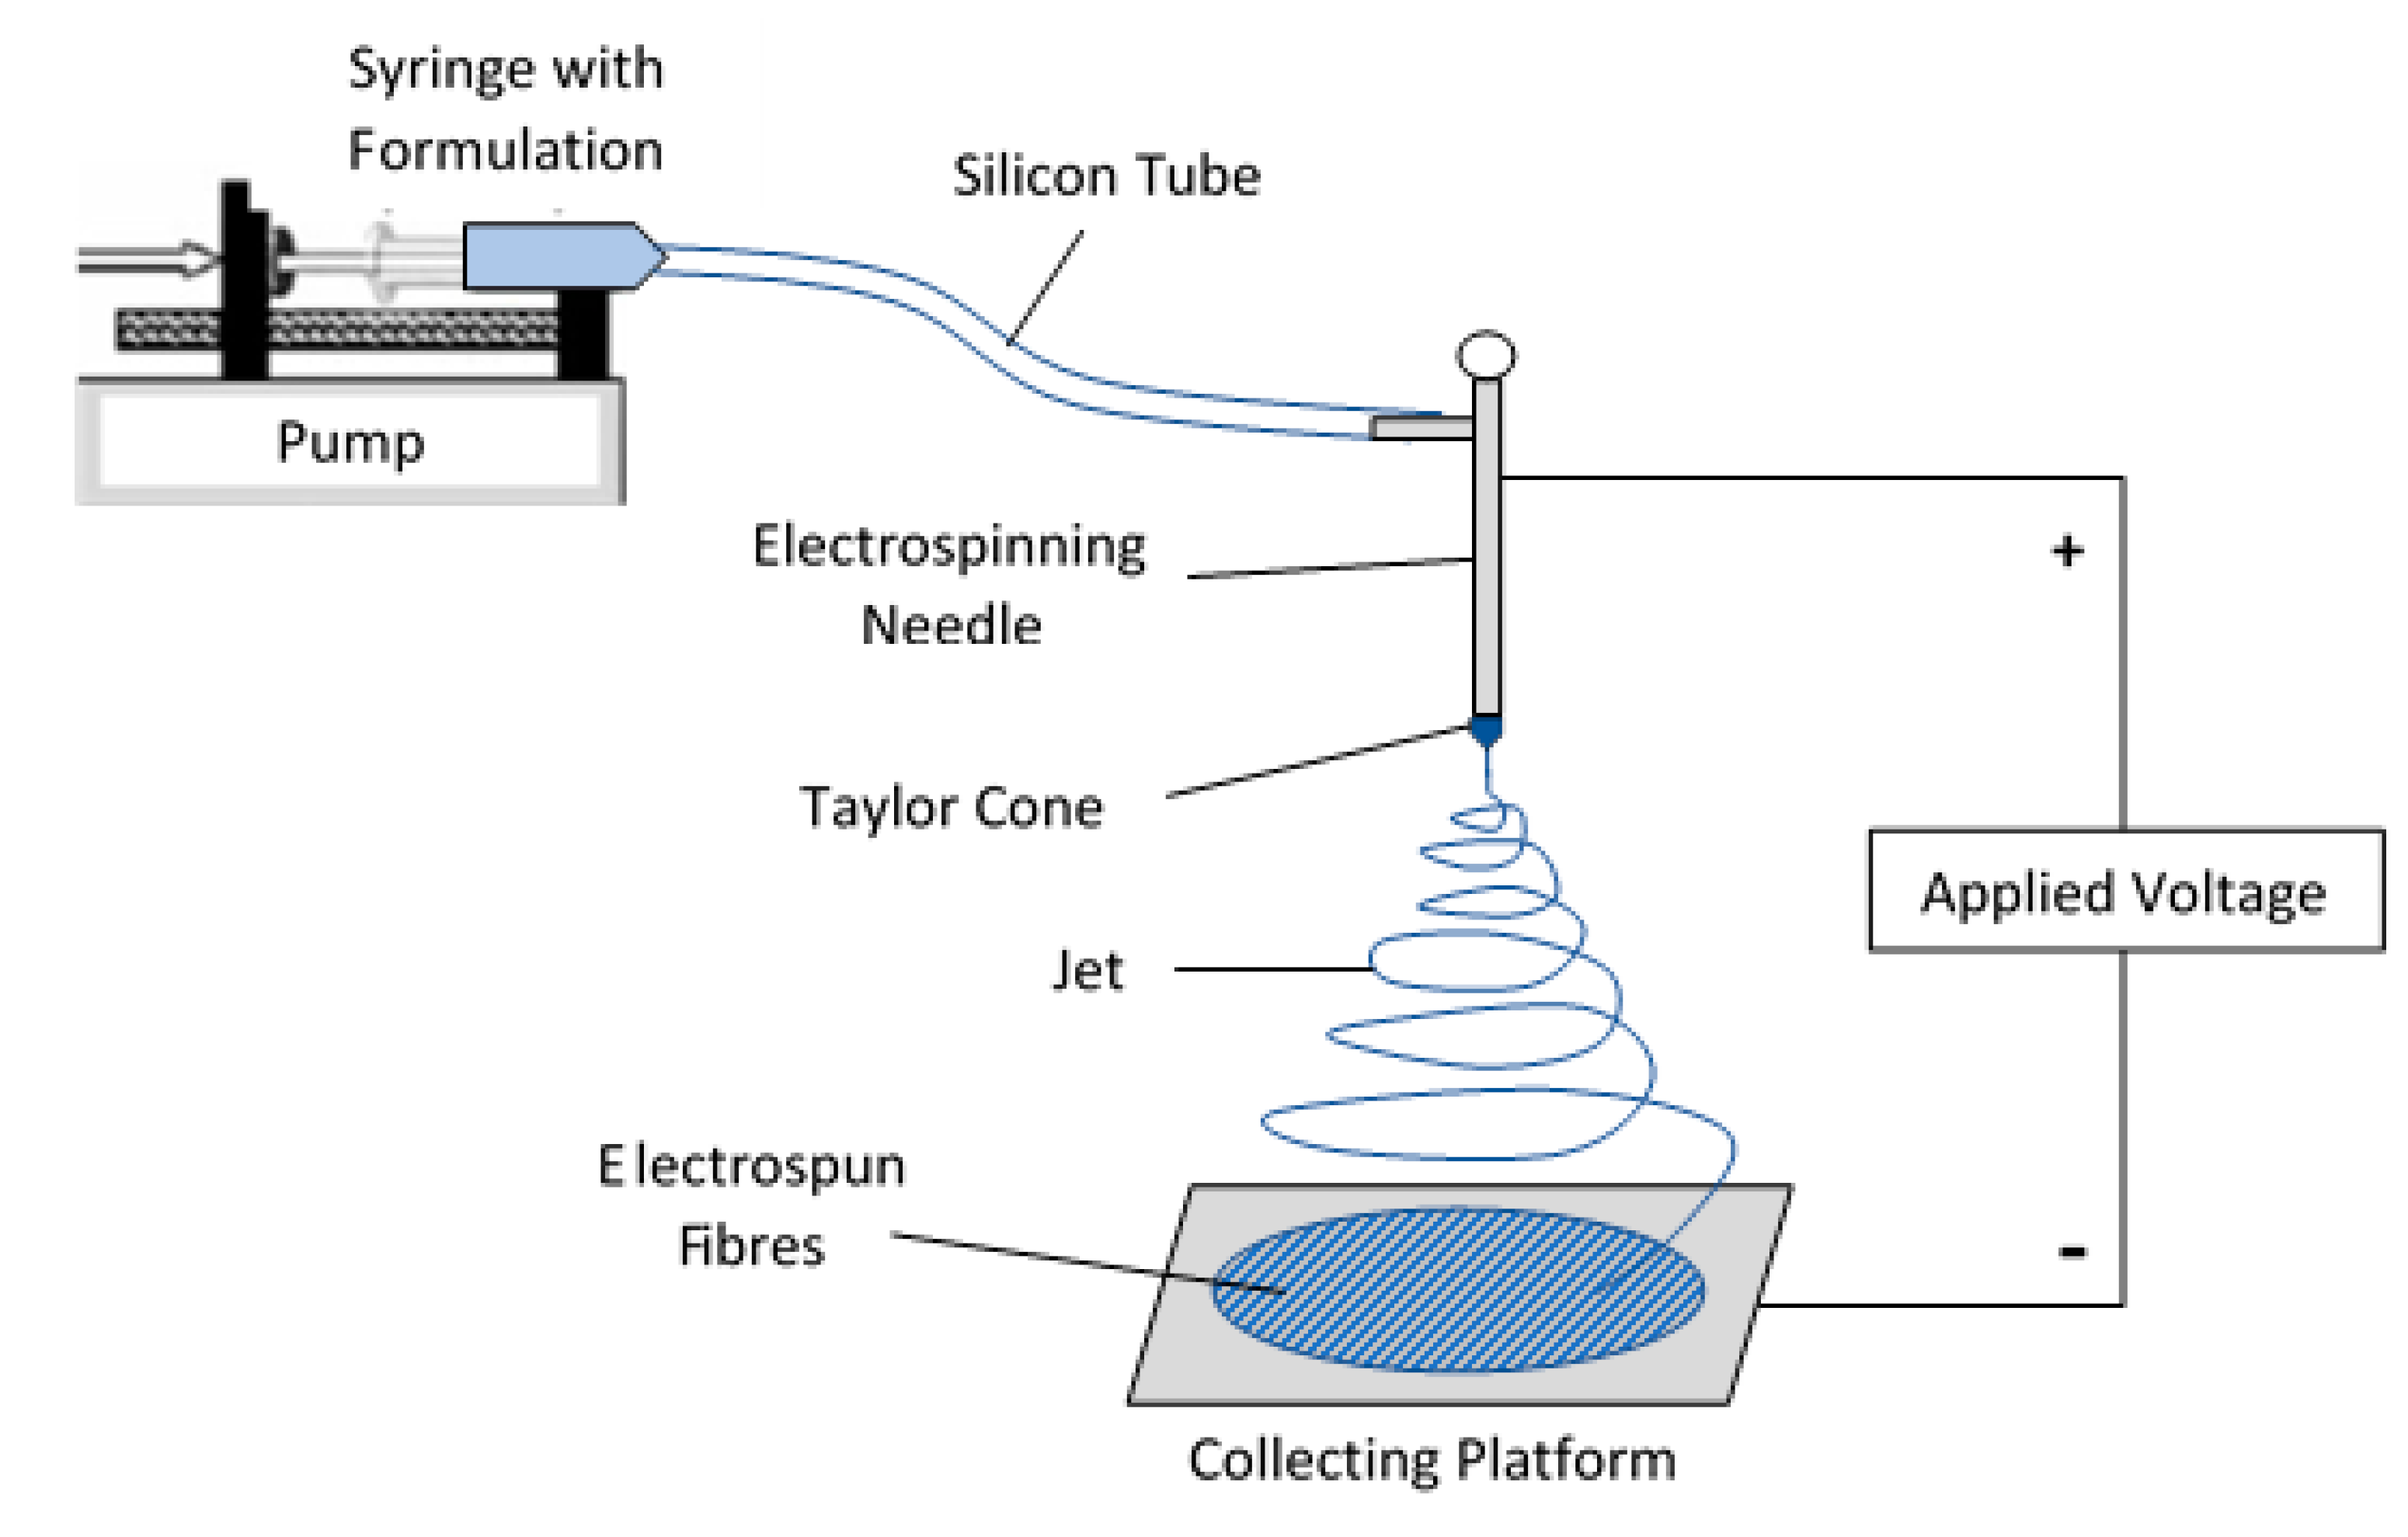
2.2.2. Preparation of Electrospun Fibres
2.2.3. FTIR Studies
2.2.4. DSC Studies
2.2.5. TGA Studies
2.2.6. XRD Studies
2.2.7. Contact Angle
2.2.8. Drug loading Capacity
2.2.9. In Vitro Release Study
2.2.10. Main QbD Experiment
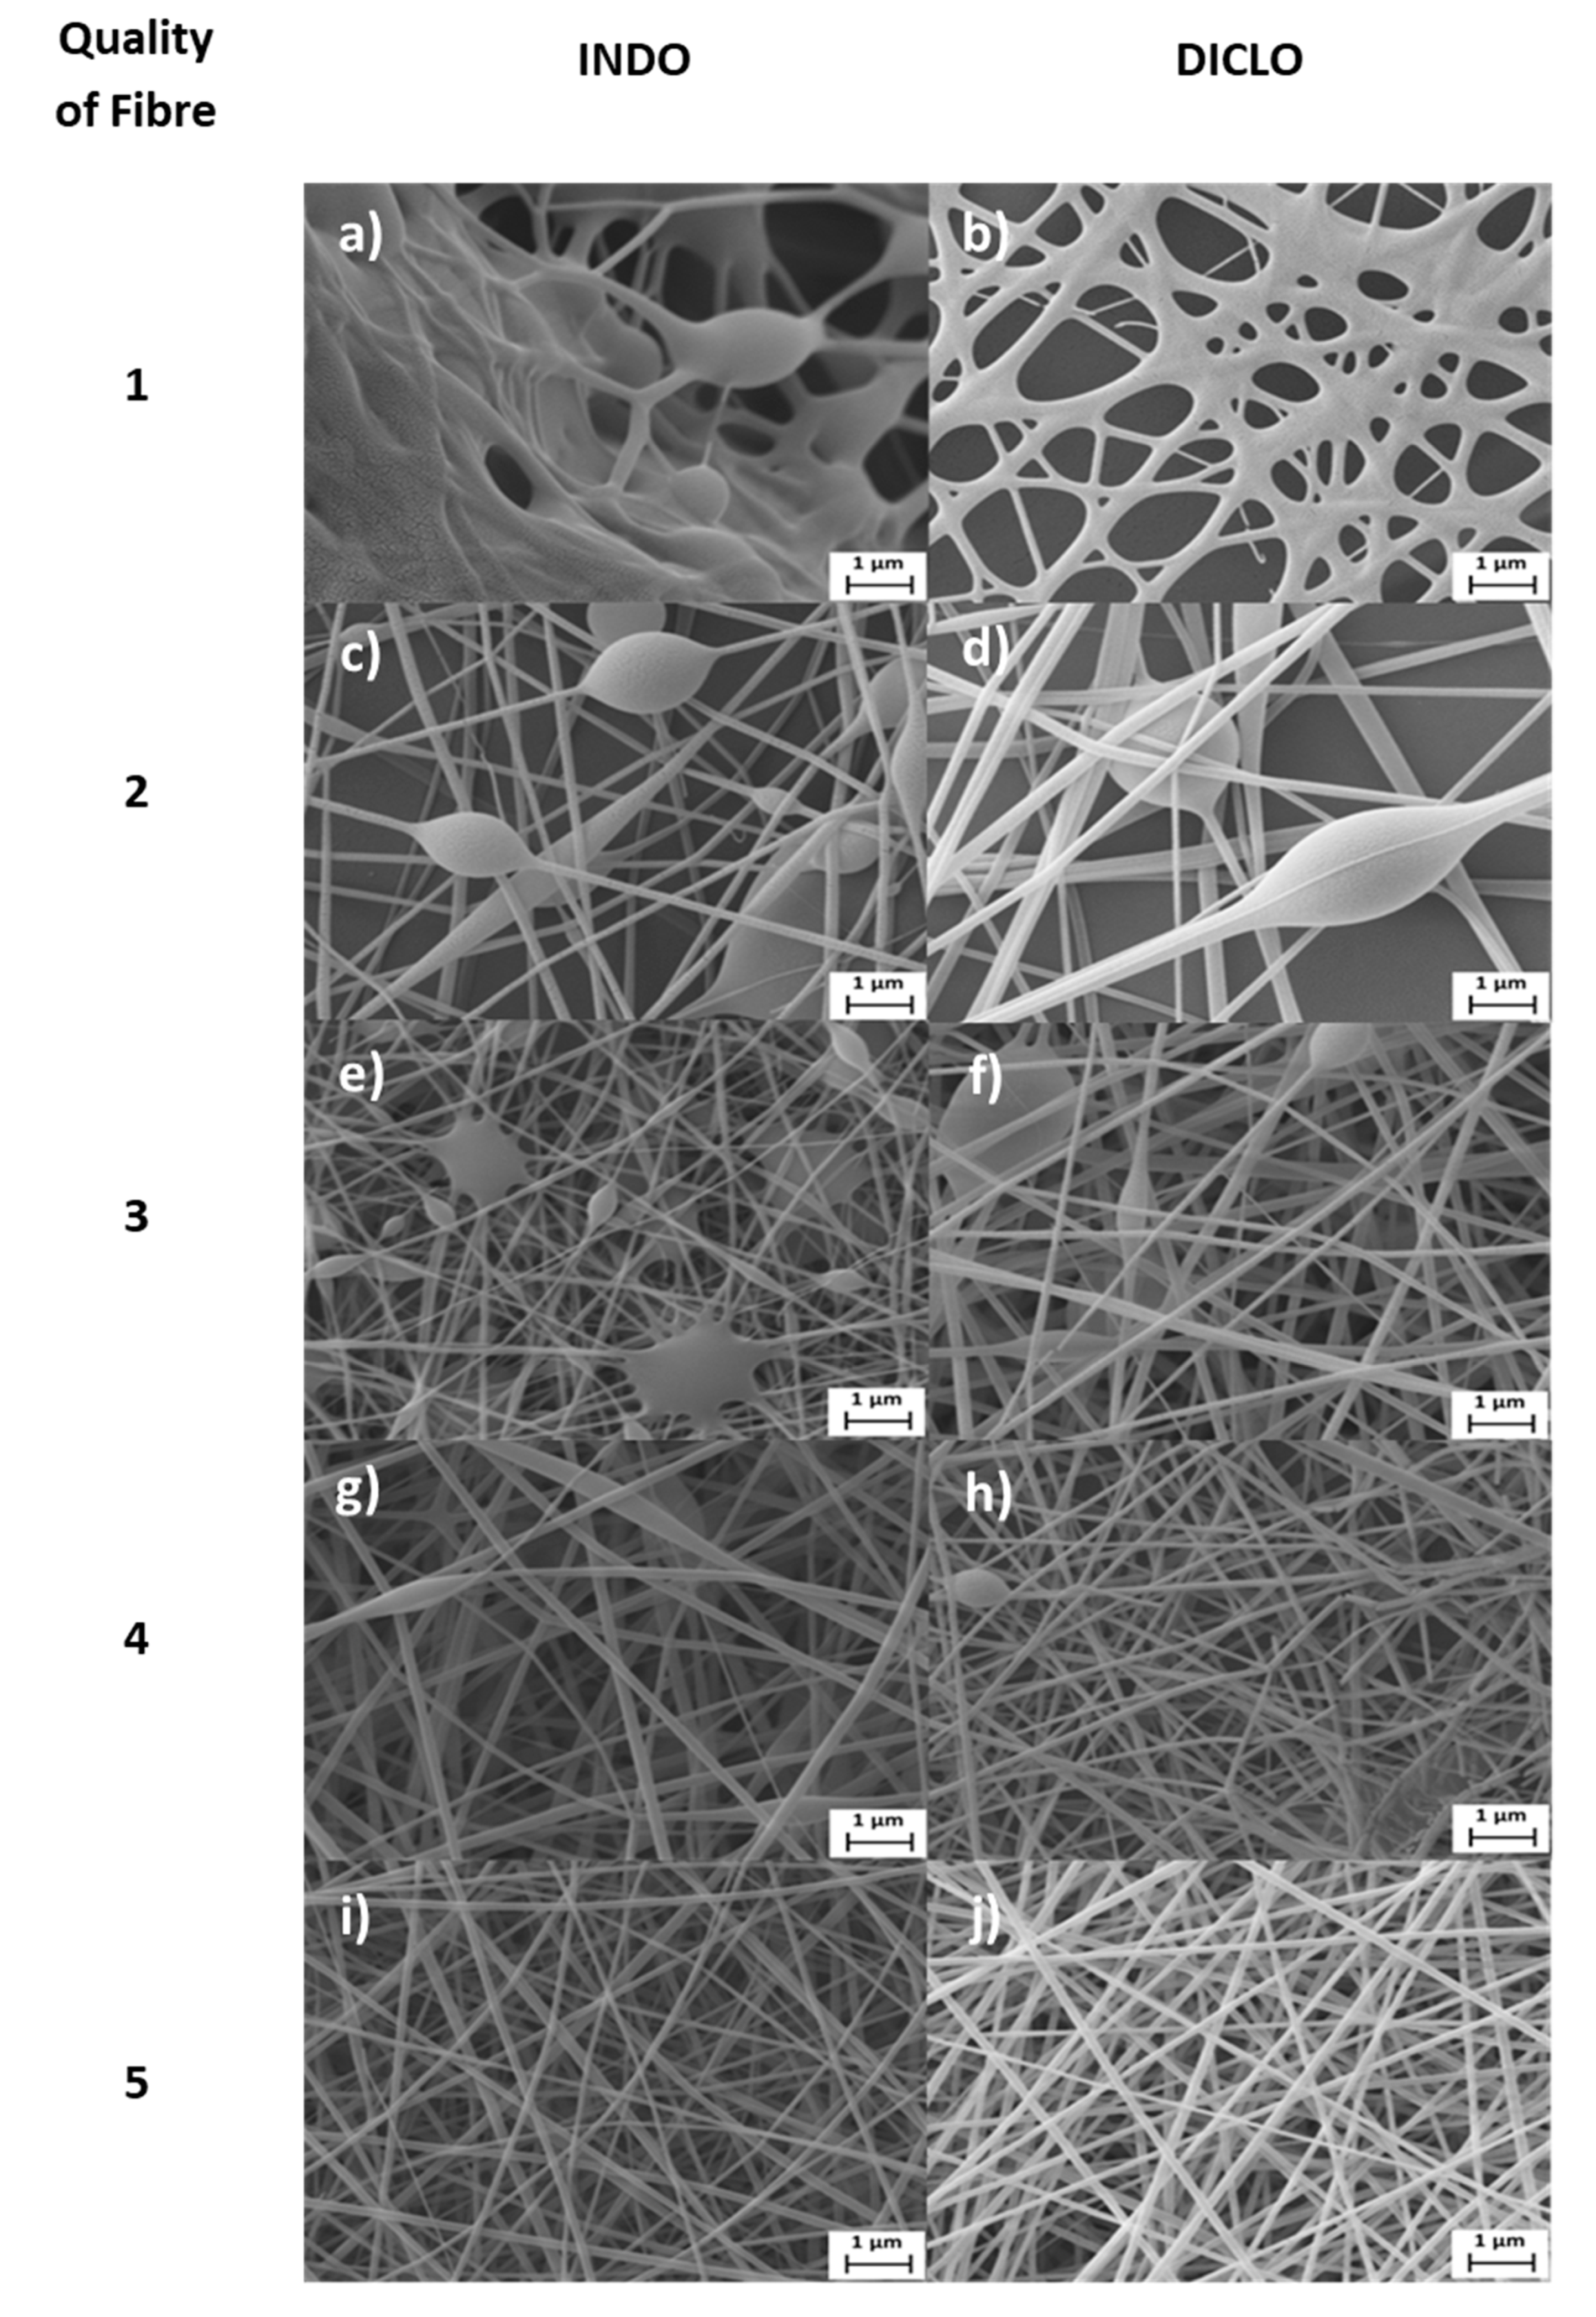
SEM Analysis
Preliminary Risk Assessments
3. Results and Discussion
3.1. QTTP and CQAs
3.2. Characterisation Tests for Electrospun Fibres
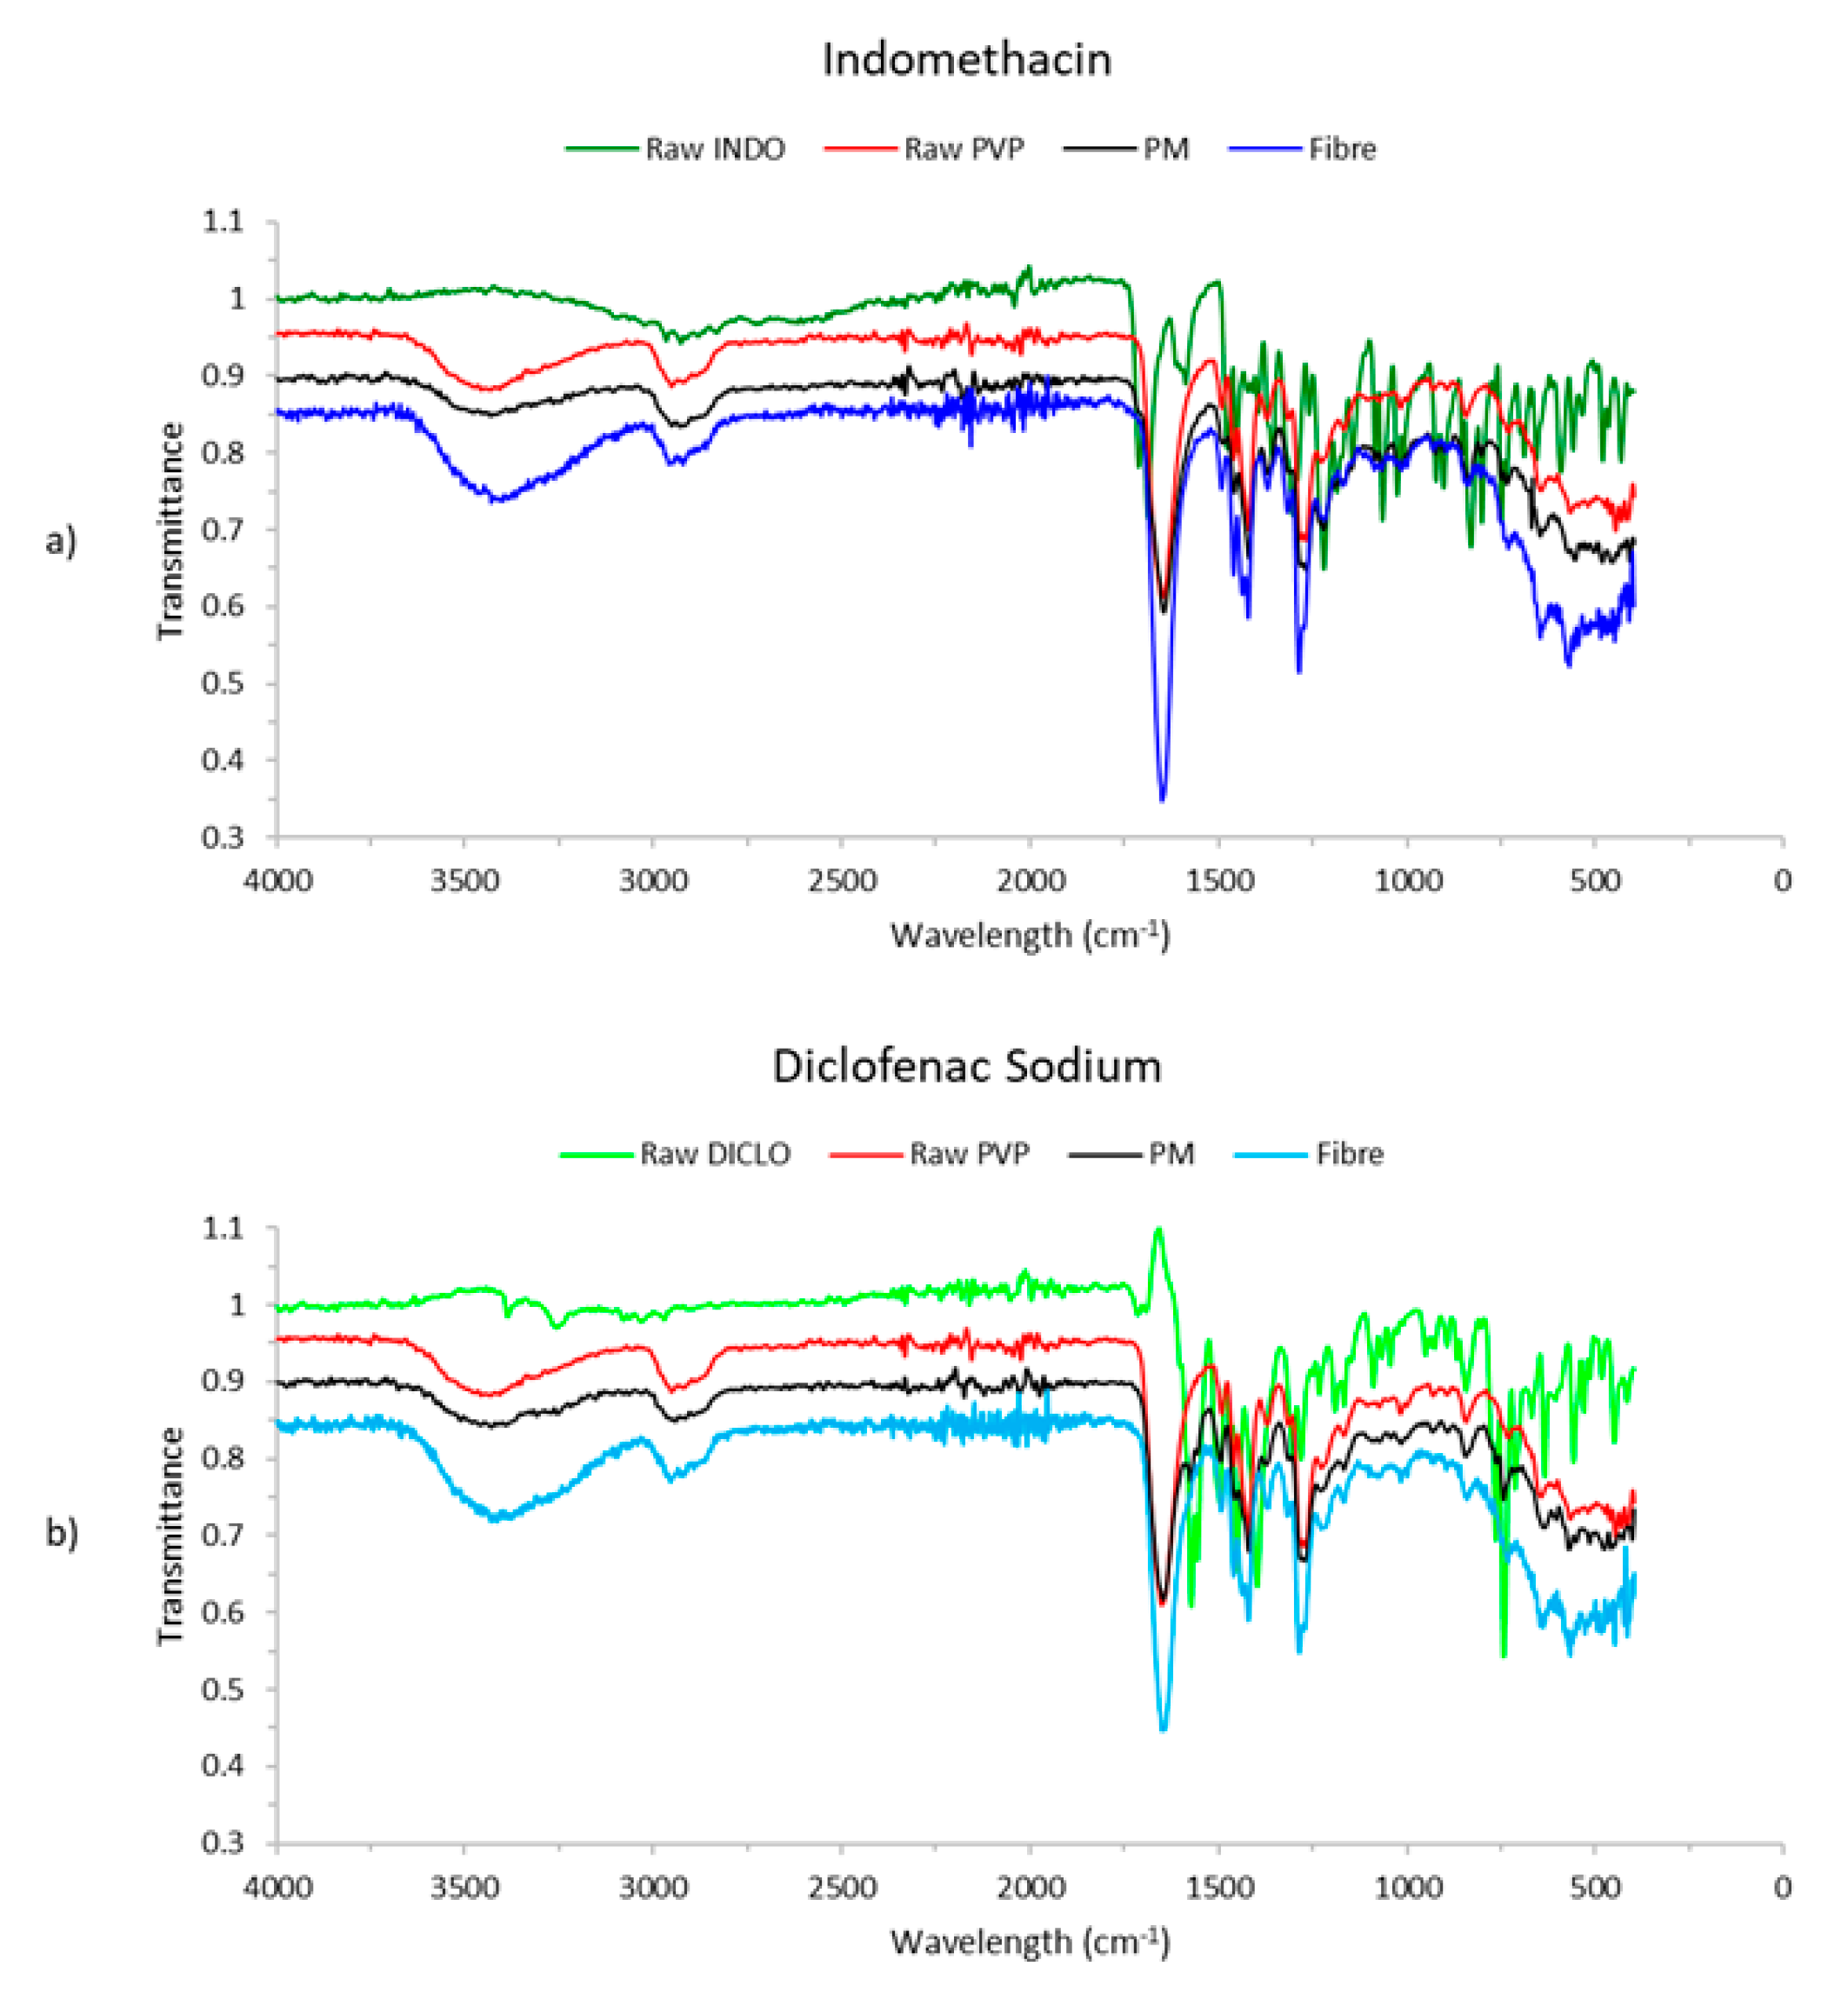
3.2.1. FTIR Studies
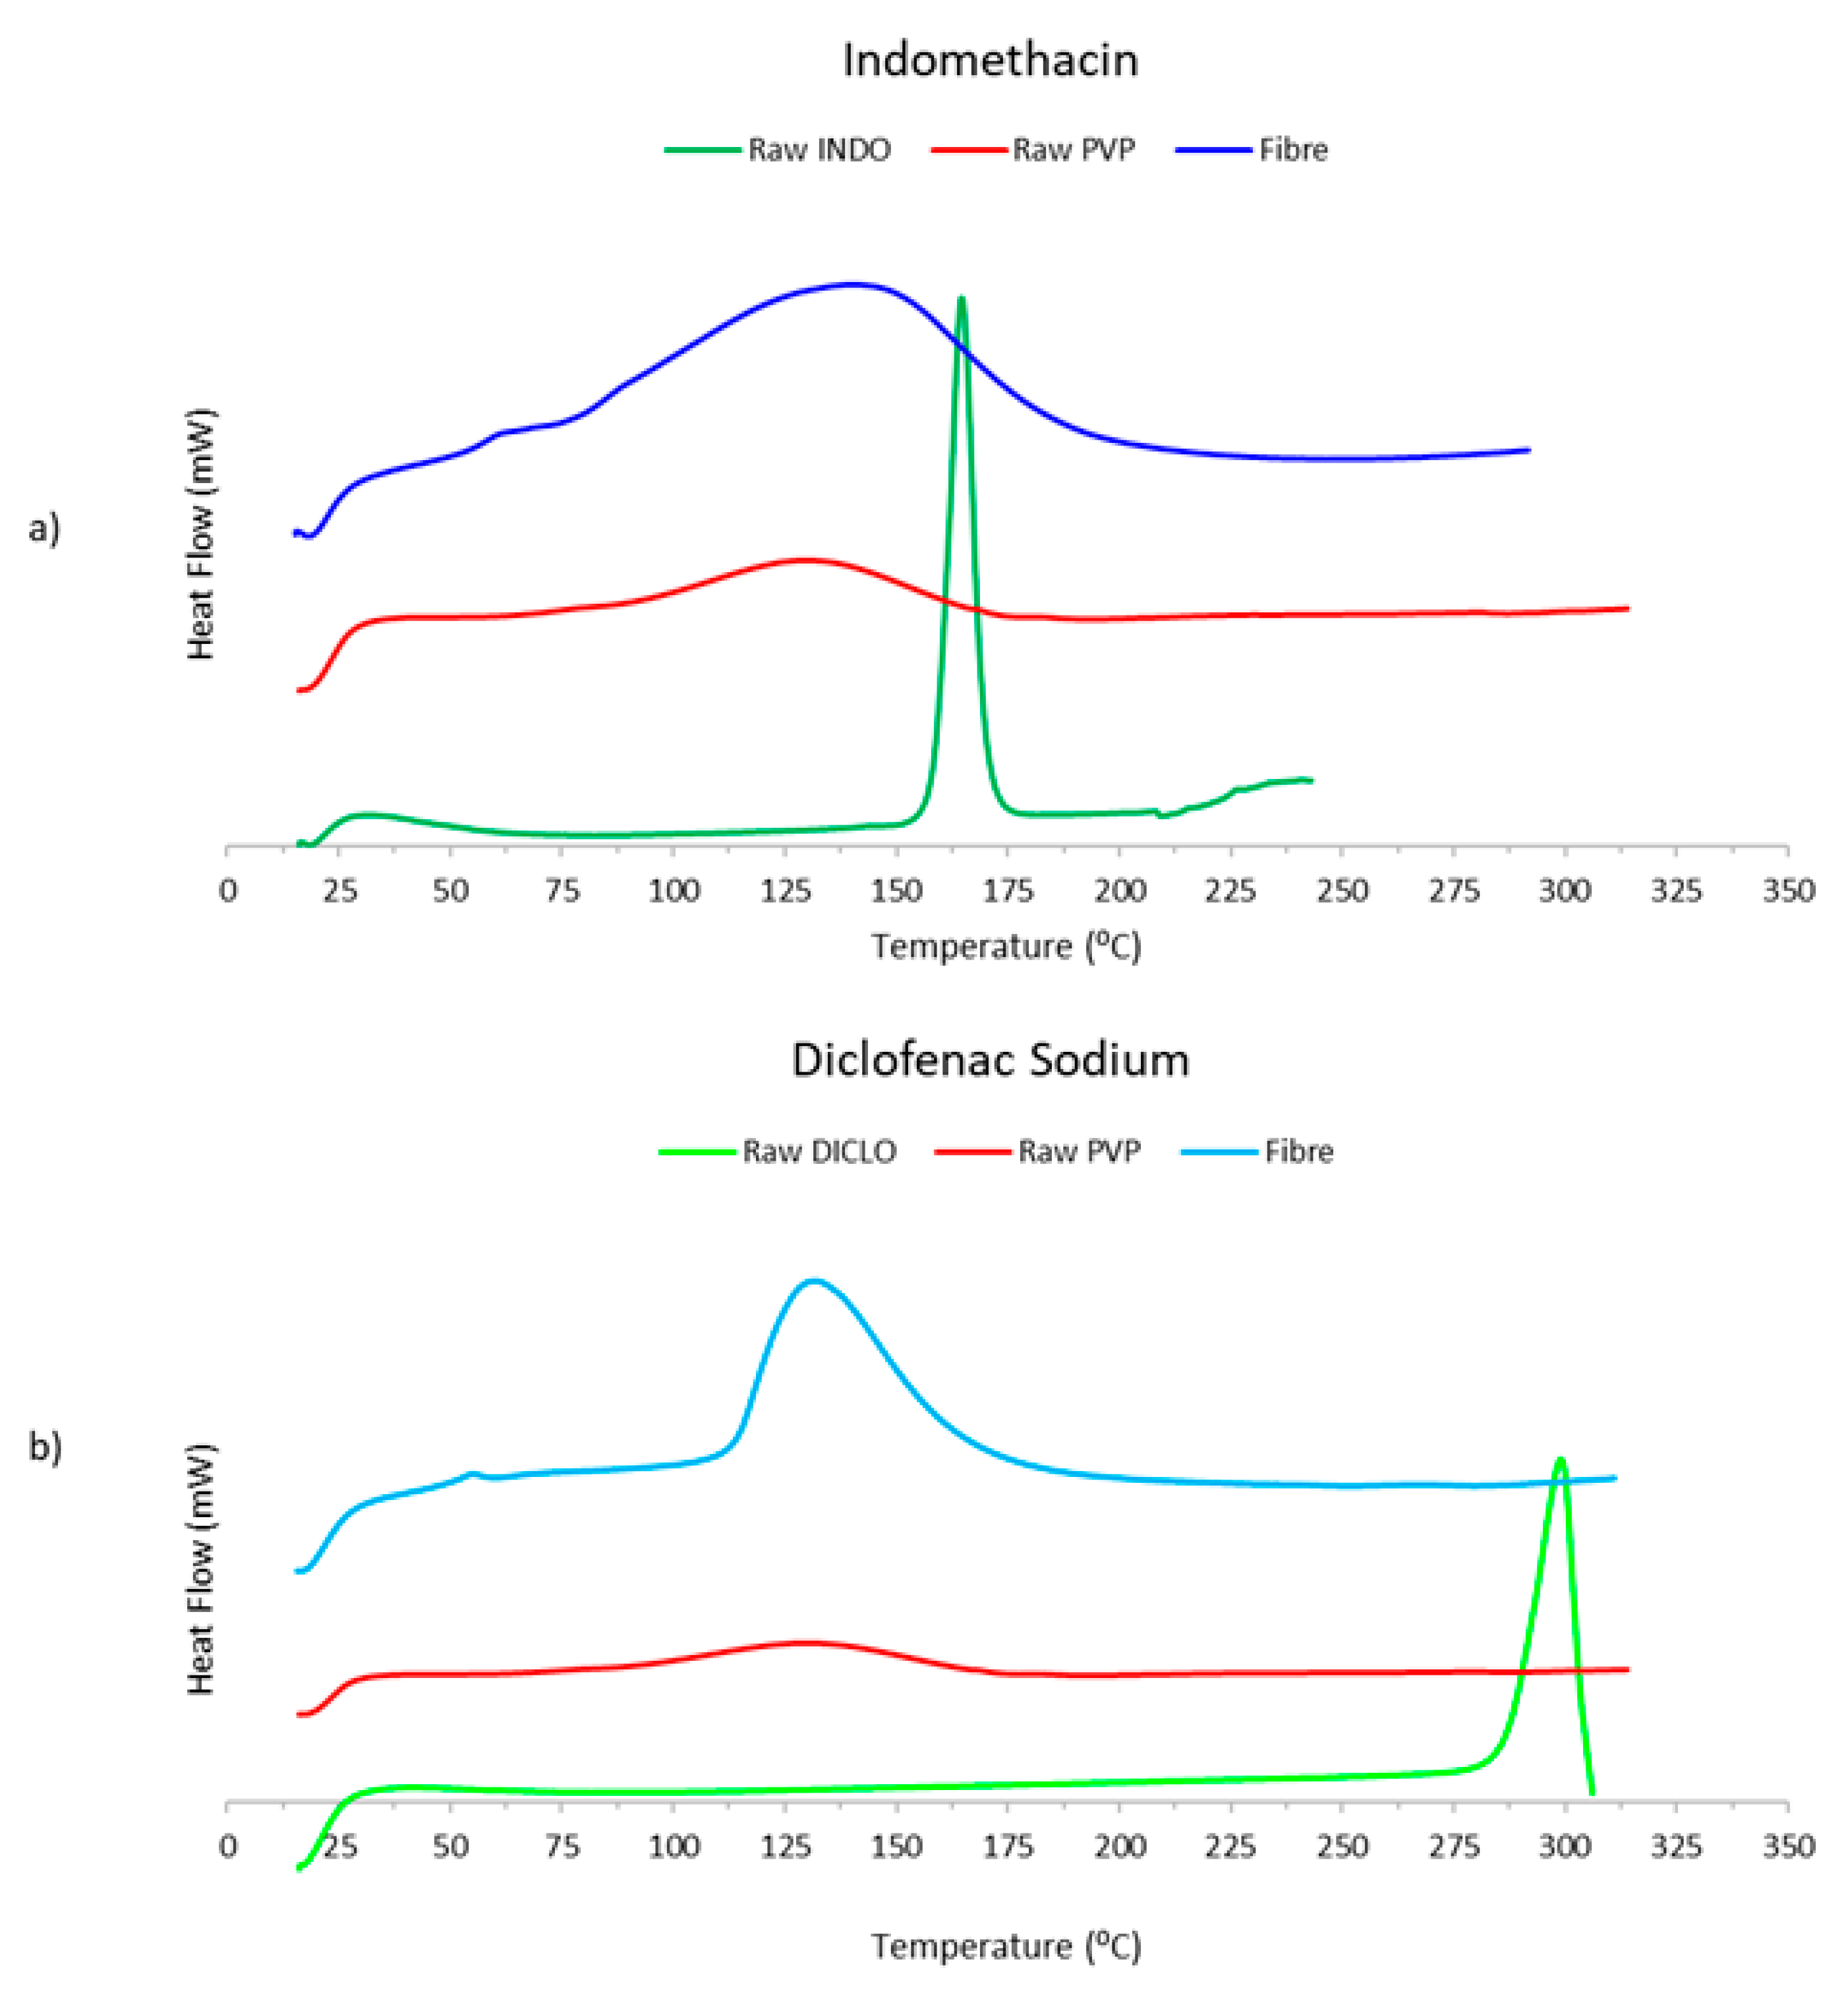
3.2.2. DSC Studies
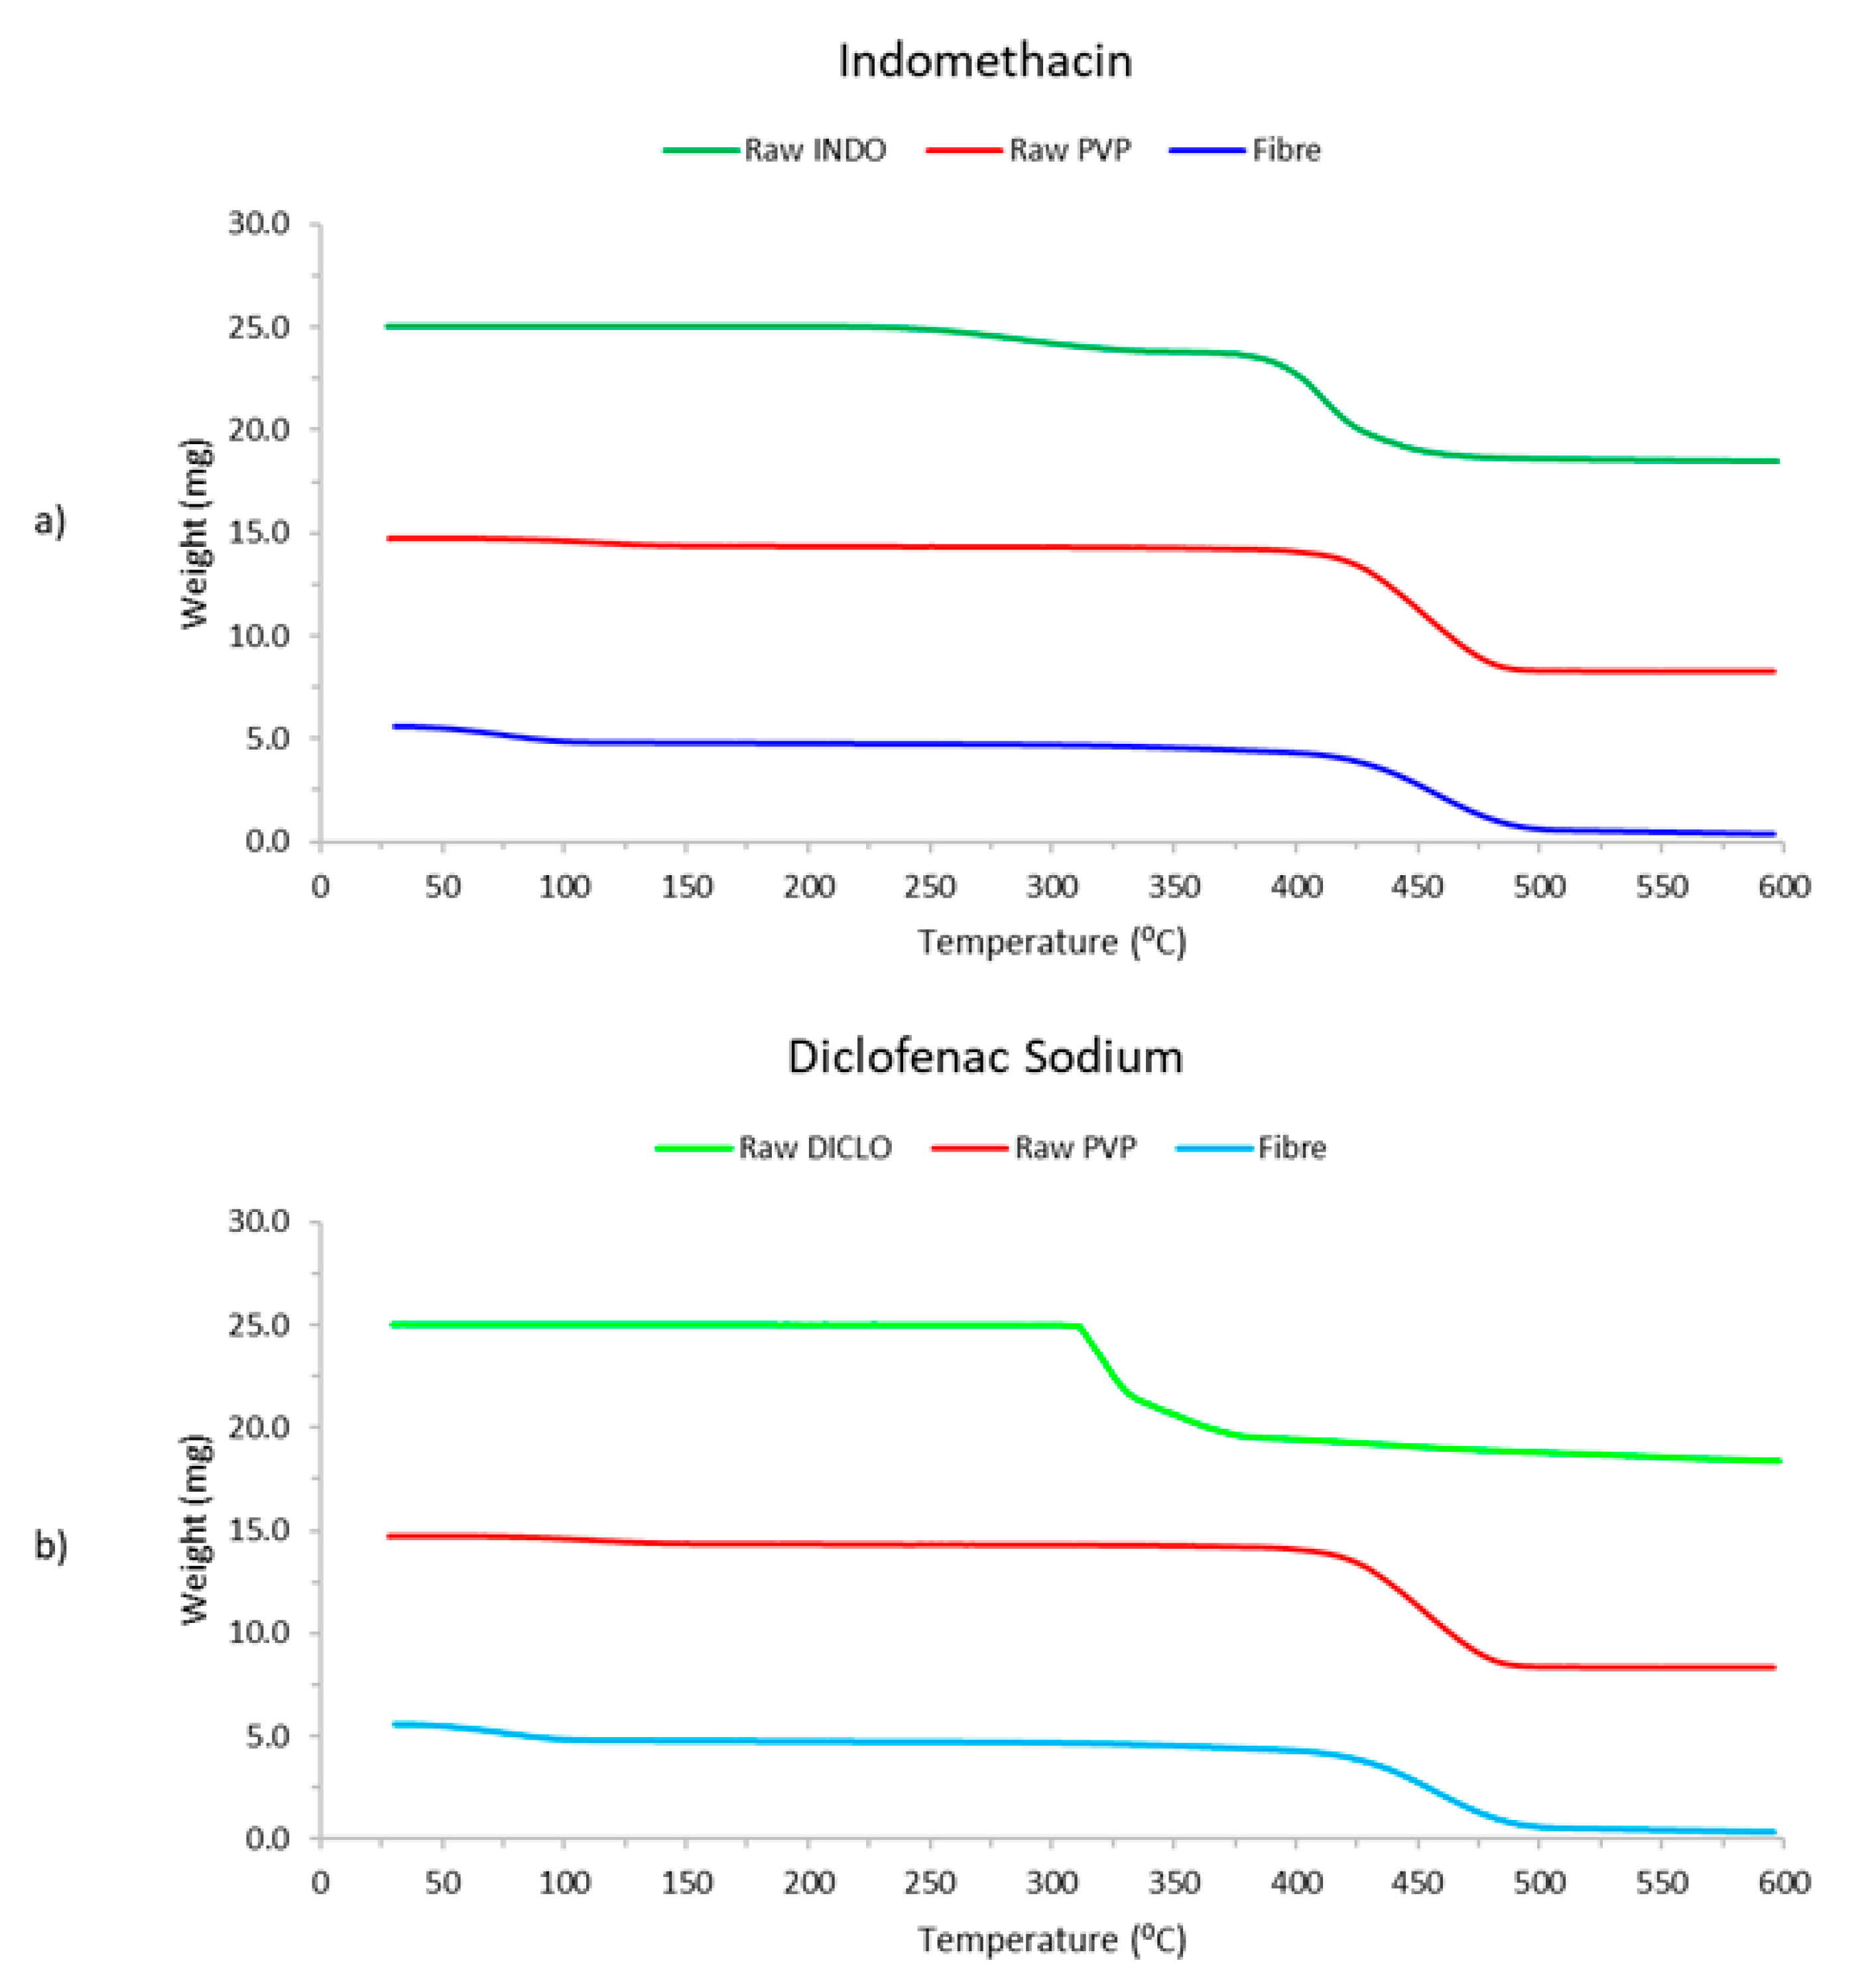
3.2.3. TGA Studies
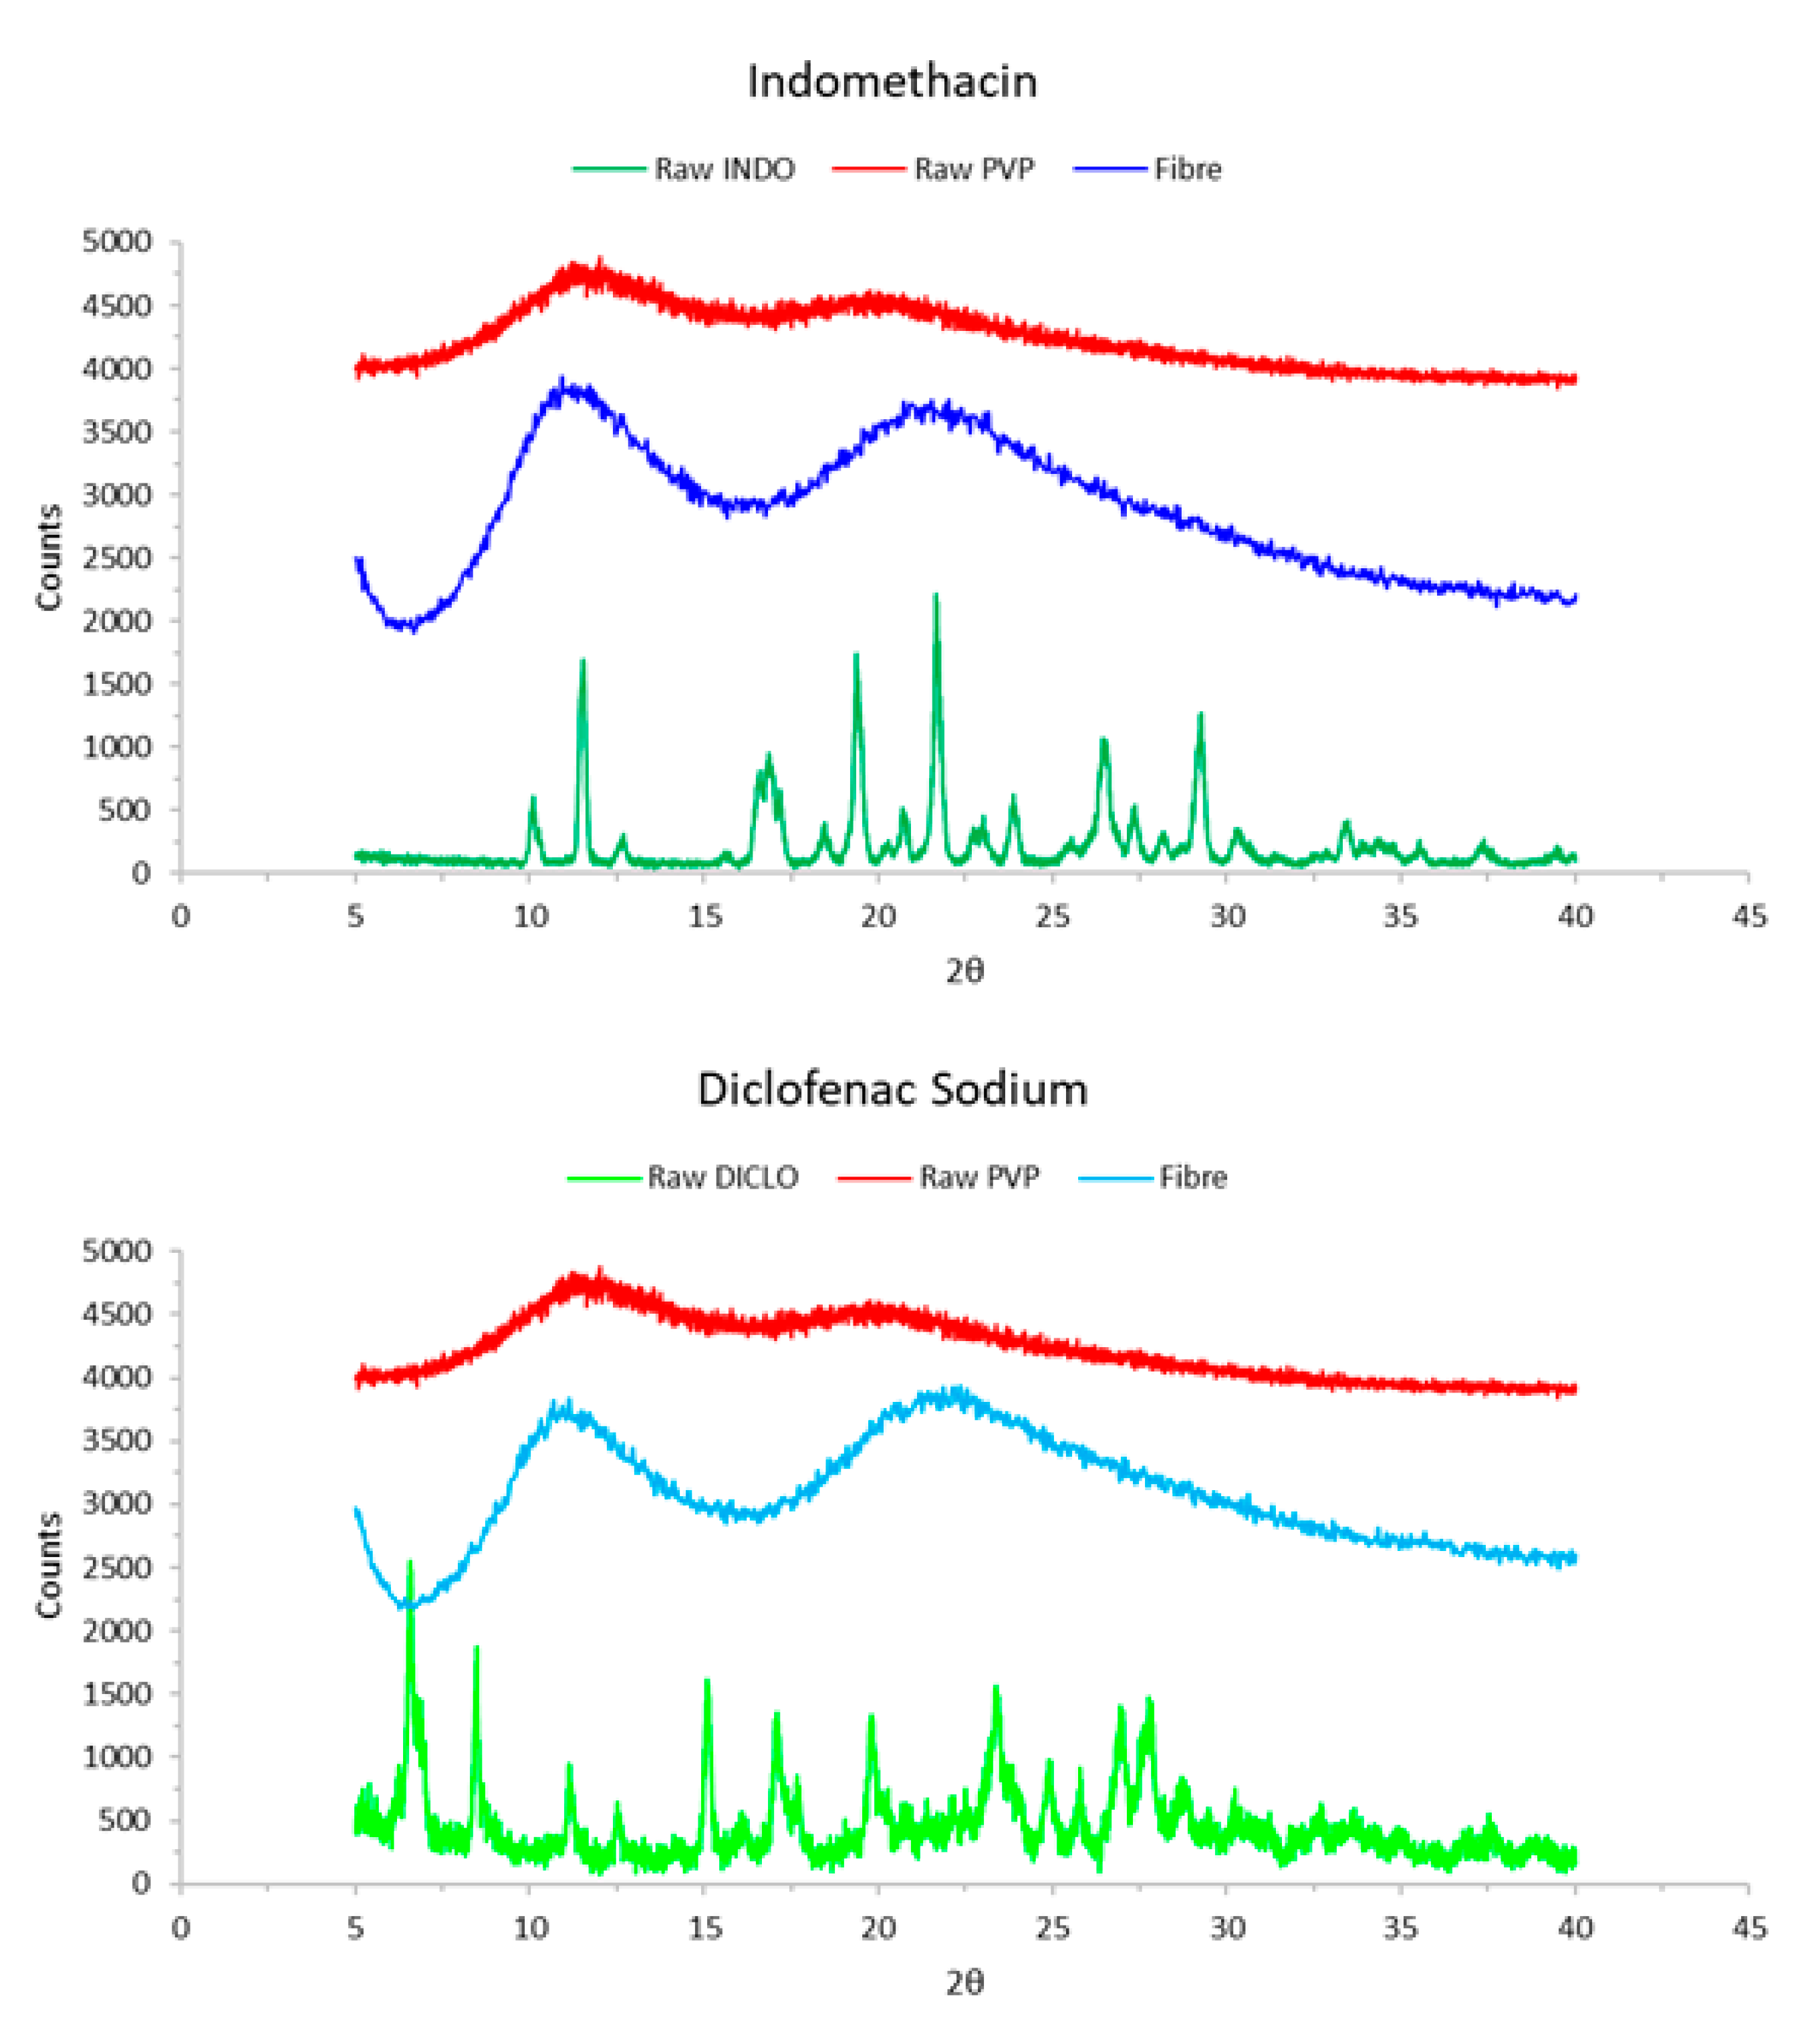
3.2.4. XRD Studies
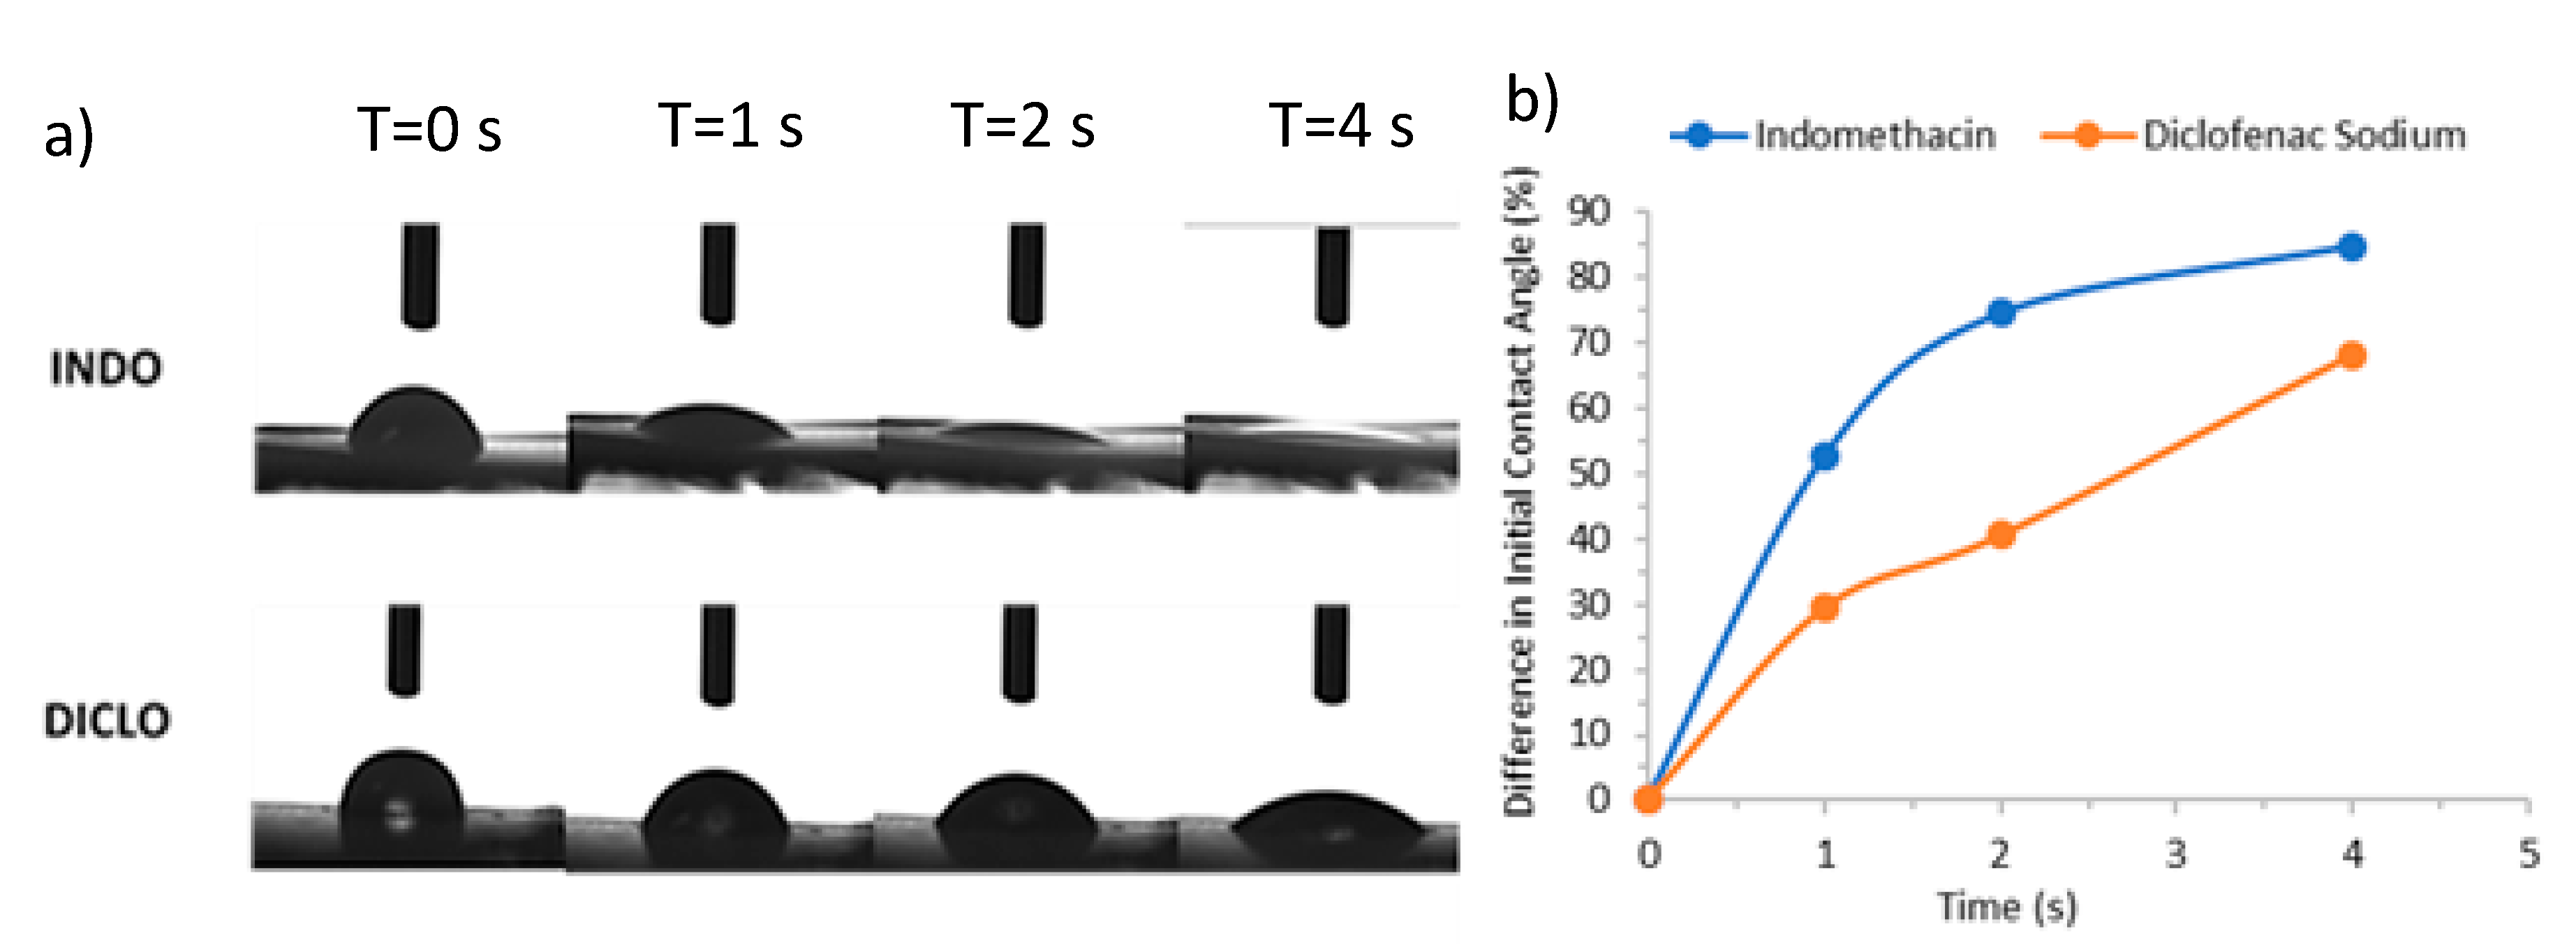
3.2.5. Contact Angle Measurements
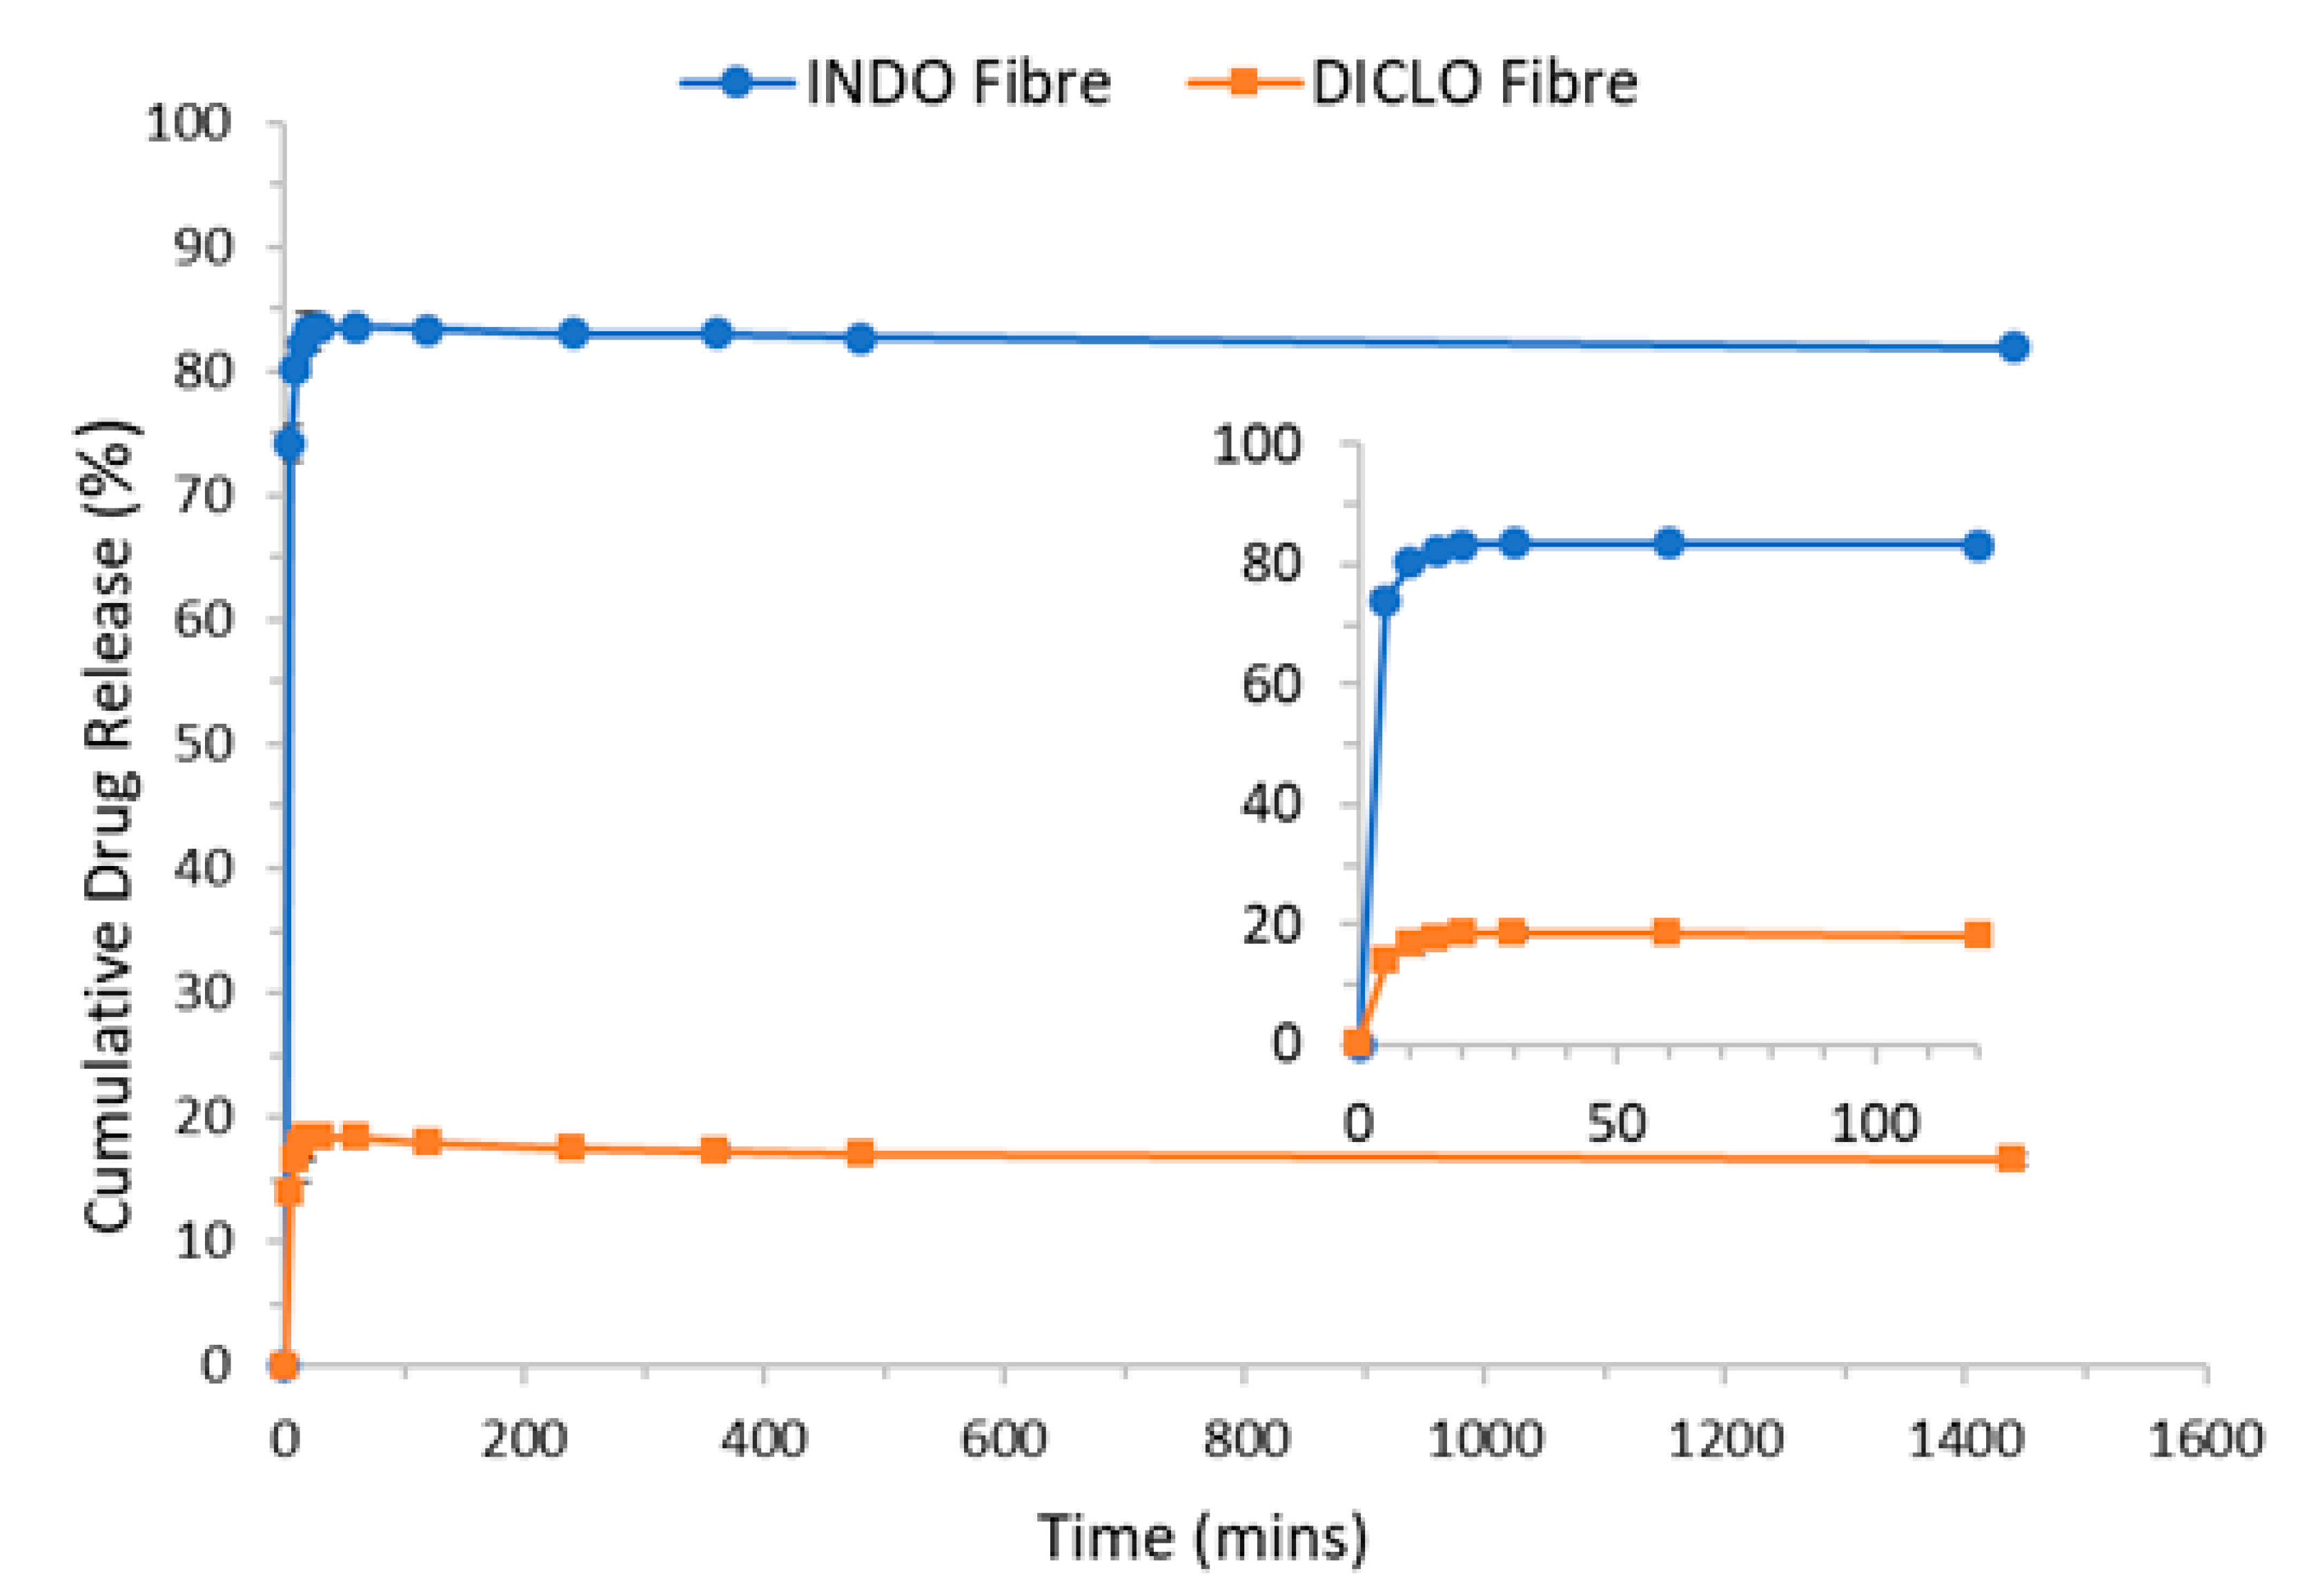
3.2.6. In Vitro Release Study and Drug Encapsulation
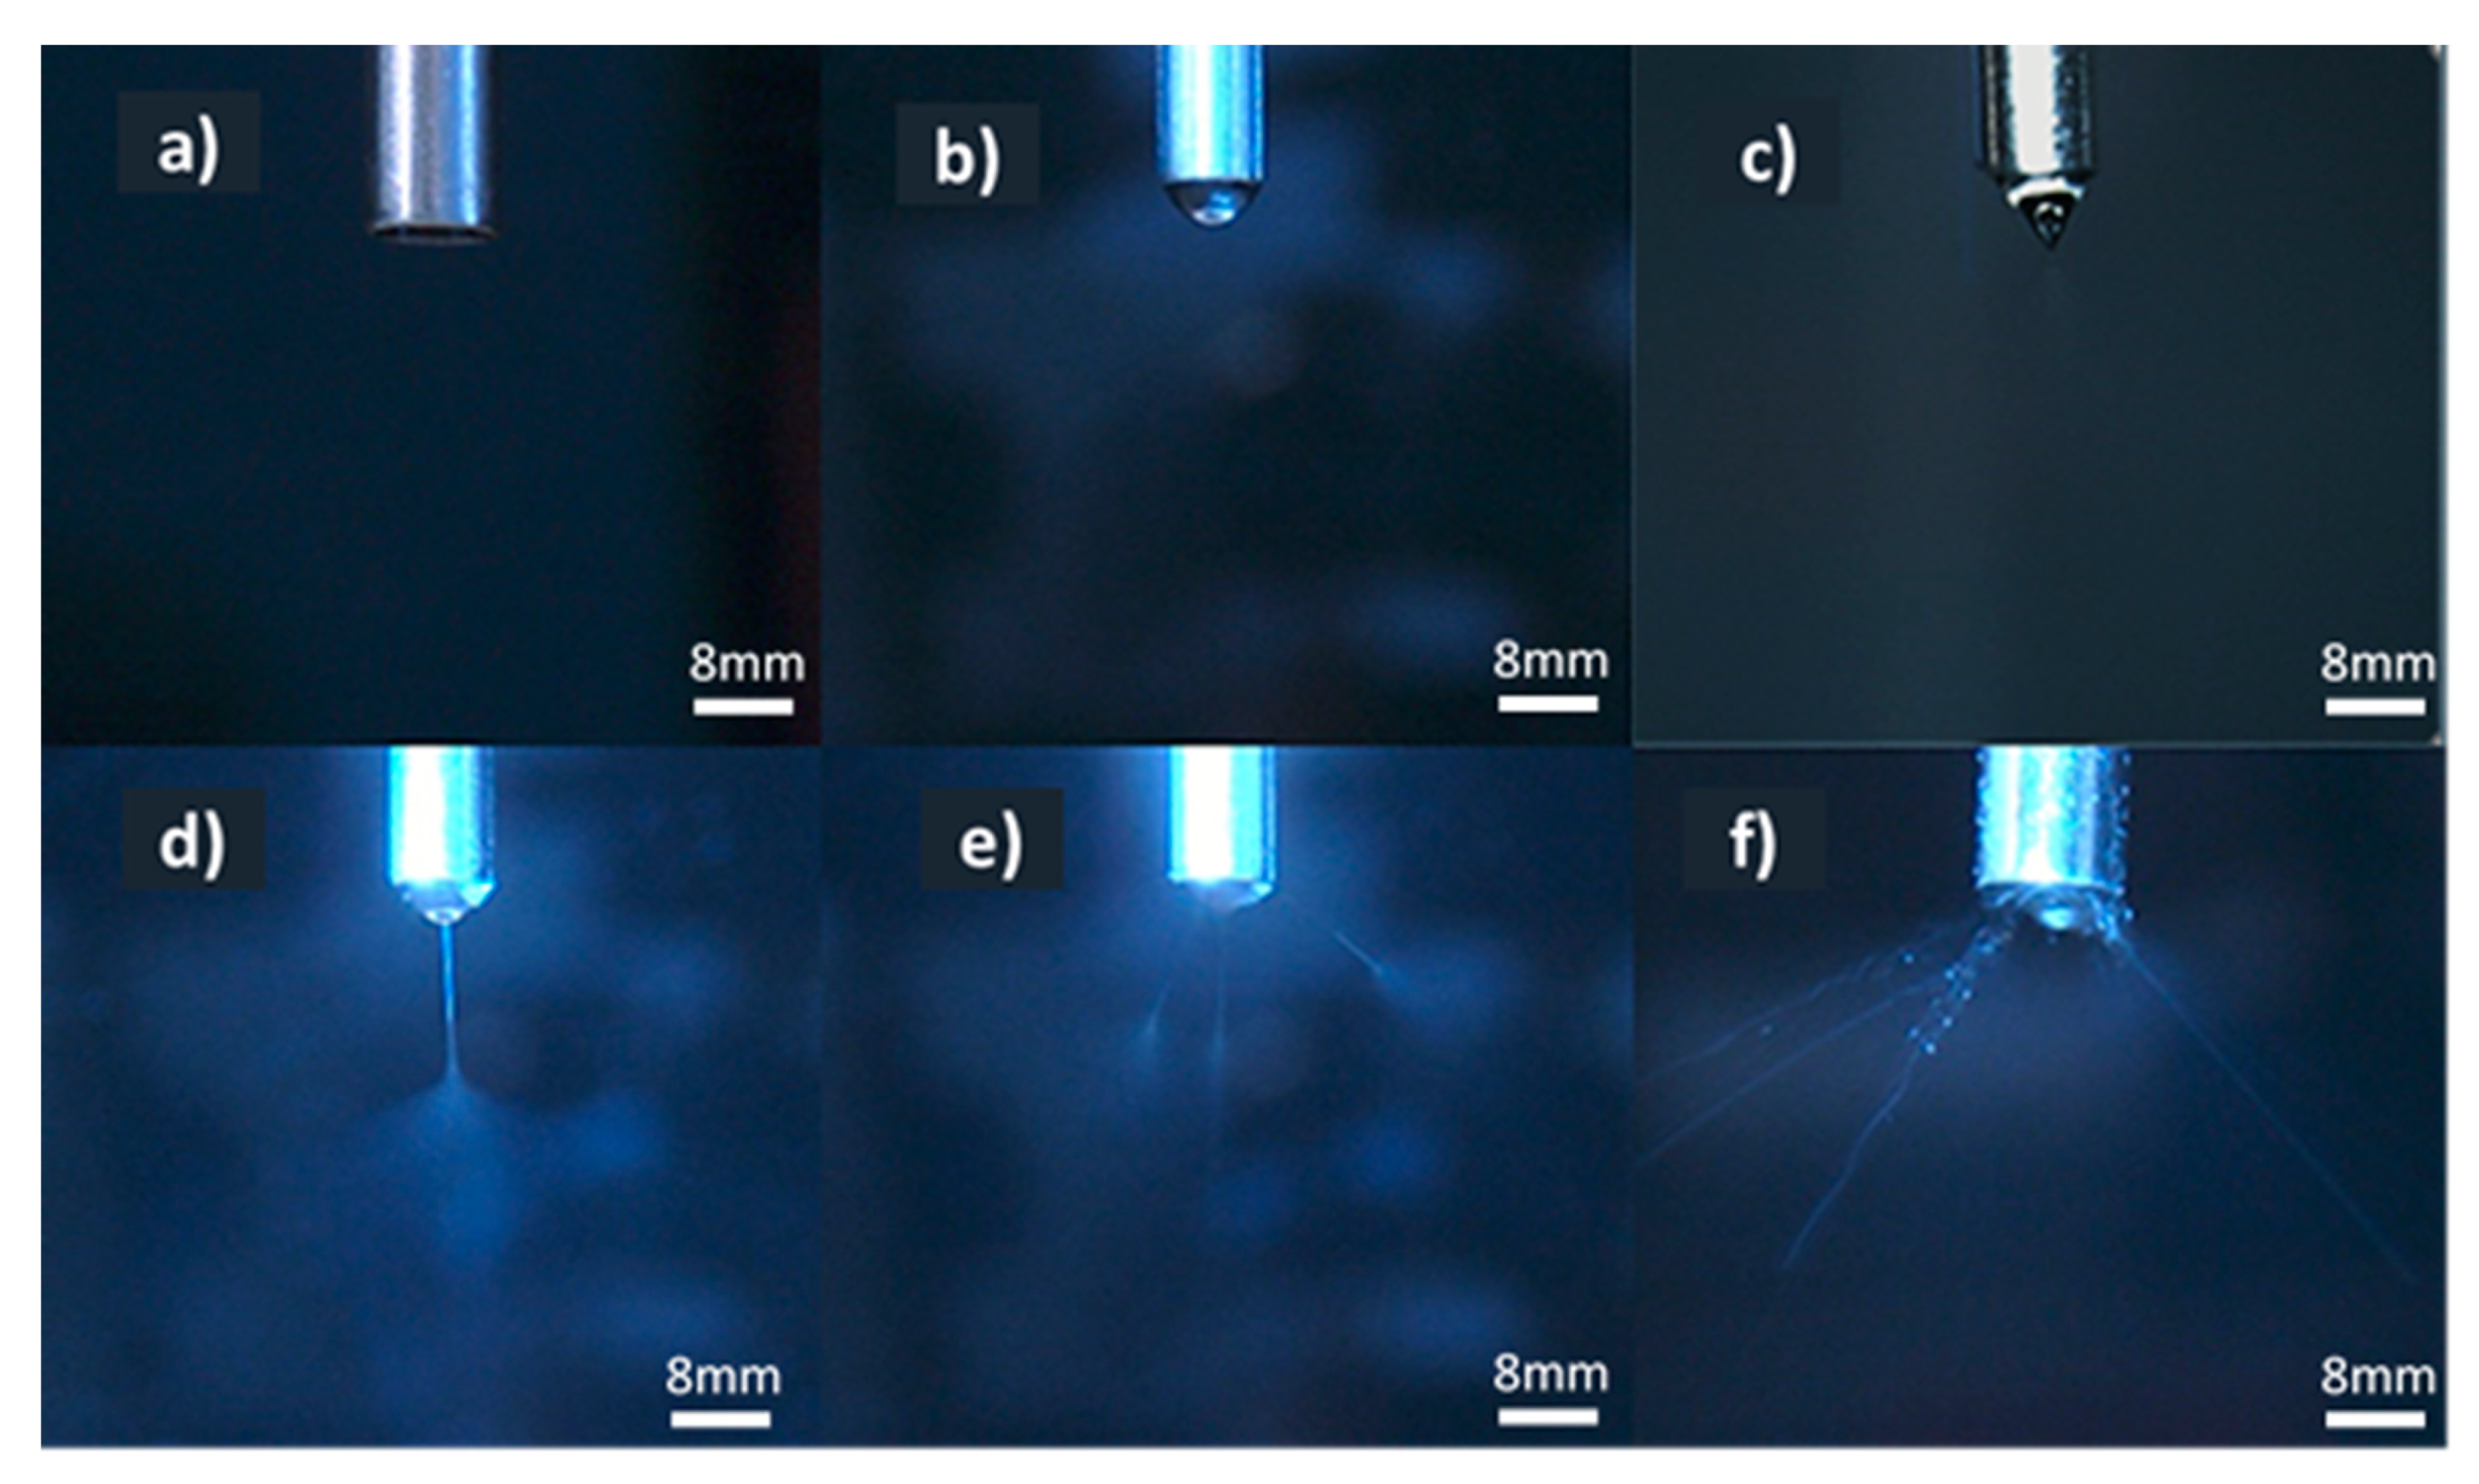
3.2.7. QbD Experiment
3.2.8. Grading Quality of Fibre
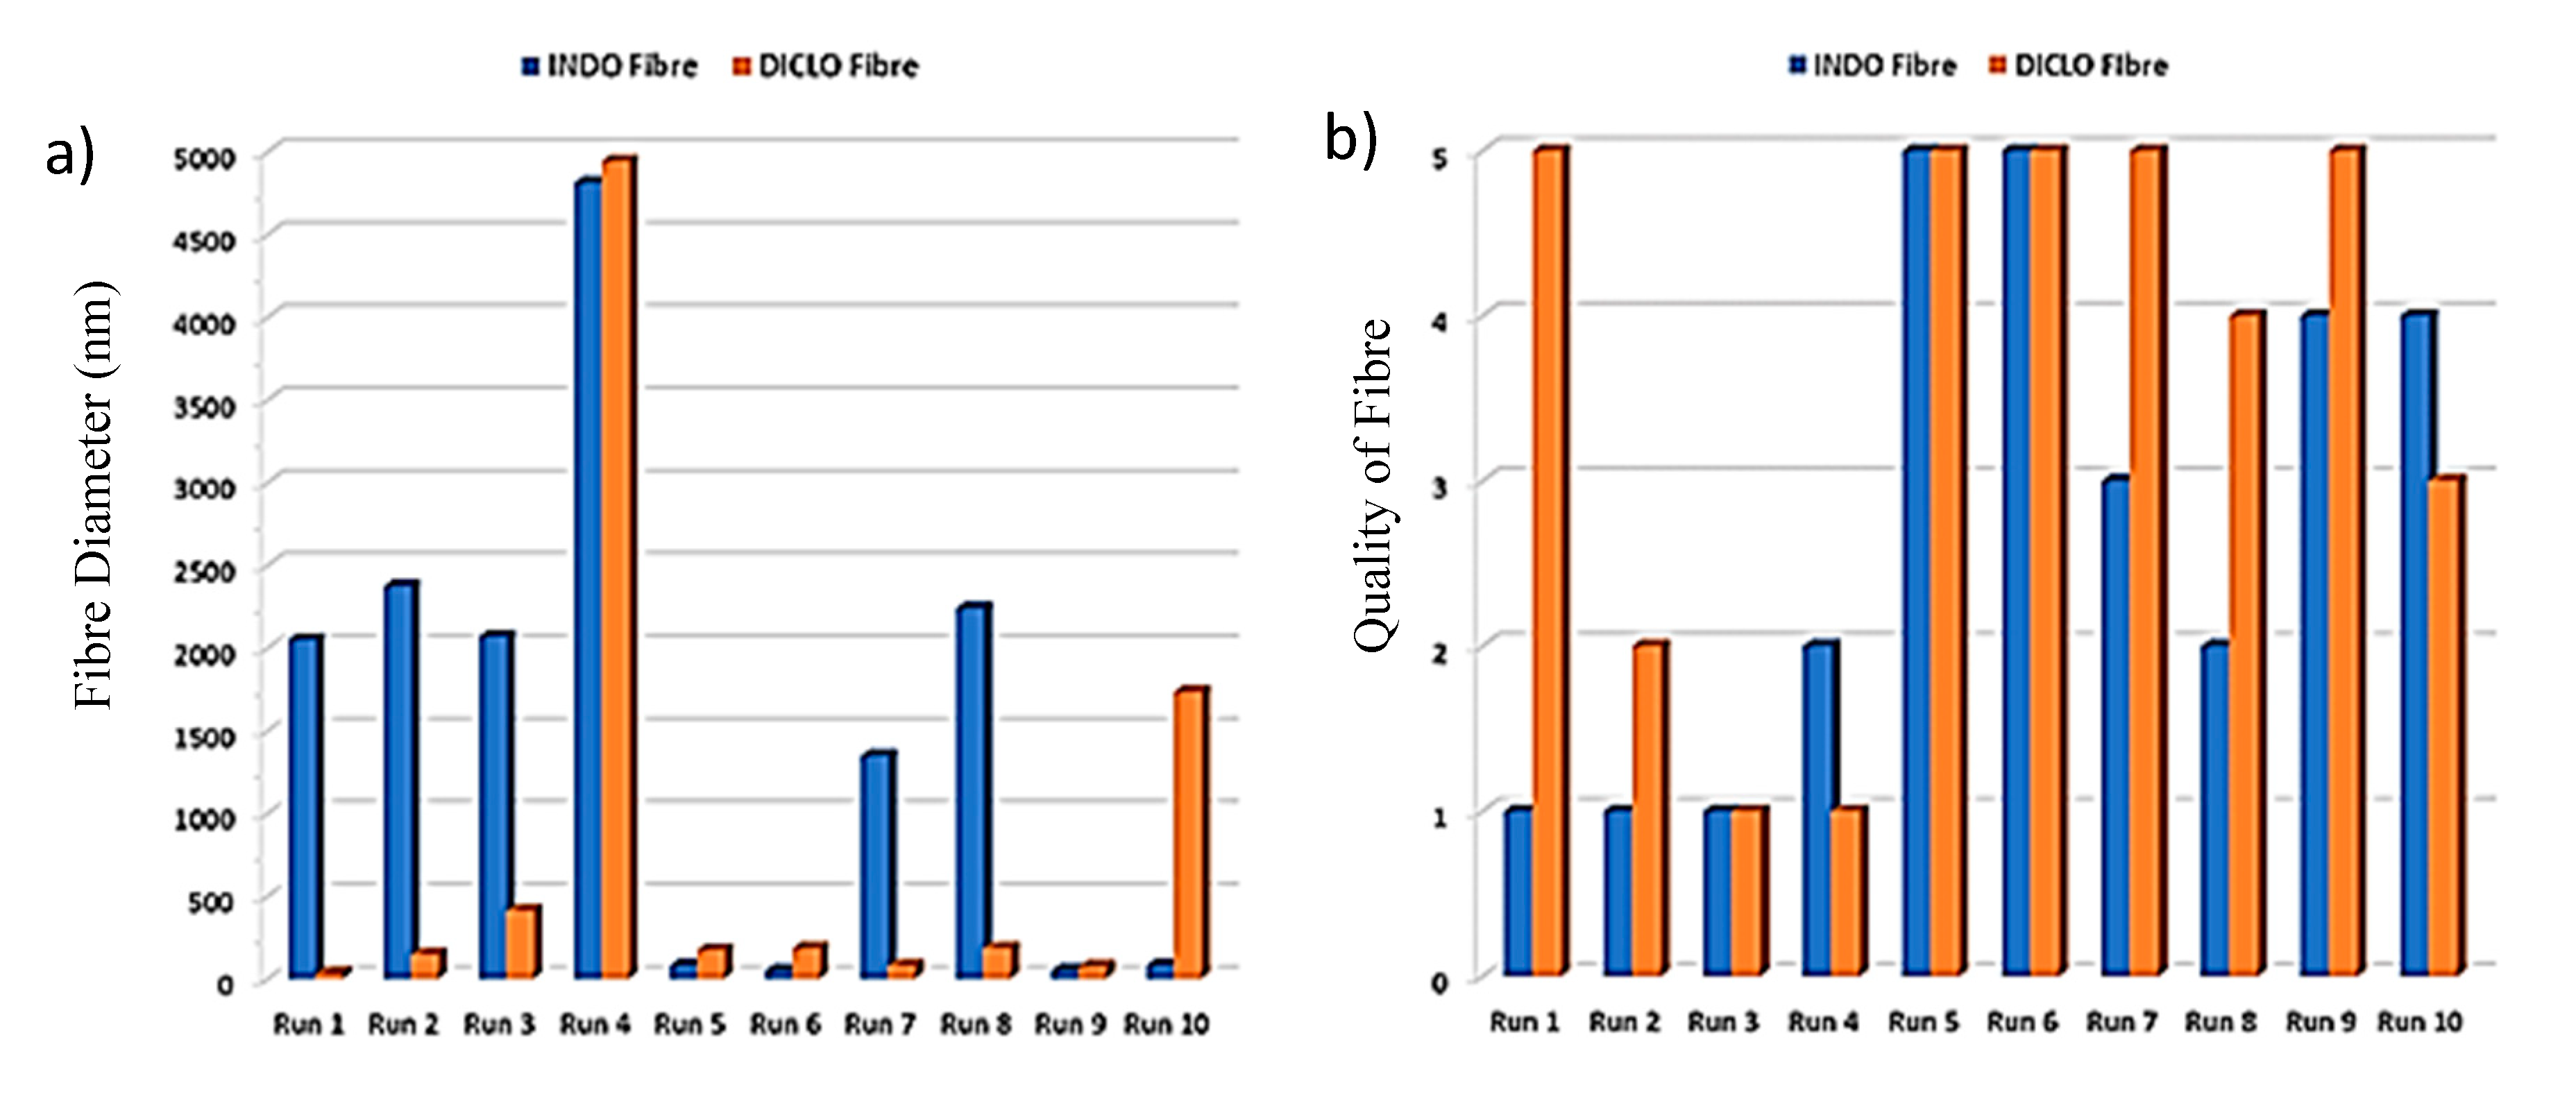
3.2.9. Distribution of Raw Results
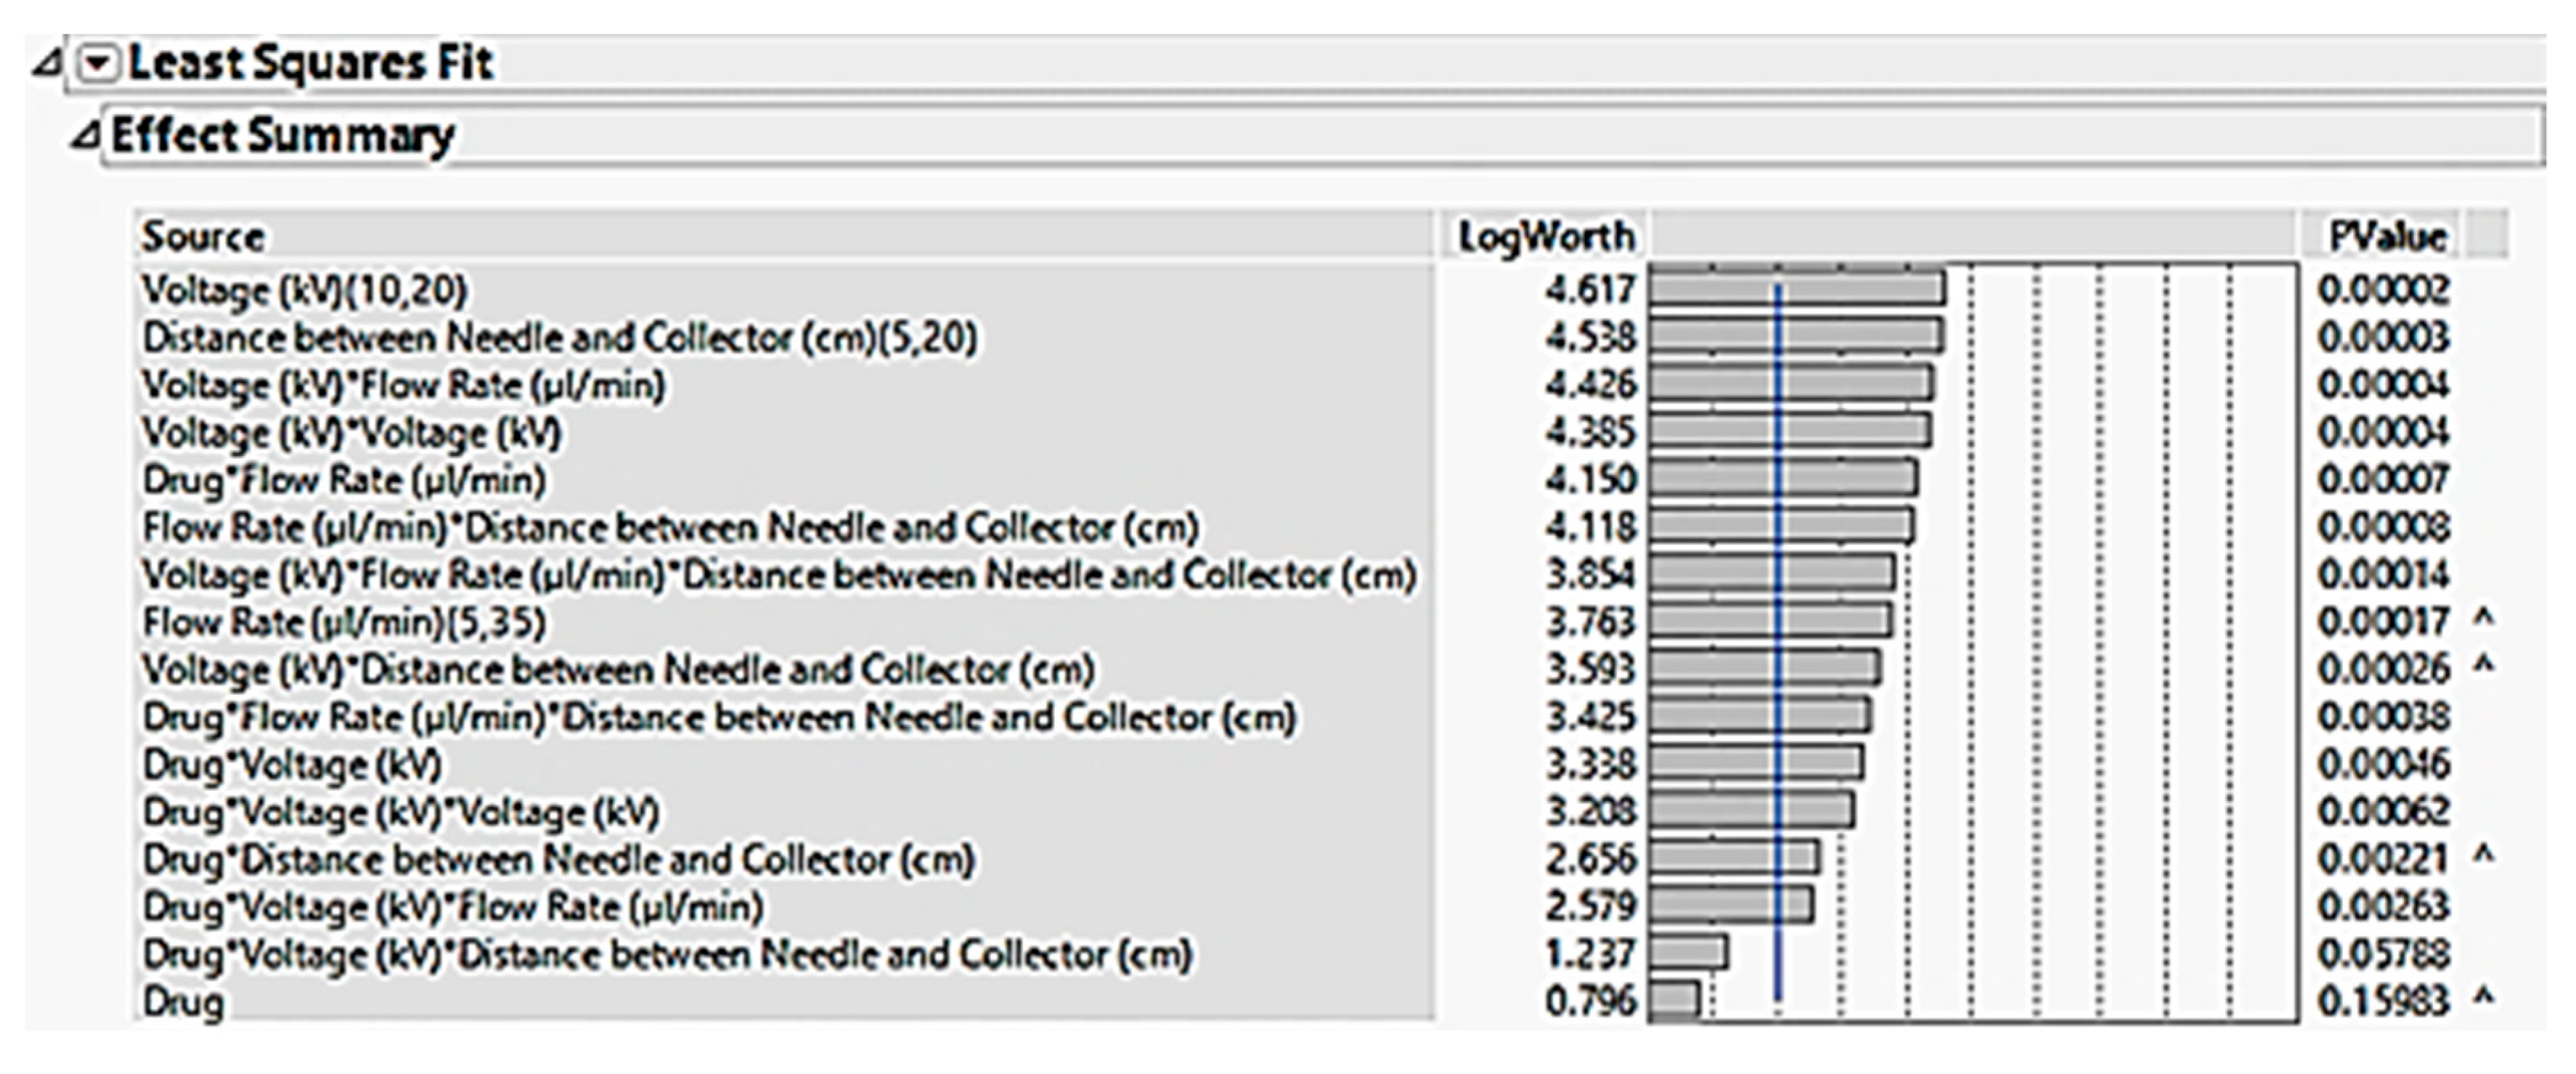
3.2.10. Statistical Multivariate Analysis
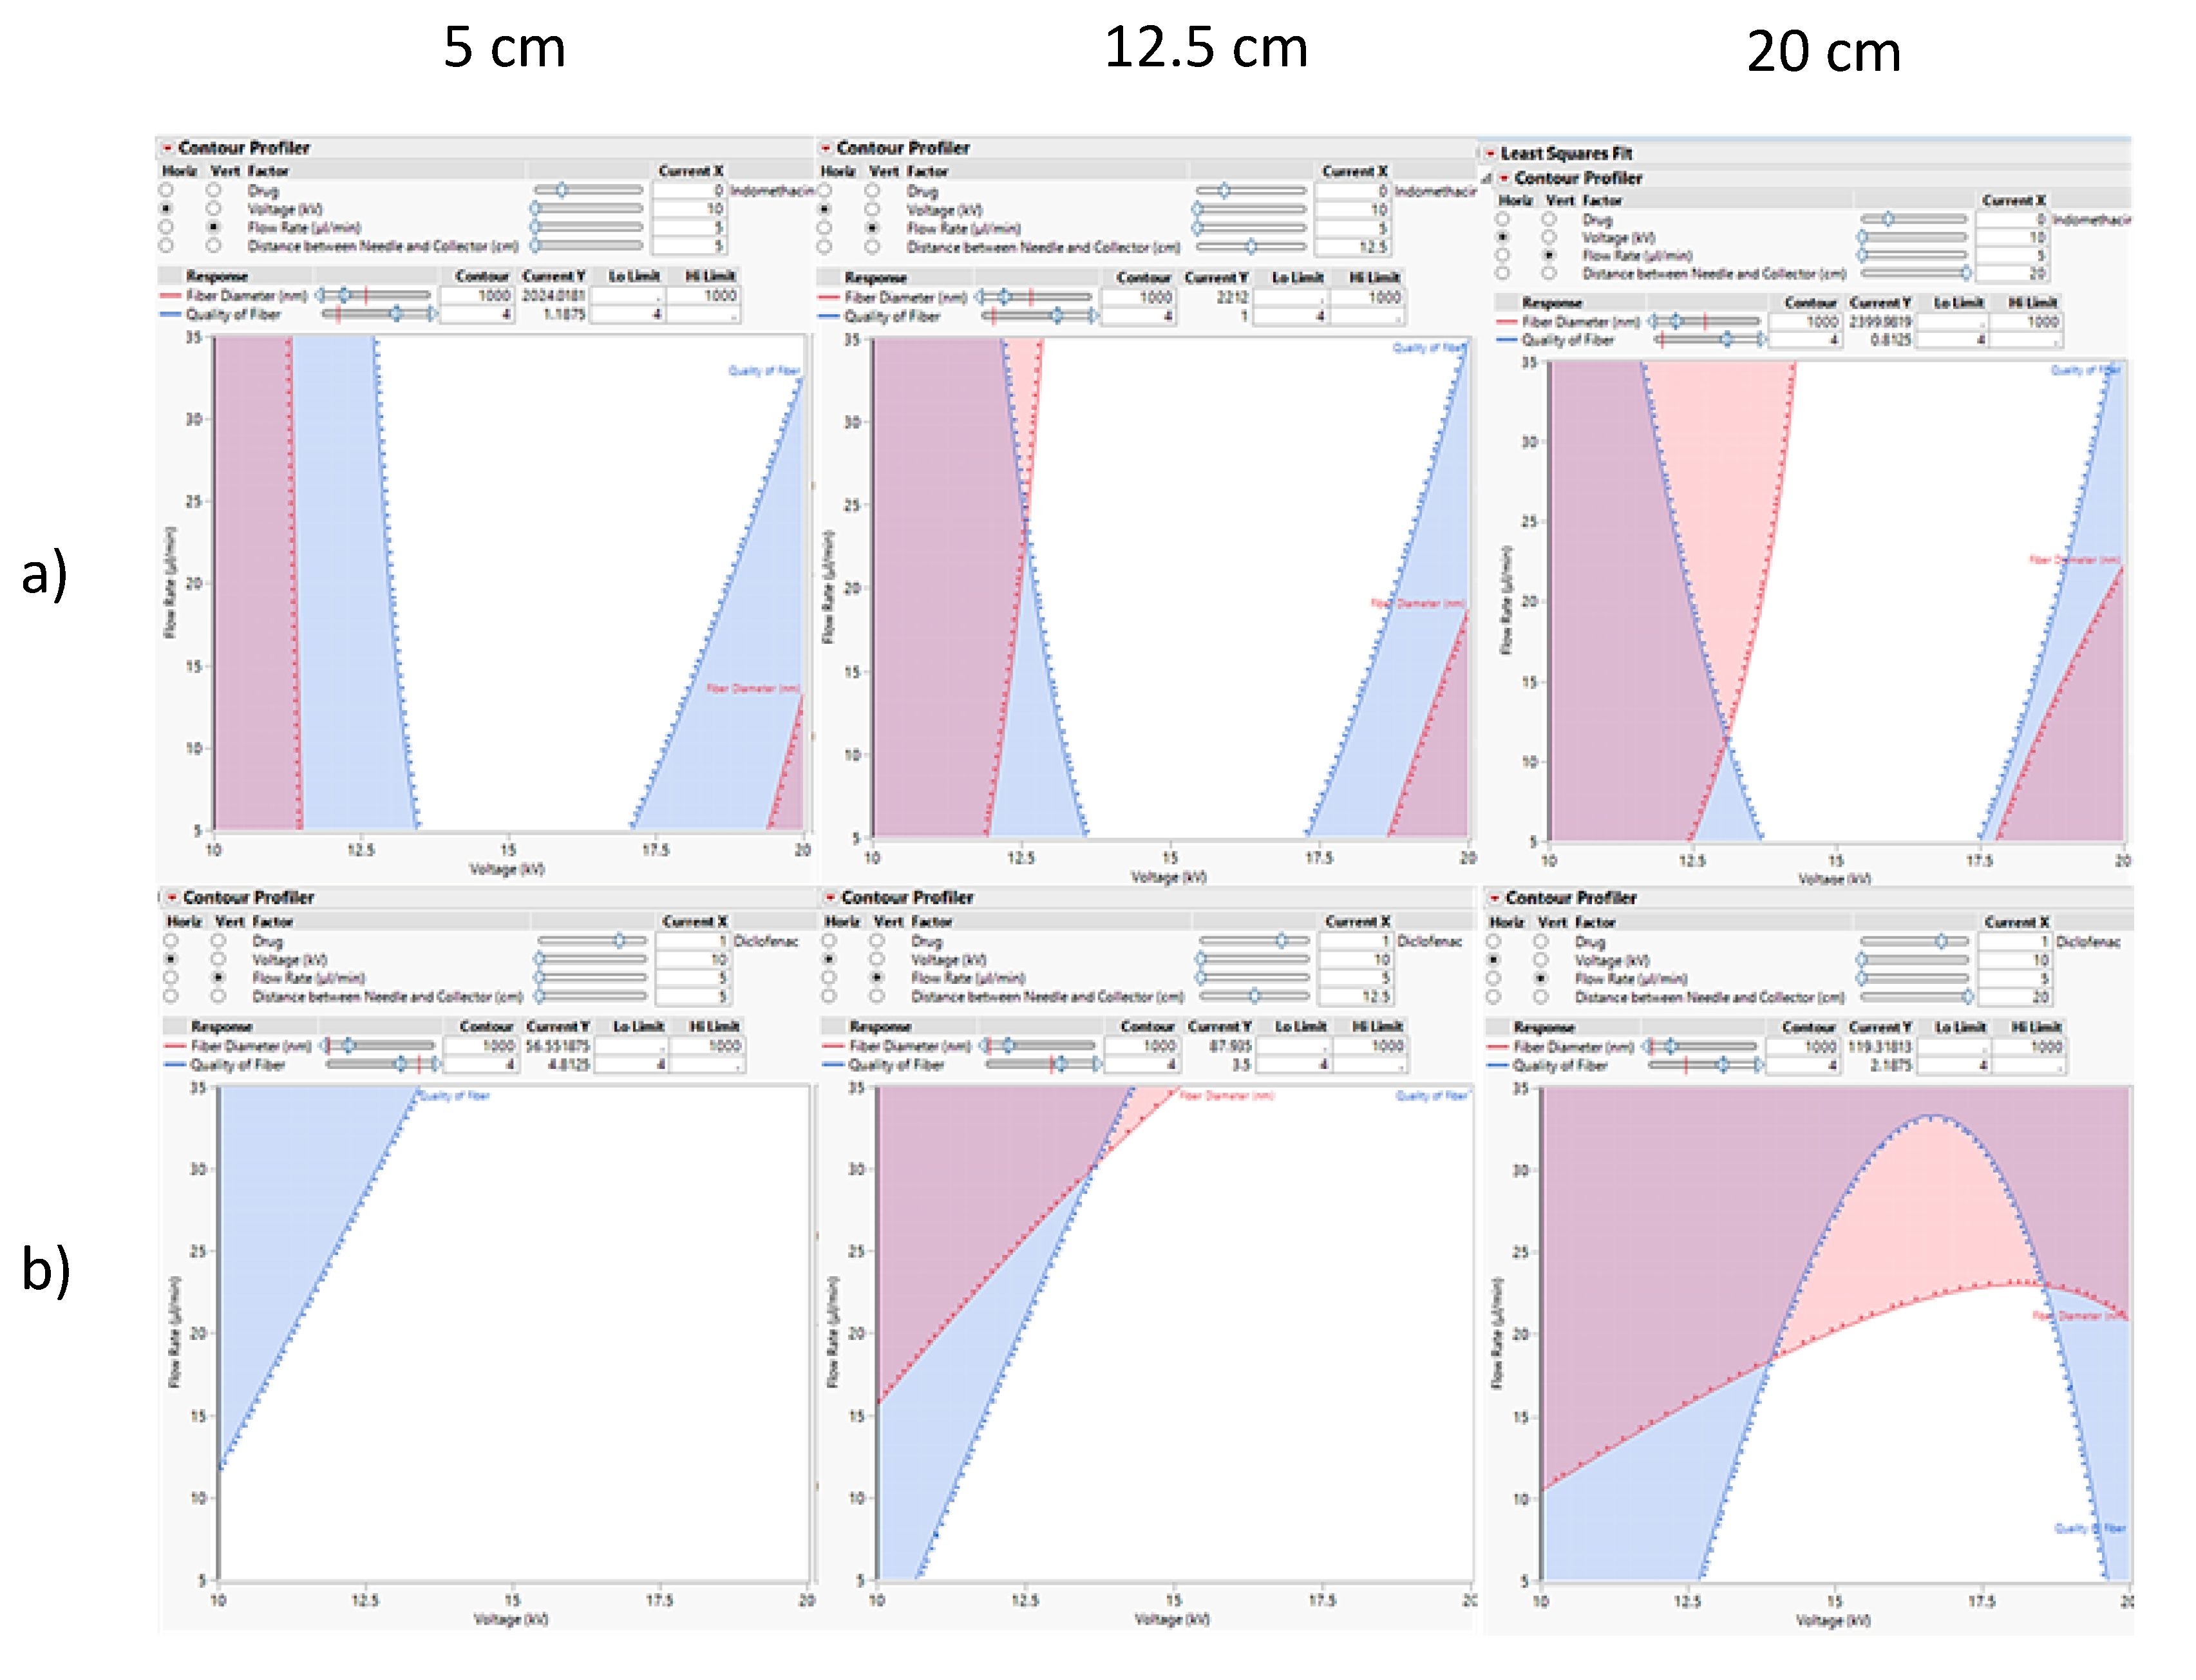
3.3. Prediction Profilers
3.4. The Design Space
4. Conclusions
Supplementary Materials
Author Contributions
Funding
Conflicts of Interest
References
- Hemamalini, Τ.; Giri Dev, V. Comprehensive review on electrospinning of starch polymer for biomedical applications. Int. J. Biol. Macromol. 2018, 106, 712–718. [Google Scholar] [CrossRef] [PubMed]
- Ramakrishna, S.; Fujihara, K.; Teo, W.; Yong, T.; Ma, Z.; Ramaseshan, R. Electrospun nanofibres: Solving global issues. Mat. Today. 2006, 9, 40–50. [Google Scholar] [CrossRef]
- Mehta, P.; Zaman, A.; Smith, A.; Rasekh, M.; Haj-Ahmad, R.; Arshad, M.S.; van der Merwe, S.; Chang, M.W.; Ahmad, Z. Broad scale and structure fabrication of healthcare materials for drug and emerging therapies via electrohydrodynamic techniques. Adv. Therap. 2019, 2, 1800024. [Google Scholar] [CrossRef] [Green Version]
- Ahmad, Z.; Nangrego, M.; Edirisinghe, M.; Stride, E.; Colombo, P.; Zhang, H.B. Engineering a material for biomedical applications with electric field assisted processing. App. Phys. A 2009, 97, 31–37. [Google Scholar] [CrossRef]
- Rasekh, M.; Ahmad, Z.; Cross, R.; Hernández-Gil, J.; Wilton-Ely, J.D.E.T.; Miller, P.W. Facile preparation of drug-loaded tristearin encapsulated superparamagnetic iron oxide nanoparticles using coaxial electrospray processing. Mol. Pharm. 2017, 14, 2010–2023. [Google Scholar] [CrossRef] [Green Version]
- Lian, H.; Meng, Z. Melt electrospinning vs. solution electrospinning: A comparative study of drug-loaded poly (ε-caprolactone) fibres. Mater. Sci. Eng. C Mater. Biol. Appl. 2017, 74, 117–123. [Google Scholar] [CrossRef]
- Hu, X.; Liu, S.; Zhou, G.; Huang, Y.; Xie, Z.; Jing, X. Electrospinning of polymeric nanofibres for drug delivery applications. J. Control. Release 2014, 185, 12–21. [Google Scholar] [CrossRef]
- Wen, P.; Zong, M.; Linhardt, R.; Feng, K.; Wu, H. Electrospinning: A novel nano-encapsulation approach for bioactive compounds. Trends Food Sci. Tech. 2017, 70, 56–68. [Google Scholar] [CrossRef]
- Khalf, A.; Madihally, S. Recent advances in multiaxial electrospinning for drug delivery. Eur. J. Pharm. Biopharm. 2017, 112, 1–17. [Google Scholar] [CrossRef]
- Li, H.; Liu, K.; Sang, Q.; Williams, G.; Wu, J.; Wang, H.; Wu, H.J.; Zhu, L. A thermosensitive drug delivery system prepared by blend electrospinning. Colloids Surf. B Biointerfaces 2017, 159, 277–283. [Google Scholar] [CrossRef] [Green Version]
- Balogh, A.; Cselkó, R.; Démuth, B.; Verreck, G.; Mensch, J.; Marosi, G.; Nagy, G.Z. Alternating current electrospinning for preparation of fibrous drug delivery systems. Int. J. Pharm. 2015, 495, 75–80. [Google Scholar] [CrossRef] [PubMed]
- Chen, S.; Li, R.; Li, X.; Xie, J. Electrospinning: An enabling nanotechnology platform for drug delivery and regenerative medicine. Adv. Drug Deliv. Rev. 2018, 132, 188–213. [Google Scholar] [CrossRef] [PubMed]
- Liang, D.; Hsiao, B.; Chu, B. Functional electrospun nanofibrous scaffolds for biomedical applications. Adv. Drug Deliv. Rev. 2007, 59, 1392–1412. [Google Scholar] [CrossRef] [PubMed] [Green Version]
- Sui, T.; Ying, S.; Titov, K.; Dolbnya, I.; Tan, I.J.; Korsunsky, A. Operando observation of the Taylor cone during electrospinning by multiple synchrotron X-ray techniques. Mater. Des. 2016, 110, 933–934. [Google Scholar] [CrossRef]
- Zeng, J.; Xu, X.; Chen, X.; Liang, Q.; Bian, X.; Yang, L.; Jing, X. Biodegradable electrospun fibres for drug delivery. J. Control Release 2003, 92, 227–231. [Google Scholar] [CrossRef]
- Reneker, D.; Yarin, A. Electrospinning jets and polymer nanofibres. Polymer 2008, 49, 2387–2425. [Google Scholar] [CrossRef] [Green Version]
- Haas, J.; Franklin, A.; Houser, M.; Maraldo, D.; Mikola, M.; Ortiz, R.; Sullivan, E.; Otero, J. Implementation of QbD for the development of a vaccine candidate. Vaccine 2014, 32, 2927–2930. [Google Scholar] [CrossRef]
- Rathore, A. Quality by design (QbD)-based process development for purification of a biotherapeutic. Trends Biotechnol. 2016, 34, 358–370. [Google Scholar] [CrossRef]
- Ko, S.; Lee, J.; Kang, C.; Park, J. Granulation development in batch-to-batch and continuous processes from a quality by design perspective. J. Drug Del. Sci. Technol. 2018, 46, 34–45. [Google Scholar] [CrossRef]
- Ohage, E.; Iverson, R.; Krummen, L.; Taticek, R.; Vega, M. QbD implementation and post approval lifecycle management (PALM). Biologicals 2016, 44, 332–340. [Google Scholar] [CrossRef]
- Taepaiboon, P.; Rungsardthong, U.; Supaphol, P. Drug-loaded electrospun mats of poly(vinyl alcohol) fibres and their release characteristics of four model drugs. Nanotechnology 2006, 17, 2317–2329. [Google Scholar] [CrossRef]
- Abdelhakim, H.E.; Coupe, A.; Tuleu, C.; Edirisinghe, M.; Craig, D.Q.M. Electrospinning optimization of Eudragit E PO with and without chlorpheniramine maleate using a design of experiment approach. Mol. Pharm. 2019, 16, 2557–2568. [Google Scholar] [CrossRef] [PubMed] [Green Version]
- Nazari, K.; Kontogiannidou, E.; Haj Ahmad, R.; Andreadis, D.; Rasekh, M.; Bouropoulos, N.; van Der Merwe, S.; Chang, M.; Fatouros, D.G.; Ahmad, Z. Fibrous polymeric buccal film formulation, engineering and bio-interface assessment. Eur. Polym. J. 2017, 97, 147–157. [Google Scholar] [CrossRef] [Green Version]
- Nazari, K.; Kontogiannidou, E.; Ahmad, R.; Gratsani, A.; Rasekh, M.; Arshad, M.; Sunar, B.; Armitage, D.; Bouropoulos, N.; Chang, M.; et al. Development and characterisation of cellulose based electrospun mats for buccal delivery of non-steroidal anti-inflammatory drug (NSAID). Eur. J. Pharm. Sci. 2017, 102, 147–155. [Google Scholar] [CrossRef]


| CQA | Formulation Variables | |||||
|---|---|---|---|---|---|---|
| Active Pharmaceutical Ingredient | Drug Conc. | Polymer Used | Polymer Conc. | Polymer Molecular Weight | Solvents Used | |
| Fibre Diameter | ||||||
| Fibre Quality | ||||||
| CQA | Formulation Variables | |||||
|---|---|---|---|---|---|---|
| API (Testing) | Drug Conc. (WC) | Polymer Used (WC) | Polymer Conc. (WC) | Polymer Molecular Weight (WC) | Solvents Used (WC) | |
| Fibre Diameter | ||||||
| Fibre Quality | ||||||
| CQA | Process Parameters | |||
|---|---|---|---|---|
| Voltage (Testing) | Flow Rate (Testing) | Distance Between Needle (Testing) | Operator | |
| Fibre Diameter | ||||
| Fibre Quality | ||||
| Quality Attribute | Target |
|---|---|
| Product Form | Fibre |
| Fibre Diameter | ≤5 µm to maximise surface area |
| Release Profile | Should be appropriate to supplement final dosage form |
| Fibre Quality | Structure and shape must be consistent throughout fibre, no breakage or droplets present |
| Impurities | Must be low as possible to avoid harm/instability |
| Pharmacokinetics | Must be appropriate |
| Solubility | Should be reasonable |
| Microbiology | Must be low and within limits |
| Stability | Must have consistent stability profile |
| Porosity | High porosity is desirable to maximise surface area and flexibility in pore size and shape |
| Surface Tension | Must be appropriate |
| Electroconductivity | Must be appropriate |
| Density | Must be appropriate |
© 2019 by the authors. Licensee MDPI, Basel, Switzerland. This article is an open access article distributed under the terms and conditions of the Creative Commons Attribution (CC BY) license (http://creativecommons.org/licenses/by/4.0/).
Share and Cite
Nazari, K.; Mehta, P.; Arshad, M.S.; Ahmed, S.; Andriotis, E.G.; Singh, N.; Qutachi, O.; Chang, M.-W.; Fatouros, D.G.; Ahmad, Z. Quality by Design Micro-Engineering Optimisation of NSAID-Loaded Electrospun Fibrous Patches. Pharmaceutics 2020, 12, 2. https://doi.org/10.3390/pharmaceutics12010002
Nazari K, Mehta P, Arshad MS, Ahmed S, Andriotis EG, Singh N, Qutachi O, Chang M-W, Fatouros DG, Ahmad Z. Quality by Design Micro-Engineering Optimisation of NSAID-Loaded Electrospun Fibrous Patches. Pharmaceutics. 2020; 12(1):2. https://doi.org/10.3390/pharmaceutics12010002
Chicago/Turabian StyleNazari, Kazem, Prina Mehta, Muhammad Sohail Arshad, Shahabuddin Ahmed, Eleftherios G. Andriotis, Neenu Singh, Omar Qutachi, Ming-Wei Chang, Dimitrios G. Fatouros, and Zeeshan Ahmad. 2020. "Quality by Design Micro-Engineering Optimisation of NSAID-Loaded Electrospun Fibrous Patches" Pharmaceutics 12, no. 1: 2. https://doi.org/10.3390/pharmaceutics12010002