Concepts and Controversies in Evaluating Vitamin K Status in Population-Based Studies

Abstract
:1. Introduction
2. Vitamin K Intakes


| Population | Region/Cohort | Vitamin K Form and Reported Intakes | Outcome | Results | References |
|---|---|---|---|---|---|
| 1836 men and 2971 women, >55 years | Rotterdam, The Netherlands (Rotterdam Study) | PK: 257 ± 116 μg/day (men); 244 μg/day (women); MK (total): 31 ± 19 μg/day (men); 33 ± 16 μg/day (women) | CHD | Highest MK tertile had lower CHD risk; PK intake not associated with CHD | [9] |
| 807 army personnel, 39–45 years, 82% male | United States | PK: 115 ± 79 μg/day | CAC | No association | [19] |
| 564 post-menopausal women | Utrecht, The Netherlands (PROSPECT-EPIC) | PK: 217 ± 92 μg/day; MK: 32 ± 12 μg/day | CAC | Highest MK quartile (34 ± 3 μg/day) had lower prevalence CAC; PK intake not associated with CAC prevalence | [15] |
| 16,057 post-menopausal women | Utrecht, The Netherlands (PROSPECT-EPIC) | PK: 212 ± 100 μg/day; MK: 29 ± 13 μg/day | CHD | Higher MK intake associated with lower CHD risk; PK intake not associated with CHD | [17] |
| 72,874 women, 38–65 years | United States (Nurse’s Health Study) | PK: 184 ± 106 μg/day | CHD | PK intake not associated with CHD once adjusted for healthy lifestyle characteristics | [20] |
| 40,087 men, 40–75 years | United States (Physicians Health Study) | PK: 165 (67–383) μg/day (median, 5%–95%ile) | CHD | PK intake not associated with CHD once adjusted for healthy lifestyle characteristics | [8] |
| 1112 men and 1479 women, 58 ± 9 years | Framingham, MA, United States (Framingham Offspring) | PK: 153 ± 115 μg/day (men); 171 ± 103 μg/day (women) | BMD | Higher PK intake associated with higher BMD in women, but not in men | [21] |
| 898 women, 45–54 years | Scotland | PK: 109 ± 54 μg/day | BMD | Higher PK intake associated with higher BMD and less bone resorption | [22] |
| 335 men and 553 women, 75 ± 5 years | Framingham, MA, United States (Framingham Heart Study) | PK: 143 ± 97 μg/day (men); 163 ± 115 μg/day (women) | BMD and hip fracture | Higher PK intake associated with lower fracture risk; not associated with BMD | [16] |
| 72,327 women aged 38–63 years | United States (Nurse’s Health Study) | PK: 169 (41–604) μg/day (median, 1%–99%ile) | Hip fracture | Higher quintiles PK intake (≥109 μg/day) associated with lower hip fracture risk (RR: 0.70; 95% CI: 0.53, 0.93) | [23] |
| 1605 men, 1339 women | Hong Kong | PK: 254 (157–362) μg/day (median (range), men); 239 (162–408) μg/day (median (range), women) | Hip and non-vertebral fracture | PK intake not associated with any fracture outcome | [24] |
| 1800 women, peri-menopausal, 43–58 years | Denmark (Danish Osteoporosis Prevention Study) | PK: baseline: 67 (45–105) μg/day (median, 25%–75%iles); 5 year followup: 60 (37–99) μg/day (median, 25%–75%iles | BMD and fracture | PK intake not associated with BMD or fracture | [25] |
| 1238 men, 1569 women, 71–75 years | Norway (Hordaland) | PK: 69 (67) μg/day (median (IQR), women); 75(62) μg/day (men); MK: 10 (7) μg/day (women); 12 (8) μg/day (men) | Hip fracture | Higher PK intake associated with lower fracture risk; no association between MK intake and fracture | [26] |
| 625 men and women, 40–80 years | The Netherlands (PROSPECT-EPIC) | PK: 210 ± 127 μg/day; MK: 31 ± 13 μg/day | Metabolic Syndrome | Higher MK intake associated with lower prevalence MetSyn; PK intake not associated with MetSyn | [27] |
| 510 men and women, diabetic and/or at risk for CHD, 67 ± 6 years | Spain (PREDIMED) | PK: 398 ± 201 μg/day | Insulin resistance and inflammation | Higher PK intake associated with improvements in IR and inflammation | [28] |
| 662 men and women, 62 ± 10 years | United States (MESA) | PK: 93 ± 107 μg/day | Inflammation | No association between PK intake and inflammation | [29] |
| 1247 men and 1472 women, 26–81 years | Framingham, MA, United States (Framingham Offspring) | PK: 139 (10 to 1975) μg/day (median (range)) | Insulin resistance, sensitivity, glycemic status | Higher PK intake associated with better insulin sensitivity and glucose tolerance | [30] |
| 11,319 men 40–64 years | Europe (EPIC-Heidelberg) | PK: 94 (71–124) μg/day (median (25%–75%ile); MK4-14: 35 (25–76) μg/day (median (25%–75%ile) | Prostate cancer | MK intake inversely associated with prostate cancer (p-trend = 0.06) and advanced prostate cancer (p-trend = 0.02) | [18] |
| 24,340 men and women, 40–64 years | Europe (EPIC-Heidelberg) | PK 35 μg/day (median, men); MK 35 μg/day (median, men); PK 32 μg/day (median, women); MK 32 μg/day (median, women) | Cancer—lung, colorectal, breast, prostate | MK intake inversely associated with cancer incidence in men and mortality in men and women | [31] |
| 7216 men and women, diabetic and/or at risk for CHD, 67 ± 6 years | Spain (PREDIMED) | PK: mean 356 μg/day; MK: mean 36 μg/day | Cardiovascular, cancer, all-cause mortality | Higher PK intake associated with lower cancer and all-cause mortality; MK intake not associated with mortality | [32] |

3. Vitamin K Status Biomarkers
3.1. Circulating Vitamin K
| Participants | Region | Phylloquinone | Menaquinone | Fasted | References |
|---|---|---|---|---|---|
| Post-menopausal women: generally healthy, 52–93 years (n = 23) | Japan | 0.22 ± 0.32 nM d | MK4: 0.02 ± 0.001 nM d; MK7: 0.54 ± 1.00 nM d | not specified | [57] |
| with hip or vertebral fracture history, 66–93 years (n = 51) | Japan | 0.21 ± 0.18 nM d | MK4: non-detectable d; MK7: 0.66 ± 1.00 nM d | not specified | |
| Pre-menopausal women generally healthy, 30–49 years (n = 52) | Nagano, Japan | 0.68 ± 0.45 nM d | MK4: 0.03 ± 0.06 nM d; MK7: 2.23 ± 3.12 nM d | yes | [58] |
| Post-menopausal women generally healthy, 50–80 years (n = 344) | 0.70 ± 0.53 nM d | MK4: 0.05 ± 0.08 nM d; MK7: 3.04 ± 4.32 nM d | yes | ||
| Post-menopausal women: normal BMD, 54 ± 0.8 years (n = 52) | Osaka, Japan | 0.29 ± 0.03 nM d | MK7: 2.44 ± 0.15 nM d | yes | [59] |
| low BMD, 55 ± 1.3 years, (n = 19) | 0.18 ± 0.02 nM d | MK7 1.67 ± 0.07 nM d | yes | ||
| Post-menopausal women | Tokyo, Japan (n = 49; 50–84 years) | 0.33 ± 0.21 nM d | MK7: 2.37 ± 2.75 nM d | yes | [51] |
| Hiroshima, Japan (n = 25; 51–66 years) | 0.33 ± 0.26 nM d | MK7: 0.55 ± 0.83 nM d | yes | ||
| London & Nottingham, United Kingdom (n = 31; 48–84 years) | 0.23 ± 0.24 nM d | MK7: 0.17 ± 0.09 nM d | yes | ||
| Older men, nursing home residents: normal BMD, 74 ± 10 years (n = 15) | Japan | 0.85 ± 0.73 nM | MK7: 1.44 ± 0.85 nM | [60] | |
| low BMD, 74 ± 11 years (n = 12) | 0.60 ± 0.73 nM | MK7: 0.71 ± 0.35 nM | |||
| Free living older adults: men, ≥65 years (n = 385) | Great Britain | 0.34 (0.06–1.84) nM a | NR | yes | [61] |
| women, ≥65 years (n = 493) | 0.37(0.06–2.06) nM a | NR | |||
| Institution-living older adults; men, ≥65 years (n = 60) | 0.26 (0.06–1.73) nM a | NR | |||
| women, ≥65 years (n = 165) | 0.23 (0.06–0.89) nM a | NR | |||
| Free living older adults: men, 19–64 years (n = 530) | Great Britain | 1.13 (0.20–8.80) nM a | NR | yes | [62] |
| women, 19–64 years (n = 624) | 0.81 (0.02–8.71) nM a | NR | |||
| Free living older adults: men, 65–75 years (n = 86) | Shenyang, China | 1.88 ± 2.19 nM | NR | yes | [63] |
| women, 65–75 years (n = 92) | 2.48 ± 2.88 nM | NR | |||
| men, 60–83 years (n = 67) | Cambridge, United Kingdom | 0.66 ± 0.75 nM | NR | ||
| women, 60–83 years (n = 67) | 0.73 ± 0.84 nM | NR | |||
| Free-living women: Pre-menopausal, 31 ± 11 years (n = 11) | Shenyang, China | 0.28 ± 0.04 nM b,d | NR | yes | [64] |
| Post-menopausal, 68 ± 3 years (n = 23) | 0.45 ± 0.06 nM b,d | NR | |||
| Pre-menopausal, 36 ± 11 years (n = 11) | Cambridge, United Kingdom | 0.14 ± 0.02 nM b,d | NR | ||
| Post-menopausal, 67 ± 7 years (n = 31) | 0.14 ± 0.01 nM b,d | NR | |||
| Pre-menopausal, 37 ± 4 years (n = 11) | Keneba, Gambia | 0.27 ± 0.05 nM b,d | NR | ||
| Post-menopausal, 68 ± 8 years (n = 50) | 0.16 ± 0.02 nM b,d | NR | |||
| Post-menopausal women, 57 ± 5 years (n = 508) | Utrecht, The Netherlands | 18% non-detectable; among detectable: 1.08 ± 1.03 nM | NR | no | [65] |
| Hemodialysis patients, 64 ± 14 years, 63% male (n = 387) | Italy | 0.44 ± 0.44 nM d | MK4: 0.30 ± 0.33 nM d; MK5: 0.45 ± 0.35 nM d; MK6: 0.28 ± 0.45 nM d; MK7: 0.52 ± 0.45 nM d | yes | [66] |
| Healthy Controls, 57 ± 4 years, 70% male (n = 62) | 0.61 ± 0.45 nM d | MK4: 0.41 ± 0.38 nM d; MK5: 0.58 ± 0.50 nM d; MK6: 0.50 ± 0.51 nM d; MK7: 0.88 ± 0.62 nM d | |||
| Patients with stage 3–5 CKD, 61 ± 14 years, 61% male (n = 162) | Kingston Ontario, Canada | 2.1 ± 2.4 nM | NR | [67] | |
| Patients with ESKD, 64 ± 15 years, 66% male (n = 44) | Kingston Ontario, Canada | 1.25 ± 1.17 nM | NR | [68] | |
| Free-living men and women: Men, 59 ± 9 years (n = 741) | Framingham, MA, United States | 1.54 ± 2.00 nM | NR | yes | [69] |
| Premenopausal women, 47 ± 7 years, (n = 170) | 1.05 ± 1.04 nM | ||||
| Postmenopausal women: Current estrogen use, 58 ± 7 years (n = 269) | 1.46 ± 1.25 nM | ||||
| No current estrogen use, 63 ± 8 years (n = 424) | 1.41 ± 1.54 nM | ||||
| Free-living adults: White, 62 ± 10 years, 45% male (n = 262) | 6 communities across United States | 1.3 ± 0.1 nM | NR | yes | [70] |
| African American, 63 ± 10 years, 47% male (n = 180) | 1.5 ± 0.1 nM | ||||
| Hispanic, 60 ± 10 years, 51% male (n = 169) | 1.2 ± 0.1 nM | ||||
| Chinese-American, 62 ± 10 years, 45% male (n = 93) | 2.4 ± 0.2 nM | ||||
| Older free-living adults, 70–79 years, 38% male, 46% black (n = 791) | Memphis TN and Pittsburgh PA, United States | 0.8 ± 0.9 nM c | NR | [71] |


3.2. Undercarboxylated Vitamin K-Dependent Proteins
| Phylloquinone Intake (µg/Day) a,b | Plasma Phylloquinone (nM) a,c | PIVKA (ng/mL) d | %ucOC e | ucOC (ng/mL) e | Total OC (ng/mL) e | (dp)ucMGP (pM) a,f | |
|---|---|---|---|---|---|---|---|
| plasma phylloquinone (nM) a,c | 0.17 (<0.001) h,i | ||||||
| PIVKA (ng/mL) d | −0.05 (0.30) h | −0.17 (<0.001) i | |||||
| %ucOC e | −0.14 (0.003) h | −0.23 (<0.001) i | 0.08 (0.11) | ||||
| ucOC (ng/mL) e | −0.06 (0.19) h | −0.18 (<0.001) i | 0.04 (0.42) | 0.78 (<0.001) | |||
| Total OC (ng/mL) e | 0.02 (0.64) h | −0.08 (0.09) i | −0.02 (0.74) | 0.41 (<0.001) | 0.84 (<0.001) | ||
| (dp)ucMGP (pM) af | −0.14 (<0.001) h | −0.32 (<0.001) | −0.06 (0.24) | 0.26 (<0.001) | 0.22 (<0.001) | 0.08 (0.08) | |
| Total MGP (ng/mL) g | 0.08 (0.10) h | 0.04 (0.46) i | −0.06 (0.24) | −0.10 (0.03) | −0.03 (0.52) | 0.05 (0.29) | 0.29 (<0.001) |
3.3. Urinary Biomarkers
3.4. Interrelatedness of Vitamin K Status Biomarkers
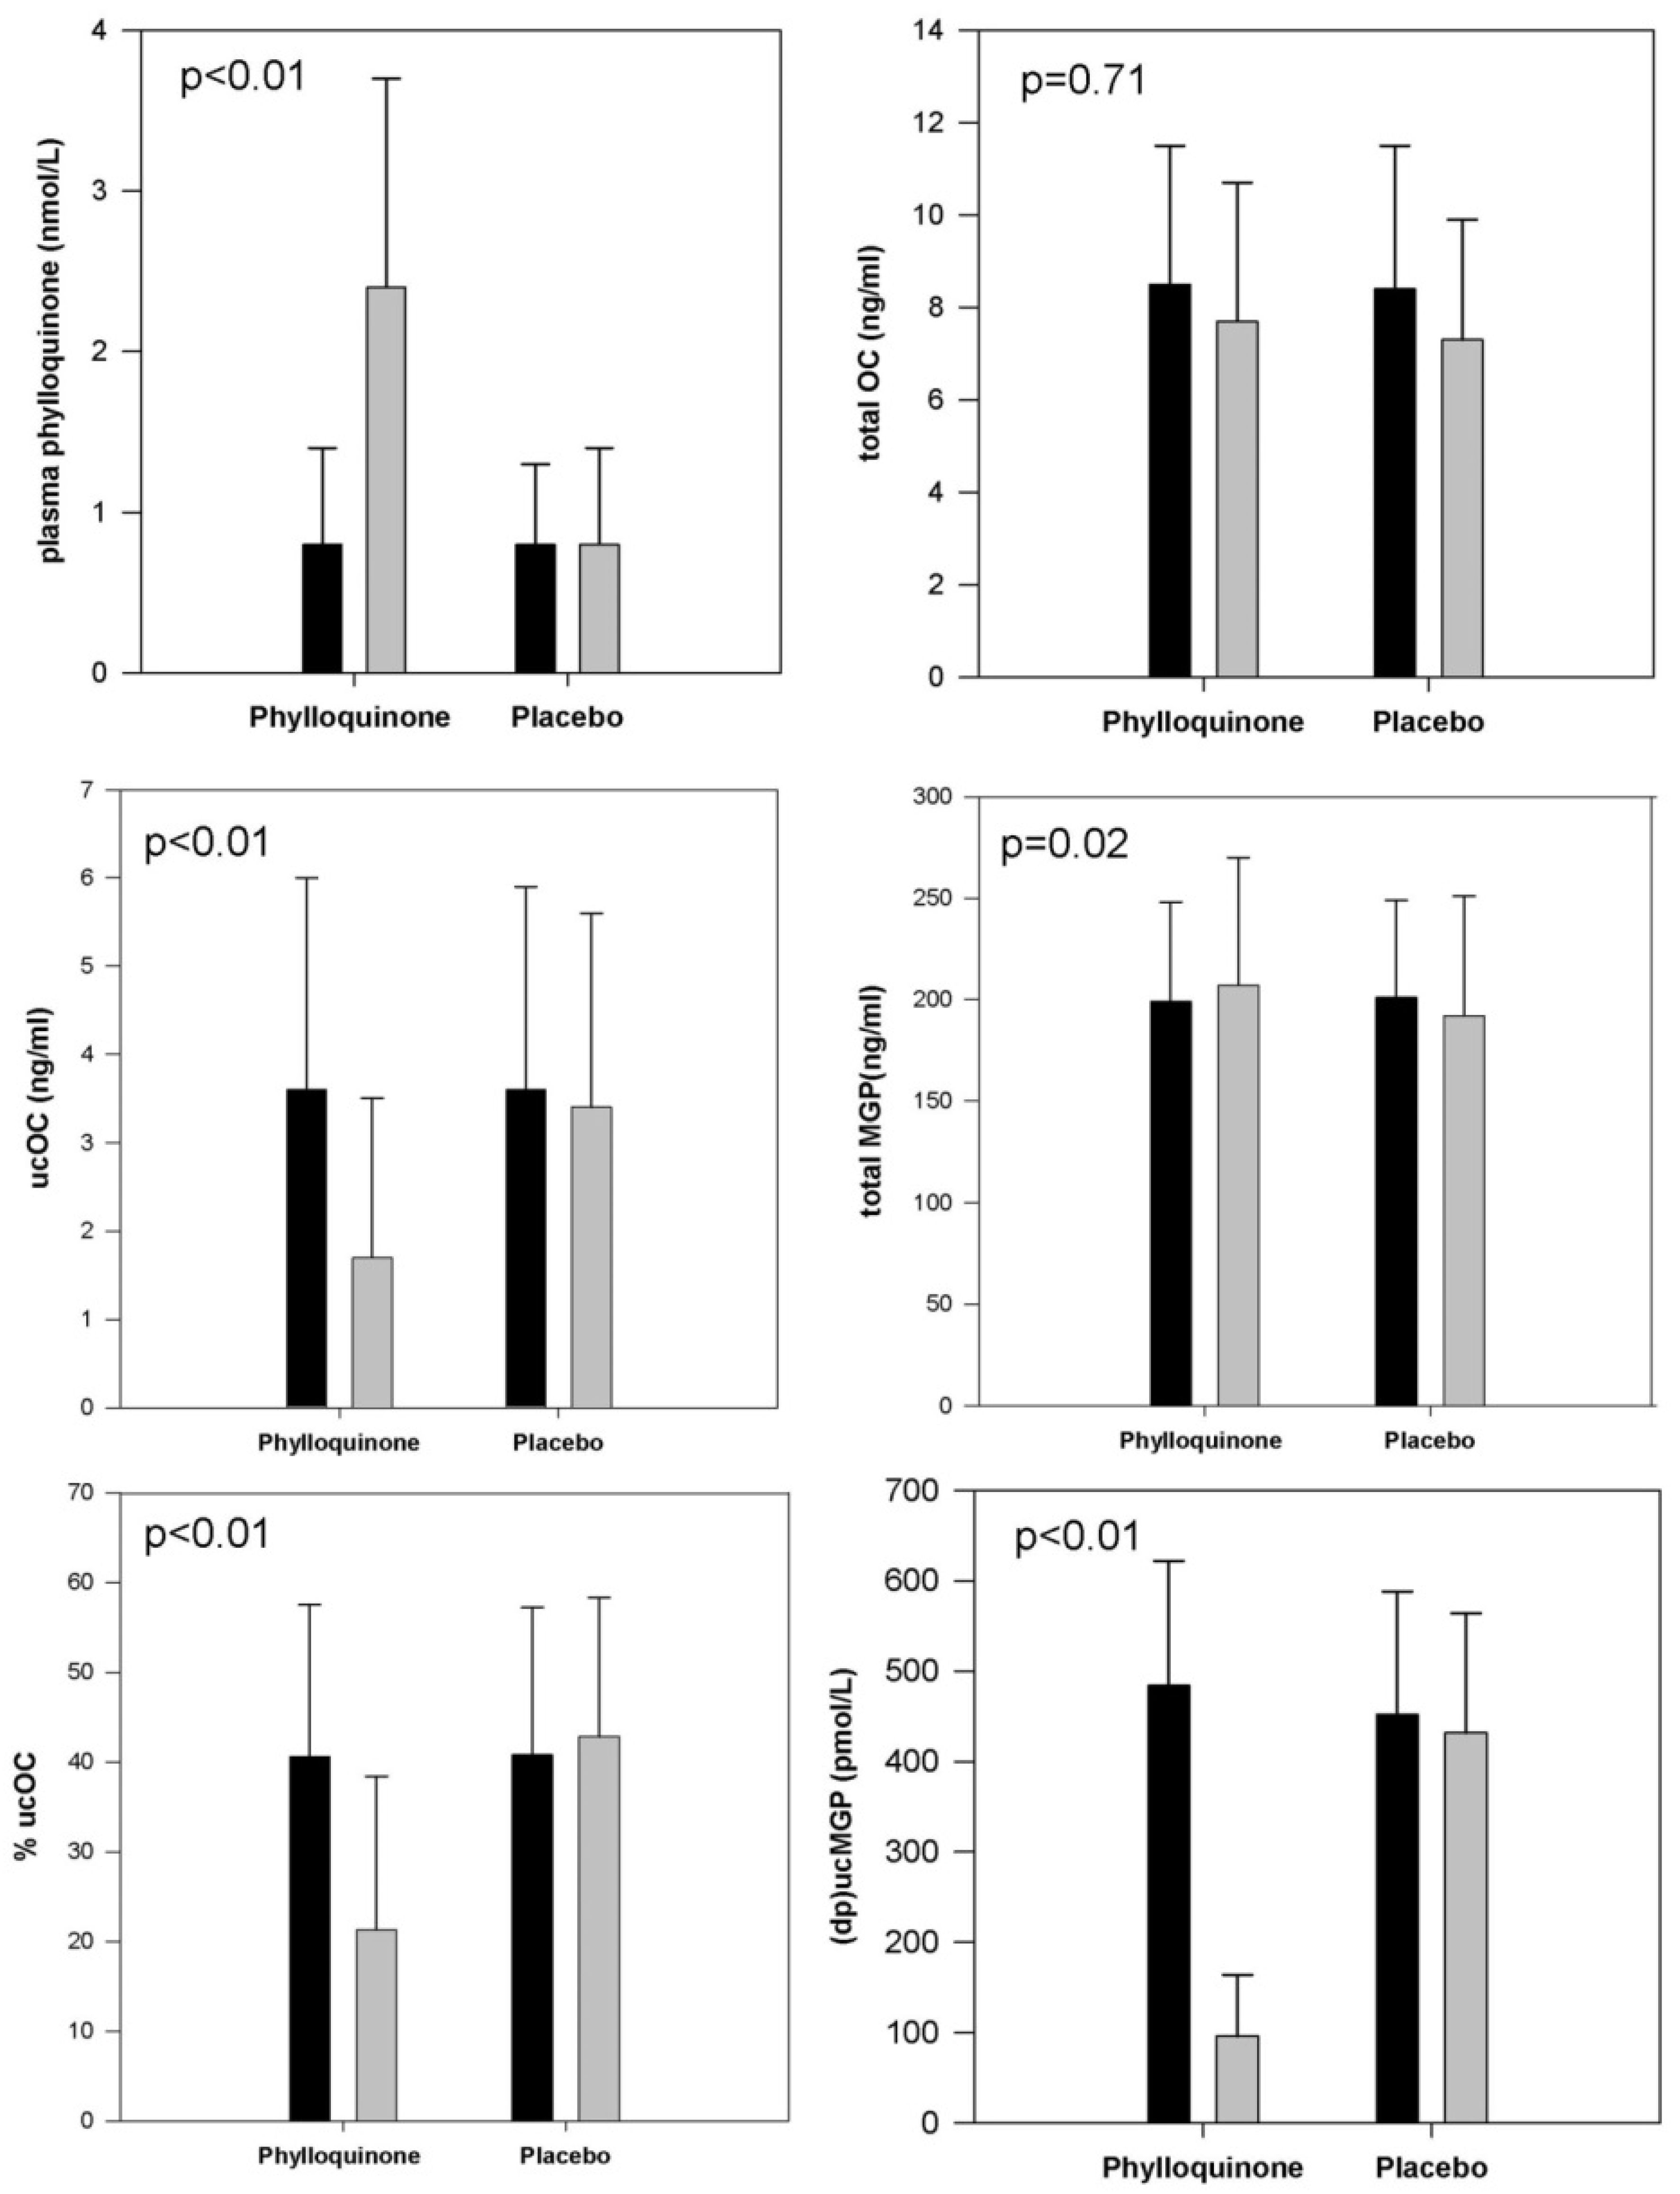
 ) of supplementation with 500 μg/day phylloquinone (n = 229) or placebo (n = 223) in primarily Caucasian community-dwelling men and women 65–80 years old. (Because of skewed distributions, plasma phylloquinone and (dp)ucMgp are presented as median values with error bars representing inter-quartile ranges. Otherwise data are presented as means with error bars representing standard deviations. p-values reflect the between-group difference for change in the biomarker in response to phylloquinone supplementation versus placebo).
) of supplementation with 500 μg/day phylloquinone (n = 229) or placebo (n = 223) in primarily Caucasian community-dwelling men and women 65–80 years old. (Because of skewed distributions, plasma phylloquinone and (dp)ucMgp are presented as median values with error bars representing inter-quartile ranges. Otherwise data are presented as means with error bars representing standard deviations. p-values reflect the between-group difference for change in the biomarker in response to phylloquinone supplementation versus placebo).
) of supplementation with 500 μg/day phylloquinone (n = 229) or placebo (n = 223) in primarily Caucasian community-dwelling men and women 65–80 years old. (Because of skewed distributions, plasma phylloquinone and (dp)ucMgp are presented as median values with error bars representing inter-quartile ranges. Otherwise data are presented as means with error bars representing standard deviations. p-values reflect the between-group difference for change in the biomarker in response to phylloquinone supplementation versus placebo).

4. Conclusions
Supplementary Materials
Acknowledgments
Author Contributions
Conflicts of Interest
Abbreviations
References
- Suttie, J.W. Vitamin K in Health and Disease; CRC Press: Boca Raton, FL, USA, 2009. [Google Scholar]
- McCann, J.C.; Ames, B.N. Vitamin K, an example of triage theory: Is micronutrient inadequacy linked to diseases of aging? Am. J. Clin. Nutr. 2009, 90, 889–907. [Google Scholar] [CrossRef] [PubMed]
- Willett, W.C. Nutritional Epidemiology, 3rd ed.; Oxford University Press: Oxford, UK, 2013. [Google Scholar]
- Food and Nutrition Board, Insititue of Medicne. Dietary Reference Intakes for Vitamin A, Vitamin K, Arsenic, Boron, Chromium, Copper, Iodine, Iron, Manganese, Molybdenum, Nickel, Silicon, Vanadium, and Zinc; National Academy Press: Washington, DC, USA, 2002. [Google Scholar]
- Shearer, M.J.; Fu, X.; Booth, S.L. Vitamin K nutrition, metabolism, and requirements: Current concepts and future research. Adv. Nutr. 2012, 3, 182–195. [Google Scholar] [CrossRef] [PubMed]
- Booth, S.L.; Pennington, J.A.; Sadowski, J.A. Food sources and dietary intakes of vitamin K-1 (phylloquinone) in the American diet: Data from the FDA Total Diet Study. J. Am. Diet. Assoc. 1996, 96, 149–154. [Google Scholar] [CrossRef]
- Duggan, P.; Cashman, K.D.; Flynn, A.; Bolton-Smith, C.; Kiely, M. Phylloquinone (vitamin K1) intakes and food sources in 18–64-year-old Irish adults. Br. J. Nutr. 2004, 92, 151–158. [Google Scholar] [CrossRef] [PubMed]
- Erkkila, A.T.; Booth, S.L.; Hu, F.B.; Jacques, P.F.; Lichtenstein, A.H. Phylloquinone intake and risk of cardiovascular diseases in men. Nutr. Metab. Cardiovasc. Dis. 2007, 17, 58–62. [Google Scholar] [CrossRef] [PubMed]
- Geleijnse, J.M.; Vermeer, C.; Grobbee, D.E.; Schurgers, L.J.; Knapen, M.H.; van der Meer, I.M.; Hofman, A.; Witteman, J.C. Dietary intake of menaquinone is associated with a reduced risk of coronary heart disease: The Rotterdam Study. J. Nutr. 2004, 134, 3100–3105. [Google Scholar] [PubMed]
- Thane, C.W.; Bolton-Smith, C.; Coward, W.A. Comparative dietary intake and sources of phylloquinone (vitamin K1) among British adults in 1986–1987 and 2000–2001. Br. J. Nutr. 2006, 96, 1105–1115. [Google Scholar] [CrossRef] [PubMed]
- Beulens, J.W.; Booth, S.L.; van den Heuvel, E.G.; Stoecklin, E.; Baka, A.; Vermeer, C. The role of menaquinones (vitamin K2) in human health. Br. J. Nutr. 2013, 110, 1357–1368. [Google Scholar] [CrossRef] [PubMed]
- Tucker, K.L.; Smith, C.E.; Lai, C.Q.; Ordovas, J.M. Quantifying diet for nutrigenomic studies. Annu. Rev. Nutr. 2013, 33, 349–371. [Google Scholar] [CrossRef] [PubMed]
- Barrett-Connor, E. Nutrition epidemiology: How do we know what they ate? Am. J. Clin. Nutr. 1991, 54 (Suppl. S1), 182S–187S. [Google Scholar] [CrossRef]
- Westerterp, K.R.; Goris, A.H. Validity of the assessment of dietary intake: Problems of misreporting. Curr. Opin. Clin. Nutr. Metab. Care 2002, 5, 489–493. [Google Scholar] [CrossRef] [PubMed]
- Beulens, J.W.; Bots, M.L.; Atsma, F.; Bartelink, M.L.; Prokop, M.; Geleijnse, J.M.; Witteman, J.C.; Grobbee, D.E.; van der Schouw, Y.T. High dietary menaquinone intake is associated with reduced coronary calcification. Atherosclerosis 2009, 203, 489–493. [Google Scholar] [CrossRef] [PubMed]
- Booth, S.L.; Tucker, K.L.; Chen, H.; Hannan, M.T.; Gagnon, D.R.; Cupples, L.A.; Wilson, P.W.; Ordovas, J.; Schaefer, E.J.; Dawson-Hughes, B.; et al. Dietary vitamin K intakes are associated with hip fracture but not with bone mineral density in elderly men and women. Am. J. Clin. Nutr. 2000, 71, 1201–1208. [Google Scholar] [PubMed]
- Gast, G.C.; de Roos, N.M.; Sluijs, I.; Bots, M.L.; Beulens, J.W.; Geleijnse, J.M.; Witteman, J.C.; Grobbee, D.E.; Peeters, P.H.; van der Schouw, Y.T. A high menaquinone intake reduces the incidence of coronary heart disease. Nutr. Metab. Cardiovasc. Dis. 2009, 19, 504–510. [Google Scholar] [CrossRef] [PubMed]
- Nimptsch, K.; Rohrmann, S.; Linseisen, J. Dietary intake of vitamin K and risk of prostate cancer in the Heidelberg cohort of the European Prospective Investigation into Cancer and Nutrition (EPIC-Heidelberg). Am. J. Clin. Nutr. 2008, 87, 985–992. [Google Scholar] [PubMed]
- Villines, T.C.; Hatzigeorgiou, C.; Feuerstein, I.M.; O’Malley, P.G.; Taylor, A.J. Vitamin K1 intake and coronary calcification. Coron. Artery Dis. 2005, 16, 199–203. [Google Scholar] [CrossRef] [PubMed]
- Erkkila, A.T.; Booth, S.L.; Hu, F.B.; Jacques, P.F.; Manson, J.E.; Rexrode, K.M.; Stampfer, M.J.; Lichtenstein, A.H. Phylloquinone intake as a marker for coronary heart disease risk but not stroke in women. Eur. J. Clin. Nutr. 2005, 59, 196–204. [Google Scholar] [CrossRef] [PubMed]
- Booth, S.L.; Broe, K.E.; Gagnon, D.R.; Tucker, K.L.; Hannan, M.T.; McLean, R.R.; Dawson-Hughes, B.; Wilson, P.W.; Cupples, L.A.; Kiel, D.P. Vitamin K intake and bone mineral density in women and men. Am. J. Clin. Nutr. 2003, 77, 512–516. [Google Scholar] [PubMed]
- Macdonald, H.M.; McGuigan, F.E.; Lanham-New, S.A.; Fraser, W.D.; Ralston, S.H.; Reid, D.M. Vitamin K1 intake is associated with higher bone mineral density and reduced bone resorption in early postmenopausal Scottish women: No evidence of gene-nutrient interaction with apolipoprotein E polymorphisms. Am. J. Clin. Nutr. 2008, 87, 1513–1520. [Google Scholar] [PubMed]
- Feskanich, D.; Weber, P.; Willett, W.C.; Rockett, H.; Booth, S.L.; Colditz, G.A. Vitamin K intake and hip fractures in women: A prospective study. Am. J. Clin. Nutr. 1999, 69, 74–79. [Google Scholar] [PubMed]
- Chan, R.; Leung, J.; Woo, J. No association between dietary vitamin K intake and fracture risk in chinese community-dwelling older men and women: A prospective study. Calcif. Tissue Int. 2012, 90, 396–403. [Google Scholar] [CrossRef] [PubMed]
- Rejnmark, L.; Vestergaard, P.; Charles, P.; Hermann, A.P.; Brot, C.; Eiken, P.; Mosekilde, L. No effect of vitamin K1 intake on bone mineral density and fracture risk in perimenopausal women. Osteoporos. Int. 2006, 17, 1122–1132. [Google Scholar] [CrossRef] [PubMed]
- Apalset, E.M.; Gjesdal, C.G.; Eide, G.E.; Tell, G.S. Intake of vitamin K1 and K2 and risk of hip fractures: The Hordaland Health Study. Bone 2011, 49, 990–995. [Google Scholar] [CrossRef] [PubMed]
- Dam, V.; Dalmeijer, G.W.; Vermeer, C.; Drummen, N.E.; Knapen, M.H.; van der Schouw, Y.T.; Beulens, J.W. The association between vitamin K and the metabolic syndrome: A ten year follow-up study in adults. J. Clin. Endocrinol. Metab. 2015, 100, 2472–2479. [Google Scholar] [CrossRef] [PubMed]
- Juanola-Falgarona, M.; Salas-Salvado, J.; Estruch, R.; Portillo, M.P.; Casas, R.; Miranda, J.; Martinez-Gonzalez, M.A.; Bullo, M. Association between dietary phylloquinone intake and peripheral metabolic risk markers related to insulin resistance and diabetes in elderly subjects at high cardiovascular risk. Cardiovasc. Diabetol. 2013, 12, 58–61. [Google Scholar] [CrossRef] [PubMed]
- Shea, M.K.; Cushman, M.; Booth, S.L.; Burke, G.L.; Chen, H.; Kritchevsky, S.B. Associations between vitamin K status and haemostatic and inflammatory biomarkers in community-dwelling adults. The Multi-Ethnic Study of Atherosclerosis. Thromb. Haemost. 2014, 112, 438–444. [Google Scholar] [CrossRef] [PubMed]
- Yoshida, M.; Booth, S.L.; Meigs, J.B.; Saltzman, E.; Jacques, P.F. Phylloquinone intake, insulin sensitivity, and glycemic status in men and women. Am. J. Clin. Nutr. 2008, 88, 210–215. [Google Scholar] [PubMed]
- Nimptsch, K.; Rohrmann, S.; Kaaks, R.; Linseisen, J. Dietary vitamin K intake in relation to cancer incidence and mortality: Results from the Heidelberg cohort of the European Prospective Investigation into Cancer and Nutrition (EPIC-Heidelberg). Am. J. Clin. Nutr. 2010, 91, 1348–1358. [Google Scholar] [CrossRef] [PubMed]
- Juanola-Falgarona, M.; Salas-Salvado, J.; Martinez-Gonzalez, M.A.; Corella, D.; Estruch, R.; Ros, E.; Fito, M.; Aros, F.; Gomez-Gracia, E.; Fiol, M.; et al. Dietary intake of vitamin K is inversely associated with mortality risk. J. Nutr. 2014, 144, 743–750. [Google Scholar] [CrossRef] [PubMed]
- Cheung, C.L.; Sahni, S.; Cheung, B.M.; Sing, C.W.; Wong, I.C. Vitamin K intake and mortality in people with chronic kidney disease from NHANES III. Clin. Nutr. 2015, 34, 235–240. [Google Scholar] [CrossRef] [PubMed]
- Geisen, C.; Watzka, M.; Sittinger, K.; Steffens, M.; Daugela, L.; Seifried, E.; Muller, C.R.; Wienker, T.F.; Oldenburg, J. VKORC1 haplotypes and their impact on the inter-individual and inter-ethnical variability of oral anticoagulation. Thromb. Haemost. 2005, 94, 773–779. [Google Scholar] [PubMed]
- Braam, L.; McKeown, N.; Jacques, P.; Lichtenstein, A.; Vermeer, C.; Wilson, P.; Booth, S. Dietary phylloquinone intake as a potential marker for a heart-healthy dietary pattern in the Framingham Offspring cohort. J. Am. Diet. Assoc. 2004, 104, 1410–1414. [Google Scholar] [CrossRef] [PubMed]
- Feskanich, D.; Rimm, E.B.; Giovannucci, E.L.; Colditz, G.A.; Stampfer, M.J.; Litin, L.B.; Willett, W.C. Reproducibility and validity of food intake measurements from a semiquantitative food frequency questionnaire. J. Am. Diet. Assoc. 1993, 93, 790–796. [Google Scholar] [CrossRef]
- Presse, N.; Shatenstein, B.; Kergoat, M.J.; Ferland, G. Validation of a semi-quantitative food frequency questionnaire measuring dietary vitamin K intake in elderly people. J. Am. Diet. Assoc. 2009, 109, 1251–1255. [Google Scholar] [CrossRef] [PubMed]
- McKeown, N.M.; Jacques, P.F.; Gundberg, C.M.; Peterson, J.W.; Tucker, K.L.; Kiel, D.P.; Wilson, P.W.; Booth, S.L. Dietary and nondietary determinants of vitamin K biochemical measures in men and women. J. Nutr. 2002, 132, 1329–1334. [Google Scholar] [PubMed]
- Booth, S.L.; Dallal, G.; Shea, M.K.; Gundberg, C.; Peterson, J.W.; Dawson-Hughes, B. Effect of vitamin K supplementation on bone loss in elderly men and women. J. Clin. Endocrinol. Metab. 2008, 93, 1217–1223. [Google Scholar] [CrossRef] [PubMed]
- Shea, M.K.; O’Donnell, C.J.; Hoffmann, U.; Dallal, G.E.; Dawson-Hughes, B.; Ordovas, J.M.; Price, P.A.; Williamson, M.K.; Booth, S.L. Vitamin K supplementation and progression of coronary artery calcium in older men and women. Am. J. Clin. Nutr. 2009, 89, 1799–1807. [Google Scholar] [CrossRef] [PubMed]
- Cheung, A.M.; Tile, L.; Lee, Y.; Tomlinson, G.; Hawker, G.; Scher, J.; Hu, H.; Vieth, R.; Thompson, L.; Jamal, S.; et al. Vitamin K supplementation in postmenopausal women with osteopenia (ECKO trial): A randomized controlled trial. PLoS Med. 2008, 5, e196. [Google Scholar] [CrossRef] [PubMed]
- Elder, S.J.; Haytowitz, D.B.; Howe, J.; Peterson, J.W.; Booth, S.L. Vitamin K contents of meat, dairy, and fast food in the U.S. Diet. J. Agric. Food. Chem. 2006, 54, 463–467. [Google Scholar] [CrossRef]
- Manoury, E.; Jourdon, K.; Boyaval, P.; Fourcassie, P. Quantitative measurement of vitamin K2 (menaquinones) in various fermented dairy products using a reliable high-performance liquid chromatography method. J. Dairy Sci. 2013, 96, 1335–1346. [Google Scholar] [CrossRef] [PubMed]
- Praagman, J.; Dalmeijer, G.W.; van der Schouw, Y.T.; Soedamah-Muthu, S.S.; Monique Verschuren, W.M.; Bas Bueno-de-Mesquita, H.; Geleijnse, J.M.; Beulens, J.W. The relationship between fermented food intake and mortality risk in the European Prospective Investigation into Cancer and Nutrition-Netherlands cohort. Br. J. Nutr. 2015, 113, 498–506. [Google Scholar] [CrossRef] [PubMed]
- Sluijs, I.; Forouhi, N.G.; Beulens, J.W.; van der Schouw, Y.T.; Agnoli, C.; Arriola, L.; Balkau, B.; Barricarte, A.; Boeing, H.; Bueno-de-Mesquita, H.B.; et al. The amount and type of dairy product intake and incident type 2 diabetes: Results from the EPIC-InterAct Study. Am. J. Clin. Nutr. 2012, 96, 382–390. [Google Scholar] [CrossRef] [PubMed]
- Aune, D.; Norat, T.; Romundstad, P.; Vatten, L.J. Dairy products and the risk of type 2 diabetes: A systematic review and dose-response meta-analysis of cohort studies. Am. J. Clin. Nutr. 2013, 98, 1066–1083. [Google Scholar] [CrossRef] [PubMed]
- Sonestedt, E.; Wirfalt, E.; Wallstrom, P.; Gullberg, B.; Orho-Melander, M.; Hedblad, B. Dairy products and its association with incidence of cardiovascular disease: The Malmo diet and cancer cohort. Eur. J. Epidemiol. 2011, 26, 609–618. [Google Scholar] [CrossRef] [PubMed]
- Farvid, M.S.; Ding, M.; Pan, A.; Sun, Q.; Chiuve, S.E.; Steffen, L.M.; Willett, W.C.; Hu, F.B. Dietary linoleic acid and risk of coronary heart disease: A systematic review and meta-analysis of prospective cohort studies. Circulation 2014, 130, 1568–1578. [Google Scholar] [CrossRef] [PubMed]
- Walther, B.; Karl, J.P.; Booth, S.L.; Boyaval, P. Menaquinones, bacteria, and the food supply: The relevance of dairy and fermented food products to vitamin K requirements. Adv. Nutr. 2013, 4, 463–473. [Google Scholar] [CrossRef] [PubMed]
- Schurgers, L.J.; Vermeer, C. Determination of phylloquinone and menaquinones in food. Effect of food matrix on circulating vitamin K concentrations. Haemostasis 2000, 30, 298–307. [Google Scholar] [PubMed]
- Kaneki, M.; Hodges, S.J.; Hosoi, T.; Fujiwara, S.; Lyons, A.; Crean, S.J.; Ishida, N.; Nakagawa, M.; Takechi, M.; Sano, Y.; et al. Japanese fermented soybean food as the major determinant of the large geographic difference in circulating levels of vitamin K2: Possible implications for hip-fracture risk. Nutrition 2001, 17, 315–321. [Google Scholar] [CrossRef]
- Hjartaker, A.; Lagiou, A.; Slimani, N.; Lund, E.; Chirlaque, M.D.; Vasilopoulou, E.; Zavitsanos, X.; Berrino, F.; Sacerdote, C.; Ocke, M.C.; et al. Consumption of dairy products in the European Prospective Investigation into Cancer and Nutrition (EPIC) cohort: Data from 35,955 24-h dietary recalls in 10 European countries. Public Health Nutr. 2002, 5, 1259–1271. [Google Scholar] [CrossRef] [PubMed]
- Thompson, F.E.; Byers, T. Dietary assessment resource manual. J. Nutr. 1994, 124 (Suppl. S11), 2245S–2317S. [Google Scholar] [PubMed]
- Miller, T.M.; Abdel-Maksoud, M.F.; Crane, L.A.; Marcus, A.C.; Byers, T.E. Effects of social approval bias on self-reported fruit and vegetable consumption: A randomized controlled trial. Nutr. J. 2008, 7, 18588696. [Google Scholar] [CrossRef] [PubMed]
- Potischman, N. Biologic and methodologic issues for nutritional biomarkers. J. Nutr. 2003, 133 (Suppl. S3), 875S–880S. [Google Scholar] [PubMed]
- Blanck, H.M.; Bowman, B.A.; Cooper, G.R.; Myers, G.L.; Miller, D.T. Laboratory issues: Use of nutritional biomarkers. J. Nutr. 2003, 133 (Suppl. S3), 888S–894S. [Google Scholar] [PubMed]
- Kawana, K.; Takahashi, M.; Hoshino, H.; Kushida, K. Circulating levels of vitamin K1, menaquinone-4, and menaquinone-7 in healthy elderly Japanese women and patients with vertebral fractures and patients with hip fractures. Endocr. Res. 2001, 27, 337–343. [Google Scholar] [CrossRef] [PubMed]
- Tsugawa, N.; Shiraki, M.; Suhara, Y.; Kamao, M.; Tanaka, K.; Okano, T. Vitamin K status of healthy Japanese women: Age-related vitamin K requirement for gamma-carboxylation of osteocalcin. Am. J. Clin. Nutr. 2006, 83, 380–386. [Google Scholar] [PubMed]
- Kanai, T.; Takagi, T.; Masuhiro, K.; Nakamura, M.; Iwata, M.; Saji, F. Serum vitamin K level and bone mineral density in post-menopausal women. Int. J. Gynaecol. Obstet. 1997, 56, 25–30. [Google Scholar] [CrossRef]
- Tamatani, M.; Morimoto, S.; Nakajima, M.; Fukuo, K.; Onishi, T.; Kitano, S.; Niinobu, T.; Ogihara, T. Decreased circulating levels of vitamin K and 25-hydroxyvitamin D in osteopenic elderly men. Metabolism 1998, 47, 195–199. [Google Scholar] [CrossRef]
- Thane, C.W.; Bates, C.J.; Shearer, M.J.; Unadkat, N.; Harrington, D.J.; Paul, A.A.; Prentice, A.; Bolton-Smith, C. Plasma phylloquinone (vitamin K1) concentration and its relationship to intake in a national sample of British elderly people. Br. J. Nutr. 2002, 87, 615–622. [Google Scholar] [CrossRef] [PubMed]
- Thane, C.W.; Wang, L.Y.; Coward, W.A. Plasma phylloquinone (vitamin K1) concentration and its relationship to intake in British adults aged 19–64 years. Br. J. Nutr. 2006, 96, 1116–1124. [Google Scholar] [CrossRef] [PubMed]
- Yan, L.; Zhou, B.; Greenberg, D.; Wang, L.; Nigdikar, S.; Prynne, C.; Prentice, A. Vitamin K status of older individuals in northern China is superior to that of older individuals in the UK. Br. J. Nutr. 2004, 92, 939–945. [Google Scholar] [CrossRef] [PubMed]
- Beavan, S.R.; Prentice, A.; Stirling, D.M.; Dibba, B.; Yan, L.; Harrington, D.J.; Shearer, M.J. Ethnic differences in osteocalcin gamma-carboxylation, plasma phylloquinone (vitamin K1) and apolipoprotein E genotype. Eur. J. Clin. Nutr. 2005, 59, 72–81. [Google Scholar] [CrossRef] [PubMed]
- Dalmeijer, G.W.; van der Schouw, Y.T.; Booth, S.L.; de Jong, P.A.; Beulens, J.W. Phylloquinone concentrations and the risk of vascular calcification in healthy women. Arterioscler. Thromb. Vasc. Biol. 2014, 34, 1587–1590. [Google Scholar] [CrossRef] [PubMed]
- Fusaro, M.; Noale, M.; Viola, V.; Galli, F.; Tripepi, G.; Vajente, N.; Plebani, M.; Zaninotto, M.; Guglielmi, G.; Miotto, D.; et al. Vitamin K, vertebral fractures, vascular calcifications, and mortality: VItamin K Italian (VIKI) dialysis study. J. Bone Miner. Res. 2012, 27, 2271–2278. [Google Scholar] [CrossRef] [PubMed]
- Holden, R.M.; Morton, A.R.; Garland, J.S.; Pavlov, A.; Day, A.G.; Booth, S.L. Vitamins K and D status in stages 3–5 chronic kidney disease. Clin. J. Am. Soc. Nephrol. 2010, 5, 590–597. [Google Scholar] [CrossRef] [PubMed]
- Elliott, M.J.; Booth, S.L.; Hopman, W.M.; Holden, R.M. Assessment of potential biomarkers of subclinical vitamin K deficiency in patients with end-stage kidney disease. Can. J. Kidney Health Dis. 2014, 1. [Google Scholar] [CrossRef] [PubMed]
- Booth, S.L.; Broe, K.E.; Peterson, J.W.; Cheng, D.M.; Dawson-Hughes, B.; Gundberg, C.M.; Cupples, L.A.; Wilson, P.W.; Kiel, D.P. Associations between vitamin K biochemical measures and bone mineral density in men and women. J. Clin. Endocrinol. Metab. 2004, 89, 4904–4909. [Google Scholar] [CrossRef] [PubMed]
- Shea, M.K.; Booth, S.L.; Nettleton, J.A.; Burke, G.L.; Chen, H.; Kritchevsky, S.B. Circulating phylloquinone concentrations of adults in the United States differ according to race and ethnicity. J. Nutr. 2012, 142, 1060–1066. [Google Scholar] [CrossRef] [PubMed]
- Shea, M.K.; Kritchevsky, S.B.; Hsu, F.C.; Nevitt, M.; Booth, S.L.; Kwoh, C.K.; McAlindon, T.E.; Vermeer, C.; Drummen, N.; Harris, T.B.; et al. The association between vitamin K status and knee osteoarthritis features in older adults: The Health, Aging and Body Composition Study. Osteoarthr. Cartil. 2015, 23, 370–378. [Google Scholar] [CrossRef] [PubMed]
- Tsugawa, N.; Shiraki, M.; Suhara, Y.; Kamao, M.; Ozaki, R.; Tanaka, K.; Okano, T. Low plasma phylloquinone concentration is associated with high incidence of vertebral fracture in Japanese women. J. Bone Miner. Metab. 2008, 26, 79–85. [Google Scholar] [CrossRef] [PubMed]
- Neogi, T.; Booth, S.L.; Zhang, Y.Q.; Jacques, P.F.; Terkeltaub, R.; Aliabadi, P.; Felson, D.T. Low vitamin K status is associated with osteoarthritis in the hand and knee. Arthritis Rheum. 2006, 54, 1255–1261. [Google Scholar] [CrossRef] [PubMed]
- Misra, D.; Booth, S.L.; Tolstykh, I.; Felson, D.T.; Nevitt, M.C.; Lewis, C.E.; Torner, J.; Neogi, T. Vitamin K deficiency is associated with incident knee osteoarthritis. Am. J. Med. 2013, 126, 243–248. [Google Scholar] [CrossRef] [PubMed]
- Shea, M.K.; Booth, S.L.; Miller, M.E.; Burke, G.L.; Chen, H.; Cushman, M.; Tracy, R.P.; Kritchevsky, S.B. Association between circulating vitamin K1 and coronary calcium progression in community-dwelling adults: The Multi-Ethnic Study of Atherosclerosis. Am. J. Clin. Nutr. 2013, 98, 197–208. [Google Scholar] [CrossRef] [PubMed]
- Card, D.J.; Shearer, M.J.; Schurgers, L.J.; Harrington, D.J. The external quality assurance of phylloquinone (vitamin K(1)) analysis in human serum. Biomed. Chromatogr. 2009, 23, 1276–1282. [Google Scholar] [CrossRef] [PubMed]
- Lamon-Fava, S.; Sadowski, J.A.; Davidson, K.W.; O’Brien, M.E.; McNamara, J.R.; Schaefer, E.J. Plasma lipoproteins as carriers of phylloquinone (vitamin K1) in humans. Am. J. Clin. Nutr. 1998, 67, 1226–1231. [Google Scholar] [PubMed]
- Booth, S.L.; Tucker, K.L.; McKeown, N.M.; Davidson, K.W.; Dallal, G.E.; Sadowski, J.A. Relationships between dietary intakes and fasting plasma concentrations of fat-soluble vitamins in humans. J. Nutr. 1997, 127, 587–592. [Google Scholar] [PubMed]
- Booth, S.L.; O’Brien-Morse, M.E.; Dallal, G.E.; Davidson, K.W.; Gundberg, C.M. Response of vitamin K status to different intakes and sources of phylloquinone-rich foods: Comparison of younger and older adults. Am. J. Clin. Nutr. 1999, 70, 368–377. [Google Scholar] [PubMed]
- Novotny, J.A.; Kurilich, A.C.; Britz, S.J.; Baer, D.J.; Clevidence, B.A. Vitamin K absorption and kinetics in human subjects after consumption of 13C-labelled phylloquinone from kale. Br. J. Nutr. 2010, 104, 858–862. [Google Scholar] [CrossRef] [PubMed]
- Jones, K.S.; Bluck, L.J.; Wang, L.Y.; Stephen, A.M.; Prynne, C.J.; Coward, W.A. The effect of different meals on the absorption of stable isotope-labelled phylloquinone. Br. J. Nutr. 2009, 102, 1195–1202. [Google Scholar] [CrossRef] [PubMed]
- Nordestgaard, B.G.; Varbo, A. Triglycerides and cardiovascular disease. Lancet 2014, 384, 626–635. [Google Scholar] [CrossRef]
- Booth, S.L.; Martini, L.; Peterson, J.W.; Saltzman, E.; Dallal, G.E.; Wood, R.J. Dietary phylloquinone depletion and repletion in older women. J. Nutr. 2003, 133, 2565–2569. [Google Scholar] [PubMed]
- Shea, M.K.; Benjamin, E.J.; Dupuis, J.; Massaro, J.M.; Jacques, P.F.; D’Agostino, R.B., Sr.; Ordovas, J.M.; O’Donnell, C.J.; Dawson-Hughes, B.; et al. Genetic and non-genetic correlates of vitamins K and D. Eur. J. Clin. Nutr. 2009, 63, 458–464. [Google Scholar] [CrossRef] [PubMed]
- Dashti, H.S.; Shea, M.K.; Smith, C.E.; Tanaka, T.; Hruby, A.; Richardson, K.; Wang, T.J.; Nalls, M.A.; Guo, X.; Liu, Y.; et al. Meta-analysis of genome-wide association studies for circulating phylloquinone concentrations. Am. J. Clin. Nutr. 2014, 100, 1462–1469. [Google Scholar] [CrossRef] [PubMed]
- Sato, T.; Schurgers, L.J.; Uenishi, K. Comparison of menaquinone-4 and menaquinone-7 bioavailability in healthy women. Nutr. J. 2012, 11. [Google Scholar] [CrossRef] [PubMed]
- Karl, J.P.; Fu, X.; Dolnikowski, G.G.; Saltzman, E.; Booth, S.L. Quantification of phylloquinone and menaquinones in feces, serum, and food by high-performance liquid chromatography-mass spectrometry. J. Chromatogr. B Anal. Technol. Biomed. Life Sci. 2014, 963, 128–133. [Google Scholar] [CrossRef] [PubMed]
- Booth, S.L.; Al, R.A. Determinants of vitamin K status in humans. Vitam. Horm. 2008, 78, 1–22. [Google Scholar] [PubMed]
- Suttie, J.W. Vitamin K and human nutrition. J. Am. Diet. Assoc. 1992, 92, 585–590. [Google Scholar] [PubMed]
- Limdi, N.A.; Nolin, T.D.; Booth, S.L.; Centi, A.; Marques, M.B.; Crowley, M.R.; Allon, M.; Beasley, T.M. Influence of kidney function on risk of supratherapeutic international normalized ratio-related hemorrhage in warfarin users: A prospective cohort study. Am. J. Kidney Dis. 2015, 65, 701–709. [Google Scholar] [CrossRef] [PubMed]
- Gundberg, C.M.; Nieman, S.D.; Abrams, S.; Rosen, H. Vitamin K status and bone health: An analysis of methods for determination of undercarboxylated osteocalcin. J. Clin. Endocrinol. Metab. 1998, 83, 3258–3266. [Google Scholar] [CrossRef] [PubMed]
- Greenspan, S.L.; Resnick, N.M.; Parker, R.A. Early changes in biochemical markers of bone turnover are associated with long-term changes in bone mineral density in elderly women on alendronate, hormone replacement therapy, or combination therapy: A three-year, double-blind, placebo-controlled, randomized clinical trial. J. Clin. Endocrinol. Metab. 2005, 90, 2762–2767. [Google Scholar] [PubMed]
- Rosen, C.J.; Chesnut, C.H., III; Mallinak, N.J. The predictive value of biochemical markers of bone turnover for bone mineral density in early postmenopausal women treated with hormone replacement or calcium supplementation. J. Clin. Endocrinol. Metab. 1997, 82, 1904–1910. [Google Scholar] [PubMed]
- Rehder, D.S.; Gundberg, C.M.; Booth, S.L.; Borges, C.R. Gamma-carboxylation and fragmentation of osteocalcin in human serum defined by mass spectrometry. Mol. Cell. Proteomics 2015, 14, 1546–1555. [Google Scholar] [CrossRef] [PubMed]
- Price, P.A.; Kaneda, Y. Vitamin K counteracts the effect of warfarin in liver but not in bone. Thromb. Res. 1987, 46, 121–131. [Google Scholar] [CrossRef]
- Hara, K.; Kobayashi, M.; Akiyama, Y. Comparison of inhibitory effects of warfarin on gamma-carboxylation between bone and liver in rats. J. Bone Miner. Metab. 2005, 23, 366–372. [Google Scholar] [CrossRef] [PubMed]
- Gundberg, C.M.; Lian, J.B.; Booth, S.L. Vitamin K-dependent carboxylation of osteocalcin: Friend or foe? Adv. Nutr. 2012, 3, 149–157. [Google Scholar] [CrossRef] [PubMed]
- Theuwissen, E.; Magdeleyns, E.J.; Braam, L.A.; Teunissen, K.J.; Knapen, M.H.; Binnekamp, I.A.; van Summeren, M.J.; Vermeer, C. Vitamin K status in healthy volunteers. Food Funct. 2014, 5, 229–234. [Google Scholar] [CrossRef] [PubMed]
- Shea, M.K.; Booth, S.L.; Gundberg, C.M.; Peterson, J.W.; Waddell, C.; Dawson-Hughes, B.; Saltzman, E. Adulthood obesity is positively associated with adipose tissue concentrations of vitamin K and inversely associated with circulating indicators of vitamin K status in men and women. J. Nutr. 2010, 140, 1029–1034. [Google Scholar] [CrossRef] [PubMed]
- Cranenburg, E.C.; Koos, R.; Schurgers, L.J.; Magdeleyns, E.J.; Schoonbrood, T.H.; Landewe, R.B.; Brandenburg, V.M.; Bekers, O.; Vermeer, C. Characterisation and potential diagnostic value of circulating matrix Gla protein (MGP) species. Thromb. Haemost. 2010, 104, 811–822. [Google Scholar] [PubMed]
- Shea, M.K.; O’Donnell, C.J.; Vermeer, C.; Magdeleyns, E.J.; Crosier, M.D.; Gundberg, C.M.; Ordovas, J.M.; Kritchevsky, S.B.; Booth, S.L. Circulating uncarboxylated matrix gla protein is associated with vitamin K nutritional status, but not coronary artery calcium, in older adults. J. Nutr. 2011, 141, 1529–1534. [Google Scholar] [CrossRef] [PubMed]
- O’Donnell, C.J.; Shea, M.K.; Price, P.A.; Gagnon, D.R.; Wilson, P.W.; Larson, M.G.; Kiel, D.P.; Hoffmann, U.; Ferencik, M.; Clouse, M.E.; et al. Matrix Gla protein is associated with risk factors for atherosclerosis but not with coronary artery calcification. Arterioscler. Thromb. Vasc. Biol. 2006, 26, 2769–2774. [Google Scholar] [CrossRef] [PubMed]
- Liu, G.; Peacock, M. Age-related changes in serum undercarboxylated osteocalcin and its relationships with bone density, bone quality, and hip fracture. Calcif. Tissue Int. 1998, 62, 286–289. [Google Scholar] [CrossRef] [PubMed]
- Szulc, P.; Chapuy, M.C.; Meunier, P.J.; Delmas, P.D. Serum undercarboxylated osteocalcin is a marker of the risk of hip fracture in elderly women. J. Clin. Invest. 1993, 91, 1769–1774. [Google Scholar] [CrossRef] [PubMed]
- Szulc, P.; Arlot, M.; Chapuy, M.C.; Duboeuf, F.; Meunier, P.J.; Delmas, P.D. Serum undercarboxylated osteocalcin correlates with hip bone mineral density in elderly women. J. Bone Miner. Res. 1994, 9, 1591–1595. [Google Scholar] [CrossRef] [PubMed]
- Vergnaud, P.; Garnero, P.; Meunier, P.J.; Breart, G.; Kamihagi, K.; Delmas, P.D. Undercarboxylated osteocalcin measured with a specific immunoassay predicts hip fracture in elderly women: The EPIDOS Study. J. Clin. Endocrinol. Metab. 1997, 82, 719–724. [Google Scholar] [CrossRef] [PubMed]
- Braam, L.A.; Knapen, M.H.; Geusens, P.; Brouns, F.; Hamulyak, K.; Gerichhausen, M.J.; Vermeer, C. Vitamin K1 supplementation retards bone loss in postmenopausal women between 50 and 60 years of age. Calcif. Tissue Int. 2003, 73, 21–26. [Google Scholar] [CrossRef] [PubMed]
- Knapen, M.H.; Drummen, N.E.; Smit, E.; Vermeer, C.; Theuwissen, E. Three-year low-dose menaquinone-7 supplementation helps decrease bone loss in healthy postmenopausal women. Osteoporos. Int. 2013, 24, 2499–2507. [Google Scholar] [CrossRef] [PubMed]
- Binkley, N.; Harke, J.; Krueger, D.; Engelke, J.; Vallarta-Ast, N.; Gemar, D.; Checovich, M.; Chappell, R.; Suttie, J. Vitamin K treatment reduces undercarboxylated osteocalcin but does not alter bone turnover, density, or geometry in healthy postmenopausal North American women. J. Bone Miner. Res. 2009, 24, 983–991. [Google Scholar] [CrossRef] [PubMed]
- Bolton-Smith, C.; McMurdo, M.E.; Paterson, C.R.; Mole, P.A.; Harvey, J.M.; Fenton, S.T.; Prynne, C.J.; Mishra, G.D.; Shearer, M.J. Two-year randomized controlled trial of vitamin K1 (phylloquinone) and vitamin D3 plus calcium on the bone health of older women. J. Bone Miner. Res. 2007, 22, 509–519. [Google Scholar] [CrossRef] [PubMed]
- O’Connor, E.M.; Grealy, G.; McCarthy, J.; Desmond, A.; Craig, O.; Shanahan, F.; Cashman, K.D. Effect of phylloquinone (vitamin K1) supplementation for 12 months on the indices of vitamin K status and bone health in adult patients with Crohn’s disease. Br. J. Nutr. 2014, 112, 1163–1174. [Google Scholar] [CrossRef] [PubMed]
- Emaus, N.; Gjesdal, C.G.; Almas, B.; Christensen, M.; Grimsgaard, A.S.; Berntsen, G.K.; Salomonsen, L.; Fonnebo, V. Vitamin K2 supplementation does not influence bone loss in early menopausal women: A randomised double-blind placebo-controlled trial. Osteoporos. Int. 2010, 21, 1731–1740. [Google Scholar] [CrossRef] [PubMed]
- Ferron, M.; Hinoi, E.; Karsenty, G.; Ducy, P. Osteocalcin differentially regulates beta cell and adipocyte gene expression and affects the development of metabolic diseases in wild-type mice. Proc. Natl. Acad. Sci. USA 2008, 105, 5266–5270. [Google Scholar] [CrossRef] [PubMed]
- Ferron, M.; McKee, M.D.; Levine, R.L.; Ducy, P.; Karsenty, G. Intermittent injections of osteocalcin improve glucose metabolism and prevent type 2 diabetes in mice. Bone 2012, 50, 568–575. [Google Scholar] [CrossRef] [PubMed]
- Pollock, N.K.; Bernard, P.J.; Gower, B.A.; Gundberg, C.M.; Wenger, K.; Misra, S.; Bassali, R.W.; Davis, C.L. Lower uncarboxylated osteocalcin concentrations in children with prediabetes is associated with beta-cell function. J. Clin. Endocrinol. Metab. 2011, 96, E1092–E1099. [Google Scholar] [CrossRef] [PubMed]
- Prats-Puig, A.; Mas-Parareda, M.; Riera-Perez, E.; Gonzalez-Forcadell, D.; Mier, C.; Mallol-Guisset, M.; Diaz, M.; Bassols, J.; de Zegher, F.; Ibanez, L.; et al. Carboxylation of osteocalcin affects its association with metabolic parameters in healthy children. Diabetes Care 2010, 33, 661–663. [Google Scholar] [CrossRef] [PubMed]
- Lu, C.; Ivaska, K.K.; Alen, M.; Wang, Q.; Tormakangas, T.; Xu, L.; Wiklund, P.; Mikkola, T.M.; Pekkala, S.; Tian, H.; Vaananen, H.K.; et al. Serum osteocalcin is not associated with glucose but is inversely associated with leptin across generations of nondiabetic women. J. Clin. Endocrinol. Metab. 2012, 97, 4106–4114. [Google Scholar] [CrossRef] [PubMed]
- Iki, M.; Tamaki, J.; Fujita, Y.; Kouda, K.; Yura, A.; Kadowaki, E.; Sato, Y.; Moon, J.S.; Tomioka, K.; Okamoto, N.; et al. Serum undercarboxylated osteocalcin levels are inversely associated with glycemic status and insulin resistance in an elderly Japanese male population: Fujiwara-kyo Osteoporosis Risk in Men (FORMEN) Study. Osteoporos. Int. 2012, 23, 761–770. [Google Scholar] [CrossRef] [PubMed]
- Okuno, S.; Ishimura, E.; Tsuboniwa, N.; Norimine, K.; Yamakawa, K.; Yamakawa, T.; Shoji, S.; Mori, K.; Nishizawa, Y.; Inaba, M. Significant inverse relationship between serum undercarboxylated osteocalcin and glycemic control in maintenance hemodialysis patients. Osteoporos. Int. 2013, 24, 605–612. [Google Scholar] [CrossRef] [PubMed]
- Yeap, B.B.; Alfonso, H.; Chubb, S.A.; Gauci, R.; Byrnes, E.; Beilby, J.P.; Ebeling, P.R.; Handelsman, D.J.; Allan, C.A.; Grossmann, M.; et al. Higher serum undercarboxylated osteocalcin and other bone turnover markers are associated with reduced diabetes risk and lower estradiol concentrations in older men. J. Clin. Endocrinol. Metab. 2015, 100, 63–71. [Google Scholar] [CrossRef] [PubMed]
- Shea, M.K.; Gundberg, C.M.; Meigs, J.B.; Dallal, G.E.; Saltzman, E.; Yoshida, M.; Jacques, P.F.; Booth, S.L. Gamma-carboxylation of osteocalcin and insulin resistance in older men and women. Am. J. Clin. Nutr. 2009, 90, 1230–1235. [Google Scholar] [CrossRef] [PubMed]
- Liu, D.M.; Guo, X.Z.; Tong, H.J.; Tao, B.; Sun, L.H.; Zhao, H.Y.; Ning, G.; Liu, J.M. Association between osteocalcin and glucose metabolism: A meta-analysis. Osteoporos. Int. 2015, 26, 2823–2833. [Google Scholar] [CrossRef] [PubMed]
- Luo, G.; Ducy, P.; McKee, M.D.; Pinero, G.J.; Loyer, E.; Behringer, R.R.; Karsenty, G. Spontaneous calcification of arteries and cartilage in mice lacking matrix GLA protein. Nature 1997, 386, 78–81. [Google Scholar] [CrossRef] [PubMed]
- Schurgers, L.J.; Spronk, H.M.; Skepper, J.N.; Hackeng, T.M.; Shanahan, C.M.; Vermeer, C.; Weissberg, P.L.; Proudfoot, D. Post-translational modifications regulate matrix Gla protein function: Importance for inhibition of vascular smooth muscle cell calcification. J. Thromb. Haemost. 2007, 5, 2503–2511. [Google Scholar] [CrossRef] [PubMed]
- Dalmeijer, G.W.; van der Schouw, Y.T.; Magdeleyns, E.; Ahmed, N.; Vermeer, C.; Beulens, J.W. The effect of menaquinone-7 supplementation on circulating species of matrix Gla protein. Atherosclerosis 2012, 225, 397–402. [Google Scholar] [CrossRef] [PubMed]
- Schlieper, G.; Westenfeld, R.; Kruger, T.; Cranenburg, E.C.; Magdeleyns, E.J.; Brandenburg, V.M.; Djuric, Z.; Damjanovic, T.; Ketteler, M.; Vermeer, C.; et al. Circulating nonphosphorylated carboxylated matrix gla protein predicts survival in ESRD. J. Am. Soc. Nephrol. 2011, 22, 387–395. [Google Scholar] [CrossRef] [PubMed]
- Westenfeld, R.; Krueger, T.; Schlieper, G.; Cranenburg, E.C.; Magdeleyns, E.J.; Heidenreich, S.; Holzmann, S.; Vermeer, C.; Jahnen-Dechent, W.; Ketteler, M.; et al. Effect of vitamin K2 supplementation on functional vitamin K deficiency in hemodialysis patients: A randomized trial. Am. J. Kidney Dis. 2012, 59, 186–195. [Google Scholar] [CrossRef] [PubMed]
- Dalmeijer, G.W.; van der Schouw, Y.T.; Magdeleyns, E.J.; Vermeer, C.; Verschuren, W.M.; Boer, J.M.; Beulens, J.W. Matrix Gla protein species and risk of cardiovascular events in type 2 diabetic patients. Diabetes Care 2013, 36, 3766–3771. [Google Scholar] [CrossRef] [PubMed]
- Liu, Y.P.; Gu, Y.M.; Thijs, L.; Knapen, M.H.; Salvi, E.; Citterio, L.; Petit, T.; Carpini, S.D.; Zhang, Z.; Jacobs, L.; et al. Inactive matrix Gla protein is causally related to adverse health outcomes: A Mendelian randomization study in a Flemish population. Hypertension 2015, 65, 463–470. [Google Scholar] [CrossRef] [PubMed]
- Mayer, O., Jr.; Seidlerova, J.; Bruthans, J.; Filipovsky, J.; Timoracka, K.; Vanek, J.; Cerna, L.; Wohlfahrt, P.; Cifkova, R.; Theuwissen, E.; et al. Desphospho-uncarboxylated matrix Gla-protein is associated with mortality risk in patients with chronic stable vascular disease. Atherosclerosis 2014, 235, 162–168. [Google Scholar] [CrossRef] [PubMed]
- Mayer, O., Jr.; Seidlerova, J.; Wohlfahrt, P.; Filipovsky, J.; Vanek, J.; Cifkova, R.; Windrichova, J.; Topolcan, O.; Knapen, M.H.; Drummen, N.E.; et al. Desphospho-uncarboxylated matrix Gla protein is associated with increased aortic stiffness in a general population. J. Hum. Hypertens. 2015. [Google Scholar] [CrossRef] [PubMed]
- Pivin, E.; Ponte, B.; Pruijm, M.; Ackermann, D.; Guessous, I.; Ehret, G.; Liu, Y.P.; Drummen, N.E.; Knapen, M.H.; Pechere-Bertschi, A.; et al. Inactive matrix Gla-protein is associated with arterial stiffness in an adult population-based study. Hypertension 2015, 66, 85–92. [Google Scholar] [CrossRef] [PubMed]
- Pivin, E.; Pruijm, M.; Ackermann, D.; Guessous, I.; Ehret, G.; Pechere-Bertschi, A.; Paccaud, F.; Mohaupt, M.; Vermeer, C.; Staessen, J.A.; et al. 1D.03: Inactive matrix gla protein is associated with renal resistive index in a population-based study. J. Hypertens. 2015, 33 (Suppl. S1). [Google Scholar] [CrossRef] [PubMed]
- van den Heuvel, E.G.; van Schoor, N.M.; Lips, P.; Magdeleyns, E.J.; Deeg, D.J.; Vermeer, C.; den, H.M. Circulating uncarboxylated matrix Gla protein, a marker of vitamin K status, as a risk factor of cardiovascular disease. Maturitas 2014, 77, 137–141. [Google Scholar] [CrossRef] [PubMed]
- Dalmeijer, G.W.; van der Schouw, Y.T.; Vermeer, C.; Magdeleyns, E.J.; Schurgers, L.J.; Beulens, J.W. Circulating matrix Gla protein is associated with coronary artery calcification and vitamin K status in healthy women. J. Nutr. Biochem. 2013, 24, 624–628. [Google Scholar] [CrossRef] [PubMed]
- Dalmeijer, G.W.; van der Schouw, Y.T.; Magdeleyns, E.J.; Vermeer, C.; Verschuren, W.M.; Boer, J.M.; Beulens, J.W. Circulating desphospho-uncarboxylated matrix gamma-carboxyglutamate protein and the risk of coronary heart disease and stroke. J. Thromb. Haemost. 2014, 12, 1028–1034. [Google Scholar] [CrossRef] [PubMed]
- Knapen, M.H.; Braam, L.A.; Drummen, N.E.; Bekers, O.; Hoeks, A.P.; Vermeer, C. Menaquinone-7 supplementation improves arterial stiffness in healthy postmenopausal women: Double-blind randomised clinical trial. Thromb. Haemost. 2015, 113, 1135–1144. [Google Scholar] [CrossRef] [PubMed]
- Farzaneh-Far, A.; Weissberg, P.L.; Proudfoot, D.; Shanahan, C.M. Transcriptional regulation of matrix gla protein. Z. Kardiol. 2001, 90 (Suppl. S3), 38–42. [Google Scholar] [CrossRef] [PubMed]
- Mustonen, E.; Pohjolainen, V.; Aro, J.; Pikkarainen, S.; Leskinen, H.; Ruskoaho, H.; Rysa, J. Upregulation of cardiac matrix Gla protein expression in response to hypertrophic stimuli. Blood Press 2009, 18, 286–293. [Google Scholar] [CrossRef] [PubMed]
- Price, P.A.; Thomas, G.R.; Pardini, A.W.; Figueira, W.F.; Caputo, J.M.; Williamson, M.K. Discovery of a high molecular weight complex of calcium, phosphate, fetuin, and matrix gamma-carboxyglutamic acid protein in the serum of etidronate-treated rats. J. Biol. Chem. 2002, 277, 3926–3934. [Google Scholar] [CrossRef] [PubMed]
- Truong, J.T.; Fu, X.; Saltzman, E.; Al, R.A.; Dallal, G.E.; Gundberg, C.M.; Booth, S.L. Age group and sex do not influence responses of vitamin K biomarkers to changes in dietary vitamin K. J. Nutr. 2012, 142, 936–941. [Google Scholar] [CrossRef] [PubMed]
- Bugel, S.; Sorensen, A.D.; Hels, O.; Kristensen, M.; Vermeer, C.; Jakobsen, J.; Flynn, A.; Molgaard, C.; Cashman, K.D. Effect of phylloquinone supplementation on biochemical markers of vitamin K status and bone turnover in postmenopausal women. Br. J. Nutr. 2007, 97, 373–380. [Google Scholar] [CrossRef] [PubMed]
- Harrington, D.J.; Soper, R.; Edwards, C.; Savidge, G.F.; Hodges, S.J.; Shearer, M.J. Determination of the urinary aglycone metabolites of vitamin K by HPLC with redox-mode electrochemical detection. J. Lipid Res. 2005, 46, 1053–1060. [Google Scholar] [CrossRef] [PubMed]
- Al, R.A.; Peterson, J.; Choi, S.W.; Suttie, J.; Barakat, S.; Booth, S.L. Measurement of menadione in urine by HPLC. J. Chromatogr. B Anal. Technol. Biomed. Life Sci. 2010, 878, 2457–2460. [Google Scholar]
- Shea, M.K.; Booth, S.L.; Brinkley, T.E.; Kritchevsky, S.B. Vitamin K status in black and white older adults and its relationship with cardiovascular disease risk. FASEB J. 2015, 29 (Suppl. S1), 906.4. [Google Scholar]
© 2016 by the authors; licensee MDPI, Basel, Switzerland. This article is an open access article distributed under the terms and conditions of the Creative Commons by Attribution (CC-BY) license (http://creativecommons.org/licenses/by/4.0/).
Share and Cite
Shea, M.K.; Booth, S.L. Concepts and Controversies in Evaluating Vitamin K Status in Population-Based Studies. Nutrients 2016, 8, 8. https://doi.org/10.3390/nu8010008
Shea MK, Booth SL. Concepts and Controversies in Evaluating Vitamin K Status in Population-Based Studies. Nutrients. 2016; 8(1):8. https://doi.org/10.3390/nu8010008
Chicago/Turabian StyleShea, M. Kyla, and Sarah L. Booth. 2016. "Concepts and Controversies in Evaluating Vitamin K Status in Population-Based Studies" Nutrients 8, no. 1: 8. https://doi.org/10.3390/nu8010008