Chiral Recognition of Flexible Melatonin Receptor Ligands Induced by Conformational Equilibria

 , , , ,
  , and
, and
Abstract
:
1. Introduction
2. Results and Discussion
2.1. Chemistry
2.2. Biological Activity
2.3. Docking of Beta-Methyl Derivatives (S)-10 and (R)-10 into MT2 Receptor Crystal Structure
2.4. Conformational Equilibria of Beta-Methyl Derivatives in Solution: MD Simulations and NMR Spectroscopy
3. Materials and Methods
3.1. Chemistry
General Procedures
3.2. Pharmacology
3.2.1. Reagents
3.2.2. Melatonin Receptor Binding and Intrinsic Activity Evaluation
3.3. Molecular Modeling
3.3.1. Protein Preparation
3.3.2. Ligand Docking and MM-GBSA Calculations
3.4. Molecular Dynamics (MD) Simulations
3.4.1. MD Simulations of Ligand-Receptor Complexes
3.4.2. MD Simulations of Melatoninergic Ligands in Solution
3.4.3. MD Simulation General Procedures
4. Conclusions
Supplementary Materials
Author Contributions
Funding
Acknowledgments
Conflicts of Interest
References
- Hardeland, R.; Cardinali, D.P.; Srinivasan, V.; Spence, D.W.; Brown, G.M.; Pandi-Perumal, S.R. Melatonin—A pleiotropic, orchestrating regulator molecule. Prog. Neurobiol. 2011, 93, 350–384. [Google Scholar] [CrossRef] [PubMed] [Green Version]
- Jockers, R.; Delagrange, P.; Dubocovich, M.L.; Markus, R.P.; Renault, N.; Tosini, G.; Cecon, E.; Zlotos, D.P. Update on melatonin receptors: IUPHAR Review 20: Melatonin receptors. Br. J. Pharmacol. 2016, 173, 2702–2725. [Google Scholar] [CrossRef]
- Cecon, E.; Oishi, A.; Jockers, R. Melatonin receptors: Molecular pharmacology and signalling in the context of system bias. Br. J. Pharmacol. 2018, 175, 3263–3280. [Google Scholar] [CrossRef] [PubMed] [Green Version]
- Liu, J.; Clough, S.J.; Hutchinson, A.J.; Adamah-Biassi, E.B.; Popovska-Gorevski, M.; Dubocovich, M.L. MT1 and MT2 melatonin receptors: A therapeutic perspective. Annu. Rev. Pharmacol. Toxicol. 2016, 56, 361–383. [Google Scholar] [CrossRef] [Green Version]
- Zlotos, D.P.; Jockers, R.; Cecon, E.; Rivara, S.; Witt-Enderby, P.A. MT1 and MT2 melatonin receptors: Ligands, Models, oligomers, and therapeutic potential. J. Med. Chem. 2014, 57, 3161–3185. [Google Scholar] [CrossRef]
- Boutin, J.A.; Witt-Enderly, P.A.; Sotriffer, C.; Zlotos, D.P. Melatonin receptor ligands: A pharmaco-chemical perspective. J. Pineal Res. 2020, e12672. [Google Scholar] [CrossRef]
- Mulchahey, J.; Goldwater, D.; Zemlan, F. A single blind, placebo controlled, across groups dose escalation study of the safety, tolerability, pharmacokinetics and pharmacodynamics of the melatonin analog β-methyl-6-chloromelatonin. Life Sci. 2004, 75, 1843–1856. [Google Scholar] [CrossRef]
- Ettaoussi, M.; Sabaouni, A.; Pérès, B.; Landagaray, E.; Nosjean, O.; Boutin, J.A.; Caignard, D.-H.; Delagrange, P.; Berthelot, P.; Yous, S. Synthesis and pharmacological evaluation of a series of the agomelatine analogues as melatonin MT1 /MT2 agonist and 5-HT2C antagonist. ChemMedChem 2013, 8, 1830–1845. [Google Scholar] [CrossRef]
- Ettaoussi, M.; Pérès, B.; Jarry, C.; Nosjean, O.; Boutin, J.A.; Gohier, A.; Mannoury la Cour, C.; Caignard, D.-H.; Delagrange, P.; Berthelot, P.; et al. Synthesis, chiral resolution, absolute configuration assignment and pharmacological evaluation of a series of melatoninergic ligands. Med. Chem. Commun. 2014, 5, 1303–1308. [Google Scholar] [CrossRef]
- Carocci, A.; Catalano, A.; Lovece, A.; Lentini, G.; Duranti, A.; Lucini, V.; Pannacci, M.; Scaglione, F.; Franchini, C. Design, synthesis, and pharmacological effects of structurally simple ligands for MT1 and MT2 melatonin receptors. Bioorg. Med. Chem. 2010, 18, 6496–6511. [Google Scholar] [CrossRef]
- Rivara, S.; Diamantini, G.; Di Giacomo, B.; Lamba, D.; Gatti, G.; Lucini, V.; Pannacci, M.; Mor, M.; Spadoni, G.; Tarzia, G. Reassessing the melatonin pharmacophore-enantiomeric resolution, pharmacological activity, structure analysis, and molecular modeling of a constrained chiral melatonin analogue. Bioorg. Med. Chem. 2006, 14, 3383–3391. [Google Scholar] [CrossRef]
- Bedini, A.; Lucarini, S.; Spadoni, G.; Tarzia, G.; Scaglione, F.; Dugnani, S.; Pannacci, M.; Lucini, V.; Carmi, C.; Pala, D.; et al. Toward the definition of stereochemical requirements for MT2-selective antagonists and partial agonists by studying 4-phenyl-2-propionamidotetralin derivatives. J. Med. Chem. 2011, 54, 8362–8372. [Google Scholar] [CrossRef]
- Stauch, B.; Johansson, L.C.; McCorvy, J.D.; Patel, N.; Han, G.W.; Huang, X.-P.; Gati, C.; Batyuk, A.; Slocum, S.T.; Ishchenko, A.; et al. Structural basis of ligand recognition at the human MT1 melatonin receptor. Nature 2019, 569, 284–288. [Google Scholar] [CrossRef] [PubMed]
- Johansson, L.C.; Stauch, B.; McCorvy, J.D.; Han, G.W.; Patel, N.; Huang, X.-P.; Batyuk, A.; Gati, C.; Slocum, S.T.; Li, C.; et al. XFEL structures of the human MT2 melatonin receptor reveal the basis of subtype selectivity. Nature 2019, 569, 289–292. [Google Scholar] [CrossRef] [PubMed]
- Ochoa-Sanchez, R.; Comai, S.; Lacoste, B.; Bambico, F.R.; Dominguez-Lopez, S.; Spadoni, G.; Rivara, S.; Bedini, A.; Angeloni, D.; Fraschini, F.; et al. Promotion of Non-Rapid Eye Movement Sleep and Activation of Reticular Thalamic Neurons by a Novel MT2 Melatonin Receptor Ligand. J. Neurosci. 2011, 31, 18439–18452. [Google Scholar] [CrossRef] [PubMed] [Green Version]
- Lopez-Canul, M.; Palazzo, E.; Dominguez-Lopez, S.; Luongo, L.; Lacoste, B.; Comai, S.; Angeloni, D.; Fraschini, F.; Boccella, S.; Spadoni, G.; et al. Selective melatonin MT2 receptor ligands relieve neuropathic pain through modulation of brainstem descending antinociceptive pathways. Pain 2015, 156, 305–317. [Google Scholar] [CrossRef]
- Rivara, S.; Vacondio, F.; Fioni, A.; Silva, C.; Carmi, C.; Mor, M.; Lucini, V.; Pannacci, M.; Caronno, A.; Scaglione, F.; et al. N-(Anilinoethyl)amides: Design and synthesis of metabolically stable, selective melatonin receptor ligands. ChemMedChem 2009, 4, 1746–1755. [Google Scholar] [CrossRef]
- Rivara, S.; Lodola, A.; Mor, M.; Bedini, A.; Spadoni, G.; Lucini, V.; Pannacci, M.; Fraschini, F.; Scaglione, F.; Sanchez, R.O.; et al. N-(Substituted-anilinoethyl) amides: Design, synthesis, and pharmacological characterization of a new class of melatonin receptor ligands. J. Med. Chem. 2007, 50, 6618–6626. [Google Scholar] [CrossRef]
- Etxabe, J.; Izquierdo, J.; Landa, A.; Oiarbide, M.; Palomo, C. Catalytic enantioselective synthesis of N,Cα,Cα-trisubstituted α-amino acid derivatives using 1H -imidazol-4(5H )-ones as key templates. Angew. Chem. Int. Ed. 2015, 54, 6883–6886. [Google Scholar] [CrossRef]
- Bartoccini, F.; Venturi, S.; Retini, M.; Mari, M.; Piersanti, G. Total synthesis of (−)-clavicipitic acid via γ,γ-dimethylallyltryptophan (DMAT) and chemoselective C–H hydroxylation. J. Org. Chem. 2019, 84, 8027–8034. [Google Scholar] [CrossRef]
- Cheng, Y.; Prusoff, W.H. Relationship between the inhibition constant (Ki) and the concentration of inhibitor which causes 50% inhibition (I50) of an enzymatic reaction. Biochem. Pharmacol. 1973, 22, 3099–3108. [Google Scholar] [PubMed]
- Ballesteros, J.A.; Weinstein, H. Integrated methods for the construction of three-dimensional models and computational probing of structure-function relations in G protein-coupled receptors. Methods Neurosci. 1995, 25, 366–428. [Google Scholar]
- Hassan Mohamed, I.; Giorgio, C.; Incerti, M.; Russo, S.; Pala, D.; Pasquale, E.B.; Zanotti, I.; Vicini, P.; Barocelli, E.; Rivara, S.; et al. UniPR 129 is a competitive small molecule Eph-ephrin antagonist blocking in vitro angiogenesis at low micromolar concentrations. Br. J. Pharmacol. 2014, 171, 5195–5208. [Google Scholar] [CrossRef] [Green Version]
- Lu, H.; Martí, J. Binding and dynamics of melatonin at the interface of phosphatidylcholine-cholesterol membranes. PLoS ONE 2019, 14, e0224624. [Google Scholar] [CrossRef] [Green Version]
- Lu, H.; Martí, J. Cellular absorption of small molecules: Free energy landscapes of melatonin binding at phospholipid membranes. Sci. Rep. 2020, 10, 9235. [Google Scholar] [CrossRef]
- Lukas, R.J.; Muresan, A.Z.; Damaj, M.I.; Blough, B.E.; Huang, X.; Navarro, H.A.; Mascarella, S.W.; Eaton, J.B.; Marxer-Miller, S.K.; Carroll, F.I. Synthesis and characterization of in vitro and in vivo profiles of hydroxybupropion analogues: Aids to smoking cessation. J. Med. Chem. 2010, 53, 4731–4748. [Google Scholar] [CrossRef] [PubMed] [Green Version]
- Chattopadhyay, A.K.; Ly, V.L.; Jakkepally, S.; Berger, G.; Hanessian, S. Total Synthesis of Isodaphlongamine H: A Possible Biogenetic Conundrum. Angew. Chem. Int. Ed. 2016, 55, 2577–2581. [Google Scholar] [CrossRef] [PubMed] [Green Version]
- Nonno, R.; Lucini, V.; Pannacci, M.; Mazzucchelli, C.; Angeloni, D.; Fraschini, F.; Stankov, B.M. Pharmacological characterization of the human melatonin Mel1a receptor following stable transfection into NIH3T3 cells. Br. J. Pharmacol. 1998, 124, 485–492. [Google Scholar] [CrossRef] [Green Version]
- Spadoni, G.; Balsamini, C.; Bedini, A.; Diamantini, G.; Di Giacomo, B.; Tontini, A.; Tarzia, G.; Mor, M.; Plazzi, P.V.; Rivara, S.; et al. 2-[N-Acylamino(C1-C3)alkyl]indoles as MT1 melatonin receptor partial agonists, antagonists, and putative inverse agonists. J. Med. Chem. 1998, 41, 3624–3634. [Google Scholar] [CrossRef]
- Bradford, M.M. A rapid and sensitive method for the quantitation of microgram quantities of protein utilizing the principle of protein−dye binding. Anal. Biochem. 1976, 72, 248–254. [Google Scholar] [CrossRef]
- Wallez, V.; Durieux-Poissonnier, S.; Chavatte, P.; Boutin, J.A.; Audinot, V.; Nicolas, J.P.; Bennejean, C.; Delagrange, P.; Renard, P.; Lesieur, D. Synthesis and structure−affinity-activity relationships of novel benzofuran derivatives as MT(2) melatonin receptor selective ligands. J. Med. Chem. 2002, 45, 2788–2800. [Google Scholar] [CrossRef] [PubMed]
- Fiser, A.; Do, R.K.G.; Šali, A. Modeling of loops in protein structures. Protein Sci. 2000, 9, 1753–1773. [Google Scholar] [CrossRef] [PubMed] [Green Version]
- Shen, M.; Šali, A. Statistical potential for assessment and prediction of protein structures. Protein Sci. 2006, 15, 2507–2524. [Google Scholar] [CrossRef] [Green Version]
- Schrödinger Release 2018-2: Protein Preparation Wizard; Epik 4.4; Schrödinger, LLC: New York, NY, USA, 2016; Impact 7.9; Schrödinger, LLC: New York, NY, USA, 2016; Prime 5.2; Schrödinger, LLC: New York, NY, USA, 2018.
- Roos, K.; Wu, C.; Damm, W.; Reboul, M.; Stevenson, J.M.; Lu, C.; Dahlgren, M.K.; Mondal, S.; Chen, W.; Wang, L.; et al. OPLS3e: Extending force field coverage for drug-like small molecules. J. Chem. Theory Comput. 2019, 15, 1863–1874. [Google Scholar] [CrossRef] [PubMed]
- Schrödinger Release 2018-2: MacroModel 12.0; Schrödinger, LLC: New York, NY, USA, 2018.
- Polak, E.; Ribière, G. Note sur la convergence de méthodes de directions conjuguées. ESAIM Math. Model. Numer. Anal. Modél. Math. Anal. Numér. 1969, 3, 35–43. [Google Scholar] [CrossRef]
- Schrödinger Release 2018-2: Maestro 11.6; Schrödinger, LLC: New York, NY, USA, 2018.
- Still, W.C.; Tempczyk, A.; Hawley, R.C.; Hendrickson, T. Semianalytical treatment of solvation for molecular mechanics and dynamics. J. Am. Chem. Soc. 1990, 112, 6127–6129. [Google Scholar] [CrossRef]
- Friesner, R.A.; Banks, J.L.; Murphy, R.B.; Halgren, T.A.; Klicic, J.J.; Mainz, D.T.; Repasky, M.P.; Knoll, E.H.; Shelley, M.; Perry, J.K.; et al. Glide: A new approach for rapid, accurate docking and scoring. 1. method and assessment of docking accuracy. J. Med. Chem. 2004, 47, 1739–1749. [Google Scholar] [CrossRef]
- Schrödinger Release 2018-2: Prime 5.2; Schrödinger, LLC: New York, NY, USA, 2018.
- Klauda, J.B.; Venable, R.M.; Freites, J.A.; O’Connor, J.W.; Tobias, D.J.; Mondragon-Ramirez, C.; Vorobyov, I.; MacKerell, A.D.; Pastor, R.W. Update of the CHARMM all-atom Additive force field for lipids: Validation on six lipid types. J. Phys. Chem. B 2010, 114, 7830–7843. [Google Scholar] [CrossRef] [Green Version]
- Lomize, M.A.; Pogozheva, I.D.; Joo, H.; Mosberg, H.I.; Lomize, A.L. OPM database and PPM web server: Resources for positioning of proteins in membranes. Nucleic Acids Res. 2012, 40, D370–D376. [Google Scholar] [CrossRef]
- Feller, S.E.; Zhang, Y.; Pastor, R.W.; Brooks, B.R. Constant pressure molecular dynamics simulation: The Langevin piston method. J. Chem. Phys. 1995, 103, 4613–4621. [Google Scholar] [CrossRef]
- Schrödinger Release 2018-2: Desmond Molecular Dynamics System 5.4; D.E. Shaw Research: New York, NY, USA, 2018; Maestro-Desmond Interoperability Tools from Maestro 11.6; Schrödinger: New York, NY, USA, 2018.
- Kräutler, V.; Van Gunsteren, W.F.; Hünenberger, P.H. A fast SHAKE algorithm to solve distance constraint equations for small molecules in molecular dynamics simulations. J. Comput. Chem. 2001, 22, 501–508. [Google Scholar] [CrossRef]
- Essmann, U.; Perera, L.; Berkowitz, M.L.; Darden, T.; Lee, H.; Pedersen, L.G. A smooth particle mesh Ewald method. J. Chem. Phys. 1995, 103, 8577–8593. [Google Scholar] [CrossRef] [Green Version]
- Tuckerman, M.; Berne, B.J.; Martyna, G.J. Reversible multiple time scale molecular dynamics. J. Chem. Phys. 1992, 97, 1990–2001. [Google Scholar] [CrossRef] [Green Version]
Sample Availability: Samples of the compounds 3, (R)-10 and (S)-10 are available from the authors. |


| Compound | Rα | Rβ | hMT1 | hMT2 | ||
|---|---|---|---|---|---|---|
| pKi (±SD) a | IA (±SD) b | pKi (±SD) b | IA (±SD) b | |||
| melatonin | -- | -- | 9.60 ± 0.18 | 1.00 ± 0.09 | 9.44 ± 0.12 | 1.00 ± 0.07 |
| 3 | H | H | 8.76 ± 0.18 | 0.95 c | 8.65 ± 0.01 | 1.06 c |
| 10 | H | Me | 8.67 ± 0.01 | 0.98 ± 0.06 | 8.77 ± 0.02 | 1.01 ± 0.07 |
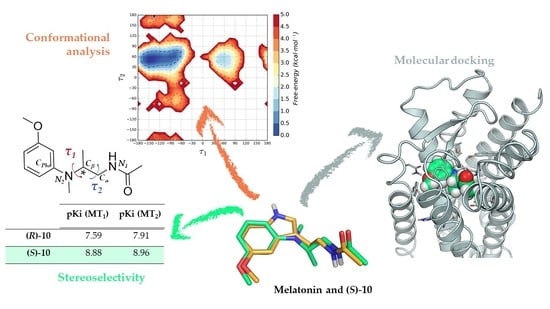
| (R)-10 d | H | Me | 7.59 ± 0.02 | 1.00 ± 0.07 | 7.91 ± 0.04 | 0.99 ± 0.08 |
| (S)-10 e | H | Me | 8.88 ± 0.08 | 0.98 ± 0.11 | 8.96 ± 0.11 | 1.01 ± 0.10 |
| 12 | Me | H | 8.17 ± 0.02 | n.d. | 7.98 ± 0.08 | n.d. |
© 2020 by the authors. Licensee MDPI, Basel, Switzerland. This article is an open access article distributed under the terms and conditions of the Creative Commons Attribution (CC BY) license (http://creativecommons.org/licenses/by/4.0/).
Share and Cite
Elisi, G.M.; Bedini, A.; Scalvini, L.; Carmi, C.; Bartolucci, S.; Lucini, V.; Scaglione, F.; Mor, M.; Rivara, S.; Spadoni, G. Chiral Recognition of Flexible Melatonin Receptor Ligands Induced by Conformational Equilibria. Molecules 2020, 25, 4057. https://doi.org/10.3390/molecules25184057
Elisi GM, Bedini A, Scalvini L, Carmi C, Bartolucci S, Lucini V, Scaglione F, Mor M, Rivara S, Spadoni G. Chiral Recognition of Flexible Melatonin Receptor Ligands Induced by Conformational Equilibria. Molecules. 2020; 25(18):4057. https://doi.org/10.3390/molecules25184057
Chicago/Turabian StyleElisi, Gian Marco, Annalida Bedini, Laura Scalvini, Caterina Carmi, Silvia Bartolucci, Valeria Lucini, Francesco Scaglione, Marco Mor, Silvia Rivara, and Gilberto Spadoni. 2020. "Chiral Recognition of Flexible Melatonin Receptor Ligands Induced by Conformational Equilibria" Molecules 25, no. 18: 4057. https://doi.org/10.3390/molecules25184057