Article

Dual Emission in a Ligand and Metal Co-Doped Lanthanide-Organic Framework: Color Tuning and Temperature Dependent Luminescence

by
Despoina Andriotou
1,
Stavros A. Diamantis
1,
Anna Zacharia
2,
Grigorios Itskos
2,
Nikos Panagiotou
3,
Anastasios J. Tasiopoulos
3 and
Theodore Lazarides
1,*
1
Department of Chemistry, Aristotle University of Thessaloniki, 54124 Thessaloniki, Greece
2
Department of Physics, University of Cyprus, 1687 Nicosia, Cyprus
3
Department of Chemistry, University of Cyprus, 1687 Nicosia, Cyprus
*
Author to whom correspondence should be addressed.
Molecules 2020, 25(3), 523; https://doi.org/10.3390/molecules25030523
Submission received: 1 December 2019 / Revised: 8 January 2020 / Accepted: 15 January 2020 / Published: 25 January 2020
(This article belongs to the Special Issue Metal Organic Frameworks: Synthesis and Application)

Abstract

:
In this study, we report the luminescence color tuning in the lanthanide metal-organic framework (LnMOF) ([La(bpdc)Cl(DMF)] (1); bpdc2− = [1,1′-biphenyl]-4,4′-dicarboxylate, DMF = N,N-dimethylformamide) by introducing dual emission properties in a La3+ MOF scaffold through doping with the blue fluorescent 2,2′-diamino-[1,1′-biphenyl]-4,4′-dicarboxylate (dabpdc2−) and the red emissive Eu3+. With a careful adjustment of the relative doping levels of the lanthanide ions and bridging ligands, the color of the luminescence was modulated, while at the same time the photophysical characteristics of the two chromophores were retained. In addition, the photophysical properties of the parent MOF (1) and its doped counterparts with various dabpdc2−/bpdc2− and Eu3+/La3+ ratios and the photoinduced energy transfer pathways that are possible within these materials are discussed. Finally, the temperature dependence study on the emission profile of a doped analogue containing 10% dabpdc2− and 2.5% Eu3+ (7) is presented, highlighting the potential of this family of materials to behave as temperature sensors.

Graphical Abstract

1. Introduction

The unique luminescence properties of trivalent lanthanide ions (Ln3+), including sharp atomic-like emission spectra, which are largely independent of the metal’s coordination environment and long lifetimes, reaching the order of a few milliseconds in the cases of Eu3+ and Tb3+, make them well suited as luminophores for a diverse range of applications spanning the fields of biotechnology, telecommunications, sensors and lighting [1,2,3,4]. Despite their favorable properties, the Laporte forbidden nature of f-f transitions makes luminescence through direct excitation of Ln3+ ions extremely inefficient. However, this shortcoming can be tackled through the coordination of Ln3+ ions to strongly absorbing chromophores which act as antennae by sensitizing metal-based emission through photoinduced energy transfer [5]. Recently, a considerable amount of research effort has been directed towards the development of lanthanide ratiometric thermometers [6] which are based on the temperature-induced changes in the photophysical behavior of at least two emission centers, thereby providing a more reliable and accurate self-referenced signal with reduced dependence on the experimental conditions. The majority lanthanide luminescent thermometers reported in the literature are based on measuring the ratio between the emission intensities of Tb3+ and Eu3+ centers at different temperatures [7,8,9,10] while those that involve the emission of a bridging ligand [11] or an encapsulated organic dye [12] are relatively rare.
In this contribution, we report the preparation and study of a homologous series of ligand and metal co-doped lanthanide-organic frameworks where a parent framework [La(bpdc)Cl(DMF)] (1) [13] is doped with the strongly fluorescent diamino derivative of the bpdc2− bridging ligand dabpdc2− and with the luminescent lanthanide ion Eu3+. The lanthanide MOF (LnMOF) ([La(bpdc)Cl(DMF)] (1) was chosen as a doping platform because: (i) its highly reproducible synthesis and chemical robustness, as dry crystals of 1 can be left in air for several months without showing any sign of deterioration; (ii) the bpdc2− bridging ligand has been demonstrated to be a good sensitizer for the luminescence of the Eu3+ ion [14,15,16]; (iii) the possibility to obtain strong Ln3+ -based emission due to the absence of water from the coordination sphere of the Ln3+ ion which would provide an efficient non-radiative deactivation pathway for f-f excited states through vibrational coupling with O–H oscillators [17]. Thus, following the above mentioned doping procedure, we prepared an isostructural series of materials with the formula [La1−xEux(bpdc)1−y(dabpdc)yCl(DMF)] (x = 0–0.025; y = 0 or 0.1) which show emission from both chromophores. With careful adjustment of the Eu3+ doping percentage while keeping the dabpdc2− doping level at 10%, luminescence color tuning from blue to red through purple was achieved. In addition, a temperature dependent luminescence study of material 7 (x = 0.025; y = 0.1) shows that good temperature sensing action can be obtained in the region from 80 to 180 K with the sensitivity parameter reaching the maximum value 2.51 %K−1 at 80 K.

2. Results and Discussion

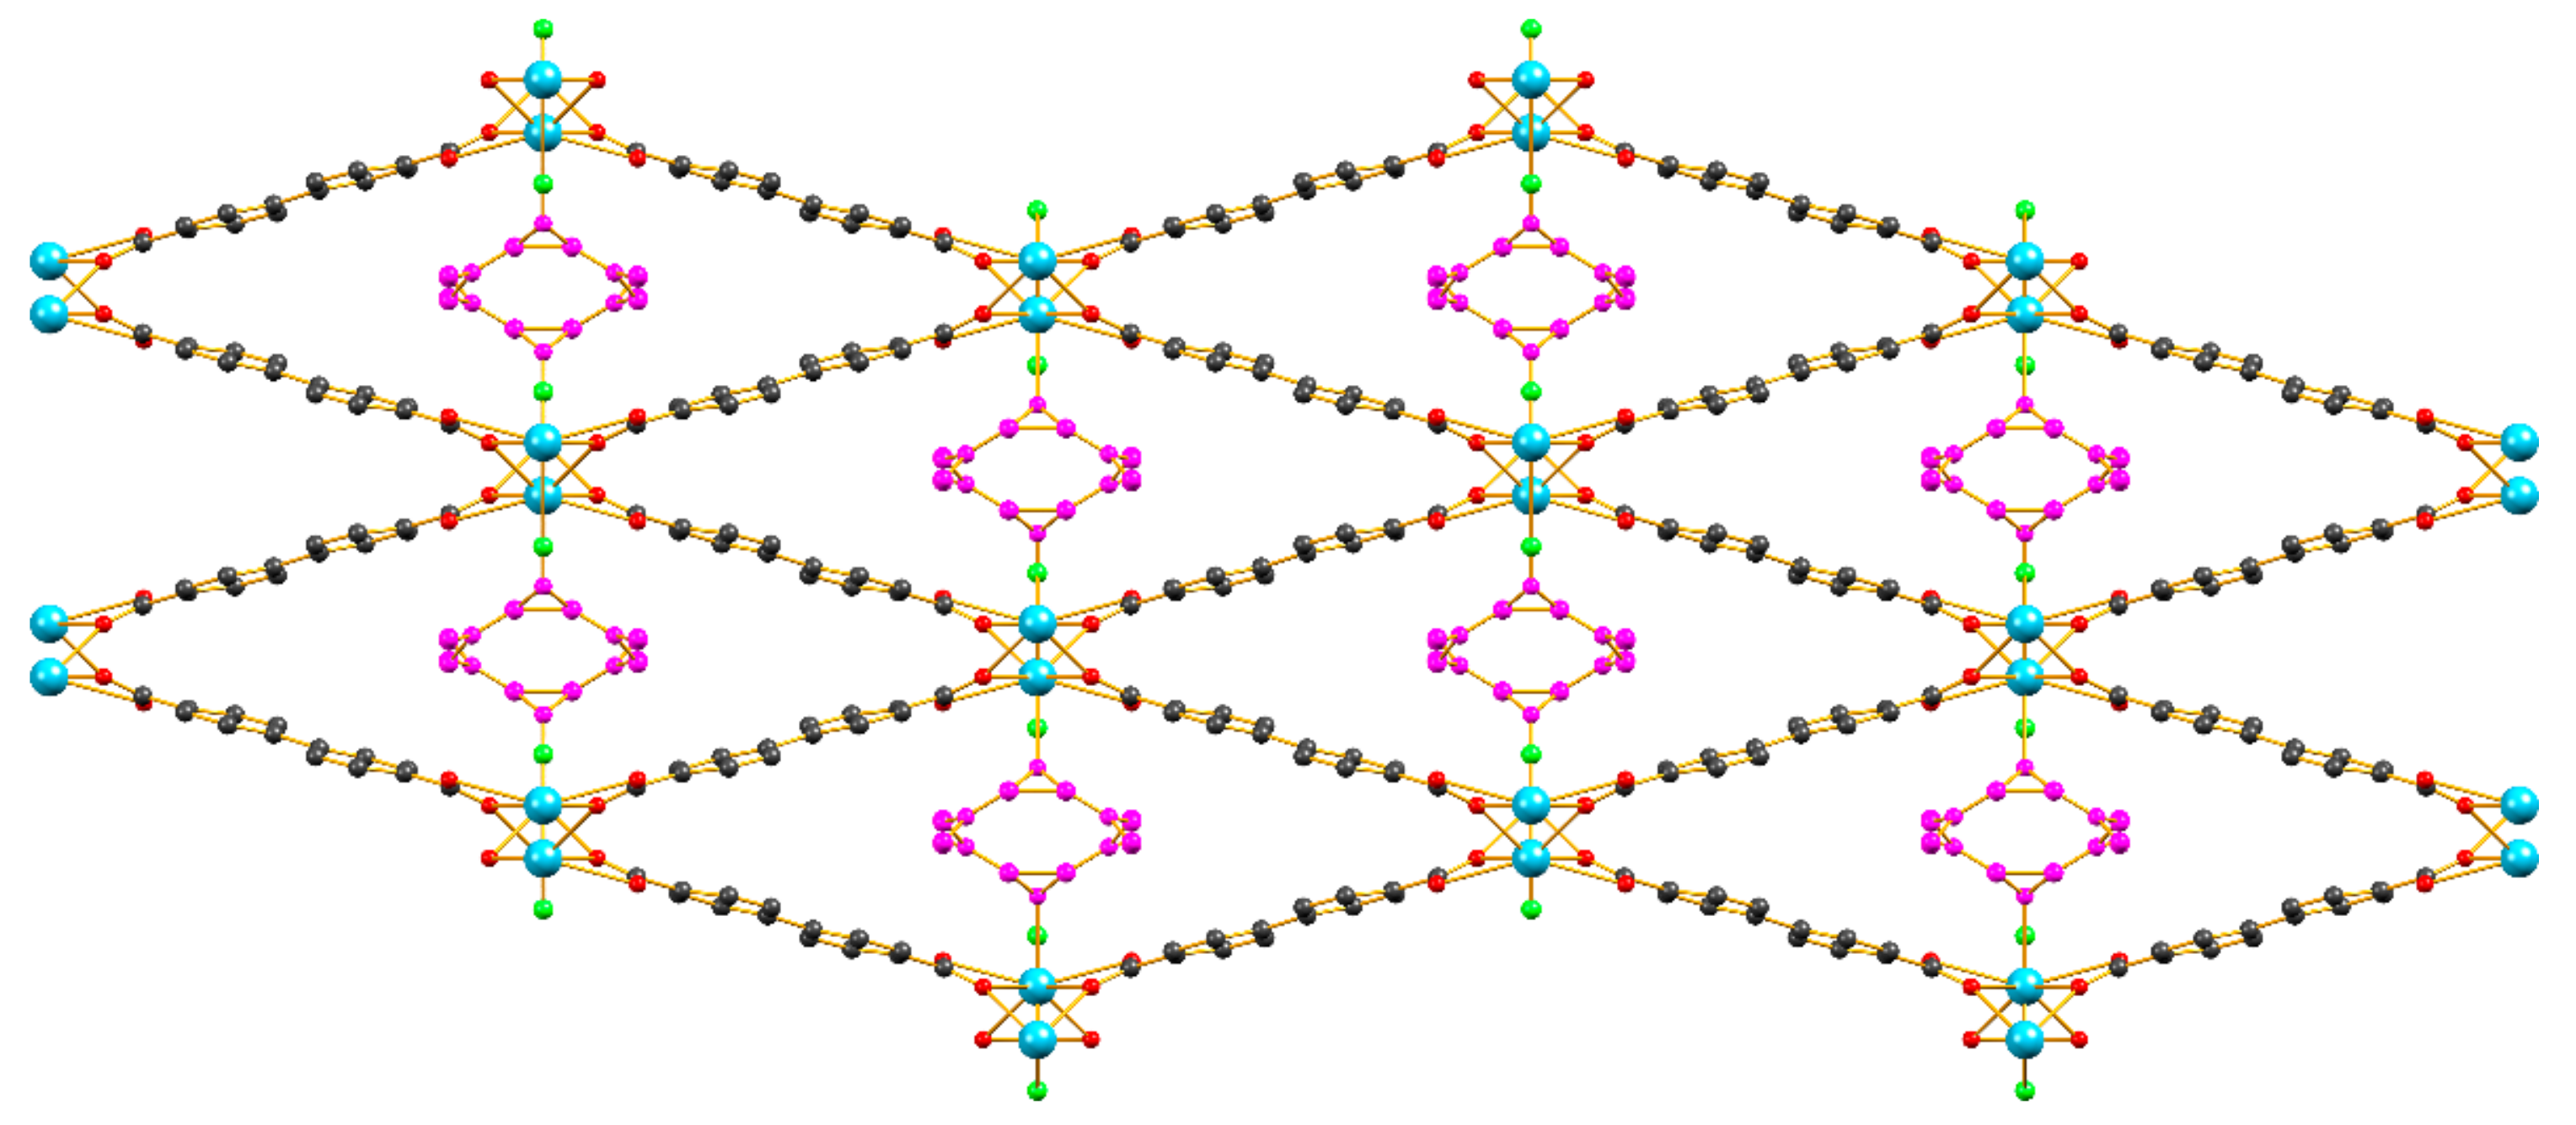
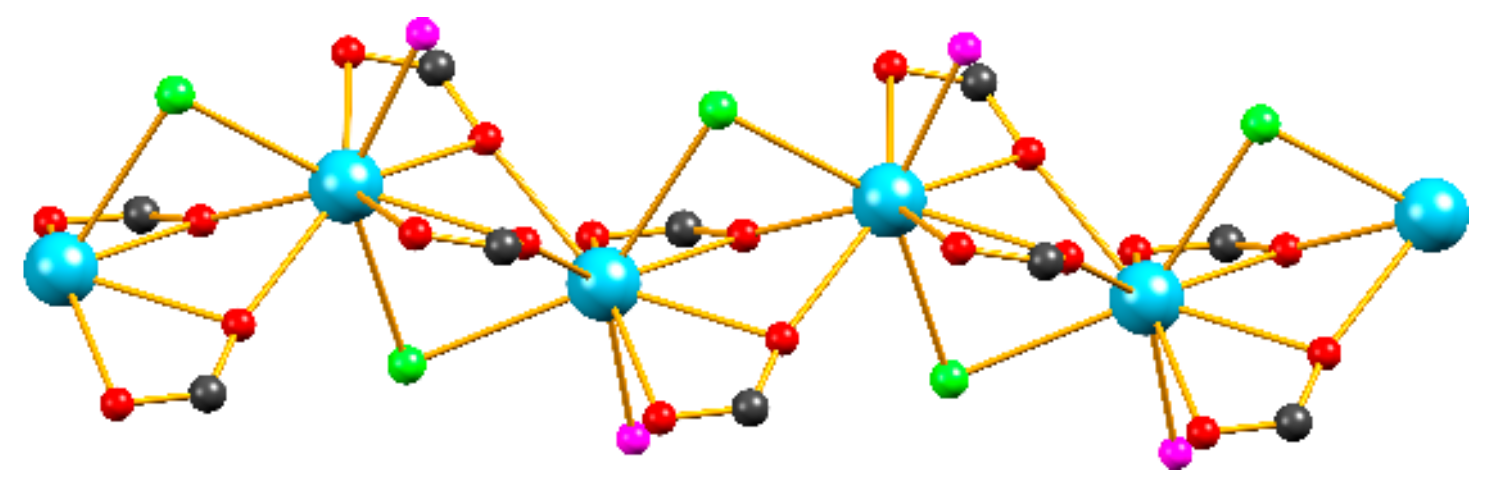
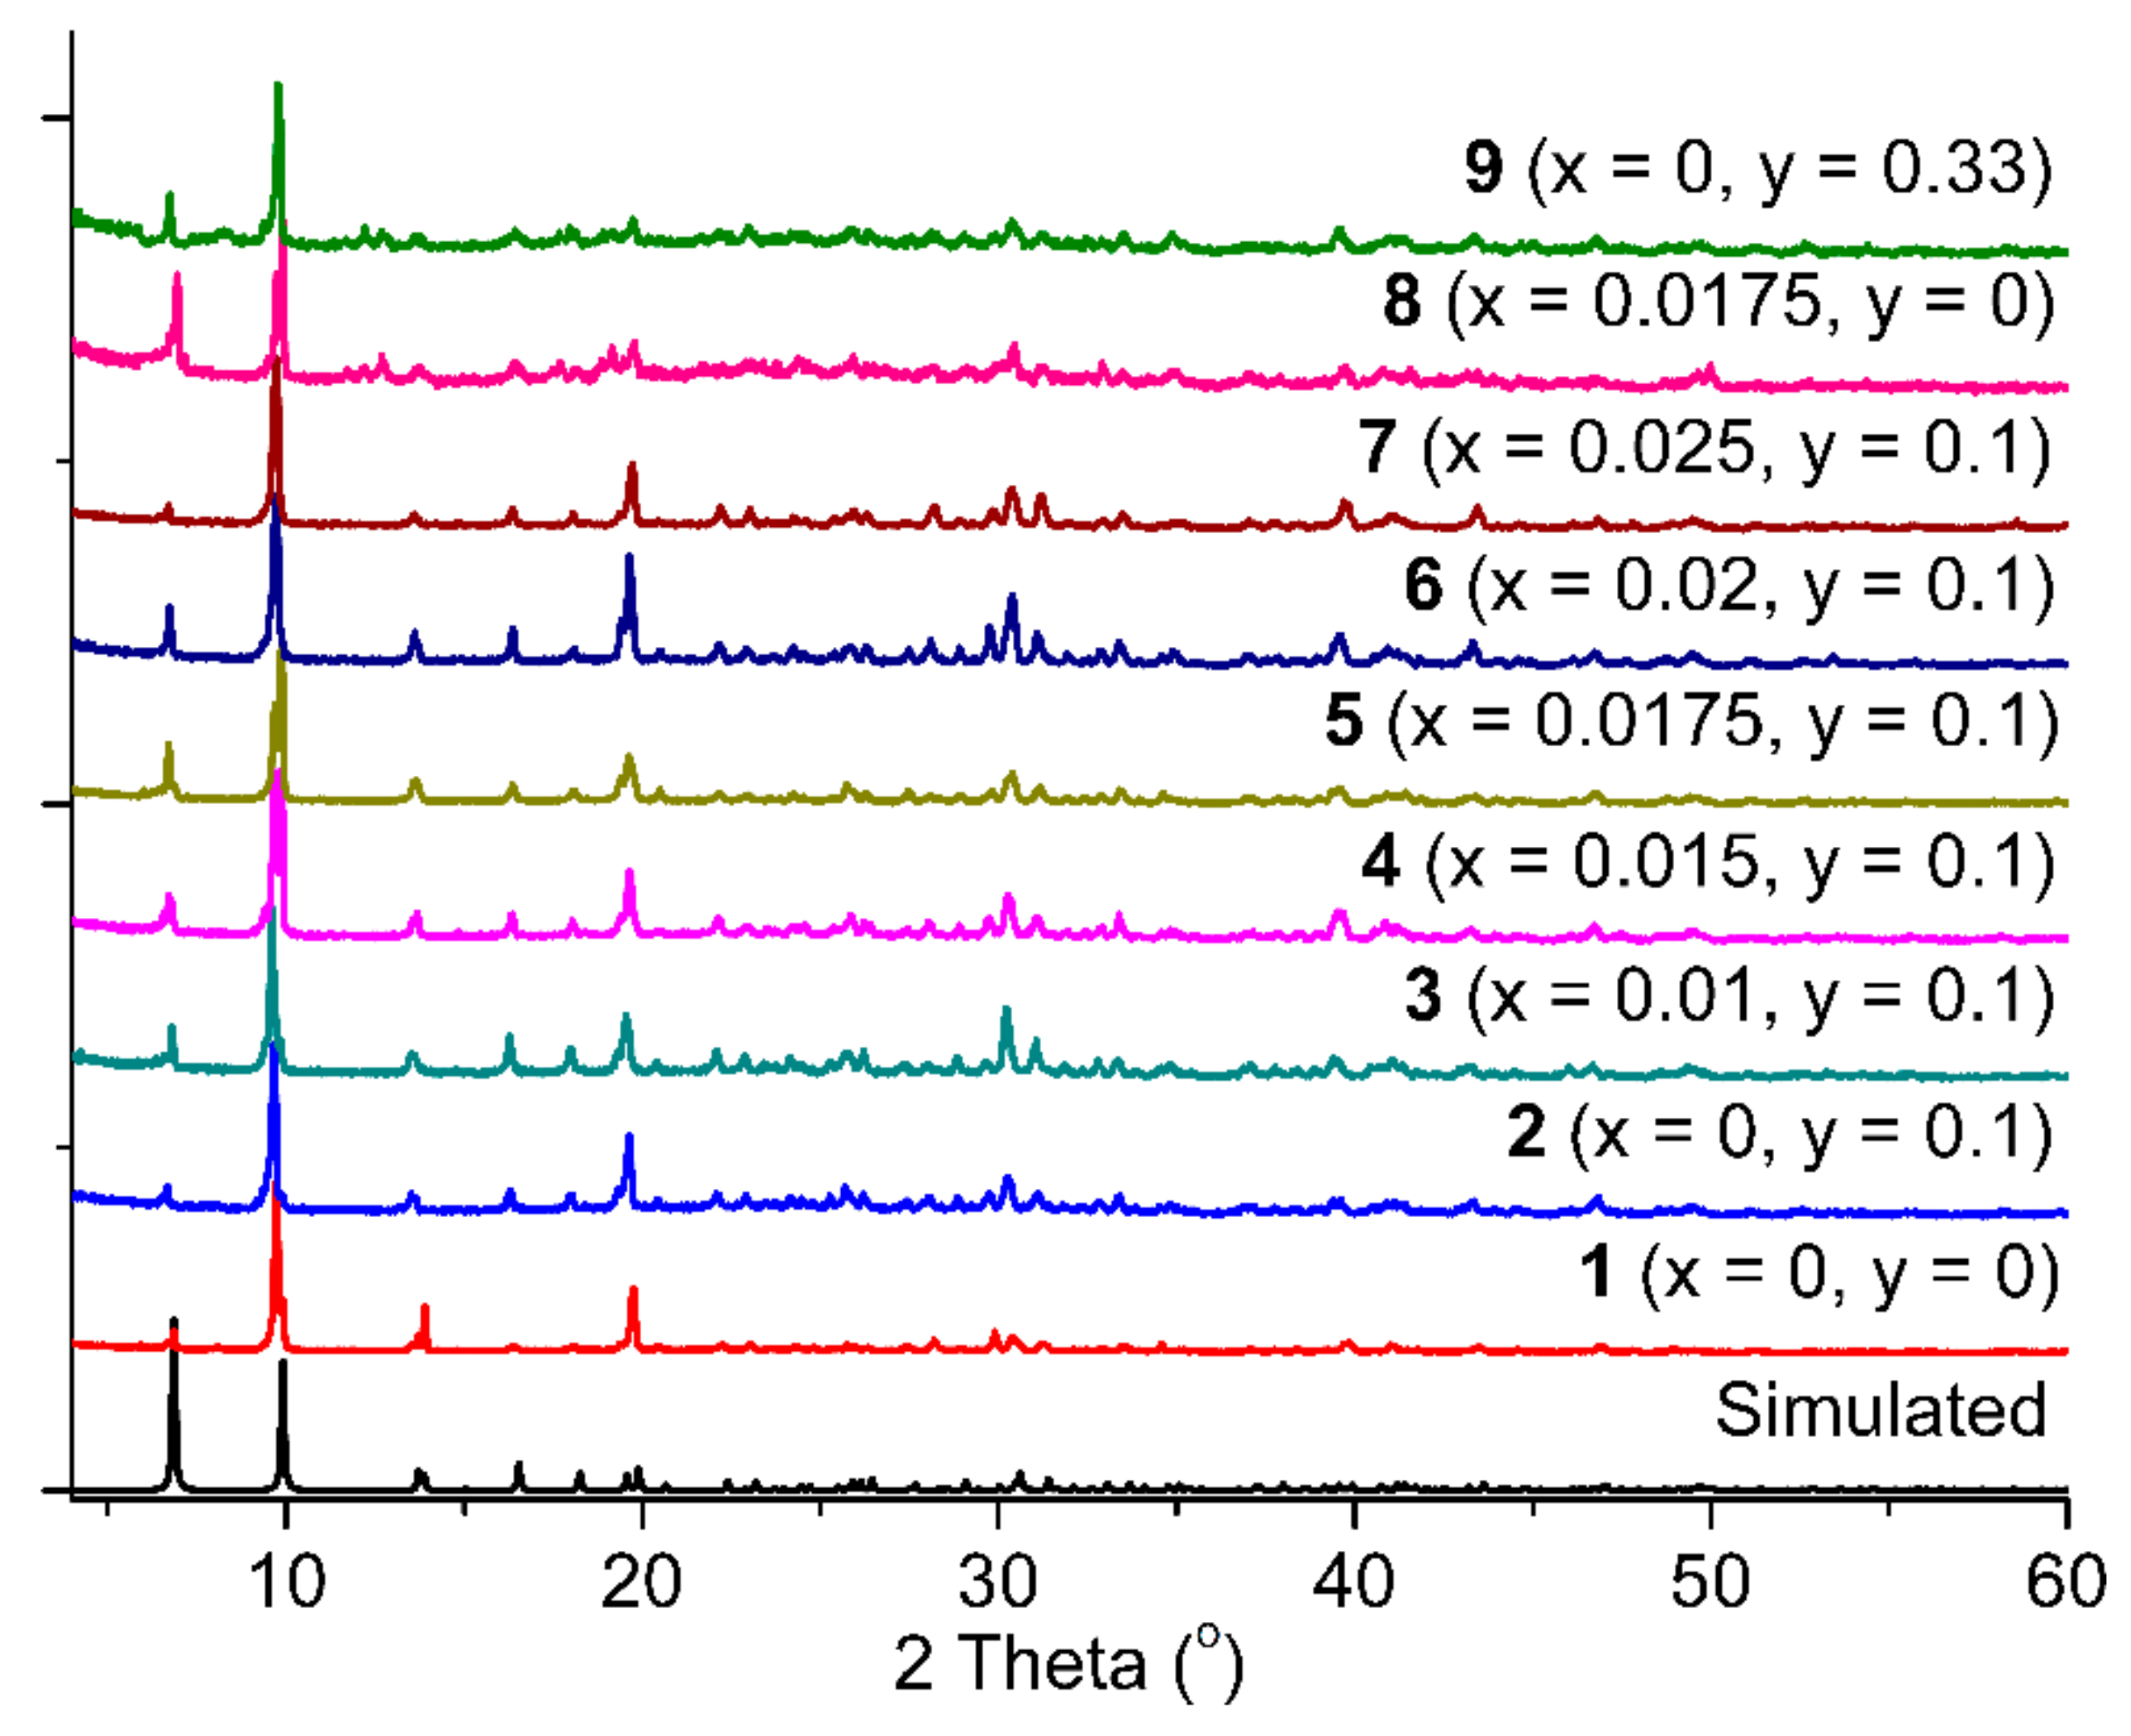
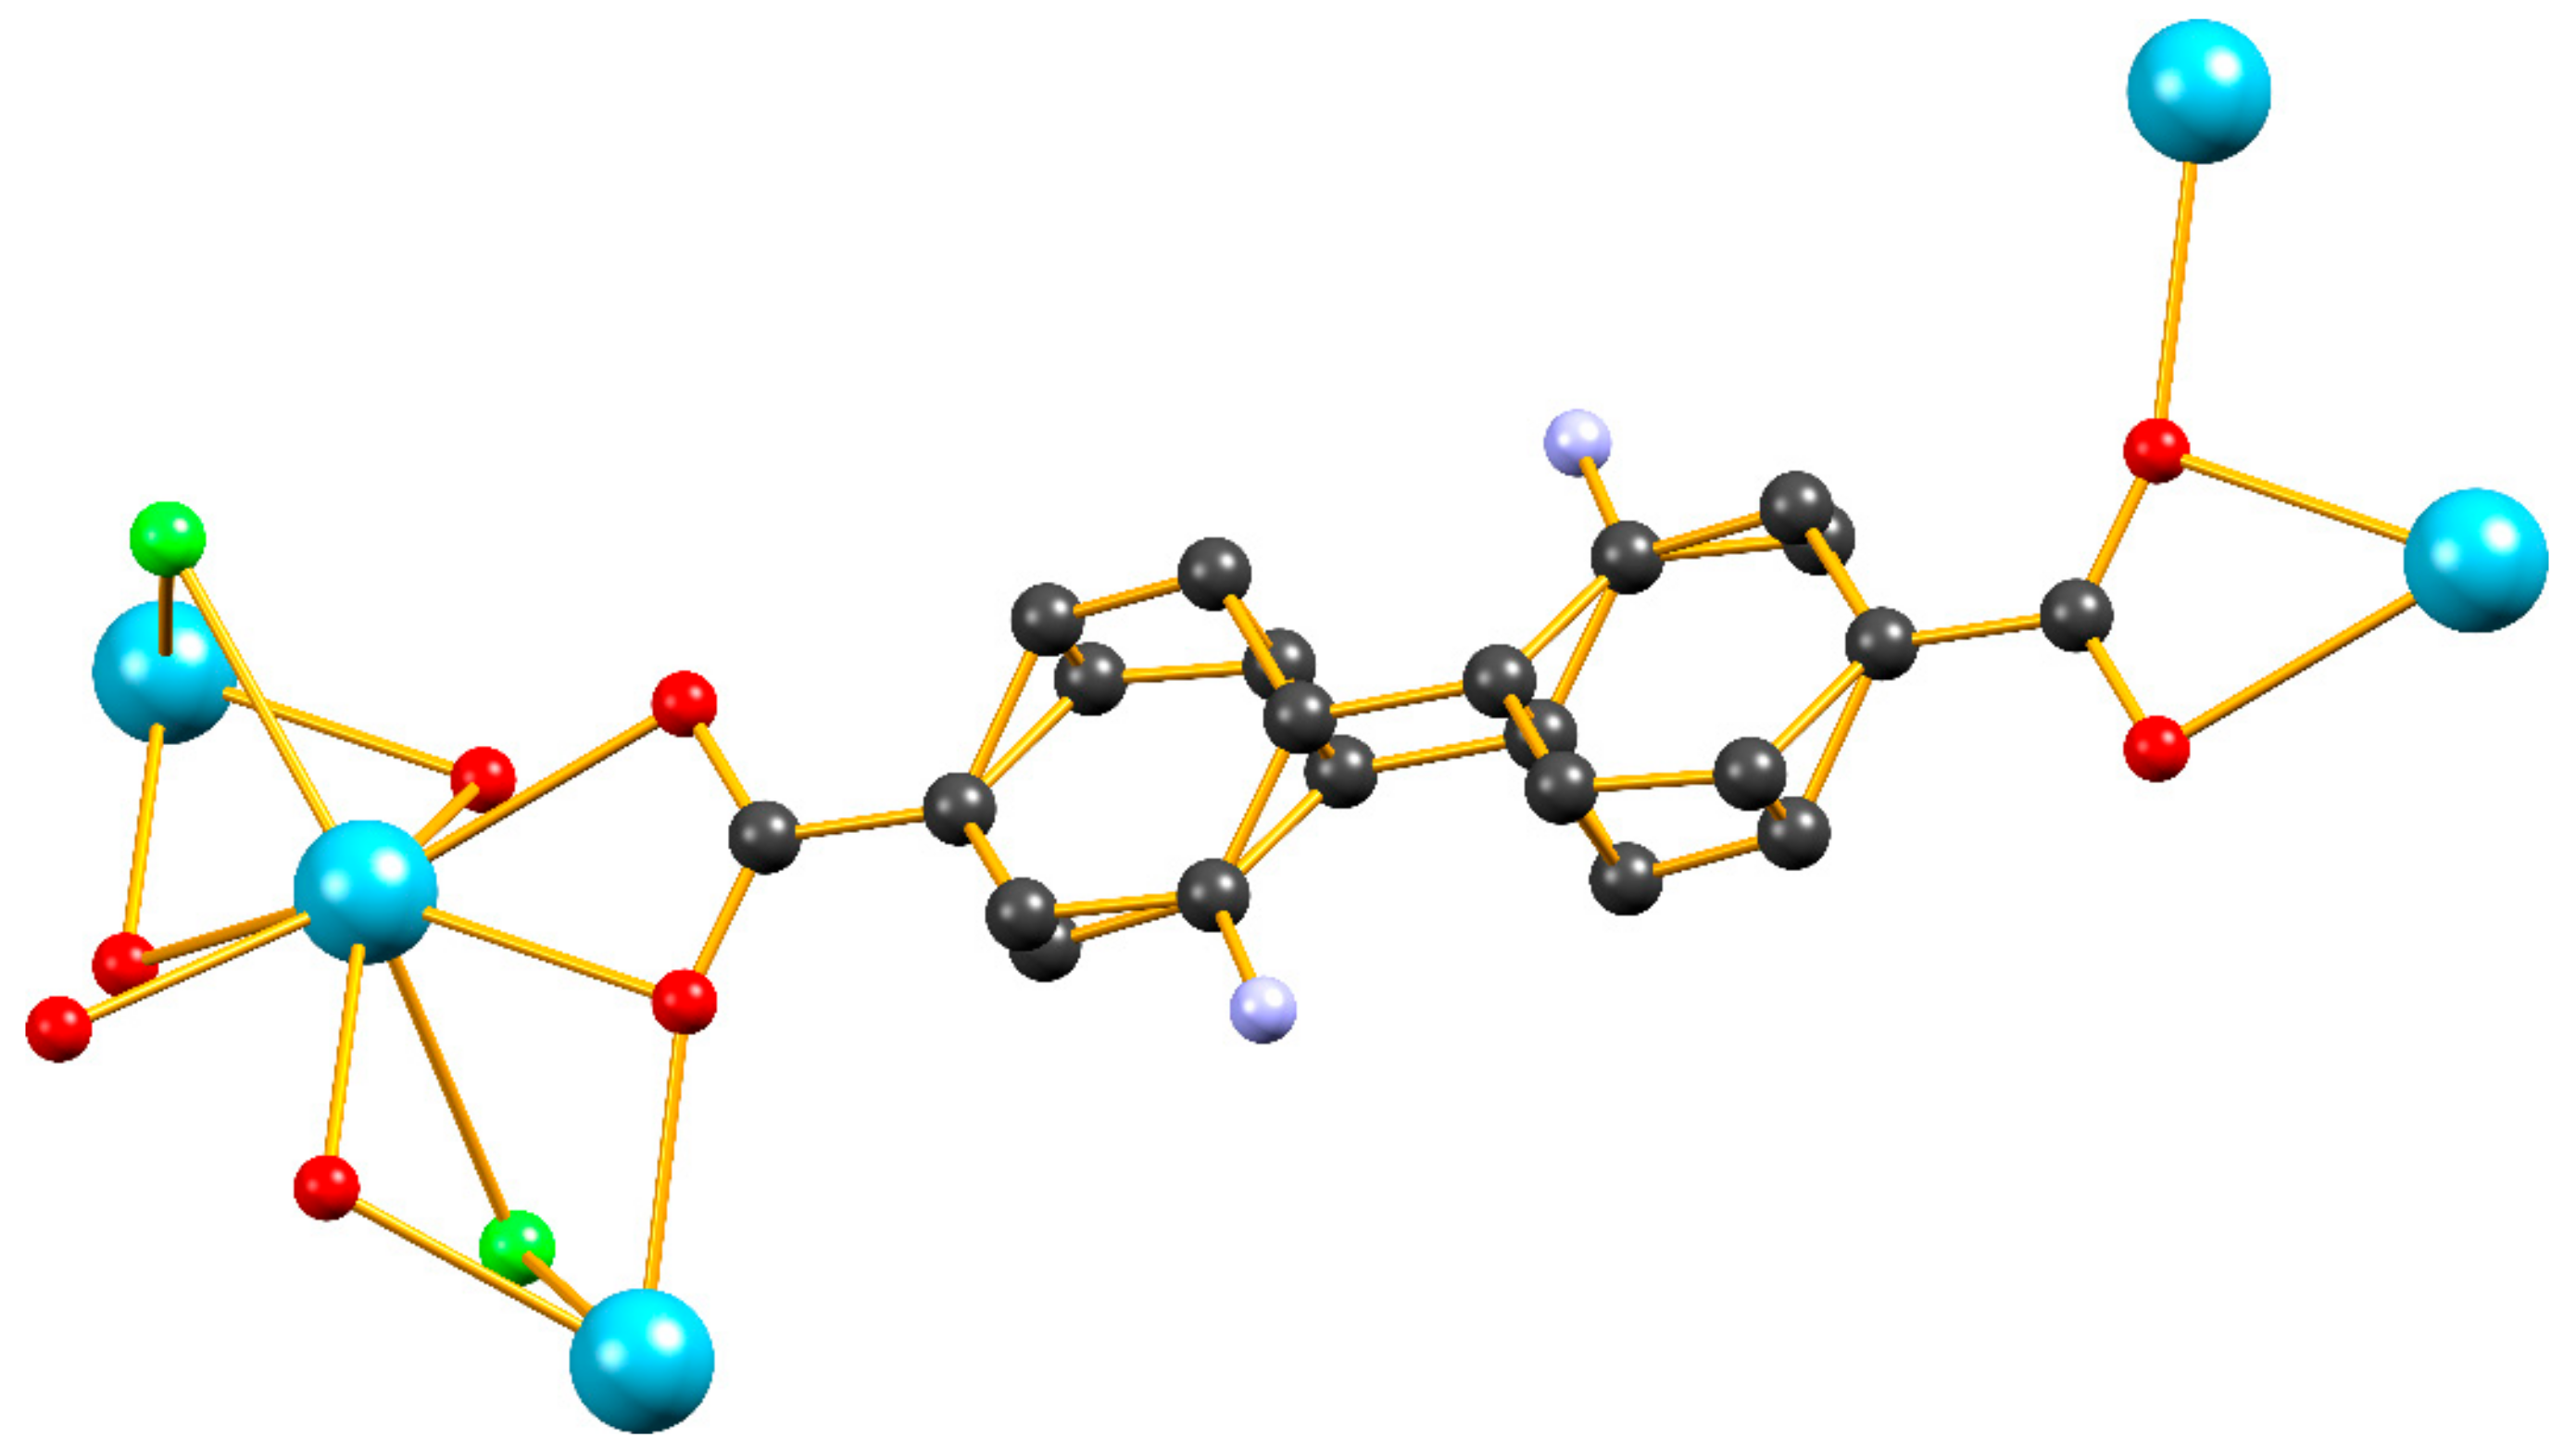
2.1. Synthesis and Structural Studies

The reaction of the bridging ligand H2bpdc with LaCl3·xH2O in a 1:1 molar ratio in DMF at 110 °C, afforded a crystalline product 1 with the formula [La(bpdc)Cl(DMF)] which is isostructural to the compound of the same formula reported by Hou et al. in 2013 [13]. Compound 1 crystallizes in the orthorombic Pnma space group and features one crystallographically unique lanthanum cation with a coordination number of nine while its coordination polyhedron can be best described as a tricapped trigonal prism. As seen in Figure 1, the structure of 1 features an infinite rod secondary building unit (SBU) consisting of a zig-zag chain of La3+ ions bridged by μ2 Cl anions and by μ221 carboxylate units. Each bridging ligand is connected to two different chains, thus forming a three-dimensional framework with rhombic channels along the crystallographic axis which are occupied by terminally coordinated DMF molecules displaying two-fold positional disorder around the crystallographic mirror plane. Selected bond lengths and bond angles for 1 are listed in Supplementary Table S1.
In agreement with the findings of Hou et al. [13], frameworks isostructural to 1 could only be obtained with early lanthanide ions such as La3+, Pr3+ and Nd3+ while our attempts to prepare a luminescent Eu3+ analog of 1 were met with failure. We therefore decided to follow the strategy of metal doping in order to introduce the luminescent Eu3+ ion within the framework of 1. Thus, a series of reactions in the presence 1–2.5 mol% of Eu3+ afforded crystalline products 29 which are isostructural to 1, as confirmed by powder X-ray diffraction (pxrd) studies (Figure 2). The Eu3+ doped materials displayed the characteristic red luminescence of the Eu3+ ion upon being illuminated with a standard laboratory UV lamp (vide infra) thus showing that Eu3+ is successfully incorporated within the parent structure. This observation encouraged us to attempt further doping of the parent framework with the intensely blue fluorescent diamino derivative the H2bpdc bridging ligand 2,2′-diamino-[1,1′-biphenyl]-4,4′-dicarboxylic acid (H2dabpdc). Indeed, we found that the presence of up to 33 mol% of H2dabpdc in the initial reaction mixture leads to crystalline products which are isostructural to 1 (Figure 2). In order to gain better insight on the degree of incorporation of dabpdc2− within the parent framework of 1, we subjected a sample of 2 (0 mol% Eu3+ and 10 mol% of H2dabpdc in the reaction feed) to 1H-NMR analysis after it was digested in a mixture of D2O/NaOH. From the ratio of the peak integrals corresponding to bpdc2− and dabpdc2− (Supplementary Figure S1), we calculated a molar fraction of 12% of dabpdc2− within 2 which is close to the molar percentage of dabpdc2− present in the reaction feed. This finding suggests that, in the employed experimental conditions, dabpdc2− is similar to bpdc2− in terms of reactivity towards La3+ and at least relatively low percentages of dabpdc2− in the reaction feed result in a statistical distribution of the amino substituted bridging ligand within the product.
In addition to the 1H-NMR study, we carried out single crystal X-ray structural analysis on a sample of 9 (0 mol% Eu3+ and 33 mol% of H2dabpdc in the reaction feed). Crystal and refinement data can be found in Supplementary Table S2. The overall structure of 9 is virtually identical to that of 1 with the difference that the bridging ligand shows significantly greater disorder and had to be refined in two positions (Figure 3). We were also able to locate one of the two nitrogen atoms of dabpdc2− which refined well with a given site occupancy of ca. 17%. In addition, several constraints were applied in order to keep the C–N distance and the angles around the C–N bond within chemically acceptable values. The disorder of the bridging ligand in 9 is possibly a result of the different conformations adopted by bpdc2− and dabpdc2−. In the parent compound 1, the bpdc2− ligand adopts a conformation where the two phenylene groups of the biphenyl spacer are virtually co-planar [13] a feature that is commonly found in structures containing the bpdc2− ligand [18,19,20,21,22,23,24,25,26] while, as observed by us [27] and others [28], the dabpdc2− bridging ligand tends to adopt a staggered syn conformation where the dihedral angle between the two phenylene groups is in the order of 60–70o. It is therefore reasonable to expect that the presence of about one third dabpdc2− at the sites normally occupied by bpdc2− in the parent framework would induce some additional disorder to the diphenylene spacer. Consequently the 1H-NMR and crystallographic data indicate that even though the dabpdc2− moiety seems to have slightly different stereochemical demands than the bpdc2− ligand of the parent framework, its incorporation does not induce a big distortion to the overall structure.

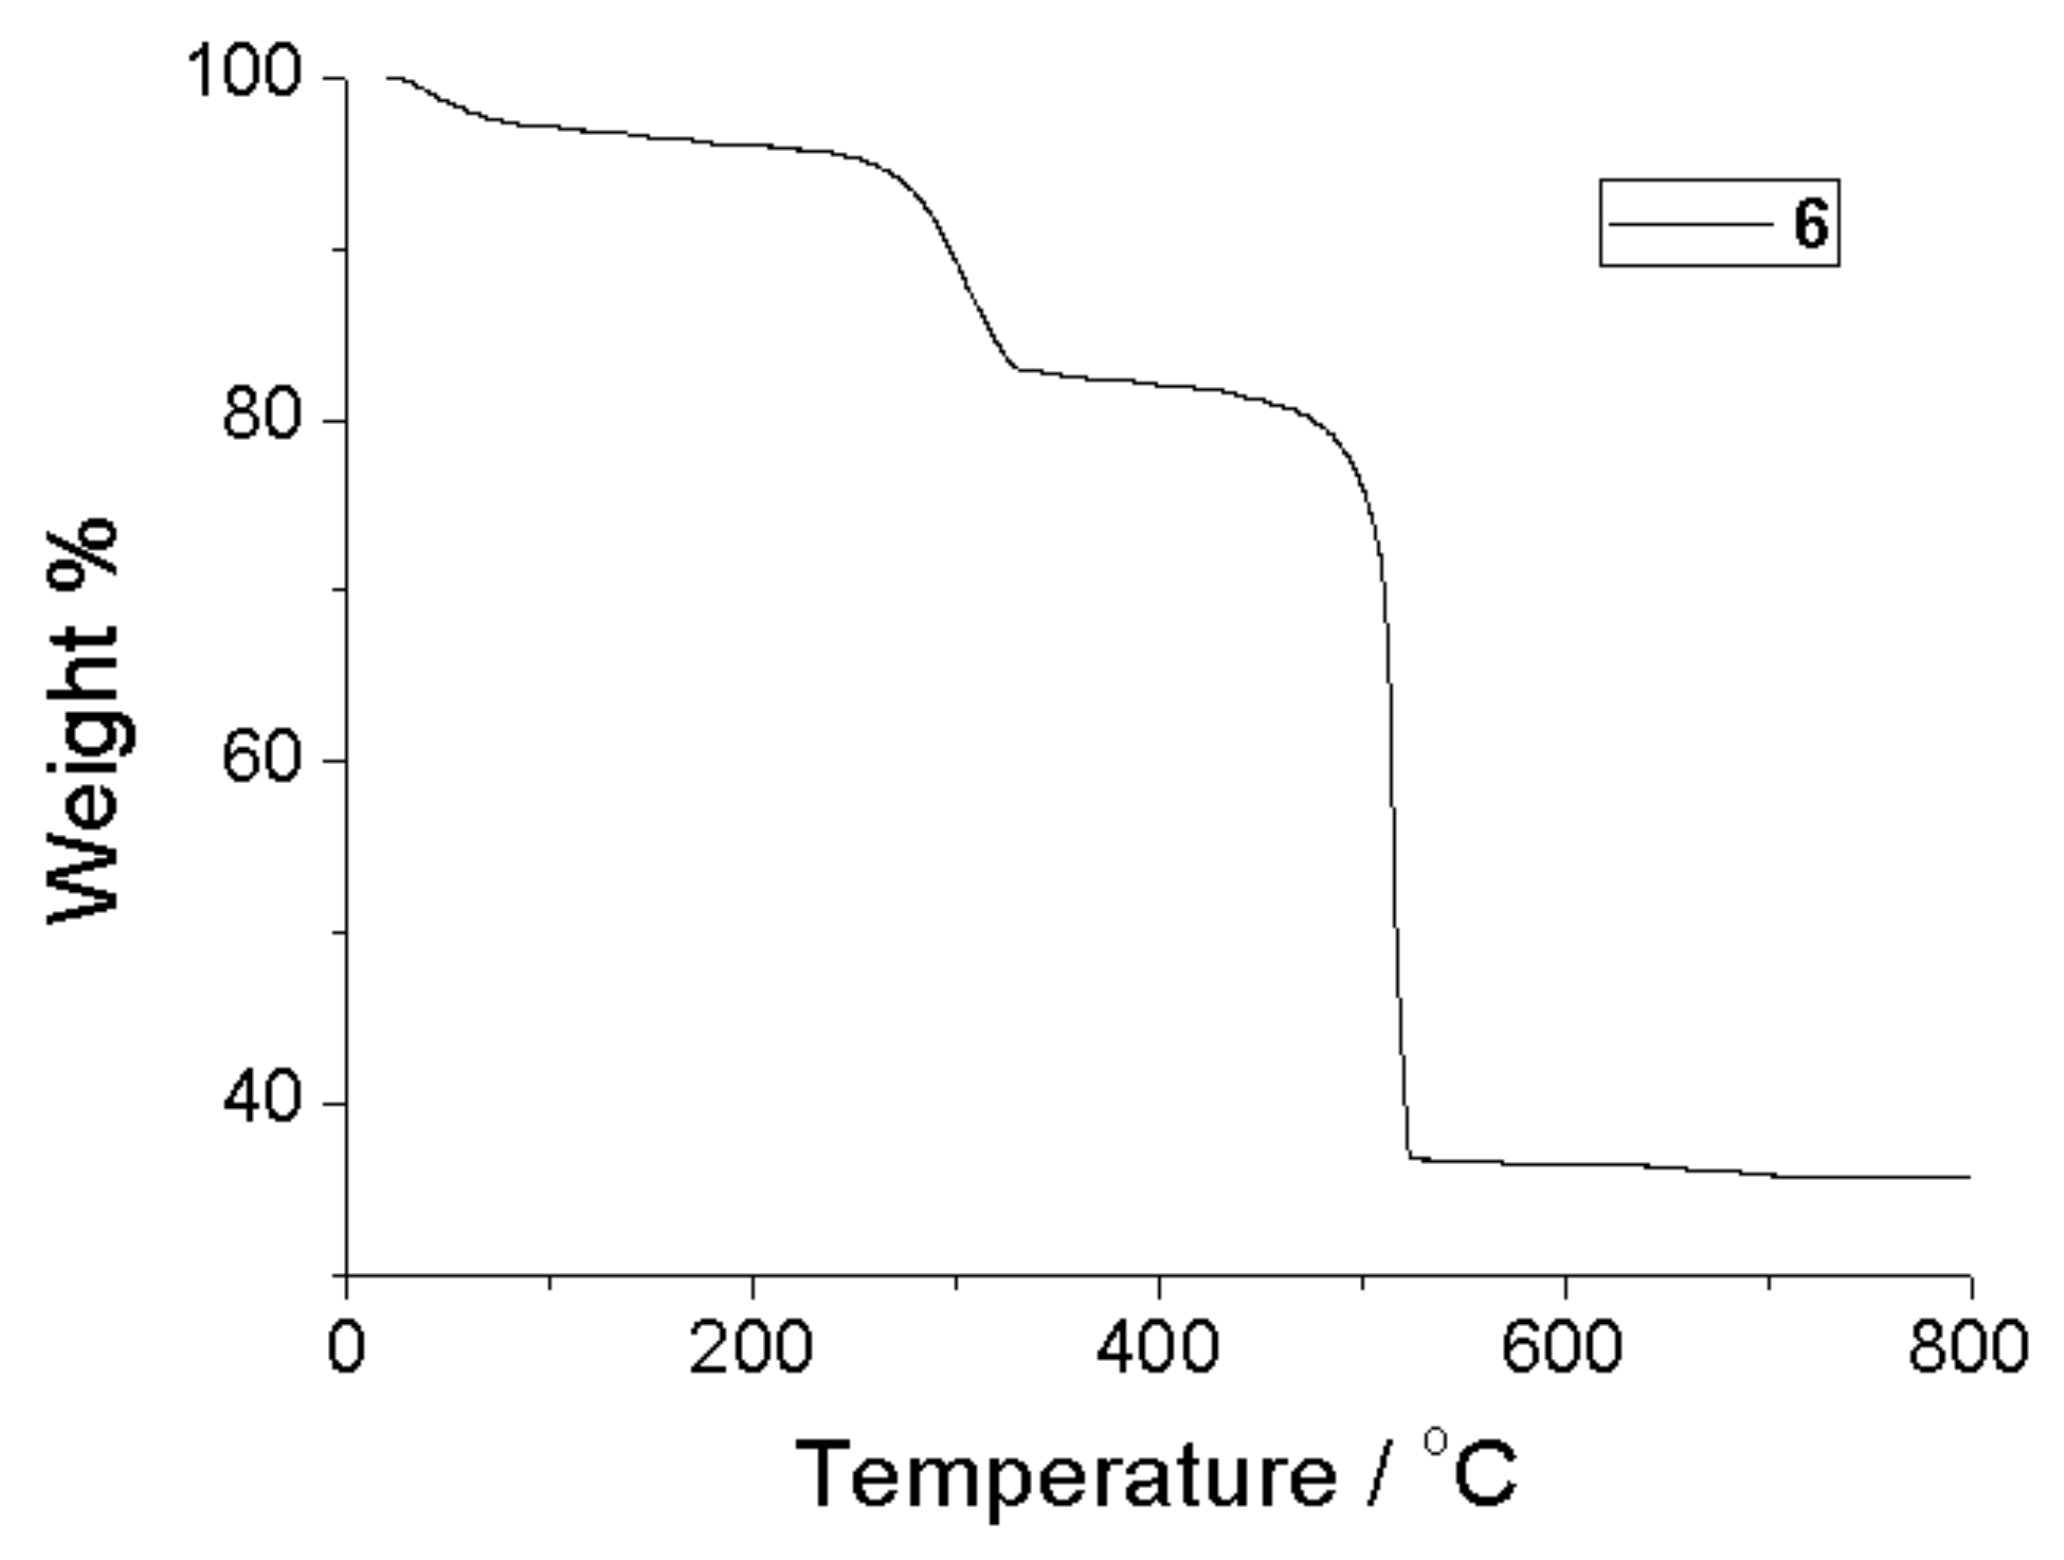
2.2. Thermogravimetric Analysis

The thermal stability of 1, 2 and 6 was studied by thermogravimetric analysis (TGA) under air (see Supplementary Figures S2 and S3). All the analogues show essentially identical behavior and for this reason only the thermograph of 6 (Figure 4) shall be discussed. In particular, the weight loss in 6 was observed in two steps. The first step is observed in the temperature range 240–330 °C and the corresponding weight loss is attributed to the coordinated DMF molecules (experimental loss: 16.83%, theoretically estimated loss of 14.9%). The framework remains thermally stable up to ~500 °C and then the second mass loss step appears, corresponding to the decomposition of the framework, which is completed up to ~525 °C.

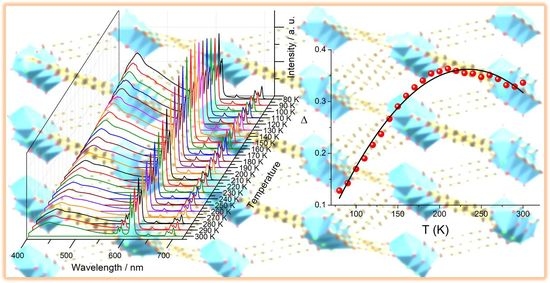
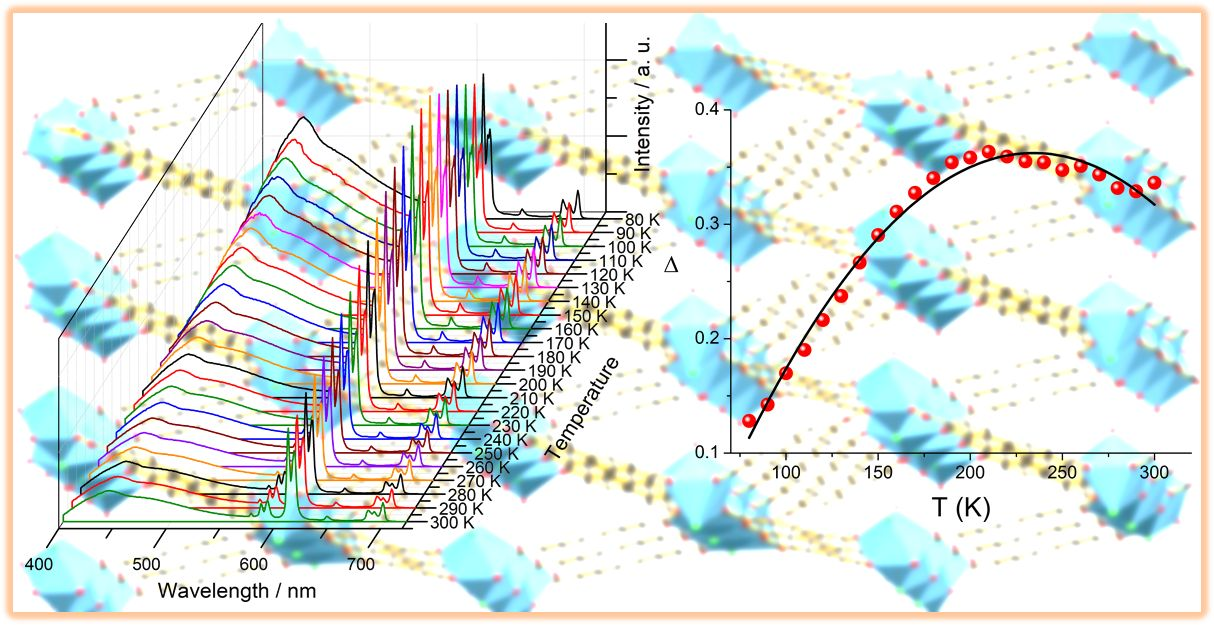
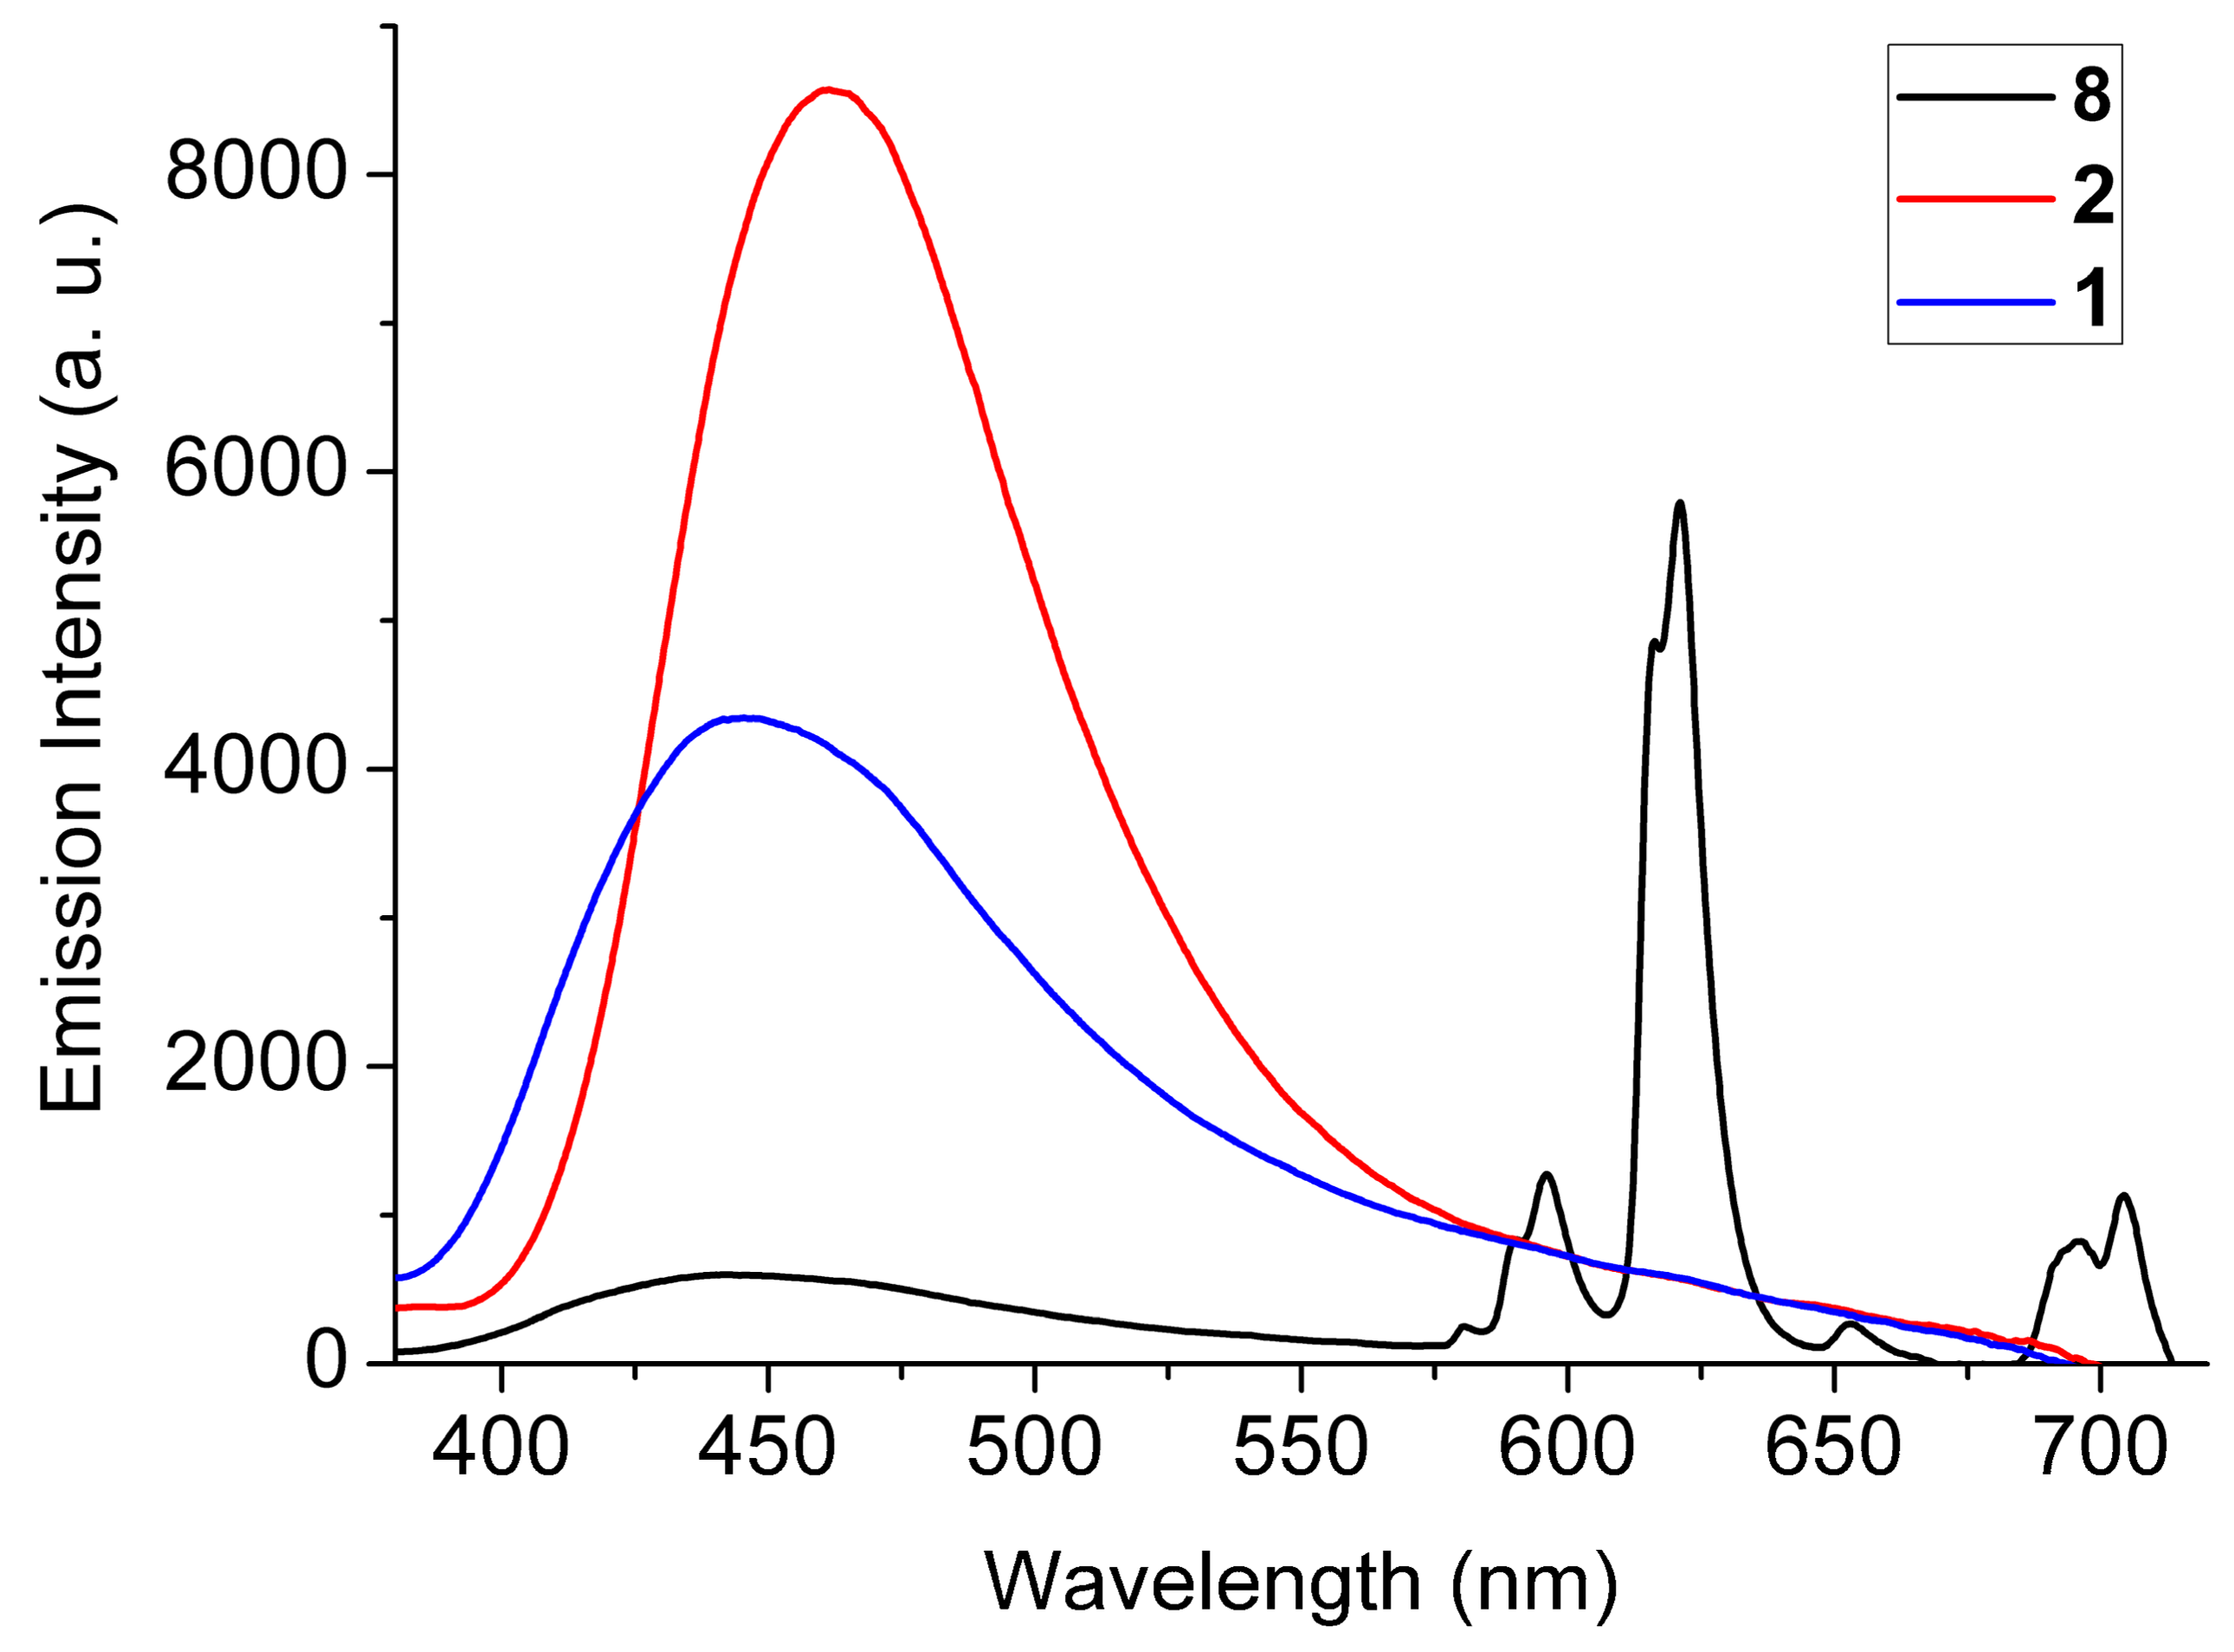
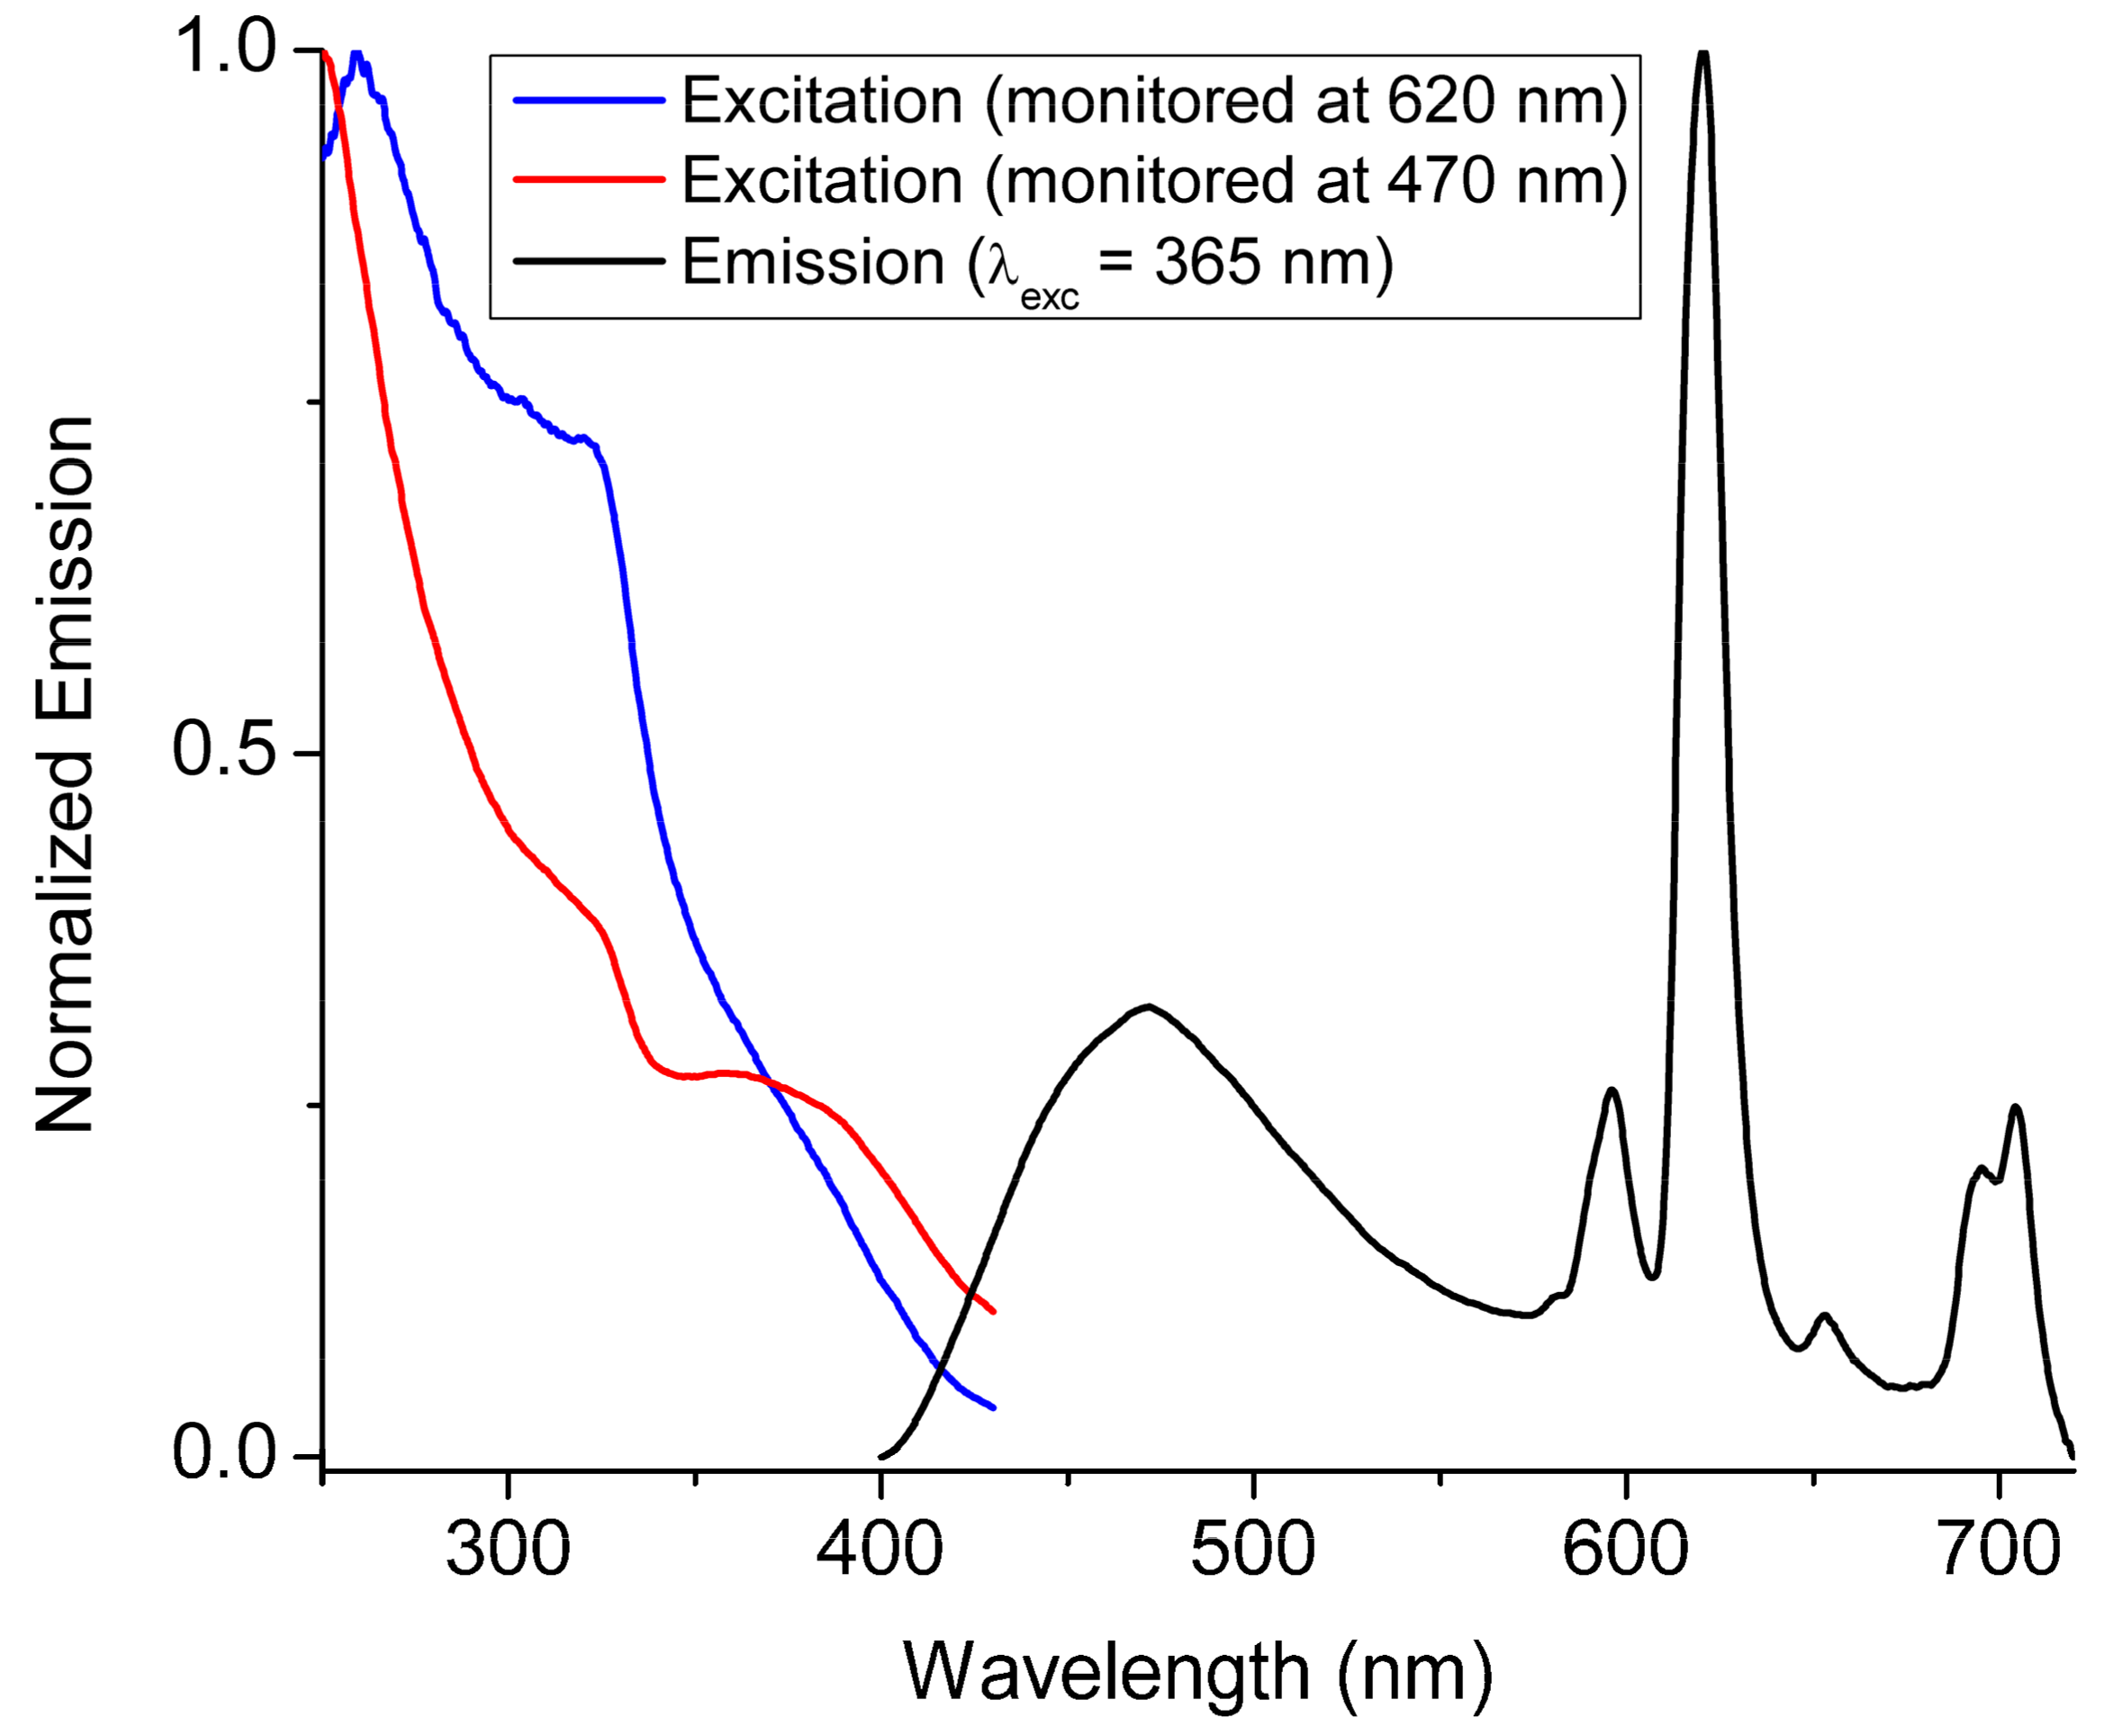
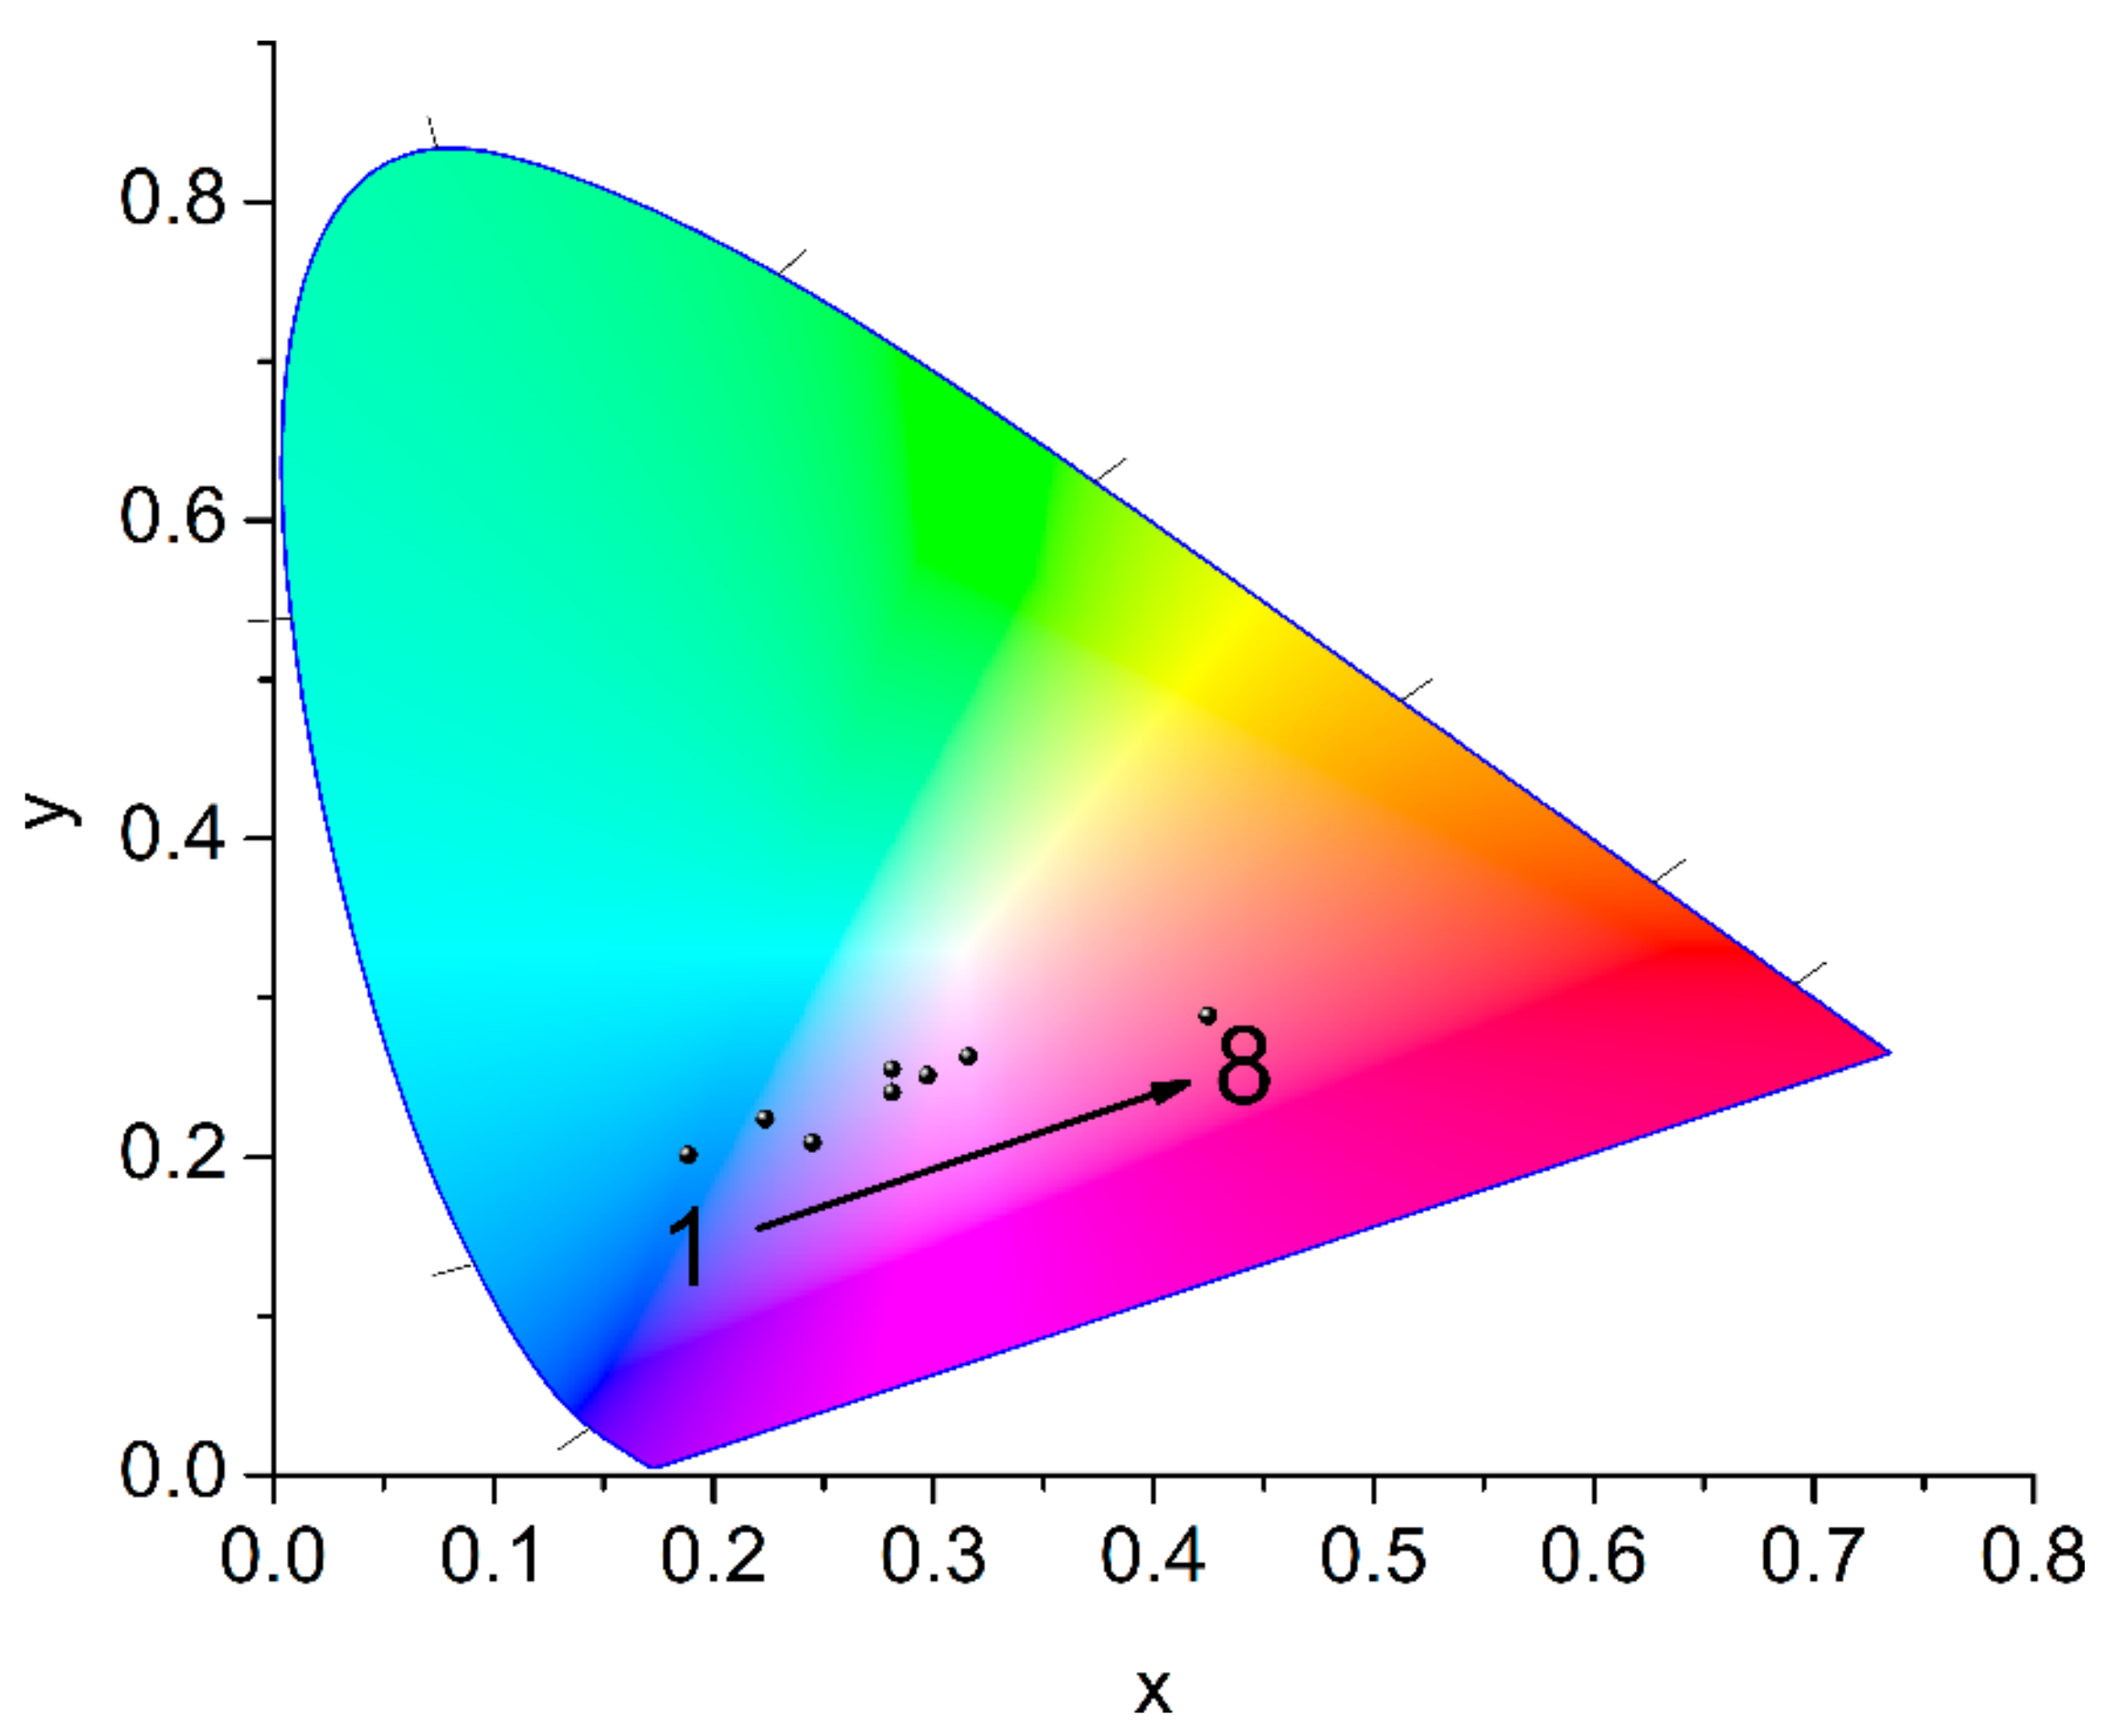
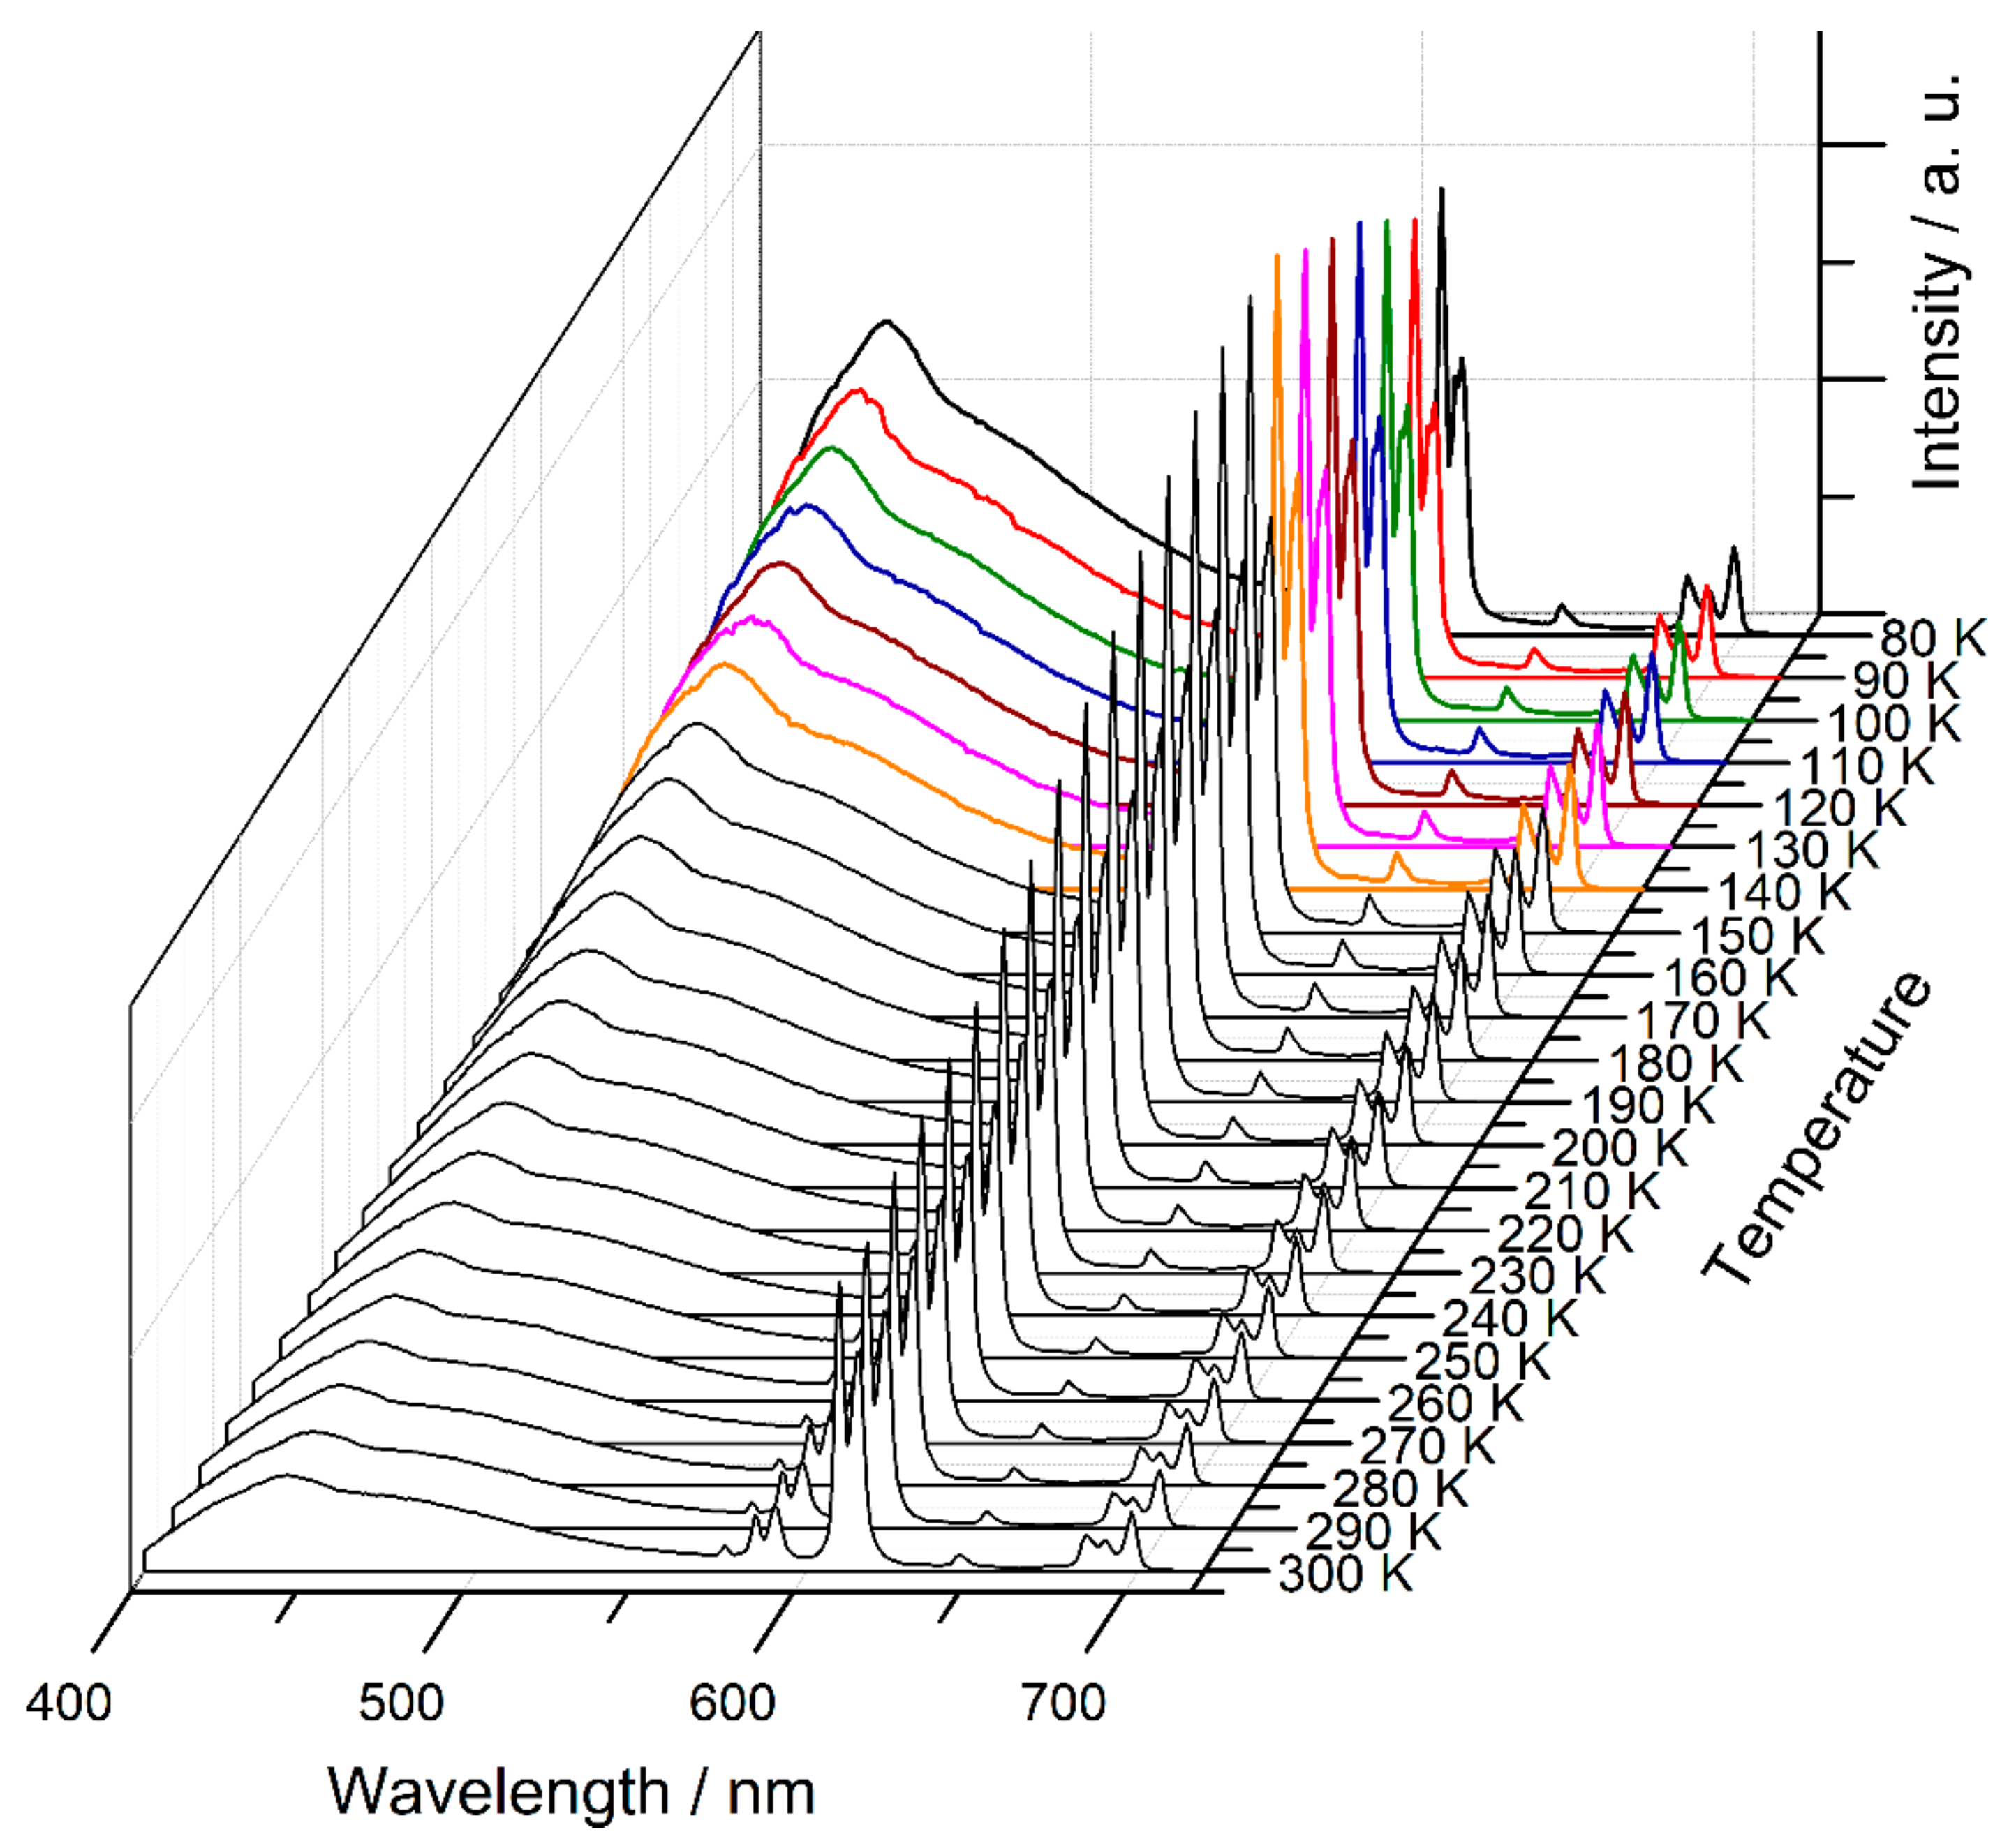
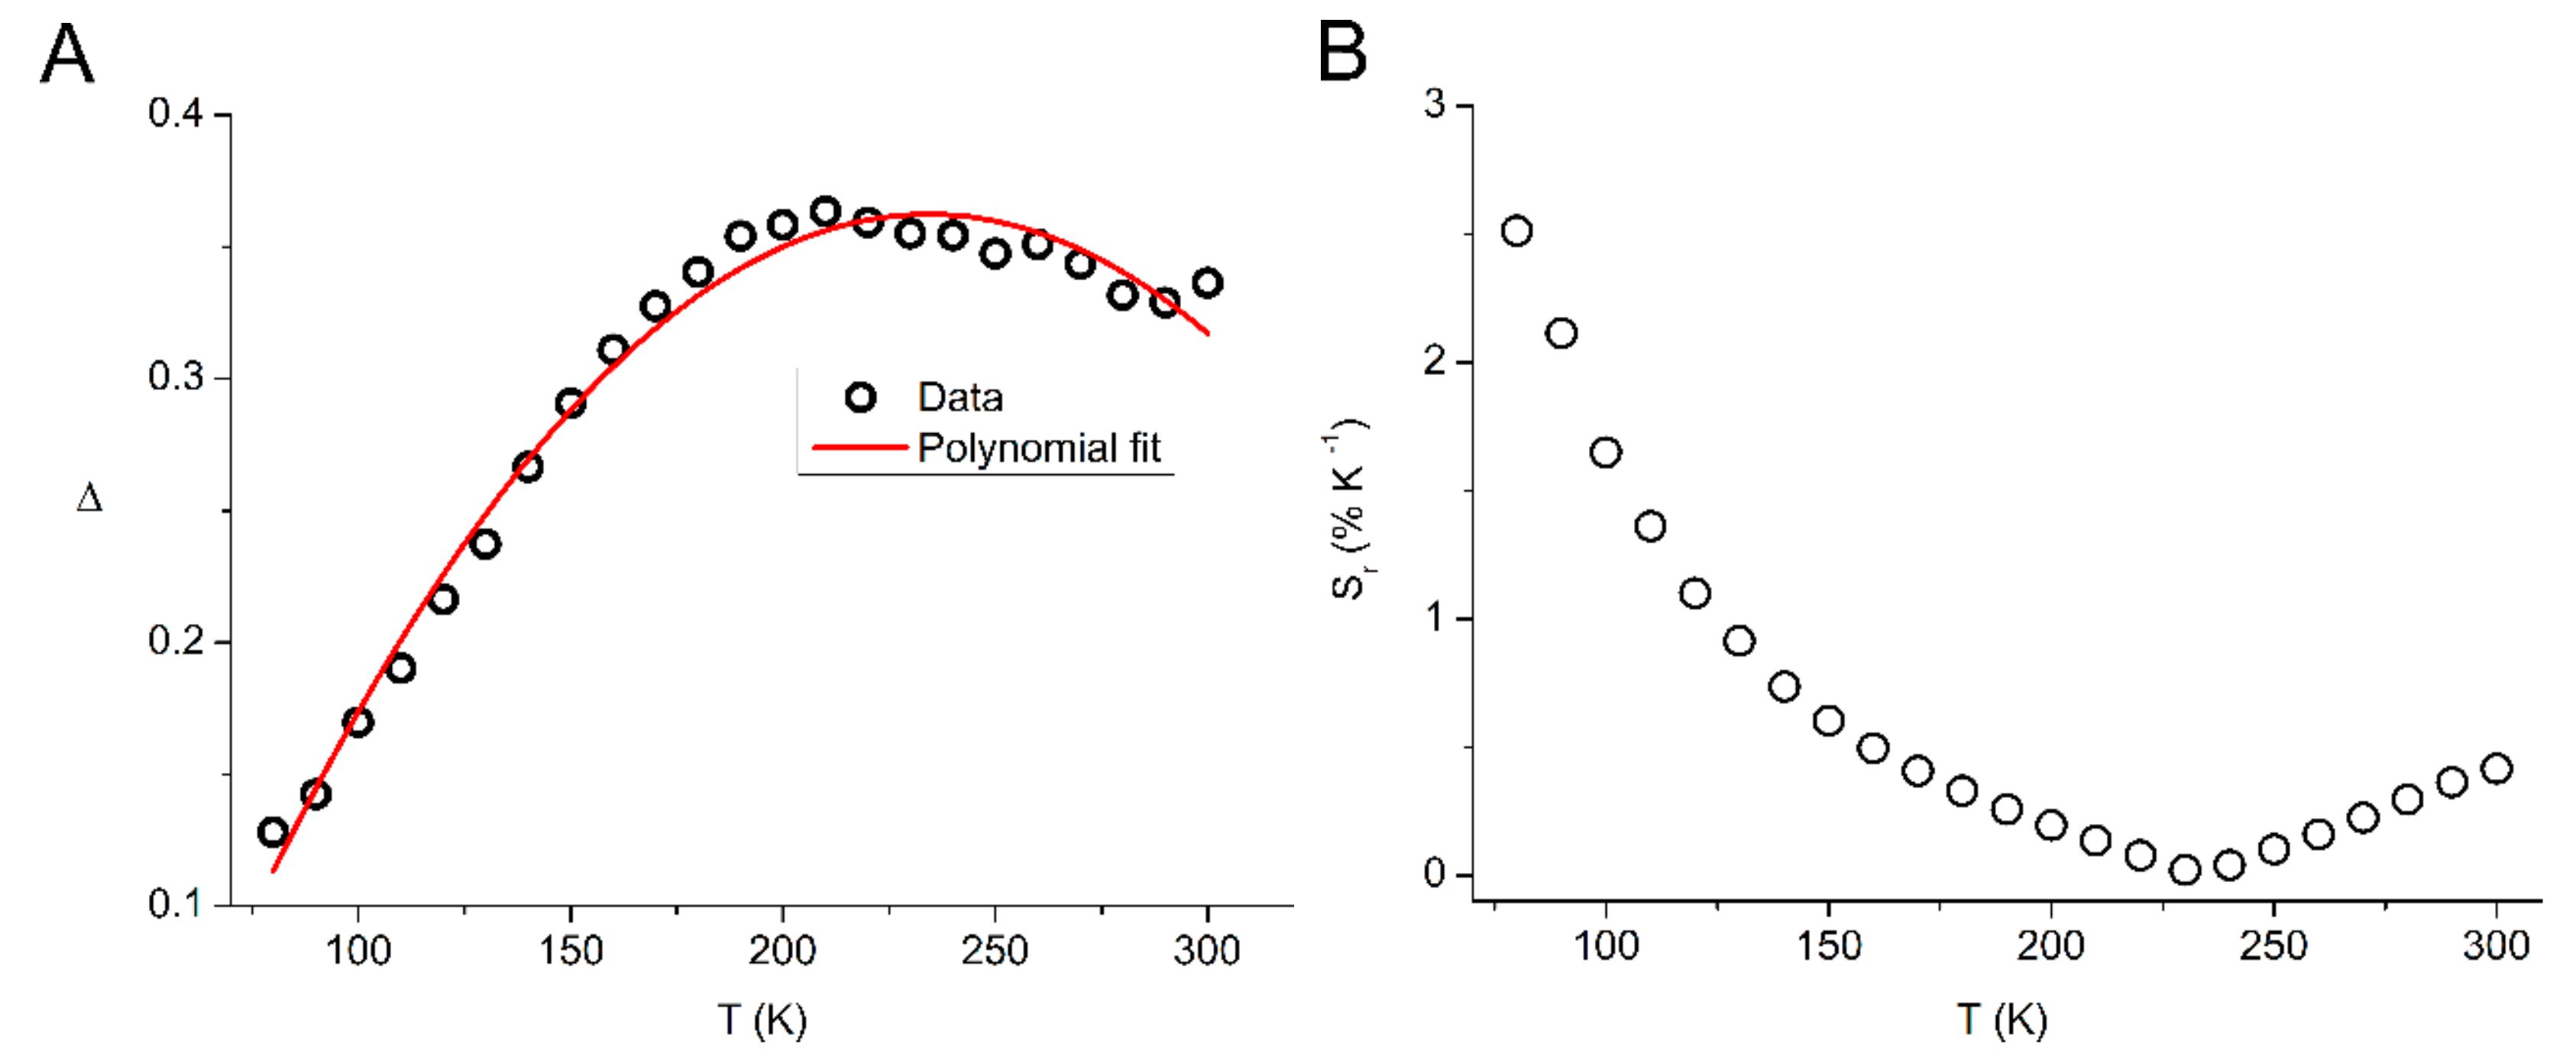
2.3. Luminescence Properties

Photophysical studies on microcrystalline powders of the parent framework 1 and its metal and ligand doped counterparts were carried out by emission spectroscopy. Excitation of compound 1 at λexc = 365 nm gives rise to a fluorescence band with maximum at ca. 440 nm (Figure 5), which is attributed to the radiative deactivation of the lowest energy 1π-π* excited state of the bpdc2− bridging ligand [13,14]. The excitation spectrum of 1 (monitored at 450 nm) shows that the lowest energy absorption feature is at 375 nm and tails off rapidly after 400 nm, thereby showing virtually no absorption in the visible region (Figure 5). When the parent framework of 1 is doped 10 mol% with the diamino derivative dabpdc2− (2), a rather small red shift in the fluorescence peak which maximizes at ca. 463 nm was observed. Based on a comparison with our previous work on the fluorescence properties of Ca2+ and Sr2+ MOFs featuring (NH2)2bpdc2− as bridging ligand, we attribute the red shifted emission signal of 2 predominantly to the fluorescence from the dabpdc2− chromophore [27]. From the onsets of the emission peaks of the two chromophores in 1 and 2 the energies of the lowest lying 1π-π* of excited states of bpdc2− and dabpdc2− were estimated at ca. 25,000 and 23,500 cm−1 respectively [29]. It therefore follows that initial excitation of predominantly the bpdc2− moiety of 2 (mainly due to its much higher abundance within the material’s framework) is followed by energy transfer to the dabpdc2− chromophore most possibly through a mechanism involving exciton diffusion to a position adjacent to a dabpdc2− group and subsequent coulombic (Förster) energy transfer to the latter [30,31,32,33,34]. It is important to mention that the emission profiles of samples doped with significantly larger percentages of dabpdc2− (such as sample 9) are virtually identical to that of 2, thus confirming that in the latter material interchromophore energy transfer reaches its maximum efficiency.
The emission spectrum of compound 8 (λexc = 365 nm), where the parent framework of 1 is doped only with 1.75 mol% Eu3+, is dominated by the Eu3+-based 5D07FJ (J = 0–4) emission peaks which are located at 580, 596, 620, 654 and 704 nm respectively. On the high energy region of the spectrum, we observe the relatively weak residual emission of the bpdc2− bridging ligand which maximizes at ca. 440 nm indicating that, even at this relatively low doping level of 1.75 mol%, ligand-to-Eu3+ energy transfer is quite efficient [1,35]. The fact that the bpdc2− bridging ligand is a good sensitizer for both dabpdc2− and Eu3+ prompted us to synthesize and study frameworks where both energy acceptors are present within the parent framework of 1.
In the case of 6, where both dabpdc2− and Eu3+ are doped into the parent framework of 1, excitation at 365 nm results in emission from both the amino substituted organic chromophore and the luminescent lanthanide ion (Figure 6). The maxima of the 5D07FJ (J = 0−4) peaks of Eu3+ in 6 are in the expected positions while the fluorescence from the dabpdc2− chromophore occupies the blue region of the spectrum showing a maximum at ca. 470 nm (vide supra). The excitation spectra of 6 were measured monitoring at both the ligand (470 nm) and Eu3+ (620 nm) emissions and are shown in Figure 6. We observe that upon monitoring the dabpdc2− ligand emission, the excitation spectrum of 6 is dominated by the absorption features of the bpdc2− chromophore, while monitoring at the Eu3+ emission results in an excitation spectrum showing a relatively weak albeit clear shoulder at ca. 425 nm which tails off above 445 nm. This spectral feature is attributed to the absorption of the dabpdc2− chromophore [27] and indicates that the latter may also sensitize Eu3+ emission.
Starting from 2 and progressively doping the framework with increased levels of Eu3+ (vide supra) results in increased lanthanide-based emission with a concomitant decrease of the contribution from the organic chromophore. The change in color of the materials doped with 10 mol% of dabpdc2− and increasing levels of Eu3+ (0–2.5 mol%) is demonstrated by the CIE (Commission Internationale de l’Éclairage) coordinates of the chromaticity diagram of Figure 7, where we see that the emission color gradually shifts from the blue (x = 0.172, y = 0.173 for 2) to the purple-red region of the spectrum (x = 0.425, y = 0.289 for 8). However, the absence of a strong yellow-green component in the emission spectra of this series of materials does not allow sufficient color tuning in order to achieve entry in the white region (x and y values of 0.3 and above) [36]. Instead, a further increase of the Eu3+ doping levels results in the emission color traversing the purple region and eventually entering the red region.
Nonetheless, the presence of two clear emission components in 7, arising from an organic chromophore and a lanthanide, prompted us to study the effect of temperature on its emission profile in order to explore the potential of the material to perform as a ratiometric luminescence thermometer [8,37,38,39,40]. Figure 8 shows the emission spectra of 7 at various temperatures from 80 to 300 K. By examining the spectra of Figure 8, we observe that the ligand component shows a steady decrease in intensity with rising temperature while the Eu3+ luminophore shows distinctly different behavior in two different temperature regions. In the region between 80 and ca. 140 K, we observe an increase of Eu3+ emission intensity, while in the region between 150 and 300 K, the emission intensity of Eu3+ follows the steady decrease of that of the organic component. The decrease in the fluorescence intensity of the organic component as the temperature rises can be mainly attributed to the increasing participation of non-radiative pathways in the decay process of the dabpdc2− chromophore [29]. The initial rise of the Eu3+ component between 80 and 150 K possibly indicates that, at that temperature range, ligand-to-metal energy transfer is a major non-radiative deactivation pathway for the dabpdc2− excited state. At higher temperatures, increased molecular and lattice vibrations render thermal deactivation pathways dominant, and thereby lead to the observed reduction in the intensities of both the organic and Eu3+ emission components.
If we define the ratio of the integrated intensities of the Eu3+-based 5D07F2 emission peak ( I E u ) to the ligand-based fluorescence signal ( I L ) as the thermometric parameter Δ and plot the result against the temperature T , we obtain the diagram of Figure 9. The data can be fitted satisfactorily (correlation coefficient R2 = 0.984) to a second-degree polynomial (Equation (1)).
Δ   =   1.05   ×   10 5   T 2   +   4.90 × 10 3   T     0.21
The performance of a temperature sensor is often reported in terms of its relative sensitivity [41], S r , which serves as a figure of merit to allow comparison between different temperature sensors reported in the literature and is defined in Equation (2) [8,42].
S r = 1 Δ Δ Τ
The S r parameter of 7 as %K−1 is plotted against the temperature in Figure 9B. The maximum value of the relative sensitivity S m = 2.51 %K−1 is obtained at 80 K. These results indicate that 7 can function as a ratiometric luminescence thermometer in the tested region from 80 to 300 K showing its best performance in the 80 to 150 K region. The maximum relative sensitivity of 2.51 %K−1 shown by 7 compares well with the typical values obtained with many luminescent thermometers based on lanthanide organic frameworks [8,9,10,43]. Therefore, combined ligand and metal doping can be an effective route for the preparation of improved luminescent temperature sensors.

3. Conclusions

We demonstrated that the parent framework of [La(bpdc)Cl(DMF)] (1) [13] can be easily doped with the bridging ligand, dabpdc2− (the diamino derivative of bpdc2− ligand present in 1), and Eu3+ to produce a range of mixed ligand and mixed metal analogues. Doping of ca. 10 mol% with dabpdc2− (2) results in a moderate red shift of the ligand-based fluorescence due to interligand photoinduced energy transfer. Further doping with various amounts of Eu3+ yields materials which display sensitized Eu3+ emission along with the blue dabpdc2− fluorescence. Emission color tuning was achieved by varying the Eu3+ doping percentage from 0 to 2.5 mol%, from blue to red through purple. However, the absence of a yellow-green component in the emission spectra of this series did not allow the achievement of white light luminescence. Finally, we studied the temperature dependence of the emission profile of 7 (10 mol% dabdc2−, 2.5 mol% Eu3+) in the region from 80 to 300 K. While the ligand component shows a steady decrease in fluorescence intensity with increasing temperature, the Eu3+ luminescence shows an initial enhancement from 80 to ca. 150 K before following the trend of the organic portion of the emission spectrum of 7. We attribute the initial enhancement of Eu3+ luminescence to the dominance of ligand-to-metal energy transfer over thermal decay pathways at relatively low temperatures. Compound 7 shows good potential as a ratiometric luminescence thermometer displaying its best performance in the 80 to 150 K region with maximum sensitivity of 2.51 %K−1 at 80 K. This result shows that combined ligand and metal doping can be a viable route to produce new luminescence-based temperature sensors. Our group is currently working towards the construction of mixed lanthanide–organic frameworks exhibiting white luminescence and luminescence-based temperature sensing properties by following the above described strategy. The results obtained from the current study can be a stepping-stone towards the construction of superior optical materials.

4. Materials and Methods

4.1. Synthesis

Starting materials and solvents were purchased from the usual commercial sources (Sigma-Aldrich and Alfa Aesar) and were used as received.

4.1.1. Synthesis of H2dabpdc

Dimethyl-2,2′-dinitro-[1,1′-biphenyl]-4,4′-dicarboxylate. Dimethyl-biphenyl-4,4′-dicarboxylate (1.00 g, 3.7 mmol) was added into concentrated H2SO4 (10 mL). The mixture was stirred at room temperature for 10 min. Nitric acid (760 μL, 3 eq.) was added into concentrated H2SO4 (2 mL). This solution was added dropwise into the first mixture at room temperature over a period of 20 min. The mixture was stirred at room temperature for 4 h and then poured into ice (300 mL) to form a beige solid. The resulting solid was dissolved in dichloromethane and the aqueous phase was extracted with dichloromethane (3 × 70 mL). The combined organic layers were dried over Na2SO4 and evaporated under reduced pressure to afford a beige solid. The crude mixture was recrystallized from 2-propanol and washed with diethyl ether to give the pure product. Yield: 1.2 g (3.33 mmol, 90%). 1H NMR (500 MHz, CDCl3): δ (ppm): 8.90 (s, 2H), 8.37 (d, J = 8.4 Hz, 2H), 7.40 (d, J = 8 Hz, 2H), 4.02 (s, 6H).
Dimethyl-2,2′-diamino-[1,1′-biphenyl]-4,4′-dicarboxylate. Dimethyl-2,2′-dinitro-[1,1′-biphenyl]-4,4′-dicarboxylate (1.2 g, 3.33 mmol) was dissolved in 20 mL acetic acid and the solution was stirred under Ar atmosphere for 10 min. To this solution was added iron powder (3.7 g, 10 eq.) and the resulting mixture was stirred at room temperature for 24 h. The suspension was filtered through celite, washed with 40 mL acetic acid and the filtrate was concentrated under reduced pressure. The solid was dissolved in ethyl acetate (80 mL) and was extracted with saturated aqueous sodium carbonate solution (2 × 80 mL) and H2O (3 × 80 mL). The combined organic layers were dried over Na2SO4 and the solution was evaporated under vacuum to yield the product as a yellow solid. Yield 900 mg (3 mmol, 90%). 1H NMR (500 MHz, DMSO-d6): δ (ppm): 7.42 (s, 2H), 7.21 (d, J = 7.8 Hz, 2H), 7.06 (d, J = 7.8 Hz, 2H), 4.97 (s, 4H), 3.81 (s, 6H).
2,2′-Diamino-[1,1′-biphenyl]-4,4′-dicarboxylic acid (H2dabpdc). Dimethyl 2,2′-diamino-[1,1′-biphenyl]-4,4′-dicarboxylate (900 mg, 3.0 mmol) was dissolved in THF (20 mL) and 20 mL of aqueous NaOH (0.6 M) were added dropwise under vigorous stirring. The mixture was stirred overnight at room temperature. The organic solvent was removed under vacuum and the aqueous solution was acidified with acetic acid to yield a light brown solid (735 mg, 2.7 mmol, 90%). 1H-NMR (500 MHz, DMSO-d6): δ (ppm) = 12.64 (br, 2H), 7.40 (s, 2H), 7.20 (d, J = 7.6 Hz, 2H), 7.40 (d, J = 7.8 Hz, 2H), 4.90 (br, 4H).

4.1.2. Synthesis of MOFs

Synthesis of [La(bpdc)Cl(DMF)] (1). LaCl3·7H2O (74.8 mg, 0.2 mmol) and biphenyl-4,4′-dicarboxylic acid (48.4 mg, 0.2 mmol) were added in DMF (3 mL) and stirred until the solids were fully dissolved. The resulting solution was sealed in a screw cap 23 mL scintillation vial and placed in a preheated oven at 110 °C where it remained undisturbed for 24 h before being cooled to room temperature. Colorless needle-like crystals were isolated by filtration, washed with DMF (5 × 3 mL), and dried under vacuum overnight. Yield 32 mg (45%).
Synthesis of the [La1−xEux(bpdc)1−y(dabpdc)yCl(DMF)] series. LaCl3·7H2O (74.8 mg, 0.2 mmol) and biphenyl-4,4′-dicarboxylic acid (48.4 mg, 0.2 mmol) were added in DMF (3 mL) and stirred until the solids were fully dissolved. Standard solutions of EuCl3·6H2O (10−2 M) and H2dabdc (10−2 M) in DMF were prepared and calculated volumes were added in the reaction feed using a volumetric pipette, while the mixture was magnetically stirred, to achieve the desired La3+/Eu3+ and H2bpdc/H2dabpdc molar ratio. Otherwise, the procedure was identical to that for the synthesis of 1. Colorless or pale-yellow needle-like crystals were isolated by filtration, washed with DMF (5 × 3 mL) and dried under vacuum overnight. Exact percentages of Eu3+ and dabpdc2− in each doped analogue and reaction yields are shown in Table 1.

4.2. Physical Measurements and Crystallogtraphy

Photoluminescence spectra. The emission spectra were measured on a Horiba fluorescence spectrometer equipped with a powder sample holder. The light source was a 450 W Xenon Arc Lamp (220–1000 nm) and the detector a red sensitive Hamamatsu R928 photomultiplier tube. All spectra were corrected for instrument response using the correction function generated after calibration of the instrument with a standard light source. Appropriate long pass filters were used to remove scattering from the sample and the monochromators. Temperature-dependent photoluminescence measurements were carried out in the 80–300 K range by placing the samples in the cold finger of a Janis VPF liquid nitrogen optical cryostat.
1H-NMR. 1H-NMR spectra were recorded at room temperature on NMR Agilent 500 MHz, with the use of the solvent proton as an internal standard and on an Avance Brucker NMR spectrometer (500 MHz).
PXRD measurements. PXRD diffraction patterns were recorded on a Shimadzu 6000 Series X-ray diffractometer with a Cu Kα source (λ = 1.5418 Å).
X-ray Crystal Structure Determination. Single crystal X-ray diffraction data were collected on a Rigaku Oxford-Diffraction Supernova diffractometer, equipped with a CCD area detector utilizing Cu Kα (λ = 1.5418 Å) radiation. A suitable crystal was mounted on a Hampton cryoloop with Paratone-N oil and transferred to a goniostat where it was cooled for data collection. Empirical absorption corrections (multiscan based on symmetry-related measurements) were applied using CrysAlis RED software [44]. The structure was solved by direct methods using SIR2004 [45] and refined on F2 using full-matrix least-squares with SHELXL-2014/7 [46] within the WinGX [47] platform. Software packages used were as follows: CrysAlis CCD for data collection [44], CrysAlis RED for cell refinement and data reduction [44], and MERCURY [48] for molecular graphics. The non-H atoms were treated anisotropically, except for those that belong to disordered parts. The aromatic H atoms were placed in calculated, ideal positions and refined depending on their respective carbon atoms. Selected crystal data for 9 are summarized in Table S2.
Thermogravimetric Analysis (TGA). Thermal stability studies were performed with a Shimadzu TGA 50 thermogravimetric analyzer. Thermal analysis was conducted from 25 to 800 °C under air with a heating rate of 10 °C min−1.

Supplementary Materials

The following are available online, Table S1: Selected bond lengths and angles for 1., Table S2: Crystal and refinement data for 9, Figure S1: 1H-NMR spectrum of a digested sample of 2 in D2O/NaOH., Figure S2: The TGA curve for 1, Figure S3: The TGA curve for 2.

Author Contributions

T.L. designed research and wrote the paper; D.A. and S.A.D. preformed the syntheses; D.A., A.Z., N.P., A.J.T., G.I. and T.L. contributed in photophysical studies, structural characterization and data interpretation. All authors have read and agreed to the published version of the manuscript.

Funding

This research is co-financed by Greece and the European Union (European Social Fund—ESF) through the Operational Programme «Human Resources Development, Education and Lifelong Learning» in the context of the project “Strengthening Human Resources Research Potential via Doctorate Research-2nd Cycle” (MIS-5000432), implemented by the State Scholarships Foundation (ΙΚΥ).

Acknowledgments

S.A.D. wishes to thank the IKY foundation for a PhD scholarship.

Conflicts of Interest

The authors declare no conflict of interest.

References

  1. Bünzli, J.-C.G. Chapter 287—Lanthanide Luminescence: From a Mystery to Rationalization, Understanding, and Applications. In Handbook on the Physics and Chemistry of Rare Earths; Bünzli, J.-C.G., Pecharsky, V.K., Eds.; Elsevier: Amsterdam, The Netherlands, 2016; Volume 50, pp. 141–176. [Google Scholar]
  2. Bünzli, J.-C.G. On the design of highly luminescent lanthanide complexes. Coord. Chem. Rev. 2015, 293, 19–47. [Google Scholar] [CrossRef]
  3. Aletti, A.B.; Gillen, D.M.; Gunnlaugsson, T. Luminescent/colorimetric probes and (chemo-) sensors for detecting anions based on transition and lanthanide ion receptor/binding complexes. Coord. Chem. Rev. 2018, 354, 98–120. [Google Scholar] [CrossRef]
  4. Armelao, L.; Quici, S.; Barigelletti, F.; Accorsi, G.; Bottaro, G.; Cavazzini, M.; Tondello, E. Design of luminescent lanthanide complexes: From molecules to highly efficient photo-emitting materials. Coord. Chem. Rev. 2010, 254, 487–505. [Google Scholar] [CrossRef]
  5. Bünzli, J.-C.G.; Piguet, C. Taking advantage of luminescent lanthanide ions. Chem. Soc. Rev. 2005, 34, 1048–1077. [Google Scholar] [CrossRef] [PubMed]
  6. Dramicanin, M.D. Sensing temperature via downshifting emissions of lanthanide-doped metal oxides and salts. A review. Methods Appl. Fluoresc. 2016, 4, 042001. [Google Scholar] [CrossRef] [Green Version]
  7. Cui, Y.J.; Zhu, F.L.; Chen, B.L.; Qian, G.D. Metal-organic frameworks for luminescence thermometry. Chem. Commun. 2015, 51, 7420–7431. [Google Scholar] [CrossRef]
  8. Rocha, J.; Brites, C.D.S.; Carlos, L.D. Lanthanide Organic Framework Luminescent Thermometers. Chem. Eur. J. 2016, 22, 14782–14795. [Google Scholar] [CrossRef]
  9. Abdelhameed, R.M.; Ananias, D.; Silva, A.M.S.; Rocha, J. Luminescent Nanothermometers Obtained by Post-Synthetic Modification of Metal-Organic Framework MIL-68. Eur. J. Inorg. Chem. 2019, 2019, 1354–1359. [Google Scholar] [CrossRef]
  10. Zhao, D.; Yue, D.; Jiang, K.; Zhang, L.; Li, C.; Qian, G. Isostructural Tb3+/Eu3+ Co-Doped Metal–Organic Framework Based on Pyridine-Containing Dicarboxylate Ligands for Ratiometric Luminescence Temperature Sensing. Inorg. Chem. 2019, 58, 2637–2644. [Google Scholar] [CrossRef]
  11. D’Vries, R.F.; Alvarez-Garcia, S.; Snejko, N.; Bausa, L.E.; Gutierrez-Puebla, E.; de Andres, A.; Monge, M.A. Multimetal rare earth MOFs for lighting and thermometry: Tailoring color and optimal temperature range through enhanced disulfobenzoic triplet phosphorescence. J. Mater. Chem. C 2013, 1, 6316–6324. [Google Scholar] [CrossRef] [Green Version]
  12. Cui, Y.J.; Song, R.J.; Yu, J.C.; Liu, M.; Wang, Z.Q.; Wu, C.D.; Yang, Y.; Wang, Z.Y.; Chen, B.L.; Qian, G.D. Dual-Emitting MOF superset of Dye Composite for Ratiometric Temperature Sensing. Adv. Mater. 2015, 27, 1420–1425. [Google Scholar] [CrossRef] [PubMed]
  13. Jia, L.-N.; Hou, L.; Wei, L.; Jing, X.-J.; Liu, B.; Wang, Y.-Y.; Shi, Q.-Z. Five sra Topological Ln(III)-MOFs Based on Novel Metal-Carboxylate/Cl Chain: Structure, Near-Infrared Luminescence and Magnetic Properties. Cryst. Growth Des. 2013, 13, 1570–1576. [Google Scholar] [CrossRef]
  14. Han, Y.-F.; Zhou, X.-H.; Zheng, Y.-X.; Shen, Z.; Song, Y.; You, X.-Z. Syntheses, structures, photoluminescence, and magnetic properties of nanoporous 3D lanthanide coordination polymers with 4,4′-biphenyldicarboxylate ligand. CrystEngComm 2008, 10, 1237–1242. [Google Scholar] [CrossRef]
  15. Amghouz, Z.; García-Granda, S.; García, J.R.; Ferreira, R.A.S.; Mafra, L.; Carlos, L.D.; Rocha, J. Series of Metal Organic Frameworks Assembled from Ln(III), Na(I), and Chiral Flexible-Achiral Rigid Dicarboxylates Exhibiting Tunable UV–vis–IR Light Emission. Inorg. Chem. 2012, 51, 1703–1716. [Google Scholar] [CrossRef] [PubMed]
  16. Chatenever, A.R.K.; Warne, L.R.; Matsuoka, J.E.; Wang, S.J.; Reinheimer, E.W.; LeMagueres, P.; Fei, H.; Song, X.; Oliver, S.R.J. Isomorphous Lanthanide Metal–Organic Frameworks Based on Biphenyldicarboxylate: Synthesis, Structure, and Photoluminescent Properties. Cryst. Growth Des. 2019, 19, 4854–4859. [Google Scholar] [CrossRef]
  17. Horrocks, W.D.; Sudnick, D.R. Lanthanide ion probes of structure in biology. Laser-induced luminescence decay constants provide a direct measure of the number of metal-coordinated water molecules. J. Am. Chem. Soc. 1979, 101, 334–340. [Google Scholar] [CrossRef]
  18. Gao, M.-L.; Wang, W.-J.; Liu, L.; Han, Z.-B.; Wei, N.; Cao, X.-M.; Yuan, D.-Q. Microporous Hexanuclear Ln(III) Cluster-Based Metal–Organic Frameworks: Color Tunability for Barcode Application and Selective Removal of Methylene Blue. Inorg. Chem. 2017, 56, 511–517. [Google Scholar] [CrossRef]
  19. Wang, J.; Lu, G.; Liu, Y.; Wu, S.-G.; Huang, G.-Z.; Liu, J.-L.; Tong, M.-L. Building Block and Directional Bonding Approaches for the Synthesis of {DyMn4} n (n = 2, 3) Metallacrown Assemblies. Cryst. Growth Des. 2019, 19, 1896–1902. [Google Scholar] [CrossRef]
  20. Volkringer, C.; Marrot, J.; Férey, G.; Loiseau, T. Hydrothermal Crystallization of Three Calcium-Based Hybrid Solids with 2,6-Naphthalene- or 4,4′-Biphenyl-Dicarboxylates. Cryst. Growth Des. 2008, 8, 685–689. [Google Scholar] [CrossRef]
  21. Qiao, Y.; Li, Z.-M.; Wang, X.-B.; Guan, W.-S.; Liu, L.-H.; Liu, B.; Wang, J.-K.; Che, G.-B.; Liu, C.-B.; Lin, X. Thermal behaviors and adsorption properties of two Europium(III) complexes based on 2-(4-carboxyphenyl) imidazo [4, 5-f]-1,10-phenanthroline. Inorg. Chim. Acta 2018, 471, 397–403. [Google Scholar] [CrossRef]
  22. Yan, W.; Zhang, C.; Chen, S.; Han, L.; Zheng, H. Two Lanthanide Metal–Organic Frameworks as Remarkably Selective and Sensitive Bifunctional Luminescence Sensor for Metal Ions and Small Organic Molecules. ACS Appl. Mater. Interfaces 2017, 9, 1629–1634. [Google Scholar] [CrossRef] [PubMed]
  23. Zhou, J.-M.; Shi, W.; Li, H.-M.; Li, H.; Cheng, P. Experimental Studies and Mechanism Analysis of High-Sensitivity Luminescent Sensing of Pollutional Small Molecules and Ions in Ln4O4 Cluster Based Microporous Metal–Organic Frameworks. J. Phys. Chem. C 2014, 118, 416–426. [Google Scholar] [CrossRef]
  24. Zhang, S.; Yang, Y.; Xia, Z.-Q.; Liu, X.-Y.; Yang, Q.; Wei, Q.; Xie, G.; Chen, S.-P.; Gao, S.-L. Eu-MOFs with 2-(4-Carboxyphenyl) imidazo [4,5-f]-1,10-phenanthroline and Ditopic Carboxylates as Coligands: Synthesis, Structure, High Thermostability, and Luminescence Properties. Inorg. Chem. 2014, 53, 10952–10963. [Google Scholar] [CrossRef] [PubMed]
  25. Min, Z.; Singh-Wilmot, M.A.; Cahill, C.L.; Andrews, M.; Taylor, R. Isoreticular Lanthanide Metal-Organic Frameworks: Syntheses, Structures and Photoluminescence of a Family of 3D Phenylcarboxylates. Eur. J. Inorg. Chem. 2012, 2012, 4419–4426. [Google Scholar] [CrossRef]
  26. Liu, C.; Eliseeva, S.V.; Luo, T.-Y.; Muldoon, P.F.; Petoud, S.; Rosi, N.L. Near infrared excitation and emission in rare earth MOFs via encapsulation of organic dyes. Chem. Sci. 2018, 9, 8099–8102. [Google Scholar] [CrossRef] [Green Version]
  27. Diamantis, S.A.; Pournara, A.D.; Hatzidimitriou, A.G.; Manos, M.J.; Papaefstathiou, G.S.; Lazarides, T. Two new alkaline earth metal organic frameworks with the diamino derivative of biphenyl-4,4′-dicarboxylate as bridging ligand: Structures, fluorescence and quenching by gas phase aldehydes. Polyhedron 2018, 153, 173–180. [Google Scholar] [CrossRef]
  28. Dikhtiarenko, A.; Olivos Suarez Alma, I.; Pustovarenko, A.; García-Granda, S.; Gascon, J. Crystal structure of 2,2′-diamino-[1,1′-biphenyl]-4,4′-dicarboxylic acid dihydrate, C14H16N2O6. Z. Kristallogr. NCS 2016, 231, 65–67. [Google Scholar] [CrossRef] [Green Version]
  29. Lakowicz, J.R. Principles of Fluorescence Spectroscopy; Springer Science: New York, NY, USA, 2006. [Google Scholar]
  30. Kent, C.A.; Mehl, B.P.; Ma, L.Q.; Papanikolas, J.M.; Meyer, T.J.; Lin, W.B. Energy Transfer Dynamics in Metal-Organic Frameworks. J. Am. Chem. Soc. 2010, 132, 12767–12769. [Google Scholar] [CrossRef]
  31. Lin, J.X.; Hu, X.Q.; Zhang, P.; Van Rynbach, A.; Beratan, D.N.; Kent, C.A.; Mehl, B.P.; Papanikolas, J.M.; Meyer, T.J.; Lin, W.B.; et al. Triplet Excitation Energy Dynamics in Metal-Organic Frameworks. J. Phys. Chem. C 2013, 117, 22250–22259. [Google Scholar] [CrossRef]
  32. So, M.C.; Wiederrecht, G.P.; Mondloch, J.E.; Hupp, J.T.; Farha, O.K. Metal-organic framework materials for light-harvesting and energy transfer. Chem. Commun. 2015, 51, 3501–3510. [Google Scholar] [CrossRef]
  33. Son, H.J.; Jin, S.; Patwardhan, S.; Wezenberg, S.J.; Jeong, N.C.; So, M.; Wilmer, C.E.; Sarjeant, A.A.; Schatz, G.C.; Snurr, R.Q.; et al. Light-harvesting and ultrafast energy migration in porphyrin-based metal-organic frameworks. J. Am. Chem. Soc. 2013, 135, 862–869. [Google Scholar] [CrossRef] [PubMed] [Green Version]
  34. Yu, J.; Park, J.; Van Wyk, A.; Rumbles, G.; Deria, P. Excited-State Electronic Properties in Zr-Based Metal-Organic Frameworks as a Function of a Topological Network. J. Am. Chem. Soc. 2018, 140, 10488–10496. [Google Scholar] [CrossRef] [PubMed]
  35. Shavaleev, N.M.; Eliseeva, S.V.; Scopelliti, R.; Bünzli, J.-C.G. Influence of Symmetry on the Luminescence and Radiative Lifetime of Nine-Coordinate Europium Complexes. Inorg. Chem. 2015, 54, 9166–9173. [Google Scholar] [CrossRef]
  36. Kotova, O.; Comby, S.; Lincheneau, C.; Gunnlaugsson, T. White-light emission from discrete heterometallic lanthanide-directed self-assembled complexes in solution. Chem. Sci. 2017, 8, 3419–3426. [Google Scholar] [CrossRef] [PubMed] [Green Version]
  37. Cui, Y.J.; Xu, H.; Yue, Y.F.; Guo, Z.Y.; Yu, J.C.; Chen, Z.X.; Gao, J.K.; Yang, Y.; Qian, G.D.; Chen, B.L. A Luminescent Mixed-Lanthanide Metal-Organic Framework Thermometer. J. Am. Chem. Soc. 2012, 134, 3979–3982. [Google Scholar] [CrossRef] [PubMed]
  38. Rao, X.T.; Song, T.; Gao, J.K.; Cui, Y.J.; Yang, Y.; Wu, C.D.; Chen, B.L.; Qian, G.D. A Highly Sensitive Mixed Lanthanide Metal-Organic Framework Self-Calibrated Luminescent Thermometer. J. Am. Chem. Soc. 2013, 135, 15559–15564. [Google Scholar] [CrossRef]
  39. Li, L.; Zhu, Y.L.; Zhou, X.H.; Brites, C.D.S.; Ananias, D.; Lin, Z.; Paz, F.A.A.; Rocha, J.; Huang, W.; Carlos, L.D. Visible-Light Excited Luminescent Thermometer Based on Single Lanthanide Organic Frameworks. Adv. Funct. Mater. 2016, 26, 8677–8684. [Google Scholar] [CrossRef]
  40. Liu, X.; Akerboom, S.; Jong, M.D.; Mutikainen, I.; Tanase, S.; Meijerink, A.; Bouwman, E. Mixed-Lanthanoid Metal–Organic Framework for Ratiometric Cryogenic Temperature Sensing. Inorg. Chem. 2015, 54, 11323–11329. [Google Scholar] [CrossRef]
  41. Wade, S.A.; Collins, S.F.; Baxter, G.W. Fluorescence intensity ratio technique for optical fiber point temperature sensing. J. Appl. Phys. 2003, 94, 4743–4756. [Google Scholar] [CrossRef]
  42. Brites, C.D.S.; Lima, P.P.; Silva, N.J.O.; Millán, A.; Amaral, V.S.; Palacio, F.; Carlos, L.D. Thermometry at the nanoscale. Nanoscale 2012, 4, 4799–4829. [Google Scholar] [CrossRef] [Green Version]
  43. Qiu, L.; Yu, C.; Wang, X.; Xie, Y.; Kirillov, A.M.; Huang, W.; Li, J.; Gao, P.; Wu, T.; Gu, X.; et al. Tuning the Solid-State White Light Emission of Postsynthetic Lanthanide-Encapsulated Double-Layer MOFs for Three-Color Luminescent Thermometry Applications. Inorg. Chem. 2019, 58, 4524–4533. [Google Scholar] [CrossRef] [PubMed]
  44. CrysAlis CCD and CrysAlis RED; Oxford Diffraction Ltd: Abingdon, UK, 2008.
  45. Burla, M.C.; Caliandro, R.; Camalli, M.; Carrozzini, B.; Cascarano, G.L.; Caro, L.D.; Giacovazzo, C.; Polidori, G.; Spagna, R.J. SIR2004: An improved tool for crystal structure determination and refinement. Appl. Crystallogr. 2005, 38, 381–388. [Google Scholar] [CrossRef] [Green Version]
  46. Sheldrick, G.M. SHELXT–Integrated space-group and crystal-structure determination. Acta Cryst. 2015, C71, 3–8. [Google Scholar] [CrossRef] [PubMed] [Green Version]
  47. Farrugia, L.J.J. J. WinGX and ORTEP for Windows: an update. Appl. Cryst. 2012, 45, 849–854. [Google Scholar] [CrossRef]
  48. Macrae, C.F.; Edgington, P.R.; McCabe, P.; Pidcock, E.; Shields, G.P.; Taylor, R.; Towler, M.; van de Streek, J.J. Mercury: visualization and analysis of crystal structures. Appl. Cryst. 2006, 39, 453–457. [Google Scholar] [CrossRef] [Green Version]
Sample Availability: Samples of the compounds are available from the authors.
Figure 1. The crystal structure of the parent framework 1 [13] viewed along the a axis. The infinite rod metal SBU of 1 is shown below the main structure. Color code: Lanthanum: turqoise, Carbon: black, Oxygen: red, Chlorine: green. The atoms of the coordinated DMF molecules are shown in magenta.
Molecules 25 00523 g001aMolecules 25 00523 g001b
Figure 2. Powder X-ray diffraction paterns of the doped analogues 19 with the general formula [La1−xEux(bpdc)1−y(dabpdc)yCl(DMF)]; the values of x and y corresponding to each doped analogue are shown on the graph.
Molecules 25 00523 g002
Figure 3. Partial view of the crystal structure of 9 highlighting the disorder of the biphenyl bridging unit. The nitrogen atoms were refined with a site occupancy of ca. 17%. Hydrogen atoms and the coordinated DMF molecules are omitted for clarity. Color code: Lanthanum: turqoise, Carbon: black, Oxygen: red, Nitrogen: blue, Chlorine: green.
Molecules 25 00523 g003
Figure 4. The TGA curve of compound 6.
Molecules 25 00523 g004
Figure 5. The solid-state emission spectra of compounds 1, 2 and 8 upon excitation at 365 nm. See main text for details.
Molecules 25 00523 g005
Figure 6. The solid-state emission and excitation spectra of compound 6. The excitation spectra are monitored both at the dabpdc2− (470 nm) fluorescence and the Eu3+ emission (620 nm).
Molecules 25 00523 g006
Figure 7. Chromaticity coordinates (CIE 1931) calculated from the corrected emission profiles of materials 18 showing the gradual shift from blue to red upon increasing the Eu3+ content.
Molecules 25 00523 g007
Figure 8. Temperature dependent emission spectra of 7 upon excitation at 375 nm. The spectra in the temperature region between 80 and 140 K are highlighted to emphasize the increase in Eu3+-based emission with rising temperature (see main text).
Molecules 25 00523 g008
Figure 9. (A) The thermometric parameter versus temperature for material 7. The red line represents a polynomial fit to the experimental data. (B) The S r parameter versus temperature for material 7. See main text for details.
Molecules 25 00523 g009
Table 1. Percentages of H2dabpdc and Eu3+ doping 1 and yields.
Compoundmol% H2dabpdcmol% Eu3+Yield
210042
3101.0041
4101.5040
5101.7545
6102.0041
7102.5044
801.7539
933032
1 Molar percentage of dopant in the reaction mixture.

