
Functional Characterization of the Saccharomyces cerevisiae Equilibrative Nucleoside Transporter 1 (ScENT1)

1
Department of Biochemistry and Molecular Biology, University of Oklahoma Health Sciences Center, Oklahoma City, OK 73104, USA
2
Stephenson Cancer Center, University of Oklahoma Health Sciences Center, Oklahoma City, OK 73104, USA
3
Harold Hamm Diabetes Center, University of Oklahoma Health Sciences Center, Oklahoma City, OK 73104, USA
*
Author to whom correspondence should be addressed.
Molecules 2018, 23(4), 732; https://doi.org/10.3390/molecules23040732
Submission received: 3 December 2017
/
Revised: 7 March 2018
/
Accepted: 14 March 2018
/
Published: 22 March 2018
(This article belongs to the Special Issue Nucleoside and Nucleotide Analogues)
Abstract
:Equilibrative nucleoside transporters (ENTs) are polytopic membrane transporters responsible for the translocation of nucleosides, nucleobases—to a lesser extent—and nucleoside analog therapeutics across cellular membranes. ENTs function in a diffusion controlled bidirectional manner and are thought to utilize an alternating access transport mechanism. However, a detailed understanding of ENT function at the molecular level has remained elusive. ScENT1 (formerly known as Function Unknown Now 26 or FUN26) is the only known ENT ortholog endogenously expressed in S. cerevisiae, and a proteoliposome assay system was used to study homogenously overexpressed and purified ScENT1 (wildtype relative to L390A and F249I mutants). L390 and F249 are highly conserved residues and were found to alter transporter function. L390A produced a reduction of mean transport activity while F249I increased mean substrate translocation relative to wildtype protein. However, both mutations resulted in transport of UTP—a novel gain of function for any ENT. These residues were then mapped onto an ab initio model of FUN26 which suggests they function in substrate translocation (L390) or cytoplasmic gating (F249). Furthermore, wildtype, L390A, and F249I were found to be sensitive to the presence of alcohols. Ethanol attenuated ScENT1-mediated transport of uridine by ~50%. These findings further demonstrate functional similarities between ScENT1 and human ENT isoforms and support identification of FUN26 as ScENT1, the first ENT isoform in S. cerevisiae.

1. Introduction
Nucleoside transporters are fundamental contributors to nucleoside physiology, pathophysiology, and the beneficial exploitation of nucleoside analog therapeutics. Nucleosides serve as metabolic precursors in de novo nucleic acid synthesis, metabolic precursors of energy metabolism (e.g., ATP and GTP), and as ligands for purinergic receptors (e.g., adenosine and inosine) [1,2]. Nucleoside and nucleobase analogs also represent important classes of antineoplastic agents and antiviral therapeutics [3]. Activity of many of these hydrophilic compounds relies upon their entry into intracellular metabolic pathways to exert their effectiveness. Thus, transport through cellular membranes is an essential component of therapeutic efficacy for nucleoside and nucleobase derived therapeutics.
Equilibrative nucleoside transporters (ENTs) are polytopic integral membrane proteins (IMPs) that regulate the plasmalemmal flux of purine and pyrimidine nucleosides and nucleobases, but not nucleotides [3]. In addition to endogenous ligands, ENTs modulate efficacy for a variety of FDA/EMA approved therapeutics (e.g., anticancer, antiarrhythmia, antihypertensive, and antiviral medications), and ENTs are also known biomarkers for drug efficacy in the treatment of certain cancers [4,5]. ENTs have also been implicated in modulating seizure activity by regulating adenosine flux [6], and in seizures associated with alcohol withdrawal syndrome [7,8]. Functionally, ENTs are bidirectional, facilitative transporters that utilize concentration gradients of transportable substrates to regulate permeant influx and efflux across membrane bilayers. There are four human ENT isoforms (hENT1–4), each having 11 predicted transmembrane domains (TMDs) and large hydrophilic loops at either the N-terminus (hENT3–4) or between TMD5 and TMD7 (hENT1–4) [9]—a predicted topology that is similar for members of the Major Facilitator Superfamily (MFS) [10]. Currently, there are no molecular structures for any member of the ENT family and, until recently, ENTs were resistant to characterization in purified form. ENT7 from Arabidopsis thaliana [11] and Function Unknown Now 26 (FUN26) from Saccharomyces cerevisiae [12] (henceforth referred to as ScENT1) are the only ENT family members to undergo detergent extraction from the lipid bilayer and retain function in a purified state.
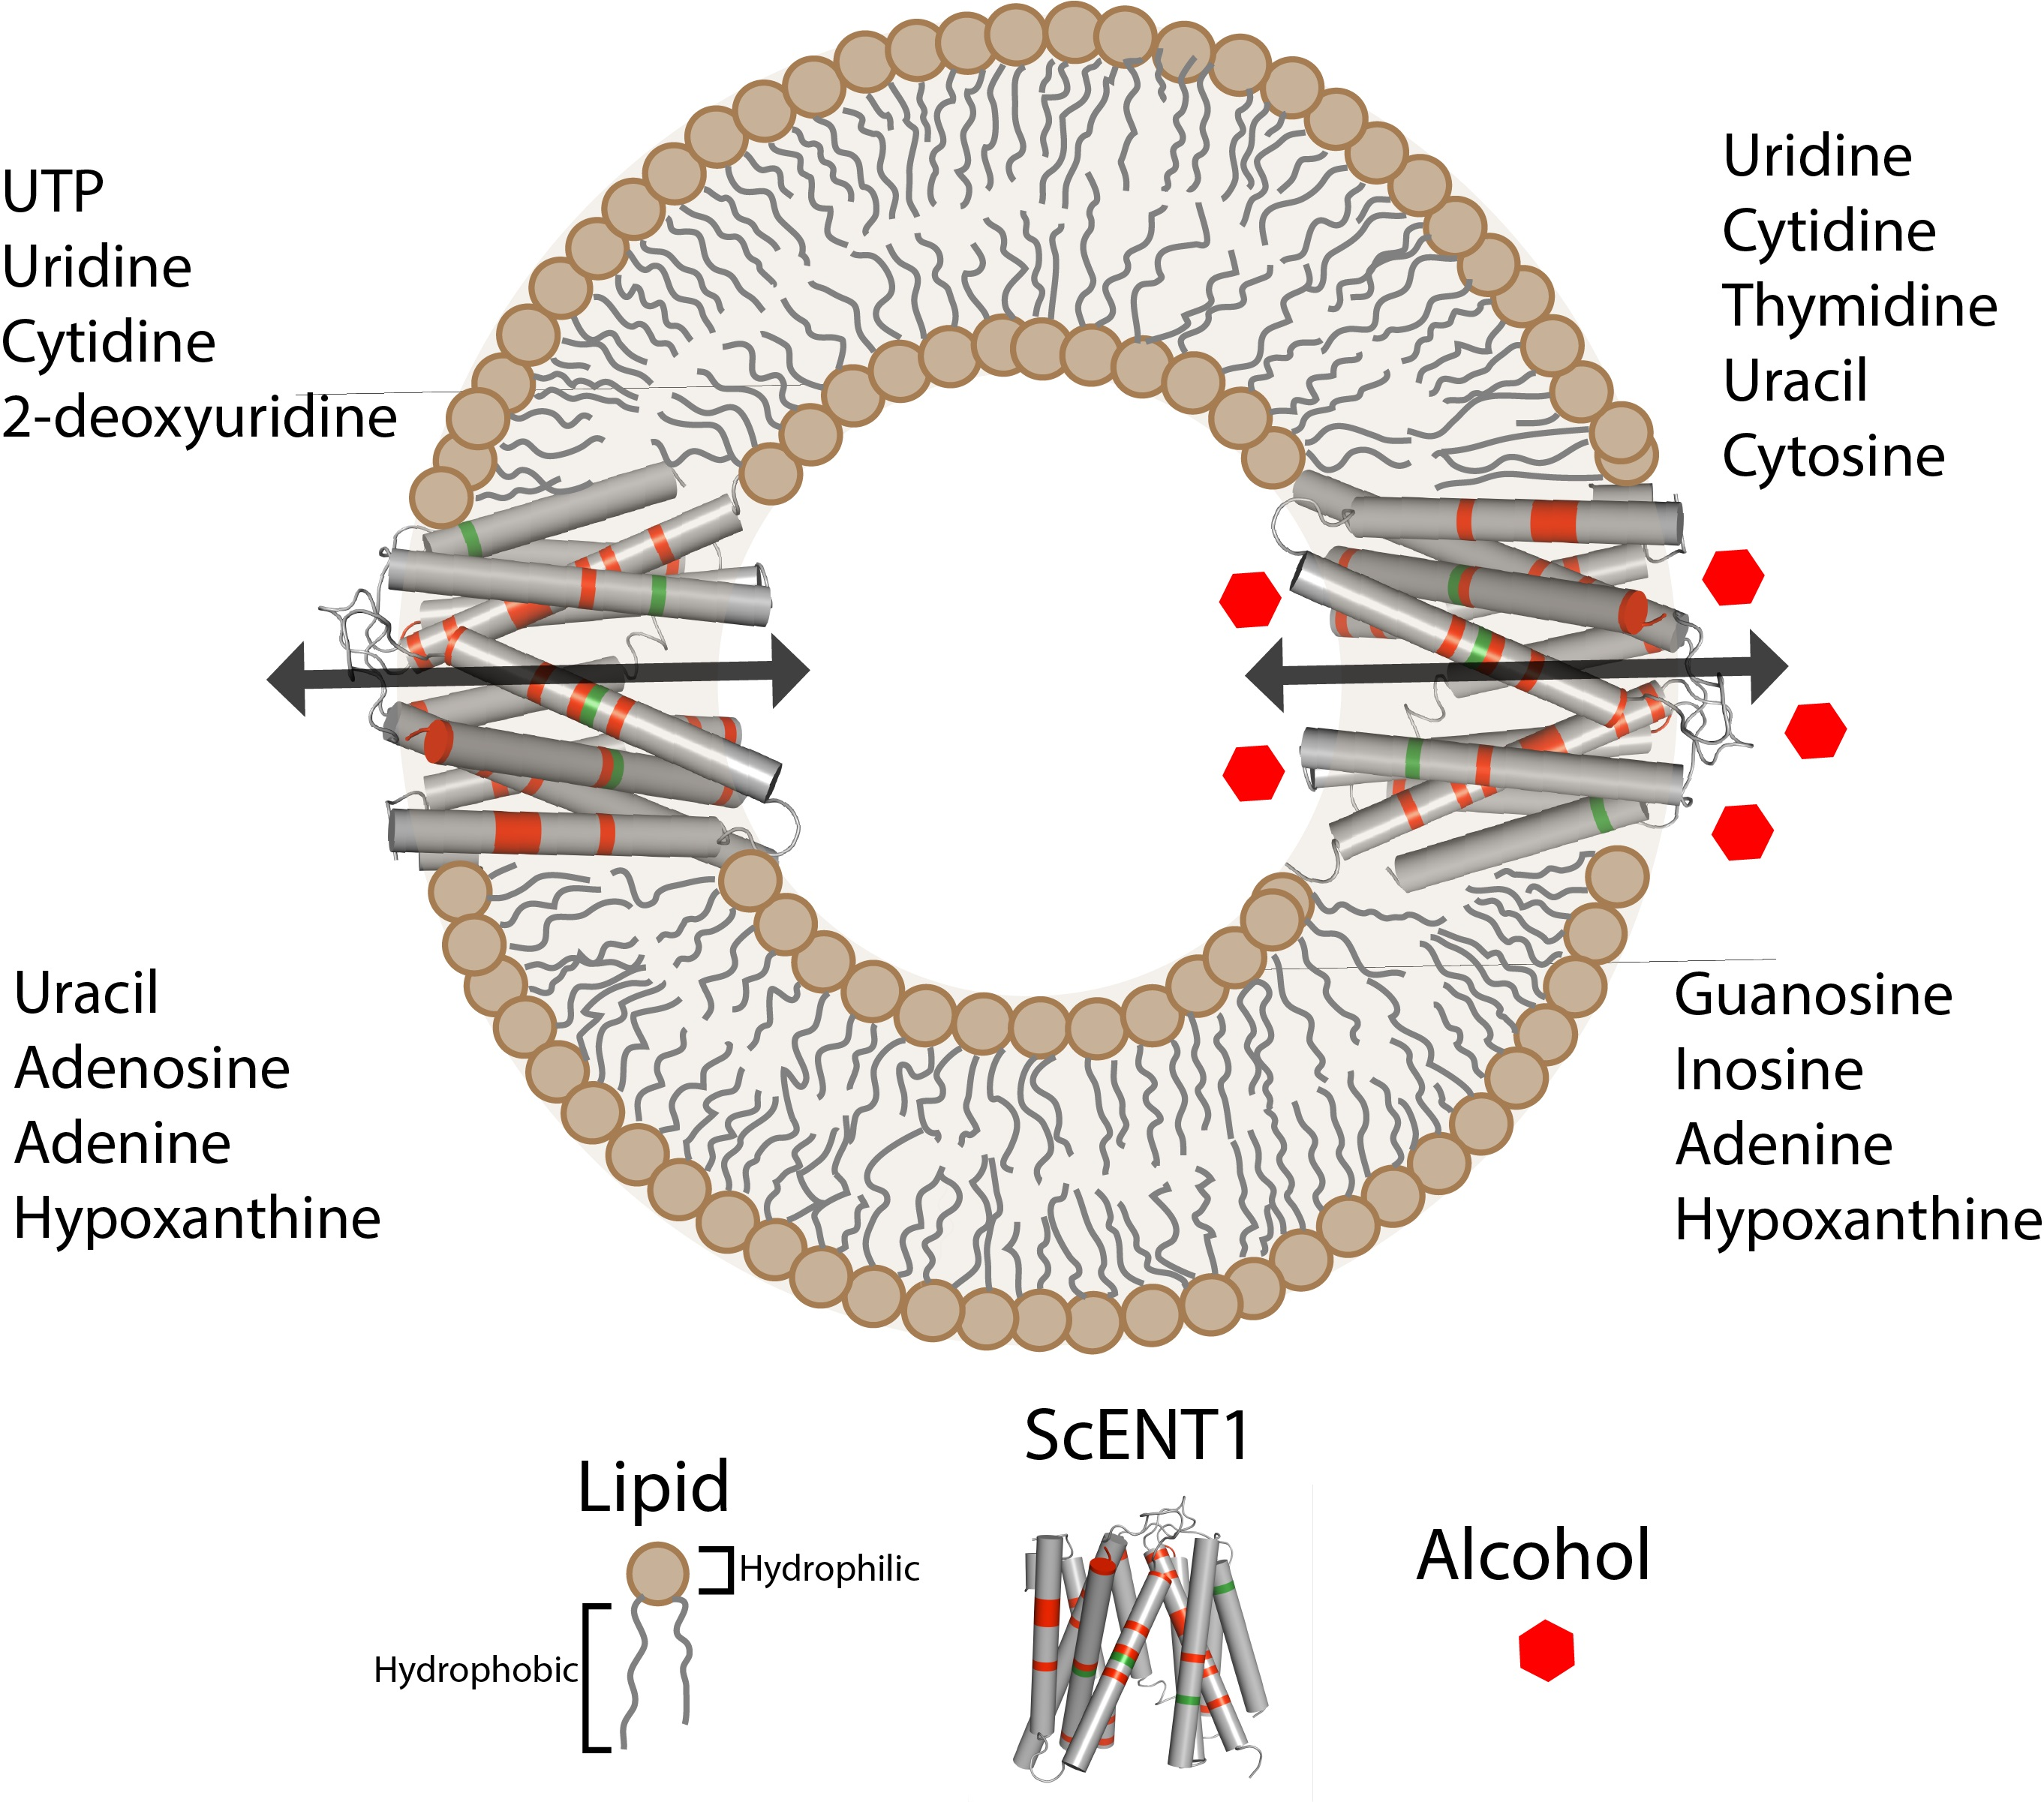
ScENT1, the only identified hENT1–4 ortholog found in Saccharomyces cerevisiae, is predicted to have: (1) 11 TMDs; (2) an extramembrane loop connecting TMDs 6 and 7; and (3) a hydrophilic N-terminal domain [12,13]. Functional characterization in proteoliposomes demonstrated that ScENT1 is a broadly selective, high affinity, nucleoside and nucleobase transporter, with positional sensitivities to modifications at the C(2′)- and C(5′)-positions of the ribose ring [12]. Since ScENT1 is predominantly localized to yeast vacuoles [13,14], the observed broad substrate selectivity would suggest that ScENT1 is involved in salvaging nucleosides and nucleobases from inside vacuoles and recycling them to cytoplasmic pools. In these studies, ScENT1 demonstrated a unique substrate transport profile when compared to human ENTs. However, mutagenesis data revealed that non-synonymous single nucleotide polymorphisms (SNPs), found in the coding region of hENT3 (G463, ScENT1) [15], and a previously characterized mutation (G216, ScENT1) found in hENT1 [16] had similar functions when studied in ScENT1 [12]. While ScENT1 is functionally distinct from previously characterized ENTs, it retains overlapping structural features with hENT1 and hENT3—therefore, further characterization of ScENT1 in the purified state would advance the understanding of ENT molecular function and facilitate structure determination efforts for this difficult family of IMP transporters.
In the present study, we utilized an in vitro proteoliposome (PL) transport assay system to functionally characterize ScENT1 point mutations using purified protein. We also utilized this system to assess what role alcohols may play in modulating ScENT1 transport activity. Previous data suggests that ENT proteins function as direct mediators of ethanol sensitivity [17,18,19]. Point mutations were selected based upon known hENT SNPs associated with disease (e.g., G216 and G463) or conserved sidechain characteristics (e.g., L390 and F249) relative to predicted structural features (e.g., transmembrane helices). The L390A and F249I mutations were selected as they reside in strictly conserved sites in the ENT family located in predicted TMDs (TMD6 for F249 and TMD8 for L390). Conserved aromatic residues located at the distal TMD ends can serve key functional or regulatory roles in integral membrane transporter function [20]. Point mutation selection was also guided by ab initio structural modeling of ScENT1 as reported below. In addition, functional studies using human lymphocytes [19], murine lymphoma cells [19], and hybrid neuroblastoma and glioma cells [21] suggest that hENT1 transport activity is modulated by ethanol. Given the functional overlap between ScENT1 and previously identified ENTs, we hypothesized that ethanol would modulate ScENT1-mediated substrate transport activity following reconstitution into PLs. An advantage of using PLs is the ability to control lipid bilayer composition and luminal buffer conditions. Data obtained in the present study demonstrates that (1) the L390A and F249I mutations are capable of modulating substrate influx and altering the overall substrate transport profile; (2) residues L390, and G463, appear to contribute to the substrate translocation pore while G216 contributes to structural stability of the protein and F249 may regulate cytoplasmic gating; (3) L390A and F249I ScENT1 mutants are capable of low levels of [3H]-UTP transport—the first demonstration of ENT-mediated nucleotide transport; (4) ScENT1-mediated uridine transport is attenuated in the presence of ethanol; and (5) the overall substrate transport profile of ScENT1 is altered by alcohols. Thus, this work advances the molecular understanding of ENTs and provides direct evidence for ethanol modulation of substrate transport using a purified ENT family member.
2. Results
2.1. Nucleoside, Nucleobase and Nucleotide Uptake by the L390A and F249I Mutant Proteoliposomes
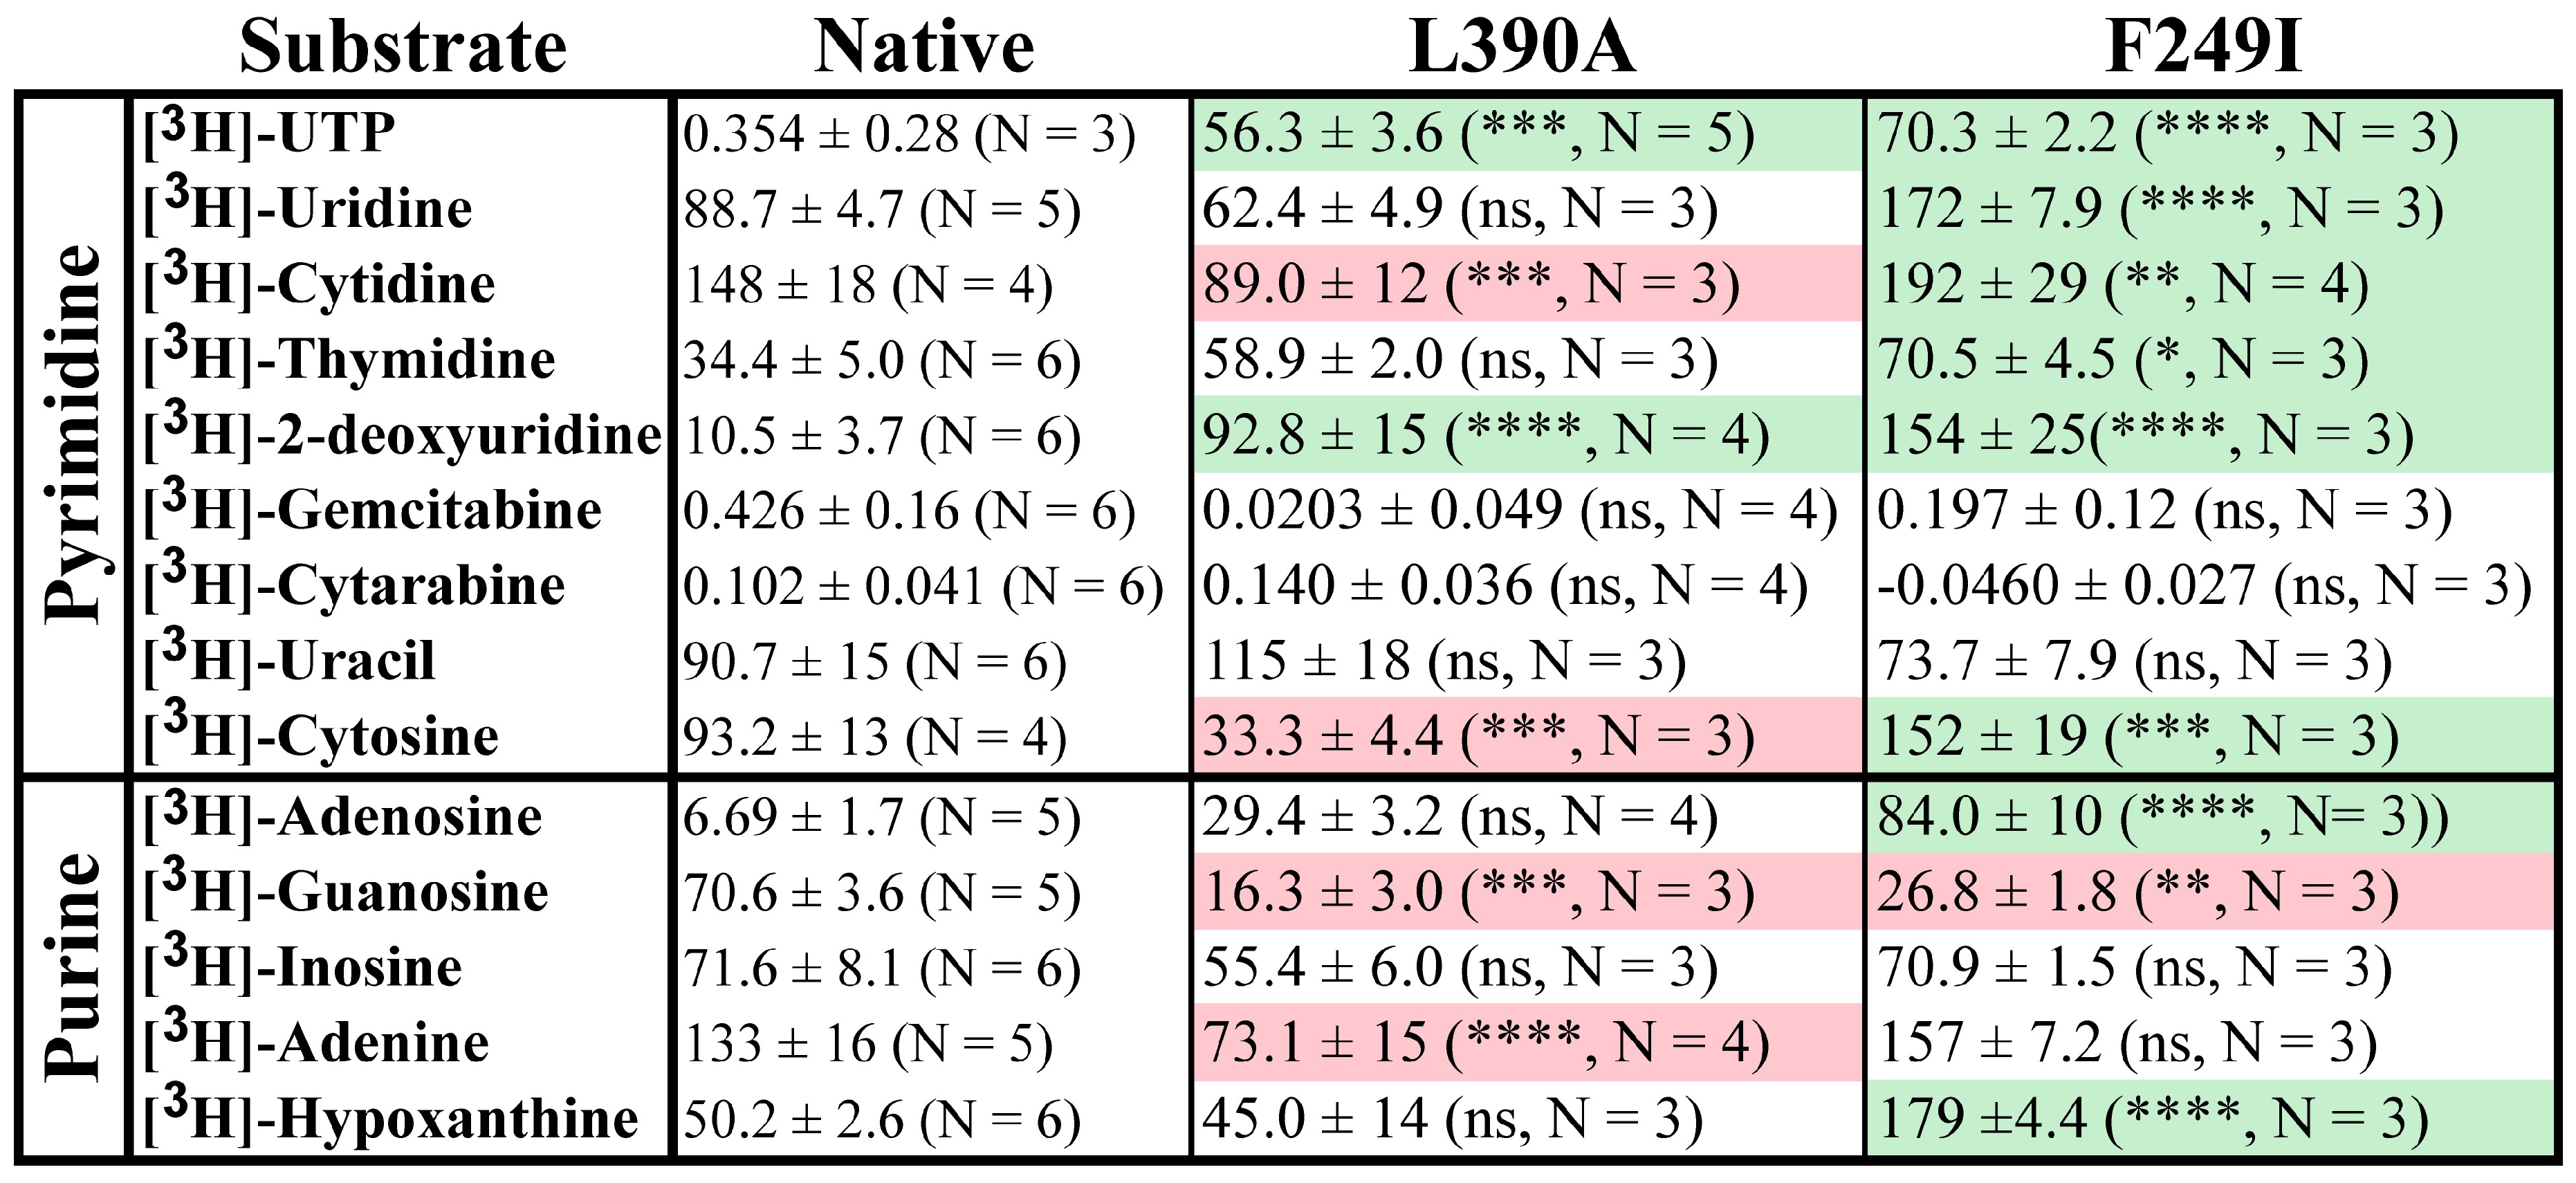
In the present studies, substrate uptake by PLs is determined post vacuum filtration, following a 3.5 h incubation with 100 nM tritiated substrate, by quantifying the radioactive signal on borosilicate filters using liquid scintillation counting. In an effort to preserve hydrophobic side chain characteristics, while probing functional alterations, a conservative isoleucine mutation was made at F249, while L390 was mutated to alanine. It has been repeatedly demonstrated that ENTs are capable of distinguishing between nucleosides and nucleotides, as no ENT ortholog has demonstrated transport of substrates containing phosphorylation on the C(5′) position of the ribose sugar [22,23]. However, when the L390A and F249I mutations were examined, statistically significant [3H]-UTP transport was observed (Figure 1) for both. Further examination of the mean transport profiles for both mutations revealed that the F249I mutant generally increased transport, while the L390A mutation resulted in a reduction of mean transport. Specifically, F249I increased transport for [3H]-uridine, [3H]-cytidine, [3H]-thymidine, [3H]-deoxyuridine, [3H]-cytosine, [3H]-adenosine, and [3H]-hypoxanthine (fold increase ranged from 1.3 to 15), while L390A decreased transport for [3H]-cytidine, [3H]-cytosine, [3H]-guanosine, and [3H]-adenine (fold decrease ranged from 1.7 to 8.8, Figure 1). Both mutations resulted in strong increases in [3H]-deoxyuridine (15X, F249I; 8.8X, L390A) transport and decreases in [3H]-guanosine transport (2.6X, F249I; 4.3X, L390A, Figure 1). Additionally, F249I had a greater effect on pyrimidine substrates relative to purine substrates (Figure 1).
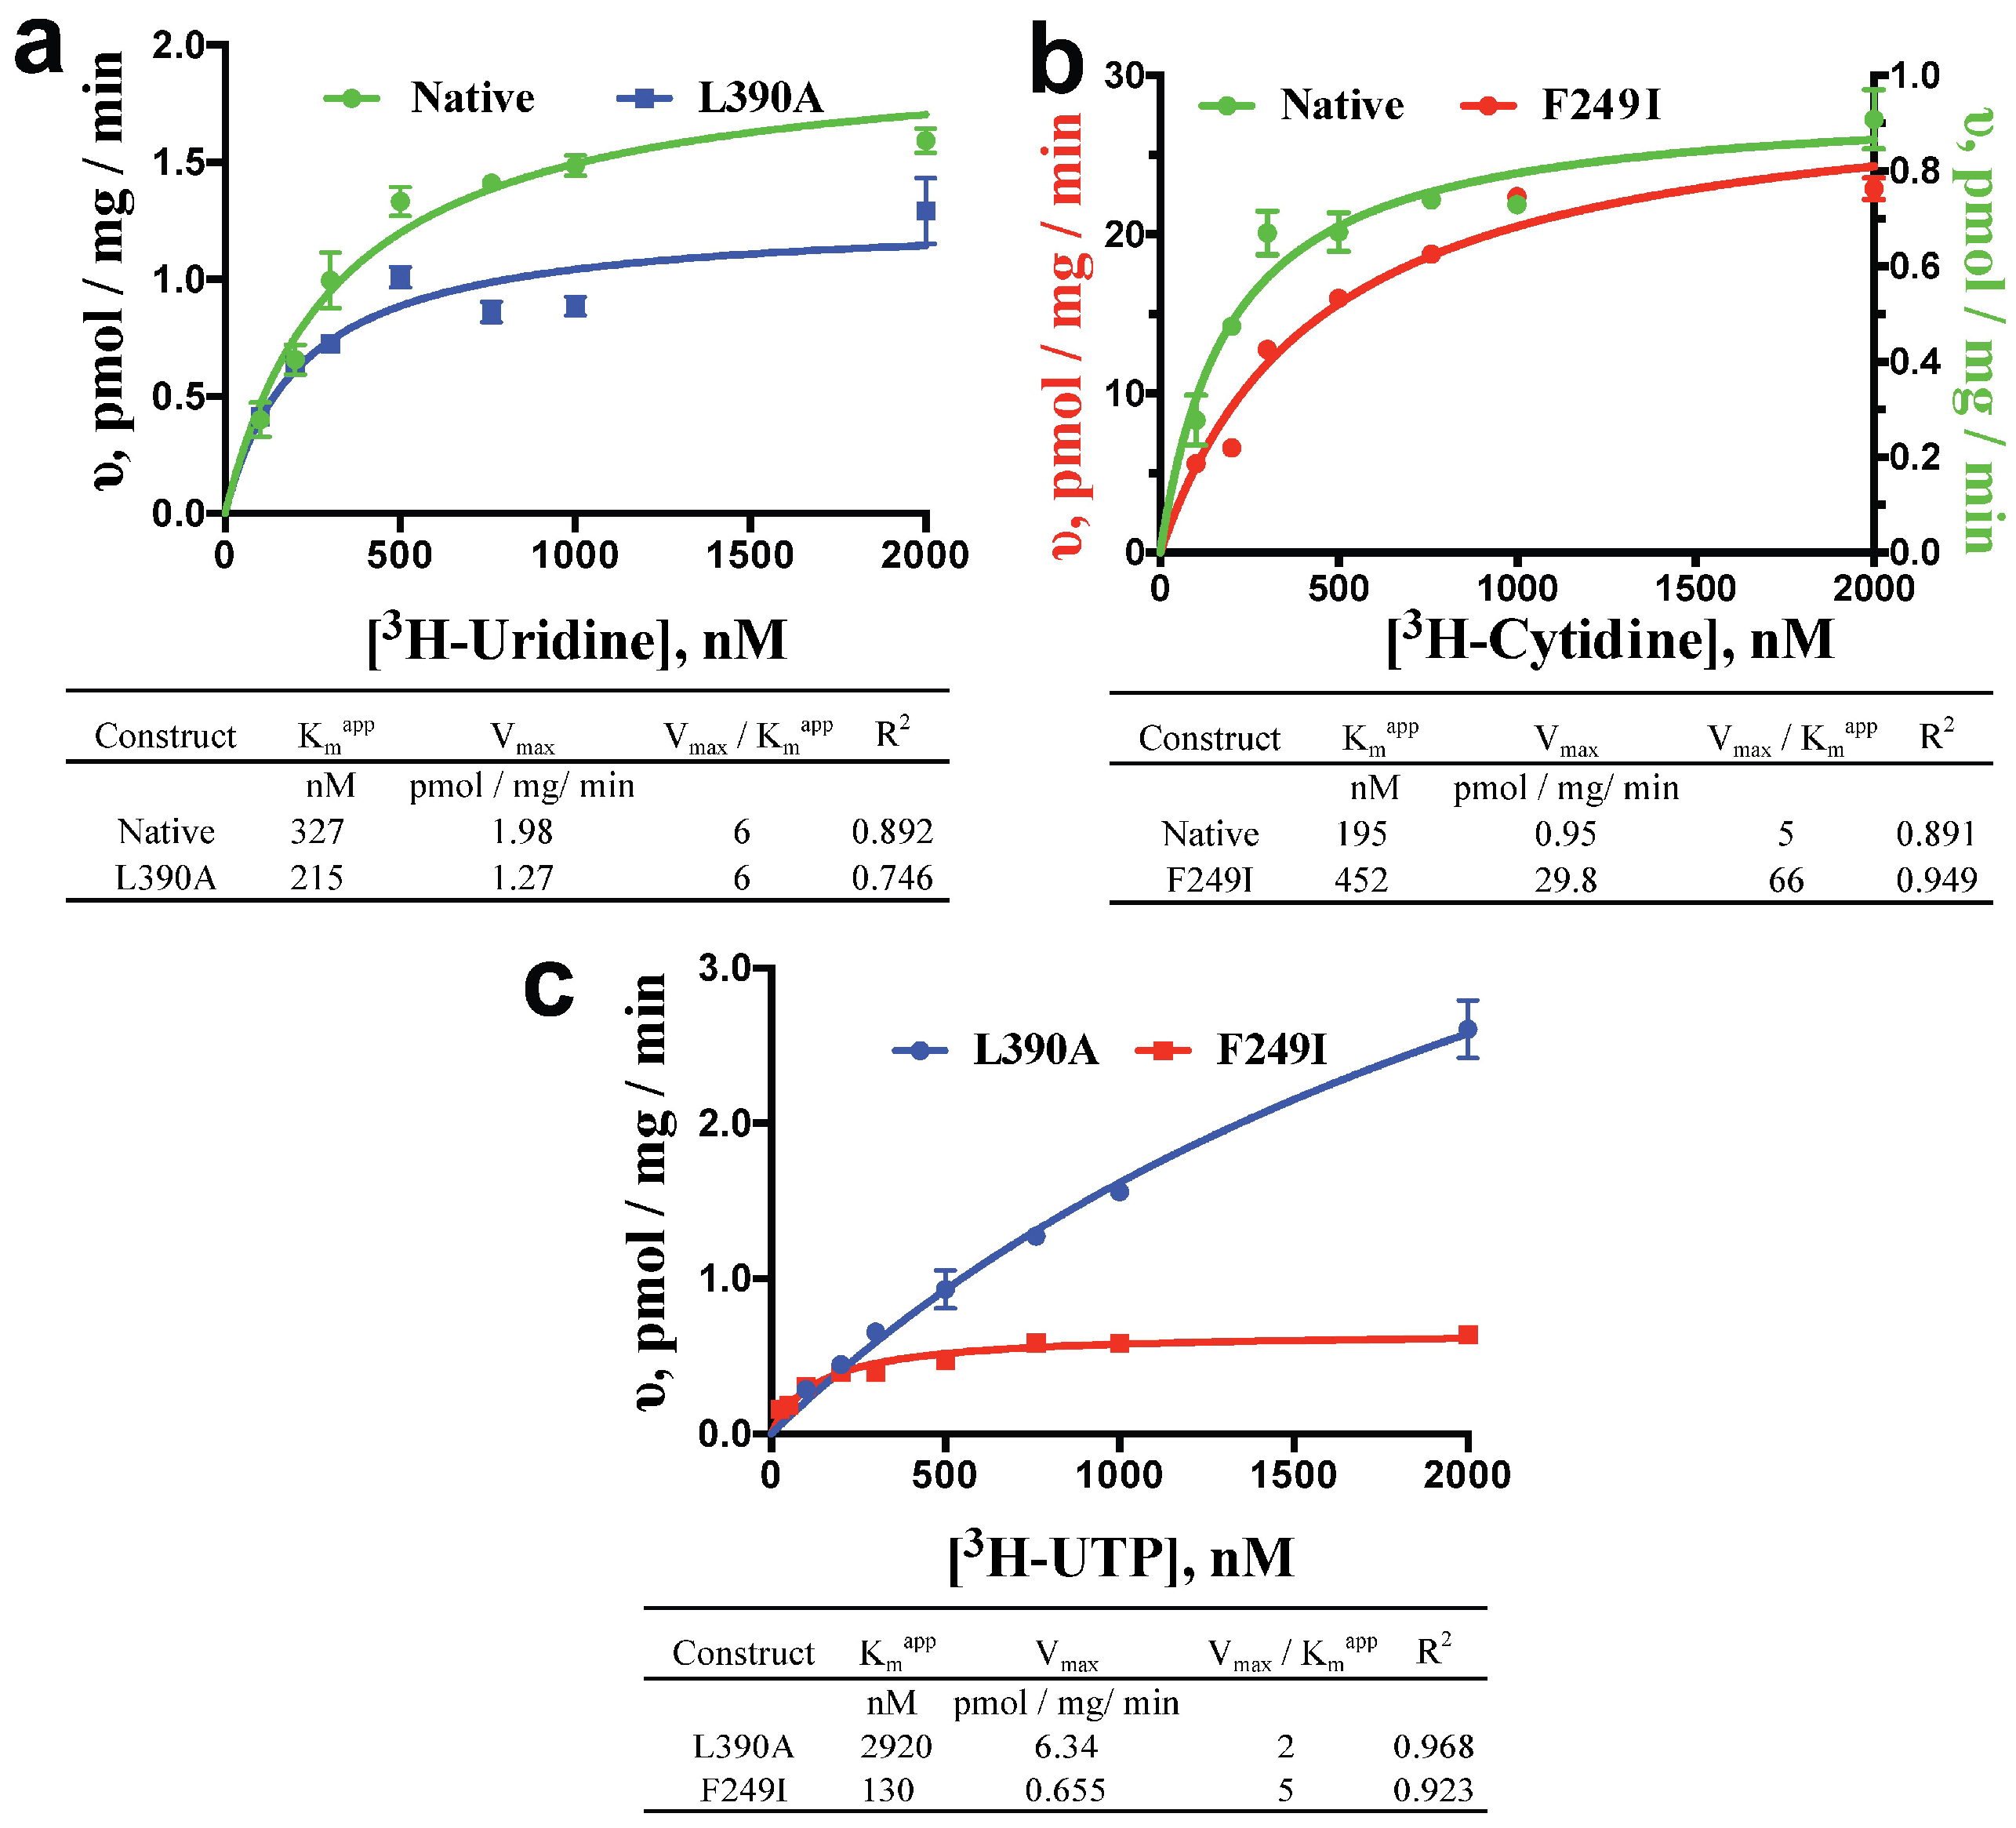
Apparent Km (Kmapp) and Vmax values were determined by measuring substrate influx at various time points and substrate concentrations. Initial uptake rates were linear across 60 min for each substrate concentration tested (Figure S1), and saturable at higher concentrations (Figure 2). The observed linearity across 60 min may reflect a low copy number of active transporter per PL vesicle, though quantitative ScENT1 insertion was observed up to 400 μg which corresponds to ~3% of the total lipid bilayer volume. ScENT1 is presumed to interact with a single permeant molecule during each transport cycle. Therefore, kinetic data was assessed using a simple steady-state Michaelis-Menten model (Figure 2). Kinetic analysis revealed that L390A only slightly decreased the Kmapp (higher affinity) and decreased the Vmax (slower transport) for [3H]-uridine, resulting in no change in transport efficiency when compared to native ScENT1 (Figure 2a), and F249I moderately increased the Kmapp (lower affinity) and drastically increased the Vmax (faster transport) for [3H]-cytidine, yielding an increase in transport efficiency when compared to native ScENT1 (Figure 2b). The observed kinetics for the L390A and F249I mutations correlated to the observed changes in the mean substrate uptake for [3H]-uridine and [3H]-cytidine. When the kinetics of [3H]-UTP transport were examined, L390A exhibited a 2920 nM Kmapp, a Vmax of 6.34 pmol/mg/min, and yielded an overall transport efficiency of 2, and F249I resulted in a Kmapp of 130 nM, a Vmax of 0.665 pmol/mg/min, which resulted in an overall transport efficiency of 5 (Figure 2c). Indeed, the F249I mutant had a higher mean substrate uptake when compared to the L390A mutant (Figure 1). It should be noted, to more accurately determine L390A [3H]-UTP transport activity (Vmax and Kmapp) would require testing higher [3H]-UTP concentrations to obtain saturable conditions. The current experiments were limited by specific activity and concentration of the [3H]-UTP stock solution. As such, the stated Vmax and Kmapp have been extrapolated from the observed transport data (Figure 2c).
2.2. Ab Initio Modeling of FUN26
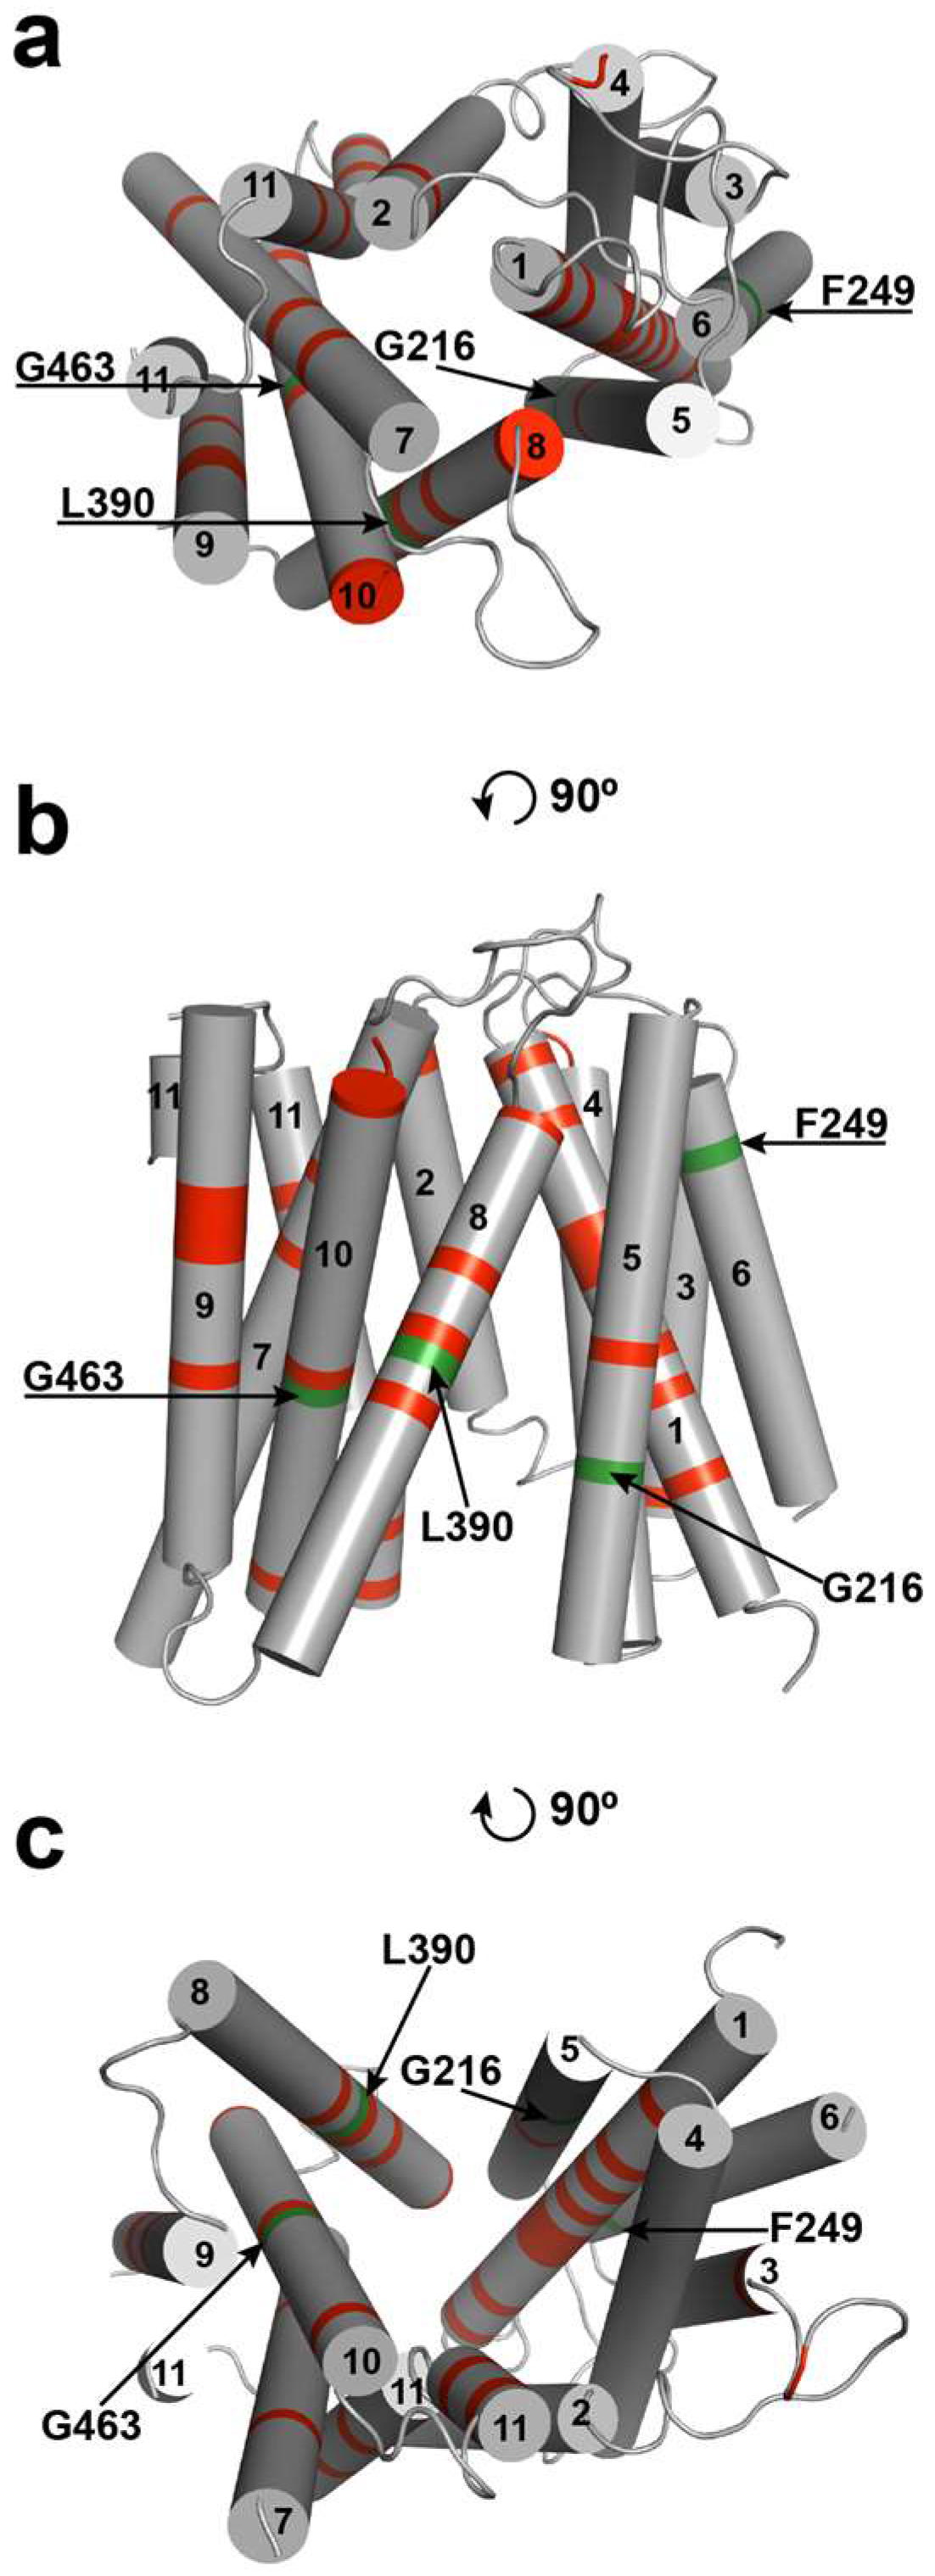
Currently, no ENT molecular structures have been determined using crystallographic, cryo-electron microscopy, or NMR methodologies. Since structural commonality has been noted between other MFS transporters, namely E. coli lactose permease (LacY) [24] and glycerol 3-phosphate transporter (GlpT) [25], a putative ab initio tertiary structural model of ScENT1 was developed based on bacterial sugar transporters with known crystallographic structures (Figure 3). The ScENT1 model depicts 11 TMDs organized similarly to the recognized canonical MFS fold [26], with TMDs 1, 4, 7, and 10 positioned in the center of the transporter; TMDs 2, 11, 5, and 8 positioned surrounding central core helices; and TMDs 3, 6, and 9 located on the outside protein periphery. In our model, ScENT1 is predicted to adopt an inward-open conformation, and is consistent with prior crystallographic observations for other members of the MFS [10] in that the inward-open conformation is a minimal energy configuration and well represented amongst known MFS transporter structures available in the PDB. While the model predicted the 11 TMDs to approximate an arrangement similar to other MFS proteins, it was unable to model the large extramembrane domain located at the N-terminus between TMDs 6 and 7. These regions were shown as large unstructured regions and were subsequently removed from the model to preserve clarity as they have no significant sequence homology to known structures.
Next, the L390A and F249I mutations were mapped onto the ab initio model of FUN26 in order to better interpret potential structural implications of functional results from the PL studies (Figure 3). F249 is predicted to reside at the distal end of TMD6, while L390 is located in the middle of TMD8. Previous studies have shown that aromatic residues within TMDs may contribute to gating [27,28] or substrate selectivity [29,30]. It has also been shown that residues positioned on TMDs outside of central core helices facing the transport pathway may participate in substrate binding [31]. In addition to the F249I and L390A mutations, G216A and G463A were also mapped onto the ab initio structure. G216A and G463A were previously identified as mutations that resulted in loss of [3H]-uridine transport (G463A) or expression (G216A) [12]. G216 is strictly conserved in all ENTs (Figure S2) and has been shown to be essential for ENT1-mediated transport [16]. It also aligns in the region of G184 in ENT1, which has been shown to be involved with targeting ENT1 to the plasma membrane [16]. Additionally, G463 is strictly conserved in all putative ENTs, and corresponds to a non-synonymous SNP found in ENT3 that is associated with H and PHID syndrome (human genetic disorders), and has been found to abrogate ENT3 mediated transport in a manner that is independent of protein abundance or cellular localization [15]. These residues map onto TMD5 (G216) and TMD10 (G463), respectfully.
ENTs are promiscuous transporters that demonstrate broad selectivity for nucleosides, nucleobases, and various nucleoside or nucleobase analogs [3]. This insight has been gained through multiple functional studies using tissue culture, oocytes, crude membrane preparations, and proteoliposomes aimed at assessing ENT function. However, little focus has been centered on the substrates themselves. We recently reported that ScENT1 was sensitive to C(2′)-ribose modifications [12]. Therefore, we analyzed thymidine, deoxyuridine, cytidine, uridine, cytarabine, and gemcitabine using Gaussian 09 to determine if any underlying chemical attributes at the C(2′) position of the ribose ring were directly contributing to substrate specificity. Partial charge distributions (1 to −1) were similar for the two transportable substrates (uridine and cytidine) and cytarabine, a stereoisomer of cytidine (Table S1). Removal of the C(2′)-hydroxyl group produced a partial charge distribution at the C(2′)-ribose increasing negativity for deoxyuridine and thymidine when compared to the transportable substrates, but remained similar between the two C(2′)-deoxy compounds (Table S1). The most notable difference was caused by the electron withdrawing C(2′)-difluorine substitution on gemcitabine (Table S1) causing Mulliken charges to become increasingly positive (~0.80 vs. ~0.15). When the electrostatic surface potentials were examined, the stereoisomer cytarabine was observed to have an increased positive potential centered above the ribose ring (Figure S3) that was absent in transportable substrates and other substrates with C(2′)-ribose modifications (Figure S3).
2.3. ScENT1-Mediated Transport is Attenuated by Alcohols
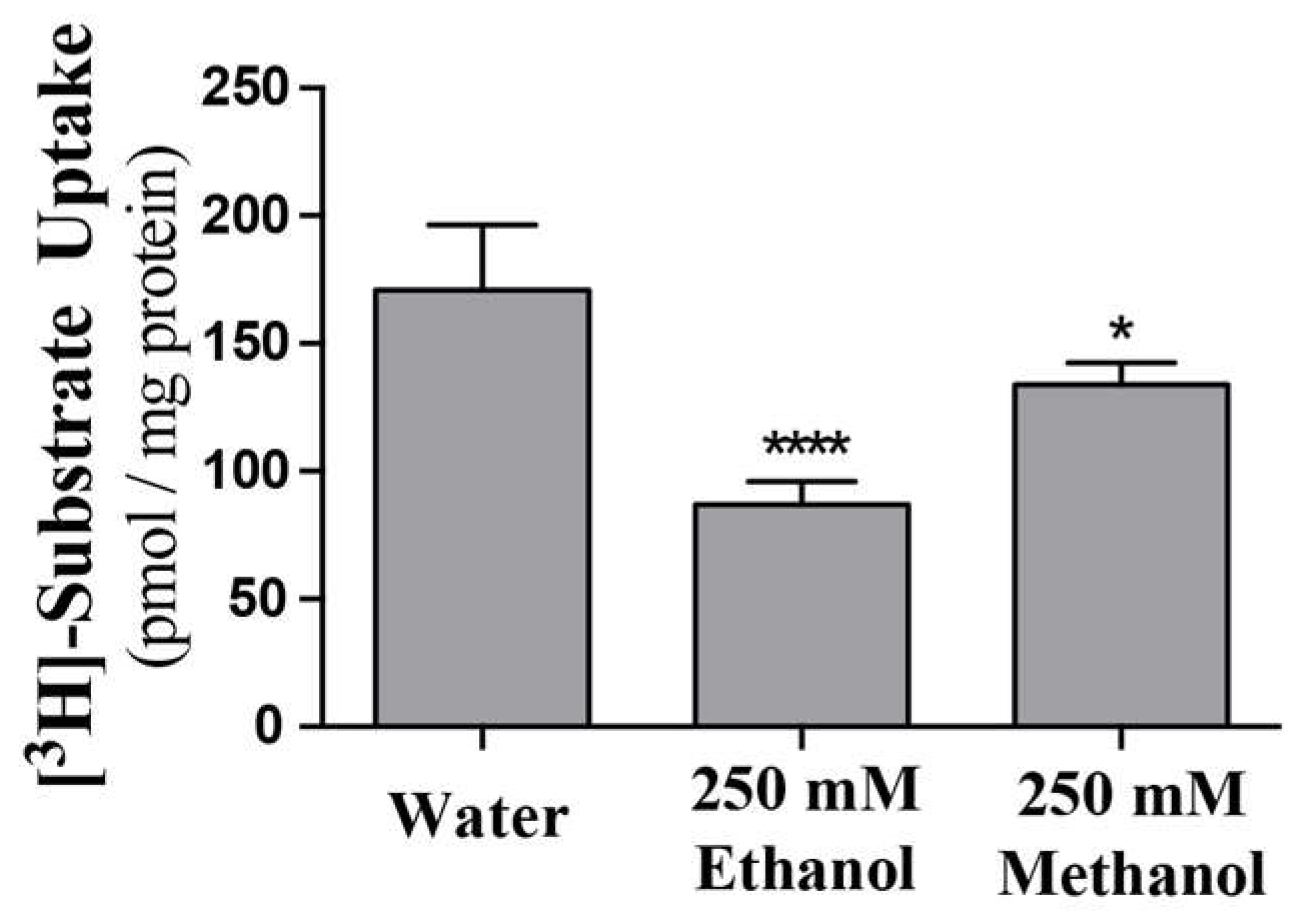
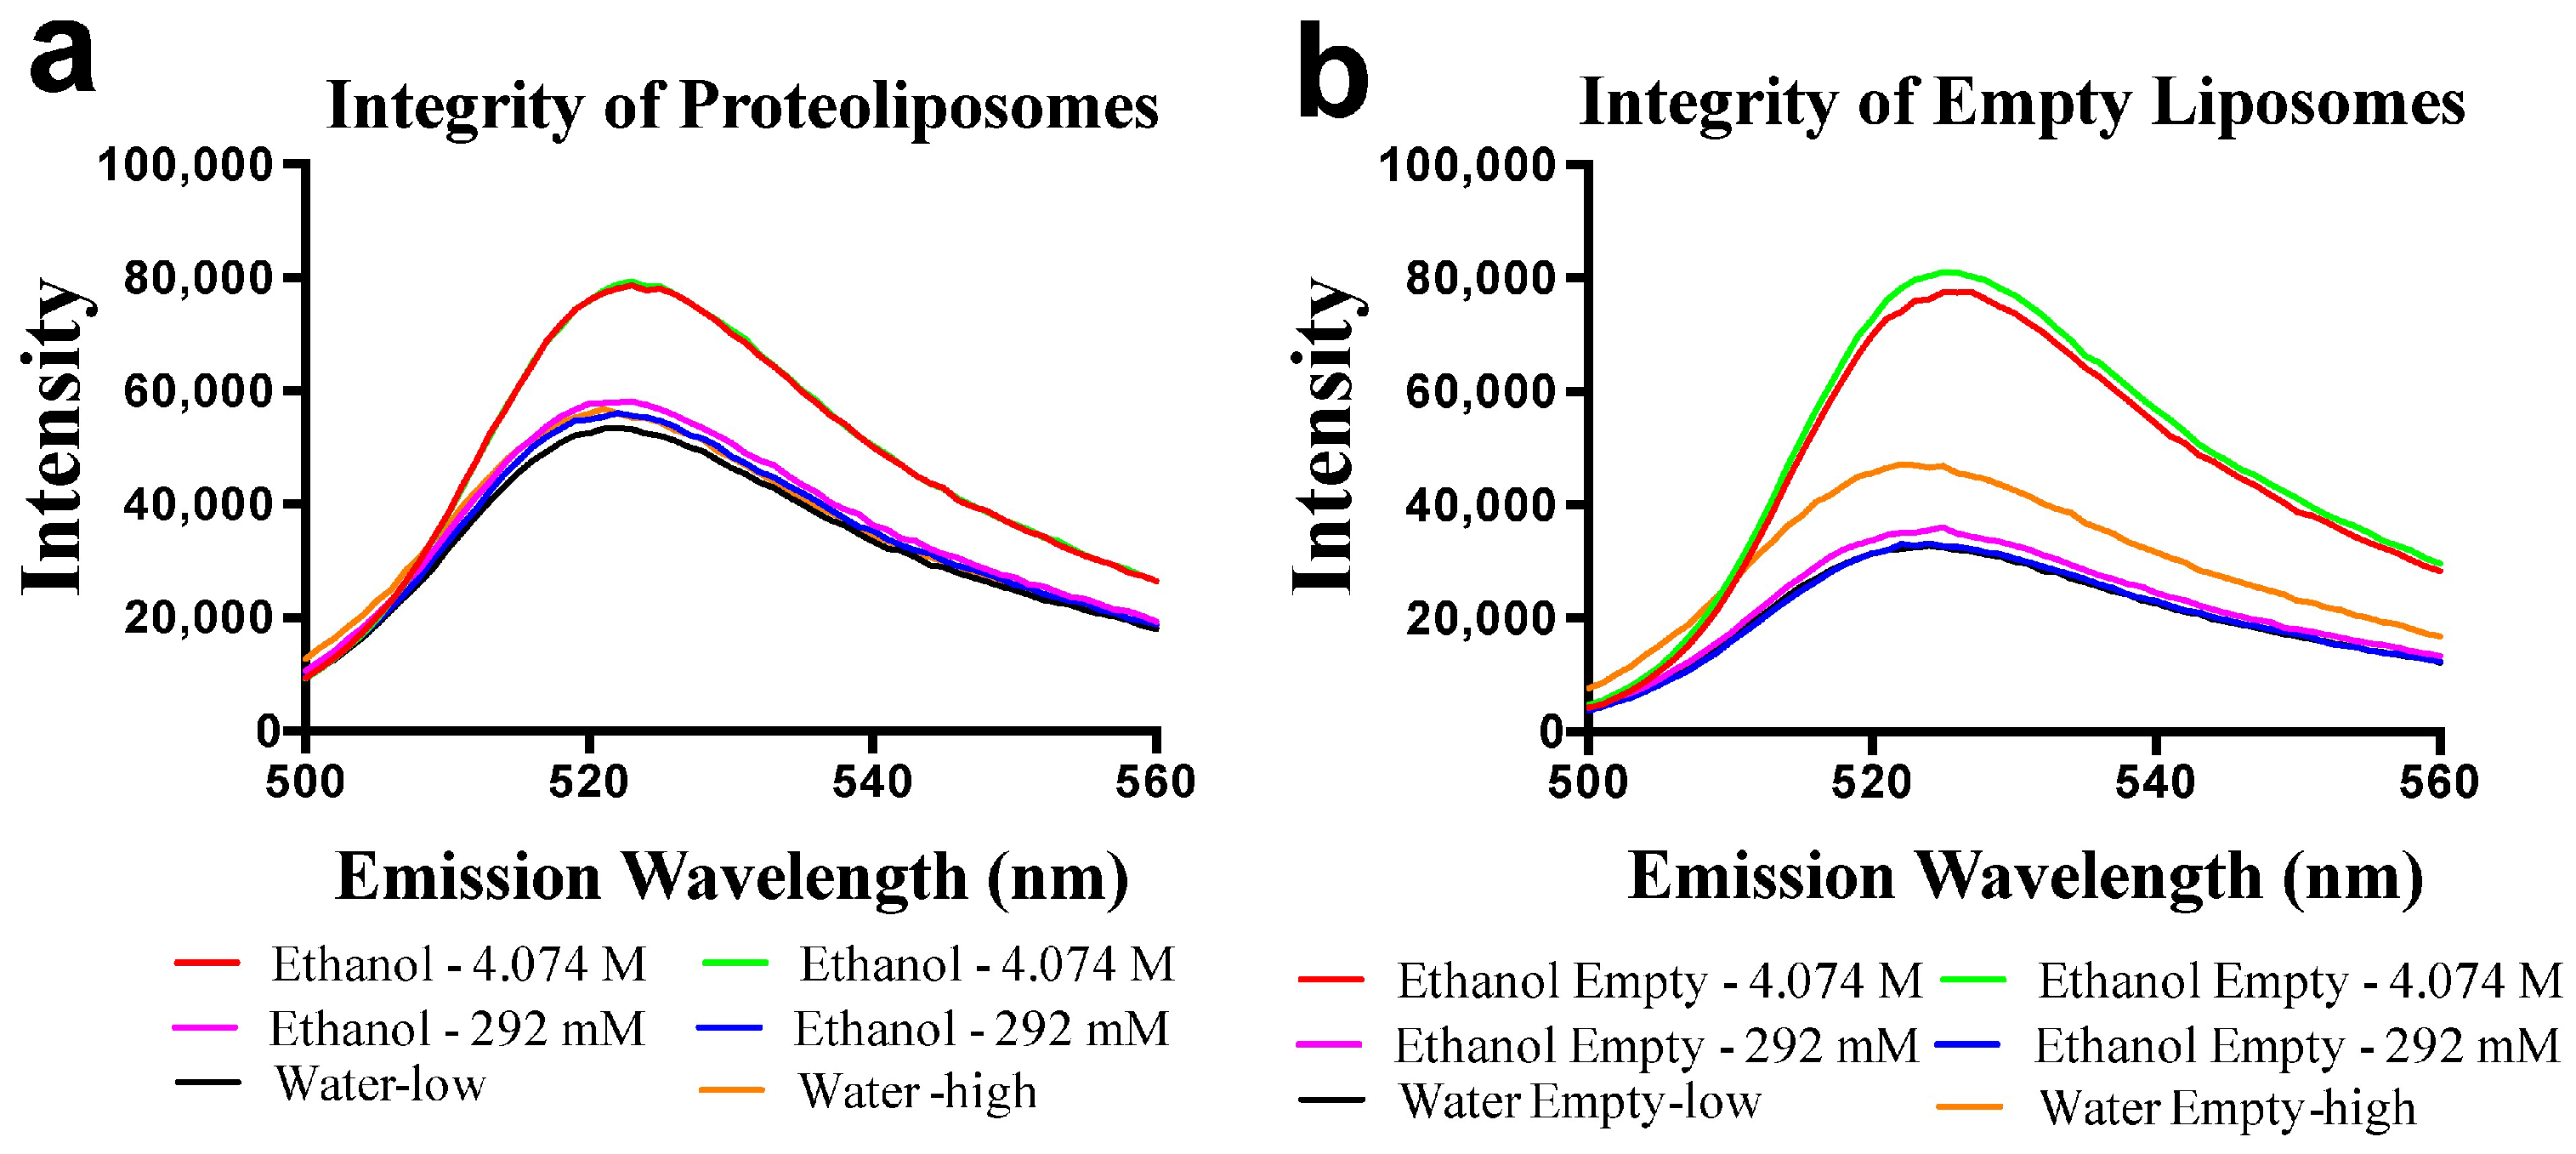
Previous data suggests, or infers, that ENT’s may be directly inhibited by ethanol or other alcohols [17,18,19]._ENREF_29 Using purified ScENT1 reconstituted into PLs, we observed attenuated ScENT1-mediated transport of [3H]-uridine (100 mM, Figure 4) in the presence of ethanol (250 mM) and, to a lesser extent, methanol (250 mM). This is the first demonstration of direct alcohol-mediated transport modulation using a purified ENT. This was confirmed after verifying that the observed decrease in [3H]-uridine transport was not due to disrupting the artificial membrane environment of the PLs or empty liposomes containing 50 mM CF in the luminal volume (Figure 5 and Figure S4). In fact, ethanol did not have a substantial impact on PL integrity until it surpassed ethanol concentrations greater than 1.1 M and the integrity of empty liposomes was intact until ethanol surpassed 400 nM (Figure S4). A more comprehensive study is required to determine what affect, if any, lower ethanol concentrations have on ScENT1 and hENT transport activity.
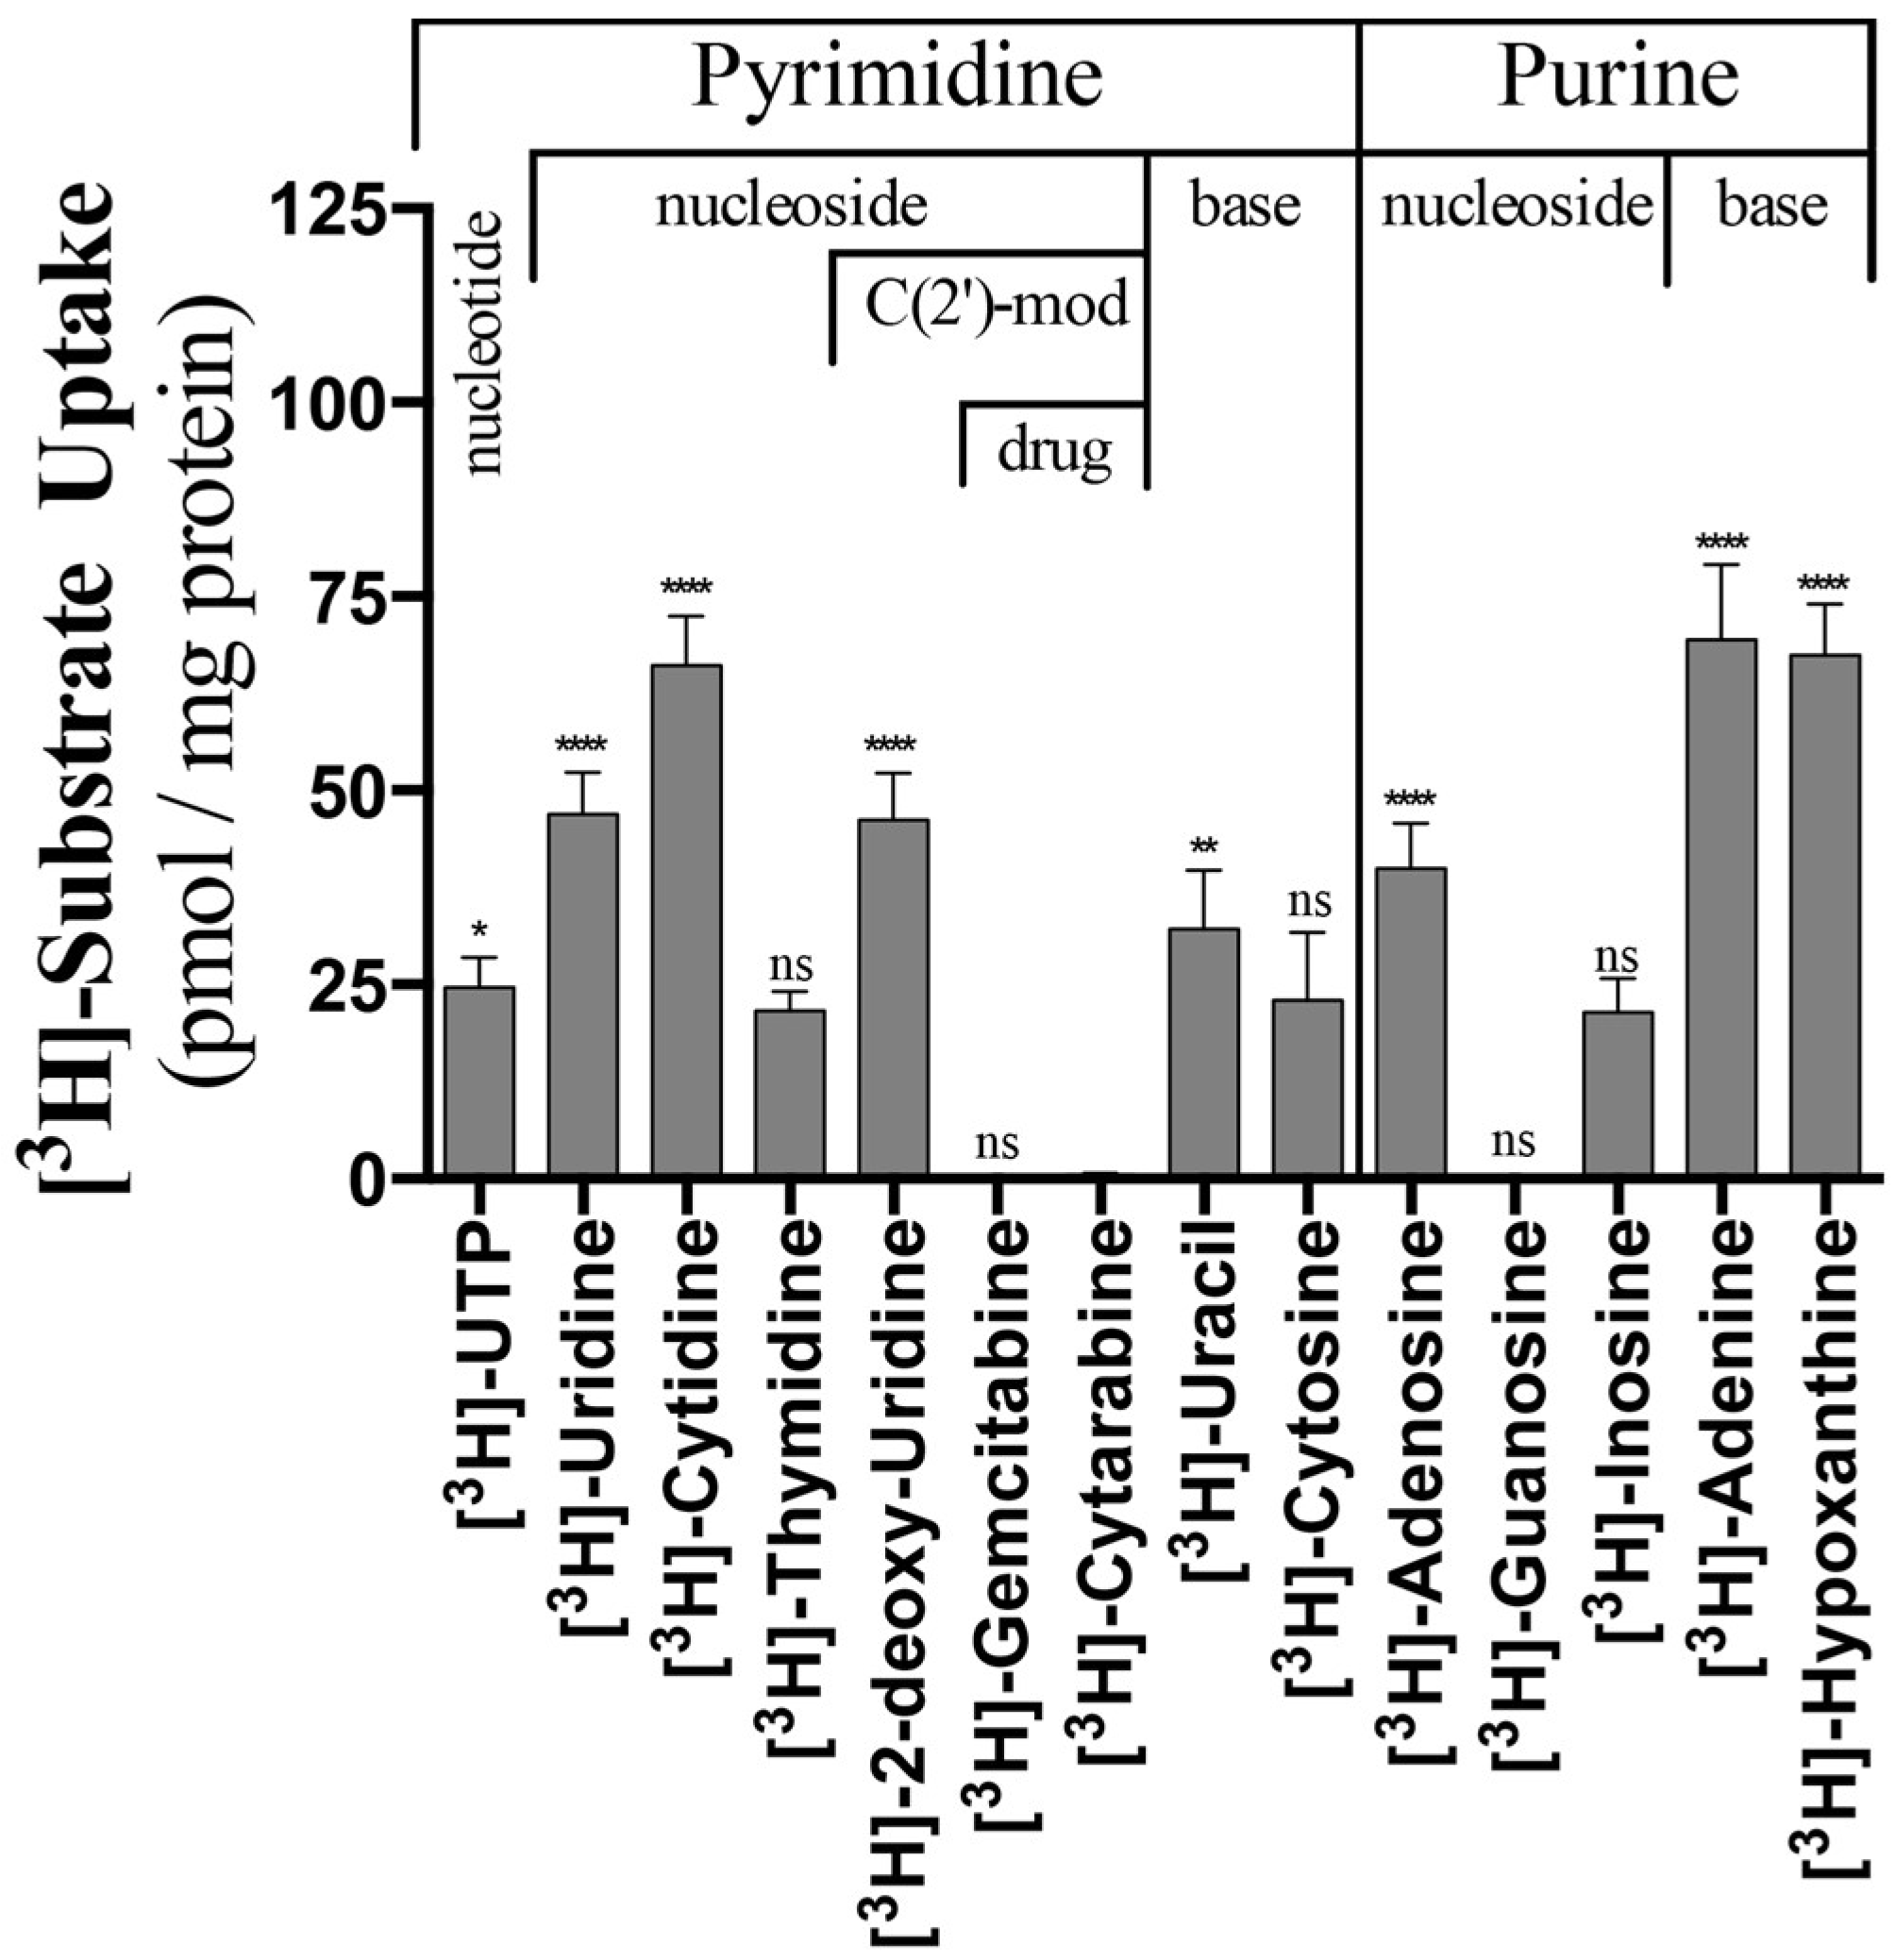
Considering this new observation that alcohols modulate ScENT1 uridine transport activity, we sought to remove all reagents containing primary or secondary alcohols in light that they may alter substrate specificity and transport. Our standard approach for protein and PL preparations utilize protease inhibitors suspended in 2-propanol, the reducing agent β-mercaptoethanol, and glycerol for protein stability. We developed protein production and PL preparation protocols that removed all sources of residual alcohols. Complete removal of residual alcohols (2-propanol and β-mercaptoethanol) from the purification scheme did not alter protein stability or yield. However, glycerol was required during the initial purification stages (pre-SEC) to maintain protein stability [32]. We then retested the alcohol free (–OH) ScENT1 preparations (wildtype and mutant) to look for alterations in substrate transport properties (Figure 6). Interestingly, ScENT1 (–OH) is gained [3H]-UTP, [3H]-deoxyuridine, and [3H]-adenosine transport activity—substrates not transported in the presence of residual alcohols. A loss of significant transport is observed for [3H]-thymidine, [3H]-cytosine, and [3H]-guanosine (Figure 6). The transport profile obtained in the absence of residual alcohols was altered when compared to ScENT1 expressed in oocytes [13], but ScENT1 (–OH) is in agreement that it now transports [3H]-adenosine—a substrate known to be transported by all ENTs [3]. Surprisingly, we see that ScENT1 (–OH) is capable of transporting [3H]-UTP. ENT-mediated transport of substrate containing a C(5′)-ribose triphosphate modification is a novel observation [3]. When we compared ScENT1 (+OH) to ScENT1 (–OH) (Figure S5a) the +OH PLs have a statistically significant increase in mean substrate uptake for most substrates tested. The increase in mean substrate transport for (+OH) preparations also held true for the F249I mutants, while the L390A mutant transport profile was less varied (Figure S5b,c).
Next, the L390A (–OH) and F249I (–OH) mutants were compared to native ScENT1 (–OH) containing PLs. F249I (–OH) still results in a general increase in mean substrate uptake, but L390A (–OH) now gives a more mixed profile (Figure S6). F249I (–OH) also shows a strong preference for increasing transportability of purine substrates tested in this study (Figure S6). In contrast, L390A (–OH) preferentially increases the uptake of pyrimidine nucleosides (Figure S6).
3. Discussion
ENT proteins modulate transmembrane flux for a broad range of nucleoside and nucleobase-derived small molecules, including human therapeutics, yet the underlying molecular mechanism and structure are unknown. This gap in understanding is derived from difficulties associated with overexpressing, and purifying, functionally active full-length ENT proteins [3,33,34]. Only recently has it been reported that ENTs are capable of being solubilized by detergents and functionally analyzed in purified form using proteoliposomes [12] (S. cerevisiae FUN26) or by microscale thermophoresis [11] (A. thaliana ENT7). The present study utilizes purified wildtype, and mutant, ScENT1 protein reconstituted into defined liposome systems to further assess how this family functions at the molecular level. Three conserved residues (L390, F249 and G216) and a known human SNP (G463) were selected based upon sequence alignments (Figure S2) and computational modeling (Figure 3) [27].
L390 is a highly conserved hydrophobic residue in TMD8 and positioned in the middle of an NXXD(X,L)XGR motif that is strictly conserved in hENT1-3, bovine ENT1-3, rat ENT1-3, mouse ENT1-3 and LdNT1.1 (Figure S2). The observation that L390A was able to alter the substrate profile and generally reduce mean substrate transport, combined with its positional location in the ab initio model, suggests that it is directly involved with substrate translocation through the protein interior. While TMD8 of MFS transporters is positioned outside of the core helices and is generally thought to mediate an interface between N-terminal and C-terminal domains [10], sidechains that project into the transport pathway can participate in substrate binding. F249 is a strictly conserved residue in TMD6. Substitution of the F249 aromatic sidechain with a hydrophobic isoleucine residue preserved transporter function, albeit with higher mean uptake and an altered transport profile. TMD6 has been previously implicated with substrate binding in Mhp1 [35], nucleobase transport activity in rat ENT2 [36], and part of a π interaction network [20] in sodium symporters. Given that aromatic residues distally placed on helices have been shown to be involved with transporter opening and closing, or “gating”, mechanisms [20,27,28], F249 of ScENT1 may contribute to cytoplasmic gating by stabilizing the cytoplasmic loop region [12]. Additionally, F249 may form stabilizing CH–π or cation–π interactions with the interhelical loop or with adjacent helices that aid in transitioning between conformations. Furthermore, a linker domain consisting of 30–100 amino acids links TMD6 to TMD7 and connects the N-terminal and C-terminal regions of ScENT1. Previous studies suggest this region forms an unstructured loop [26,27,28], though no structures have been determined. In the present study, this linker region and the large N-terminal domain were removed in ab initio models to provide clarity. Thus, F249 may also play a role in modulating TMD6 dynamics and overall ScENT1 conformational variability.
Residue G216 is positioned outside of the core helices in TMD5 (Figure 3). This transmembrane helix has been associated with nucleobase transport in rat ENT2 [36], protein targeting to the plasma membrane [16], and transporter function [37]. We previously observed that the G216A mutation resulted in significant attenuation of ScENT1 expression [12]. This would suggest that the G216 position is essential for proper protein folding or membrane targeting. However, like L390, G216 maps onto the region suspected of interacting directly with substrate, and if the sidechain projects into the translocation pore it may be involved with substrate binding. Likewise, we propose that G463 is also involved in direct substrate binding interactions. G463A is a known human SNP found in hENT3 and associated with the autosomal recessive disorders H syndromes, pigmentary hypertrichosis and non-autoimmune insulin-dependent diabetes mellitus (PHID) syndrome, familial Rosai-Dorfman disease, and histiocytosis-lymphadenopathy plus syndrome [15]. These syndromes are associated with pancreatic exocrine insufficiency, stunted growth, pubertal delay, persistent inflammation, and cardiomyopathy. G463 is conserved in ScENT1 (Figure S2) and predicted to reside in TMD10 according to the ab initio model. TMD10 has been shown to be involved in substrate binding and release [10,31] and an intracellular gating mechanism in LdNT1.1 [28]. We previously reported that, like G463′s hENT3 counterpart, even a minor mutation to alanine results in the loss of uridine transport, while maintaining expression levels comparable with native ScENT1 [12]. These results, combined with the location of G463 on the ab initio model, would suggest that G463 is directly involved with the binding of substrate. However, any interpretation of mutagenesis data in the absence of an atomic structure must be done so with caution as point mutations may disrupt protein structure (either locally or distally).
Using ScENT1 reconstituted PL assays [12], these data demonstrate that ScENT1-mediated transport of uridine is attenuated in the presence of ethanol (Figure 4). The reduction in mean transport does not result from decreased membrane integrity (Figure 5 and Figure S4). It is unknown if ethanol attenuation is the result of specific protein interactions with either the cytoplasmic or luminal face of ScENT1, the translocation pore itself, or changes in PL fluidity or lipid dynamics. Protein insertion into the artificial membrane environment is stochastic with ENT’s functioning as bidirectional transporters along a concentration gradient. 250 mM ethanol attenuates ScENT1-mediated uridine transport by approximately 50%, suggesting either facio-specific binding interactions or conformation-dependent binding. When residual primary and secondary alcohols were removed from protein purification steps, a shift in the substrate transport profile was observed allowing for passage of larger molecular volume substrates (e.g., UTP and adenosine as shown in Figure 6 and Figure S5a).
Given that wildtype ScENT1 has been observed to have high affinity and broad selectivity for substrates [12], it is expected to play a role in recycling nucleosides and nucleobases between the vacuolar lumen and cytosol. Furthermore, the ability of ethanol [250 mM or 1.46% (v/v)] to modulate ScENT1′s substrate transport profile is expected to be biologically relevant by increasing cytosolic nucleoside/nucleobase concentrations during elevated metabolic stress (e.g., early stationary phase of fermentation). Laboratory strains of S. cerevisiae have low to moderate levels of ethanol tolerance (e.g., 6–12% (v/v) ethanol) while natural or industrial strains can accommodate ethanol concentrations ranging from 16% to 20% (v/v) [38]. Under fermentation conditions, S. cerevisiae cells undergo distinctive metabolic stages during cell growth (latent, exponential growth, early-stationary, and stationary) [39,40]. The early-stationary phase is of particular note since this is when cells reach their highest density until available nitrogen sources are depleted. As fermentation slows, sugar is converted into ethanol which, ultimately, leads to autophagy at elevated ethanol concentrations and depleted metabolic precursors (e.g., nucleosides/nucleobases) [41]. A key component to autophagy is activation of ribosome degradation with targeting of ribosomal RNAs to the vacuole where they are catabolized into individual nucleosides and nucleobases [42]. We hypothesize that ScENT1 mediates flux of these nucleosides/nucleobases back to the cytoplasmic pool to aid in reestablishing metabolic balance. Our results support this hypothesis in that ScENT1 substrate transport profile shifts in the presence of alcohols (Figure S5a). In the absence of alcohols (–OH) ScENT1 is capable of low level UTP transport (Figure 6). One possible explanation for the phenomenon is that, during the exponential growth phase, ScENT1 may export UTP from the vacuole to be utilized by CTP synthetase. CTP synthetase is a cytosolic associated amidotransferase that catalyzes transfer of an amide nitrogen from glutamine to UTP in order to form CTP [43]. CTP synthetase is essential in the synthesis of all membrane phospholipids for eukaryotic cells [44]. Under conditions of ethanol stress and nitrogen starvation, phospholipid synthesis is presumably altered since S. cerevisiae is known to have an altered membrane composition to promote ethanol tolerance [41].
The mean substrate transport of Native-ScENT1, and F249I mutants, were reduced when compared to assays prepared using our previously reported conditions [12] (Figure S5a,b). Interestingly, the L390A mutant was less affected by alcohol relative to the F249I mutant or wildtype constructs (Figure S5c). These data may suggest, when combined with structural implications of L390, that ethanol interacts with the translocation pore in a conformation dependent manner. The odorant binding protein LUSH from Drosophila melanogaster has been previously shown to bind alcohol through a set of concerted hydrogen bonding interactions [45]. Hydrogen bonding networks coupled to substrate transport have also been previously observed in numerous MFS transporters, including LacY [46]. The concentrations of 2-propanol and β-mercaptoethanol were 130 mM and 5 mM, respectfully, prior to membrane insertion and purification by SEC—therefore, the final concentrations of each is negligible. However, minimal concentrations of alcohols possessing higher lipid solubilities may still increase membrane fluidity without decreasing integrity, thus lowering activation barriers and allowing ScENT1 to have more conformational flexibility. While alcohols have been associated with promoting secondary structure [47,48,49], they more commonly act as protein denaturants. An alternative explanation for the observed alcohol effects is that alcohols induce a non-native conformation, which alters substrate specificity and transport, by reducing available hydrogen bonding interactions through dehydration of solvation shells surrounding exposed amino acids.
One of the main hurdles that industrial fermentation using S. cerevisiae must overcome is ethanol induced toxicity. The mechanisms of ethanol tolerance remain poorly understood. Ethanol is known to modulate cellular transport systems [50], cell metabolism, and biosynthesis of macromolecules [51]. From a physical perspective, ethanol directly impacts membrane composition and fluidity and protein (both hydrophobic and hydrophilic) conformation and stability [52]. The observation that ethanol attenuates ScENT1-mediated uridine transport is consistent with previous observations on other yeast systems and proteins. For instance, ethanol alters yeast amino acid permease, itself an IMP, function and activity [53]. Additionally, systematic mutation sets, in S288C ScENT1-null cells, decrease resistance to ethanol induced stress [54] and decrease utilization of glutamine, a key nitrogen source in metabolically active yeast [55]. In addition to systematic mutation sets, classical genetics using S288C ScENT1-null cells demonstrate that NAD+ accumulation decreases [56] and N-ribosylnicotinamide (NmR) accumulation and excretion is increased [14]. Furthermore, ScENT1 contributes to the redox state of S. cerevisiae by transporting NmR [14,56], a nucleoside precursor of NAD+. Given that ScENT1 is suspected to be a regulator of metabolic precursors contained within the vacuole by maintaining concentrations of cytoplasmic pools, we hypothesize that ScENT1 is capable of sensing ethanol and modulating its transport capabilities in response to ethanol induced stress.
Human ENTs, specifically hENT1, have also been associated with ethanol inhibition [19,21,57], preference for the consumption of ethanol [8], and SNPs associated with alcohol withdrawal seizures [7]. The ability of hENT1 to regulate adenosine flux, has recently been shown to affect glutamate release, thus regulating glutamatergic neurotransmission [6] while hENT1 inhibitors were shown to attenuate seizure severity [6]. In light of these recent findings, hENT1 may play a role in epilepsy and seizure activity associated with alcohol withdrawal syndrome. Indeed, genetic polymorphisms of hENT1 are associated with alcoholism and an increased risk of alcohol withdrawal seizures [7]. ENT1 knockout mice have increased voluntary ethanol self-seeking behaviors associated with increased resistance to acute ethanol intoxication and reduced aversive effects of ethanol [18,58]. Mutational analysis has also identified residue I216 in hENT1 as contributing to ethanol sensitivity [59]. Ethanol was previously demonstrated to reduce gemcitabine cytotoxicity in HTB2 cells, which are derived from a human papilloma [17]. hENT1 protein expression level is strongly correlated with patient outcomes and drug sensitivity in cancer therapies that utilize nucleoside analogs such as cytarabine (e.g., leukemia or lymphoma) or gemcitabine (e.g., pancreatic or lung cancer) [4,60,61,62,63,64,65,66,67]. A definitive correlation is unknown though hENT1-dependent (e.g., inhibition of hENT1 function or modulation of hENT1 expression level) and hENT-independent (e.g., attenuated deoxycytidine kinase activity, increased MDR1 activity, RRM, etc.) mechanisms have been proposed.
4. Materials and Methods
4.1. Molecular Cloning and Protein Expression
Native FUN26 and single point mutants (L390A and F249I) were cloned as described previously (12). Protein expression utilized W303-Δpep4 (leu2-3, 112trp1-1, can1-100, ura3-1, ade2-1, his3-11, 15 Δpep4MATα) S. cerevisiae cells that were transformed using sheared salmon sperm DNA. Yeast cells positive for the native FUN26, L390A, or F249I transformants were grown in 1× synthetic complete histidine dropout media (SC-His) containing 1× Complete Supplement Mixture minus histidine (CSM-His, Sunrise Science Products, San Diego, CA, USA, catalog No. 1006), 0.67% (w/v) yeast nitrogen base without amino acids, 1% (w/v) glucose, and 1% (w/v) raffinose. Cultures were grown in 10 L working volumes using a 12 L fermenter at 30 °C with 500 μL of Antifoam 204. Agitation was set from 200 to 350 rpm based on a dissolved oxygen range of 90% to 20% with an airflow rate of 2.5 L/min Each round of protein expression contained 7.125 L of 1× SC-His media, and 375 mL of overnight culture. Following 24 h of growth, protein expression was induced by adding 2.5 L of yeast extract-peptone-galactose containing 8% (w/v) yeast extract, 16% (w/v) peptone, and 8% (w/v) galactose. After induction, cells were grown for 16 h at 30 °C using the same dissolved oxygen based agitation scheme described above. Airflow was increased to 5.0 L/min post induction. Cells were harvested by centrifugation at 3600× g for 30 min at 4 °C.
4.2. Membrane Preparation, Solubilization and Purification
Native ScENT1 and corresponding mutants, were purified following a previously published detailed protocol (12). Briefly, cells were disrupted at ~28,000 psi using an Avestin C-3 Emulsiflex, membranes were collected by ultra-centrifugation (101,000× g), and solubilized using ~9 mM N-dodecyl-β-d-maltoside (DDM). Proteins were initially purified using TALON cobalt resin (Pierce, catalog No. 89965) followed by size exclusion chromatography on a Superdex 200 10/300 (GE Healthcare, Little Chalfont, UK, catalog No. 17-5175-01) column. Alcohol free preparations (–OH) were obtained by the removal of DHALT and PMSF protease inhibitors, and β-mercaptoethanol at all steps from cell harvest through final protein preparations. ScENT1 preparations were validated using SDS-PAGE, western blotting using an anti-poly histidine tag (Millipore Sigma, Burlington, MA, USA, catalog No. AB3517), and sequencing of protein digests using mass spectrometry.
Preparation of proteoliposomes (PLs) containing FUN26 and empty liposomes has been described previously [12]. Assays denoted as +OH utilized protein preparations containing residual alcohols from protease inhibitor cocktails (DHALT or PMSF) and β-mercaptoethanol while, –OH denotes their absence. Carboxyfluorescein (CF)-containing liposomes and PLs were prepared by resuspending the lipid mixture (28.25 mg E. coli polar lipids and 1.6 mg chicken egg l-α-phosphatidylcholine per mL of buffer) with 50 mM KH2PO4 pH 7.4 buffer containing 50 mM CF [5(6)-carboxyfluorescein] prior to extrusion. Empty CF-liposomes and CF-PLs were then prepared and purified as previously described for the non-CF containing empty liposomes and PLs [12]. Tritium based functional assays were performed using the methods and tritiated substrates described previously [12]. Briefly, PLs are incubated with a tritiated substrate for a controlled amount of time. Substrate influx is terminated using vacuum filtration. Substrate uptake is observed by the presence of radioactive signal on borosilicate filters following vacuum filtration; the filters capture the PLs or empty liposomes while allowing the excess non-luminal substrate to be washed away. Specific substrate transport in pmol/mg of ScENT1 was calculated by:
where CPMsample are the counts on the filter associated with the proteoliposome, CPMcontrol are the counts on the filter associated with the empty liposomes, and SR is the specific radioactivity defined as: total radioactivity (CPM)/pmol of substrate per sample, and was described previously [68]. Ethanol inhibition was determined by pre-incubating –OH PLs (prepared by reconstituting 600 μg of ScENT1 in 200 μL of liposomes) and empty liposomes with 250 mM (ethanol or methanol) for 15 min, then incubating with 100 nM [3H]-uridine for 3.5 h, as previously reported for assays assessing overall substrate accumulation [12], prior to filtration.
Fluorescence based integrity assays were performed on an ISS PC1 photon counting spectrofluorometer (Champaign, IL, USA) at 20 °C using sealed quartz cuvettes. Excitation was initiated at 492 nm and emission was monitored between 500 nm and 560 nm. Equal volumes of alcohol or water were added to each cuvette containing either CF-PLs or empty CF-liposomes. The contents of each cuvette were then mixed and capped off prior to each measurement. Alcohol concentrations ranged from 0 mM to 4.074 M.
4.3. Gaussian Modeling
MarvinSketch version 6.0.3 (ChemAxon, Cambridge, MA, USA) was used to generate 2D models and Cartesian coordinate files for each substrate. The coordinate files were then cleaned using GaussView 5 (Gaussian, Wallingford, CT, USA) and normalized based on the ribose ring prior to being modeled with Gaussian 09 (Gaussian, Wallingford, CT, USA). All substrates were considered neutral with a spin multiplicity of 1. Substrates modeled using Gaussian 09 underwent a tight geometric optimization at a MP2/6-31G** theory level followed by an energy optimization with a full population analysis at the same theory level using both non-solvated and fully water solvated constraints.
4.4. Ab Initio Model of the ScENT1 Inward-Open Configuration
Rosetta version 3.4 (Rosetta Commons, www.rosettacommons.org) ab initio modeling software was used to generate an MFS-anchored comparative structural model of ScENT1 [69]. Structure fragments were generated using the SAM-T99 and PSI-PRED secondary structure prediction methods. Twenty thousand independent structures were generated and subjected to clustering analysis and binning. Centroids of the three largest clusters were selected with α-carbon backbones compared relative to the outward-open FucP transporter structure (PDB ID: 3O7P) [70]. The top three structures represented minimal relative deviation to each other and identical membrane topology as predicted using TMPred [71] and described previously for other ENTs [3]. The most representative Rosetta model was also compared to models generated using MODELLER [72] and LOMETS [73] servers which also produced inward-open models with similar topology to our Rosetta fragment-based ab initio model.
4.5. Statistical Analysis
The significance of mean substrate transport (pmol substrate/mg of ScENT1) by the L390A and F249I mutants relative to native construct was determined by two-way analysis of variance and Dunnett’s multiple comparison test (Figure 1 and Figure S6) relative to [3H]-cytarabine uptake into Native PLs. The significance of alcohol free substrate transport (Figure 6) was determined by comparing mean substrate uptake (pmol substrate/mg of ScENT1) relative to [3H]-cytarabine by ScENT1 using one-way analysis of variance and Dunnett’s multiple comparison test. Significance between –OH and +OH substrate transport assays were made by comparing mean substrate uptake (pmol substrate/mg of ScENT1) of the alcohol free assays to the assays performed in their presence by using multiple unpaired t-test not corrected for multiple comparisons, consistent standard deviations were not assumed, and alpha was equal to 5.000% (Figure S5a–c). Kinetic studies (e.g., Vmax and Km) were fitted directly using nonlinear regression for each individual experiment (Figure 2). Ethanol and methanol inhibition of ScENT1-mediated transport was determined using a one-way analysis of variance and Dunnett’s multiple comparison tests (Figure 4). All statistical analysis was conducted using version 6.03 of GraphPad PRISM 6 for Mac (GraphPad, La Jolla, CA, USA) and Microsoft Excel version 14.0.7106 (Microsoft Corporation, Redmond, WA, USA).
5. Conclusions
ScENT1 (formerly known as FUN26) is the S. cerevisiae ortholog to hENT1-3 and mutagenesis studies have analyzed the function of residues conserved throughout various members of the ENT family. We developed an ab initio model that is consistent with prior models of protozoan ENTs [27,28], and other members of the MFS [10]. While ScENT1 has a unique transport profile relative to other ENTs, it contains conserved elements with similar ENT functions—suggesting similar structural arrangements. Additionally, we show that like hENT1, ScENT1-mediated transport is capable of being attenuated in the presence of ethanol. A clear relationship between ENT function and cancer therapy or mechanistic causes of human disease remain elusive in the absence of definitive structure-function insights [74,75,76]. The current study correlates transport activity with sidechain identity for a small subset of highly conserved amino acids within the ENT family. These data further support, using purified protein, an argument that known human SNPs (e.g., G463 or G216) abrogate ScENT1 transport activity and that presence of specific ENT mutations may be viable screens to guide treatment protocols utilizing nucleoside analog therapeutics. Furthermore, follow-on studies to determine if ScENT1 functions as an ethanol sensor to modulate metabolite transport in response to ethanol induced stress are needed.
Supplementary Materials
The following are available online. Initial uptake rates for [3H]-cytidine, [3H]-uridine, and [3H]-UTP showing linearity across 60 min for wildtype (WT), F249I, and L390A ScENT1 are show in Figure S1. A multiple sequence alignment between ScENT1, human ENTs 1–3, and LdNT1.1 is shown in Figure S2. Electrostatic surface potentials of tested substrates with C(2′) modifications were calculated using Gaussian 09 and shown in Figure S3. Proteoliposome integrity was tested by adding ethanol (0–4.074 M) or equal volumes of water to CF loaded proteoliposomes (a) or empty liposomes (b) and the resultant emission spectra are shown in Figure S4. Figure S5 highlights the differences in transport profiles between alcohol and alcohol-free preparations for Native ScENT1 (a) and the F249I (b) and L390A (c) mutants. Figure S6 compares radiolabeled substrate uptake between Native ScENT1 and the L390A and F249I mutants in the absence of alcohol. Table S1 displays the calculated mulliken charges on the C(2′) carbon of tested substrates with C(2′) modifications.
Acknowledgments
We thank Paul H. Weigel, Christopher West, Rajagopal Ramesh, and Jialing Lin at the University of Oklahoma Health Sciences Center for helpful comments and suggestions. Research reported in this study was supported an Institutional Development Award (IDeA) from the National Institute of General Medical Sciences of the National Institutes of Health under grant numbers P20GM103639 and R01GM118599, Oklahoma Center for the Advancement of Science grant HR11-046 (to F.A.H.), OUHSC College of Medicine Alumni Association seed grant (to F.A.H.), and American Heart Association predoctoral fellowship 13PRE17040024 (to R.C.B-C.).
Author Contributions
R.C.B.-C. and F.A.H. designed and conceived experiments. R.C.B.-C., J.M.J. and F.A.H. conducted experiments. R.C.B.-C. and F.A.H. analyzed data and wrote manuscript.
Conflicts of Interest
The authors declare no conflict of interest.
Abbreviations
| ENT | Equilibrative nucleoside transporter |
| FUN26 | Function unknown now 26 |
| ScENT1 | Saccharomyces cerevisiae equilibrative nucleoside transporter 1 |
| IMP | Integral membrane protein |
| FDA | Food and Drug Administration |
| EMA | European Medicines Agency |
| hENT | Human equilibrative nucleoside transporter |
| TMD | Transmembrane domain |
| MFS | Major facilitator superfamily |
| PL | Proteoliposome |
| SC-His | Synthetic complete histidine dropout media |
| DDM | n-Dodecyl-β-d-maltoside |
| CF | 5(6)-Carboxyfluorescein |
| LacY | Lactose permease |
| GlpT | Glycerol 3-phosphate transporter |
| PHID syndrome | Pigmentary hypertrichosis and non-autoimmune insulin-dependent diabetes mellitus |
| Mhp1 | MAP-Homologous Protein 1 |
| LdNT1.1 | Leishmania donovani nucleoside transporter 1.1 |
| LUSH | General odorant binding protein lush |
| SEC | Size exclusion chromatography |
| NmR | N-ribosylnicotinamide |
| ns | Not significant |
References
- Jacobson, K.A. Introduction to adenosine receptors as therapeutic targets. Handb. Exp. Pharmacol. 2009, 193, 1–24. [Google Scholar]
- Li, R.W.; Yang, C.; Sit, A.S.; Lin, S.Y.; Ho, E.Y.; Leung, G.P. Physiological and pharmacological roles of vascular nucleoside transporters. J. Cardiovasc. Pharmacol. 2012, 59, 10–15. [Google Scholar] [CrossRef] [PubMed]
- Young, J.D.; Yao, S.Y.; Baldwin, J.M.; Cass, C.E.; Baldwin, S.A. The human concentrative and equilibrative nucleoside transporter families, SLC28 and SLC29. Mol. Asp. Med. 2013, 34, 529–547. [Google Scholar] [CrossRef] [PubMed]
- Greenhalf, W.; Ghaneh, P.; Neoptolemos, J.P.; Palmer, D.H.; Cox, T.F.; Lamb, R.F.; Garner, E.; Campbell, F.; Mackey, J.R.; Costello, E.; et al. Pancreatic cancer hent1 expression and survival from gemcitabine in patients from the ESPAC-3 trial. J. Natl. Cancer Inst. 2014, 106, djt347. [Google Scholar] [CrossRef] [PubMed]
- Jordheim, L.P.; Durantel, D.; Zoulim, F.; Dumontet, C. Advances in the development of nucleoside and nucleotide analogues for cancer and viral diseases. Nat. Rev. Drug Discov. 2013, 12, 447–464. [Google Scholar] [CrossRef] [PubMed]
- Xu, Z.; Xu, P.; Chen, Y.; Liu, J.; Zhang, Y.; Lv, Y.; Luo, J.; Fang, M.; Zhang, J.; Wang, J.; et al. ENT1 inhibition attenuates epileptic seizure severity via regulation of glutamatergic neurotransmission. Neuromol. Med. 2015, 17, 1–11. [Google Scholar] [CrossRef] [PubMed]
- Kim, J.H.; Karpyak, V.M.; Biernacka, J.M.; Nam, H.W.; Lee, M.R.; Preuss, U.W.; Zill, P.; Yoon, G.; Colby, C.; Mrazek, D.A.; et al. Functional role of the polymorphic 647 T/C variant of ENT1 (SLC29A1) and its association with alcohol withdrawal seizures. PLoS ONE 2011, 6, e16331. [Google Scholar] [CrossRef] [PubMed] [Green Version]
- Nam, H.W.; Hinton, D.J.; Kang, N.Y.; Kim, T.; Lee, M.R.; Oliveros, A.; Adams, C.; Ruby, C.L.; Choi, D.S. Adenosine transporter ENT1 regulates the acquisition of goal-directed behavior and ethanol drinking through A2A receptor in the dorsomedial striatum. J. Neurosci. 2013, 33, 4329–4338. [Google Scholar] [CrossRef] [PubMed]
- Sundaram, M.; Yao, S.Y.; Ingram, J.C.; Berry, Z.A.; Abidi, F.; Cass, C.E.; Baldwin, S.A.; Young, J.D. Topology of a human equilibrative, nitrobenzylthioinosine (NBMPR)-sensitive nucleoside transporter (HENT1) implicated in the cellular uptake of adenosine and anti-cancer drugs. J. Biol. Chem. 2001, 276, 45270–45275. [Google Scholar] [CrossRef] [PubMed]
- Yan, N. Structural biology of the major facilitator superfamily transporters. Annu. Rev. Biophys. 2015, 44, 257–283. [Google Scholar] [CrossRef] [PubMed]
- Girke, C.; Arutyunova, E.; Syed, M.; Traub, M.; Mohlmann, T.; Lemieux, M.J. High yield expression and purification of equilibrative nucleoside transporter 7 (ENT7) from Arabidopsis thaliana. Biochim. Biophys. Acta 2015, 1850, 1921–1929. [Google Scholar] [CrossRef] [PubMed]
- Boswell-Casteel, R.C.; Johnson, J.M.; Duggan, K.D.; Roe-Zurz, Z.; Schmitz, H.; Burleson, C.; Hays, F.A. FUN26 (function unknown now 26) protein from saccharomyces cerevisiae is a broad selectivity, high affinity, nucleoside and nucleobase transporter. J. Biol. Chem. 2014, 289, 24440–24451. [Google Scholar] [CrossRef] [PubMed]
- Vickers, M.F.; Yao, S.Y.; Baldwin, S.A.; Young, J.D.; Cass, C.E. Nucleoside transporter proteins of saccharomyces cerevisiae. Demonstration of a transporter (FUI1) with high uridine selectivity in plasma membranes and a transporter (FUN26) with broad nucleoside selectivity in intracellular membranes. J. Biol. Chem. 2000, 275, 25931–25938. [Google Scholar] [CrossRef] [PubMed]
- Lu, S.P.; Lin, S.J. Phosphate-responsive signaling pathway is a novel component of NAD+ metabolism in Saccharomyces cerevisiae. J. Biol. Chem. 2011, 286, 14271–14281. [Google Scholar] [CrossRef] [PubMed]
- Kang, N.; Jun, A.H.; Bhutia, Y.D.; Kannan, N.; Unadkat, J.D.; Govindarajan, R. Human equilibrative nucleoside transporter-3 (HENT3) spectrum disorder mutations impair nucleoside transport, protein localization, and stability. J. Biol. Chem. 2010, 285, 28343–28352. [Google Scholar] [CrossRef] [PubMed]
- SenGupta, D.J.; Lum, P.Y.; Lai, Y.; Shubochkina, E.; Bakken, A.H.; Schneider, G.; Unadkat, J.D. A single glycine mutation in the equilibrative nucleoside transporter gene, HENT1, alters nucleoside transport activity and sensitivity to nitrobenzylthioinosine. Biochemistry 2002, 41, 1512–1519. [Google Scholar] [CrossRef] [PubMed]
- Ramadan, A.; Naydenova, Z.; Stevanovic, K.; Rose, J.B.; Coe, I.R. The adenosine transporter, ENT1, in cardiomyocytes is sensitive to inhibition by ethanol in a kinase-dependent manner: implications for ethanol-dependent cardioprotection and nucleoside analog drug cytotoxicity. Purinergic Sign. 2014, 10, 305–312. [Google Scholar] [CrossRef] [PubMed]
- Chen, J.; Nam, H.W.; Lee, M.R.; Hinton, D.J.; Choi, S.; Kim, T.; Kawamura, T.; Janak, P.H.; Choi, D.S. Altered glutamatergic neurotransmission in the striatum regulates ethanol sensitivity and intake in mice lacking ENT1. Behav Brain Res. 2010, 208, 636–642. [Google Scholar] [CrossRef] [PubMed]
- Krauss, S.W.; Ghirnikar, R.B.; Diamond, I.; Gordon, A.S. Inhibition of adenosine uptake by ethanol is specific for one class of nucleoside transporters. Mol. Pharmacol. 1993, 44, 1021–1026. [Google Scholar] [PubMed]
- Jiang, X.; Loo, D.D.F.; Hirayama, B.A.; Wright, E.M. The importance of being aromatic: Pi interactions in sodium symporters. Biochemistry 2012, 51, 9480–9487. [Google Scholar] [CrossRef] [PubMed]
- Coe, I.R.; Dohrman, D.P.; Constantinescu, A.; Diamond, I.; Gordon, A.S. Activation of cyclic AMP-dependent protein kinase reverses tolerance of a nucleoside transporter to ethanol. J. Pharmacol. Exp. Ther. 1996, 276, 365–369. [Google Scholar] [PubMed]
- Lum, P.Y.; Ngo, L.Y.; Bakken, A.H.; Unadkat, J.D. Human intestinal es nucleoside transporter: Molecular characterization and nucleoside inhibitory profiles. Cancer Chemother. Pharmacol. 2000, 45, 273–278. [Google Scholar] [CrossRef] [PubMed]
- Cass, C.E.; Paterson, A.R. Mediated transport of nucleosides by human erythrocytes. Specificity toward purine nucleosides as permeants. Biochim. Biophys. Acta 1973, 291, 734–746. [Google Scholar] [CrossRef]
- Abramson, J.; Smirnova, I.; Kasho, V.; Verner, G.; Kaback, H.R.; Iwata, S. Structure and mechanism of the lactose permease of escherichia coli. Science 2003, 301, 610–615. [Google Scholar] [CrossRef] [PubMed]
- Huang, Y.; Lemieux, M.J.; Song, J.; Auer, M.; Wang, D.N. Structure and mechanism of the glycerol-3-phosphate transporter from escherichia coli. Science 2003, 301, 616–620. [Google Scholar] [CrossRef] [PubMed]
- Yan, N. Structural advances for the major facilitator superfamily (MFS) transporters. Trends Biochem. Sci. 2013, 38, 151–159. [Google Scholar] [CrossRef] [PubMed]
- Valdes, R.; Arastu-Kapur, S.; Landfear, S.M.; Shinde, U. An ab initio structural model of a nucleoside permease predicts functionally important residues. J. Biol. Chem. 2009, 284, 19067–19076. [Google Scholar] [CrossRef] [PubMed]
- Valdes, R.; Elferich, J.; Shinde, U.; Landfear, S.M. Identification of the intracellular gate for a member of the equilibrative nucleoside transporter (ENT) family. J. Biol. Chem. 2014, 289, 8799–8809. [Google Scholar] [CrossRef] [PubMed]
- Law, C.J.; Enkavi, G.; Wang, D.N.; Tajkhorshid, E. Structural basis of substrate selectivity in the glycerol-3-phosphate: Phosphate antiporter GlpT. Biophys. J. 2009, 97, 1346–1353. [Google Scholar] [CrossRef] [PubMed]
- Sanguinetti, M.; Amillis, S.; Pantano, S.; Scazzocchio, C.; Ramon, A. Modelling and mutational analysis of Aspergillus nidulans urea, a member of the subfamily of urea/H(+) transporters in fungi and plants. Open Biol. 2014, 4, 140070. [Google Scholar] [CrossRef] [PubMed]
- Zhou, Y.; Jiang, X.; Kaback, H.R. Role of the irreplaceable residues in the LacY alternating access mechanism. Proc. Natl. Acad. Sci. USA 2012, 109, 12438–12442. [Google Scholar] [CrossRef] [PubMed]
- Boswell-Casteel, R.C.; Johnson, J.M.; Roe-Zurz, Z.; Duggan, K.D.; Schmitz, H.; Hays, F.A. Expression and purification of human and saccharomyces cerevisiae equilibrative nucleoside transporters. Protein Expr. Purif. 2018, 142, 68–74. [Google Scholar] [CrossRef] [PubMed]
- Hammond, J.R. Enhancement of the functional stability of solubilized nucleoside transporters by substrates and inhibitors. Biochem. Pharmacol. 1997, 53, 623–629. [Google Scholar] [CrossRef]
- Hammond, J.R.; Zarenda, M. Effect of detergents on ligand binding and translocation activities of solubilized/reconstituted nucleoside transporters. Arch. Biochem. Biophys. 1996, 332, 313–322. [Google Scholar] [CrossRef] [PubMed]
- Shimamura, T.; Weyand, S.; Beckstein, O.; Rutherford, N.G.; Hadden, J.M.; Sharples, D.; Sansom, M.S.; Iwata, S.; Henderson, P.J.; Cameron, A.D. Molecular basis of alternating access membrane transport by the sodium-hydantoin transporter Mhp1. Science 2010, 328, 470–473. [Google Scholar] [CrossRef] [PubMed]
- Yao, S.Y.; Ng, A.M.; Vickers, M.F.; Sundaram, M.; Cass, C.E.; Baldwin, S.A.; Young, J.D. Functional and molecular characterization of nucleobase transport by recombinant human and rat equilibrative nucleoside transporters 1 and 2. Chimeric constructs reveal a role for the ENT2 helix 5–6 region in nucleobase translocation. J. Biol. Chem. 2002, 277, 24938–24948. [Google Scholar] [CrossRef] [PubMed]
- Papageorgiou, I.; De Koning, H.P.; Soteriadou, K.; Diallinas, G. Kinetic and mutational analysis of the trypanosoma brucei NBT1 nucleobase transporter expressed in Saccharomyces cerevisiae reveals structural similarities between ent and mfs transporters. Int. J. Parasitol. 2008, 38, 641–653. [Google Scholar] [CrossRef] [PubMed]
- Swinnen, S.; Goovaerts, A.; Schaerlaekens, K.; Dumortier, F.; Verdyck, P.; Souvereyns, K.; Van Zeebroeck, G.; Foulquie-Moreno, M.R.; Thevelein, J.M. Auxotrophic mutations reduce tolerance of saccharomyces cerevisiae to very high levels of ethanol stress. Eukaryot. Cell 2015, 14, 884–897. [Google Scholar] [CrossRef] [PubMed]
- Cramer, A.C.; Vlassides, S.; Block, D.E. Kinetic model for nitrogen-limited wine fermentations. Biotechnol. Bioeng. 2002, 77, 49–60. [Google Scholar] [CrossRef] [PubMed]
- Varela, C.; Pizarro, F.; Agosin, E. Biomass content governs fermentation rate in nitrogen-deficient wine musts. Appl. Environ. Microbiol. 2004, 70, 3392–3400. [Google Scholar] [CrossRef] [PubMed]
- Henderson, C.M.; Block, D.E. Examining the role of membrane lipid composition in determining the ethanol tolerance of Saccharomyces cerevisiae. Appl. Environ. Microbiol. 2014, 80, 2966–2972. [Google Scholar] [CrossRef] [PubMed]
- Huang, H.; Kawamata, T.; Horie, T.; Tsugawa, H.; Nakayama, Y.; Ohsumi, Y.; Fukusaki, E. Bulk RNA degradation by nitrogen starvation-induced autophagy in yeast. EMBO J. 2015, 34, 154–168. [Google Scholar] [CrossRef] [PubMed]
- Long, C.W.; Pardee, A.B. Cytidine triphosphate synthetase of Escherichia coli B. I. Purification and Kinetics. J. Biol. Chem. 1967, 242, 4715–4721. [Google Scholar] [PubMed]
- Ostrander, D.B.; O’Brien, D.J.; Gorman, J.A.; Carman, G.M. Effect of CTP synthetase regulation by ctp on phospholipid synthesis in Saccharomyces cerevisiae. J. Biol. Chem. 1998, 273, 18992–19001. [Google Scholar] [CrossRef] [PubMed]
- Ader, L.; Jones, D.N.; Lin, H. Alcohol binding to the odorant binding protein LUSH: Multiple factors affecting binding affinities. Biochemistry 2010, 49, 6136–6142. [Google Scholar] [CrossRef] [PubMed]
- Kumar, H.; Finer-Moore, J.S.; Kaback, H.R.; Stroud, R.M. Structure of LacY with an alpha-substituted galactoside: Connecting the binding site to the protonation site. Proc. Natl. Acad. Sci. USA 2015, 112, 9004–9009. [Google Scholar] [CrossRef] [PubMed]
- Gerlsma, S.Y.; Stuur, E.R. The effect of polyhydric and monohydric alcohols on the heat-induced reversible denaturation of lysozyme and ribonuclease. Int. J. Pept. Protein Res. 1972, 4, 377–383. [Google Scholar] [CrossRef] [PubMed]
- Liu, Y.; Bolen, D.W. The peptide backbone plays a dominant role in protein stabilization by naturally occurring osmolytes. Biochemistry 1995, 34, 12884–12891. [Google Scholar] [CrossRef] [PubMed]
- Thomas, P.D.; Dill, K.A. Local and nonlocal interactions in globular proteins and mechanisms of alcohol denaturation. Protein Sci. 1993, 2, 2050–2065. [Google Scholar] [CrossRef] [PubMed]
- Ma, M.; Liu, Z.L. Mechanisms of ethanol tolerance in Saccharomyces cerevisiae. Appl. Microbiol. Biotechnol. 2010, 87, 829–845. [Google Scholar] [CrossRef] [PubMed]
- Hu, X.H.; Wang, M.H.; Tan, T.; Li, J.R.; Yang, H.; Leach, L.; Zhang, R.M.; Luo, Z.W. Genetic dissection of ethanol tolerance in the budding yeast Saccharomyces cerevisiae. Genetics 2007, 175, 1479–1487. [Google Scholar] [CrossRef] [PubMed]
- Stanley, D.; Bandara, A.; Fraser, S.; Chambers, P.J.; Stanley, G.A. The ethanol stress response and ethanol tolerance of Saccharomyces cerevisiae. J. Appl. Microbiol. 2010, 109, 13–24. [Google Scholar] [CrossRef] [PubMed]
- Leao, C.; van Uden, N. Effects of ethanol and other alkanols on the general amino acid permease of Saccharomyces cerevisiae. Biotechnol. Bioeng. 1984, 26, 403–405. [Google Scholar] [CrossRef] [PubMed]
- Yoshikawa, K.; Tanaka, T.; Furusawa, C.; Nagahisa, K.; Hirasawa, T.; Shimizu, H. Comprehensive phenotypic analysis for identification of genes affecting growth under ethanol stress in Saccharomyces cerevisiae. FEMS Yeast Res. 2009, 9, 32–44. [Google Scholar] [CrossRef] [PubMed]
- VanderSluis, B.; Hess, D.C.; Pesyna, C.; Krumholz, E.W.; Syed, T.; Szappanos, B.; Nislow, C.; Papp, B.; Troyanskaya, O.G.; Myers, C.L.; et al. Broad metabolic sensitivity profiling of a prototrophic yeast deletion collection. Genome Biol. 2014, 15, R64. [Google Scholar] [CrossRef] [PubMed] [Green Version]
- Belenky, P.A.; Moga, T.G.; Brenner, C. Saccharomyces cerevisiae YOR071C encodes the high affinity nicotinamide riboside transporter Nrt1. J. Biol. Chem. 2008, 283, 8075–8079. [Google Scholar] [CrossRef] [PubMed]
- Allen-Gipson, D.S.; Jarrell, J.C.; Bailey, K.L.; Robinson, J.E.; Kharbanda, K.K.; Sisson, J.H.; Wyatt, T.A. Ethanol blocks adenosine uptake via inhibiting the nucleoside transport system in bronchial epithelial cells. Alcohol. Clin. Exp. Res. 2009, 33, 791–798. [Google Scholar] [CrossRef] [PubMed]
- Choi, D.S.; Cascini, M.G.; Mailliard, W.; Young, H.; Paredes, P.; McMahon, T.; Diamond, I.; Bonci, A.; Messing, R.O. The type 1 equilibrative nucleoside transporter regulates ethanol intoxication and preference. Nat. Neurosci. 2004, 7, 855–861. [Google Scholar] [CrossRef] [PubMed]
- Osato, D.H.; Huang, C.C.; Kawamoto, M.; Johns, S.J.; Stryke, D.; Wang, J.; Ferrin, T.E.; Herskowitz, I.; Giacomini, K.M. Functional characterization in yeast of genetic variants in the human equilibrative nucleoside transporter, ENT1. Pharmacogenetics 2003, 13, 297–301. [Google Scholar] [CrossRef] [PubMed]
- Marechal, R.; Bachet, J.B.; Mackey, J.R.; Dalban, C.; Demetter, P.; Graham, K.; Couvelard, A.; Svrcek, M.; Bardier-Dupas, A.; Hammel, P.; et al. Levels of gemcitabine transport and metabolism proteins predict survival times of patients treated with gemcitabine for pancreatic adenocarcinoma. Gastroenterology 2012, 143, 664–674. [Google Scholar] [CrossRef] [PubMed]
- Murata, Y.; Hamada, T.; Kishiwada, M.; Ohsawa, I.; Mizuno, S.; Usui, M.; Sakurai, H.; Tabata, M.; Ii, N.; Inoue, H.; et al. Human equilibrative nucleoside transporter 1 expression is a strong independent prognostic factor in UICC T3-T4 pancreatic cancer patients treated with preoperative gemcitabine-based chemoradiotherapy. J. Hepatobiliary Pancreat. Sci. 2012, 19, 413–425. [Google Scholar] [CrossRef] [PubMed]
- Morinaga, S.; Nakamura, Y.; Watanabe, T.; Mikayama, H.; Tamagawa, H.; Yamamoto, N.; Shiozawa, M.; Akaike, M.; Ohkawa, S.; Kameda, Y.; et al. Immunohistochemical analysis of human equilibrative nucleoside transporter-1 (hENT1) predicts survival in resected pancreatic cancer patients treated with adjuvant gemcitabine monotherapy. Ann. Surg. Oncol. 2012, 19 (Suppl 3), S558–S564. [Google Scholar] [CrossRef] [PubMed]
- Fujita, H.; Ohuchida, K.; Mizumoto, K.; Itaba, S.; Ito, T.; Nakata, K.; Yu, J.; Kayashima, T.; Souzaki, R.; Tajiri, T.; et al. Gene expression levels as predictive markers of outcome in pancreatic cancer after gemcitabine-based adjuvant chemotherapy. Neoplasia 2010, 12, 807–817. [Google Scholar] [CrossRef] [PubMed]
- Marechal, R.; Mackey, J.R.; Lai, R.; Demetter, P.; Peeters, M.; Polus, M.; Cass, C.E.; Young, J.; Salmon, I.; Deviere, J.; et al. Human equilibrative nucleoside transporter 1 and human concentrative nucleoside transporter 3 predict survival after adjuvant gemcitabine therapy in resected pancreatic adenocarcinoma. Clin. Cancer Res. 2009, 15, 2913–2919. [Google Scholar] [CrossRef] [PubMed]
- Farrell, J.J.; Elsaleh, H.; Garcia, M.; Lai, R.; Ammar, A.; Regine, W.F.; Abrams, R.; Benson, A.B.; Macdonald, J.; Cass, C.E.; et al. Human equilibrative nucleoside transporter 1 levels predict response to gemcitabine in patients with pancreatic cancer. Gastroenterology 2009, 136, 187–195. [Google Scholar] [CrossRef] [PubMed]
- Giovannetti, E.; Del Tacca, M.; Mey, V.; Funel, N.; Nannizzi, S.; Ricci, S.; Orlandini, C.; Boggi, U.; Campani, D.; Del Chiaro, M.; et al. Transcription analysis of human equilibrative nucleoside transporter-1 predicts survival in pancreas cancer patients treated with gemcitabine. Cancer Res. 2006, 66, 3928–3935. [Google Scholar] [CrossRef] [PubMed]
- Spratlin, J.; Sangha, R.; Glubrecht, D.; Dabbagh, L.; Young, J.D.; Dumontet, C.; Cass, C.; Lai, R.; Mackey, J.R. The absence of human equilibrative nucleoside transporter 1 is associated with reduced survival in patients with gemcitabine-treated pancreas adenocarcinoma. Clin. Cancer Res. 2004, 10, 6956–6961. [Google Scholar] [CrossRef] [PubMed]
- Indiveri, C. Studying amino acid transport using liposomes. Methods Mol. Biol. 2010, 606, 55–68. [Google Scholar] [PubMed]
- Yarov-Yarovoy, V.; Schonbrun, J.; Baker, D. Multipass membrane protein structure prediction using Rosetta. Proteins 2006, 62, 1010–1025. [Google Scholar] [CrossRef] [PubMed]
- Dang, S.; Sun, L.; Huang, Y.; Lu, F.; Liu, Y.; Gong, H.; Wang, J.; Yan, N. Structure of a fucose transporter in an outward-open conformation. Nature 2010, 467, 734–738. [Google Scholar] [CrossRef] [PubMed]
- Jones, D.T. Do transmembrane protein superfolds exist? FEBS Lett. 1998, 423, 281–285. [Google Scholar] [CrossRef]
- Sali, A.; Blundell, T.L. Comparative protein modelling by satisfaction of spatial restraints. J. Mol. Biol. 1993, 234, 779–815. [Google Scholar] [CrossRef] [PubMed]
- Wu, S.; Zhang, Y. LOMETS: A local meta-threading-server for protein structure prediction. Nucleic Acids Res. 2007, 35, 3375–3382. [Google Scholar] [CrossRef] [PubMed]
- Mackey, J.R.; Mani, R.S.; Selner, M.; Mowles, D.; Young, J.D.; Belt, J.A.; Crawford, C.R.; Cass, C.E. Functional nucleoside transporters are required for gemcitabine influx and manifestation of toxicity in cancer cell lines. Cancer Res. 1998, 58, 4349–4357. [Google Scholar] [PubMed]
- Achiwa, H.; Oguri, T.; Sato, S.; Maeda, H.; Niimi, T.; Ueda, R. Determinants of sensitivity and resistance to gemcitabine: The roles of human equilibrative nucleoside transporter 1 and deoxycytidine kinase in non-small cell lung cancer. Cancer Sci. 2004, 95, 753–757. [Google Scholar] [CrossRef] [PubMed]
- Hong, S.P.; Wen, J.; Bang, S.; Park, S.; Song, S.Y. CD44-positive cells are responsible for gemcitabine resistance in pancreatic cancer cells. Int. J. Cancer 2009, 125, 2323–2331. [Google Scholar] [CrossRef] [PubMed]
Sample Availability: Radioactive substrates are available from sources indicated. Purified protein is not available from the authors. |
Figure 1.
Comparison of the uptake of radiolabeled substrate by Native ScENT1 and L390A and F249I mutants. Substrates have been classified based on containing a pyrimidine or purine nucleobase and data represents the mean substrate uptake (pmol substrate/mg of ScENT1) for each substrate tested at 100 nM final concentration in the assay sample mixture, N-values are indicated next to each substrate in the figure. PLs were incubated with radiolabeled substrate for 3.5 h followed by vacuum filtration onto membranes. Error bars represent the S.E.M. Statistical significance of the L390A and F249I PLs was determined by comparing the mean substrate uptake for each individual substrate to the mean substrate uptake of the respected Native PLs using two-way analysis of variance and Dunnett’s multiple comparison test [3H]-cytarabine uptake for the Native PLs was used as a reference. Statistically significant changes are denoted in red (decrease) or green (increase) relative to Native ScENT1. Negative control PLs and substrate specific activity are included in the pmol substrate/mg ScENT1 calculation for each sample. ns, not significant; * p < 0.05; ** p < 0.01; *** p < 0.001; **** p < 0.0001.

Figure 2.
Kinetics of [3H]-uridine (a), [3H]-cytidine (b), and [3H]-UTP (c) by Native and Mutant ScENT1-containing PLs. Substrate influx was measured at 10, 20, 50, and 60 min using substrate concentrations ranging from 26 nM to 2000 nM for most substrates tested. The slope of the linear time course for each substrate concentration was then fit directly using nonlinear regression to determine initial uptake rates for each substrate concentration. These values, in pmol/mg/min, were then plotted relative to substrate concentration and fitted directly using nonlinear regression and a simple steady-state Michaelis-Menton model. Resultant values for Kmapp, Vmax, transport efficiency (Vmax/Kmapp), and R2 are listed in the tables below each graph. N = 3 for all L390A (blue) and F249I (red) trials. Native (green) trails are N = 2 for cytidine, and N = 4 for uridine.

Figure 3.
Inward-open model of ScENT1 structure. Strictly conserved residues are denoted in red (~16% of total sequence). Residues functionally characterized using ScENT1 PLs are denoted in green and highlighted by arrows. Helix numbering is shown as 1–11 beginning with the N-terminus, and helix 11 is shown as discontinuous. (a) top-down view of structure (cytoplasmic side), (b) side view—lipid bilayer not depicted, and (c) bottom-up view of structure (luminal side). Panel a and panel c are simple rotations of 90 degrees relative to b.

Figure 4.
Alcohol attenuation of ScENT1-mediated uridine transport. Ethanol and methanol attenuation was determined by pre-incubating (–OH) PLs with 250 mM of the denoted alcohol or an equal volume of water for 15 min, then incubating with 100 mM of [3H]-uridine for an additional 3.5 h followed by vacuum filtration onto membranes. Error bars represent the S.E.M. of N = 3 independent experiments. Negative control PLs and substrate specific activity are included in the pmol substrate/mg ScENT1 calculation for each sample. Statistical significance was determined using a one-way analysis of variance and Dunnett’s multiple comparison tests (* p < 0.05; **** p < 0.0001).

Figure 5.
Membrane integrity is maintained in the presence of ethanol and methanol. PLs (a) and empty liposomes (b) were loaded with 50 mM CF prior to extrusion. Equal volumes of alcohol or water (control) were added to each sample of PLs (a) or empty liposomes (b). Each sample was then mixed, cuvettes capped off, and emission was monitored between 500 nm and 560 nm. Red, ethanol 4.074 M; magenta, ethanol 292 mM; green, ethanol 4.074 M; blue, ethanol 292 mM; black, water volume corrected to match 292 mM ethanol volumes; yellow, water volume corrected to match 4.074 M ethanol volumes.

Figure 6.
Uptake of radiolabeled substrates into ScENT1 (–OH) PLs. All substrates tested in this study were tested in PLs prepared in the absence of residual alcohols and are divided into pyrimidine and purine classifications further separated into nucleotide, nucleoside, and nucleobase categories with C(2′)-modification noted. Data represents the mean uptake from N = 9 (Native) and N = 3 (L390A and F249I) independent observations for each substrate tested (100 nM final concentrations), and N-values are presented on the graph. PLs were incubated with substrate for 3.5 h prior to being vacuumed filtered onto membranes. Error bars represent the S.E.M. Statistical significance was determined by comparing the mean substrate uptake (pmol substrate/mg ScENT1) for substrates relative to [3H]-cytarabine uptake by PLs using ordinary one-way analysis of variance and Dunnett’s multiple comparison test. Negative control PLs and substrate specific activity are included in the pmol substrate/mg ScENT1 calculation for each sample (see Methods). ns, not significant; * p < 0.05; ** p < 0.01; **** p < 0.0001.

© 2018 by the authors. Licensee MDPI, Basel, Switzerland. This article is an open access article distributed under the terms and conditions of the Creative Commons Attribution (CC BY) license (http://creativecommons.org/licenses/by/4.0/).
Share and Cite
MDPI and ACS Style
Boswell-Casteel, R.C.; Johnson, J.M.; Hays, F.A. Functional Characterization of the Saccharomyces cerevisiae Equilibrative Nucleoside Transporter 1 (ScENT1). Molecules 2018, 23, 732. https://doi.org/10.3390/molecules23040732
AMA Style
Boswell-Casteel RC, Johnson JM, Hays FA. Functional Characterization of the Saccharomyces cerevisiae Equilibrative Nucleoside Transporter 1 (ScENT1). Molecules. 2018; 23(4):732. https://doi.org/10.3390/molecules23040732
Chicago/Turabian StyleBoswell-Casteel, Rebba C., Jennifer M. Johnson, and Franklin A. Hays. 2018. "Functional Characterization of the Saccharomyces cerevisiae Equilibrative Nucleoside Transporter 1 (ScENT1)" Molecules 23, no. 4: 732. https://doi.org/10.3390/molecules23040732