Structural Trends and Solid-Solutions Based on the Crystal Chemistry of Two Hausmannite (Mn3O4) Samples from the Kalahari Manganese Field


Department of Geoscience, University of Calgary, Calgary, AB T2N 1N4, Canada
*
Author to whom correspondence should be addressed.
Minerals 2019, 9(6), 343; https://doi.org/10.3390/min9060343
Submission received: 5 May 2019
/
Revised: 22 May 2019
/
Accepted: 3 June 2019
/
Published: 5 June 2019
(This article belongs to the Special Issue Feature Papers in Crystallography, Mineralogy, and Physical Chemistry of Minerals 2019)
Abstract
:The crystal chemistry of two hausmannite samples from the Kalahari manganese field (KMF), South Africa, was studied using electron-probe microanalysis (EPMA), single-crystal X-ray diffraction (SCXRD) for sample-a, and high-resolution powder X-ray diffraction (HRPXRD) for sample-b, and a synthetic Mn3O4 (97% purity) sample-c as a reference point. Hausmannite samples from the KMF were reported to be either magnetic or non-magnetic with a general formula AB2O4. The EPMA composition for sample-a is [Mn2+0.88Mg2+0.11Fe2+0.01]Σ1.00Mn3+2.00O4 compared to Mn2+Mn3+2O4 obtained by refinement. The single-crystal structure refinement in the tetragonal space group I41/amd gave R1 = 0.0215 for 669 independently observed reflections. The unit-cell parameters are a = b = 5.7556(6), c = 9.443(1) Å, and V = 312.80(7) Å3. The Jahn–Teller elongated Mn3+O6 octahedron of the M site consists of M–O × 4 = 1.9272(5), M–O × 2 = 2.2843(7), and an average <M–O>[6] = 2.0462(2) Å, whereas the Mn2+O4 tetrahedron of the T site has T–O × 4 = 2.0367(8) Å. The site occupancy factors (sof) are M(sof) = 1.0 Mn (fixed, thereafter) and T(sof) = 1.0008(2) Mn. The EPMA composition for sample-b is [Mn0.99Mg0.01](Mn1.52Fe0.48)O4. The Rietveld refinement gave R (F2) = 0.0368. The unit-cell parameters are a = b = 5.78144(1), c = 9.38346(3) Å, and V = 313.642(1) Å3. The octahedron has M–O × 4 = 1.9364(3), M–O × 2 = 2.2595(6), and average <M–O>[6] = 2.0441(2) Å, whereas T–O × 4 = 2.0438(5) Å. The refinement gave T(sof) = 0.820(9) Mn2+ + 0.180(9) Fe2+ and M(sof) = 0.940(5) Mn3+ + 0.060(5) Fe3+. Samples-a and -b are normal spinels with different amounts of substitutions at the M and T sites. The Jahn–Teller elongation, Δ(M–O), is smaller in sample-b because atom substitutions relieve strain compared to pure Mn3O4.
1. Introduction
Numerous studies were carried out on spinels because of their chemical and structural simplicity, their geological importance, and their use as geothermometers, geobarometers, and geospeedometers (e.g., [1,2]). Spinel-supergroup minerals have the general formula, AB2O4. The A and B cation charges may be either +2 and +3 (e.g., spinel, MgAl2O4, and magnesioferrite, MgFe2O4), or +4 and +2 (e.g., ulvöspinel, TiFe2O4, and qandilite, TiMg2O4). The formal charge of A and B constituents can range from 0 to +6 [3]. In “normal” spinels, the A constituent occupies the 4-coordinated tetrahedral T site and the B constituent occupies the 6-coordinated octahedral metal M site [4]. In “inverse” spinels, the T site contains only B cations and the M site contains an equal number of A and B cations, so the M site is fully disordered. Intermediate spinels may be expressed as a mix of normal and inverse end-members, with the general formula, [4][A1−xBx][6](AxB2−x)O4, where the variable x is referred to as the “inversion parameter”. This x is the fraction of B cations at the T site. In normal spinels x = 0, and in inverse spinels x = 1. A value of x = 2/3 corresponds to a random distribution of A and B atoms. Alternatively, an order parameter, Q, is used to express the degree of order [5]. The order parameter, Q, varies from Q = 1 for a completely ordered normal spinel to Q = 0 (where x = 2/3) for a random arrangement of cations to Q = −0.5 in inverse spinel. The relationship between Q and x is: Q = 1 – (3/2)x. Magnesioferrite, MgFe2O4, is partly inverse and partly normal, so it is one of the most interesting ferrite spinels [6,7,8].
The structure of cubic spinels consists of T cations at 8a (1/8, 1/8, 1/8), M cations at 16d (½, ½, ½), and O atoms on the body diagonals of a cube at 32e (u, u, u), where u is approximately ¼ in space group Fdm. In a cubic spinel structure, there are only two structural variables (except displacement parameters): the a unit-cell parameter and the O atom positional parameter, u.
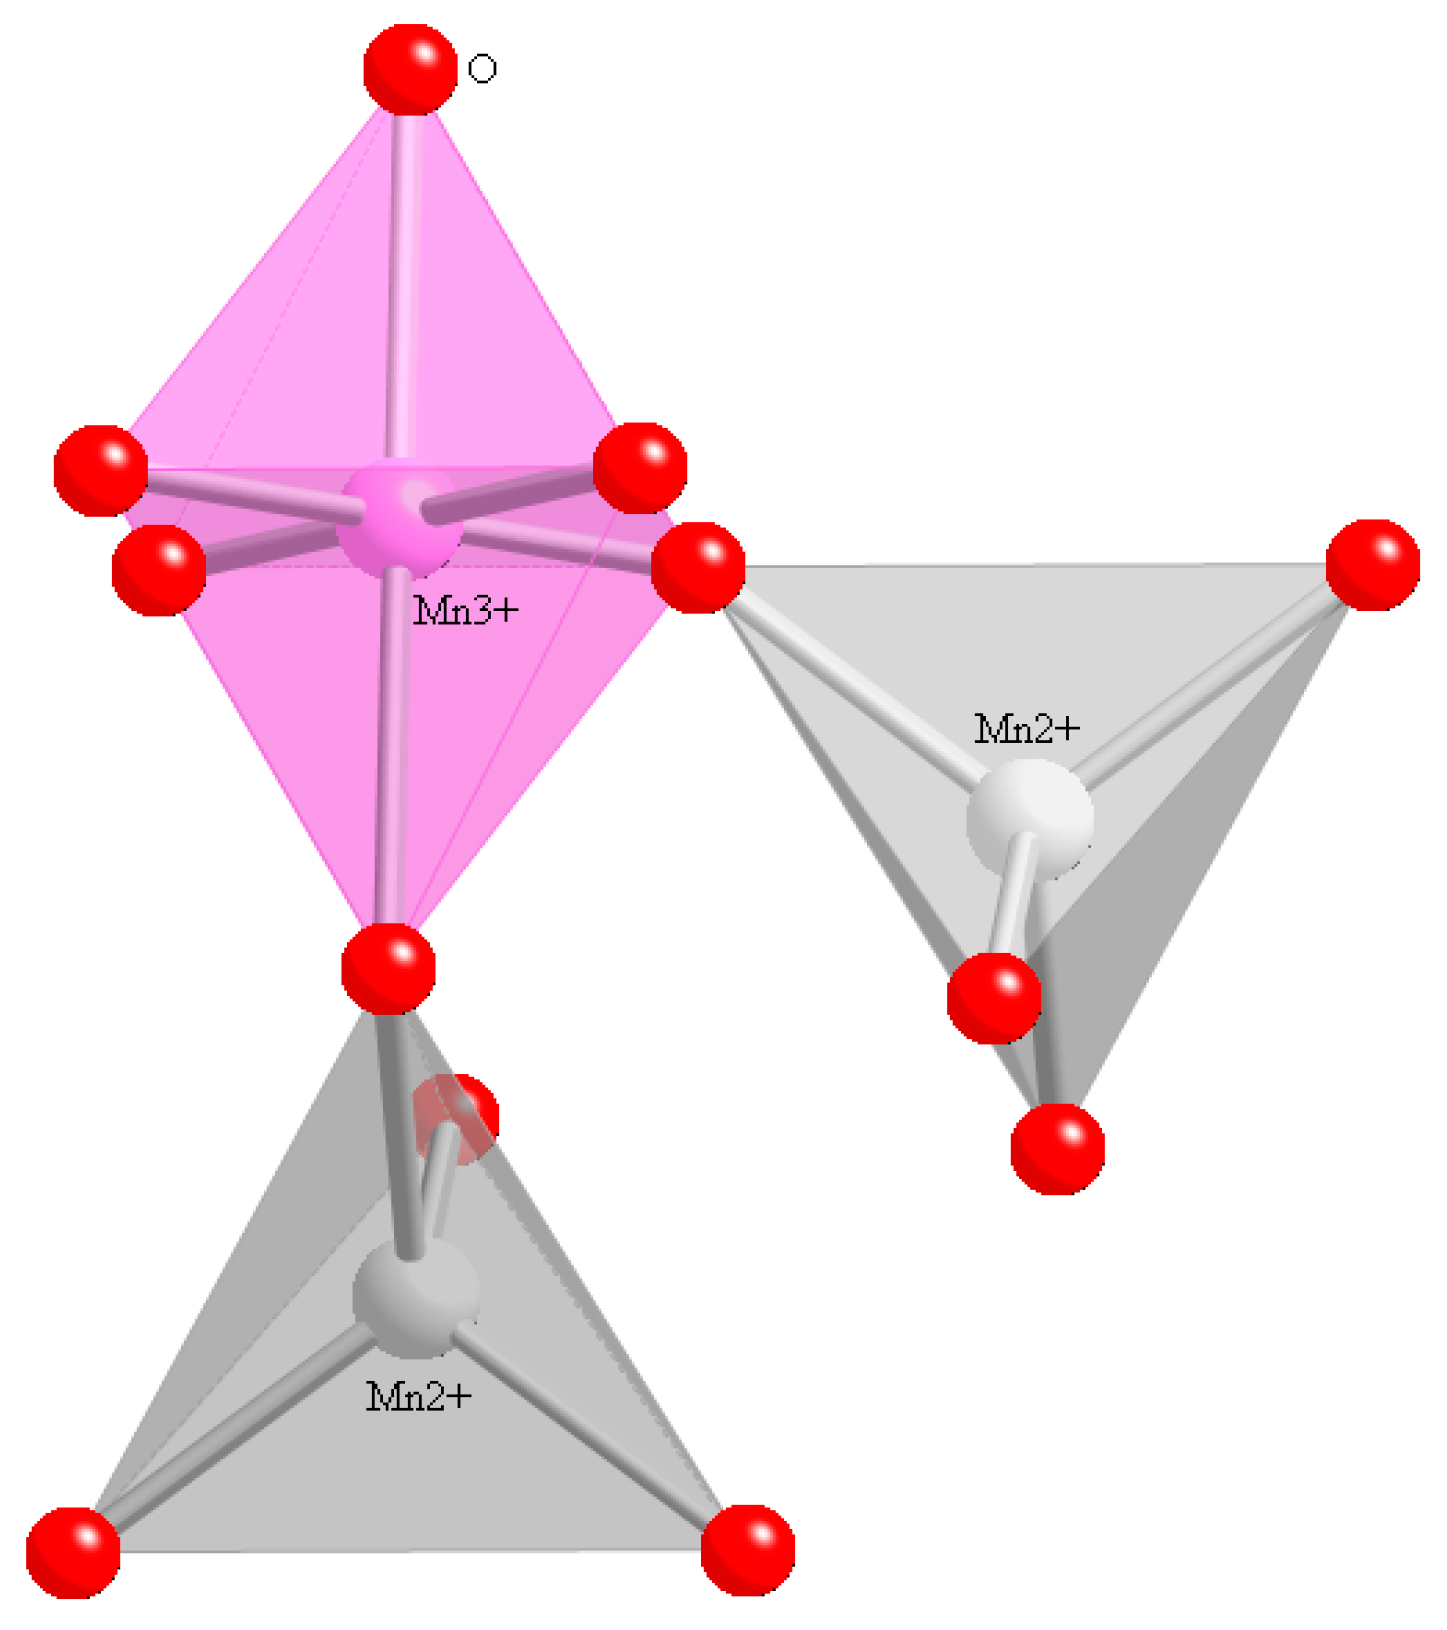
Hausmannite, ideally Mn3O4, is a normal spinel with a distorted tetragonal structure (Figure 1). End-member hausmannite structural formula is [4][Mn2+][6](Mn23+)O4. The T site may be occupied by divalent cations (e.g., Mn2+, Mg2+, Zn2+, or Fe2+), and the Jahn–Teller elongated MO6 octahedron may be occupied by trivalent cations (e.g., Mn3+, Fe3+, or Al3+). These two types of substitutions should give rise to different structural features. Hetaerolite, ideally ZnMn2O4, is isostructural with hausmannite [9]. Many natural samples belong to the hausmannite–hetaerolite series [MnMn2O4–ZnMn2O4], where the main substitution is between Mn2+and Zn2+ cations. Such series gives rise to well-defined structural variations in hausmannite solid solutions because the divalent cations have similar sizes (e.g., [10,11]).
Gutzmer et al. [13] reported both magnetic and non-magnetic hausmannite samples from Kalahari manganese field (KMF; samples-2 and -3 in Table 1). It seems that substitution of Fe3+ cations at the M site give rise to a magnetic sample. Substitution of Mn3+ (0.645 Å, HS) by Fe3+ (0.645 Å, HS) cations results in minor, but measurable changes in unit-cell parameters, and a decrease of Jahn–Teller distortion with increasing Fe3+ concentrations [14]. Neutron diffraction results at 10 K from Baron et al. [14] indicate that Fe-rich hausmannite is not the source for high-temperature (Curie temperature of 750 K) ferrimagnetism in hausmannite-rich ores from the KMF that was described by Gutzmer et al. [13]. The authors indicated that minor amounts of Mn-bearing hematite in the hausmannite-rich ores may be the source for the unusual magnetic properties, but this was not confirmed. There appear to be two different types of hausmannite samples from the KMF. One type has substitution of divalent cations at the T site, and the other type has substitution of trivalent cations at the M site as well as at the T site. These different types of samples are investigated further in this study.
The crystal structure of hausmannite is that of a tetragonally-deformed cubic spinel structure [15]. Satomi [16] reported unit-cell parameters for a synthetic Mn3O4 (sample-1; Table 1). The magnetic structure of hausmannite from a polycrystalline sample was examined by neutron methods and aspects of the structure were discussed [14,17,18]. Thereafter, several structural studies were carried out on hausmannite (Table 1). Structural data for ZnMn2O4 [19] and MgMn2O4 [20] are also available.
In hausmannite, the T and M sites are at fixed positions and the O-atom coordinate is at (0, x, y). The O atom is positioned to balance between the co–Operative Jahn–Teller distortion around the Mn3+ site, stretching of the Mn3+O6 octahedron along [001], countered by the force of the tetrahedron preserving its regular form against the tetragonal deformation of the structure [16,22]. The chemical bonds in spinels influence the cation ordering, the structural distortion, and the magnetic-exchange interactions [23]. In hausmannite, the four short Mn3+–O bonds around the octahedrally-co–Ordinated Mn3+ cations are covalent, and the two longest bonds have an ionic character [23]. In contrast, the four Mn2+–O bonds around the tetrahedral T sites have characteristics that are between ionic and covalent.
Under normal pressure conditions, hausmannite has two crystallographic forms: a tetragonal low-temperature form and a cubic high-temperature form [24,25]. The cubic-tetragonal transition occurs at 1170 °C where there is no Jahn–Teller distortion. The structure is deformed during the transition to the tetragonal structure that contains Jahn–Teller elongation [24]. In the tetragonal hausmannite structure, the O atoms form a tetragonally distorted cubic close-packed structure where the tetrahedral and octahedral sites are occupied by Mn2+ and Mn3+ cations, respectively [24]. The tetragonal hausmannite crystal structure has space group I41/amd [24]. The structure of a hausmannite from Langbån, Sweden is known [21].
Hausmannite is relatively uncommon, but it has a wide field of stability. It is usually found with other manganese oxide minerals in metamorphosed or hydrothermal manganese ores [24], but euhedral crystals are rare. Hausmannite occurs in a few localities such as Ilmanau, Thuringia, Germany and the Kalahari manganese field (KMF), South Africa [14]. It is typically ferrimagnetic, but a strong magnetic sample was discovered in the hydrothermally altered KMF [13]. In the KMF, the manganese ores are interbedded with the iron-rich Hotazel formation and are preserved in erosional relict basins [13]. Within the high-grade Wessels type manganese ore, normal faults acted as conduits for hydrothermal fluids which caused hematitization of the manganese ores. This high-grade manganese ore is coarse grained and contains hausmannite, bixbyite, marokite, and hematite [13].
The unit-cell parameters of Mn3−xFexO4 hausmannite indicate decreasing Jahn–Teller distortion with increasing Fe content, which also causes an increase in the Curie temperature [14]. Their study seems to indicate that Fe-rich hausmannite causes the unusual high-temperature ferrimagnetic behavior in the KMF. Iron-rich hausmannite, containing up to 11.3 wt % of Fe2O3, has unit-cell parameters that are smaller along the a axis and larger along the c axis than pure Mn3O4. These parameters shrink along the a axis and expand along the c axis, proportional to increasing Fe content [14].
This study examines the crystal chemistry of two different hausmannite samples from the KMF using electron-probe microanalysis (EPMA). The crystal structure of sample-a was obtained with single-crystal X-ray diffraction (SCXRD) data, whereas that for samples-b and -c were obtained from Rietveld structure refinement using synchrotron high-resolution powder X-ray diffraction (HRPXRD) data. These results are compared with data from the literature (Table 1).
2. Experimental Methods
2.1. Sample Description
The hausmannite sample-a used in this study is a black crystal that occurs with henritermierite garnet from Wessels X Mine, Kalahari manganese field (KMF), Northern Cape Province, South Africa. The hausmannite crystals are intergrown with tetragonal garnet, henritermierite, ideally Ca3Mn2[(SiO4)2(O4H4)]Σ3 [12]. Sample-a was obtained from the Royal Ontario Museum (ROM #M54234). The hausmannite sample-b is from the KMF, where it occurs as a large massive sample that resembles a pyramidal “Christmas tree”. Both samples-a and -b are non-magnetic. However, Gutzmer et al. [13] reported both magnetic and non-magnetic samples from the KMF (Table 1). We also obtained the structure of a synthetic powdered Mn3O4 sample-c (97% purity from Sigma Aldrich, Oakville, ON, Canada) as a reference material. This hausmannite sample-c contains about 3% bixbyite, Mn2O3, as determined by Rietveld refinement.
2.2. Electron-Probe Microanalysis (EPMA)
Quantitative chemical compositions and backscattered electron (BSE) images were collected with a JEOL JXA-8200 WD-ED electron-probe microanalyser (EPMA). The JEOL operating program on a Solaris platform was used for ZAF correction and data reduction. The wavelength-dispersive (WD) operating conditions were 15 kV accelerating voltage, 20 nA beam current and 5 μm beam diameter. The standards used were rhodonite (Mn Kα), chromite (Mg Kα, Fe Kα), and corundum (Al Kα). Using the EPMA data, atoms per formula unit (apfu) were calculated on the basis of four oxygen atoms and three cations [10], with FeO converted to Fe2O3 by multiplying by 1.1113 and MnO converted to Mn2O3 by multiplying by 1.1128. The average chemical analyses from 12 points are given for samples-a and -b (Table 2).
2.3. Single-Crystal X-ray Diffraction (SCXRD)
The hausmannite sample-a structure was studied with single-crystal X-ray diffraction (SCXRD) using a Nonius Kappa APEX2 CCD on a diffractometer using a Bruker Nonius FR591 Rotating anode with graphite monochromatized MoKα radiation. A small crystal fragment (approximately 0.05 × 0.05 × 0.06 mm3) was mounted on the end of a glass fiber (0.05 mm in diameter) with epoxy and placed on a goniometer. The generator setting was 50 kV and 36 mA and the detector-to-crystal distance was fixed at 35 mm. A total of ten frames were collected for unit-cell determination. The scan settings were 1° rotation per frame (total rotation = 10°) and 22 s of X-ray exposure time per frame. After obtaining satisfactory unit-cell parameters and mosaicity values (less than 1°), a complete dataset was collected using a 2° per frame rotation with exposure of 42–122 s per frame. The diffraction spots were measured in full, scaled with SCALEPACK, corrected for Lorentz-polarization, and integrated using the Nonius program suite DENZO-SMN [26].
The space group I41/amd was obtained based on systematic absence of reflections and structure factor statistics. Full-matrix least-squares refinements were carried out with the SHELXL program using neutral atom scattering factors [27] and the WinGX platform [28]. The starting structural model was from Jarosch [21]. Anisotropic displacement parameters were used for all of the atoms in hausmannite. The site occupancy factors (sofs) for the cations were refined together with the isotropic displacement parameters and the resulting sofs were fixed while the anisotropic displacement parameters were refined. Further details of the data collection for sample-a and refinement are given in Table 3 and those for samples-b and -c are given in Table 4. The atom coordinates, sofs, and equivalent isotropic displacement parameters are given in Table 5. Anisotropic displacement parameters are given in Table 6. Selected bond distances and angles are given in Table 7. Bond-valence sums (BVS; valence units, vu) are given in Table 8.
2.4. Synchrotron High-Resolution Powder X-Ray Diffraction (HRPXRD)
Both samples-b and -c were studied with HRPXRD that was performed at beamline 11-BM, Advanced Photon Source (APS), Argonne National Laboratory (ANL). A small fragment (about 2 mm in diameter) of sample-b was crushed under methanol to a fine powder using a corundum mortar and pestle (crystal size is unknown as no mesh was used). Sample-c was obtained as a powder. The crushed samples were loaded into Kapton capillaries (0.8 mm internal diameter) and rotated during the experiment at a rate of 90 rotations per second. The data were collected at 21 °C to a maximum 2θ of about 50° with a step size of 0.0005° and a step time of 0.1 s per step. The HRPXRD trace was collected with a unique multi-analyzer detection assembly consisting of 12 independent silicon (111) crystal analysers and LaCl3 scintillation detectors that reduce the angular range to be scanned and allow for rapid acquisition of data. A silicon (NIST 640c) and alumina (NIST 676a) standard (ratio of ⅓ Si:⅔ Al2O3 by weight) was used to calibrate the instrument and refine the monochromatic wavelength used in the experiment (Table 4). Additional details of the experimental setup are given elsewhere [29,30,31]. All of the above experimental techniques were used to characterize many minerals [32,33,34,35,36,37,38,39,40,41,42,43].
2.5. Rietveld Structure Refinement
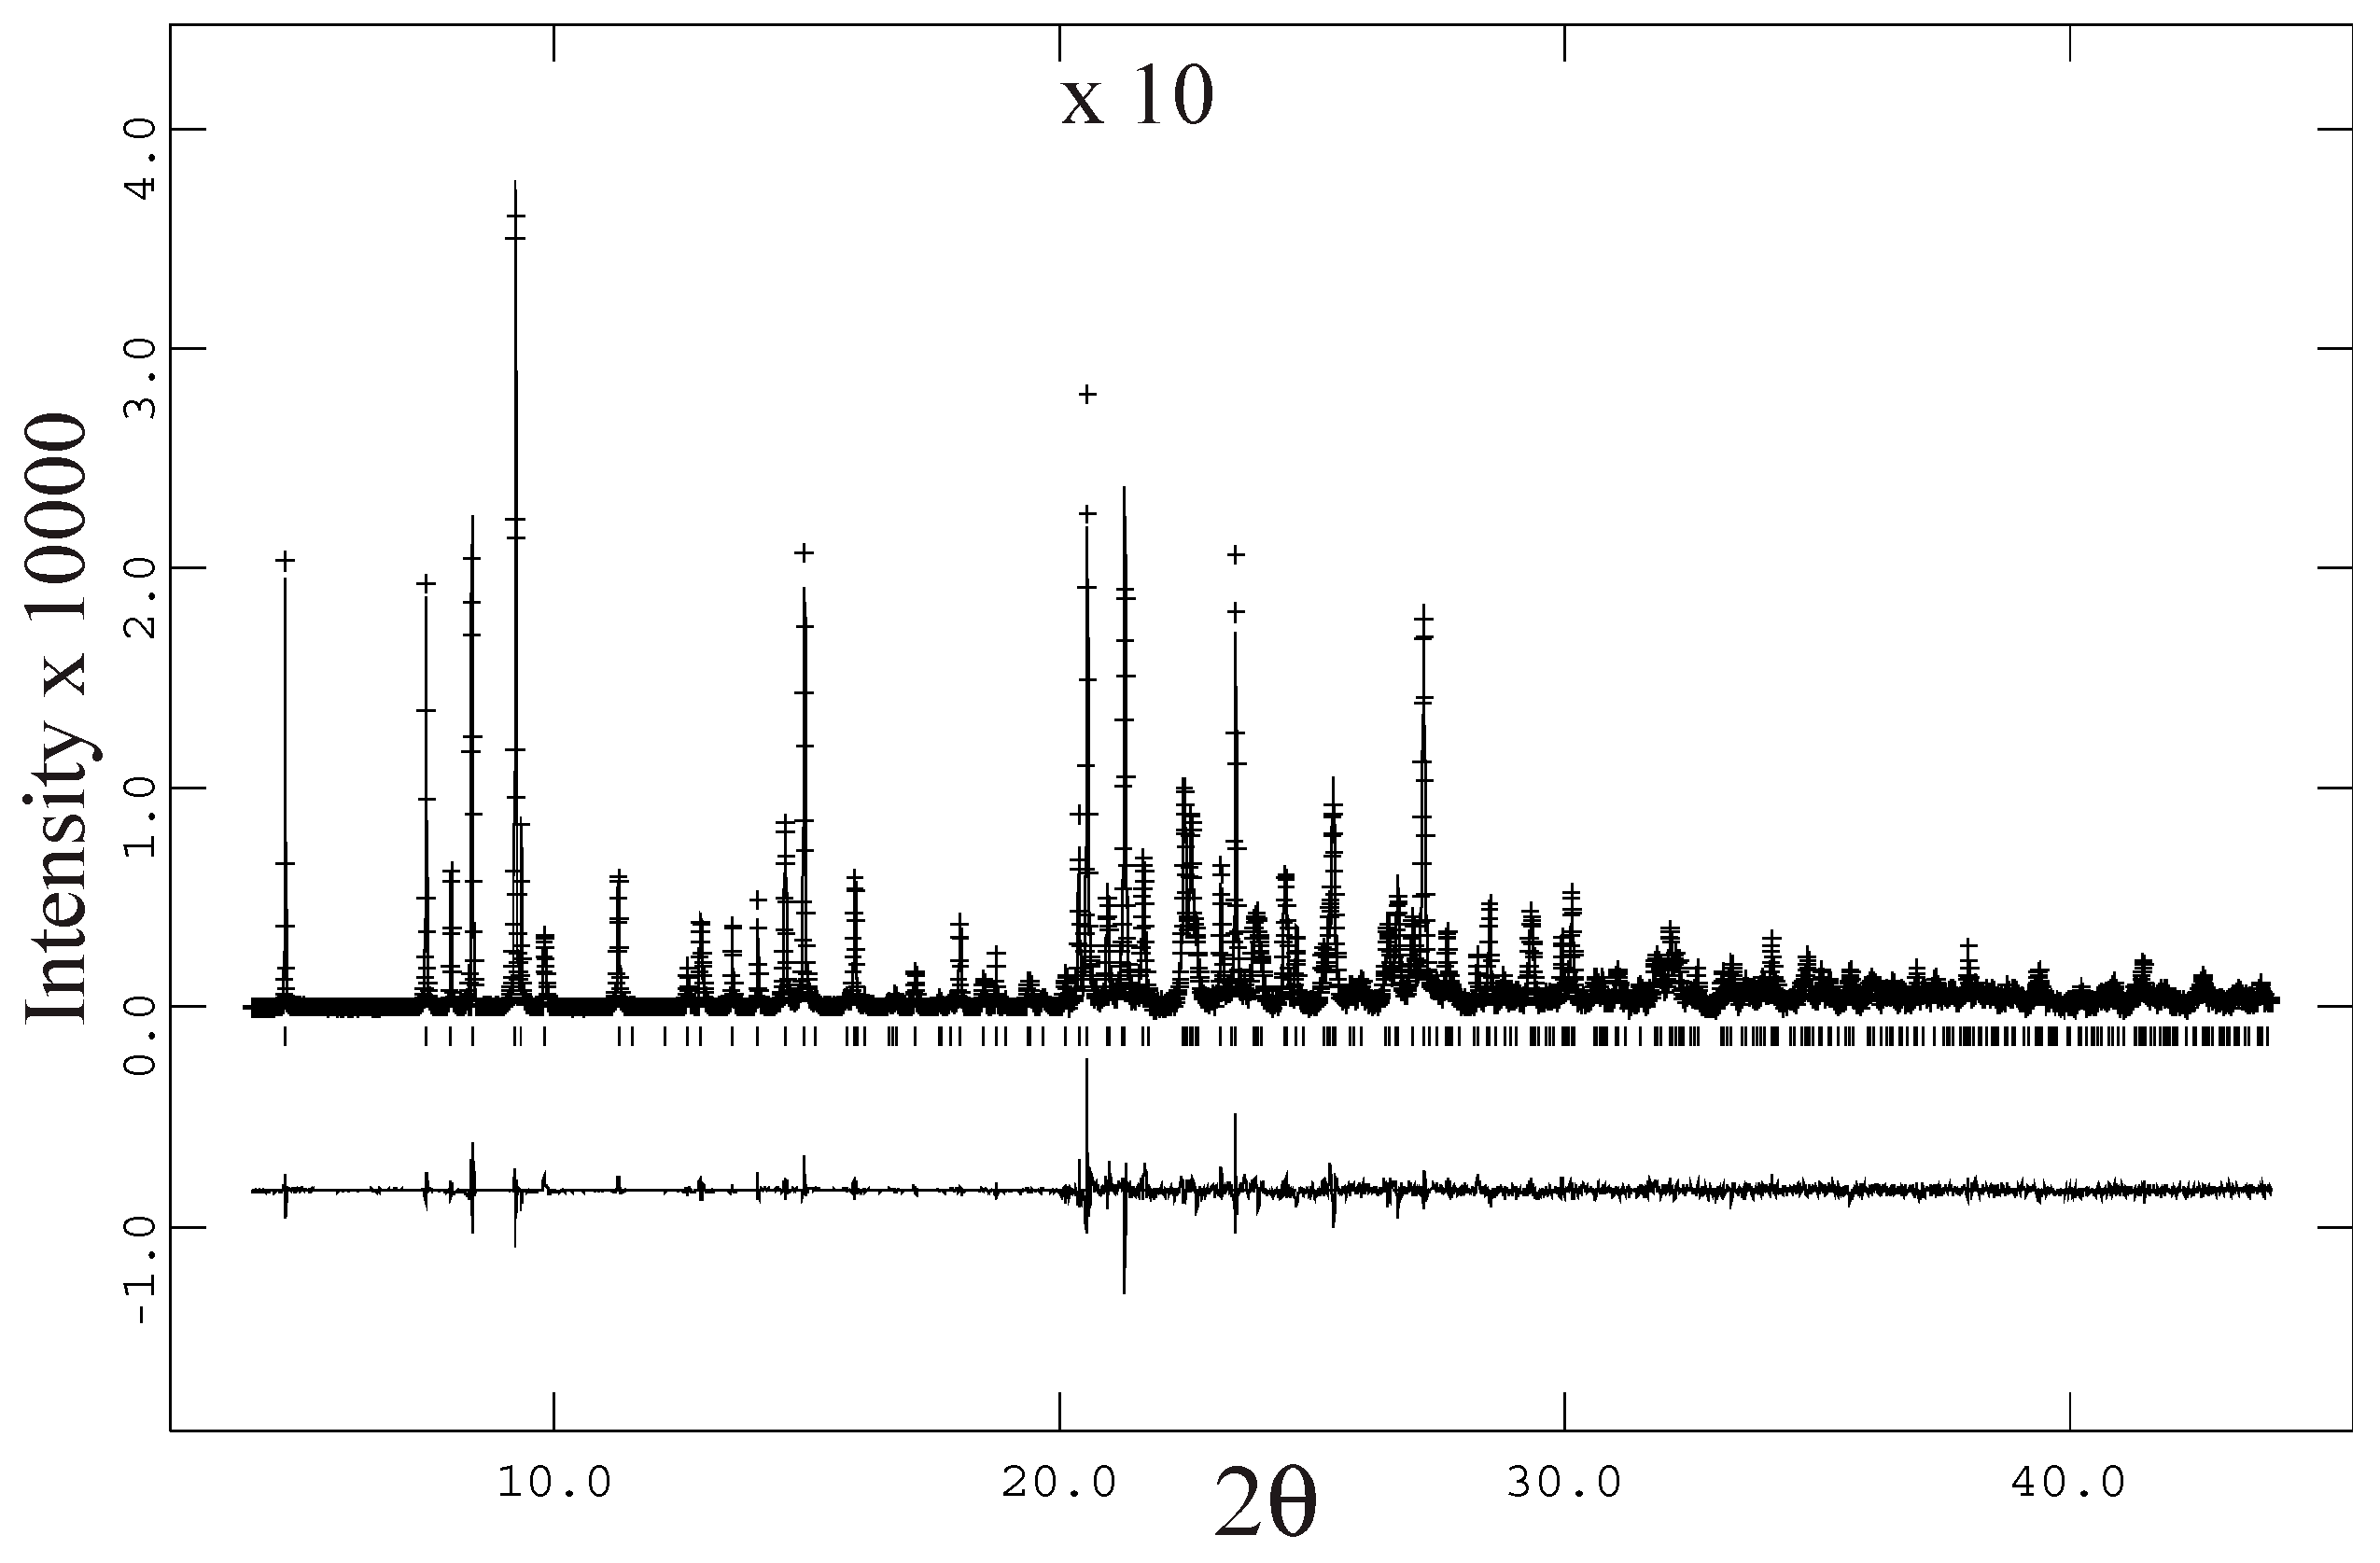
The HRPXRD data was analyzed with the Rietveld method [44], as implemented in the GSAS program [45], and using the EXPGUI interface [46]. Scattering curves for neutral atoms were used. The single-crystal results were used as the initial structural model for the Rietveld refinement. The background was modeled with a shifted Chebyschev polynomial (six terms). The reflection-peak profiles were fitted using type-3 profile (pseudo-Voigt; [47,48]). Examination of the HRPXRD trace for the hausmannite sample-b shows a single tetragonal phase. No impurities or un-indexed peaks were observed (Figure 2). The unit-cell parameters and the Rietveld refinement statistical indicators are given for both samples-b and -c (Table 4). The atom coordinates, sofs, and equivalent isotropic displacement parameters are given in Table 5. Anisotropic displacement parameters are given in Table 6. Selected bond distances and angles are given in Table 7.
3. Results and Discussion
Backscattered electron (BSE) images of sample-a revealed the presence of hausmannite within henritermierite garnet (see Figure 8 in [12]). The chemical composition for sample-a is [Mn2+0.88Mg0.11Fe2+0.01]Σ2.00(Mn3+)2.00O4, where the substitution is mainly between divalent Mn2+and Mg2+ cations at the T site. In general, the Mn2+ cation may be replaced by Mg2+ or Fe2+ cations. Among trivalent cations, Mn3+ is the most abundant and may be replaced by Fe3+ cations, but the amount of Mn3+ cation is nearly constant at its maximum value of 2 for sample-a (Table 2). The single-crystal structure refinement indicates that sample-a is close to pure Mn3O4 because both the T and M site occupancy factors (sofs) refine to 1 (Table 5). Consequently, both the M and O sofs were fixed at 1.0 in the final refinement and T(sof) still refined to 1.0. The bond-valence sums around the three atom sites are close to the expected value for pure Mn3O4, where the M site has 3.03 vu that corresponds to the Mn3+ cation, the T site has 2.05 vu that corresponds to the Mn2+ cation, and the O site has 2.03 vu that corresponds to the O atom (Table 8).
The chemical composition for sample-b is [Mn0.99Mg0.01](Mn1.52Fe0.48)O4 (Table 2) whereas the Rietveld structure refinement give the formula [Mn0.82Fe0.18](Mn1.88Fe0.12)O4 (Table 5), where the total amount of Fe atoms is 0.30, compared to 0.48 obtained by EPMA. The substitution of Fe3+ for Mn3+ cations at the M site indicates that samples-a and -b should have different structural features. Sample-a has a shorter T–O distance because some Mg2+ (0.57 Å) replace Mn2+ (0.66 Å) cations at the T site. The Jahn–Teller elongation, Δ(M–O), is larger in sample-a than sample-b (Table 7). The difference in Jahn–Teller elongation of 0.034(1) Å between samples-a and -b is one of the most significant structural difference between these two samples.
Structural Trends for Hausmannite Solid Solutions
Chemical compositions, unit-cell parameters, and bond distances for 25 hausmannite samples are listed and their variations are shown graphically (Table 1, Figure 3, Figure 4 and Figure 5). Using data for samples-13 to -24 from Bosi et al. [10,11], linear trend lines were constructed. The equations for the linear lines and their R2 values are given as inserts in each figure. The linear lines represent solid solutions incorporating Mg2+, Fe2+, or Zn2+ cations in the place of Mn2+ cations at the T site (Figure 3, Figure 4 and Figure 5). Substitution of Fe3+ for Mn3+ cations occur at the M site in sample-b. The following cation radii from Shannon [50] are of relevance for hausmannite solid solutions: tetrahedral four-coordinated Mn2+ (0.66 Å), Fe2+ (0.63 Å), Zn2+ (0.60 Å), and Mg2+ (0.57 Å) cations have similar sizes and may replace each other at the T site. Similarly, octahedral six-coordinated Mn3+ (0.645 Å, HS), Fe3+ (0.645 Å, HS), and less likely Al3+ (0.535 Å) cations may substitute for each other at the M site.
Neutron data from Baron et al. [14] gave structural data at 10 K for three samples (5–7; Table 1). These neutron data appear to be incorrectly calculated and reported in the American Mineralogist Crystal Structure Database at 295 K (8 to 10; Table 1). Unit-cell parameters (sample-1) from Satomi [16] are unreliable because it does not plot close to pure hausmannite that corresponds to samples-24 and -c. The neutron data at 295 K (sample-8) assume sample-1 values in its calculations. Structural data for some nearly pure Mn3O4 are given (1, 4, 5, 8, and 21–23). Their deviations in values from nearly pure samples-24 and -c show what datasets are unreliable (1, 8–10 are unreliable; Figure 3), so these four data points are not considered further.
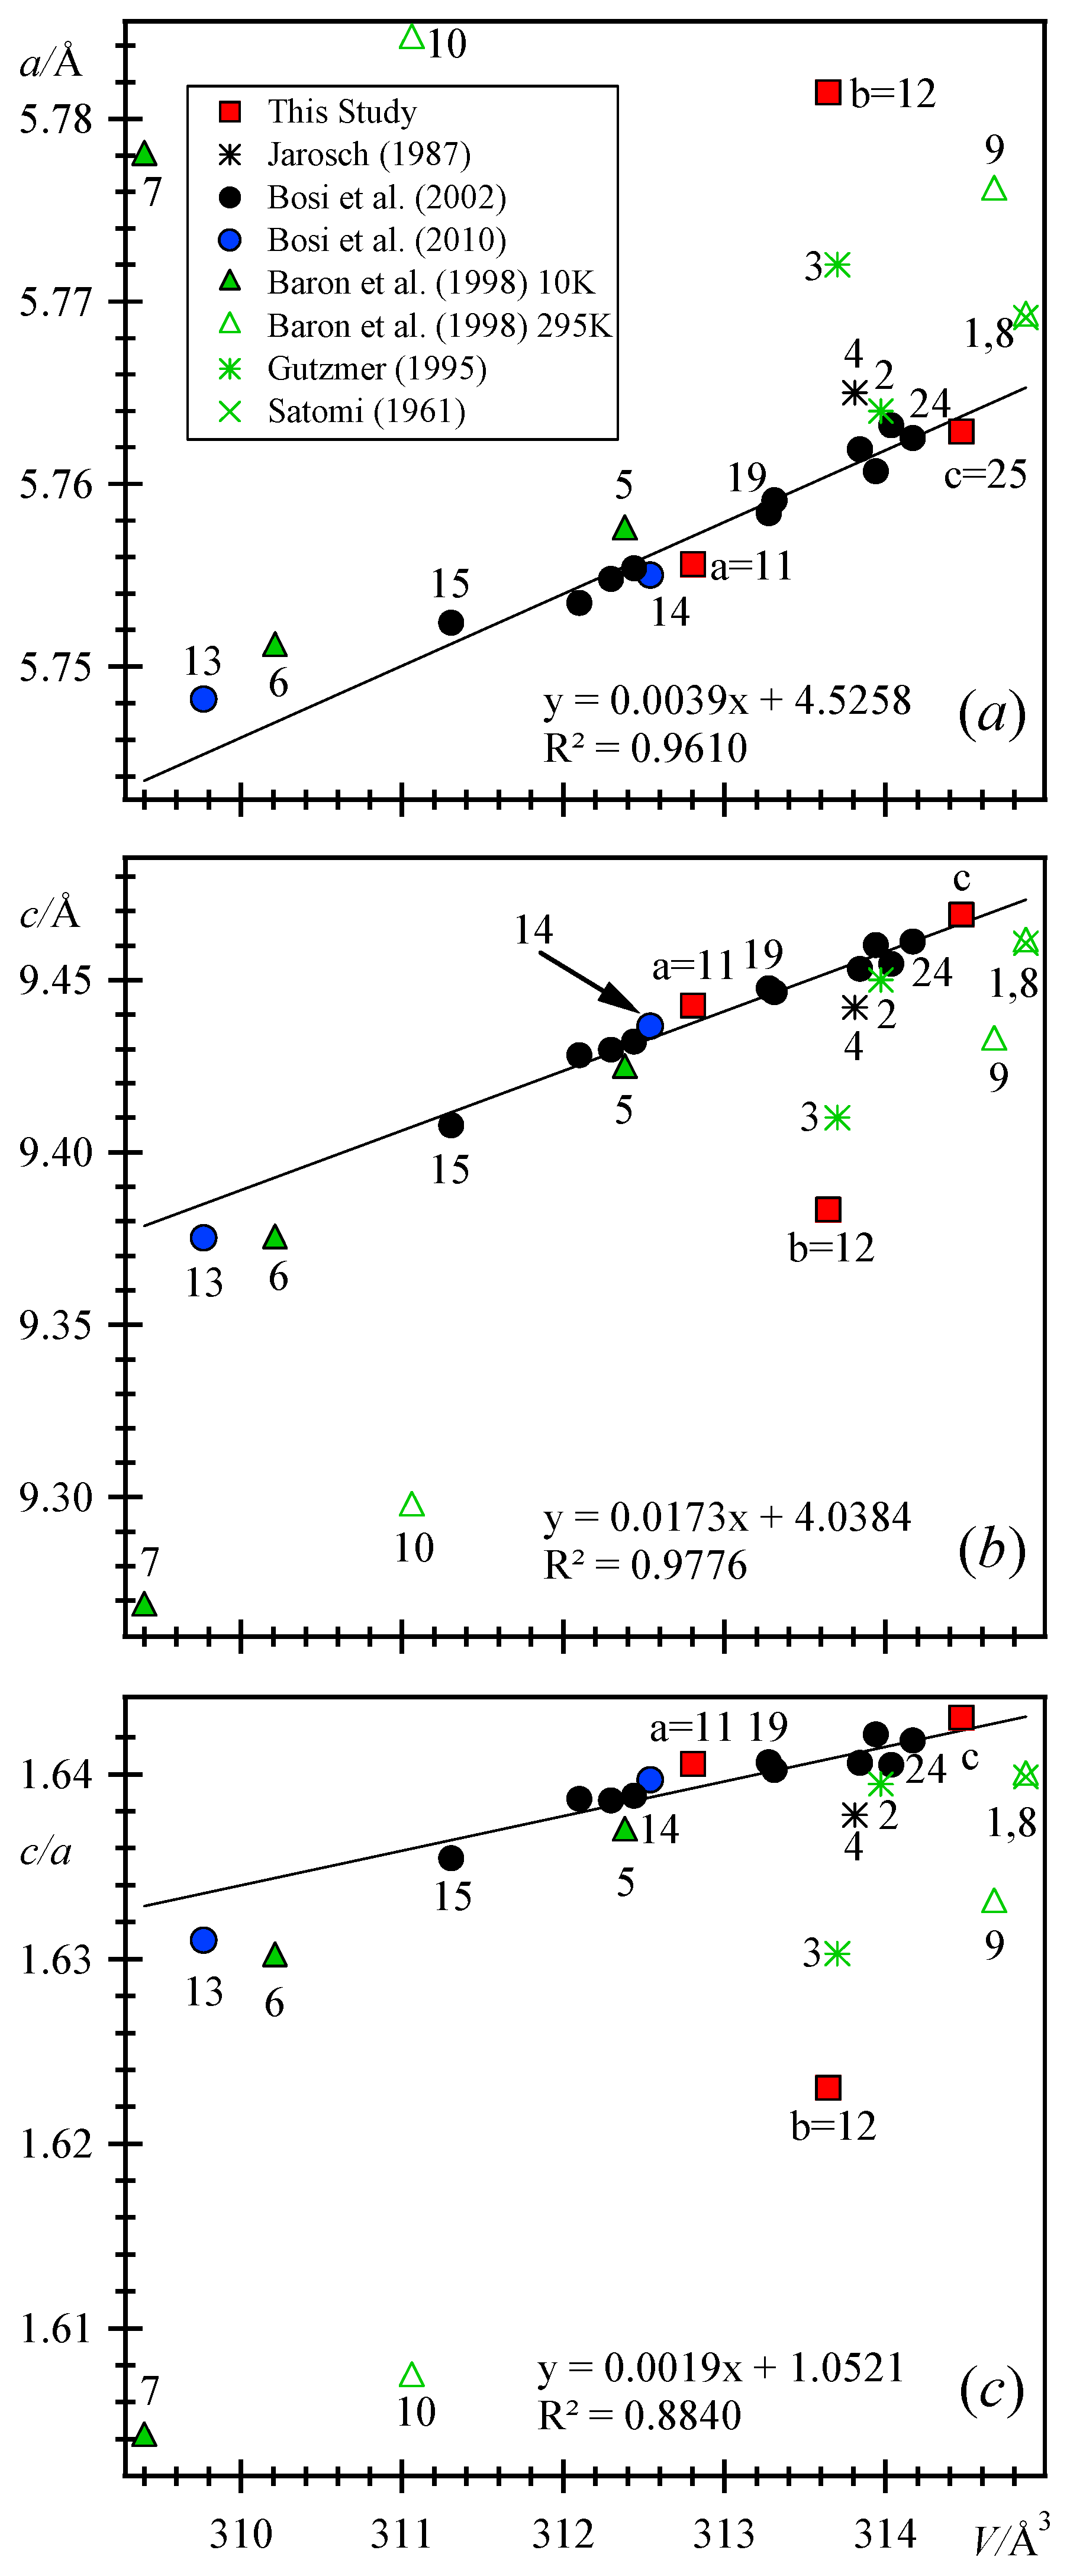
Gutzmer et al. [13] presented chemical compositions and unit-cell parameters for two samples from the KMF (2 is non-magnetic and 3 is magnetic; Table 1). Sample-2 seems similar to pure Mn3O4 sample-c (Figure 3). Sample-a (= 11) plots between samples-14 and -19 (Figure 3). Sample-b has unit-cell parameters that are different from samples-3 and -7 (10 K data), but it seems plausible that both of these samples are similar to sample-b because all three samples are off the trend lines (Figure 3). The magnetic property of samples-3 and -7, if present, may arise from the incorporation of Fe3+ for Mn3+ cations in hausmannite solid solutions [14]. However our sample-b is not magnetic when tested with a hand magnet. Based on room-temperature data, sample-c has the largest V among samples for which structures are available, whereas the Mg-rich sample-13 has the smallest V.
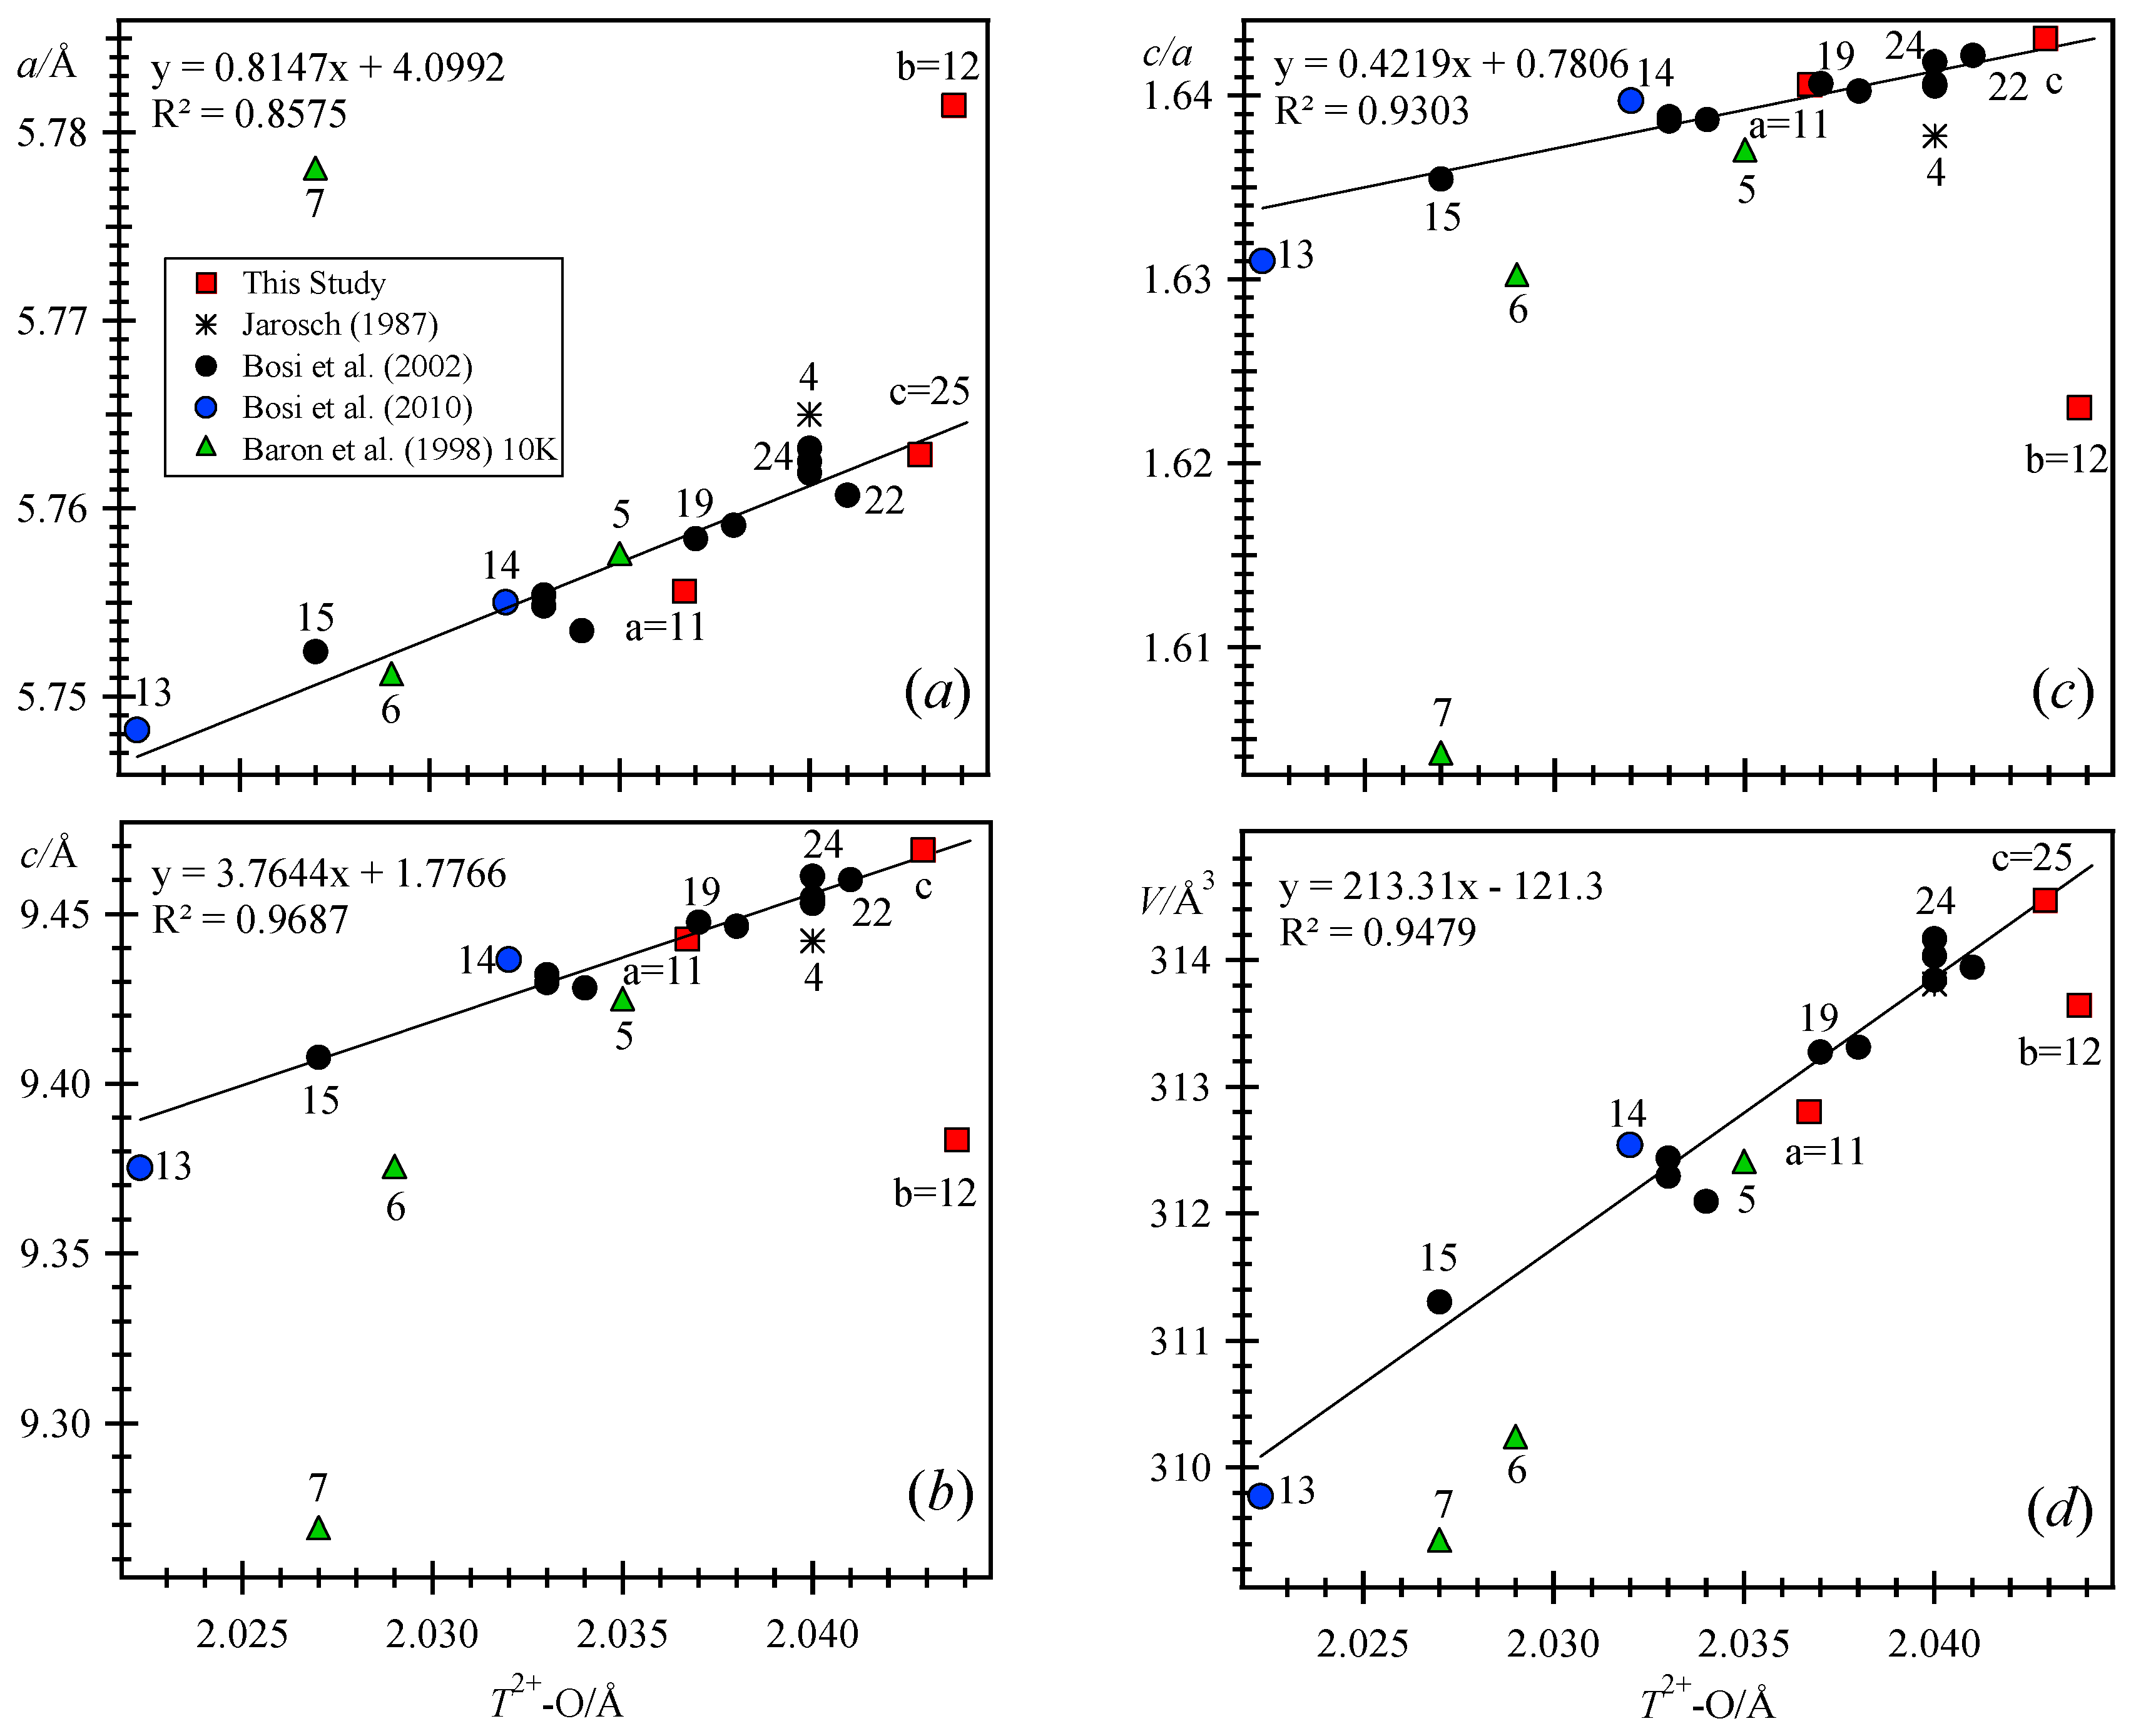
Figure 4 displays the <T–O> distance against unit-cell parameters. Data for sample-a plots close to sample-19, but samples-b and -7 (10 K) are off the linear trend lines. Samples-b and -c have the largest but similar T–O distances, whereas the Mg-rich sample-13 has the smallest T–O distance. The trend lines correspond to substitution of divalent cations at the T site. Substitution of smaller divalent cations for Mn2+ at the T site causes contraction of the T–O distances, where sample-13 has the shortest distance (Figure 4; Table 1). Sample-13 also has the smallest unit-cell parameters because it contains the highest amount of Mg2+ cations at the T site. Samples-b and -7 contain a significant amount of Fe3+ cations at the octahedral M site, which affects the unit-cell parameters and T–O distances (Figure 4).
The average <M–O> distance varies linearly with unit-cell parameters (Figure 5). Data for samples-a and -c falls near the linear trend lines, but samples-b and -7 are off those lines. The trend lines correspond to substitution of divalent cations at the T site. Substitution of trivalent cations at the M site causes these samples to plot off the trend lines. The presence of Fe3+ cations at the M site causes less Jahn–Teller distortion in sample-b compared to sample-a, so the average <M–O> is shorter in sample-b (Table 7).
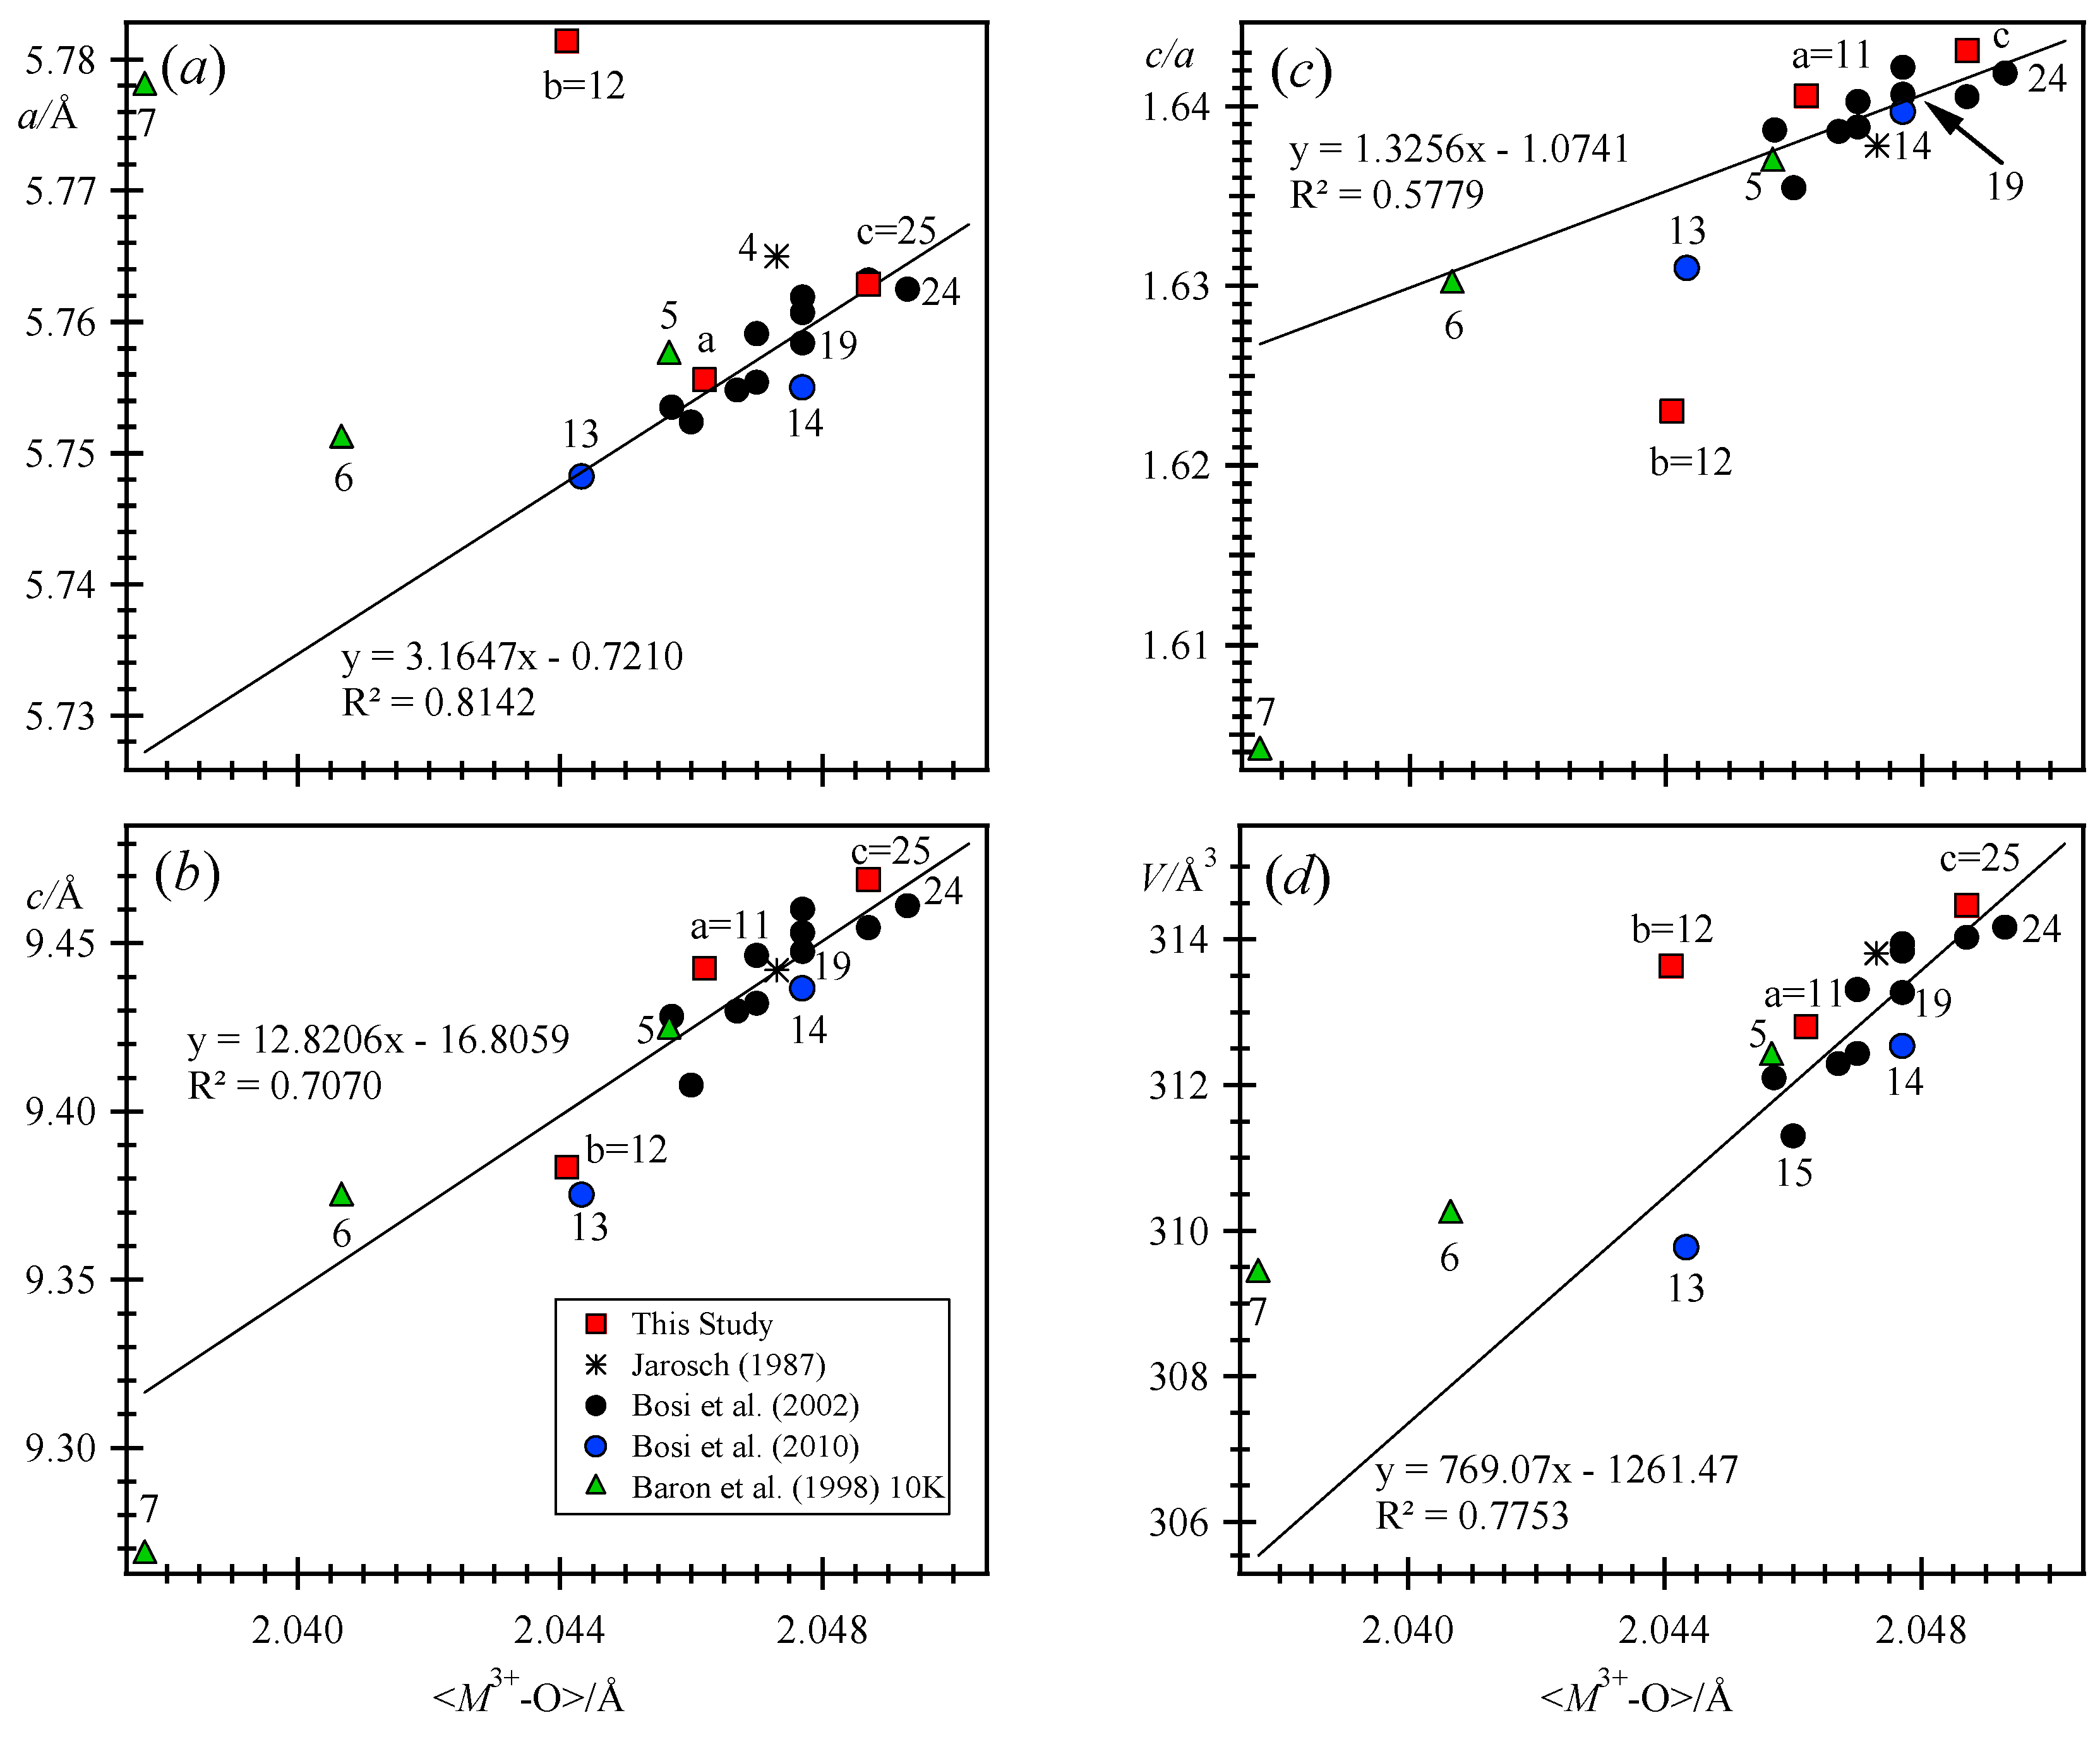
Substitution of cations at the octahedral M site causes a change in the average <M3+–O> distance and unit-cell parameters (Figure 5). For the samples (13 to 24; Table 1) for which the trend lines are based, the M site is completely filled with Mn3+ cations. Therefore, variations in the <M3+–O> distance arise from the influence of the T site cations. However, samples-b and -7 contain a significant amount of Fe3+ cations at the M site, so these samples are off the trend lines (Figure 5). With respect to pure Mn3O4 (samples-24, -c), sample-b shows an enlargement of a and contraction of the c unit-cell parameter. Samples-c and -24 have the largest average <M–O> distance, whereas the Mg-rich sample-13 has the smallest average <M–O> distance.
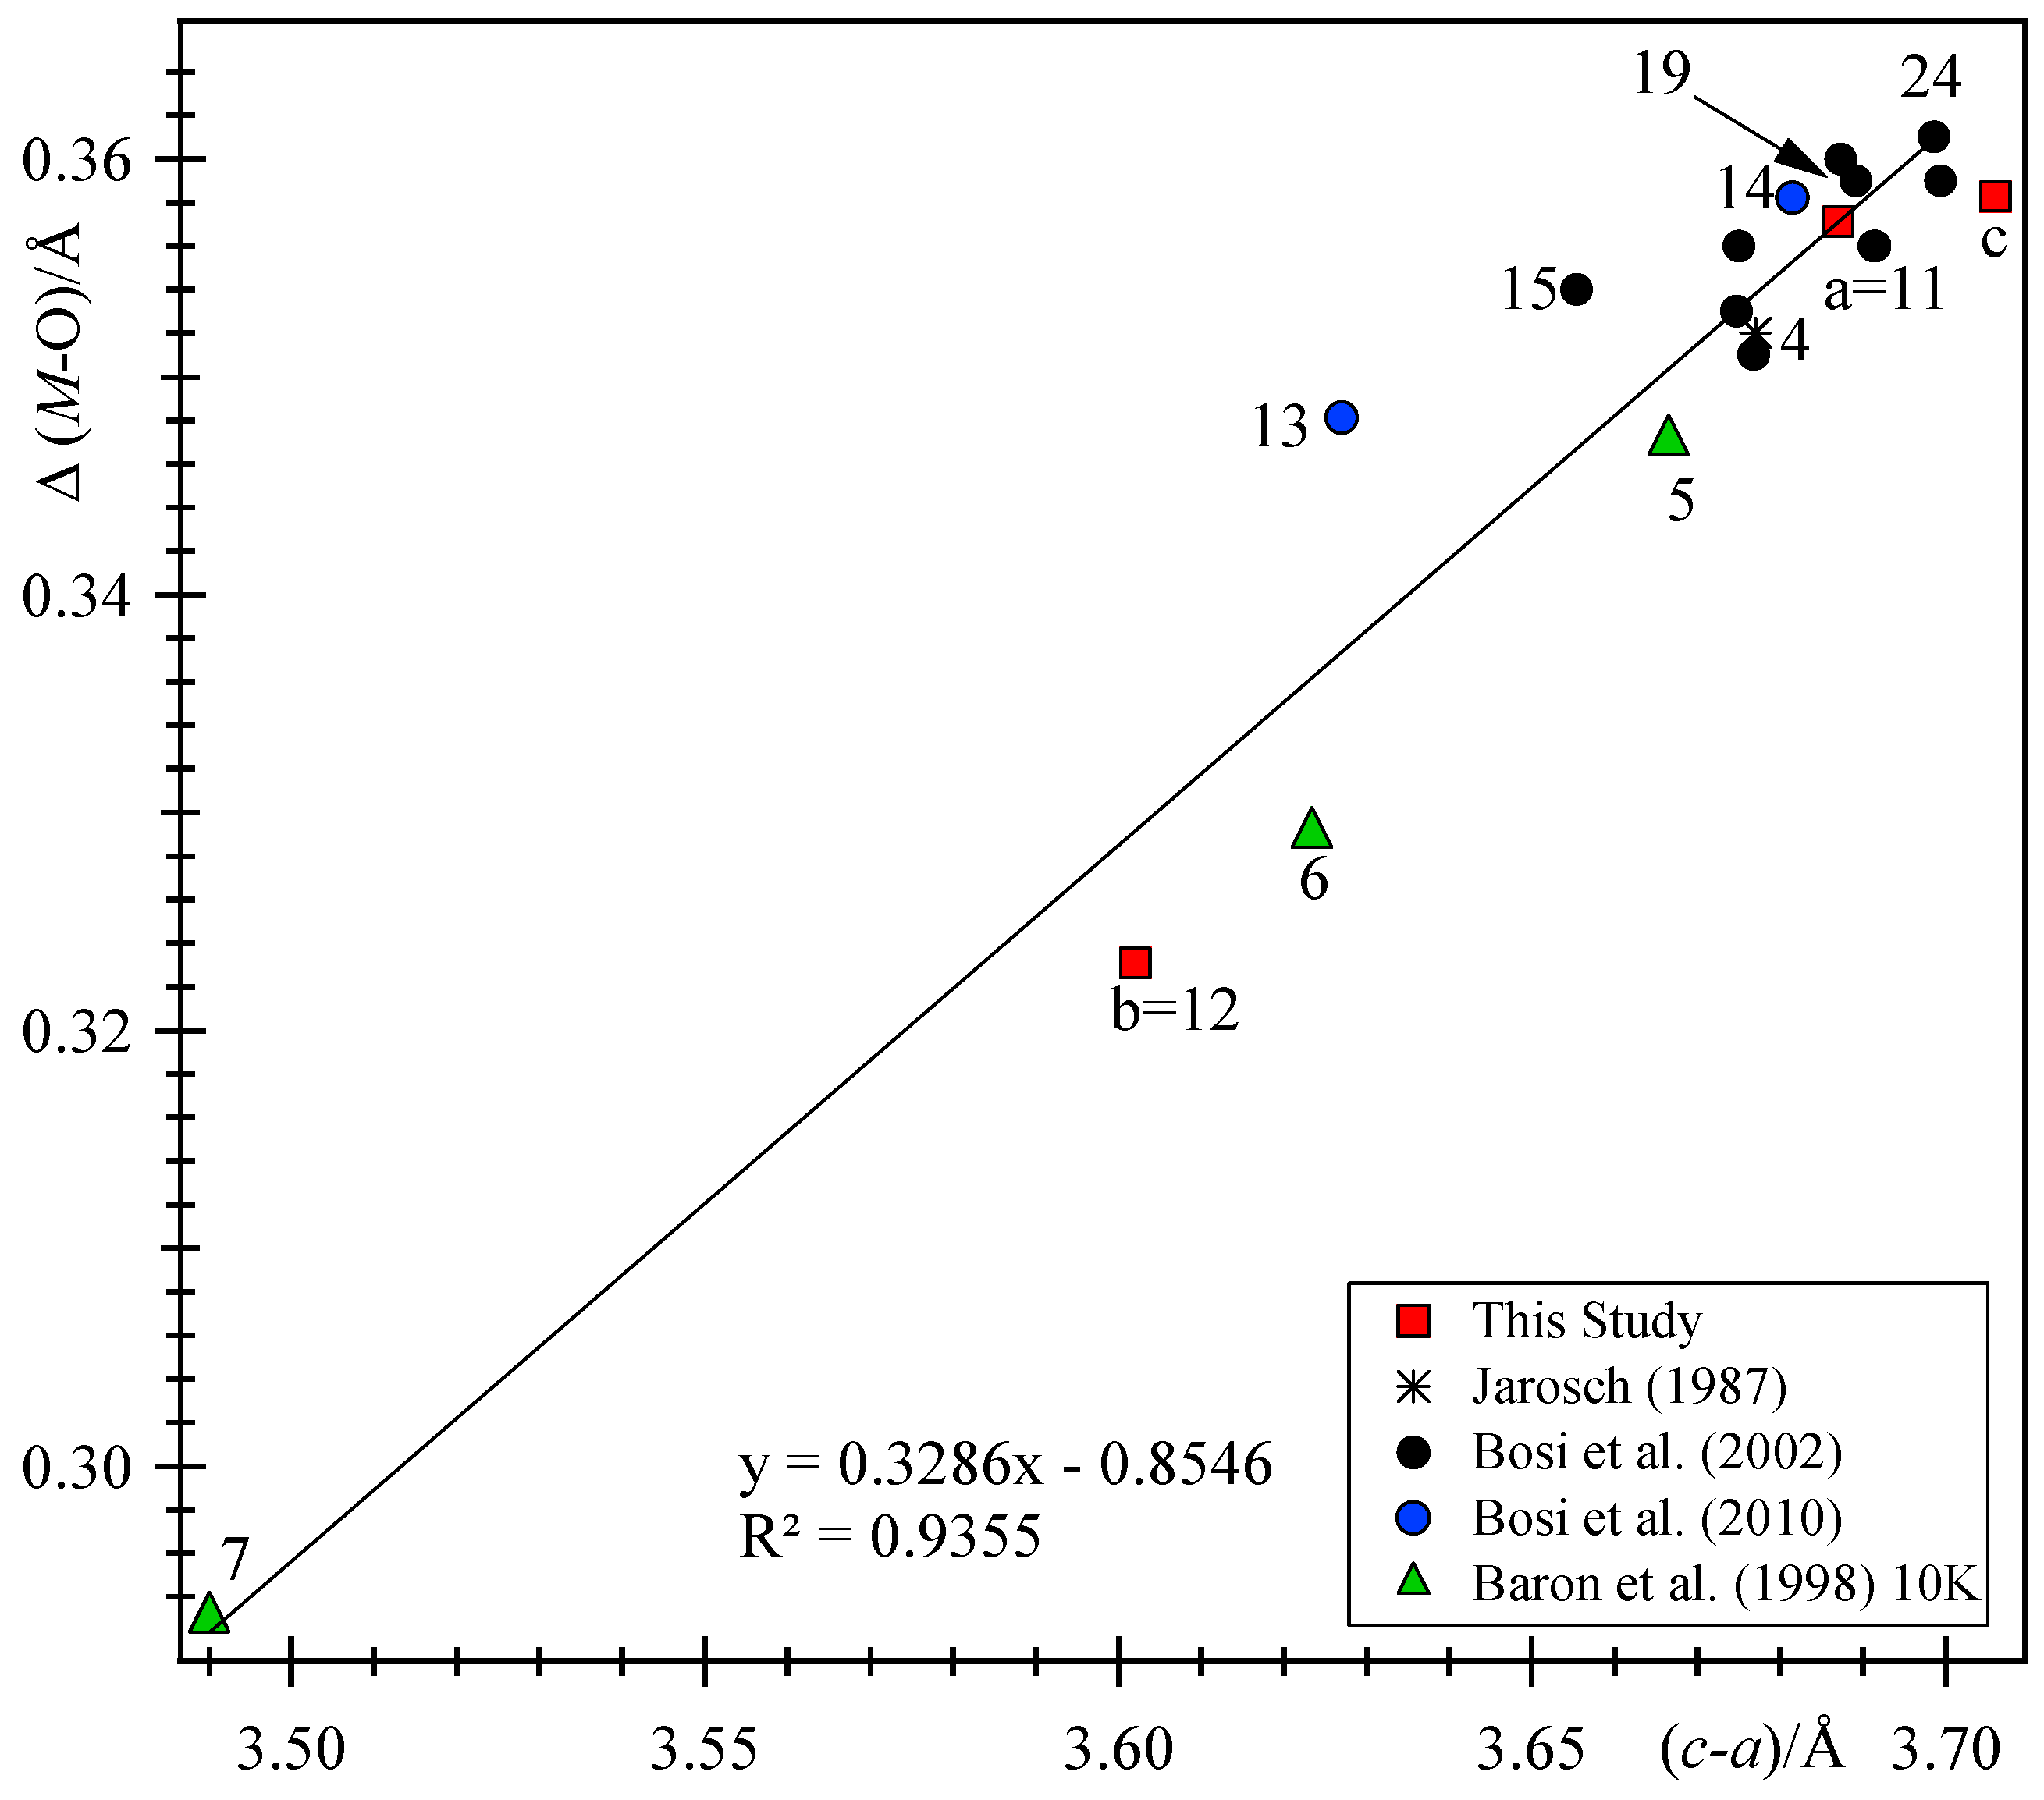
The Jahn–Teller elongation, Δ(M–O), is less for sample-b compared to sample-a (Table 6; Figure 6). As the difference between the a and c unit-cell parameters, (c-a), becomes smaller, the Jahn–Teller elongation, Δ(M–O), also becomes smaller (Figure 6). For the samples in this study, sample-c has the highest Δ(M–O), whereas sample-b has the lowest Δ(M–O). At low temperature (10 K), sample-7 has the least distortion. The Mg-rich sample-13 has a small distortion. In the case of the tetragonal to cubic transition of hausmannnite, with increasing temperature, the a and c unit-cell parameters approach equality and Δ(M–O) also approaches 0 towards the transition at 1170 °C.
4. Conclusions
Hausmannite, [4][Mn2+][6](Mn23+)O4, has space group I41/amd and forms a tetragonally-distorted spinel structure. The octahedral M3+ cation site contains Jahn–Teller elongation that is less in the Fe3+-rich sample-b compared to pure hausmannite. Cubic hausmannite contains no Jahn–Teller elongation. Both the tetrahedral T2+ and octahedral M3+ sites accommodate cation substitutions. Possible T site divalent cations are Mn2+, Mg2+, Zn2+, or Fe2+, whereas the M site trivalent cations are Mn3+, Fe3+, or Al3+ (Table 1). These two different substitutions give rise to two distinct set of structural features that includes unit-cell parameters and bond distances (Figure 3, Figure 4 and Figure 5).
Supplementary Materials
Supplementary Materials can be found at https://www.mdpi.com/2075-163X/9/6/343/s1.
Author Contributions
L.A.C. performed the EPMA experiment, analyzed the chemical composition data, and collected the SCXRD data for sample-a. K.S.H. analysed the HRPXRD data for sample-c. S.M.A. conceived the project, analysed the HRPXRD data for sample-b and SCXRD data for sample-a, and wrote the manuscript. All authors contributed to editing the manuscript.
Funding
This project was supported with a NSERC Discovery Grant to S.M.A.
Acknowledgments
We thank the two anonymous reviewers for comments that helped improve this manuscript. We thank the Royal Ontario Museum (ROM) for the hausmannite–henritermierite sample. R. Marr is thanked for his help with the electron probe analyses and B. Gelfand is thanked for his help with the SCXRD work. The HRPXRD data were collected at the X-ray Operations and Research beamline 11-BM, Advanced Photon Source (APS), Argonne National Laboratory (ANL). Use of the APS was supported by the U.S. Dept. of Energy, Office of Science, Office of Basic Energy Sciences, under contract no. DE-AC02-06CH11357.
Conflicts of Interest
The authors declare no conflict of interest.
References
- O’Neill, H.S.C.; Wall, V.J. The olivine–Orthopyroxene-spinel oxygen geobarometer, the nickel precipitation curve, and the oxygen fugacity of the Earth’s upper mantle. J. Petrol. 1987, 28, 1169–1191. [Google Scholar] [CrossRef]
- Sack, R.O. Spinels as petrogenetic indicators: Activity-composition relations at low pressures. Contrib. Mineral. Petrol. 1982, 79, 169–186. [Google Scholar] [CrossRef]
- Bosi, F. Chemical and structural variability in the cubic spinel oxides. Acta Crystallogr. 2019, B75, 279–285. [Google Scholar] [CrossRef]
- Bosi, F.; Biagioni, C.; Pasero, M. Nomenclature and classification of the spinel supergroup. Eur. J. Mineral. 2019, 31, 183–192. [Google Scholar] [CrossRef] [Green Version]
- Antao, S.M.; Hassan, I.; Parise, J.B. Cation ordering in magnesioferrite, MgFe2O4, to 982 °C using in situ synchrotron X-ray powder diffraction. Am. Mineral. 2005, 90, 219–228. [Google Scholar] [CrossRef]
- Antao, S.M.; Hassan, I.; Crichton, W.A.; Parise, J.B. Effects of high pressure and temperature on cation ordering in magnesioferrite, MgFe2O4, using in situ synchrotron X-ray powder diffraction up to 1430 K and 6 GPa. Am. Mineral. 2005, 90, 1500–1505. [Google Scholar] [CrossRef]
- Antao, S.M.; Jackson, I.; Li, B.; Kung, J.; Chen, J.; Hassan, I.; Liebermann, R.C.; Parise, J.B. High temperature elasticity of magnesioferrite spinel. Phys. Chem. Miner. 2007, 34, 345–350. [Google Scholar] [CrossRef]
- Paladino, A.E. Phase equilibria in the ferrite region of the system FeO-MgO-Fe2O3. J. Am. Ceram. Soc. 1960, 43, 183–191. [Google Scholar] [CrossRef]
- Nogues, M.; Poix, P. Contribution á l’étude de la déformation de type Jahn-Teller dans l’oxyde mixte, ZnMn2O4 (A: Co, Ni, Cu, or Zn). Phys. Status Solidi A 1971, 69, 15–19. [Google Scholar]
- Bosi, F.; Hålenius, U.; Skogby, H. Crystal chemistry of the MgAl2O4-MgMn2O4-MnMn2O4 system: Analysis of structural distortion in spinel- and hausmannite-type structures. Am. Mineral. 2010, 95, 602–607. [Google Scholar] [CrossRef]
- Bosi, F.; Lucchesi, S.; Della Giusta, A. Structural relationships in (Mn1–xZnx)Mn2O4 (0 ≤ x ≤ 0.26): The “dragging effect” of the tetrahedron on the octahedron. Am. Mineral. 2002, 87, 1121–1127. [Google Scholar] [CrossRef]
- Antao, S.M.; Cruickshank, L.A. Crystal structure refinements of tetragonal (OH,F)-rich spessartine and henritermierite garnets. Acta Crystallogr. 2018, B74, 104–114. [Google Scholar] [CrossRef]
- Gutzmer, J.; Beukes, N.J.; Kleyenstüber, A.S.E.; Burger, A.M. Magnetic hausmannite from hydrothermally altered manganese ore in the paleoproterozoic kalahari manganese deposit, Transvaal Supergroup, South Africa. Mineral. Mag. 1995, 59, 703–716. [Google Scholar] [CrossRef]
- Baron, V.; Gutzmer, J.; Rundlöf, H.; Tellgren, R. The influence of iron substitution on the magnetic properties of hausmannite, Mn2+(Fe,Mn)3+2O4. Am. Mineral. 1998, 83, 786–793. [Google Scholar] [CrossRef]
- Aminoff, G. Über die Kristallstruktur von Hausmannit. Z. Krist. 1927, 64, 475–490. [Google Scholar]
- Satomi, K. Oxygen positional parameters of tetragonal Mn3O4. J. Phys. Soc. Jpn. 1961, 16, 258–266. [Google Scholar] [CrossRef]
- Boucher, B.; Buhl, R.; Perrin, M. Propriétés et structure magnétique de Mn3O4. J. Phys. Chem. Solids 1971, 32, 2429–2437. [Google Scholar] [CrossRef]
- Kasper, J.S. Magnetic structure of hausmannite, Mn3O4. Bull. Am. Phys. Soc. 1959, 4, 178. [Google Scholar]
- Åsbrink, S.; Waś Kowska, A.; Gerward, L.; Staun Olsen, J.; Talik, E. High-pressure phase transition and properties of spinel ZnMn2O4. Phys. Rev. B 1999, 60, 12651–12656. [Google Scholar] [CrossRef]
- Radhakrishnan, N.K.; Biswas, A.B. Cation distribution in the tetragonal spinel MgMn2O4. Z. Krist. 1975, 142, 117–120. [Google Scholar]
- Jarosch, D. Crystal structure refinement and reflectance measurements of hausmannite, Mn3O4. Mineral. Petrol. 1987, 37, 15–23. [Google Scholar] [CrossRef]
- Sinha, A.P.B.; Sanjana, N.R.; Biswas, A.B. On the structure of some manganites. Acta Crystallogr. 1957, 10, 439–440. [Google Scholar] [CrossRef]
- Goodenough, J.B.; Loeb, A.L. Theory of ionic ordering, crystal distortion, and magnetic exchange due to covalent forces in spinels. Phys. Rev. 1955, 98, 391–408. [Google Scholar] [CrossRef]
- Frenzel, G. The manganese ore minerals. In The Geology and Geochemistry of Manganese; Varentsov, I.M., Grasselly, G., Eds.; Schweizerbarth: Stuttgart, Germany, 1980; Volume 1, pp. 25–157. [Google Scholar]
- Pollert, E. Tetragonal-to-cubic transformation of hausmannite. J. Solid State Chem. 1980, 33, 305–308. [Google Scholar] [CrossRef]
- Otwinowski, Z.; Minor, W. “Processing of X-ray Diffraction Data Collected in Oscillation Mode”, Methods in Enzymology: Macromolecular Crystallography, Part A; Academic Press: New York, NY, USA, 1997; Volume 276, pp. 307–326. [Google Scholar]
- Sheldrick, G.M. Crystal structure refinement with SHELXL. Acta Crystallogr. 2015, C71, 3–8. [Google Scholar]
- Farrugia, L.J. WinGX and ORTEP for Windows: An update. J. Appl. Crystallogr. 2012, 45, 849–854. [Google Scholar] [CrossRef]
- Lee, P.L.; Shu, D.; Ramanathan, M.; Preissner, C.; Wang, J.; Beno, M.A.; Von Dreele, R.B.; Ribaud, L.; Kurtz, C.; Antao, S.M.; et al. A twelve-analyzer detector system for high-resolution powder diffraction. J. Synchrotron Radiat. 2008, 15, 427–432. [Google Scholar] [CrossRef]
- Wang, J.; Toby, B.H.; Lee, P.L.; Ribaud, L.; Antao, S.M.; Kurtz, C.; Ramanathan, M.; Von Dreele, R.B.; Beno, M.A. A dedicated powder diffraction beamline at the advanced photon source: Commissioning and early operational results. Rev. Sci. Instrum. 2008, 79, 085105. [Google Scholar] [CrossRef]
- Antao, S.M.; Hassan, I.; Wang, J.; Lee, P.L.; Toby, B.H. State–Of-the-art high-resolution powder X-ray diffraction (HRPXRD) illustrated with Rietveld structure refinement of quartz, sodalite, tremolite, and meionite. Can. Mineral. 2008, 46, 1501–1509. [Google Scholar] [CrossRef]
- Antao, S.M.; Duane, M.J.; Hassan, I. DTA, TG, and XRD studies of sturmanite and ettringite. Can. Mineral. 2002, 40, 1403–1409. [Google Scholar] [CrossRef]
- Ehm, L.; Antao, S.M.; Chen, J.H.; Locke, D.R.; Michel, F.M.; Martin, C.D.; Yu, T.; Parise, J.B.; Lee, P.L.; Chupas, P.J.; et al. Studies of local and intermediate range structure in crystalline and amorphous materials at high pressure using high-energy X-rays. Powder Diffr. 2007, 22, 108–112. [Google Scholar] [CrossRef] [Green Version]
- Antao, S.M.; Hassan, I. Thermal analyses of sodalite, tugtupite, danalite, and helvite. Can. Mineral. 2002, 40, 163–172. [Google Scholar] [CrossRef]
- Skinner, L.B.; Benmore, C.J.; Antao, S.M.; Soignard, E.; Amin, S.A.; Bychkov, E.; Rissi, E.; Parise, J.B.; Yarger, J.L. Structural changes in vitreous GeSe4 under pressure. J. Phys. Chem. C 2011, 116, 2212–2217. [Google Scholar] [CrossRef]
- Hassan, I.; Antao, S.M.; Parise, J.B. Haüyne: Phase transition and high-temperature structures obtained from synchrotron radiation and Rietveld refinements. Mineral. Mag. 2004, 68, 499–513. [Google Scholar] [CrossRef]
- Antao, S.M. Structural trends for celestite (SrSO4), anglesite (PbSO4), and barite (BaSO4): Confirmation of expected variations within the SO4 groups. Am. Mineral. 2012, 97, 661–665. [Google Scholar] [CrossRef]
- Ehm, L.; Michel, F.M.; Antao, S.M.; Martin, C.D.; Lee, P.L.; Shastri, S.D.; Chupas, P.J.; Parise, J.B. Structural changes in nanocrystalline mackinawaite (FeS) at high presure. J. Appl. Crystallogr. 2009, 42, 15–21. [Google Scholar] [CrossRef]
- Parise, J.B.; Antao, S.M.; Michel, F.M.; Martin, C.D.; Chupas, P.J.; Shastri, S.; Lee, P.L. Quantitative high-pressure pair distribution function analysis. J. Synchrotron Radiat. 2005, 12, 554–559. [Google Scholar] [CrossRef]
- Antao, S.M. Three cubic phases intergrown in a birefringent andradite-grossular garnet and their implications. Phys. Chem. Miner. 2013, 40, 705–716. [Google Scholar] [CrossRef]
- Antao, S.M.; Klincker, A.M. Origin of birefringence in andradite from Arizona, Madagascar, and Iran. Phys. Chem. Miner. 2013, 40, 575–586. [Google Scholar] [CrossRef]
- Antao, S.M. Crystal structure of morimotoite from Ice River, Canada. Powder Diffr. 2014, 29, 325–330. [Google Scholar] [CrossRef] [Green Version]
- Antao, S.M. Crystal-structure analysis of four mineral samples of anhydrite, CaSO4, using synchrotron high-resolution powder X-ray diffraction data. Powder Diffr. 2011, 26, 326–330. [Google Scholar] [CrossRef]
- Rietveld, H.M. A profile refinement method for nuclear and magnetic structures. J. Appl. Crystallogr. 1969, 2, 65–71. [Google Scholar] [CrossRef]
- Larson, A.C.; Von Dreele, R.B. General Structure Analysis System (GSAS); Los Alamos National Laboratory Report; LAUR 86-748; Los Alamos National Laboratory: Los Alamos, NM, USA, 2000.
- Toby, B.H. EXPGUI, a graphical user interface for GSAS. J. Appl. Crystallogr. 2001, 34, 210–213. [Google Scholar] [CrossRef]
- Cagliotti, G.; Paoletti, A.; Ricci, F.P. Choice of collimators for a crystal spectrometer for neutron diffraction. Nucl. Instrum. 1958, 3, 223–228. [Google Scholar] [CrossRef]
- Thompson, P.; Cox, D.E.; Hastings, J.B. Rietveld refinement of Debye-Scherrer synchrotron X-ray data from alumina. J. Appl. Crystallogr. 1987, 20, 79–83. [Google Scholar] [CrossRef]
- Wills, A.S.; Brown, I.D. VaList; This Is a Freely Available Computer Program; CEA: Gif-sur-Yvette, France, 1999. [Google Scholar]
- Shannon, R.D. Revised effective ionic radii and systematic studies of interatomic distances in halides and chalcogenides. Acta Crystallogr. 1976, A32, 751–767. [Google Scholar] [CrossRef]
Figure 1.
Part of the tetragonal hausmannite structure consisting of Mn2+O4 tetrahedra (grey) and Mn3+O6 octahedra (pink) that contains Jahn–Teller elongation of two apical O atoms that occur in the vertical direction that is parallel to [001]; the four shorter basal Mn3+–O bonds of the bypyramid are nearly in the (100) plane. The oxygen atoms are indicated by red spheres. The hausmannite structure is similar to the henritermierite garnet structure that also consists of Jahn–Teller elongated Mn3+O6 octahedra and SiO4, instead of Mn2+O4, tetrahedra (see Figure 6 in [12]).

Figure 2.
The HRPXRD trace for hausmannite sample-b together with the calculated (continuous line) and observed (crosses) profiles. The difference curve (Iobs – Icalc) with the same intensity scale is shown at the bottom of the trace. Short vertical lines indicate allowed reflection positions. The intensities for the trace and difference curve that are above 20° 2θ are multiplied by 10.

Figure 3.
Linear variations among unit-cell parameters for hausmannite solid solutions (data from Table 1): (a) a vs. V, (b) c vs. V, and (c) c/a vs. V. Neutron data at 10 K (5–7 in Table 1; solid green triangles) are incorrectly calculated at 295 K (8–10; open green triangles). At room temperature, sample-c (= 25 in Table 1), which is a synthetic Mn3O4 powder, has the largest V among samples for which structures were refined, whereas sampe-13 has the smallest V because it contains small Mg cations. Samples-a (= 11) and -b (= 12) are indicated. Black lines represent atom replacement in the T2+ site, whereas substitution at the M3+ site occurs in samples that plot away from the trend lines. Sample-7 (10 K) and sample-b are off the trend lines and are related to Fe3+ substituting for Mn3+ at the M site. In addition, samples-2 to -4, especially sample-3, may contain substitutions at the M site. All the trend lines (equations given as inserts) in Figure 3, Figure 4 and Figure 5 are based on data from Bosi et al. [10,11].

Figure 4.
Structural variations for hausmannite solid solutions (data from Table 1). The average <T–O> distances vary linearly with unit-cell parameters: (a) a, (b) c, (c) c/a ratio, and (d) V. Samples-a and -c fall close to the trend lines, but samples-b and -7 are off the trend lines. Sample-b has the largest T–O distance. Of the samples close to the trend lines, samples-c has the largest T–O distance, whereas the Mg-rich sample-13 has the smallest T–O distance.

Figure 5.
The average <M–O> distance varies linearly with unit-cell parameters: (a) a, (b) c, (c) c/a ratio, and (d) V (data from Table 1). Samples-a and -c fall close to the trend lines, but samples-b and -7 are off those lines. Pure Mn3O4 has the largest average <M–O> distance (samples-c and -24) and the Mg-rich sample-13 has a small average <M–O> distance at room temperature.

Figure 6.
Linear variation of Jahn–Teller elongation, Δ(M–O), with the difference in unit-cell parameters, (c-a). The (c-a) value becomes smaller as Δ(M–O) becomes smaller. Cubic hausmannite contains no Jahn–Teller elongation, so (c-a) = 0. The trend line is fitted to all the plotted data (4–7 and 11–25; Table 1). Samples-c and -24 contain the most distortion from cubic symmetry, whereas sample-b contains the least distortion. Sample-7 at 10 K contains the least distortion of all the samples. The Mg-rich sample-13 has a small distortion.


Table 1.
Unit-cell parameters and bond distances for hausmannite, [4][T2+][6](M3+)2O4, where T = tetrahedral site and M = octahedral site.
Table 1.
Unit-cell parameters and bond distances for hausmannite, [4][T2+][6](M3+)2O4, where T = tetrahedral site and M = octahedral site.
| # | Locality | Composition | a/Å | c/Å | V/Å3 | M–OS × 4 | M–OL × 2 | T–O × 4 | Reference |
|---|---|---|---|---|---|---|---|---|---|
| 1 | Synthetic (Syn) | [Mn](Mn)2O4 | 5.7691(4) | 9.4605(7) | 314.87 | - | - | - | [16] |
| 2 | ‡ KMF (non-magnetic) | [Mn1.07Mg0.02]Ʃ1.09(Mn1.90Fe0.04)Ʃ1.94O4 | 5.764(7) | 9.45(8) | 313.97 | - | - | - | [13] |
| 3 | KMF (magnetic) | [Mn]1.03(Mn1.66Fe0.32)Ʃ1.98O4 | 5.772(6) | 9.41(6) | 313.70 | - | - | - | [13] |
| 4 | Langbån, Sweden | [Mn](Mn)2O4 | 5.765(1) | 9.442(2) | 313.81 | 1.930(1) | 2.282(1) | 2.040(1) | [21] |
| 5 | Syn @ 10 K | [Mn](Mn)2O4 | 5.7574(4) | 9.4239(9) | 312.38 | 1.930 | 2.277 | 2.035 | [14] † |
| 6 | KMF @ 10 K | [Mn](Mn1.94Fe0.06)Ʃ2.00O4 | 5.7510(3) | 9.3744(8) | 310.05 | 1.931 | 2.260 | 2.029 | [14] † |
| 7 | Syn @ 10 K | [Mn0.94Fe0.06]Ʃ1.00(Mn1.76Fe0.24)Ʃ2.00O4 | 5.7779(4) | 9.268(1) | 309.40 | 1.940 | 2.233 | 2.027 | [14] † |
| 8 | Syn@ 295 K | [Mn](Mn)2O4 | 5.7691 | 9.4605 | 314.87 | 1.932(1) | 2.284(2) | 2.044(2) | [14] * |
| 9 | KMF @ 295 K | [Mn](Mn1.94Fe0.06)Ʃ2.00O4 | 5.7760 | 9.432 | 314.67 | 1.936 | 2.279 | 2.040 | [14] * |
| 10 | Syn@ 295 K | [Mn0.94Fe0.06]Ʃ1.00(Mn1.76Fe0.24)Ʃ2.00O4 | 5.7843 | 9.297 | 311.06 | 1.941 | 2.239 | 2.033 | [14] * |
| 11 | a_KMF, S. Africa | [Mn0.88Mg0.11Fe0.01]Ʃ1.00(Mn)2O4 | 5.7556(6) | 9.4426(11) | 312.80 | 1.9272(5) | 2.2843(7) | 2.0367(8) | This study (SCXRD) |
| 12 | b_KMF, S. Africa | [Mn0.99Mg0.01](Mn1.52Fe0.48)O4 | 5.78144(1) | 9.38346(3) | 313.64 | 1.9364(3) | 2.2595(6) | 2.0438(5) | This study (HRPXRD) |
| 13 | Syn(Mn80B) | [Mn0.74Mg0.26]Ʃ1.00(Mn1.93Al0.07)Ʃ2.00O4 | 5.7482(5) | 9.3752(12) | 309.77 | 1.9283(7) | 2.2764(9) | 2.0223(9) | [10] |
| 14 | Syn (Mn100B) | [Mn0.82Mg0.18]Ʃ1.00(Mn)2O4 | 5.7550(3) | 9.4365(8) | 312.54 | 1.9283(7) | 2.2865(9) | 2.032(1) | [10] |
| 15 | Germany (5A) | [Mn0.74Zn0.26]Ʃ1.00(Mn)2O4 | 5.7524(4) | 9.4078(7) | 311.31 | 1.928(2) | 2.282(2) | 2.027(2) | [11] |
| 16 | Germany (3A) | [Mn0.84Mg0.01Zn0.15]Ʃ1.00(Mn)2O4 | 5.7535(7) | 9.4282(15) | 312.10 | 1.928(2) | 2.281(2) | 2.034(2) | [11] |
| 17 | Germany (4C) | [Mn0.83Mg0.03Zn0.14]Ʃ1.00(Mn)2O4 | 5.7548(2) | 9.4298(6) | 312.29 | 1.928(1) | 2.284(2) | 2.033(1) | [11] |
| 18 | Germany (4B) | [Mn0.83Mg0.03Zn0.15]Ʃ1.01(Mn)2O4 | 5.7554(2) | 9.4322(6) | 312.44 | 1.930(1) | 2.281(2) | 2.033(2) | [11] |
| 19 | Germany (2B) | [Mn0.89Mg0.02Zn0.10]Ʃ1.01(Mn)2O4 | 5.7584(3) | 9.4476(8) | 313.27 | 1.928(1) | 2.287(2) | 2.037(2) | [11] |
| 20 | Germany (2A) | [Mn0.90Mg0.03Zn0.07]Ʃ1.00(Mn)2O4 | 5.7591(4) | 9.4464(11) | 313.31 | 1.927(1) | 2.287(1) | 2.038(1) | [11] |
| 21 | Germany (8A) | [Mn0.98Zn0.02Al0.01]Ʃ1.01(Mn)2O4 | 5.7619(3) | 9.4532(6) | 313.84 | 1.929(1) | 2.285(1) | 2.040(1) | [11] |
| 22 | Germany (3B) | [Mn0.97Mg0.03Zn0.01]Ʃ1.01(Mn)2O4 | 5.7607(5) | 9.4601(12) | 313.94 | 1.928(1) | 2.287(2) | 2.041(2) | [11] |
| 23 | Germany (8B) | [Mn0.98Zn0.02]Ʃ1.00(Mn)2O4 | 5.7632(2) | 9.4547(6) | 314.03 | 1.930(1) | 2.286(1) | 2.040(1) | [11] |
| 24 | Germany (6A) | [Mn0.99Mg0.01]Ʃ1.00(Mn)2O4 | 5.7625(3) | 9.4611(7) | 314.17 | 1.929(1) | 2.290(1) | 2.040(1) | [11] |
| 25 | c_Syn | [Mn](Mn)2O4 | 5.76287(1) | 9.46891(1) | 314.47 | 1.9293(3) | 2.2876(5) | 2.0429(5) | This study (HRPXRD) |
‡ KMF = Kalahari manganese field (S. Africa). † These three datasets (5, 6, 7) were obtained with neutron diffraction at 10 K. * These same datasets (5, 6, 7) were incorrectly calculated and reported in the American Mineralogist Crystal Structure Database at 295 K and these correspond respectively to 8, 9, and 10. The bond distances from the neutron diffraction study were calculated in this study. The chemical formula for sample-b (= 12) from the Rietveld refinement is [Mn0.82Fe0.18](Mn1.88Fe0.12)O4. Sample-8 bond lengths are from Baron et al. [14].
Table 2.
Electron-probe microanalysis (EPMA) for hausmannite samples-a and -b compared to data from Bosi et al. [10].
Table 2.
Electron-probe microanalysis (EPMA) for hausmannite samples-a and -b compared to data from Bosi et al. [10].
| Oxide | a = 11 | b = 12 | Bosi et al. [10] † |
|---|---|---|---|
| MnO wt% | 27.27(9) | 30.66(8) | 25.68 |
| MgO | 2.02(6) | 0.15(5) | 3.20 |
| FeO | 0.29(9) | 0.00(8) | - |
| Mn2O3 | 69.02(9) | 52.37(8) | 69.70 |
| Fe2O3 | 0.08(1) | 16.55(1) | - |
| Al2O3 | 0.01(1) | 0.00(1) | - |
| Σ | 98.68 | 99.73 | 98.58 |
| Mn2+ apfu | 0.877 | 0.992 | 0.820 |
| Mg2+ | 0.114 | 0.009 | 0.180 |
| Fe2+ | 0.009 | 0.000 | - |
| ΣT | 1.000 | 1.001 | 1.000 |
| Mn3+ | 1.997 | 1.523 | 2.000 |
| Fe3+ | 0.003 | 0.476 | - |
| Al | 0.000 | 0.000 | - |
| ΣM | 2.000 | 1.999 | 2.000 |
Ideal hausmannite, Mn2+Mn3+2O4, has (wt%): 31.003 MnO and 68.997 Mn2O3, total = 100. a = [Mn0.88Mg0.11Fe0.01]Mn2.00O4 by EPMA vs. Mn2+Mn3+2O4 by refinement. b = [Mn0.99Mg0.01Fe0.00](Mn1.52Fe0.48)O4 by EPMA vs. [Mn0.82Fe0.18](Mn1.88Fe0.12)O4 by refinement. † [Mn0.82Mg0.18]Σ1.00Mn2.00O4 (#14 in Table 1).
Table 3.
Crystal structure refinement data for hausmannite sample-a (cif is given as a supplementary material).
Table 3.
Crystal structure refinement data for hausmannite sample-a (cif is given as a supplementary material).
| Miscellaneous | Sample-a |
|---|---|
| Empirical formula by refinement | Mn2+Mn3+2O4 |
| Formula weight | 228.82 |
| Temperature | 273(2) K |
| Wavelength | 0.71073 Å |
| Crystal system | Tetragonal |
| Space group | I41/amd |
| Unit-cell dimensions | a = b = 5.7556(6) Å |
| c = 9.4426(9) Å | |
| Volume, V | 312.80(7) Å3 |
| Z | 4 |
| Density (calculated) | 4.859 Mg/m3 |
| Absorption coefficient, μ | 11.752 mm−1 |
| Crystal size | 0.05 × 0.05 × 0.06 mm3 |
| Absorption, μR | 0.313 |
| F(000) | 428 |
| θ range for data collection | 4.15° to 60.63° |
| Index ranges | −14 <= h <= 14, −14 <= k <= 14, −23 <= l <= 23 |
| Reflections collected | 47,254 |
| Independent reflections | 669 [R(int) = 0.0842] |
| Completeness to θ = 60.63° | 99.6% |
| Refinement method | Full-matrix least-squares on F2 |
| Data/restraints/parameters | 669/0/16 |
| Goodness–Of-fit on F2 | 1.157 |
| Final R indices [I > 2σ (I)] | R1 = 0.0215, wR2 = 0.0538 |
| R indices (all data) | R1 = 0.0280, wR2 = 0.0564 |
| Extinction coefficient | 0.003(1) |
| Largest diff. peak and hole | 1.685 and −1.624 e/Å3 |
Table 4.
HRPXRD data and Rietveld refinement statistical indicators for hausmannite samples-b and -c.
Table 4.
HRPXRD data and Rietveld refinement statistical indicators for hausmannite samples-b and -c.
| Miscellaneous | Sample-b | Sample-c † |
|---|---|---|
| a (Å) | 5.78144(1) | 5.76287(1) |
| c (Å) | 9.38346(3) | 9.46891(1) |
| c/a | 1.62303 | 1.64309 |
| V (Å3) | 313.642(1) | 314.469(1) |
| Reduced χ2 | 3.744 | 3.504 |
| ‡R (F2) | 0.0368 | 0.0362 |
| wRp | 0.0957 | 0.0831 |
| Nobs | 319 | 409 |
| λ (Å) | 0.40071(2) | 0.41285(2) |
| Data points | 47600 | 47564 |
‡R (F2) = Overall R-structure factor based on observed and calculated structure amplitudes = [∑(Fo2 – Fc2)/∑(Fo2)]1/2. 2θ range = 4–44°. † Sample-c contains 96.8(2)% hausmannite and 3.2(2)% bixbyite (cubic with a = 9.41561(4) Å).
Table 5.
Atom coordinates and equivalent isotropic displacement parameters (Å2) for three hausmannite samples.
Table 5.
Atom coordinates and equivalent isotropic displacement parameters (Å2) for three hausmannite samples.
| site | sofs | x | y | z | Ueq.‡ | |
|---|---|---|---|---|---|---|
| sample-a | ||||||
| T2+ | 4a | 1.0008(2) Mn2+ | 0 | ¾ | ⅛ | 0.008(1) |
| M3+ | 8d | 1.0 Mn3+ | 0 | 0 | ½ | 0.007(1) |
| O | 16h | 1.0 | 0 | 0.4723(1) | 0.2587(1) | 0.008(1) |
| sample-b † | ||||||
| T2+ | 4a | 0.820(9) Mn + 0.180(9) Fe | 0 | ¾ | ⅛ | 0.0089(1) |
| M3+ | 8d | 0.940(5) Mn + 0.060(5) Fe | 0 | 0 | ½ | 0.0071(1) |
| O | 16h | 1.0 | 0 | 0.47233(9) | 0.25980(6) | 0.0074(2) |
| sample-c | ||||||
| T2+ | 4a | 1.0 Mn2+ | 0 | ¾ | ⅛ | 0.005(1) |
| M3+ | 8d | 1.0 Mn3+ | 0 | 0 | ½ | 0.004(1) |
| O | 16h | 1.0 | 0 | 0.47217(8) | 0.25900(5) | 0.006(2) |
‡U(eq) is defined as one third of the trace of the orthogonalized Uij tensor. The structure refinement formula is Mn2+Mn3+2O4 for samples-a and -c. † The structure refinement formula is [Mn2+0.82Fe2+0.18](Mn3+1.88Fe3+0.12)O4 for sample-b.
Table 6.
Anisotropic † displacement parameters (Å2) for three hausmannite samples.
| U11 | U22 | U33 | U23 | U13 | U12 | |
|---|---|---|---|---|---|---|
| sample-a | ||||||
| T2+ | 0.008(1) | 0.008(1) | 0.008(1) | 0 | 0 | 0 |
| M3+ | 0.006(1) | 0.006(1) | 0.009(1) | 0.000(1) | 0 | 0 |
| O | 0.008(1) | 0.007(1) | 0.010(1) | 0.001(1) | 0 | 0 |
| sample-b | ||||||
| T2+ | 0.0079(1) | 0.0079(1) | 0.0108(2) | 0 | 0 | 0 |
| M3+ | 0.0065(1) | 0.0050(1) | 0.0097(1) | 0 | 0 | 0.0007(1) |
| O | 0.0052(3) | 0.0066(3) | 0.0103(3) | 0 | 0 | −0.0017(3) |
| sample-c | ||||||
| T2+ | 0.0053(1) | 0.0053(1) | 0.0049(1) | 0 | 0 | 0 |
| M3+ | 0.0033(1) | 0.0030(1) | 0.0058(1) | 0 | 0 | 0.0004(1) |
| O | 0.0053(2) | 0.0047(3) | 0.0076(2) | 0 | 0 | 0.0006(2) |
† The anisotropic displacement factor exponent takes the form: −2 π2[h2(a*)2U11 + … + 2 h k a* b* U12].
Table 7.
Selected distances (Å) and angles (°) for three hausmannite samples.
| a = 11 | b = 12 | c = 25 | ||
|---|---|---|---|---|
| T–O | ×4 | 2.0367(8) | 2.0438(5) | 2.0429(5) |
| †M–O | ×4 | 1.9272(5) | 1.9364(3) | 1.9293(3) |
| M–O | ×2 | 2.2843(7) | 2.2595(6) | 2.2876(5) |
| Δ(M–O) | 0.3571(9) | 0.3231(7) | 0.3583(6) | |
| <M–O> | [6] | 2.0462(2) | 2.0441(2) | 2.0487(2) |
| M–M | 2.8778(3) | 2.8907(1) | 2.88144(1) | |
| O–M–O | ×2 | 83.19(3) | 83.18(2) | 83.153(20) |
| O–M–O | ×2 | 96.81(3) | 96.82(2) | 96.847(20) |
| O–M–O | ×2 | 180.0 | 180.0 | 180.0 |
| O–T–O | ×2 | 103.40(4) | 103.53(3) | 103.21(3) |
| O–T–O | ×4 | 112.59(2) | 112.52(2) | 112.69(1) |
| <O–T–O> | [6] | 109.53(1) | 109.52(1) | 109.53(1) |
†M = Mn3+ octahedral site that contains Jahn–Teller elongation, Δ(M–O), that is largest in sample-c. T = Mn2+ tetrahedral site.
Table 8.
Bond-valence sums (BVS; vu) † for hausmannite sample-a.
| M | T | Ʃ | |
|---|---|---|---|
| O | 0.637 × 4 | 0.513 × 4 | 2.029 ‡ |
| O | 0.242 × 2 | ||
| Ʃ | 3.032 | 2.053 |
‡ 2.029 = [(0.637 × 2) + 0.513 + 0.242]; M = Mn3+; T = Mn2+. † BVS were calculated with the program “VaList” [49]. BVS were not calculated for the samples-b and -c because the bond distances are similar to those in sample-a.
© 2019 by the authors. Licensee MDPI, Basel, Switzerland. This article is an open access article distributed under the terms and conditions of the Creative Commons Attribution (CC BY) license (http://creativecommons.org/licenses/by/4.0/).
Share and Cite
MDPI and ACS Style
Antao, S.M.; Cruickshank, L.A.; Hazrah, K.S. Structural Trends and Solid-Solutions Based on the Crystal Chemistry of Two Hausmannite (Mn3O4) Samples from the Kalahari Manganese Field. Minerals 2019, 9, 343. https://doi.org/10.3390/min9060343
AMA Style
Antao SM, Cruickshank LA, Hazrah KS. Structural Trends and Solid-Solutions Based on the Crystal Chemistry of Two Hausmannite (Mn3O4) Samples from the Kalahari Manganese Field. Minerals. 2019; 9(6):343. https://doi.org/10.3390/min9060343
Chicago/Turabian StyleAntao, Sytle M., Laura A. Cruickshank, and Kaveer S. Hazrah. 2019. "Structural Trends and Solid-Solutions Based on the Crystal Chemistry of Two Hausmannite (Mn3O4) Samples from the Kalahari Manganese Field" Minerals 9, no. 6: 343. https://doi.org/10.3390/min9060343
Note that from the first issue of 2016, this journal uses article numbers instead of page numbers. See further details here.