2. History of Electronic Lenses in Human Vision Care
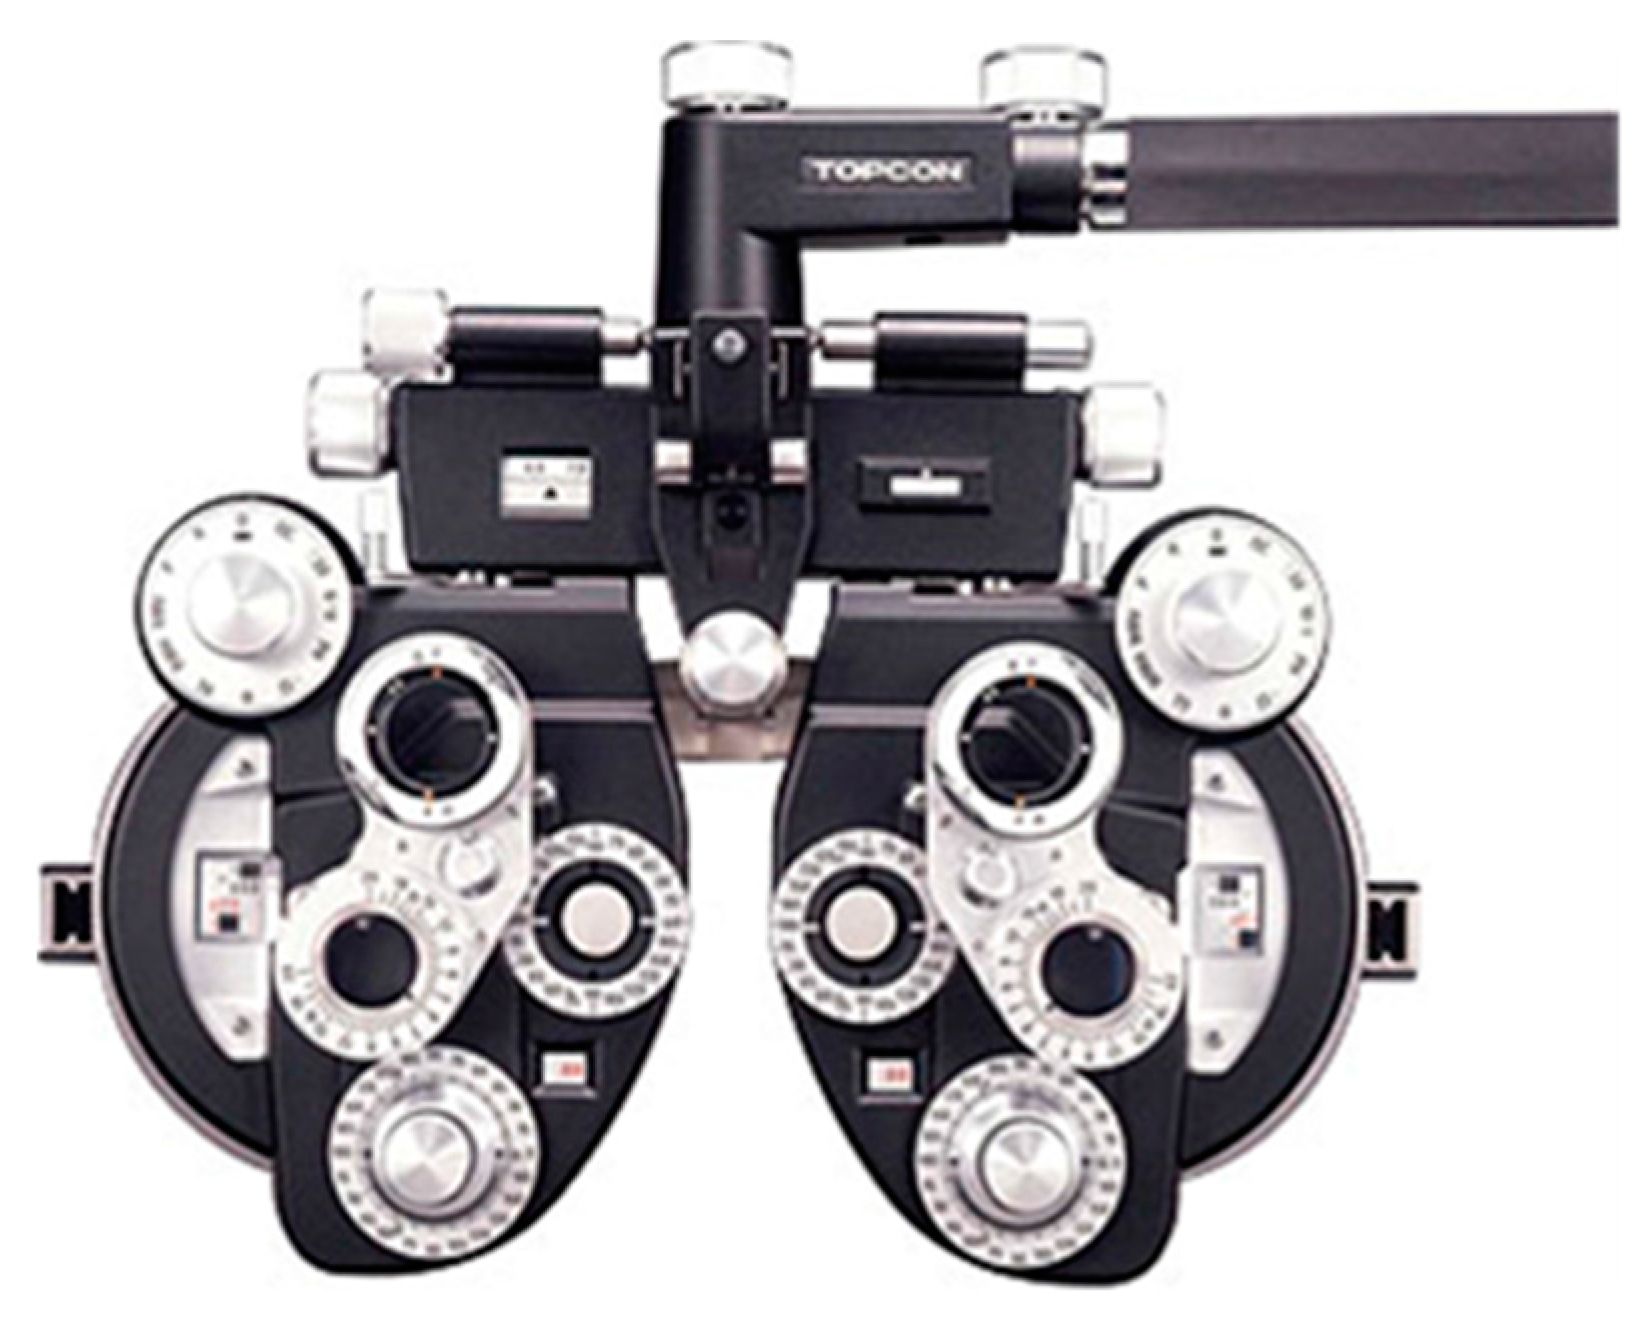
As aforementioned, eye vision correction measurement is traditionally done using bulky opto-mechanical systems called phoropters [
6,
7] that commonly have large moving parts and minimal handheld portability (see
Figure 1). It would be highly desirable to have a vision (for prescription) test instrument that has minimal large moving parts and uses compact low power consumption optical and electronic devices. Although the design of liquid variable focus lenses has been around since the early 1940s, such as via the 1942 U.S. Patent by Flint [
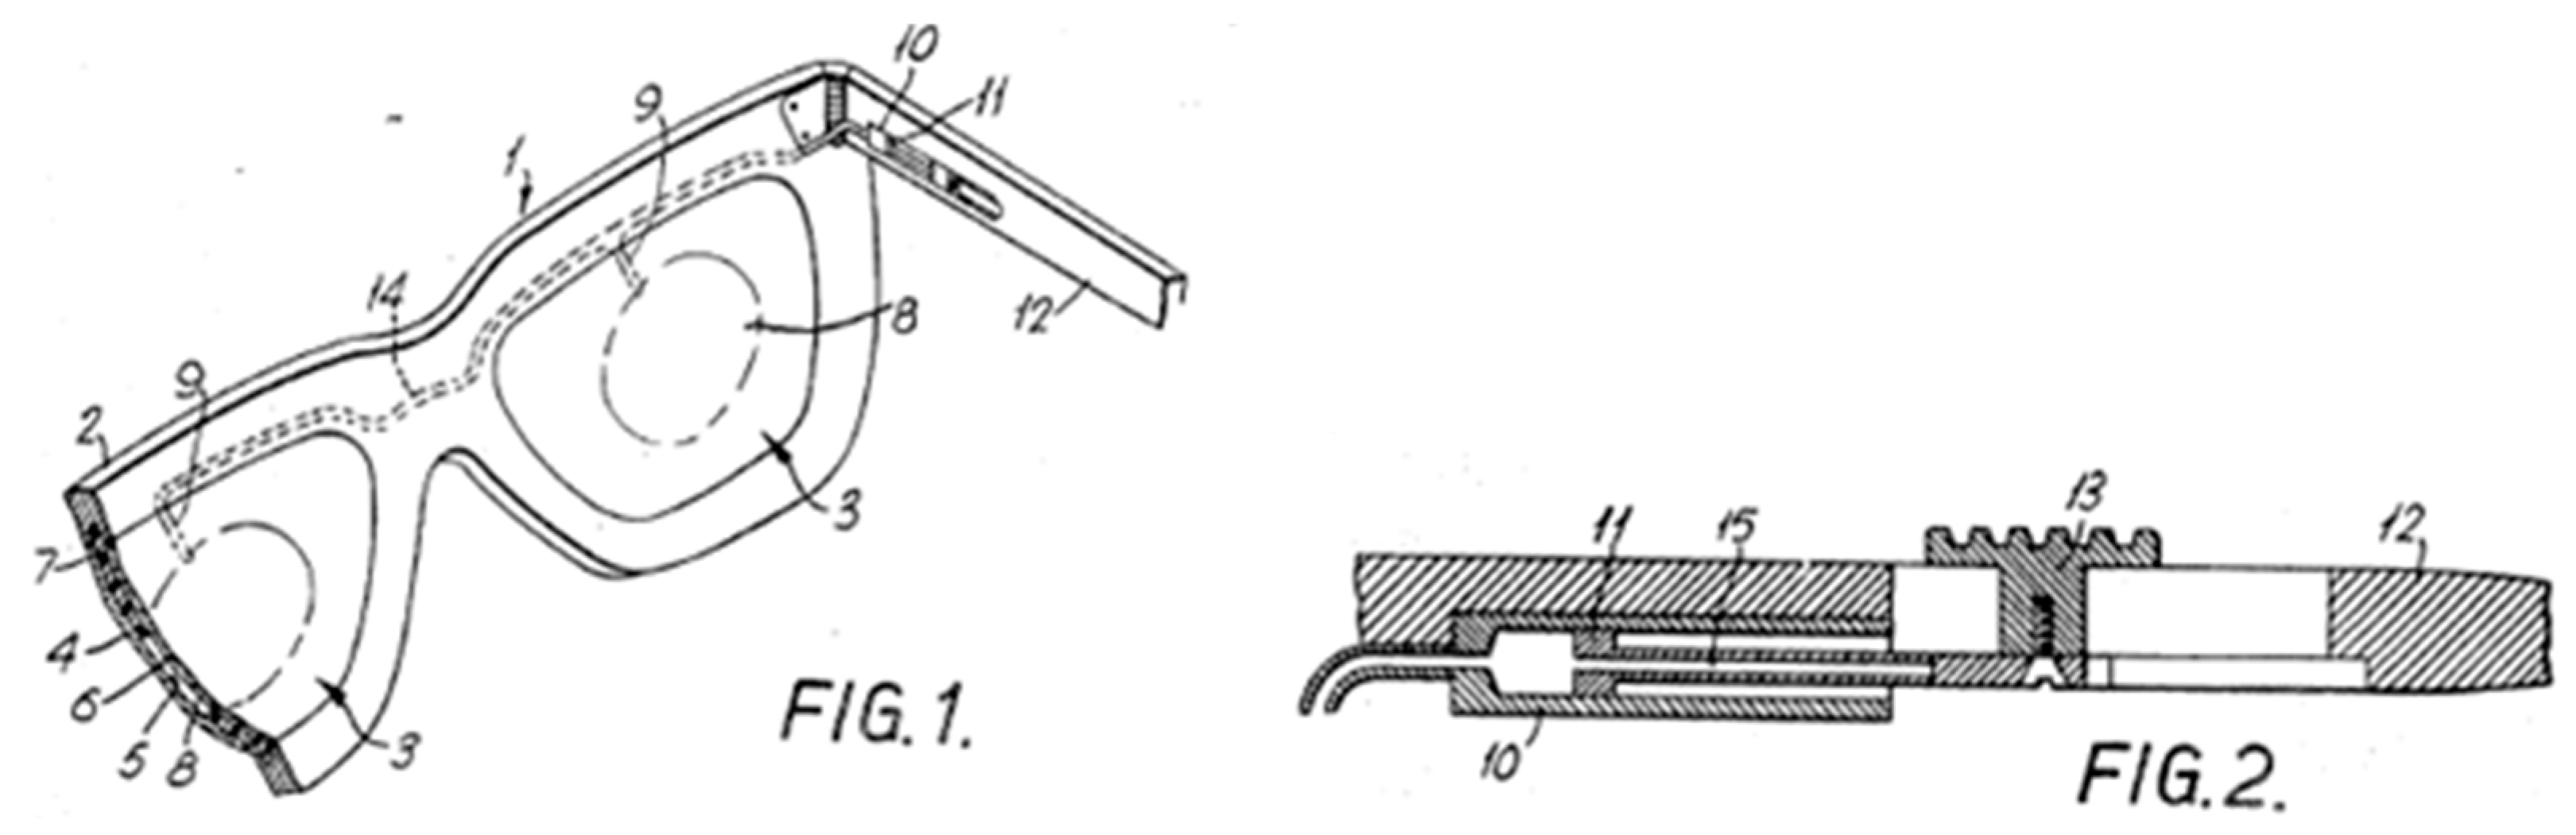
8], the desire to use mechanically programmable optical lens devices to replace spectacles for everyday use has been around since the 1960s. For example, Basil M. Wright (see
Figure 2) was awarded a 1968 patent proposing the use of mechanically controlled liquid variable focus lenses for spectacle eyewear [
9,
10]. In 1979, Sato of Japan [
11] proposed the use of electrically programmable optical lens devices, now called Electronic lenses or E-lenses based on Liquid Crystals (LCs) to form electrically controlled varifocal spectacles worn by people who need both distance and reading glasses. In 1980, Dwight W. Berreman was issued a patent for an LC E-lens design suitable for use in eyeglasses [
12]. Sato also proposed the use of LC E-Lens for auto-focus cameras, but Sato, Berreman and Wright did not propose E-lenses for eye refractive power vision tests and measurements. In 1981, LC-based lenses in spectacles were also proposed to control the light transmission passing to the eyes to control image brightness [
13].
Figure 1.
Example of a typical commercial phoropter system commonly used today to measure eye refractive errors to determine human eyewear prescriptions [
7].
Figure 1.
Example of a typical commercial phoropter system commonly used today to measure eye refractive errors to determine human eyewear prescriptions [
7].
Figure 2.
Basic design of the 1968 Basil M. Wright proposed for a mechanically controlled variable focal length spectacles based on liquid movement [
10].
Figure 2.
Basic design of the 1968 Basil M. Wright proposed for a mechanically controlled variable focal length spectacles based on liquid movement [
10].
Since the 1960s, the Radio Corporation of America (RCA) and later the parent company General Electric (GE), pioneered the use of LCs for designing optical displays such as in watches, avionics, and television systems, and also for designing optical switches [
14,
15,
16]. Starting in the mid-1980s, the LC Display (LCD) lab at the General Electric Corporate Research and Development Center (GE-CRD) fabricated novel electronically controlled LC lens devices [
17], including for eye correction measurement applications [
18,
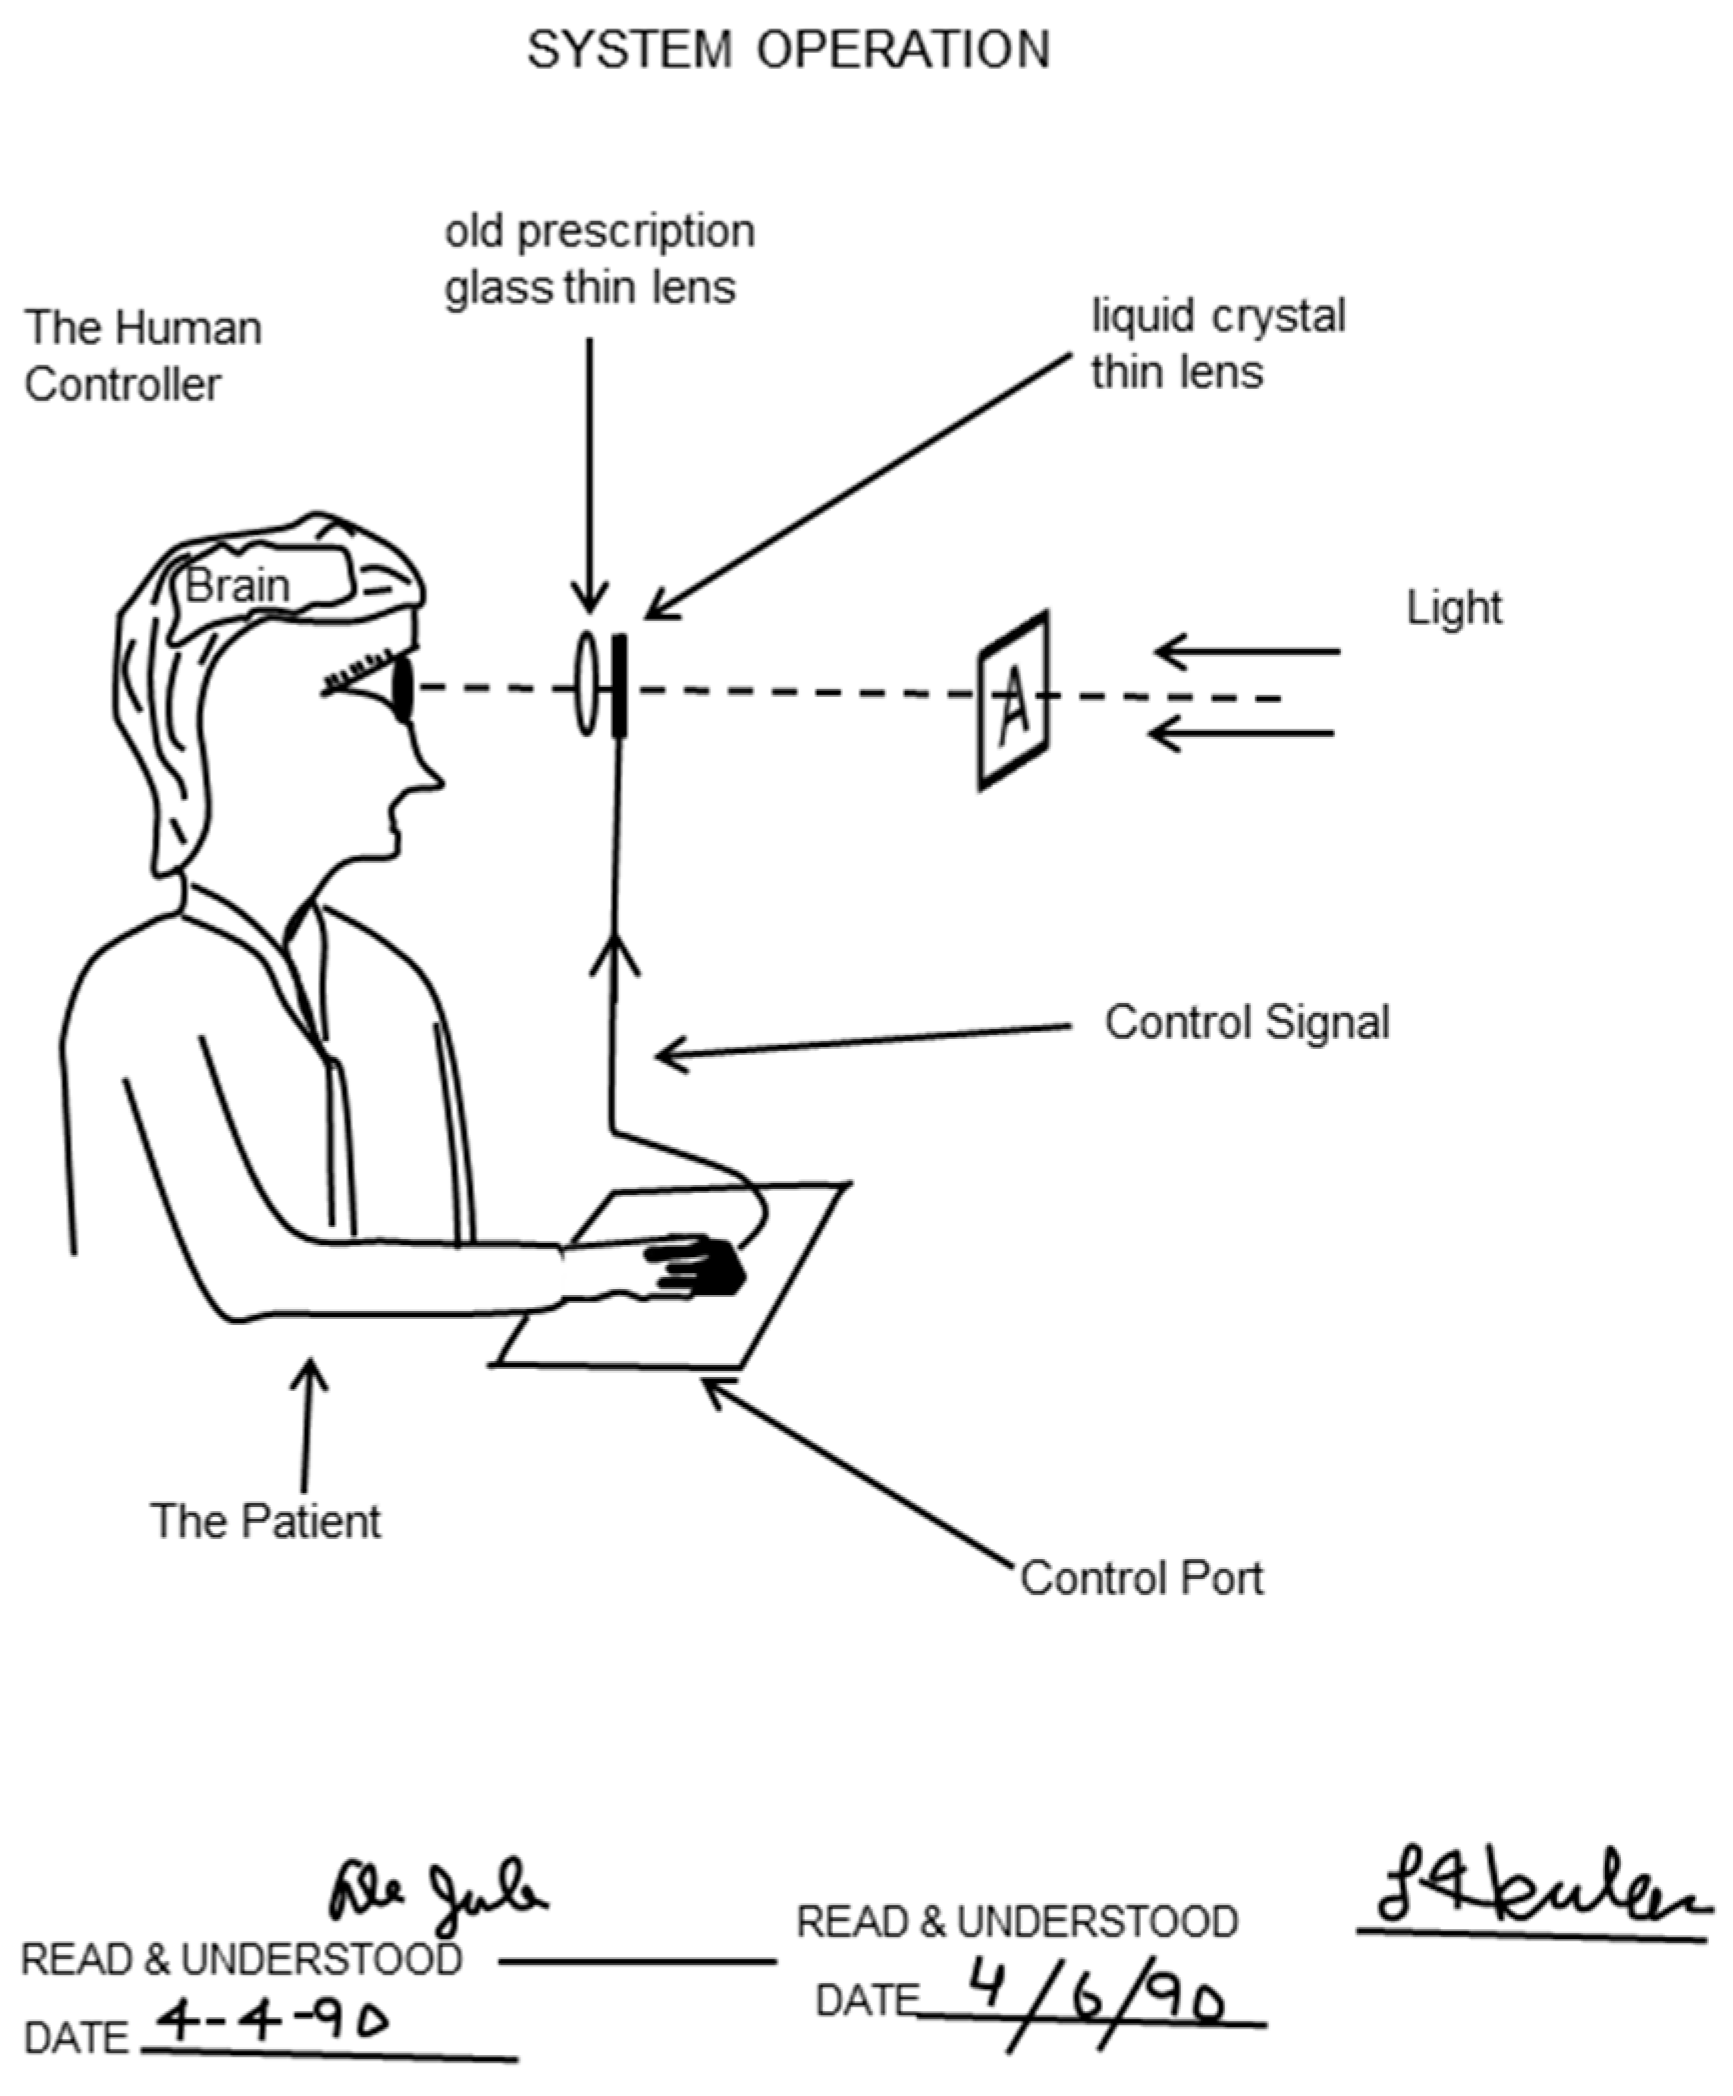
19]. Specifically, to the best of our knowledge, Riza, in 1989, first proposed the use of the LC E-Lens for eye exams (see
Figure 3) to measure refractive power change [
18].
In addition, apart from using an electronic LC lens in a phoropter to get new eyewear refractive readings [
18], two dimensional (2-D) optical Spatial Light Modulator (SLM) devices via LC and micromachined or Micro-electromechanical Systems (MEMS) devices plus bias lenses have been proposed in 1995 by Riza, not only for eye refractive power measurements (both positive and negative Diopters), but also for color blindness tests as well as to provide the capability to perform eye strain relief and eye muscle exercises [
20,
21]. Because 2-D SLMs are optically phase programmable devices, astigmatic refractive error measurement in the human eye was proposed in these SLM-based eye vision test systems. In addition, Riza proposed the use of switching to different optical paths in the eye vision system to measure eye refractive power [
20,
21]. In 1998, Riza introduced the design of a fast response digital LC E-lens for numerous 3-D beamforming applications including vision [
22,
23,
24].
Figure 3.
Basic design of the 1989 Nabeel A. Riza proposed E-lens based human eye vision test system. Adapted from [
18].
Figure 3.
Basic design of the 1989 Nabeel A. Riza proposed E-lens based human eye vision test system. Adapted from [
18].
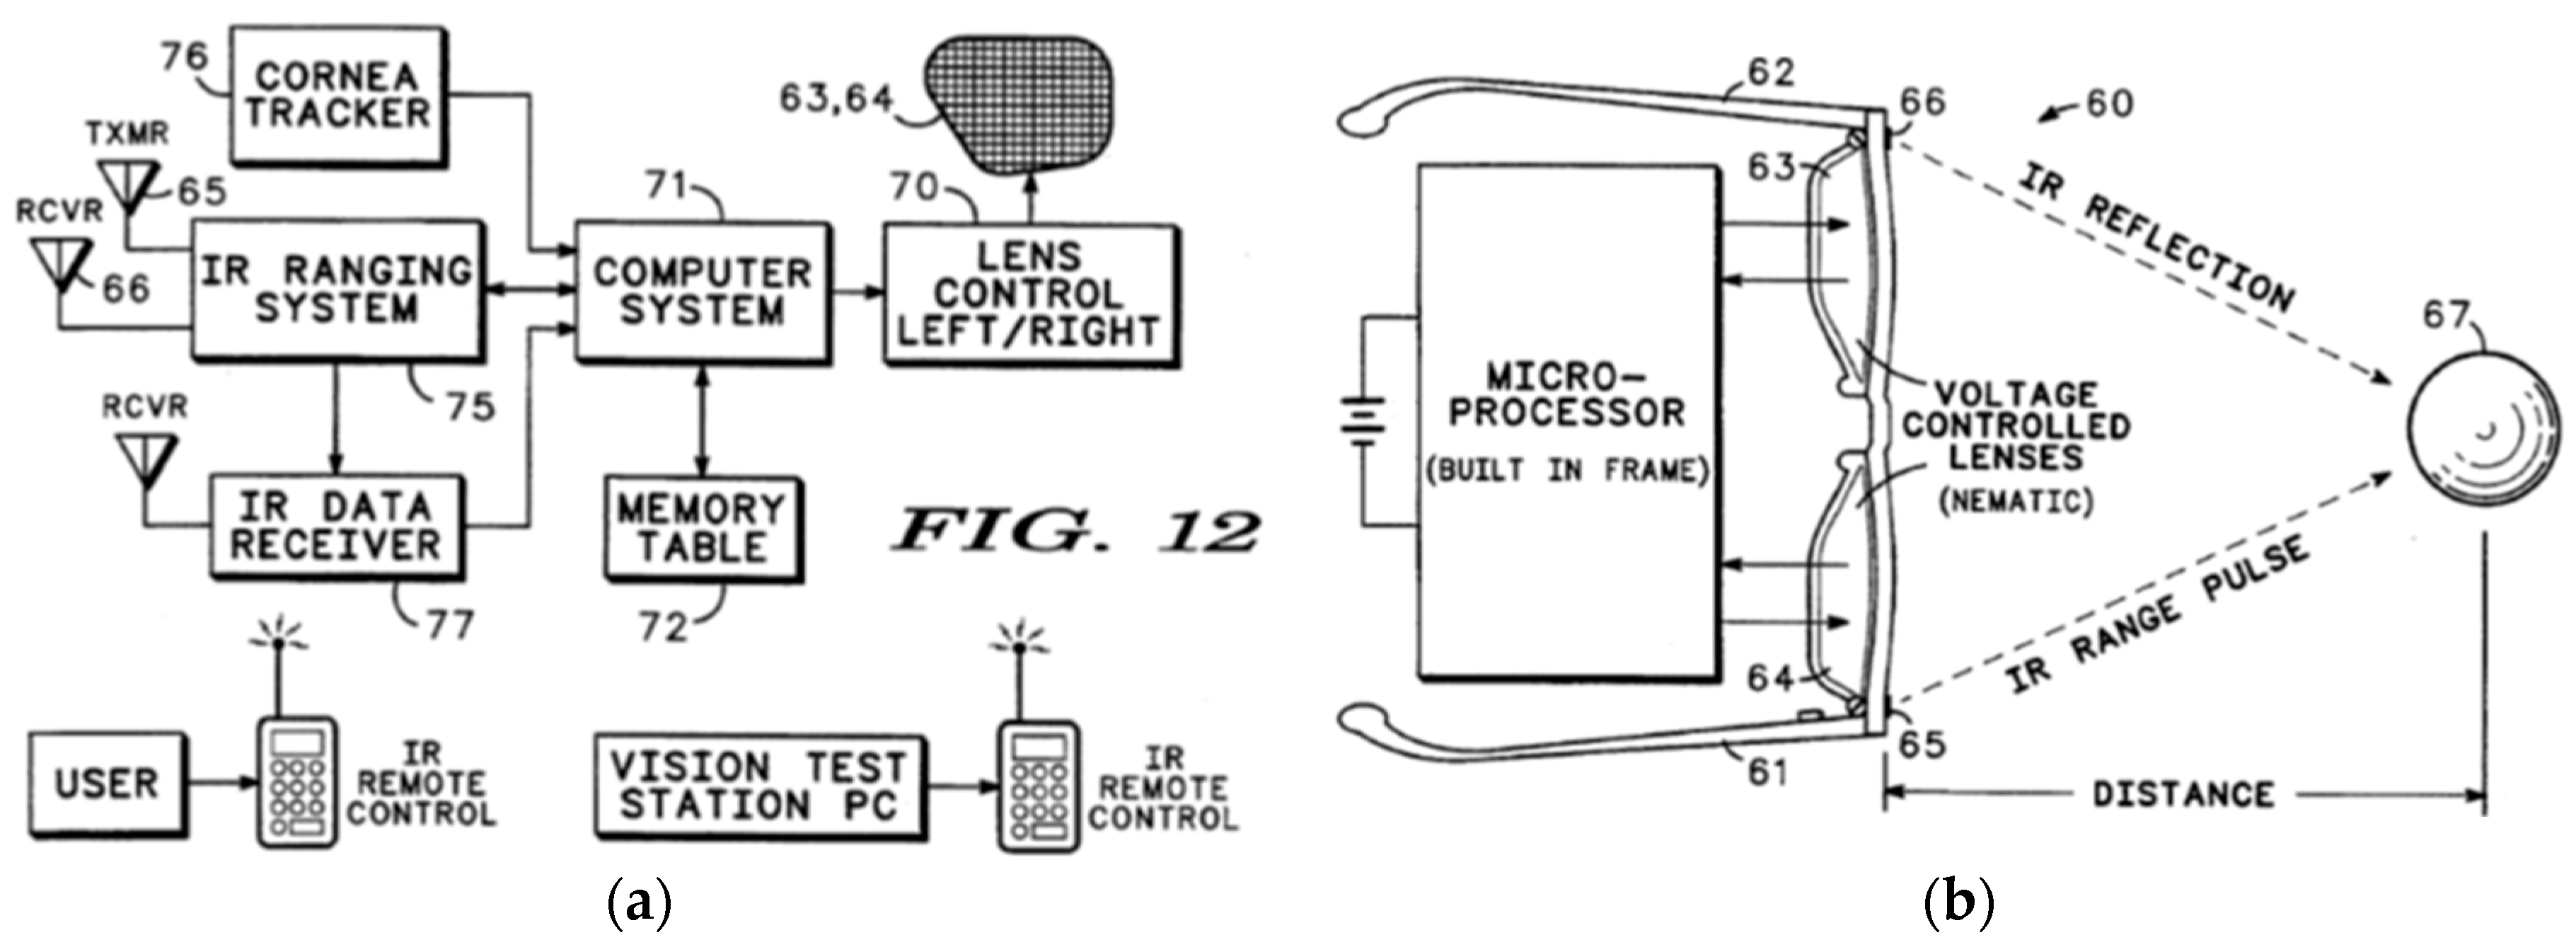
Independent use of the LC E-Lens for eye exams to measure refractive power change was patented in 1994 (see
Figure 4) by Piosenka and Leahy [
25] and licensed by E-Vision (same as Pixel-Optics). Interestingly, the same basic idea was patented by E-Vision in 2003 by Blum and Dustin [
26]. The use of liquid-based lenses using mechanical pressure to change lens focal length has also been proposed for phoropters in a patent by Quaglia in 1995 [
27] and later in 2010 by the group of Peyghambarian [
28]. In 1996, an LC diffractive-optic E-Lens had been designed [
29] and in 2006, the Peyghambarian group suggested the use of the LC diffractive-optic E-Lens for eye exams to measure eye refractive power change [
30]. In 2003, a team from Lawrence Livermore National Lab demonstrated an adaptive optics phoropter where a Shack-Hartmann sensor was used to measure the aberrations of the eye and an LC SLM was used to compensate these eye aberrations [
31].
More recently, works have been conducted to improve both LC and liquid device design and performance in phoropter systems. Large 20 mm diameter E-lenses have been designed with LC and electromagnetic force controlled liquid materials with 3 Diopters and ±25 Diopters powers, respectively [
32]. A double-layered LC E-lens has been designed that has polarizer-free operations [
33]. In addition, aberrations in an astigmatic liquid E-lens have been compensated using a Shack-Hartmann adaptive optics system [
34]. These recent E-lens device technologies and adaptive optic system advances can be incorporated in the proposed eye vision system using micromachines to enable user scenario-dependent optimal performance.
Figure 4.
Basic design of the 1994 U.S. Patent by Gerald V. Piosenka and Peter J. Leahy that proposed E-lens spectacles based human eye vision test system [
25].
Figure 4.
Basic design of the 1994 U.S. Patent by Gerald V. Piosenka and Peter J. Leahy that proposed E-lens spectacles based human eye vision test system [
25].
3. Proposed Eye Vision System using Micromachines
Today micromachine-based microelectronic, micromechanic, and micro-optic device technologies have evolved to a very high degree, providing energy efficient, compact and lightweight sub-systems. In particular, Radio Frequency (RF) wireless control is commonplace for many handheld systems and highly reliable liquid-based Electronically Controlled Variable Focus Lens (ECVFL) (also called an E-lens) micro-optic devices have entered the commercial arena, for purposes such as using electro-wetting technology and electromagnetic actuation of elastic polymer membranes [
35,
36]. In addition, MEMS devices including optical MEMS devices have reached commercial maturity, including applications in fiber-optical Internet and inertial guidance applications [
37]. Hence, what is proposed next is a basic design of a human eye vision test system that combines the use of advanced micro-optic, micromechanic, and microelectronic technologies to deliver a portable, lightweight system that can measure eye refractive powers, conduct color-blindness tests, and also implement eye strain relief and eye muscle exercises via time sequenced imaging.
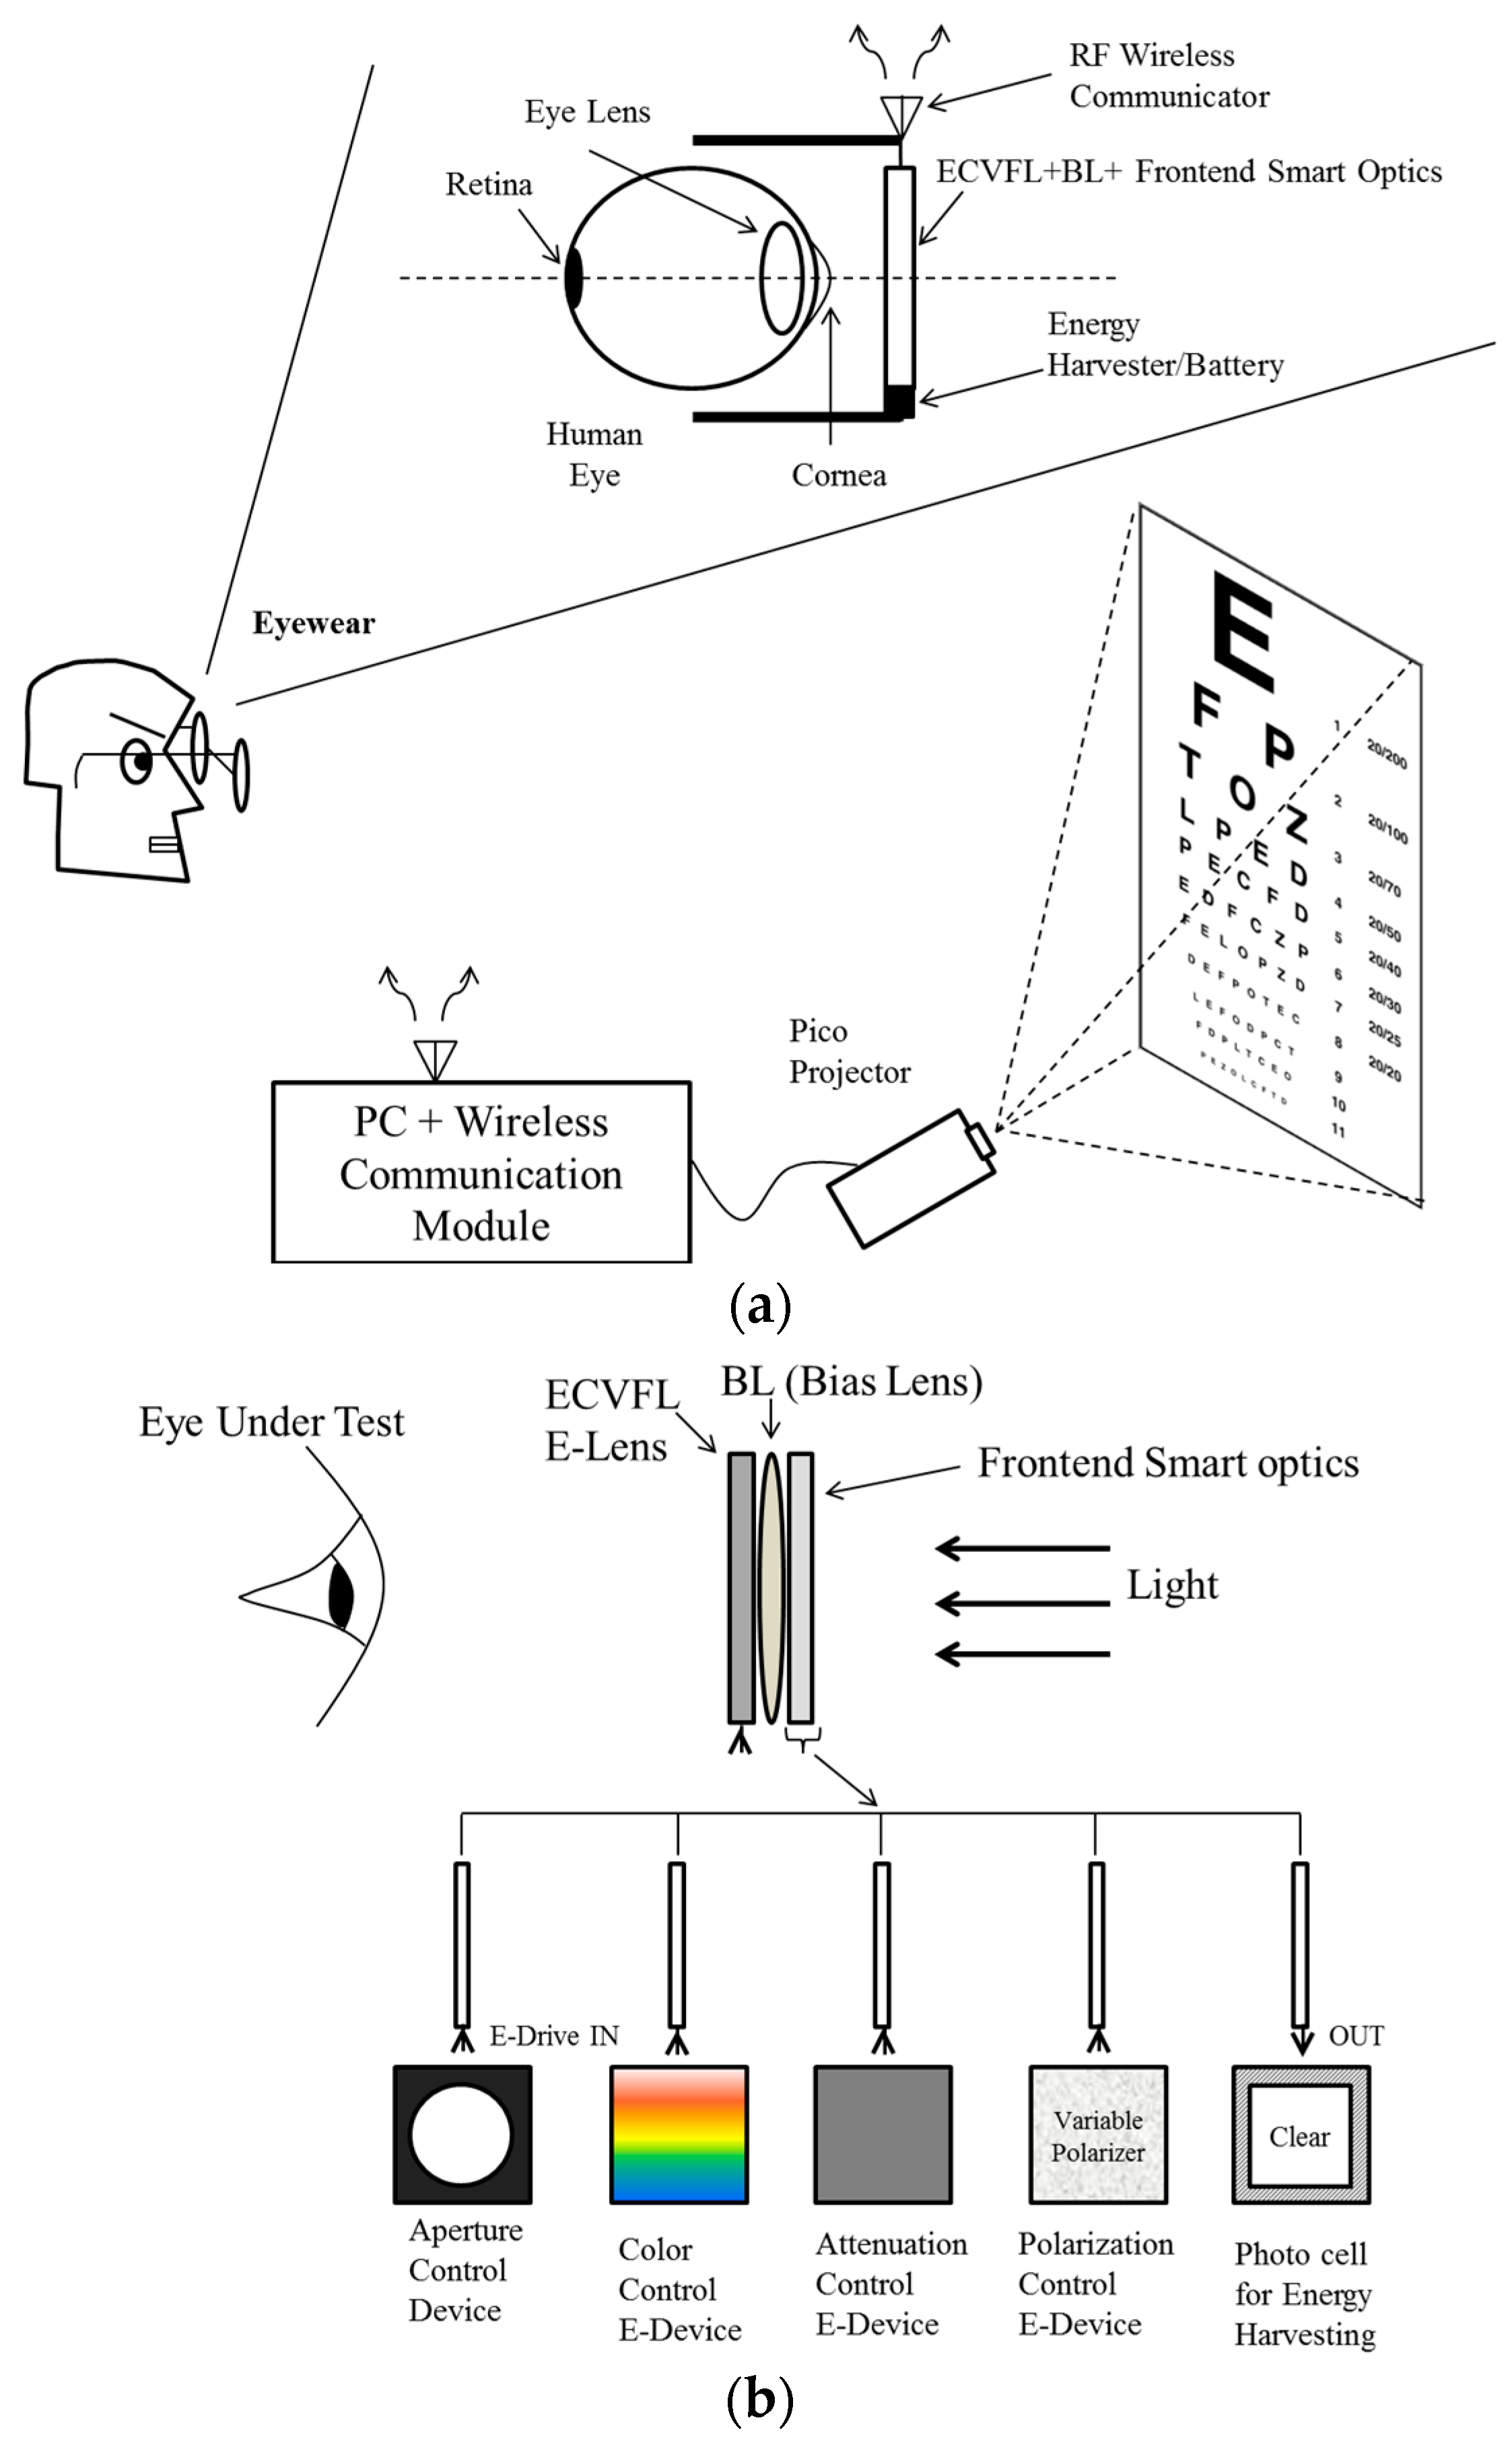
Shown in
Figure 5a is the basic design of the proposed eye vision test system using micromachines. The test system eyewear per eye includes an ECVFL (E-lens), a bias lens (BL), and novel frontend smart optics module. The dioptric power of the BL depends on the refractive power performance of the E-lens, as well as the refractive power testing range desired for the eye test system. The smart optics module shown in
Figure 5b can include an aperture control device, color control device, optical throughput/attenuation control device, polarization control device, and energy-harvesting device. The use or physical deployment of these smart devices depends on the level of eye test features required for the test system scenario. The smart optical devices can be stackable, ultra-thin, electrically controlled optical cells that are fabricated using a variety of LC materials (e.g., polymer dispersed LCs to form the attenuation control device), ultra-thin glass substrates, and thin polarization optics. Multiple functionalities for light control can be within a single ultra-thin device. These devices can also be fabricated using other technologies such as liquids, silicon MEMS, and liquid MEMS. When electronically controlled for desired best vision, e.g., 20/20 setting, the described test eyewear combines with the eye’s internal refractive optic (Eye Lens and Cornea) to project a clear image on the retina while optimizing operations of all devices in the light path from test scene on screen to the eye retina. RF/optical wireless communication between the test eyewear and the Personal Computer (PC) controls the smart optics, as well as the ECVFL focal length settings. The eyewear is also equipped with energy harvesting and storage devices to enable wireless remote energy transfer to power components such as the ECVFL.
Figure 5.
(a) Basic design of the proposed novel eye vision test system using micro-optics, micromechanics, and microelectronics. The system frontend encompasses the smart optics for light conditioning in the context of the specific properties of the human eye being tested. The test system eyewear includes devices that enable wireless communication and control links, energy harvesting, energy storage, and remote energy delivery. BL: bias lens. PC: personal computer. (b) Novel frontend smart optics design which includes an aperture control device, color control device, optical throughput/attenuation control device, polarization control device, and energy harvesting device.
Modern ECVFLs come in different sizes with specific power requirements and are based on different technologies including electrowetting [
35], LCs [
24,
30], deformable mirror membrane [
38], and others. For example, Optotune’s EL-6-18 device [
36] utilizes optical fluids and a polymer membrane to achieve variable focus action in less than 2 ms with a power consumption ranging between 0 to 350 mW depending on driver current, which is governed by desired focal length requirements. For the proposed system using this particular Optotune ECVFL model, ECVFL operational power needs to be supplied from micro-electronic components mounted on the proposed eyewear. One option to provide this power is via a micro-sized battery, possibly via a rechargeable photocell. The photocell can be designed to be sensitive to a particular wavelength band depending on the lighting environment for the vision test system. Various wireless power transfer techniques are gaining popularity and can serve as a viable option. Magnetic coupling technology [
39,
40,
41] is able to wirelessly transfer up to 60 W over a 2 m range, though the size of the receiver would need to be customized for the proposed eyewear application with its low power requirements. Solar cells for energy harvesting applications as well as micro-sized rechargeable batteries [
42,
43,
44] can prove to be a relatively inexpensive option in the long run. Once power is supplied, communication via a wireless link needs to be established to convey information necessary for the programmable micro-optics. This communication link can either be RF Wi-Fi or via recently proposed optical energy efficient wireless indoor links [
45,
46,
47] with an appropriate interface to the programmable optics. In addition, the wireless optical link can also naturally be used for remote energy transfer such as via the spatially controlled light from the eye safe LED or laser source. In summary, for a complete functioning system, the various components on the proposed eyewear and their interconnections need to be designed and optimized to keep the overall dimensions of the eyewear to a minimum weight and size while delivering the required performance for the eye vision system.
The Pico Projector, which can use a micro MEMS chip (e.g., TI Digital Light Processing chip), a micro LC chip (e.g., Liquid Crystal on Silicon (LCoS)), or a laser scanner, displays the examination content on a screen. One can envision mounting a micro sized projector as part of the eyewear. The projector is connected to the PC, which communicates with the eyewear optics via wireless communication. Depending on eye examination requirements and prior patient information, the projected display can either be static images/text, video, or a hybrid data set to initiate appropriate patient response. Depending on patient feedback, the smart optics are adjusted via PC control according to pre-set instructions. The visual data sets are synchronized with both smart optics control and patient feedback such that the test system automatically converges to the eye’s inherent refractive error accurately, enabling allocation of correct subscription eyeglasses. This means the proposed system does not necessarily need technically trained opticians to oversee eyesight diagnosis. Note that the PC can be replaced by modern-day handheld devices such as smartphones or tablets. Decreasing price of wireless technology and its wider availability means that this simple to use system is likely suitable for deployment in medical centers and shops for self-testing. The ease and speed of use to provide vision test measurements will enhance usage with children, a key motivation for the proposed
Figure 5 system.
The
Figure 5 eye test system can operate in three different modes to measure the needed eye refractive power and to achieve non-blurred clear vision of the test target. The first mode is the classical refractive error measurement method similar to a mechanical phoropter where except for mechanically changing fixed power lenses in the eye vision path, an E-lens without macro-mechanical motion creates lenses of different powers at the eye spectacle positions to determine when the patient feels that he/she has seen the best non-blurred image of the test target such as a 20/20 vision standard when seeing line 8 in the chart.
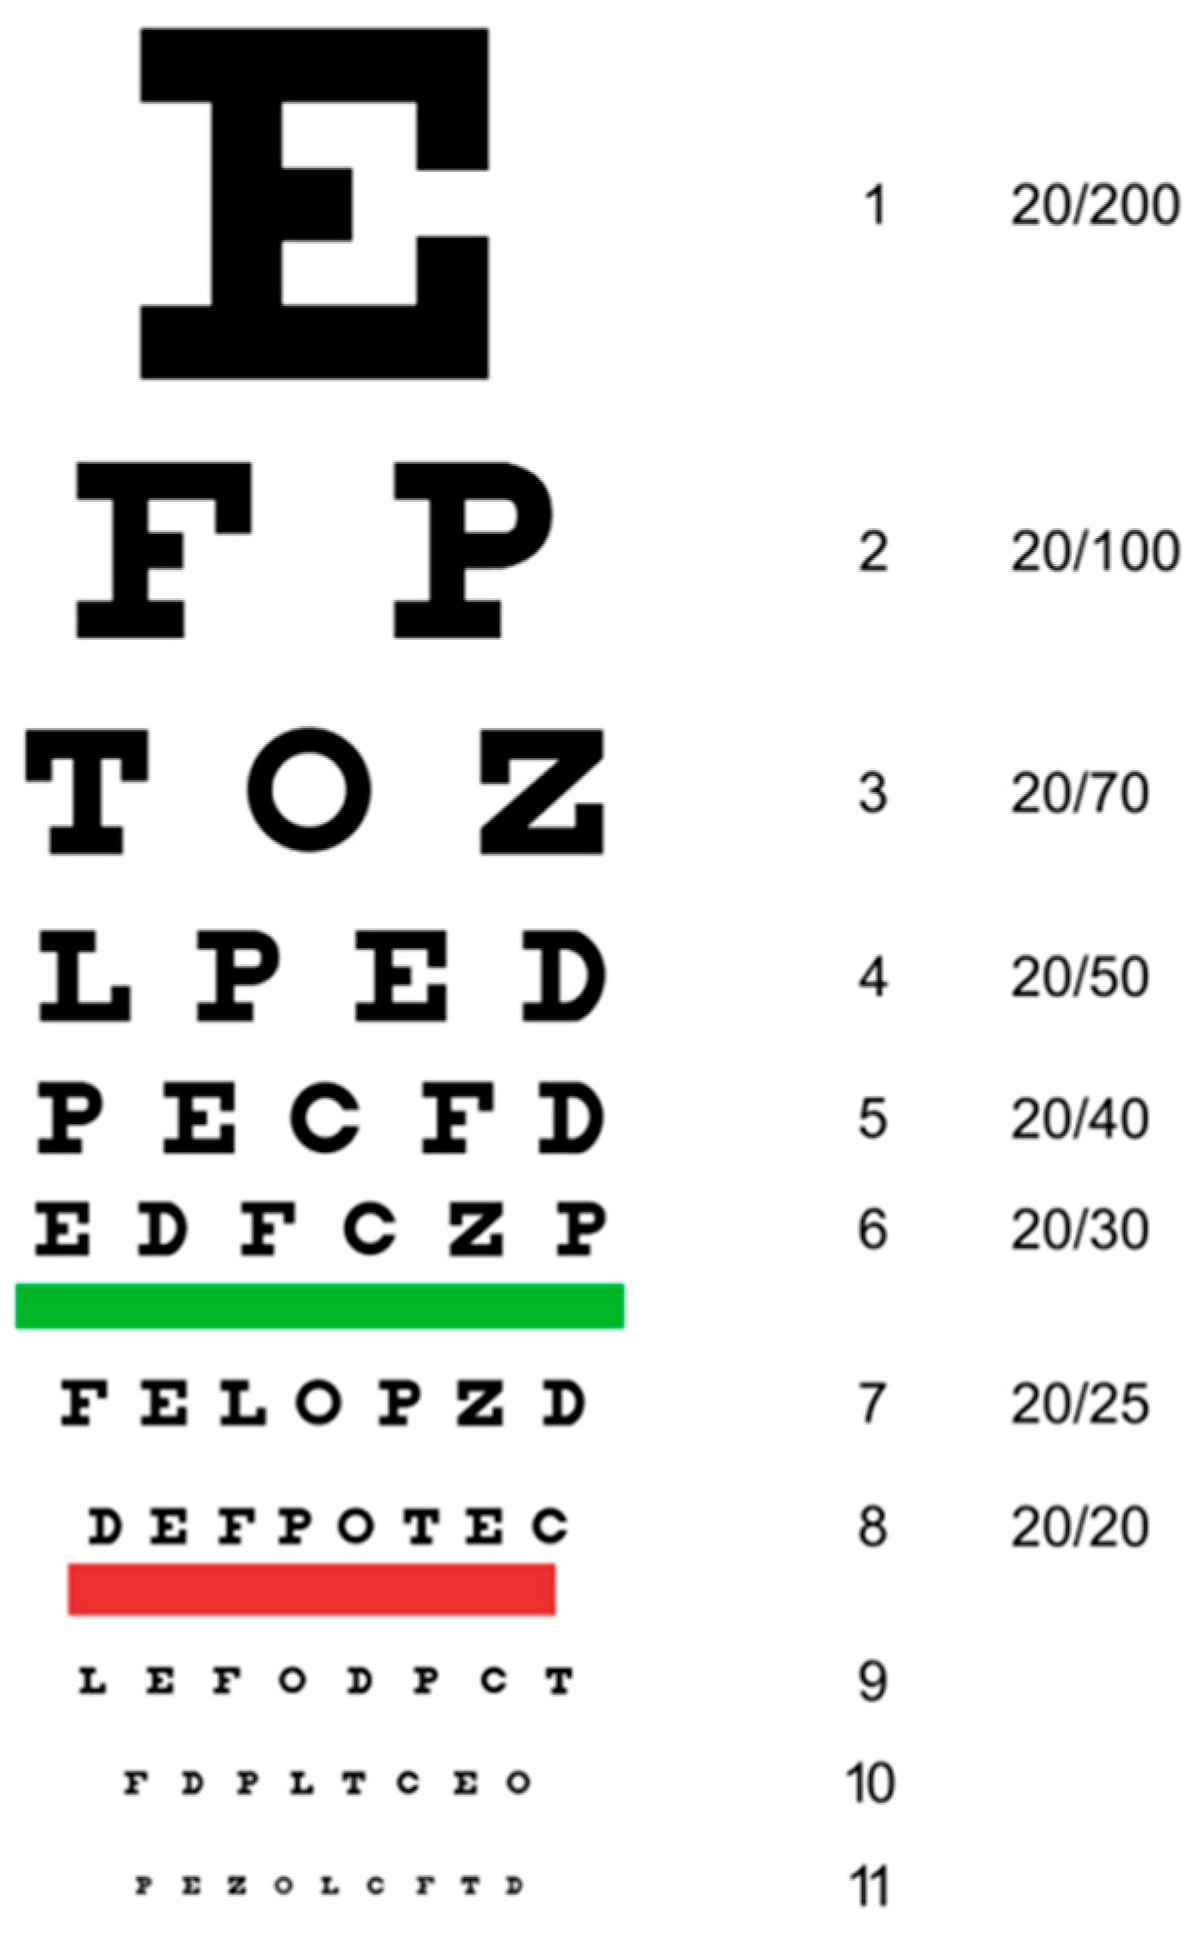
Figure 6 shows a typical standard eye vision Snellen chart [
48] that is used today in phoropter systems where this eye chart is viewed by a patient from a distance of 20 ft (or 10 ft when using a mirror in the vision path). Based on the smallest text on a line that the patient is able to read, a quantification of the patient’s near sightedness is determined for both the patient’s uncorrected eye and the E-lens refraction corrected eye. The E-lens is driven by an electrical control signal (e.g., current) that is calibrated to spherical lens power values. Thus by noting the current of the E-lens that gives the best non-blurred vision to the patient, the patient’s corrective lens prescription is determined directly in Diopters (D) with a standard 0.25 D step size. Here it is assumed that apertures of devices used are much larger than the natural aperture of the open pupil in the eye so that the pupil functions as the limiting aperture for the eye test vision system.
Figure 6.
A standard eye Snellen vision test chart used today in phoropter systems, which quantifies the eye near sighted refractive power levels based on the text line the patient is able to read as a non-blurred clear image.
Figure 6.
A standard eye Snellen vision test chart used today in phoropter systems, which quantifies the eye near sighted refractive power levels based on the text line the patient is able to read as a non-blurred clear image.
The second mode of operation proposed for the
Figure 5 eye vision test system is based on controlled optical aperture control. In this mode, the E-lens and BL are removed from the system, leaving only the aperture-controlled device in the smart frontend optics. In effect, an extremely simple and cost effective eye vision system is formed that relies on the operation of a single micromechanical aperture device.
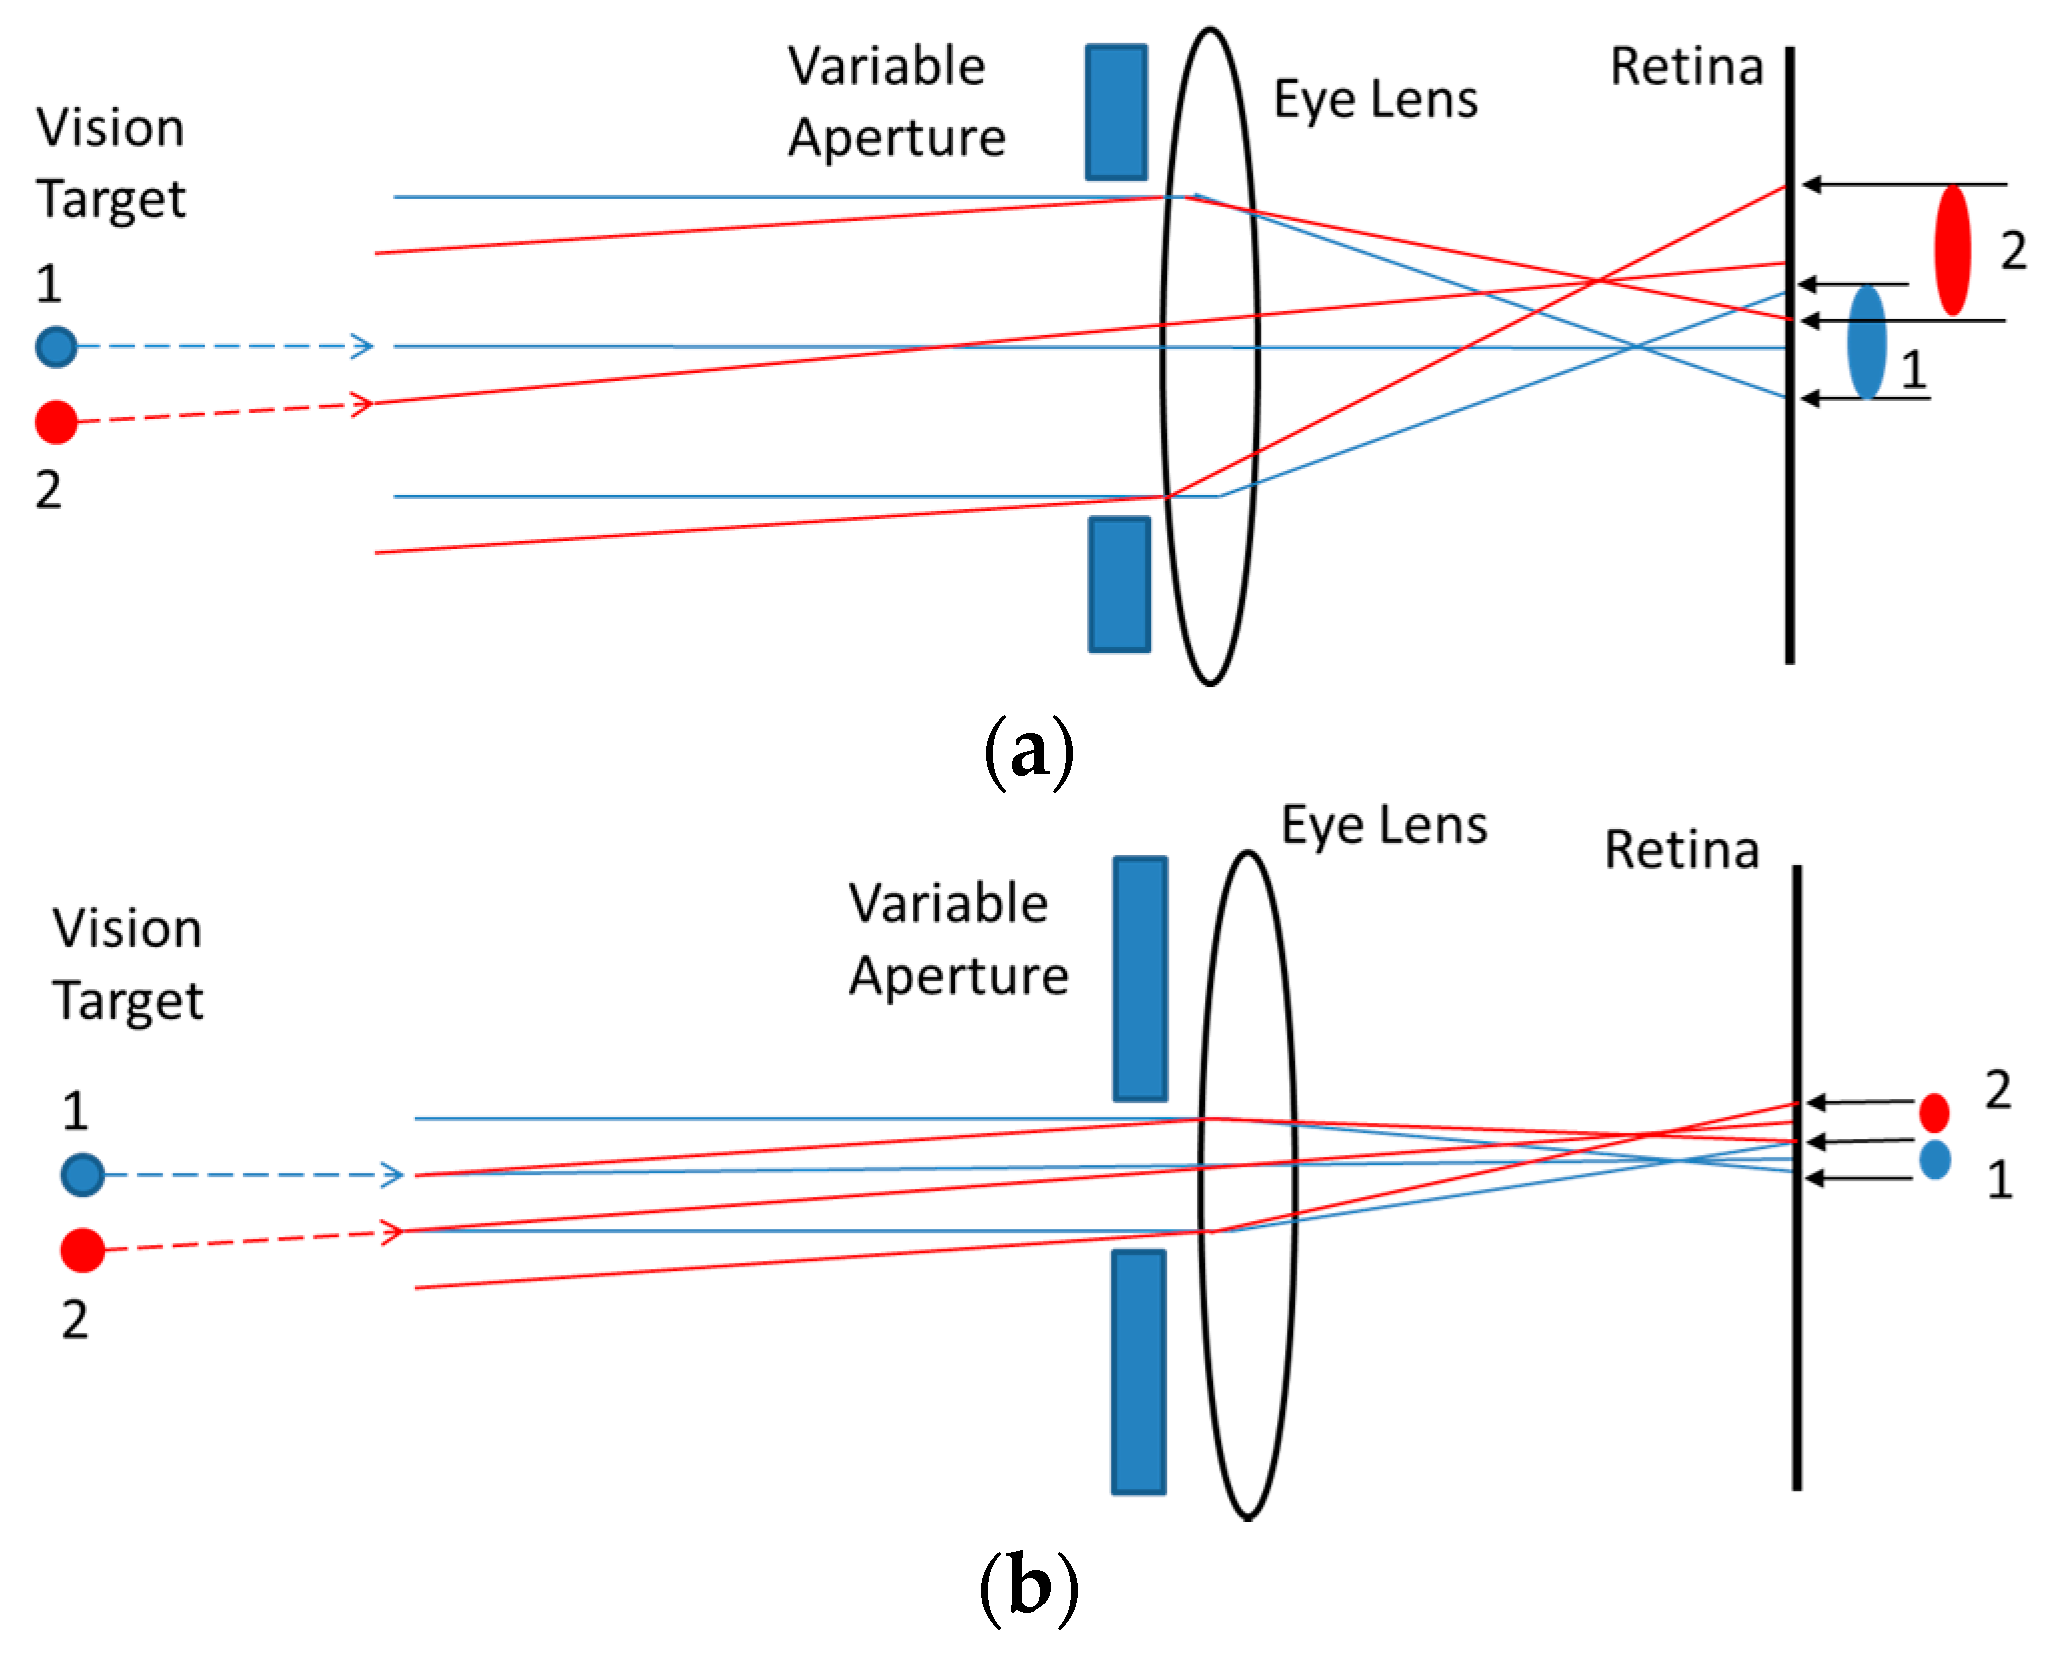
Figure 7 shows the basic principle of aperture-controlled myopic eye vision testing explained using a variable aperture in front of the eye, and imaging of two points labeled as point 1 and point 2 in the far-field test target. As shown in
Figure 7a, as the eye is myopic with a certain given myopic refractive power, light rays from points 1 and 2 focus along a slightly curved contour that is before the retina (shown as a flat screen). Thus, one larger spot is formed at the retina location as these two imaged spots partly overlap in space. In effect, the two spatially separated spots in the viewed test image appear as one blurred large spot; hence the patient under eye test is unable to see a clear focused image on his/her eye retina of two spatially independent spots. In
Figure 7b, the aperture in front of the eye is made smaller to the extent that now the two spots appearing at the retina are smaller in size and appear separated from each other on the retina, thus creating an image of points 1 and 2 in the viewed test image that is now seen and considered a non-blurred image. In effect, the simple act of squeezing the optical aperture size at the entrance of the eye creates the ability for a myopic eye to see (or focus on) objects that otherwise would appear too small to see with clear vision. This simple act has been naturally known to human eyes for perhaps thousands of years and often people squint their eyes when trying to focus on small distant objects. In the
Figure 5 proposed eye vision system, the power of aperture-controlled clearer vision is harnessed using a micromachine electronically controlled variable aperture device that is calibrated to provide equivalent corrective dioptric powers for a near-sighted eye. For a human eye to clearly view a test letter in a black and white eye chart, the eye should be able to resolve two black dots with a white dot in between the two black dots. For example, the letter “U” can be considered made up of two parallel black vertical lines separated by a white space. Points 1 and 2 in
Figure 7 can be considered representing the vertical black line widths in the letter “U” while the white gap (dot) between points 1 and 2 in the target space can be considered as an additional invisible/white dot in a line of three dots in the target space. To see the letter “U”, the retina should be able to spatially resolve all three dots (two black ones and one white one between the two black dots).
Figure 7.
Principle of aperture-controlled eye vision testing explained via geometrical optics, a myopic eye, a variable aperture in front of the eye and imaging of two points in the test target. (
a) Aperture is large so points 1 and 2 create physically inseparable optical spots on the retina; (
b) Aperture is smaller so points 1 and 2 create physically separable and smaller optical spots on the retina enabling clear vision of the two points test target. Note that these spots are not of the smallest size that would be observed by the retina if the eye lens did not have myopia (see
Figure 8).
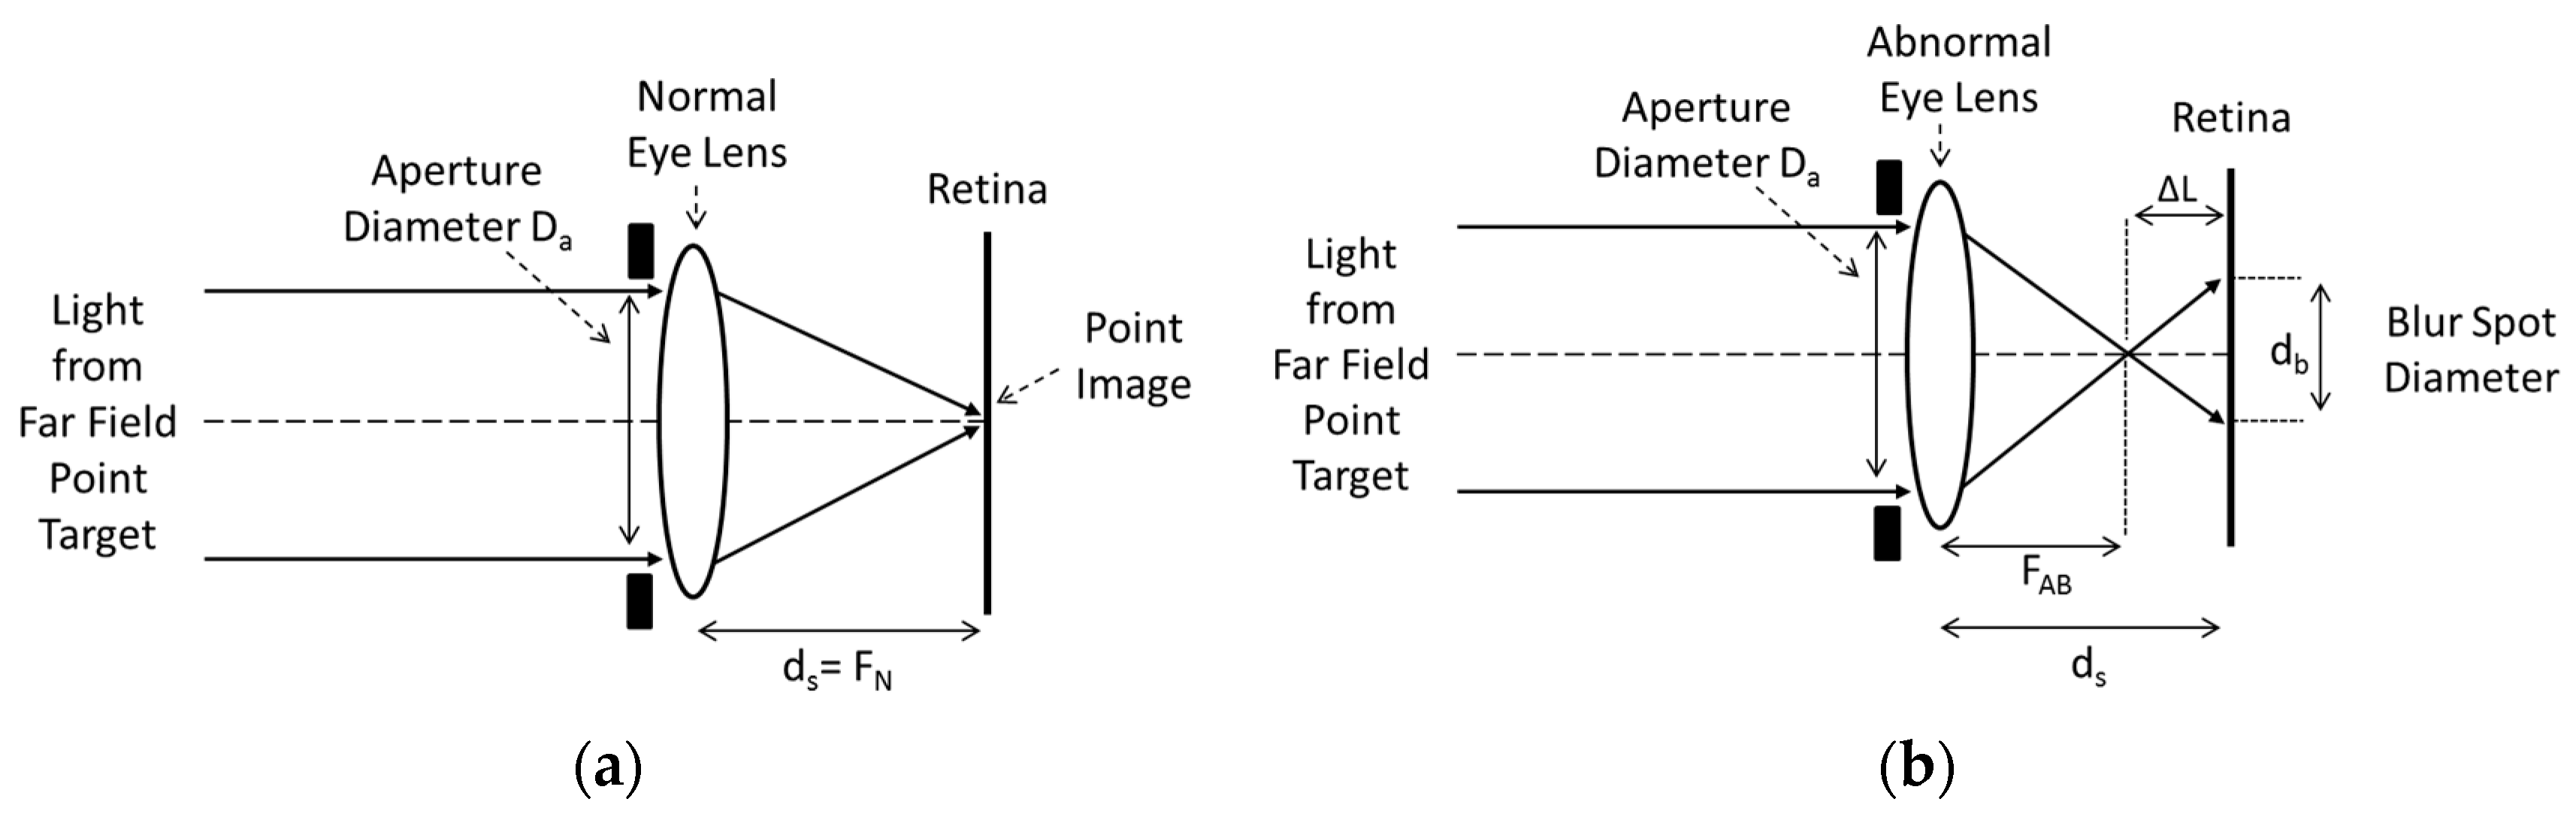
Because human eyes have certain limiting characteristics designed by biology, such as retinal cell resolution and eye cavity length between eye lens and retina, there are limits to how powerful an approach can be in dioptric numbers for eye vision testing using aperture control. A basic analysis to determine this limit can be conducted as follows [
1,
2]. A normal eye lens of focal length
FN focuses a far field object onto a point image on the retina giving the highest detectable spatial resolution for the observed image. This is shown in
Figure 8a where the aperture diameter is
Da and the distance between the lens and the retina is
ds. It can be seen for
Figure 8a that:
If the normal eye lens is replaced by an abnormal (
i.e., myopic) eye lens of focal length
FAB, where
FAB <
FN, the far field object focuses as a point located at a distance Δ
L from the retina as shown in
Figure 8b. As a result, a blur spot of diameter
db forms on the retina. From
Figure 8b, it can be seen that:
Since
ds =
FN, Equation (2) is written as:
Using geometry,
db,
ΔL,
FAB and
Da are related by:
Equation (4) is rearranged to give:
Figure 8.
(a) Optical ray diagrams for an eye lens system having a normal eye lens and (b) optical ray diagrams for an eye lens system having an abnormal eye lens.
Figure 8.
(a) Optical ray diagrams for an eye lens system having a normal eye lens and (b) optical ray diagrams for an eye lens system having an abnormal eye lens.
The expression for
ΔL from Equation (3) is substituted in Equation (4), giving:
Let the optical power in Diopters (1/m) of a normal lens be
DN = 1/
FN and let the optical power of an abnormal lens be
DAB = 1/
FAB. Therefore, Equation (6) can be expressed in terms of dioptric powers as:
Equation (7) relates the aperture diameter
Da with the optical powers of both the normal and abnormal eyes. The next step is to find an expression for
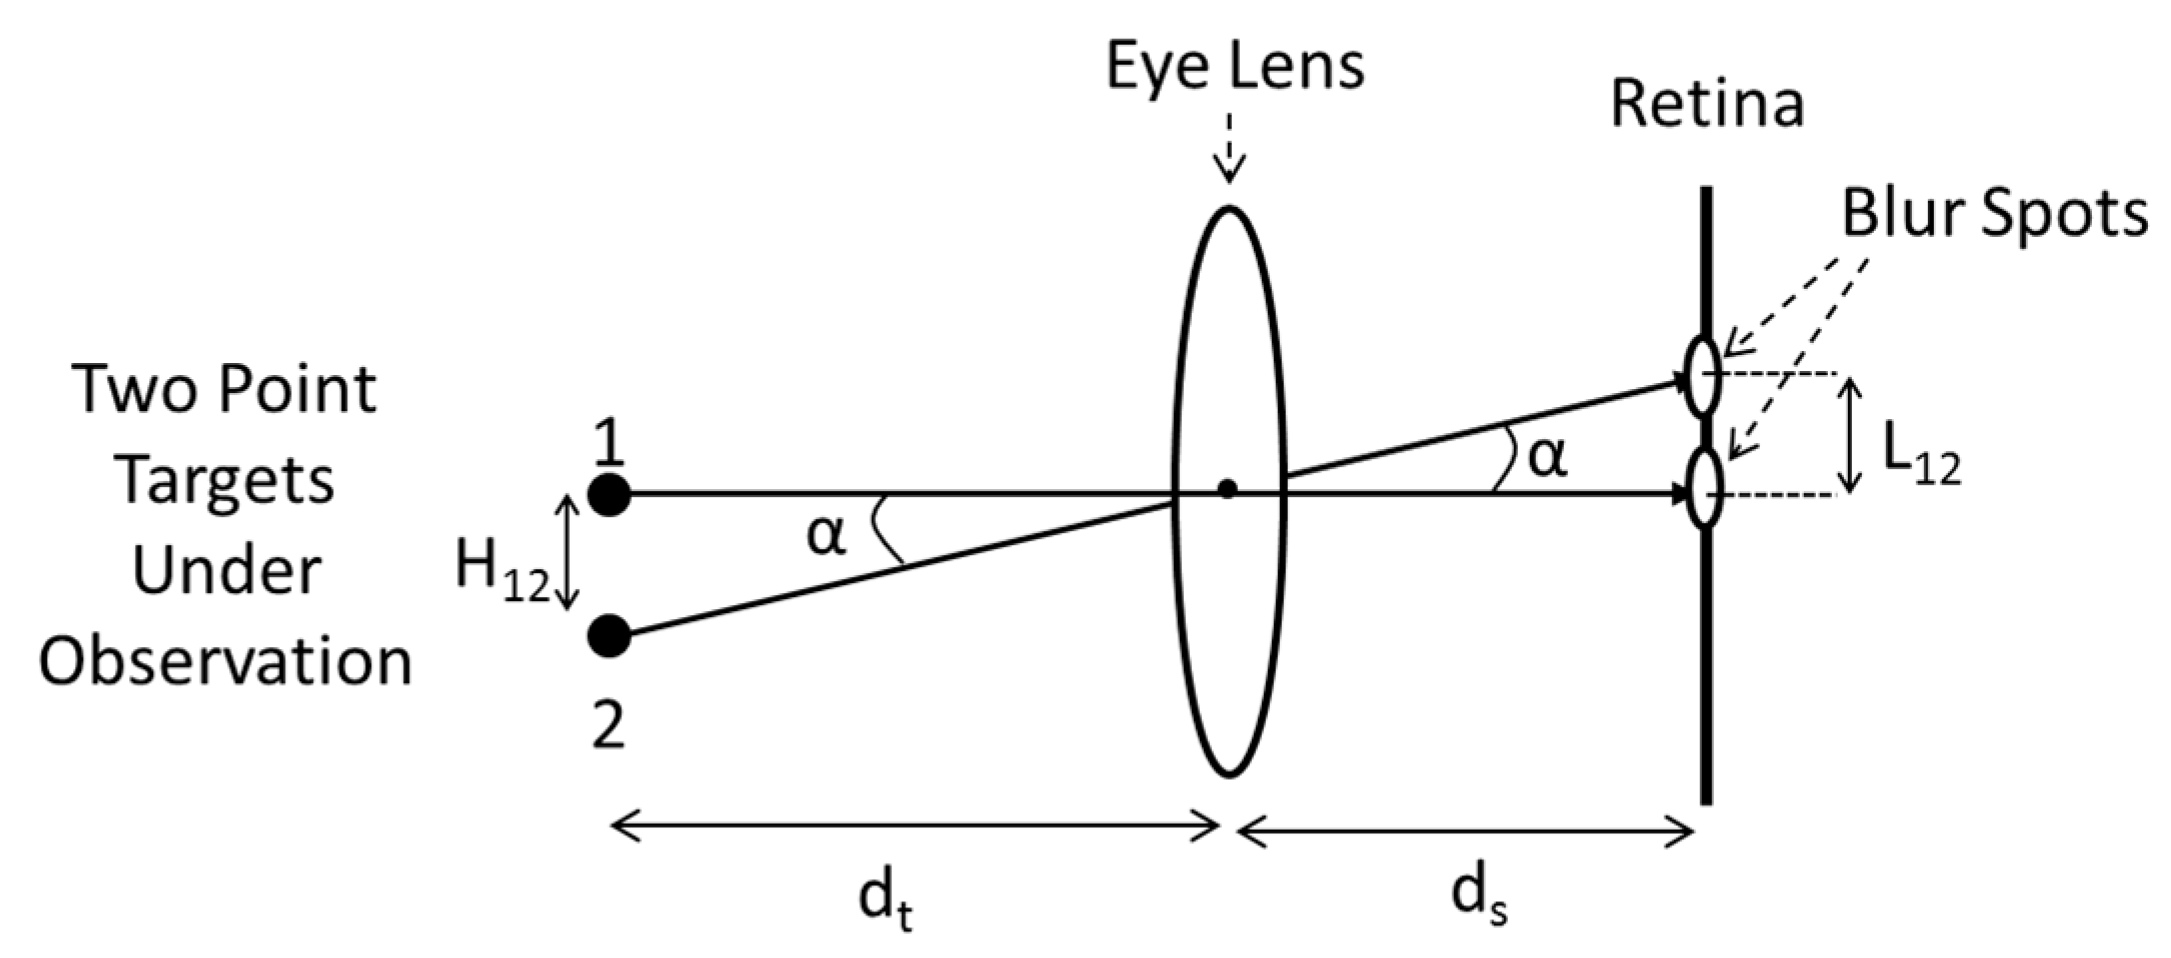
db. To do this, refer to
Figure 9 which shows two point objects, separated by
H12, being imaged by an eye lens located a distance
dt from the objects, and forming their respective image blur spots on the retina. A ray from each object point passes through the center of the eye lens before striking the retina. The angle between the two rays (one from each object point as shown in
Figure 9 is α, and the distance between the centers of the two blur spots formed on the retina is
L12. The diameter of each blur spot is
db. From trigonometry, α is written as:
Also from trigonometry,
L12 can be written as:
Since
ds =
FN from Equation (1), Equation (9) can be written as:
In
Figure 9, in order for the retina to be able to resolve the two object points 1 and 2,
db must be less than or equal to
L12. That is:
Combining Equations (7) and (12) gives:
Figure 9.
Optical ray diagram of a single lens system showing rays from two objects striking the retina.
Figure 9.
Optical ray diagram of a single lens system showing rays from two objects striking the retina.
In order to resolve two object points in the test target used in the proposed aperture control-based eye vision test system, Equation (13) shows that the aperture diameter must be less than some threshold value. Like any optical imaging system with a variable aperture such as in the proposed eye test system, diffraction affects the spatial resolving power of the system based on specific system parameters. Specifically, the diameter
Ddiff of the airy disk (smallest diffraction spot) formed on the retina due to the proposed eye vision testing system is given by:
where λ is the wavelength of light, F is the focal length of the eye lens system and
Da is the diameter of the variable aperture. Using typical values of
F = 55 Diopters, λ = 550 nm (center of visible band), and a minimal
Da of 0.2 mm deployed in the eye test system, one gets
Ddiff of 122 μm. Given that the eye under test is not expected to spatially resolve test images with features as small as 122 μm in diameter, the effect of optical diffraction can be considered negligible. With regards to visual acuity that is a measure of the degree to clearly observe images using the proposed eye test system, a number of factors come into play such as the scene object size and lighting conditions as well as aberrations in the optical system, which interestingly reduce for smaller optical apertures [
1]. Indeed, the high resolution imaging performance of the proposed aperture control eye vision test method and corresponding eyewear is somewhat limited when compared to classic prescription-lens based hardware where large aperture custom lens design eyewear is engaged. This concludes the description for the second mode of operation proposed for the
Figure 5 eye vision test system.
The third mode of the proposed eye vision test system is a hybrid mode that engages both the E-lens first mode and the aperture-controlled second mode of the system. For example, to measure eye refractive errors up to two Diopters, mode 2 is deployed and for higher refractive power measurements, the E-lens system first mode is activated. So for weaker refractive power corrections, the E-lens is not engaged. This can be a benefit when using today’s E-lens technologies since generation and stability of weak E-lensing can be considered electronically harder than operating E-lenses for higher refractive powers. Finally, the choice of operations mode used for the proposed eye vision test system will depend on many parameters including the patient testing scenario as well the economics of the local eye testing site.
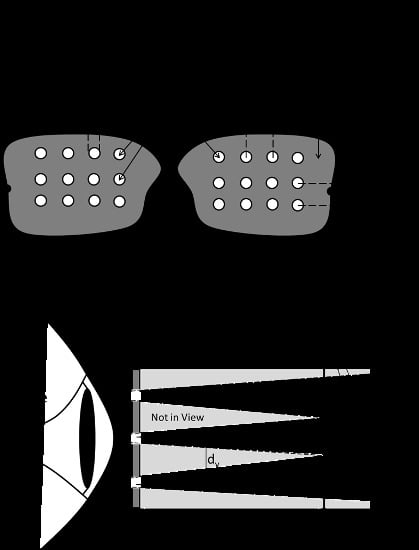
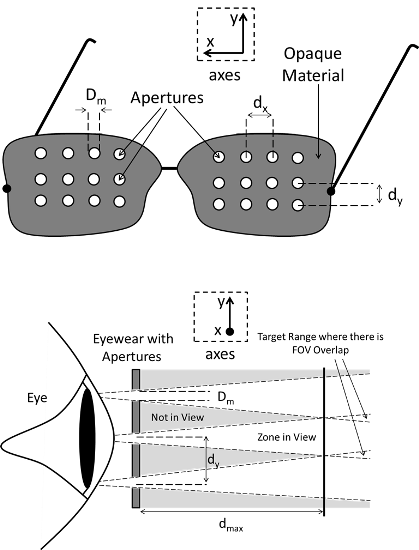
The second operations mode of the eye test system also empowers a new type of myopic eye corrective eyewear whose design using multiple apertures and principles of operation is shown in
Figure 10. The diameter
Dm of the circular aperture holes in the eyewear is dictated by the corrective refractive power needed by the myopic patient to get clear (e.g., 20/20) vision. The eye vision test conducted with the patient will give the needed prescription for the eyewear aperture diameter. As a single aperture in eyewear restricts the visual field of view (FOV) to a narrow field, multiple apertures are added in 2-D space in the eyewear to increase the overall eye FOV. The spacing between the clear apertures denoted
dx in the horizontal plane and
dy in the vertical plane, is determined by the desired patient viewing maximum target distance to prevent FOV overlap, which would cause overlap of viewed images per aperture (
Figure 10b). Note that when wearing such proposed low cost eyewear, the user may need to roll his/her eyes left to right and up and down to fill in all images to construct wide FOV imaging. Another aspect when using such eyewear is the need for adequate lighting. This is because compared to traditional eyewear; the proposed aperture eyewear involves a decreased aperture diameter, which reduces the amount of light entering the eye. The rationale behind using the eyewear in optimal light conditions is to ensure that the reduced light levels entering the eye do not handicap the user in any way. For scenes in low lighting conditions, aperture control can deteriorate vision by affecting scene brightness levels. Therefore, it is recommended to use the proposed aperture eyewear in well-lit regions to ensure that its use won’t significantly degrade the quality of vision. For instance, bright electronic displays or high sunlight areas would provide good lighting levels for operations of this low cost eyewear. Therefore, deployment in Sun rich Asian and African countries would be suitable for the proposed eyewear.
Figure 10.
(a) Design and (b) principle of wide FOV operation of a new type of low cost myopia correction eyewear using aperture control and multiple distributed apertures.
Figure 10.
(a) Design and (b) principle of wide FOV operation of a new type of low cost myopia correction eyewear using aperture control and multiple distributed apertures.
4. Experimental Demonstration
To demonstrate the potential eyesight testing capability of the proposed vision test system, the experimental design shown in
Figure 11 is implemented in the laboratory. Note that this proof-of-concept experiment demonstrates spherical refractive error correction only. Optotune ECVFL devices are used to simulate a human eye of different myopic powers viewing a test image through another ECVFL device that simulates a patient’s eyewear. A complementary metal oxide semiconductor (CMOS) chip sensor is placed at a distance equivalent to
ds from the eye lens system comprising of a pair of 20 D lenses and an ECVFL labeled as ECVFL 1. The deployed CMOS sensor model number is IDS UI-1250LE-M-GL having a 5.3 μm pixel size. In comparison, the diameter of a single cone cell in the fovea of the human eye is on average between 1 to 4 μm [
2]. Therefore, the deployed CMOS pixel size is in close proximity to that of the human eye. However, it must be noted that unlike the CMOS sensor, the human eye’s optical sensing resolution depends on various factors including angle of viewing, lighting conditions, and viewing distances. The ECVFL 1 is used to control the power of the myopic eye during the experiment, thereby simulating an eye having varying degrees of refractive error. A mechanically variable aperture of diameter
Da is located a distance
da from the eye lens system. Another ECVFL, labeled as ECVFL 2, is placed a distance
de2 from the aperture. The ECVFL 2 represents the corrective lens needed to restore blurred vision. A standard Snellen chart is used as a vision test target,
ds is 14.2 mm,
da is 9.5 mm,
de2 is 11 mm and
dt is 100 cm. The ECVFL 1 model deployed in the experiment is Optotune’s EL-10-30 having a focal length
Fe1, while Optotune’s EL-6-18 is used as ECVFL 2 having focal length
Fe2. SM1D12C Iris Diaphragm from Thorlabs (Newton, NJ, USA) is deployed as the mechanically controlled aperture, with all
Da values measured using Aerospace Vernier calipers. The height of the largest letter “E” on a Snellen chart placed 6 m away is 87.5 mm [
48]. Therefore, for the 1 m target distance as used in the experiment, the deployed Snellen chart is scaled to have its largest “E” to be 87.5/6 mm = 14.6 mm in height.
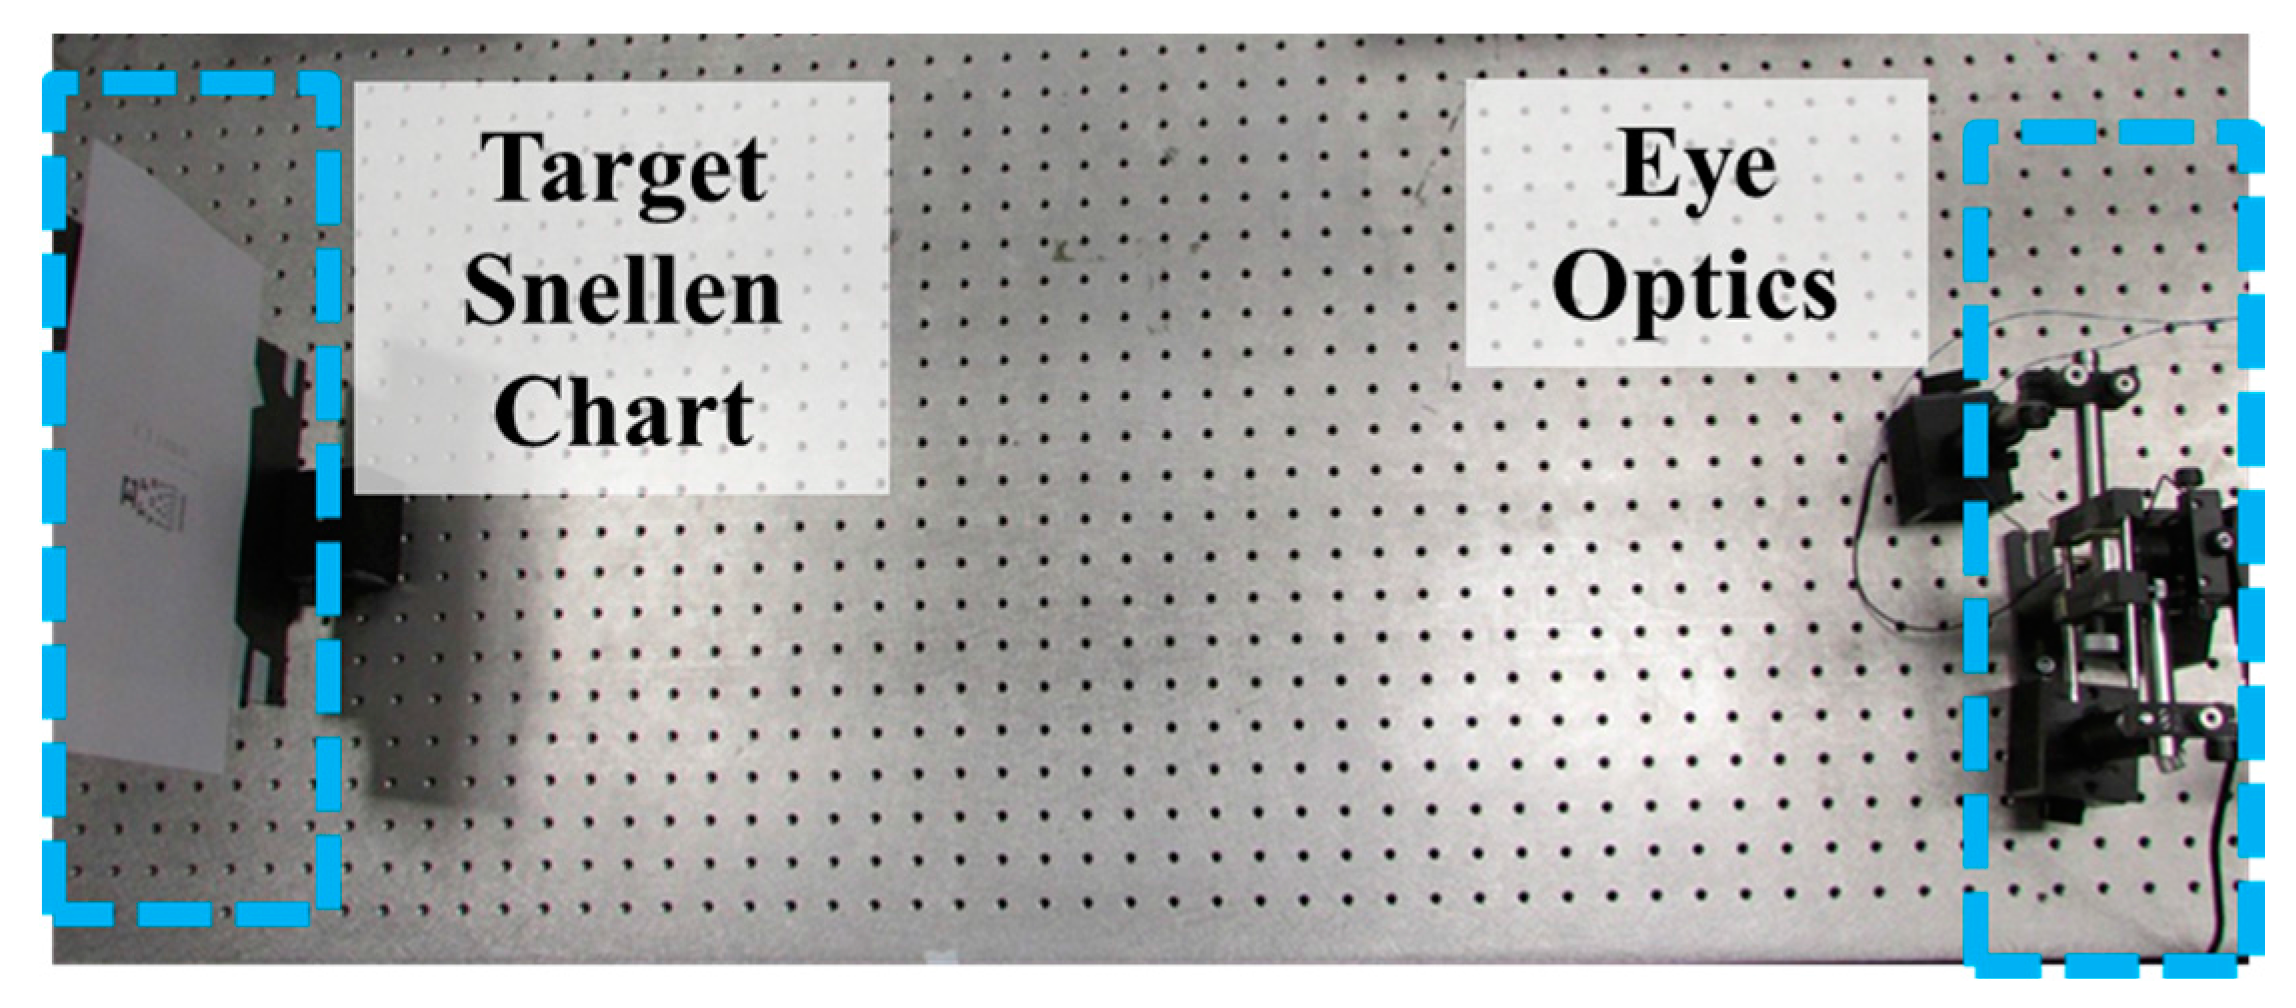
Figure 12 shows a top view of the laboratory experimental setup.
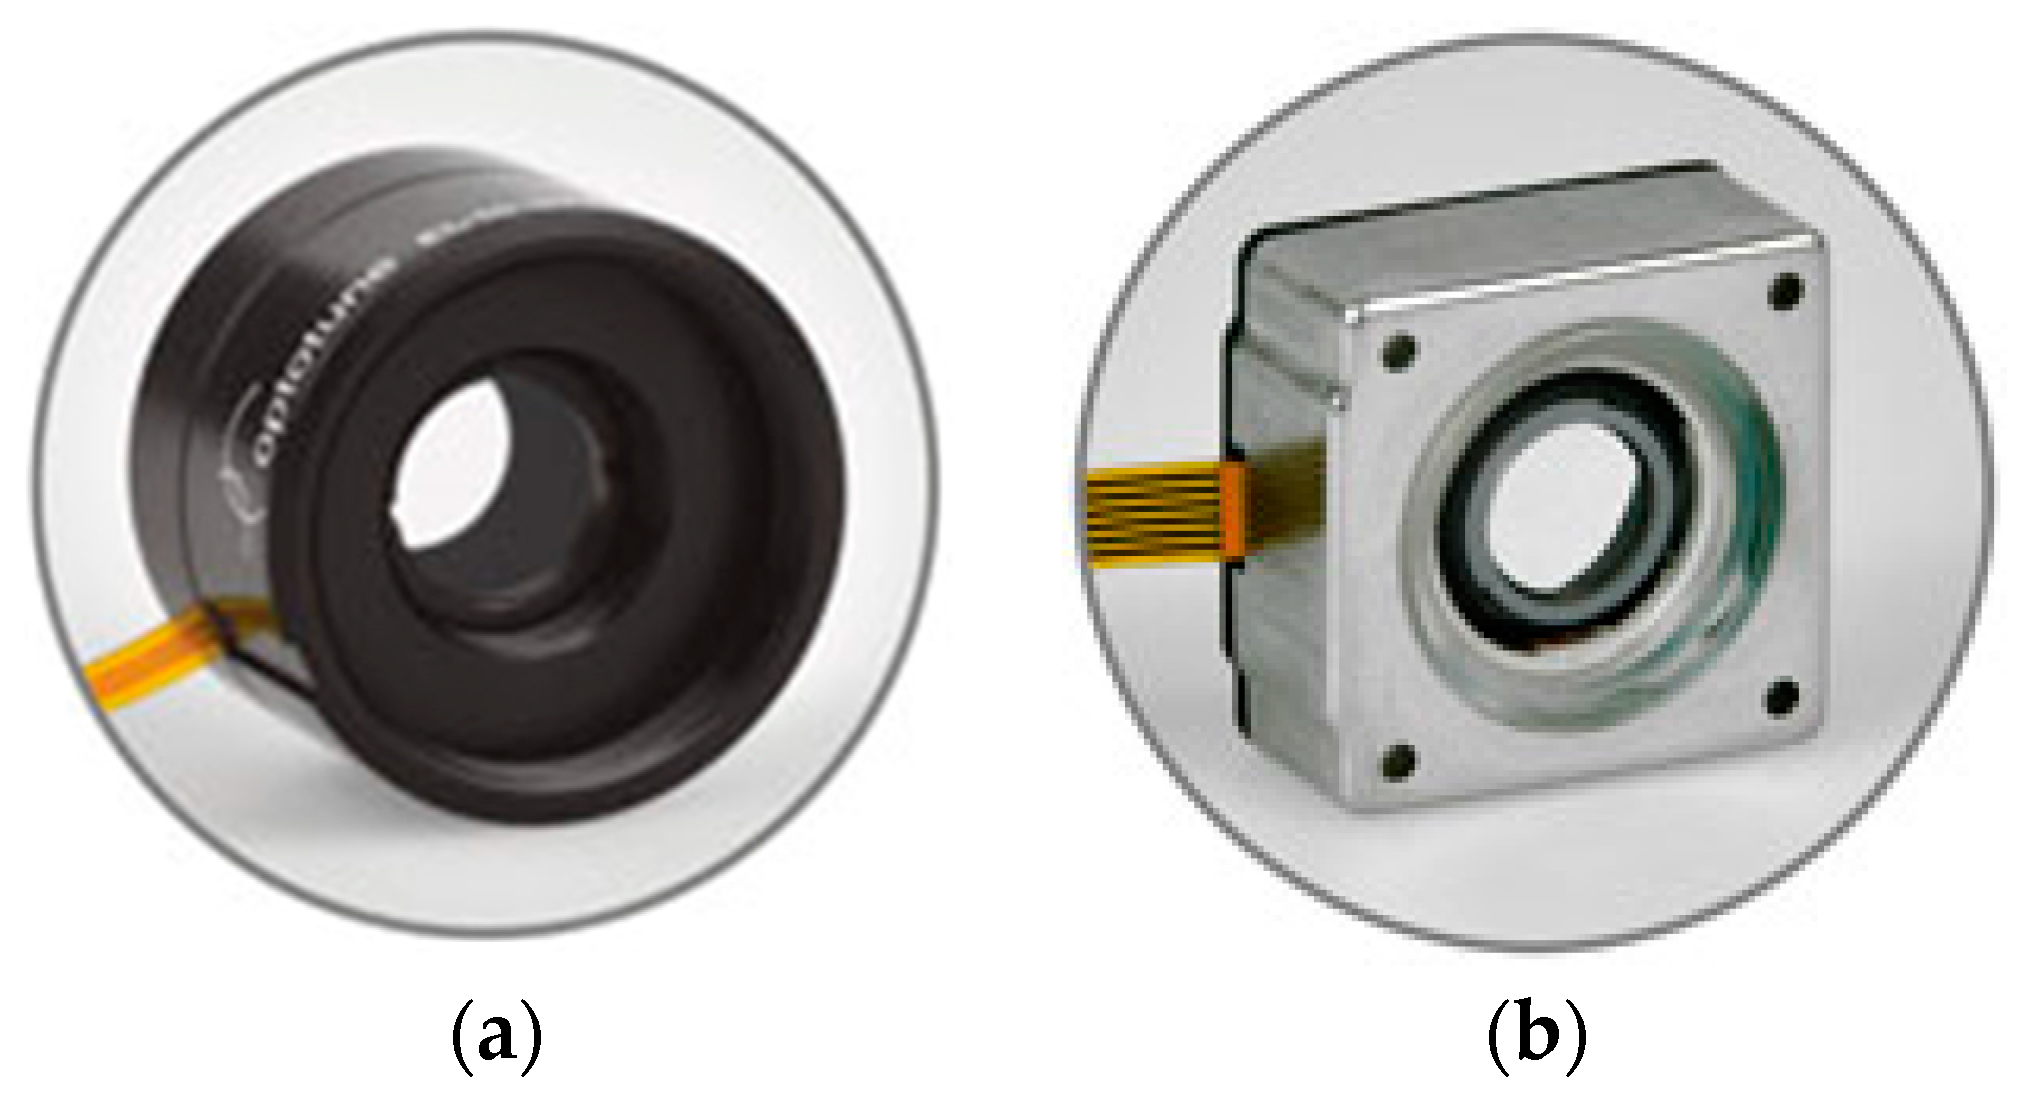
Figure 13 shows images of the 1 cm diameter model EL-10-30 ECVFL 1 and the 6 mm diameter model EL-6-18 ECVFL 2 used to introduce eye refractive error and dioptric power correction, respectively.
Figure 11.
Experimental design of the proposed basic E-lens based eye vision test system assembled in the laboratory using commercially available micromachines.
Figure 11.
Experimental design of the proposed basic E-lens based eye vision test system assembled in the laboratory using commercially available micromachines.
Figure 12.
Laboratory experimental setups (top view) used to demonstrate the principles of the proposed eye vision test system using micromachines based on E-lenses and aperture control.
Figure 12.
Laboratory experimental setups (top view) used to demonstrate the principles of the proposed eye vision test system using micromachines based on E-lenses and aperture control.
Figure 13.
Images of Electronically Controlled Variable Focus Lens (ECVFL) 1 (a) and ECVFL 2 (b) used in the experiment.
Figure 13.
Images of Electronically Controlled Variable Focus Lens (ECVFL) 1 (a) and ECVFL 2 (b) used in the experiment.
To demonstrate the first mode of operations of the proposed
Figure 5 eye vision test system that implements eye refractive error correction via ECVFL 2,
Da is fixed to an average human pupil diameter of 5 mm with
Fe1 initially set to 15 D resulting in a total eye lens system power of 55 D. This results in a clear image of the Snellen chart acquired by the CMOS sensor with the image recorded and viewed via the connected laptop, with
Fe2 set to 0 D (infinite focal length). The first step in the experiment is to acquire
Fe1 values corresponding to varying degrees of myopia. Note that since myopia (nearsightedness) [
49] is measured by the optical power (in negative Diopters) of the corrective lens (in this case ECVFL 2) which helps focus the image on the retina,
Fe2 is first varied via ECVFL 2 current control from 0.00 to −5.00 D in 0.25 D steps signifying the different degrees of myopia. For each
Fe2 setting,
Fe1 is altered to restore the clear image of the Snellen chart. A clear image is defined in the experiment as an image in which the letters on the 20/20 line of the Snellen chart are resolvable by the experimenter viewing the laptop display that provides the CMOS sensor generated image. These acquired
Fe1 values represent the optical power of the myopic eye for which the different degrees of myopia are given by
Fe2 values. As an example, a person with −1.0 D myopia requires spectacles with a prescription of −1.0 D (
i.e., a corrective lens of focal length
Fe2), but it does not necessarily mean that the eye lens system has a refractive error of −1.0 D. Once all
Fe1 values are noted for varying degrees of myopia,
Fe2 is set to give 0.0 D and
Fe1 is altered electronically to induce a refractive error in the eye, simulating a patient’s eye with varying degrees of known myopia. Depending on the induced refractive error, subsequent control of ECVFL 2, which represents part of the programmable vision test eyewear, allows correction of the induced error. The CMOS chip sensor snapshots are captured for each 0.25 D step of myopia. These images show what the myopic eye would see for different degrees of refractive error.
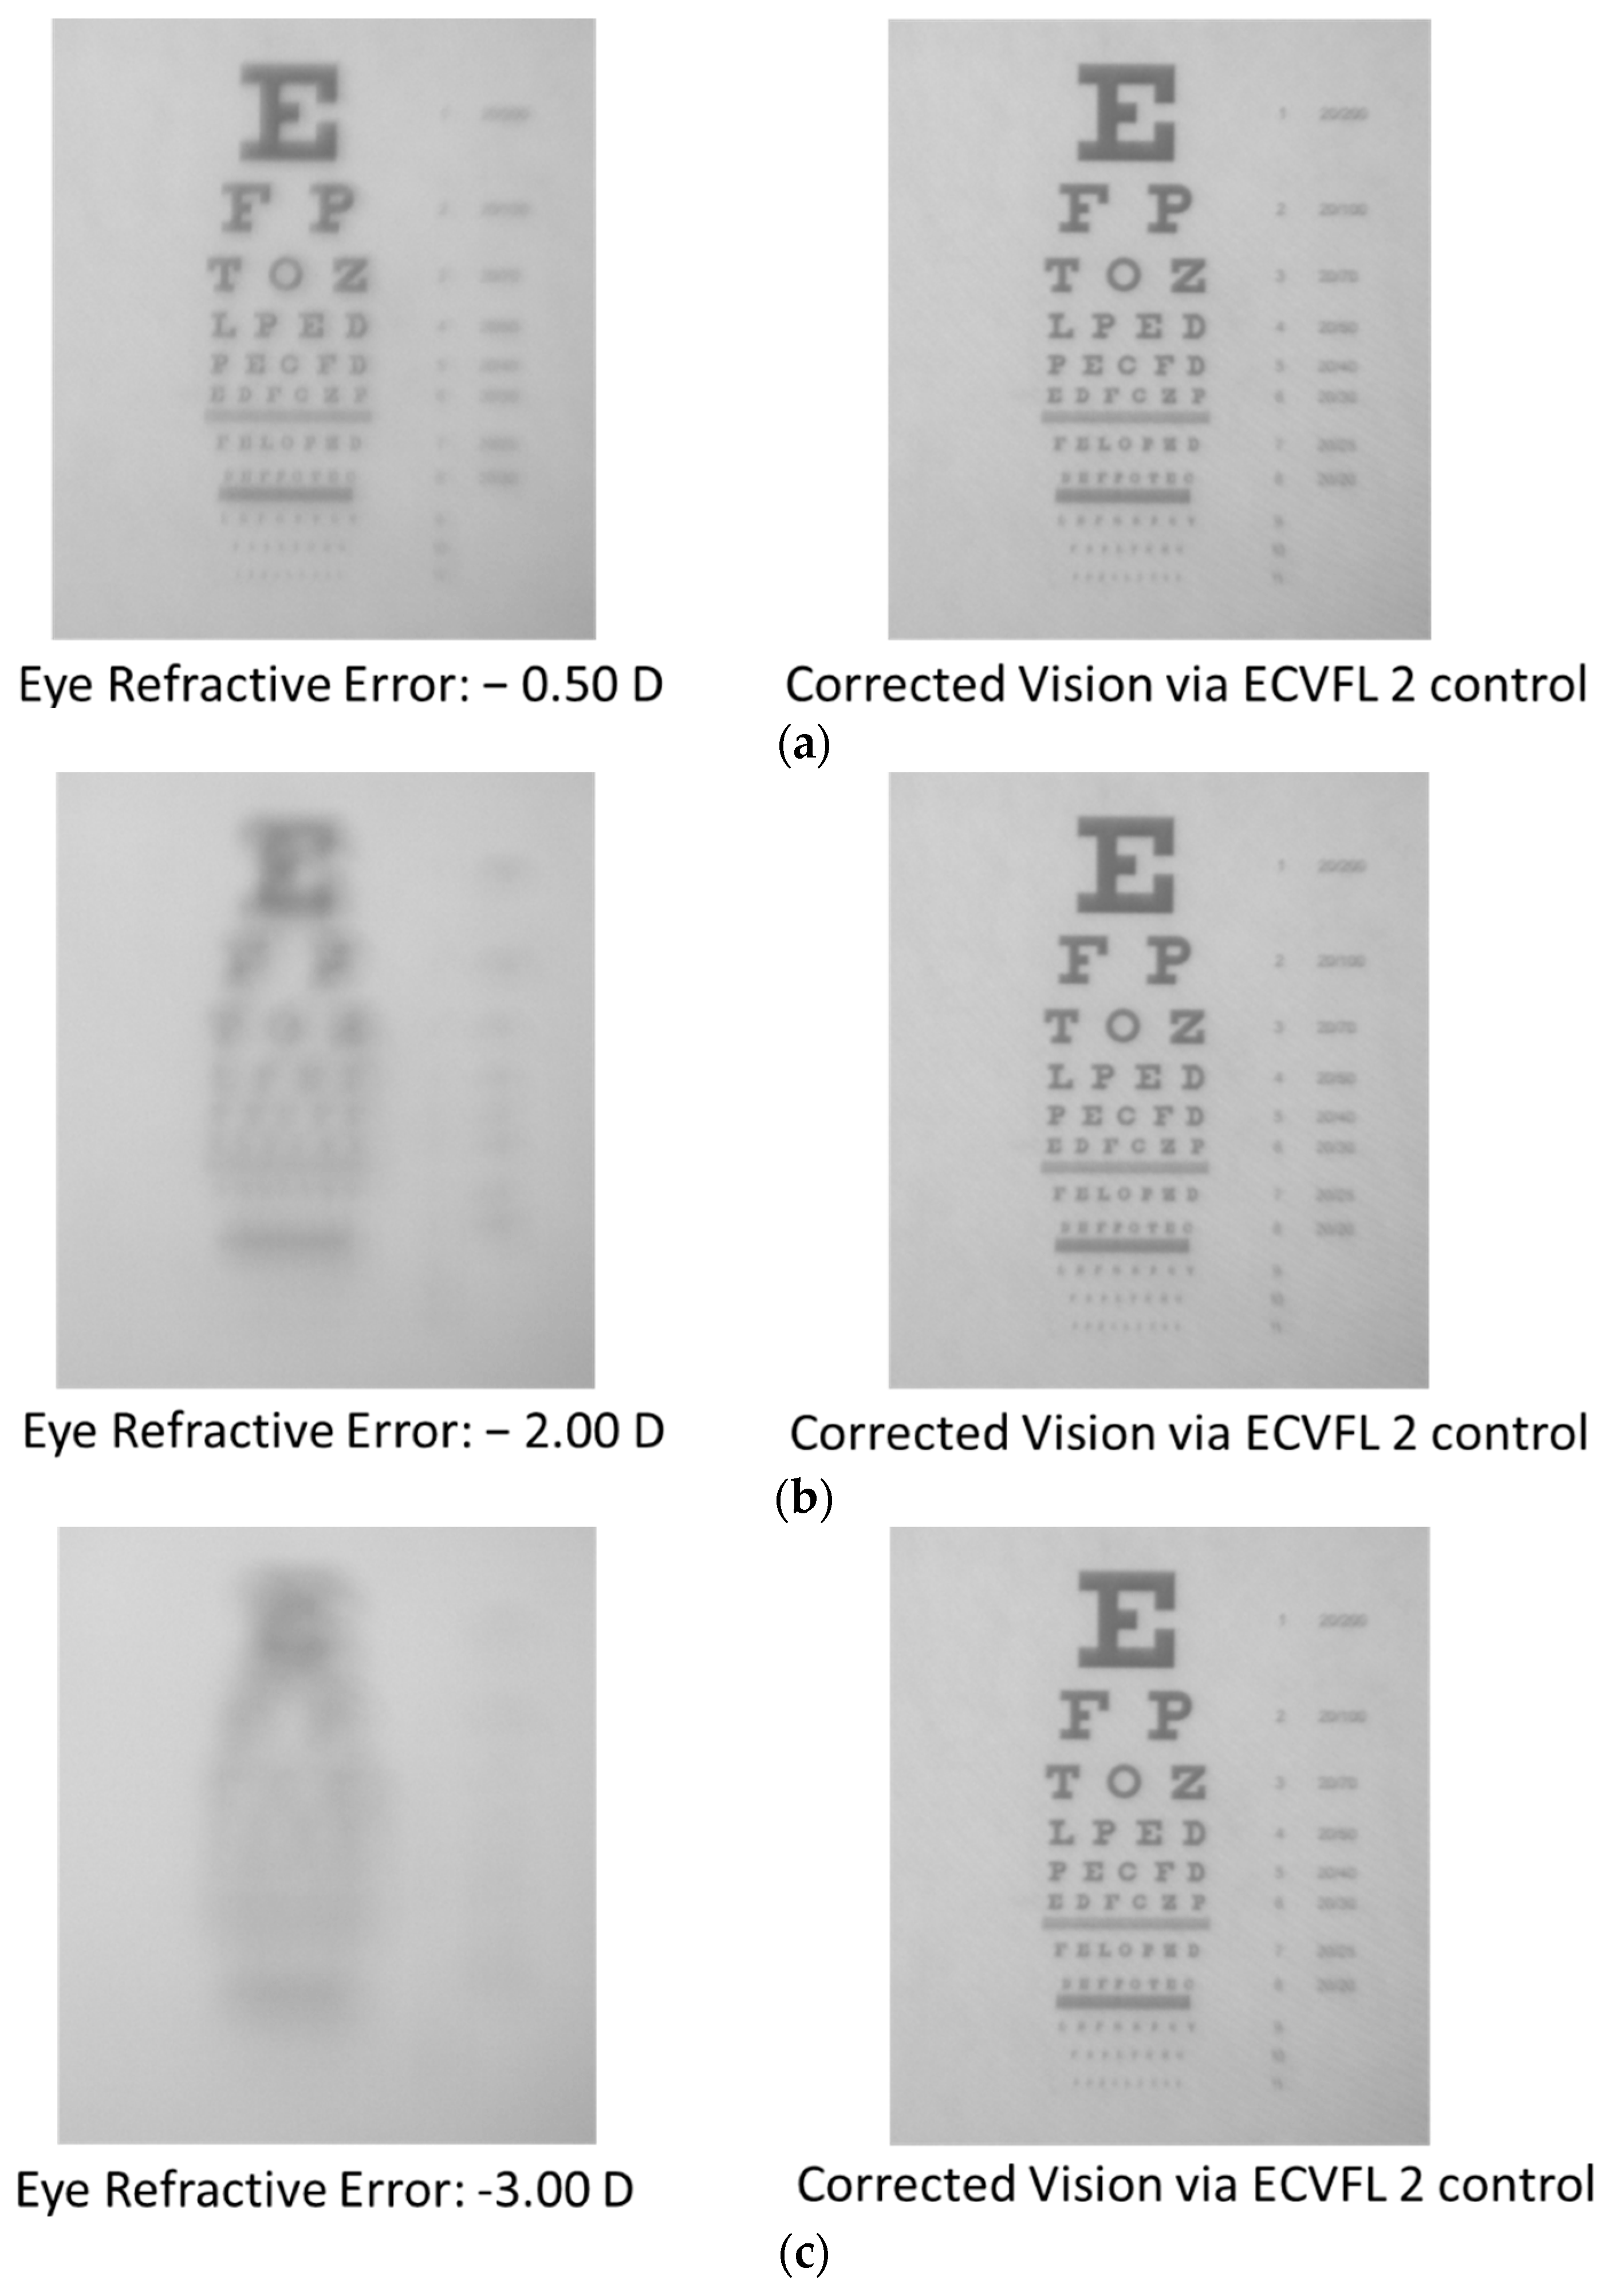
Figure 14 shows such images for refractive errors of −0.50 D, −2.00 D, and −3.0 D error values along with ECVFL 2 corrected images. The list of induced myopic refractive errors via
Fe1 and corresponding
Fe2 values along with respective ECVFL current settings are summarized in
Table 1.
Note that ECVFL 2 is equally capable of going into the positive range of powers (above 0.0 Diopters) by increasing the current supplied to it above 65.6 mA. These positive ECVFL 2 dioptric powers would be useful in testing far-sightedness/hyperopia and presbyopia in patients. Although, positive range of powers wasn’t considered for this proof of concept experiment because hyperopia and related vision problems do not normally occur among younger patients, it is fully realizable using the proposed
Figure 5 system. The demonstrated resolution of 0.25 D can also be enhanced using smaller ECVFL drive current steps that will in-turn give smaller focal length change. With optimized ECVFL technologies suited for the desired range of focal lengths, the patient’s eyes can be diagnosed with greater accuracy. In conjunction with the smart optics described in the previous section, the proposed eyewear system has potential in taking the eyesight diagnosis process to the next level of vision systems impacting human health.
Next, demonstrated is the second mode of operations of the proposed
Figure 5 eye vision test system comprising eye refractive error correction via aperture control. For this experiment, ECVFL 2 is removed from the vision path because easy access is obtained to vary and measure the aperture setting without ECVFL 2. Also, ECVFL 2 is not needed for this part of the experiment. The ECVFL 1 is set to current values corresponding to varying degree of myopia shown in
Table 1 and the aperture diameter
Da is reduced until the 20/20 line on the Snellen chart on the CMOS sensor acquired image seen on the computer is just readable by the experimenter. Two experimenters called Subject A and Subject B are chosen to carry out the decision making process on whether the 20/20 line is readable on decreasing
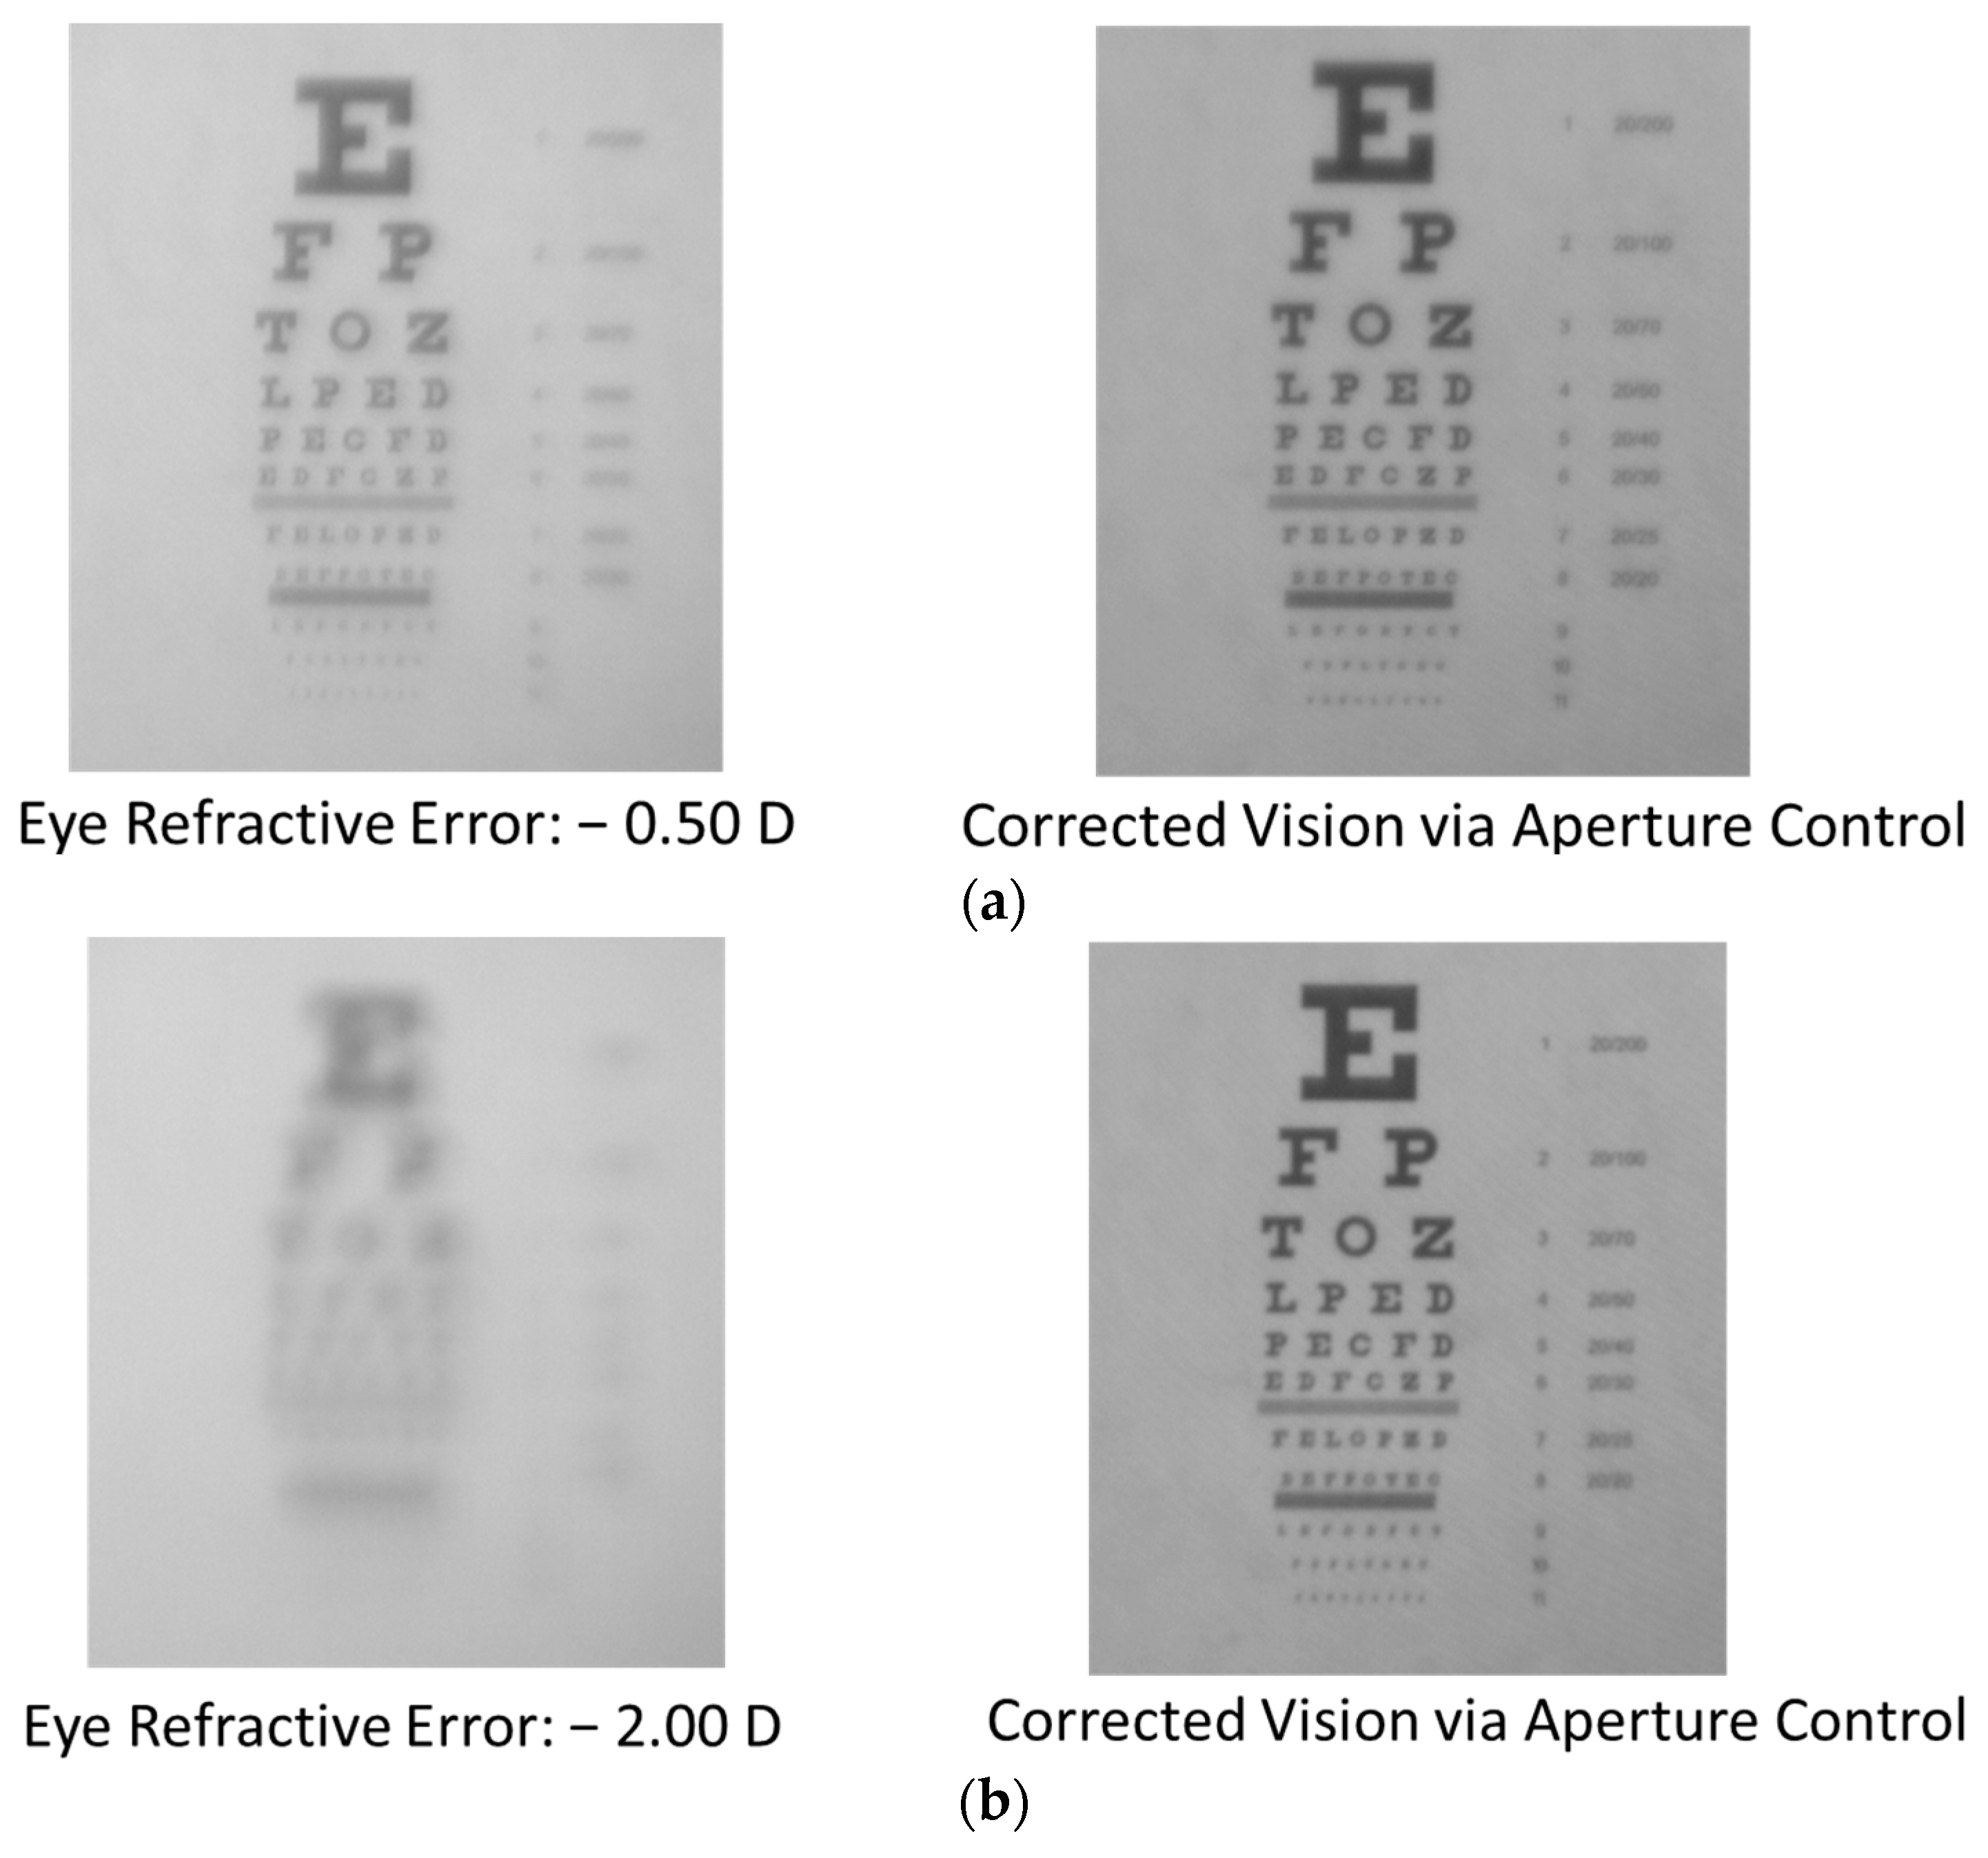
Da values. Sample CMOS chip acquired images for induced refractive error values of −0.50 D and −2.00 D along with respective aperture control vision corrected images are shown in
Figure 15.
Table 2 summarizes the acquired
Da data for both experimenters for a simulated eye refractive error range of 0.00 D to −2.00 D. Refractive errors worse than −2.00 D can also be corrected to some degree but are not considered here because the aperture diameters were too small to measure using the Vernier caliper used in the experiment.
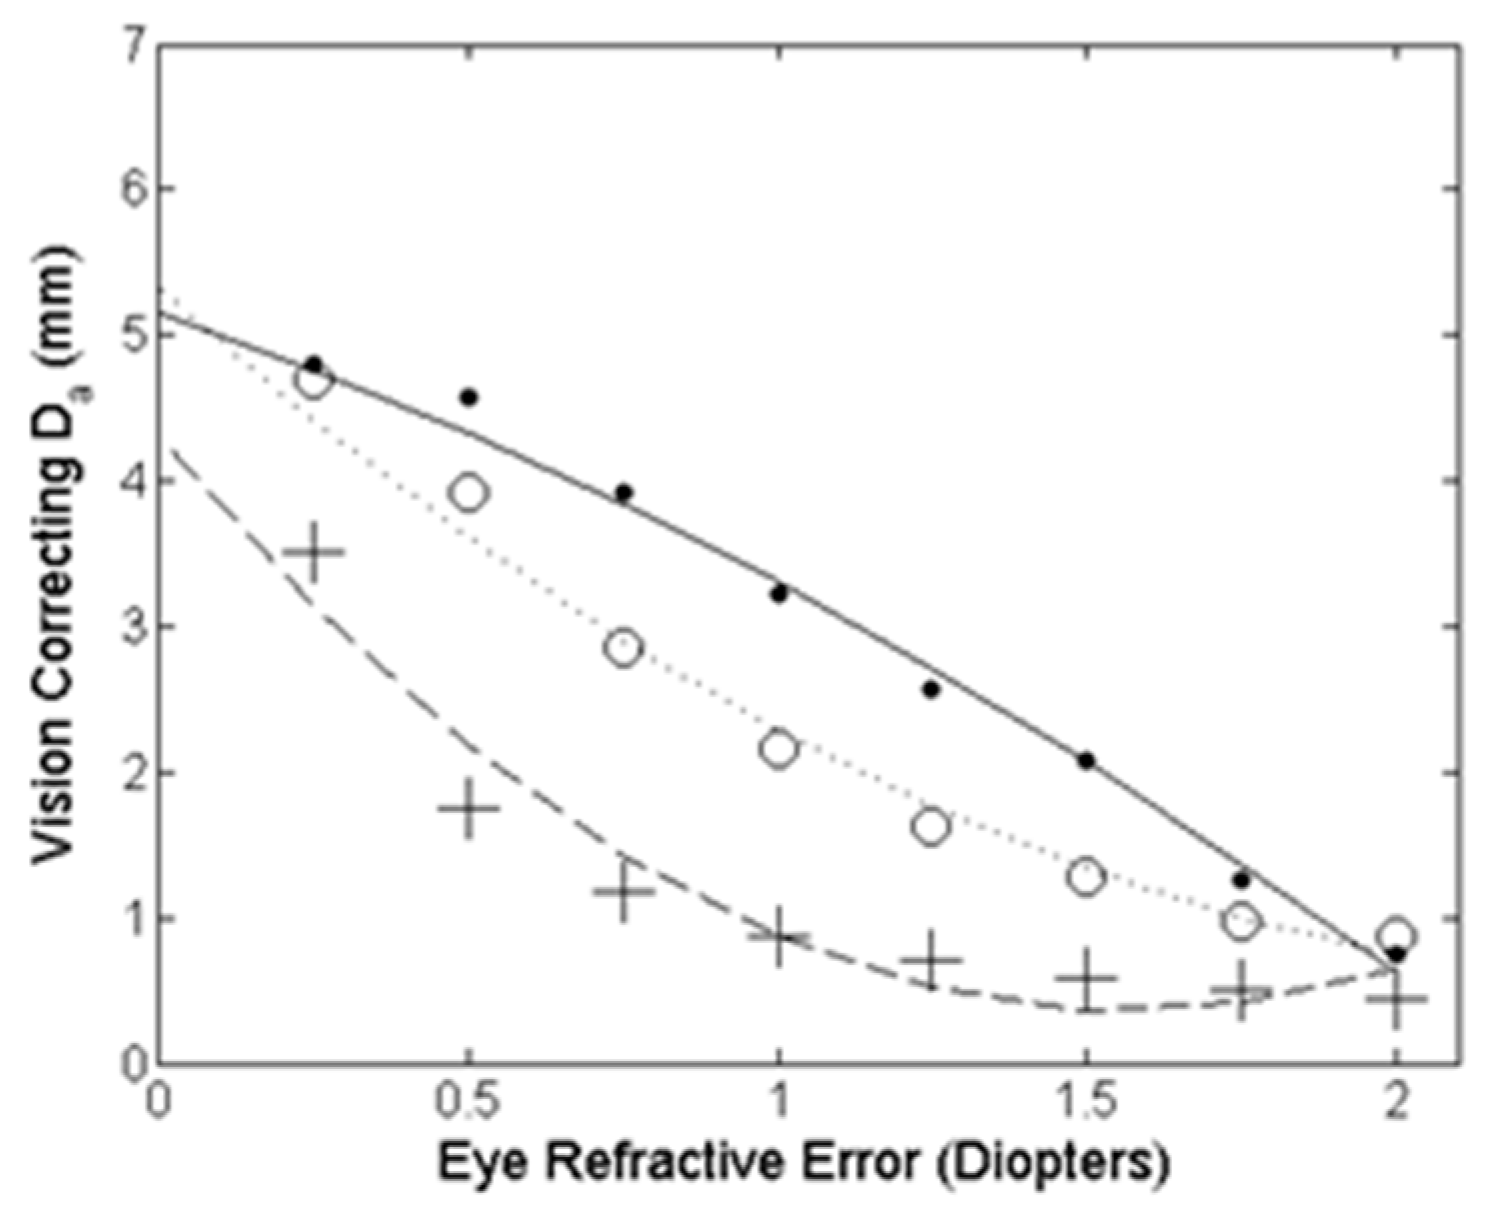
The experimental
Da data in
Table 2 for both Subject A and Subject B is compared to the theoretically derived Equation (13)
Da curve for refractive error of up to −2.00 D. This theoretical curve is given by Equation (13) in which
FN = 55 D and
FAB is varied from 55 to 57 D to estimate the 0.00 D to −2.00 D range of myopia. For Equation (13), α is found using Equation (8) where
dt is 1 m. To find
H12, first the height of the letters on the 20/20 line of the target Snellen chart is found which is 10 times smaller than the height of the largest “E” on the 20/200 line,
i.e., (height of letters on 20/20 line) = (height of letters on 20/200 line)/10 = 14.6/10 mm = 1.46 mm. In order to read these letters, one needs to resolve the highest spatial frequency variation in these letters. This is given by the second letter “E” on the 20/20 line, which has the top arm followed by a white space, which is then followed by the middle arm as the highest spatial frequency variation on this line. Hence
H12 is given by the distance covered by these three dots (two black and one white), so
H12 = height of letters on 20/20 line × fraction of this height covered by three dots = 1.46 × (3/5) mm ≈ 0.88 mm. Using this
H12, α is calculated using Equation (8) to be 0.05 Rad. Using this α value, the Equation (13)
Da is plotted and shown in
Figure 16 as a coarse dashed curve with plus symbols, along with experimental data from Subject A (solid curve with dot symbols) and Subject B (fine-dashed curve with circular symbols). The difference in the experimental data acquired via Subject A and Subject B is due to the subjective nature of the readability of the 20/20 line and is a common data representation in human vision experimental studies [
50]. A pattern different from the letters deployed in a standard vision test chart may be used to discern the degree of clarity of a target.
Figure 14.
Images acquired by CMOS sensor acting as retina for varying degrees of ECVFL 1 induced myopia of (a) −0.50 D, (b) −2.00 D, and (c) −3.00 D, all corrected using ECVFL 2.
Figure 14.
Images acquired by CMOS sensor acting as retina for varying degrees of ECVFL 1 induced myopia of (a) −0.50 D, (b) −2.00 D, and (c) −3.00 D, all corrected using ECVFL 2.
Table 1.
Table shows focus and current settings for both ECVFL 1 and ECVFL 2 for eye refractive error range from 0.00 to −5.00 D.
Table 1.
Table shows focus and current settings for both ECVFL 1 and ECVFL 2 for eye refractive error range from 0.00 to −5.00 D.
| Induced Myopic Refractive Error via ECVFL 1 (Diopter) | ECVFL 1 Current setting (mA) | ECVFL 2 current setting for vision correction (mA) | Corresponding ECVFL 2 focal length Fe2 (Diopter) |
|---|
| 0.00 | 142.01 | 65.6 | 0.00 |
| −0.25 | 146.26 | 64.3 | −0.25 |
| −0.50 | 148.13 | 63.1 | −0.50 |
| −0.75 | 150.03 | 61.8 | −0.75 |
| −1.00 | 152.61 | 60.5 | −1.00 |
| −1.25 | 158.47 | 59.3 | −1.25 |
| −1.50 | 161.04 | 58.0 | −1.50 |
| −1.75 | 167.62 | 56.7 | −1.75 |
| −2.00 | 173.84 | 55.4 | −2.00 |
| −2.25 | 182.00 | 54.2 | −2.25 |
| −2.50 | 185.72 | 52.9 | −2.50 |
| −2.75 | 189.01 | 51.7 | −2.75 |
| −3.00 | 195.87 | 50.4 | −3.00 |
| −3.25 | 198.23 | 49.1 | −3.25 |
| −3.50 | 210.00 | 47.9 | −3.50 |
| −3.75 | 216.82 | 46.6 | −3.75 |
| −4.00 | 220.11 | 45.3 | −4.00 |
| −4.25 | 224.33 | 44.1 | −4.25 |
| −4.50 | 230.15 | 42.8 | −4.50 |
| −4.75 | 234.20 | 41.5 | −4.75 |
| −5.00 | 239.49 | 40.3 | −5.00 |
Figure 15.
CMOS sensor acquired images showing induced refractive error values of (a) −0.50 D and (b) −2.00 D, along with respective aperture control vision corrected images. The aperture values for (a) and (b) corrected vision as measured by Subject A are 4.58 mm and 0.75 mm, respectively.
Figure 15.
CMOS sensor acquired images showing induced refractive error values of (a) −0.50 D and (b) −2.00 D, along with respective aperture control vision corrected images. The aperture values for (a) and (b) corrected vision as measured by Subject A are 4.58 mm and 0.75 mm, respectively.
Table 2.
Table shows induced myopic refractive errors and corresponding Da values needed to restore corrected vision for Subject A and Subject B.
Table 2.
Table shows induced myopic refractive errors and corresponding Da values needed to restore corrected vision for Subject A and Subject B.
| Induced Myopic Refractive Error via ECVFL 1 (Diopter) | ECVFL 1 Current setting (mA) | Subject A: Da required for vision correction (Diopter) | Subject B: Da required for vision correction (Diopter) |
|---|
| 0.00 | 243.02 | 5.00 | 5.00 |
| −0.25 | 146.26 | 4.80 | 4.70 |
| −0.50 | 148.13 | 4.58 | 3.92 |
| −0.75 | 150.03 | 3.92 | 2.86 |
| −1.00 | 152.61 | 3.22 | 2.16 |
| −1.25 | 158.47 | 2.56 | 1.62 |
| −1.50 | 161.04 | 2.08 | 1.28 |
| −1.75 | 167.62 | 1.26 | 0.98 |
| −2.00 | 173.84 | 0.75 | 0.86 |
Figure 16.
Data plot showing vision test system aperture diameter needed to correct for eye refractive error. The theoretical Equation (13) acquired aperture diameter Da is shown as a coarse-dashed line with plus symbols and experimental data for Subject A is shown as a solid line with dot symbols and Subject B as fine-dashed line with circle symbols.
An experimental test of the proposed
Figure 10 eyewear is also conducted demonstrating the clearer vision using aperture control and the effect of aperture separation on the FOVs seen by the sensor representing the retina. Custom masks having apertures each of diameter
Dm are constructed from black sheets and placed at the location of ECVFL 2 in the
Figure 11 set-up with
Da set to 5 mm and −1.75 D of myopia induced in the eye lens system using ECVFL1. Three masks are designed called mask A, mask B and mask C. Mask A has a single aperture of
Dm = 1.5 mm, mask B has two apertures of the 1.5 mm diameters with a separation of 3 mm and mask C has two apertures of 1.5 mm diameters that are separated by 6 mm.
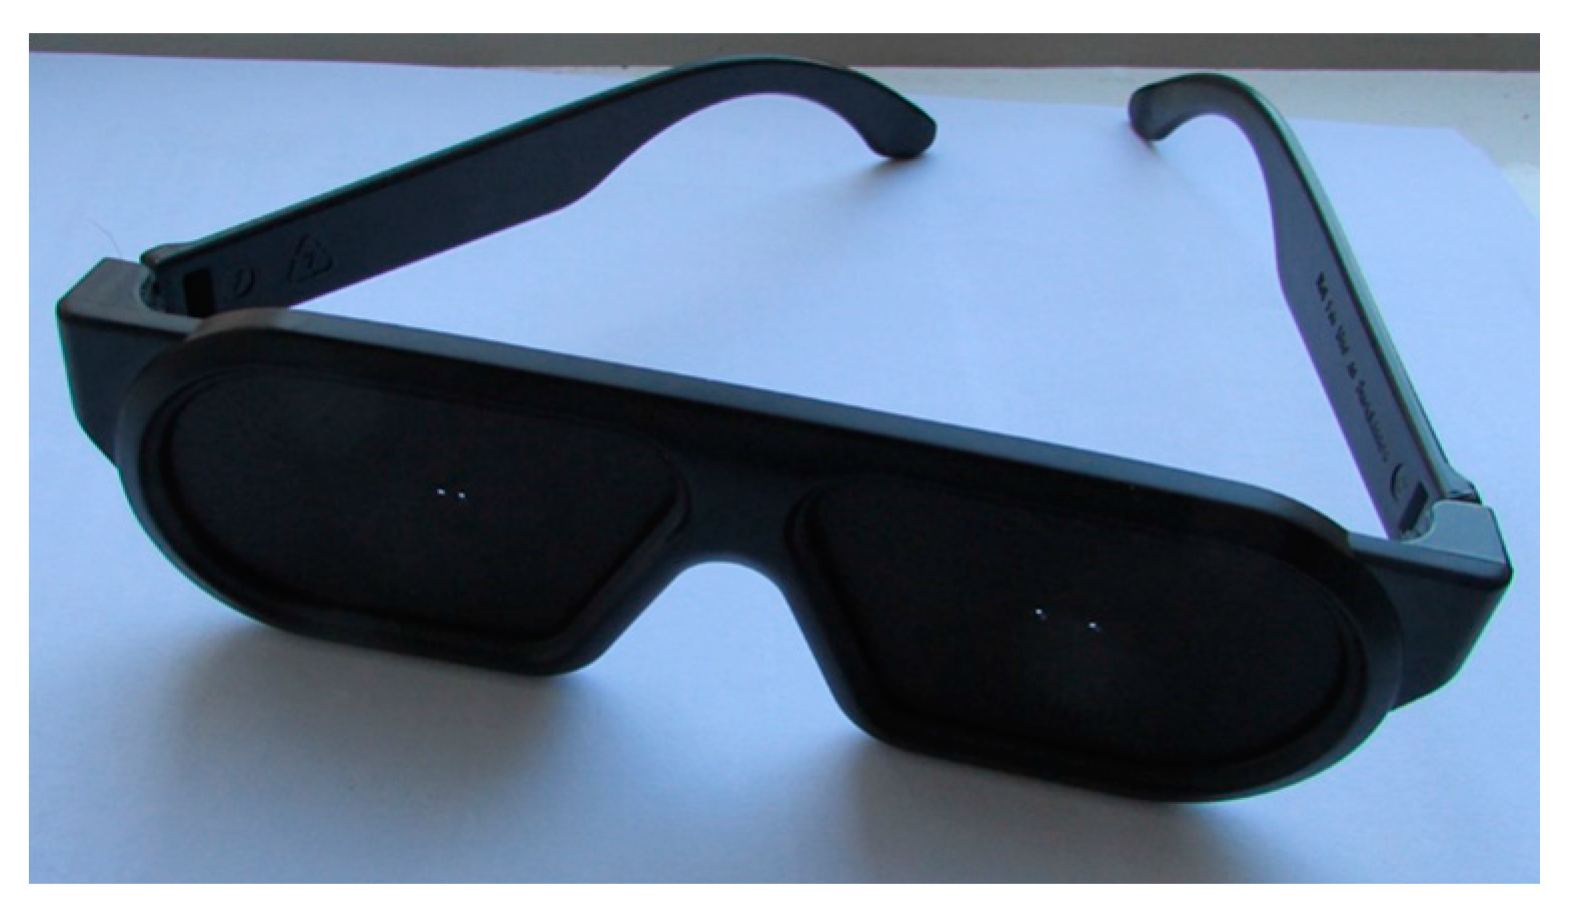
Figure 17 shows the deployed custom-made eyewear having eye pieces made with mask B (left) and mask C (right).
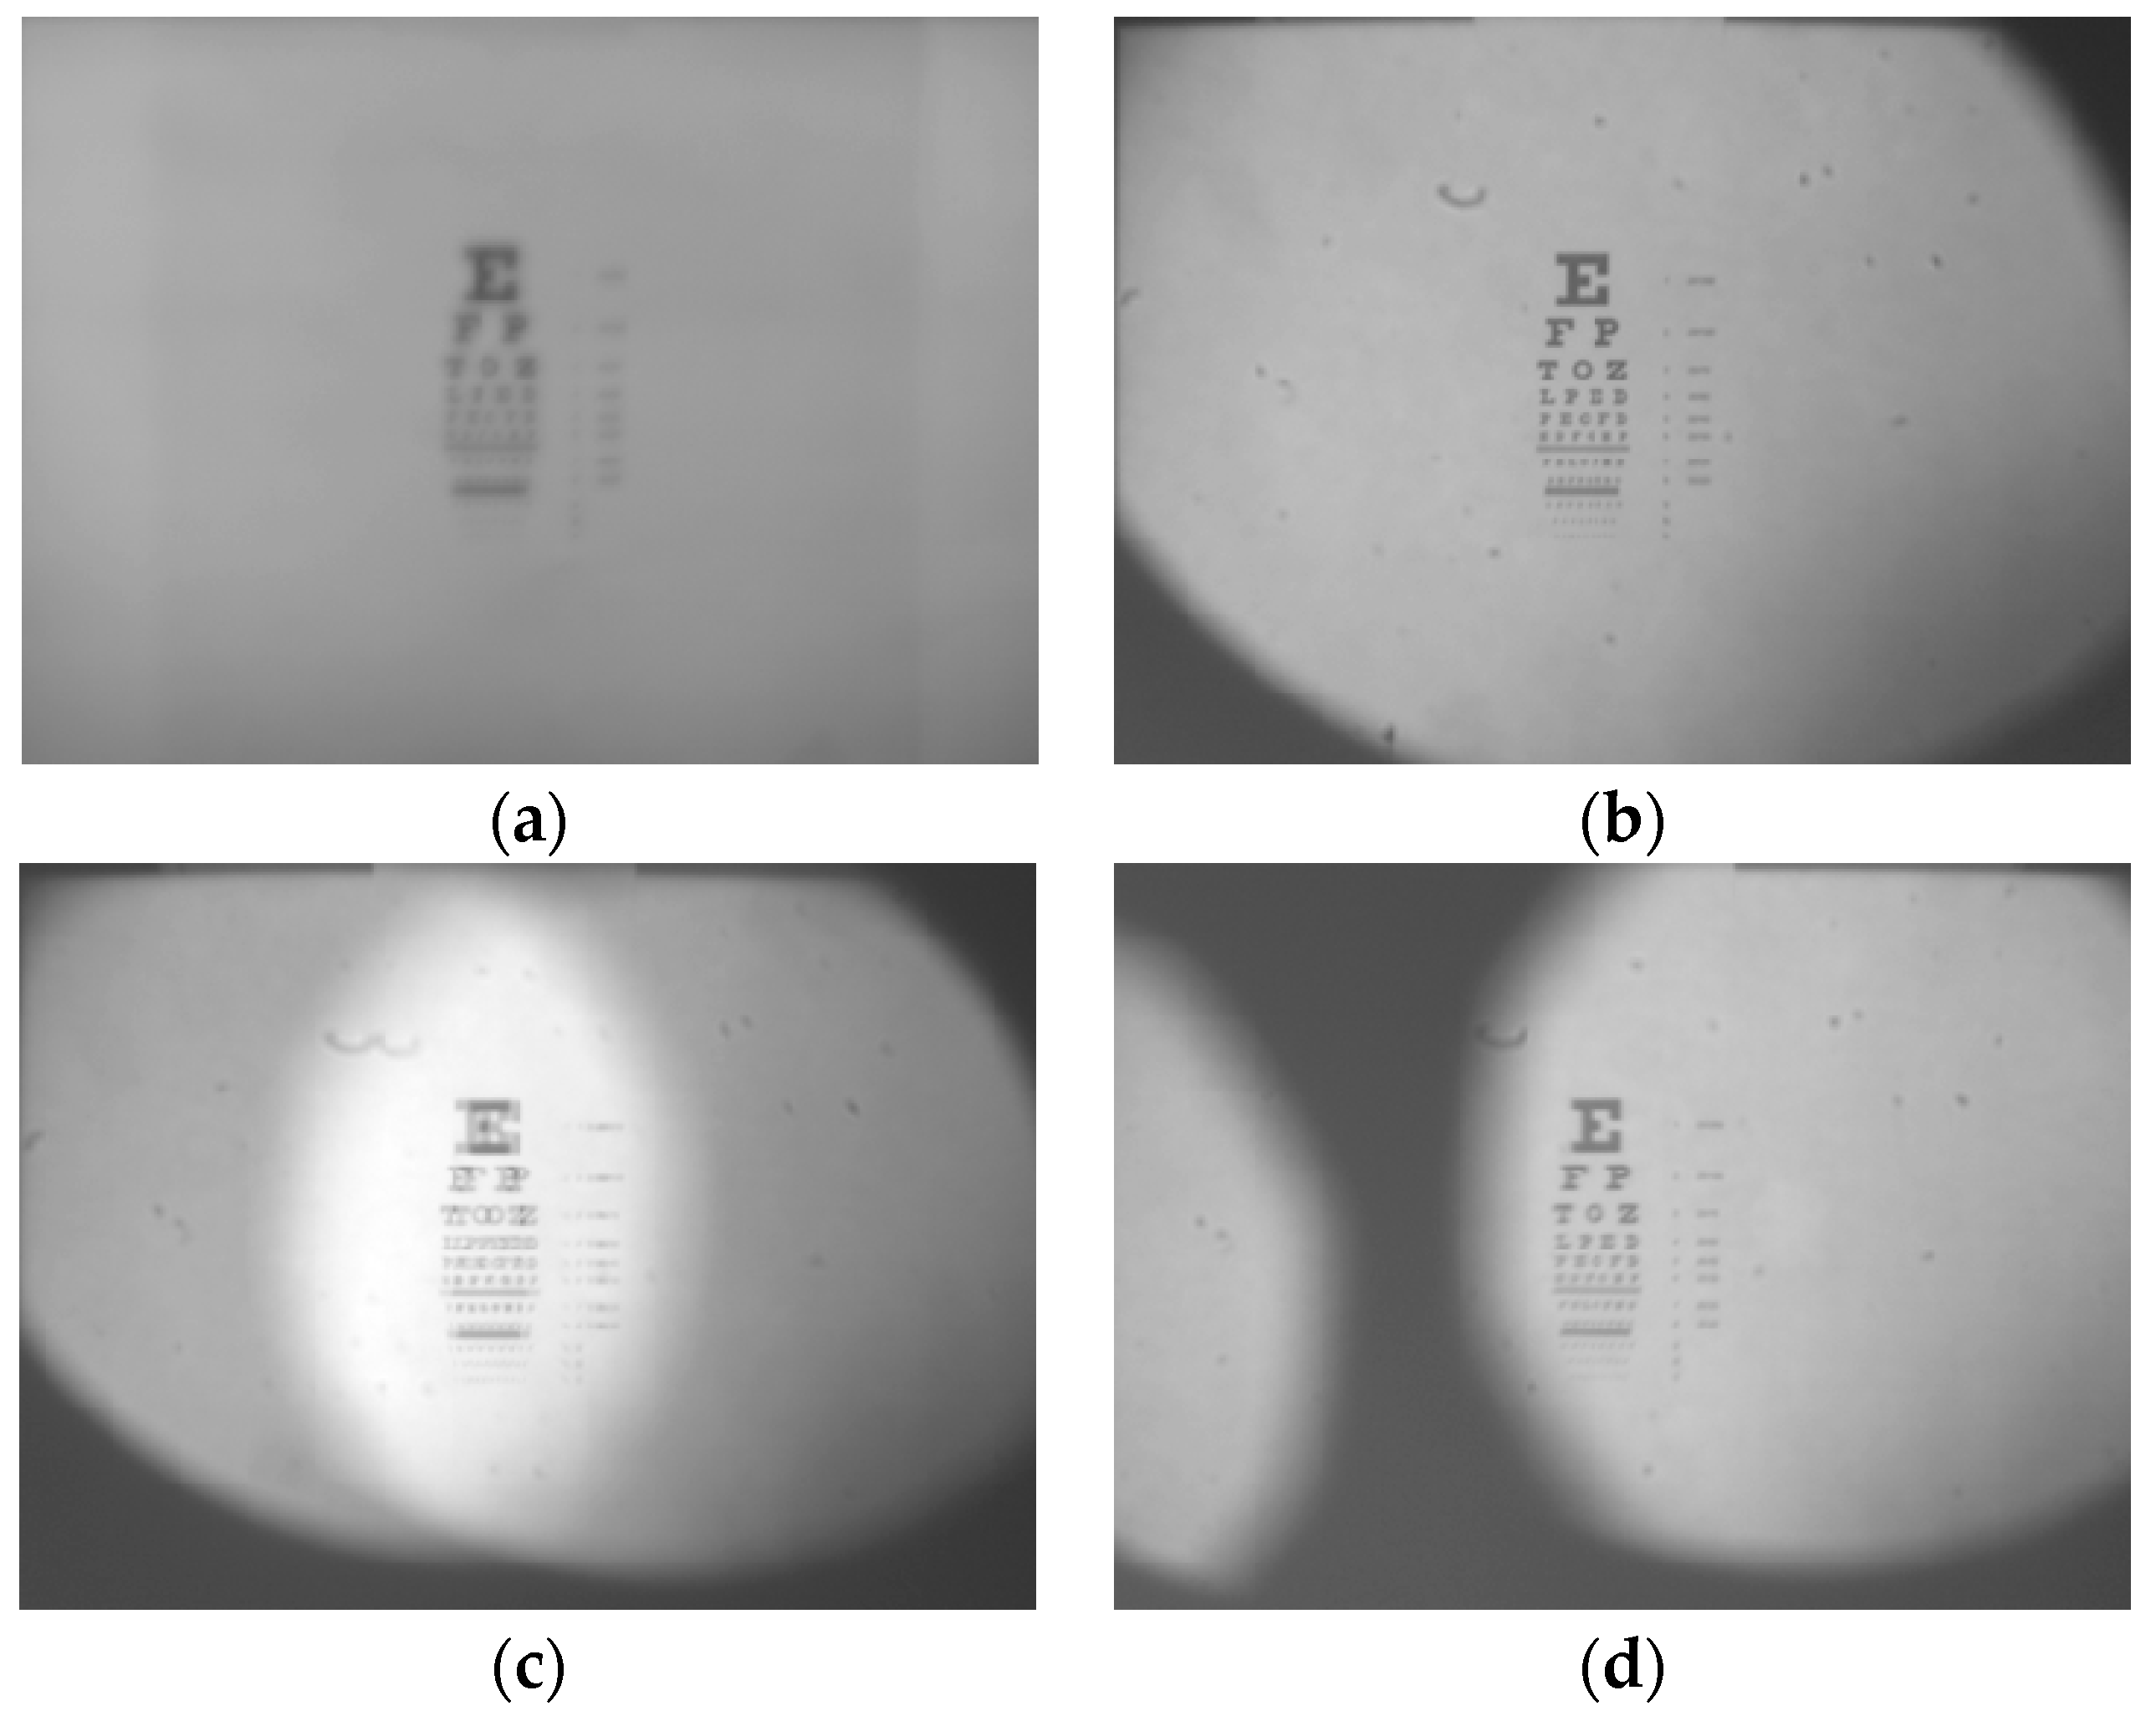
Figure 18a shows the CMOS sensor chip acquired eye test chart image obtained without any mask present in the deployed test eyewear.
Figure 18b shows an image viewed through mask A giving the expected clearer image demonstrating non-blurred image viewing aperture control.
Figure 18c shows the CMOS chip acquired image when using mask B. This image shows laterally offset eye charts that results due to the slightly overlapping FOVs that occurs due to the two apertures in mask B with a gap of 3 mm between the two apertures. Finally,
Figure 18d is captured using mask C where the apertures are separated by a larger distance of 6 mm resulting in FOVs that are separated and thus result in a clear non-blurred view of the Snellen chart through one of the mask apertures. Therefore, in the design of the proposed eyewear using multiple apertures of a given aperture diameter, one must take into account the aperture separation parameters
dx and
dy in both the transverse (
x-y) directions for a given maximum viewing distance
dmax.
Figure 17.
Test eyewear comprising of eye-pieces having 1.5 mm diameter apertures separated by 3 mm (left) and 6 mm (right) distances.
Figure 17.
Test eyewear comprising of eye-pieces having 1.5 mm diameter apertures separated by 3 mm (left) and 6 mm (right) distances.
Figure 18.
CMOS chip acquired images for eyewear vision test system having an eye lens refractive error of −1.75 D with test eyewear having (a) no mask; (b) mask A having a single aperture of diameter 1.5 mm; (c) mask B having two 1.5 mm diameter apertures separated by 3.00 mm creating overlapping FOVs; and (d) mask C having two 1.5 mm diameter apertures separated by 6.00 mm creating non-overlapping FOVs.


