
On the Dynamic Tensile Behaviour of Thermoplastic Composite Carbon/Polyamide 6.6 Using Split Hopkinson Pressure Bar


Department of Aeronautics, Imperial College London, Exhibition Road, London SW7 2AZ, UK
*
Author to whom correspondence should be addressed.
Materials 2021, 14(7), 1653; https://doi.org/10.3390/ma14071653
Submission received: 2 February 2021
/
Revised: 15 March 2021
/
Accepted: 22 March 2021
/
Published: 27 March 2021
(This article belongs to the Section Advanced Composites)
Abstract
:A dynamic tensile experiment was performed on a rectangular specimen of a non-crimp fabric (NCF) thermoplastic composite T700 carbon/polyamide 6.6 specimens using a split Hopkinson pressure (Kolsky) bar (SHPB). The experiment successfully provided useful information on the strain-rate sensitivity of the NCF carbon/thermoplastic material system. The average tensile strength at three varying strain rates: 700, 1400, and 2100/s was calculated and compared to the tensile strength measured from a standardized (quasi-static) procedure. The increase in tensile strength was found to be 3.5, 24.2, and 45.1% at 700, 1400, and 2100/s strain rate, respectively. The experimental findings were used as input parameters for the numerical model developed using a commercial finite element (FE) explicit solver LS-DYNA®. The dynamic FE model was validated against experimental gathering and used to predict the composite system’s behavior in various engineering applications under high strain-rate loading conditions. The SHPB tension test detailed in this study provided the enhanced understanding of the T700/polyamide 6.6 composite material’s behavior under different strain rates and allowed for the prediction of the material’s behavior under real-world, dynamic loading conditions, such as low-velocity and high-velocity impact.
1. Introduction
There has been a continuous, growing interest in the development and characterization of high-performance thermoplastic composites, primarily in the automotive and aerospace industry. In comparison to thermosetting composites, thermoplastic-based composite materials do not require specific cure schedule and can be processed, heated, and cooled more readily. On top of being recyclable [1], thermoplastics and thermoplastic composites comply with EU directive 2000/53/EC [2]: “the total percentage of preparation for reuse and recycling will be at least 85% of the average weight per vehicle and year”.
The mechanical characterization process of a material is critical in determining its reliability and mechanical performance, particularly under real-world applications under impact conditions, e.g., vehicle collision [3,4], bird strike [5,6], and sports impact [7]. Traditional standardized test procedures are typically performed under quasi-static conditions [8,9,10,11,12,13]. However, if a test specimen is ten millimeters long and is deformed at a loading rate of 1–100 m/s, the strain rate in the specimen is 102–104/s and conventional universal testing machines or load frames are not usually capable of achieving such loading rates. Therefore, high-rate loading conditions are beyond the scope of traditional material testing machines [14].
1.1. Characterisation of Dynamic Mechanical Properties of Composites Using Split Hopkinson Pressure Bar
To date, most studies found in the literature that were carried out on the dynamic mechanical properties of composite materials revolved around thermosetting composites [15,16,17,18,19,20] and compressive behavior [20,21,22,23]. Unlike the more commonly used thermoplastic composites that were reinforced with glass fibers [24], short fibers [25], basalt fibers [26,27]; very limited information can be found on in the literature on the dynamic properties, specifically, dynamic tensile properties of continuous carbon fiber-reinforced polymer (CFRP) composites [28,29,30,31], let alone the more recent carbon fiber-reinforced thermoplastic (CFRTP) composites [32]. Furthermore, the majority dynamic analysis of CFRTP focused on unidirectional (UD) fiber orientation [30,33] and very limited information can be found in relation to multidirectional [21,34,35] or bidirectional, especially non-crimp fabric (NCF). Also, in addition to studying the dynamic tensile behavior of UD carbon/thermoset composite, using a servo-hydraulic universal testing machine, Zhang et al. [33] only managed to achieve strain rates from 4 × 10⁻⁵/s to 160/s. Conversely, split Hopkinson pressure bar (SHPB) allows for much higher, if not the highest possible strain rates. The SHPB technique was implemented on a wide variety of materials, e.g., metals [36], concrete [37], coal [38], and adhesives [39]. Naturally, it was also adapted to the testing composite materials. In the past, this has largely been carried out in compression [40,41]. However, it was adapted for tension [34,35]. Using the SHPB technique, Hou and Ruiz [34] and Gilat et al. [35] reported achieving strain rates of up to 600/s on multidirectional carbon/thermoset composite systems.
Hence, there was a gap in the literature regarding the characterization of the dynamic tensile behavior of an NCF biaxial CFRTP composite, as presented in this study. Given the interest from various industries (as well as the industrial partners of Imperial College), e.g., automotive and aerospace to understand the strain-rate sensitivity of thermoplastic composites, the experimental results presented in this paper are valuable. Moreover, due to recent advancements in and advantages of NCF composites as well as newer NCF-based CFRTPs (such as the one presented in this paper), there is a need for its dynamic mechanical characterization prior to commercialization.
1.2. Numerical Model of SHPB Experiment
Numerical model development of SHPB experiments were performed on UD glass fiber-reinforced polymer [42], wood [43], and epoxy [44], but none were found on NCF bidirectional CFTRP. Therefore, there is an opportunity to discuss and describe the development of a numerical model of a CFRTP composite that incorporates the strain-rate dependency of the material.
Based on the results obtained from the SHPB experiment, a numerical model can be developed for the procedure and validated against the experimental findings. To the authors’ knowledge at the time of writing, there has not been a constitutive material model in commercial finite element (FE) that incorporates strain-rate sensitivity of a laminated composite material that can predict its behavior using an energy-based damage model, e.g., based on the translaminar/intralaminar mode I fracture toughness of the material.
The approach proposed in this paper could assist in future numerical model development and should allow for the prediction the structural and mechanical behavior of the component made of similar, strain-rate sensitive materials under comparable loading conditions, and real-world applications e.g., low-velocity impact or high-velocity impact applications [45,46,47].
A numerical model that describes the damage characteristics of laminated composites was reported by Konstantinos et al. [48]. However, the impact energies considered were merely one to two joules. Therefore, knowing the strain-rate sensitivity in this case, was not critical as the mechanical behavior of the composite ought to be very similar to its quasi-static behavior. In comparison, the low-velocity impact energies that were of interest in [45] were 40, 100, and 160 J. Hence, until the dynamic mechanical properties of the composite system at different strain rates have been characterized, it is uncertain whether the (known) quasi-static properties could be implemented in the numerical model.
2. Materials and Manufacturing Methods
2.1. Material System and Preparation
The CFRTP material system used in this research was a NCF biaxial (0°/90°) T700 (continuous) carbon pre-impregnated with polyamide 6.6 veils (T700/PA6.6) The stitching material of the T700/PA6.6 was also PA6.6. The material was supplied by THERMOCOMP (UK) project [49] partners.
The neat material and mechanical properties of the constituent materials of the composite are shown in Table 1. However, since the material system is proprietary, the mechanical properties of the laminates were obtained by the author using a series of standardized and non-standardized testing described in [47] and listed in Table 2.
The densities of both CFRTP material systems were measured using a pycnometer after being stored in an oven at 40 °C for three days. This was done to completely eliminate moisture. The density of the T700/PA6.6 was measured to be 1485 kg/m3.
The fiber-volume-fraction (FVF) of the material system was quantified using thermogravimetric analysis (TGA) to be 52%. The process was documented and described in [55].
2.2. Manufacturing Process and Specimen
The laminates of the NCF biaxial 0/90 T700/PA6.6 CFRTP were manufactured using a hand lay-up method and processed using thermoforming method using a laboratory hydraulic press (HÖFER, Taiskirchen, Austria) at 275 °C. Each laminate comprised of two plies of the T700/PA6.6 with the following layup sequence: 0/90/90/0.
The recommended dwell time was 10 min. The heating rate was set to 15 °C/min, following the manufacturer’s recommendation. The recommended pressure for the thermoforming process was 1.5 MPa. The demolding temperature was 25°. The average thickness of the manufactured laminates was measured to be 0.65 mm.
2.3. Experimental Setup
At the time of primary author’s visit to Purdue University, two SHPBs were found to be suitable for the planned experiment: (i) aluminum SHPB and (ii) steel SHPB. Based on the specimen size and the limits of the load cell, it was calculated that the aluminum and steel tension SHPB can achieve strain rates of up to 1500 and 3000/s, respectively. Therefore, it was decided that the dynamic tension experiment would be conducted at three different strain rates: 700, 1400, and 2100/s. The wave dispersion in the experiments was minimized using pulse shaping techniques, where a small piece of material was placed on the end of the incident bar, known as the ‘pulse shaper’. Based on the information provided to the author, the pulse shaper material used during the experiment was made of copper.
The rectangular sample was placed into a fixture (Figure 3a). This cylindrical fixture consists of a flat rectangular groove where a (rough) section of a file was glued onto. The surface roughness of the file provides the necessary friction required to hold the specimen in place. This fixture was then screw into the bar (SHPB) via a threaded connection. Figure 3b indicates how the specimen was held in the fixture and the 3 mm gauge length. Figure 3c illustrates the typical tensile fracture of the specimen after the test.
3. Data Reduction
3.1. Energy Calculation
All of the Equations (1)–(49), which are presented here were obtained from Chen and Song [14]. Based on the one-dimensional wave propagation theory, the dynamic stress-strain response of the specimen can be derived as follows
where is the material Young’s modulus. Hence, the one-dimensional equation of motion is
where is the displacement and is the density of the material. Combining Equations (1) and (2)
Therefore, the equation of motion in the bar for a wave of infinite wavelength along direction can be written as follows
where is the wave velocity. Comparing Equations (3) and (4), can be rewritten as
The D’Alembert’s equation for wave equation (Equation (4)) is
where the function and correspond to a wave propagating in the positive and negative -direction, respectively. If the wave propagates only in the positive -direction (Figure 4), Equation (6) reduces to
and if the wave propagates only in the negative -direction, Equation (6) reduces to
Considering the wave travels in the positive -direction, using Equation (7), the strain in the bar can written as
and Hooke’s law can be applied to determine the stress as follows
and force, , on the cross-sectional area of the bar, can be expressed as
Differentiating with respect to time, yields
where is the particle velocity in the -direction with respect to time, . Combining Equations (9) and (13), the particle velocity
and the ratio of the applied force on the bar and particle velocity, is the impedance, , where
Based on Equation (14), by substituting the Young’s modulus, , the impedance, , can be expressed as
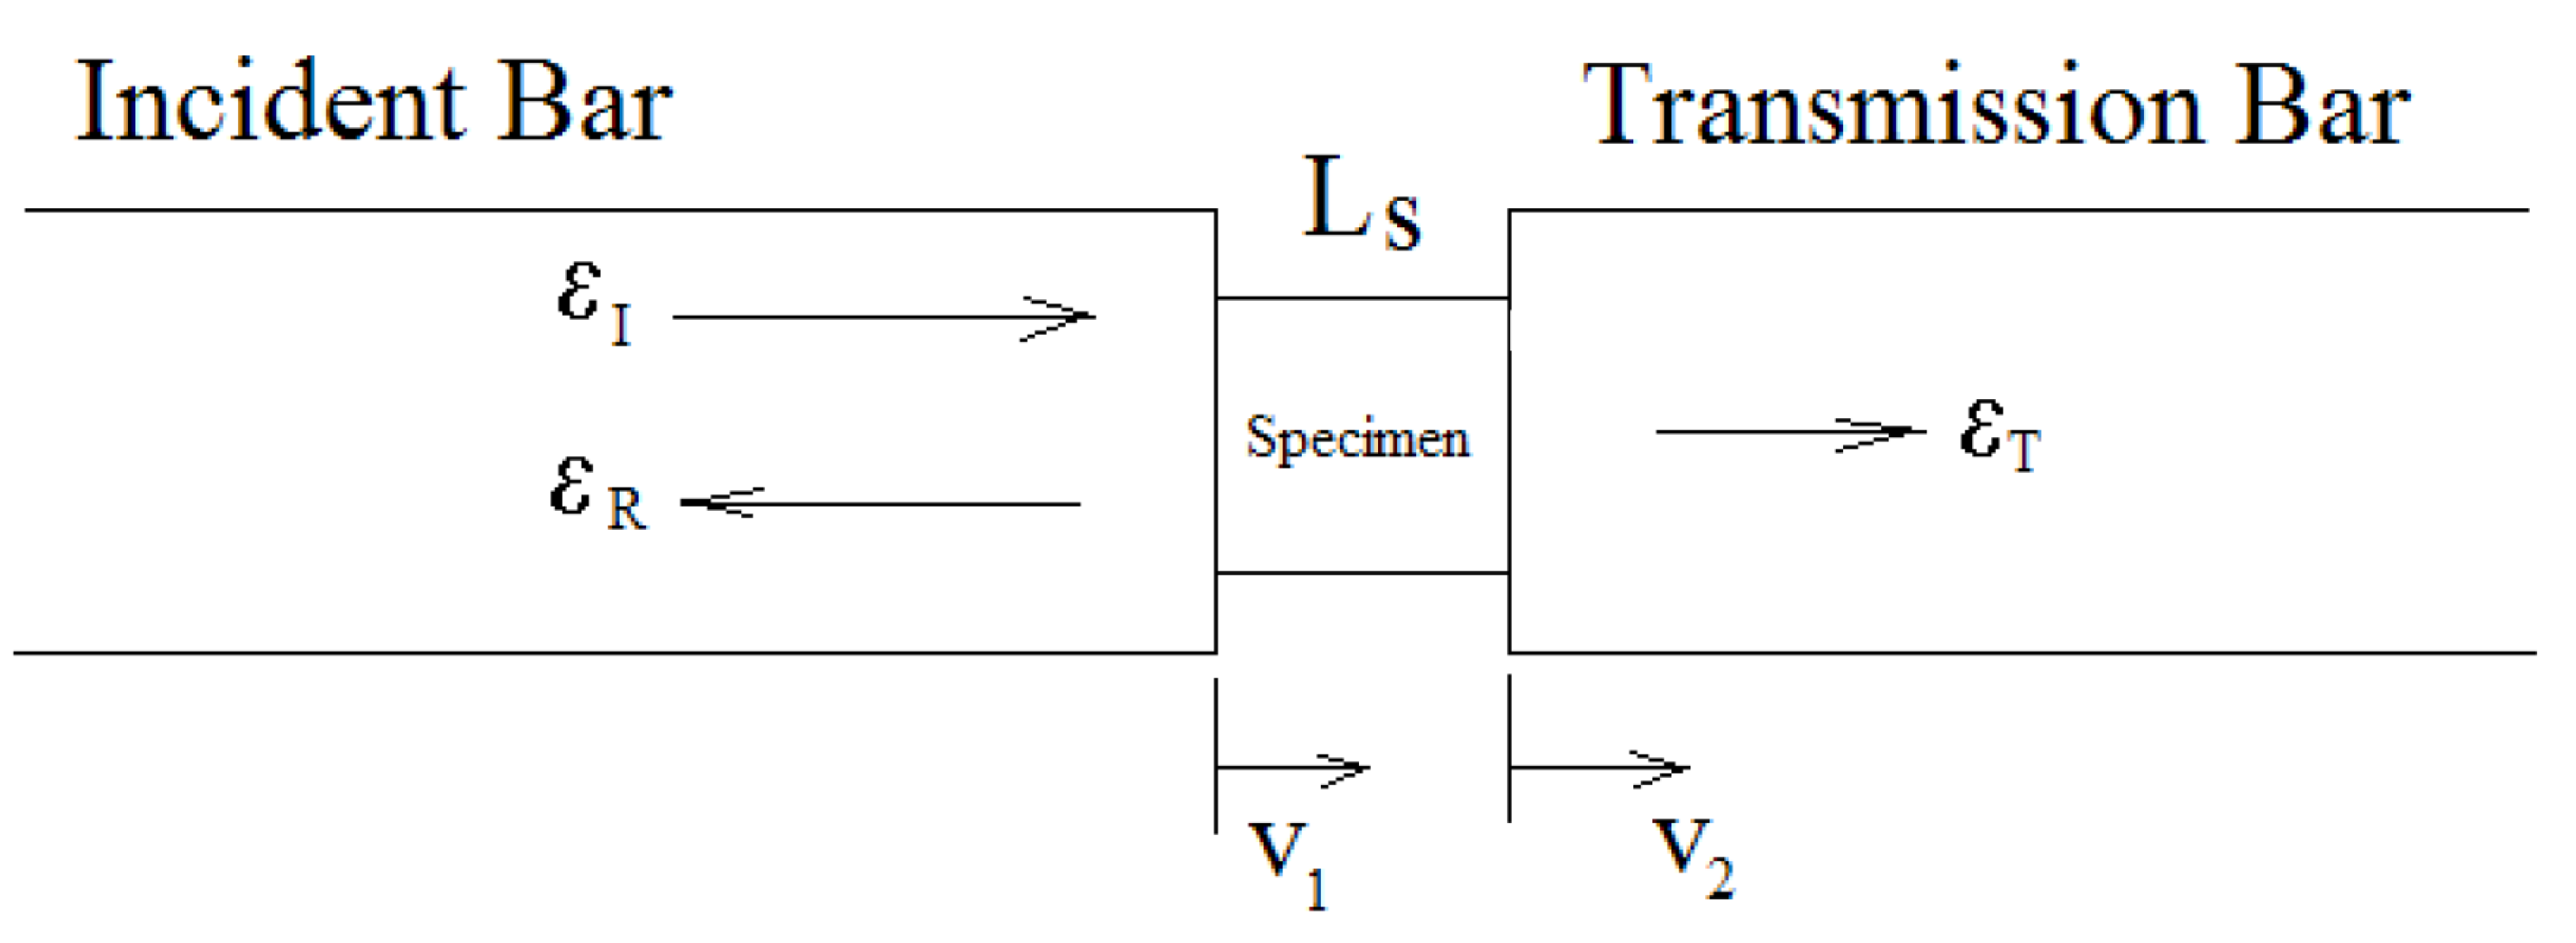
On the assumption that the stress waves propagate in both the transmission bars without dispersion (where the pulses recorded by strain gauge represent those at the bar ends, in contact with the specimen), one-dimensional stress wave theory relates the particle velocities at both ends of the specimen to the three strain pulses recorded as illustrated in Figure 5.
Thus, and can be expressed as
where the subscripts, , and correspond to the incident, reflected, and transmitted pulses, respectively. The average engineering strain rate, and strain, in the specimen can be written as:
where is the initial length of the specimen. The stresses at both ends of the specimen can be calculated using the elastic relations
where and are the cross-sectional areas of the bar and test specimen, respectively. is the Young’s modulus of the material of the bar. The specimen is assumed to be under stress equilibrium in SHPB experiment. Therefore, this assumption must be satisfied in the dynamic characterization of the material properties. Hence, the sample deforms uniformly and the response obtained is the average response over its total volume. This is regarded as a good representative of the point-wise valid material behavior. So,
and from Equations (20) and (21),
and Equations (18), (19), and (21) can be simplified as
The (average) elastic strain energy, , associated with the incident wave can be calculated as follows using the incident strain,
where is the deformed volume in the incident bar. Nonetheless, during the stress wave propagation, only a section of the incident bar is involved in the elastic deformation following the incident pulse. Thus, the deformed volume, in the incident bar is dependent on the loading duration and the cross-sectional area of the bar. This can then be expressed as follows
where is the loading duration, which can be described by the following equation
where is the elastic wave speed of the striker material. The stress of a linearly elastic bar,
Therefore, the elastic strain energies associated with the reflected, , and transmitted waves, , can be expressed as follows
Hence, the influence of elastic strain energy in the bars in relation to the specimen deformation can be calculated as
or simplified as
when the specimen is under dynamic stress equilibrium. The kinetic energy of the incident bar, , after the incident wave propagates can be written as
where is the mass and is the particle velocity of the deformed section of the incident bar. The mass, , and the velocity, , can be gathered from
Using Equations (36) and (37), Equation (35), can be rewritten as
and similarly, the kinetic energy corresponding to the reflected, , and transmitted, , pulses can be expressed as
Assuming that the specimen is in stress equilibrium, the relationship between the specimen deformation and kinetic energy can be written as
Considering linear elastic bars, the Young’s modulus of the bar, , can also be expressed as
and Equation (41) will now become
where Equation (43) is now in the same form as Equation (34). Based on the assumption of perfectly plastic response, the deformation energy can be simplified as
where and are the initial cross-sectional area and length of the sample, respectively. is the yield strength (expressed in Equation (45)) and is the plastic strain of the specimen (described by Equation (46)).
Now, Equation (44) can be written as
where it can be concluded that the energy coming from the elastic strain energy in the bars yields half of the energy necessary for the plastic deformation and the remaining half is contributed by the kinetic energy.
3.2. Stress Calculation from Raw Signals
In the SHPB experiment, the raw signals consisting of the incident, reflected, and transmitted pulses were processed and plotted. The properties of both aluminum and steel SHPB are listed in Table 3.
4. Experimental Results and Discussion
4.1. Relationship between Tensile Strength and Strain Rate
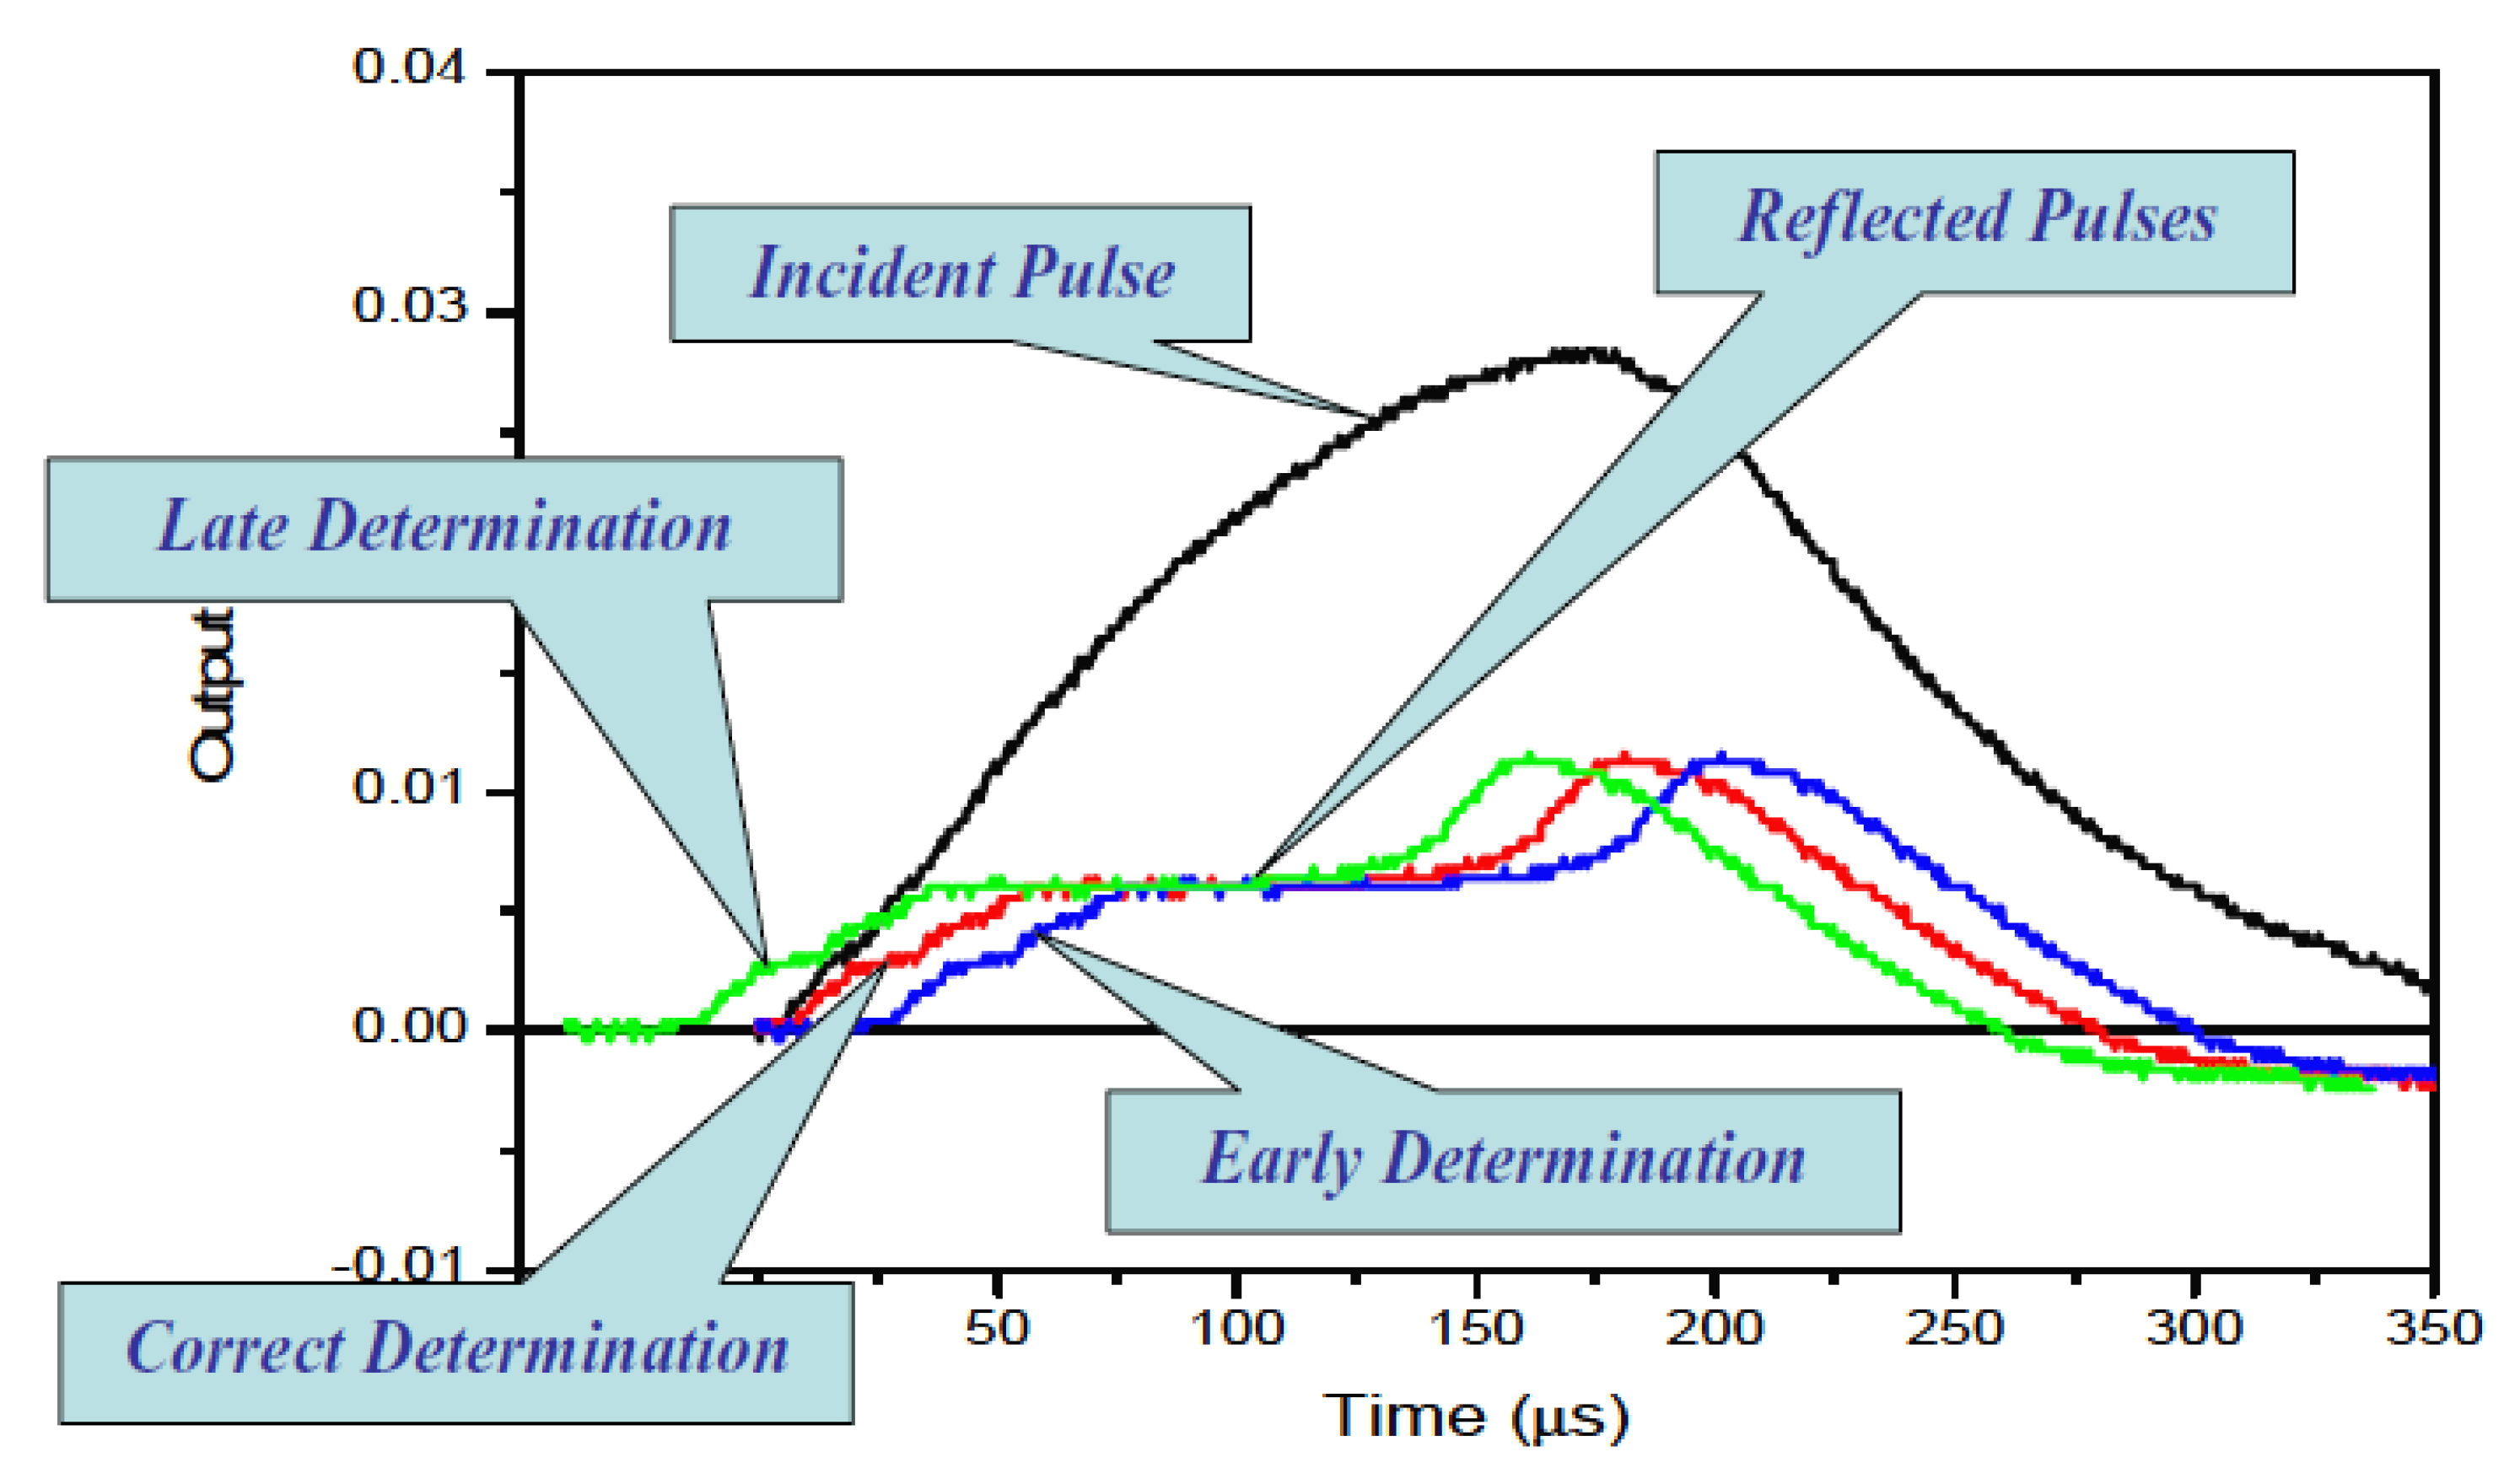
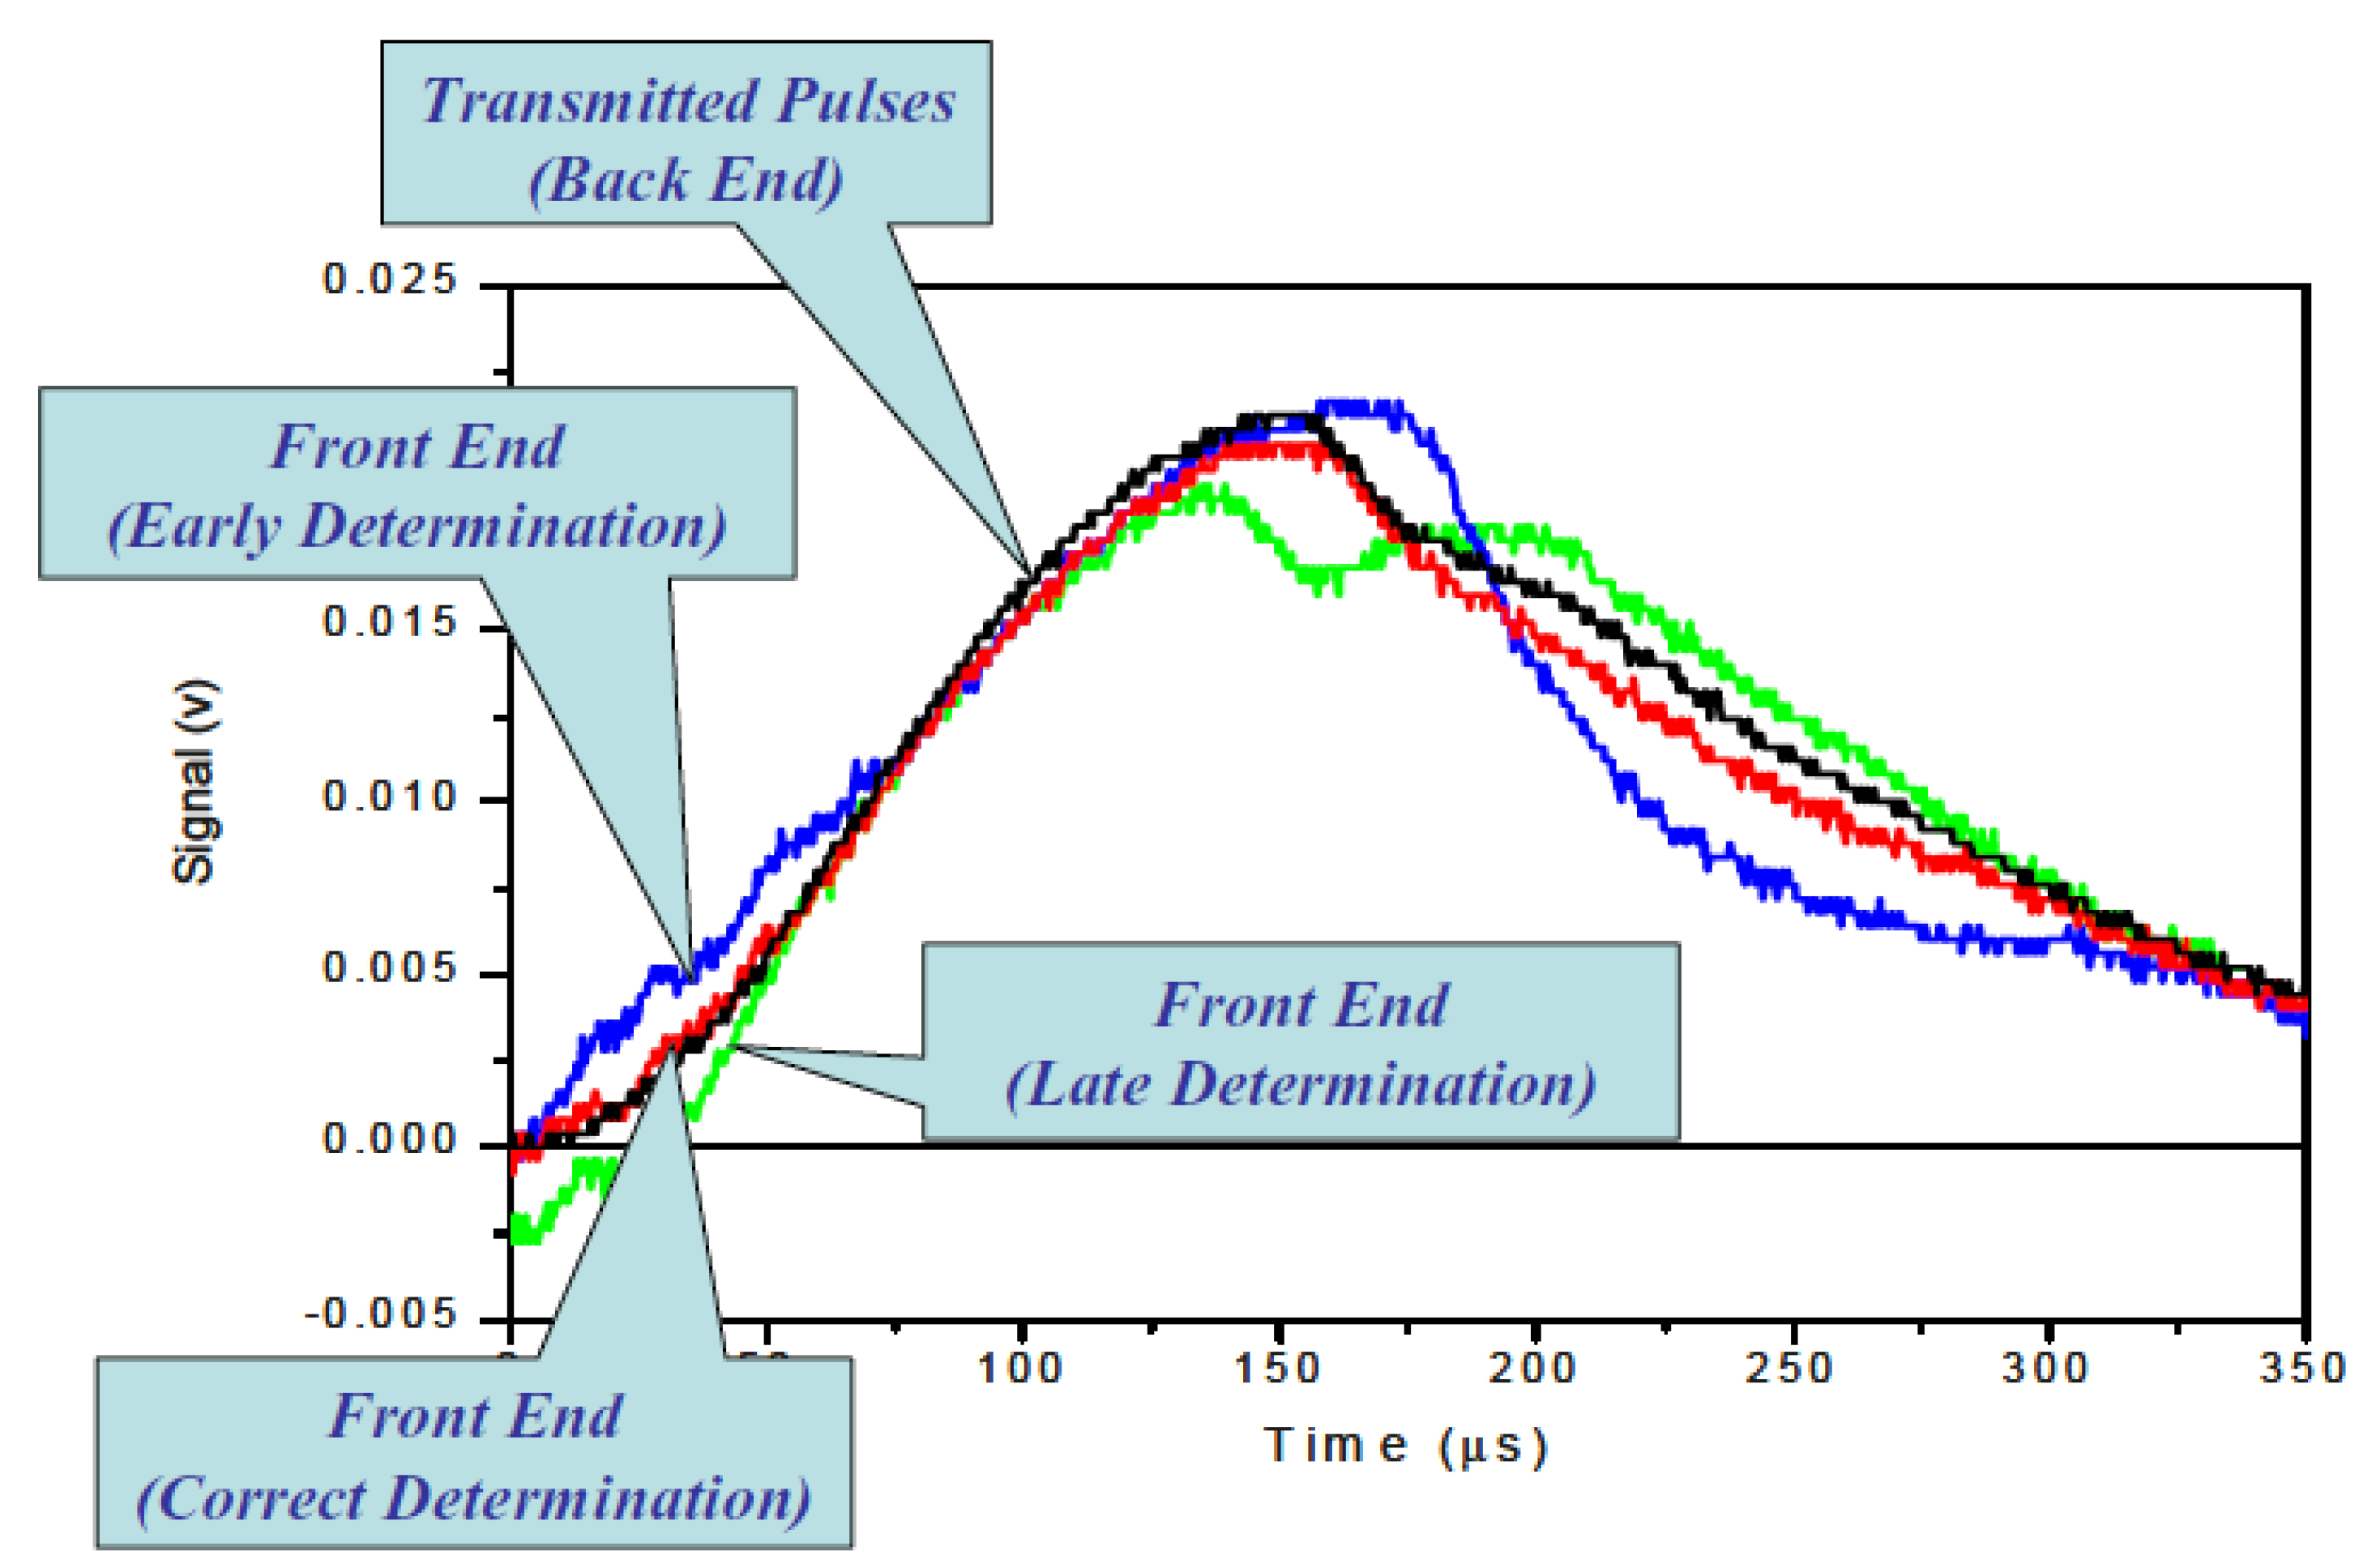
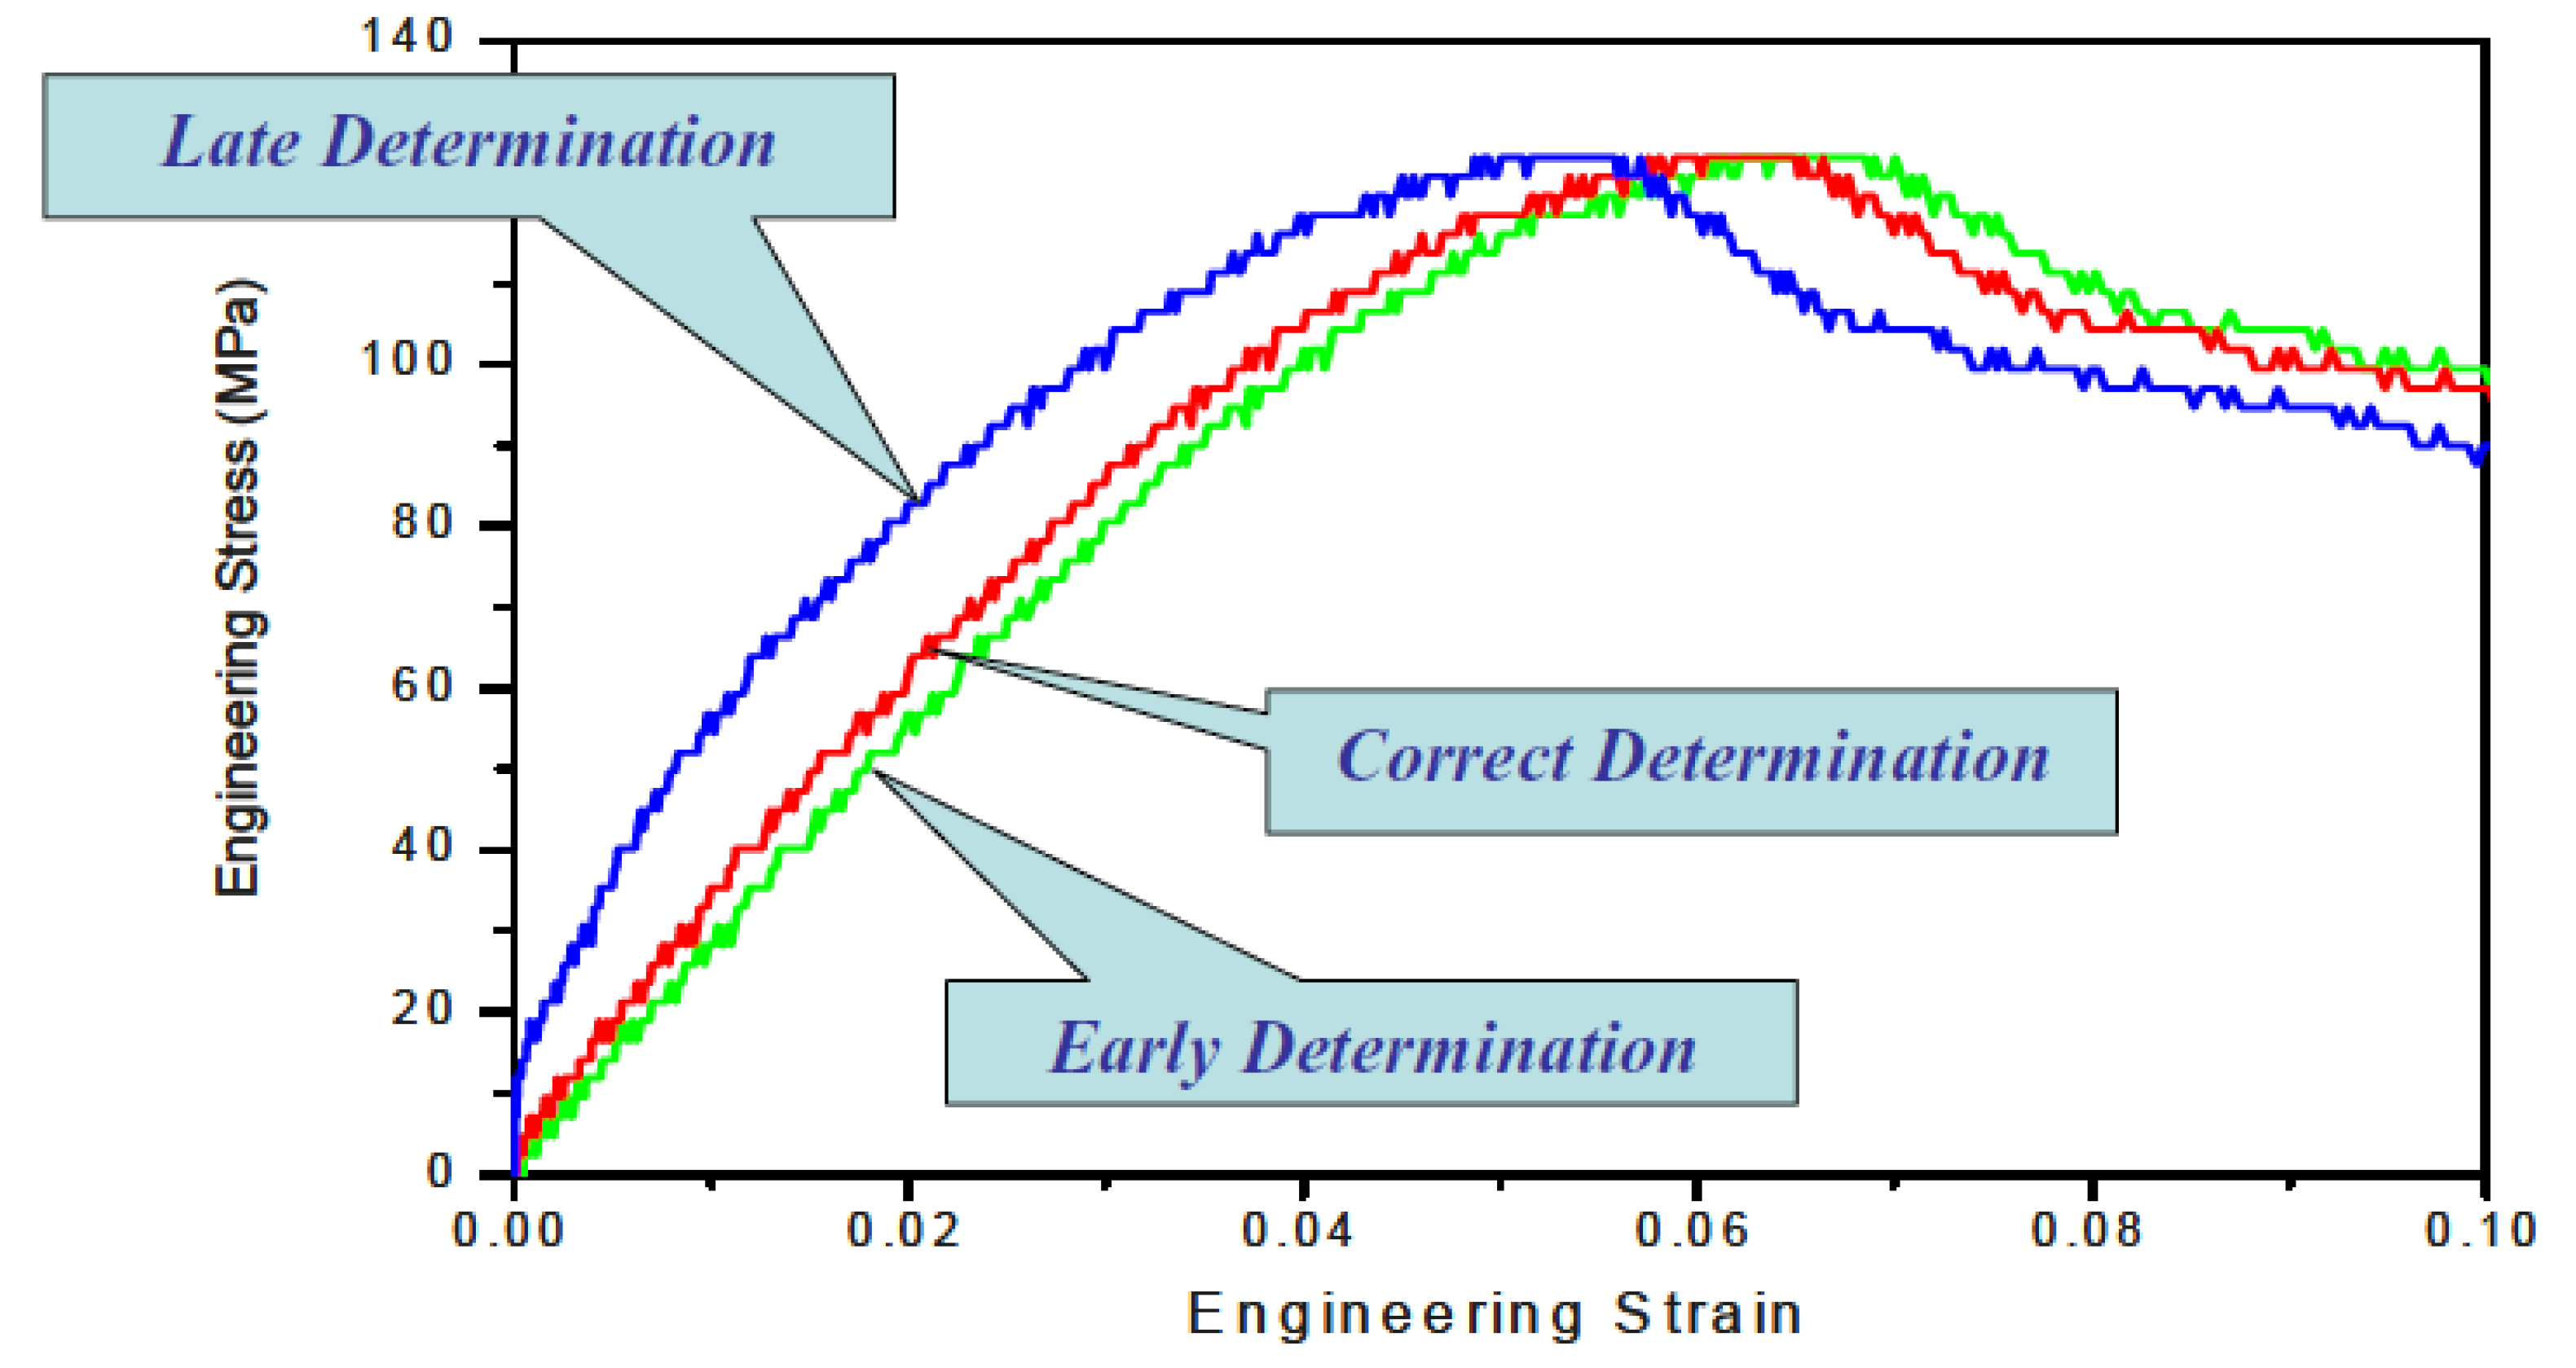
Figure 6 illustrates the correct and incorrect starting-point determinations of the reflected pulse for a certain incident pulse. Given that the experiment was correctly designed, the accurate determination of the starting point corresponds to the stress equilibrium across the specimen length. Incorrect starting points of the reflected pulse will result in erroneous calculation of the force at the initial (front) end of the specimen, which will provide a wrong assessment of the dynamic stress equilibrium (depicted in Figure 7). Such incorrect determination of the starting point leads to erroneous stress–strain curves (shown in Figure 8).
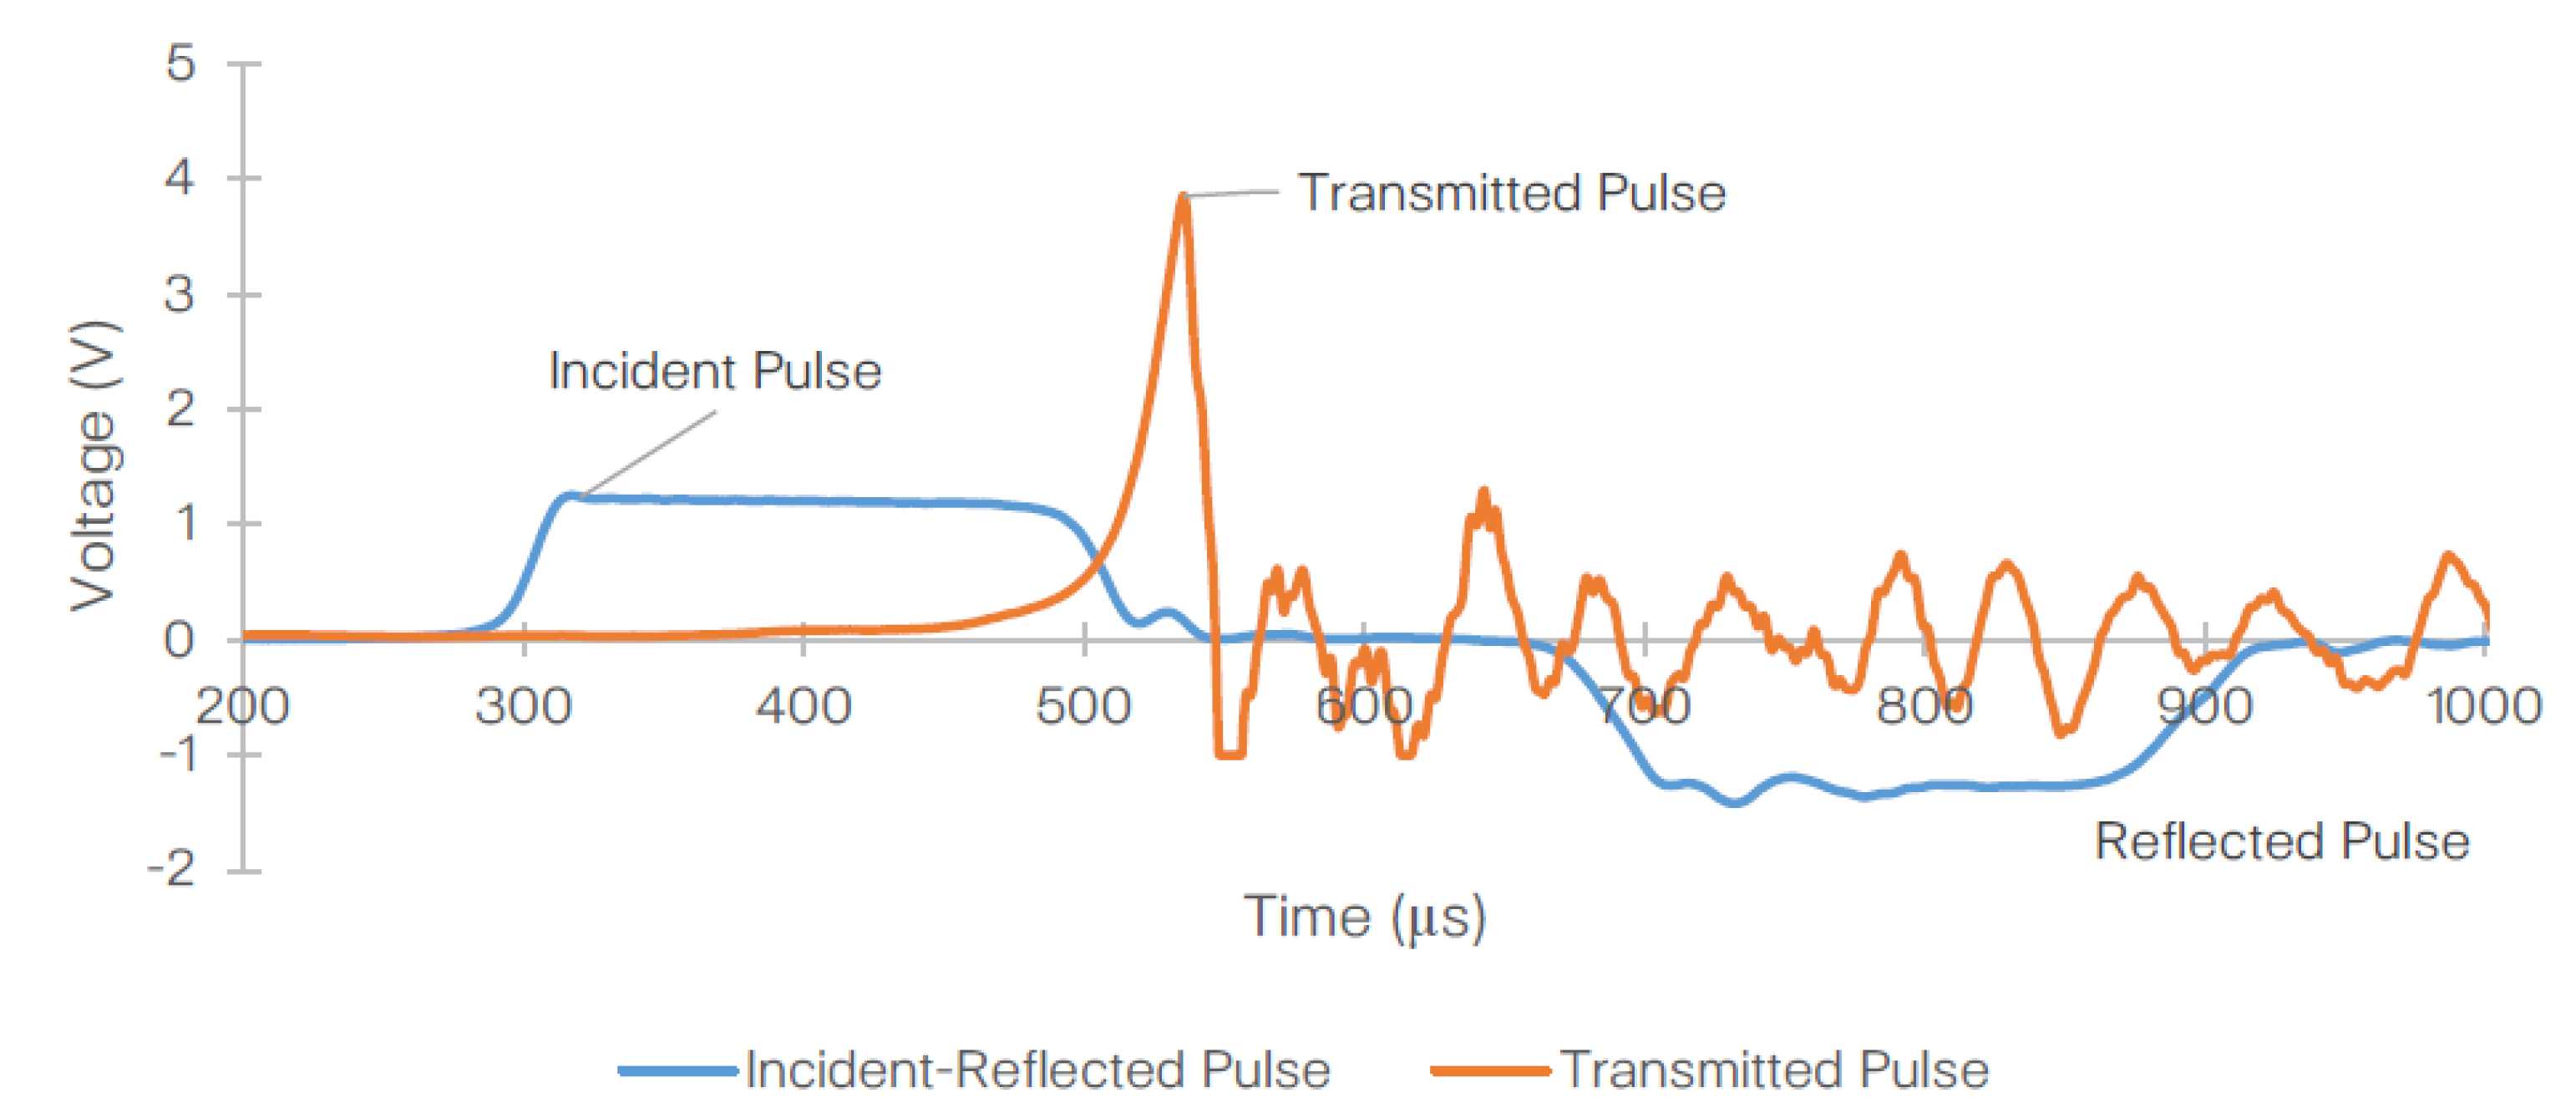
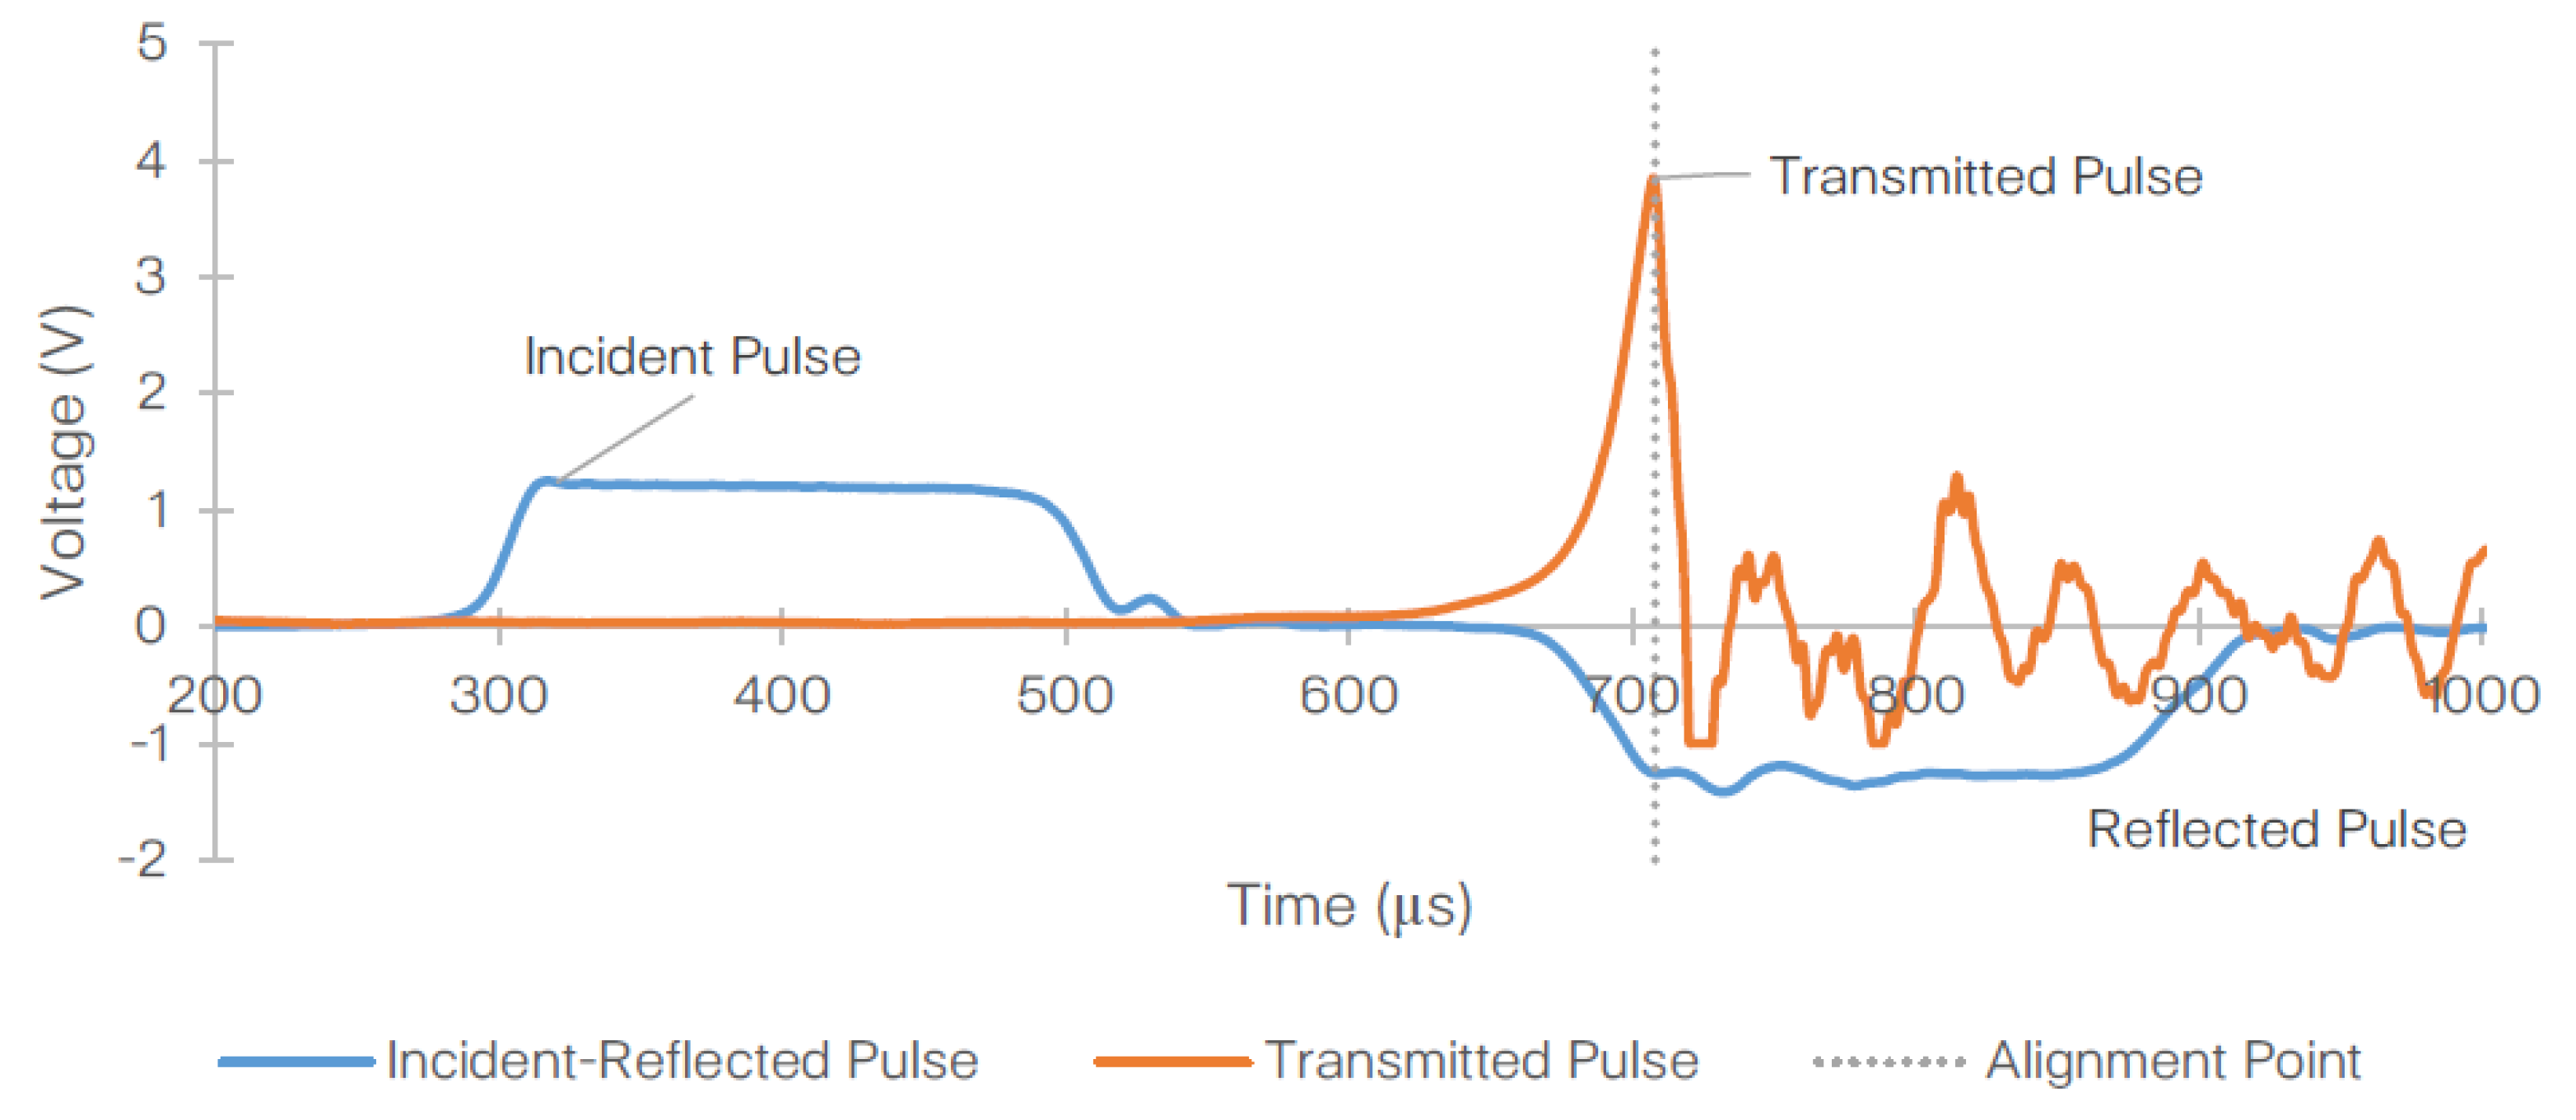
Figure 9 shows the representative stress wave signals obtained from the SHPB test at 2100/s strain rate. Evidently, the transmitted and reflected pulses are misaligned. Therefore, prior to performing the calculations detailed in Section 3.1 and Section 3.2, the reflected and transmitted waves must be aligned (as shown in Figure 10), where the peak of the transmitted pulse is now matching the (reverse) peak of the reflected pulse. The data obtained throughout the test reached saturation beyond peak force. The sampling rate on the data acquisition system was 0.2 µs.
Using Equations (48) and (49) and those discussed in Section 3.1 and Section 3.2, the stress and strains were calculated and plotted for each strain rate.
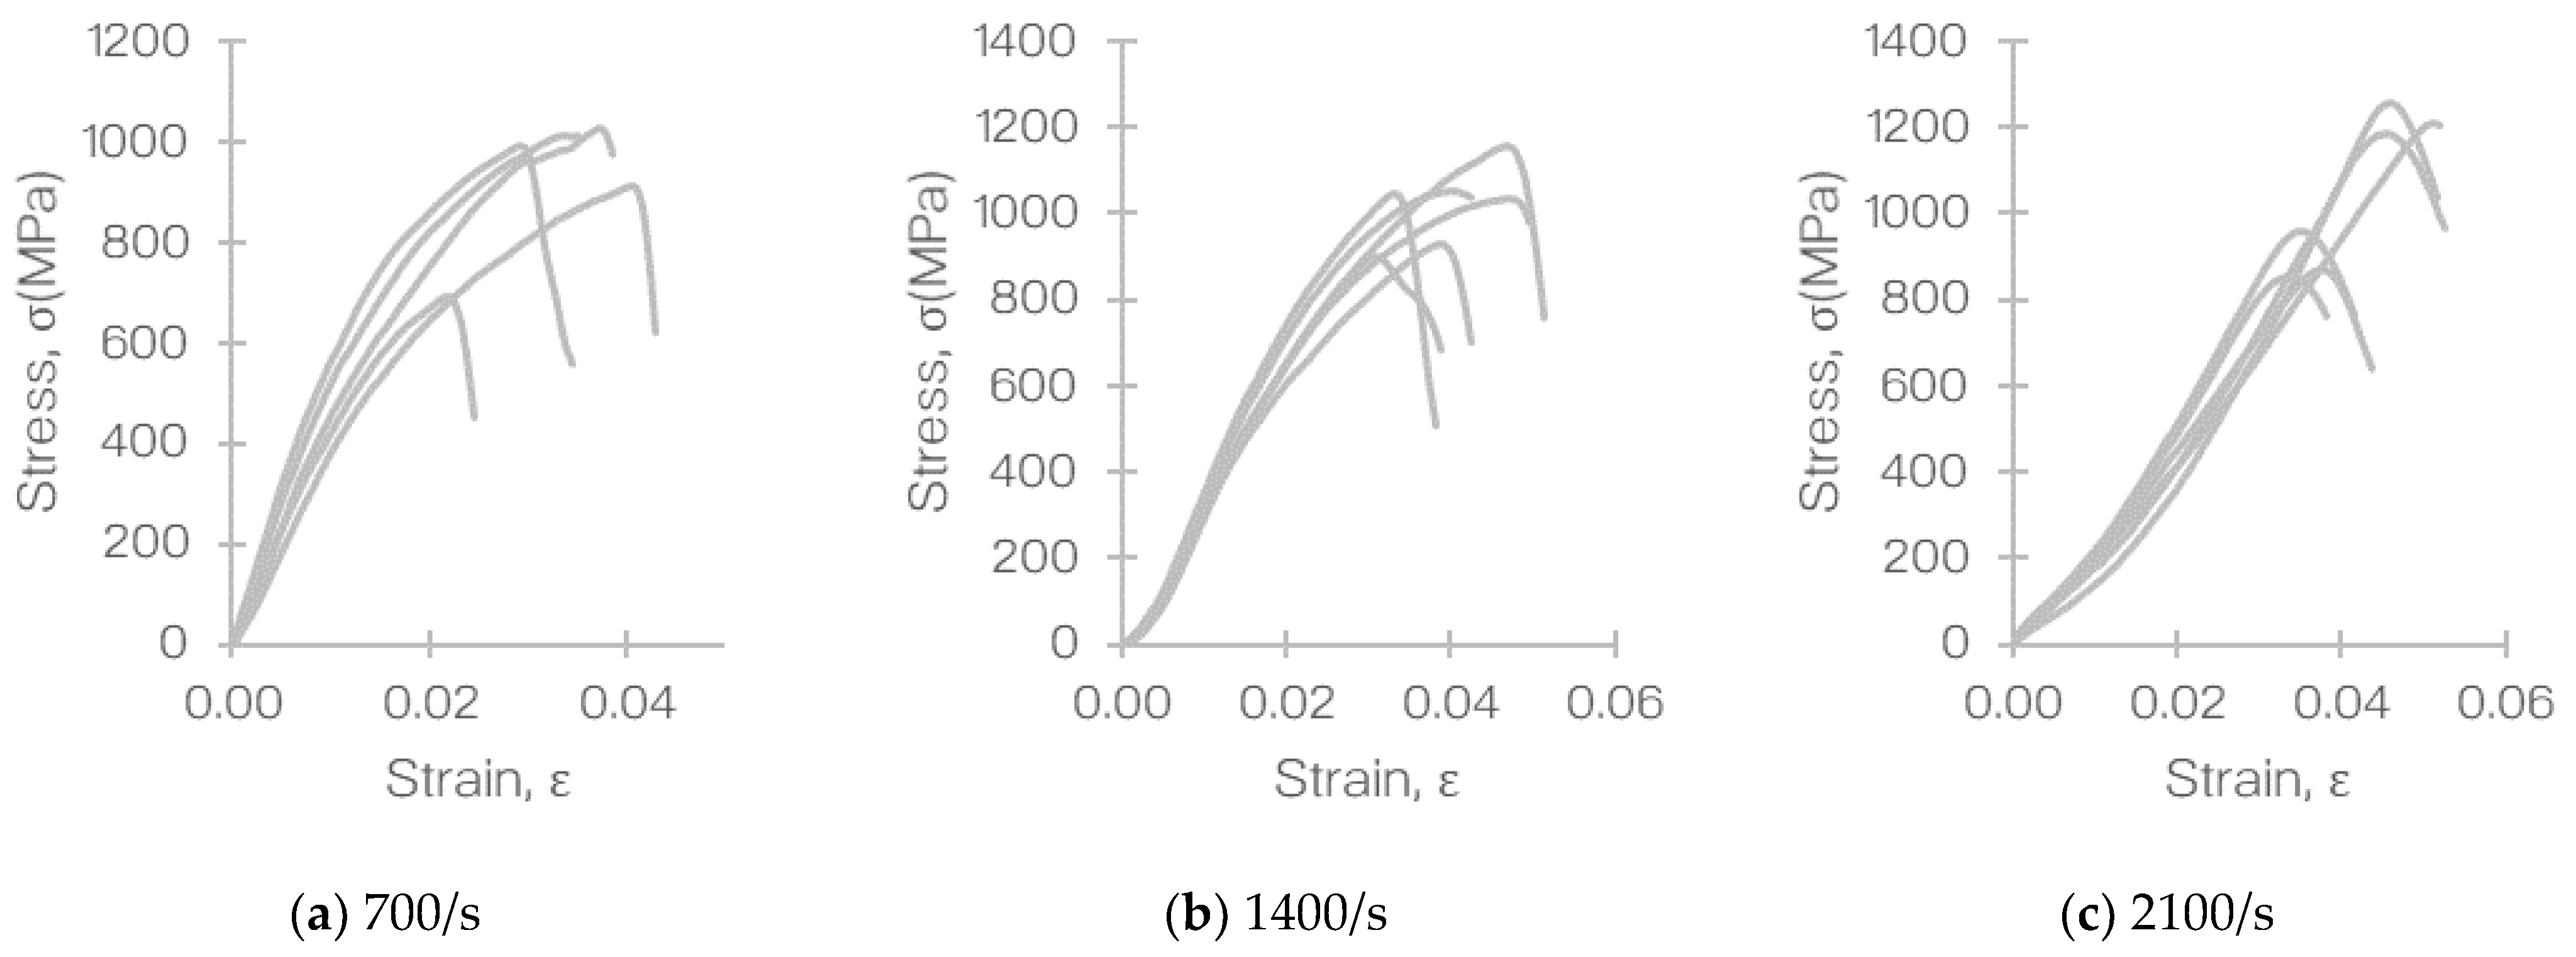
The stress-strain relationship observed in the experiments at the three different strain rates is illustrated in Figure 11. Based on this, the average strengths were calculated and presented in Table 4. The average tensile strengths at 700, 1400, and 2100/s were 950 (CV = 3.3%), 1140 (CV = 7.8%), and 1332 MPa (CV = 8.5%), respectively. The variation seen in the experiment was predominantly caused by the marginal discrepancy in the quality of the coupon samples that were cut from different areas of the laminated composite panel. However, the CVs reported here were found to be comparable to variation seen in the standardized and non-standardized tests when characterizing the material [47].
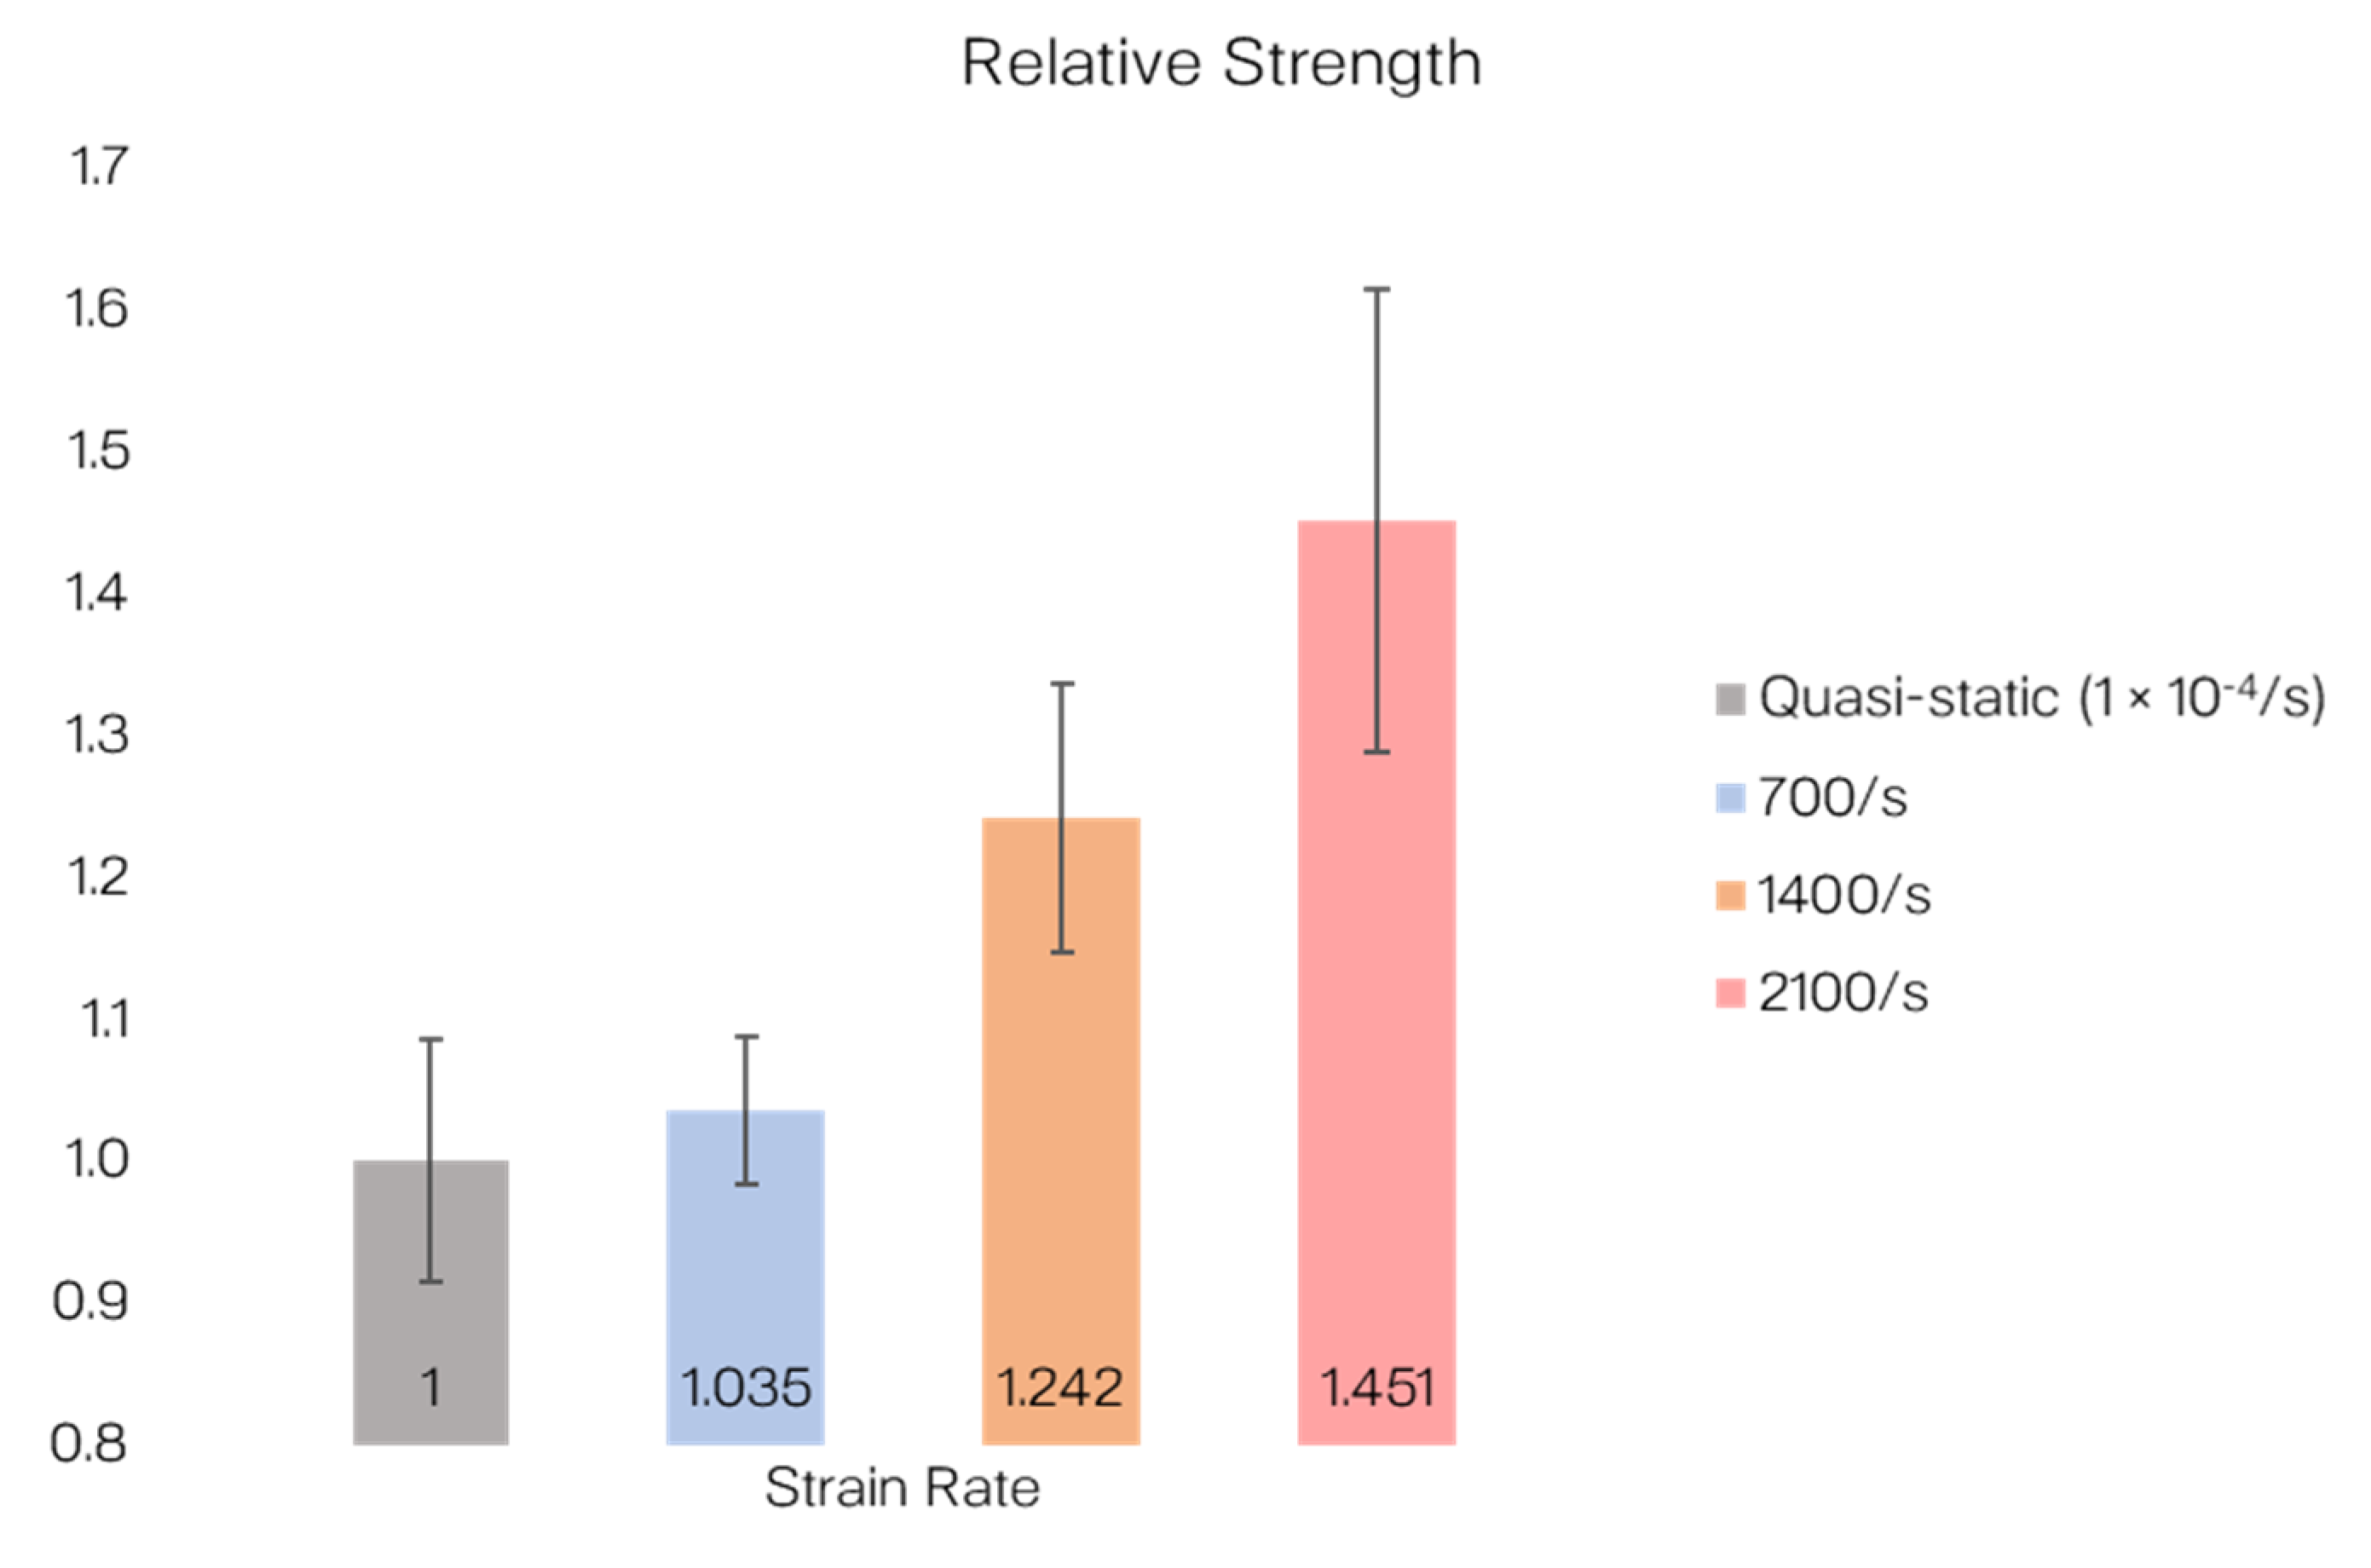
In comparison to the quasi-static results (obtained from a standardized test [56] in [47]), the average strengths obtained from the dynamic SHPB tests were higher: +3.5% at 700/s, +24.2% at 1400/s, and +45.1% at 2100/s. Figure 12 illustrates the relative tensile strengths of the T700/PA6.6 specimens compared to the standardized quasi-static test.
It must be noted that a nonlinearity (denoted by the curvature) in the stress–strain behavior of the T700/PA6.6 was observed in Figure 11 and found to be more dominant at higher strain rates, which was predicted. This nonlinearity was believed to be contributed by the following:
- Geometrical effects of the fixtures used and threaded connection between the fixtures and the bar
- Pulse dispersion that was caused by the wave that propagates through the bar, which had to travel through the threads of the fixture, the fixture, and then the specimen
- Viscoelasticity of the interface between the fixture and the file as the file was glued to the fixture using an epoxy-based glue (which is viscoelastic)
4.2. Experimental Conclusion
Therefore, given the nature of the novel SHPB test setup and its limitations, the apparent (slight) nonlinearity of the stress-strain curves was expected. Moreover, it was physically and mechanically natural for the (three) factors contributing towards the nonlinearity to be more pronounced at higher strain rates.
In conclusion, it was found that the T700/PA6.6 CFRTP system was influenced by the strain-rate effect, where the tensile strength increases as the strain rate increases. Although the exact information on the strain-rate dependency of this specific fiber-matrix combination, the results were consistent with a wide variety of similar thermoplastic composite laminates [57], where significant nonlinear and strain rate dependency behavior have been observed.
5. Finite Element Model of the Tension SHPB Experiment
5.1. Model Description
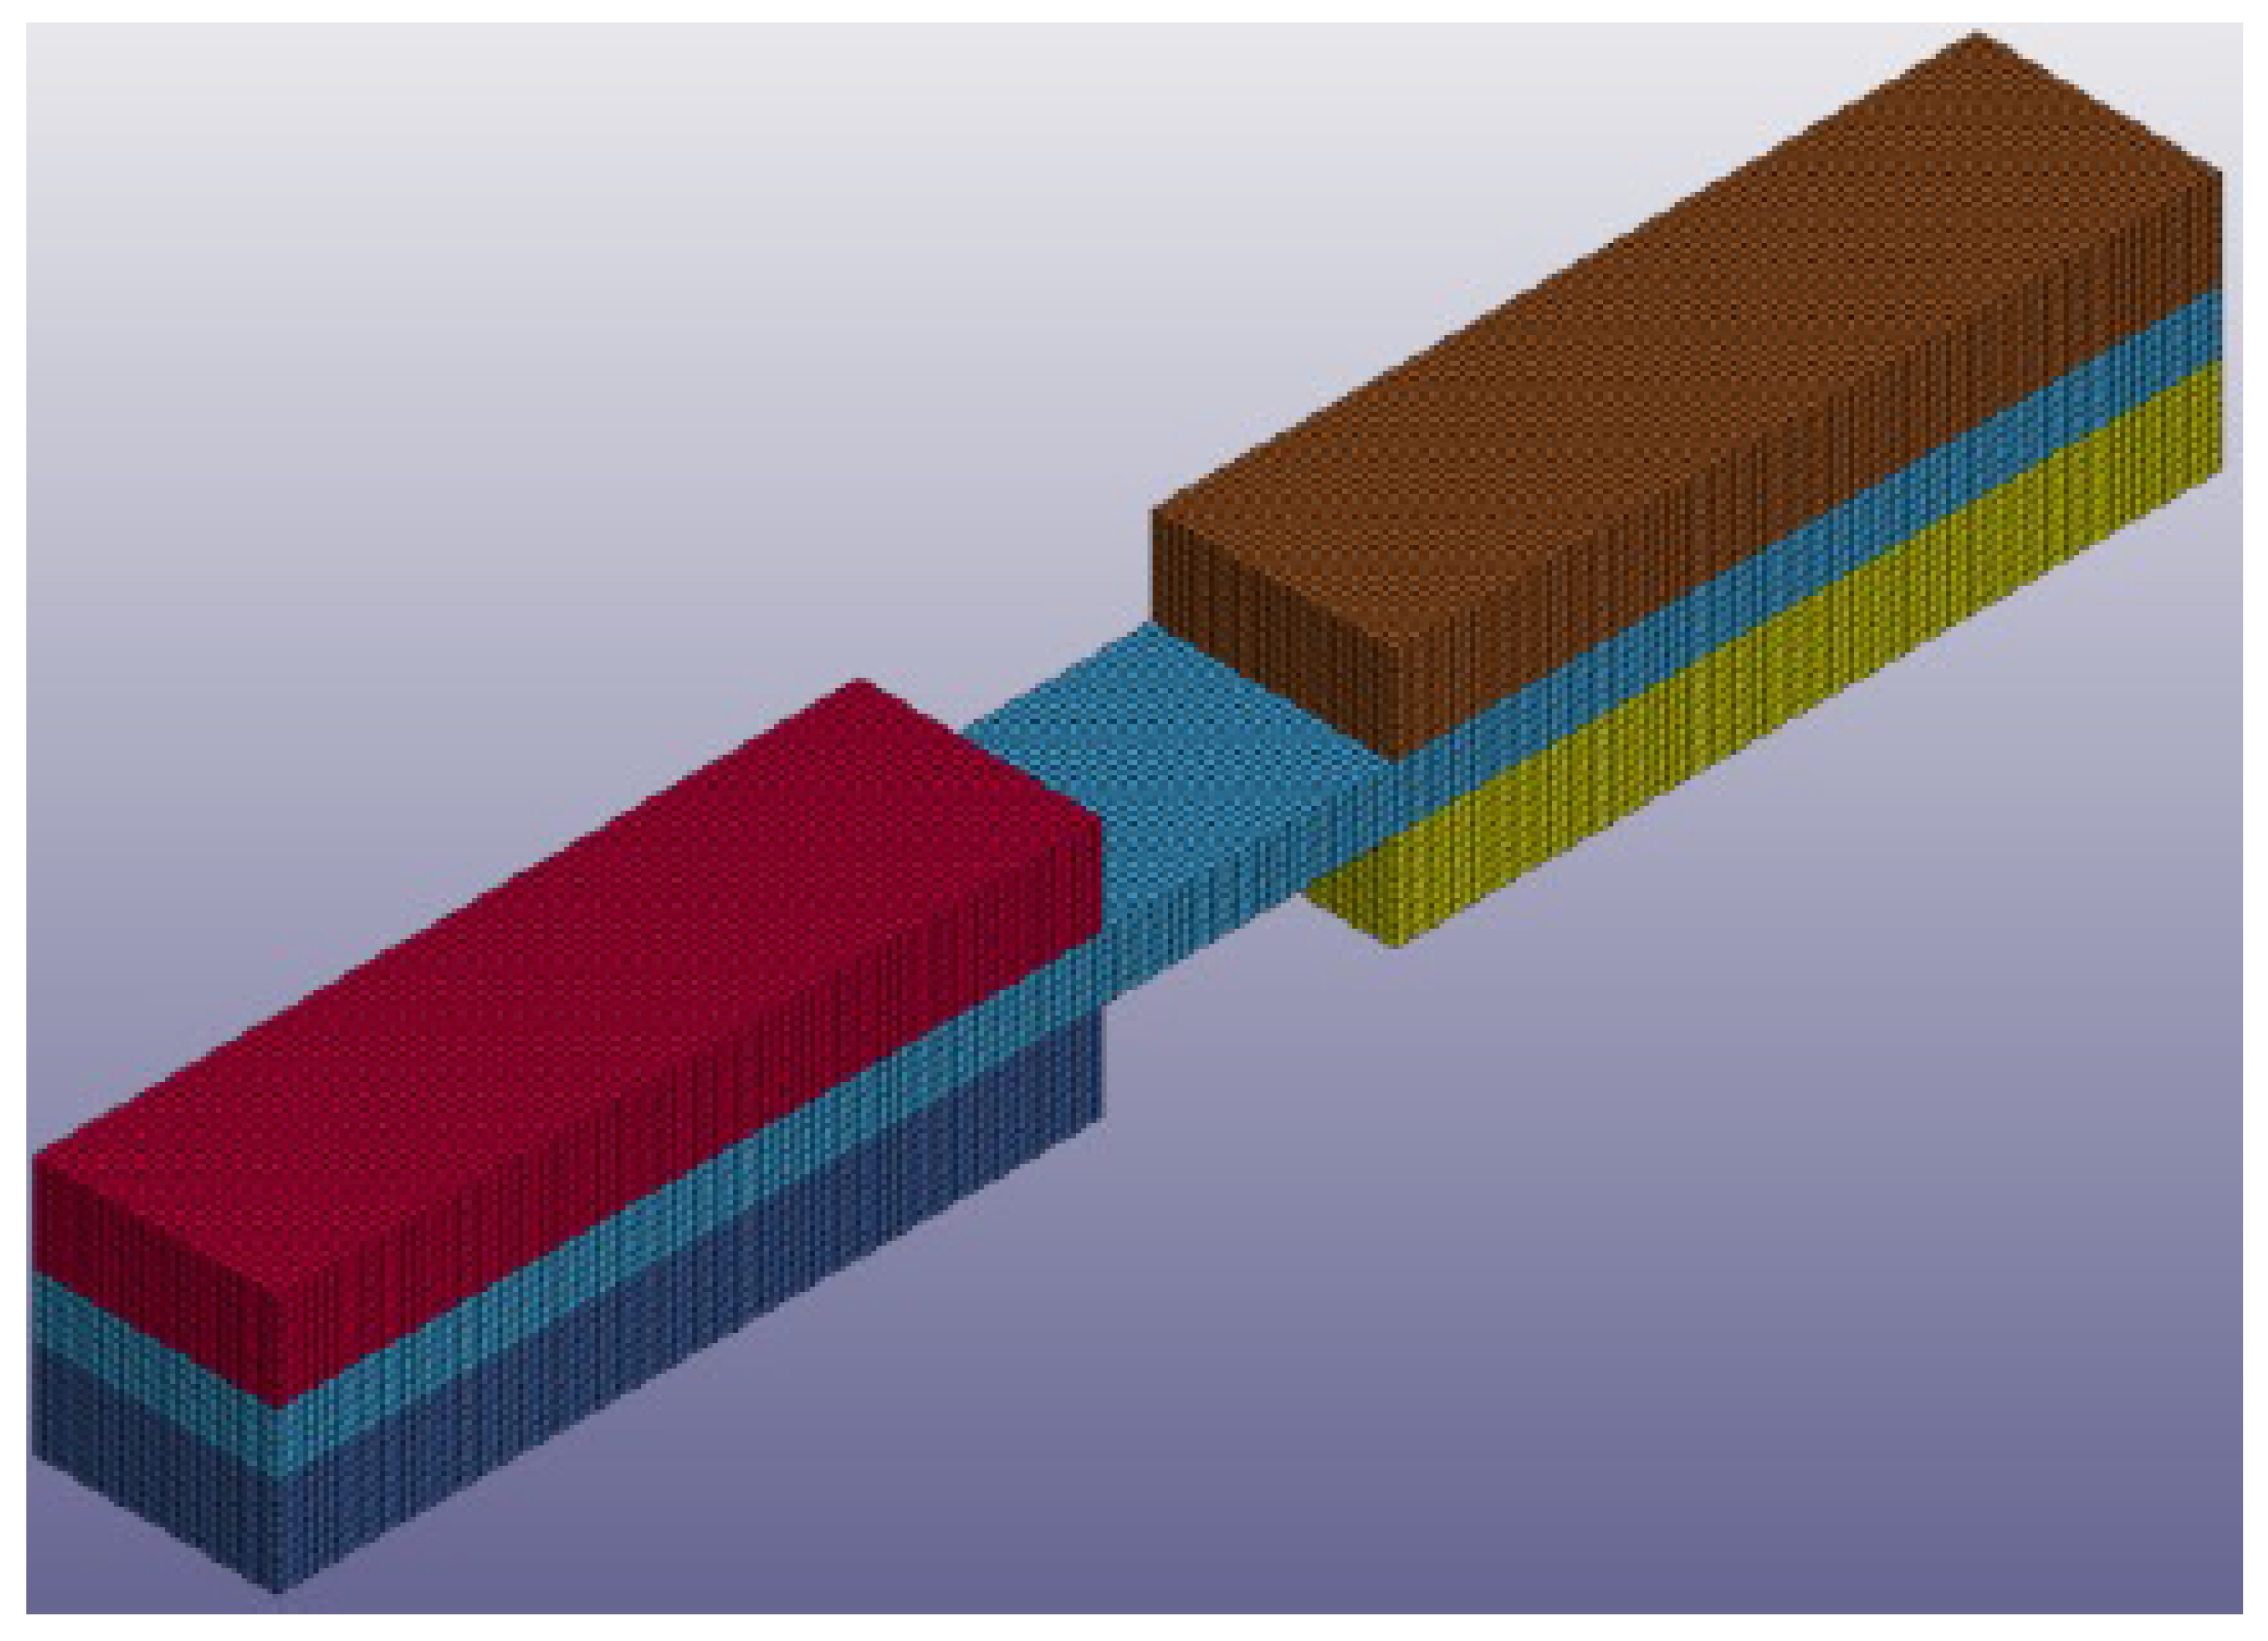
To simulate the SHPB experiment, a dynamic finite element (FE) model was developed in LS-DYNA® R8.1.0 (R8.105896) (LSTC, Livermore, CA, USA). For simplification, the model was composed of a section of bespoke SHPB (rectangular) fixture that was in contact with the specimen and the specimen itself (Figure 13), not the entire (cylindrical) SHPB. The boundary conditions and specimen constraints were set to mimic the actual test.
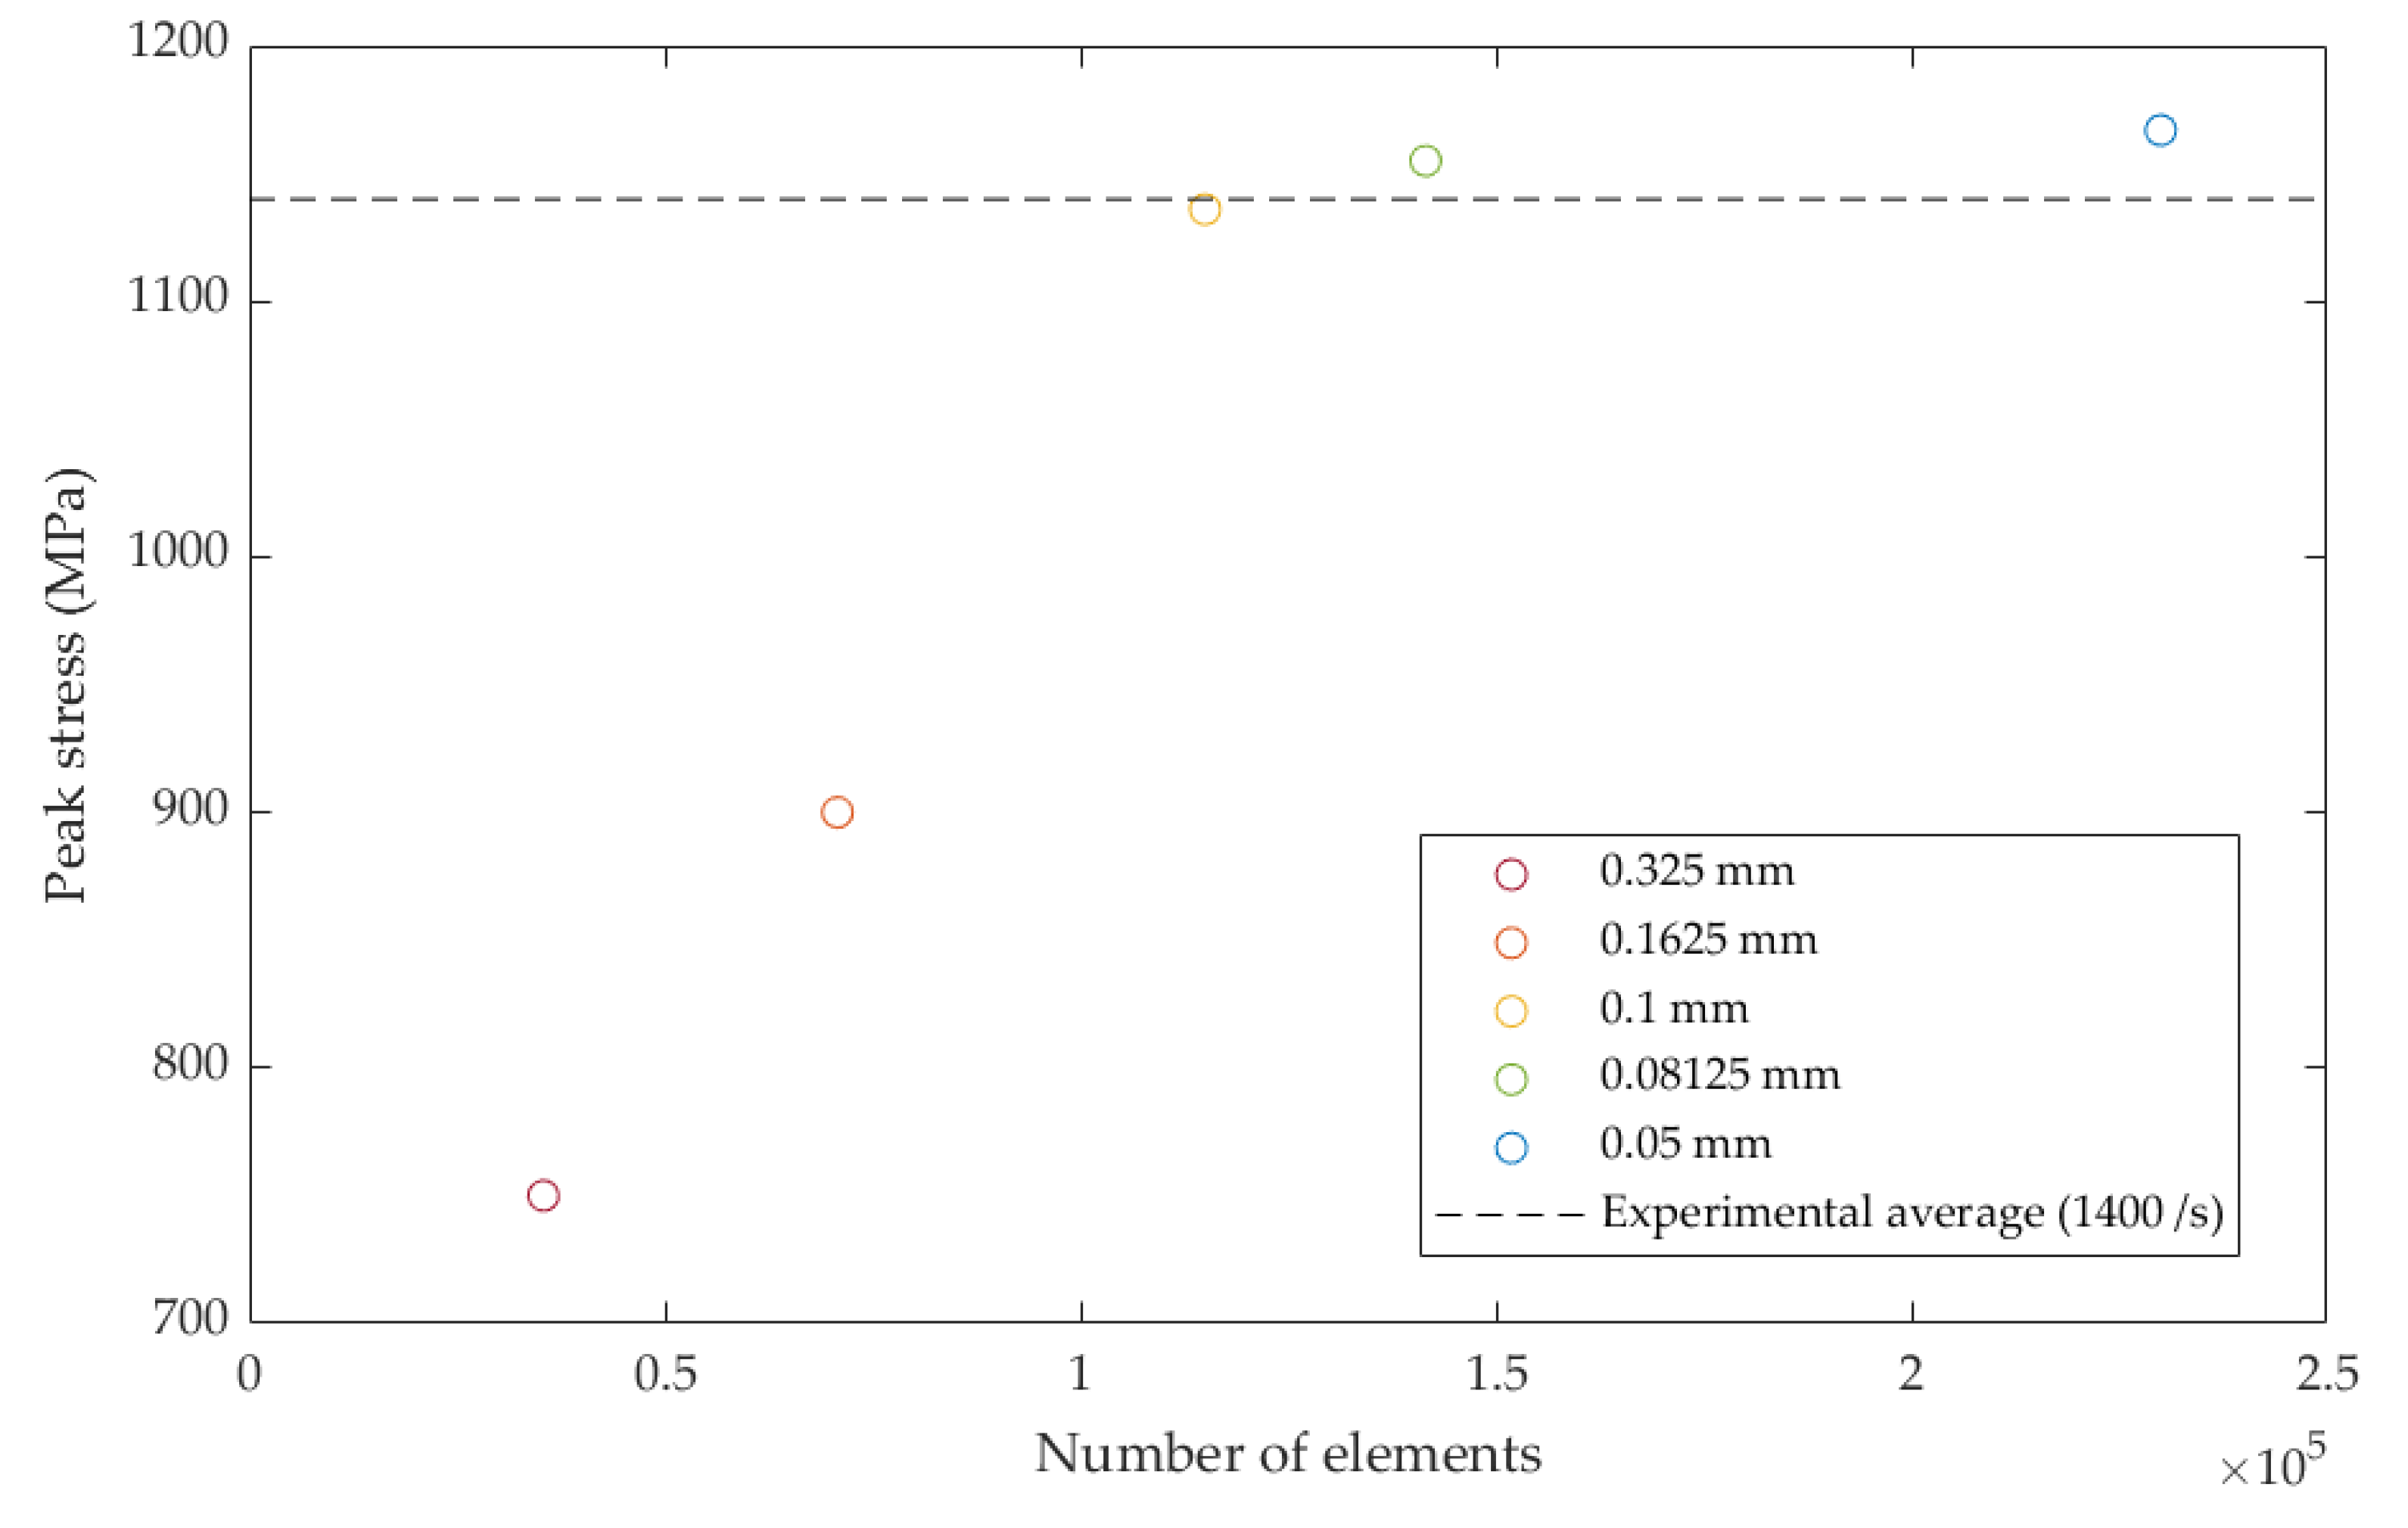
The interaction between the section of the fixture that held the specimen and the specimen was modelled using LS-DYNA® TIED_SURFACE_TO_SURFACE (LSTC, Livermore, CA, USA) contact algorithm. The material card used to predict the T700/PA6.6 behavior was the energy-based MAT_262-LAMINATED_FRACTURE_DAIMLER_CAMANHO (LSTC, Livermore, CA, USA). The material card was populated using a combination of the quasi-static (Table 2) and dynamic mechanical properties (Table 4). For simplification, other (basic) mechanical properties in the material model description, e.g., Young’s modulus, in-plane shear, etc., were also scaled using the same factor obtained in the SHPB experiment. Following the mesh convergence study (Figure 14), the optimized element size was determined to be 0.1 mm (100 µm) and this was set throughout the model. The model consisted of 115,000 of solid elements. Using a quad core, hyper-threaded Intel® Core i7-4930 MX (Intel®, Santa Clara, CA, USA), a simulation took approximately 4–8 h to complete.
The strain rates that were achieved in the SHPB experiment were replicated in the model. To achieve this, the fixture was prescribed with the (average) initial velocity observed in the experiment and the same inertia (mass) of the SHPB setup (either the aluminum or steel bar) with respect to the desired strain rate. The input parameters used to describe the model in LS-DYNA® can be found in Table 5.
5.2. Finite Element Analysis versus Experimental Results
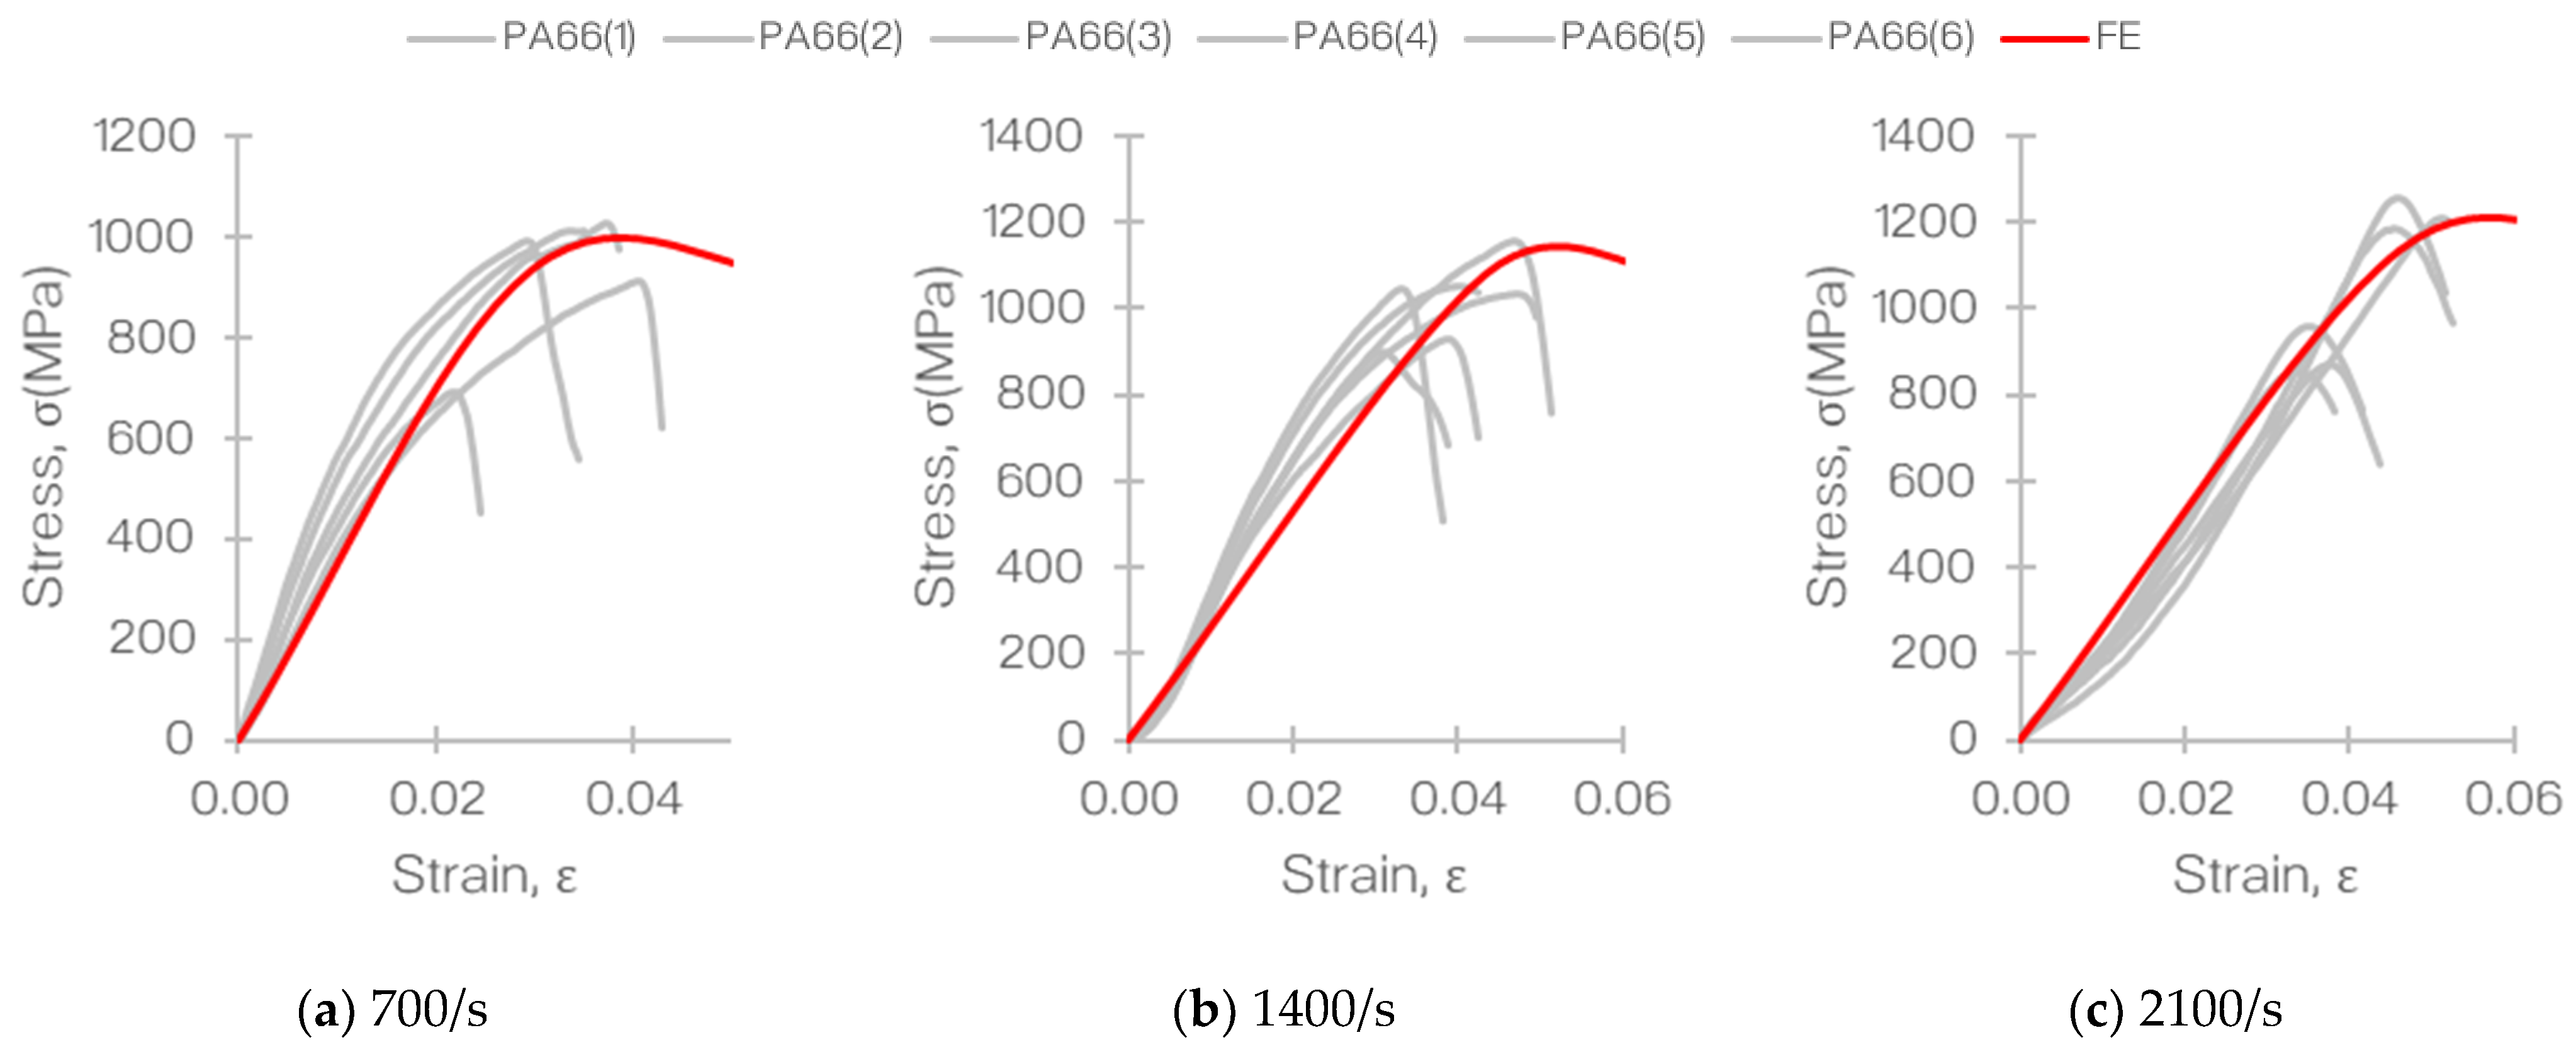
The experimental results obtained and discussed in Section 4.1. were used to validate the numerical model that was developed in LS-DYNA®. Therefore, the stress and strain outputs from the model were extracted and compared against the experimental gathering. This is depicted in Figure 15.
Based on the stress–strain relationship seen in Figure 15, it was evident that the results obtained from the finite element analysis (FEA) were in good agreement with the experimental findings. Clearly, the nonlinearity observed in the experiments was not replicated in the FEA as the entire SHPB assembly was not modelled.
Based on the author’s knowledge, to date, there has not been a constitutive model (in a commercial FE solver) with strain-rate sensitivity description that can accurately predict the dynamic behavior of multidirectional laminated composite material. The FE model detailed in this paper does not claim to fully address that, but since the model was validated for three different strain rates, therefore, to a certain extent, the approach (SHPB experiments with FEA) can be used to predict a laminated composite material behavior at a specific strain rate using the SHPB experimental data at that strain rate. In this way, the methodology can be implemented to assess a laminated composite material’s behavior in real-world applications associated with the range of strain rates seen here, such as low-velocity impact (LVI) and high-velocity impact (HVI).
6. Conclusions
In this study, the goal was to measure the dynamic tensile properties of the NCF biaxial T700/PA6.6 CFRTP composite material system. To achieve this, the specimens of the material were tested using SHPB in tension at three different strain rates: 700, 1400, and 2100/s.
The data gathered from the SHPB experiments described in this paper provided meaningful information on the strain-rate dependency of the laminated thermoplastic composite material system. The T700/PA6.6 carbon/thermoplastic composite material system was found to be strain-rate dependent (sensitive). Therefore, the tensile properties, e.g., tensile strength, increased at higher strain rates. The standard deviations, presented in terms of coefficient of variation (CV), observed from the experimental data sets were primarily due to the nature of manufacturing quality of the composite panel. This was found to be similar to the variations seen in the standardized and non-standardized tests performed on the material.
The nonlinearity of the stress–strain behavior of the material in the experiment was found to be influenced by the following: (i) geometrical effects of the experimental assembly, (ii) dispersion of the pulse of the propagated waves, and (iii) viscoelasticity of the interface within the fixture.
An FE model was also successfully developed to simulate the SHPB tensile test and was validated against the experimental data. The numerical model predictions were in good agreement with the experimental data sets. Hence, the study shows that by knowing the strain-rate sensitivity of the material, the quasi-static constitutive model can be partially modified to replicate the material’s dynamic behavior at a given strain rate. Specifically, this was done by incorporating the quasi-static mechanical properties and scaling them to the dynamic mechanical properties.
The experimental results and the FE model in this study were proven to be valuable as they allow for the prediction of the material’s behavior under LVI [45] and HVI [46] using the correct implementation of the material’s mechanical properties with respect to the strain rates, under such dynamic loading conditions.
The methodology that was presented in this research was proven to be useful for the authors, and therefore, could potentially assist future researchers, scientists, and engineers in understanding and modelling the dynamic behavior of their composite materials of choice.
Author Contributions
Conceptualization, M.A.A.M.; methodology, M.A.A.M.; software, L.I.; validation, M.A.A.M.; formal analysis, M.A.A.M.; investigation, M.A.A.M.; resources, L.I. and E.S.G.; data curation, M.A.A.M.; writing—original draft preparation, M.A.A.M.; writing—review and editing, M.A.A.M.; visualization, M.A.A.M.; supervision, L.I. and E.S.G.; project administration, M.A.A.M.; funding acquisition, M.A.A.M. and L.I. All authors have read and agreed to the published version of the manuscript.
Funding
Institutional Review Board Statement
Not applicable.
Informed Consent Statement
Not applicable.
Data Availability Statement
Not applicable.
Acknowledgments
The author would like to express his deepest gratitude to Lorenzo Iannucci (Imperial College London) and Emile Greenhalgh (Imperial College London) for their guidance and contribution towards this research; and to THERMOCOMP [49] and DATACOMP [58] project partners for the materials supplied. The author would also like to thank Weinong Chen (Purdue University) for providing the resources and experimental equipment.
Conflicts of Interest
The authors declare no conflict of interest.
Nomenclature
| Longitudinal Young’s modulus, in the fiber direction (Pa) | |
| Transverse Young’s modulus (Pa) | |
| Gauge factor | |
| Mode I fracture toughness (kJ/m2) | |
| Mode II fracture toughness (kJ/m2) | |
| Translaminar fracture toughness (kJ/m2) | |
| Translaminar fracture toughness in compression | |
| Translaminar fracture toughness in tension | |
| Transverse fracture toughness in compression | |
| Transverse fracture toughness in compression | |
| Shear modulus (Pa) | |
| Shear strength (Pa) | |
| Voltage input | |
| Voltage output | |
| Longitudinal compression strength (Pa) | |
| Longitudinal tensile strength (Pa) | |
| Transverse compression strength (Pa) | |
| Transverse tensile strength (Pa) | |
| Elastic strain energy (J) | |
| Strain rate | |
| CFRTP | Carbon fiber-reinforced thermoplastic |
| FE | Finite element |
| FEA | Finite element analysis |
| FVF | Fiber-volume-fraction |
| HVI | High-velocity impact |
| LVI | Low-velocity impact |
| NCF | Non-crimp fabric |
| NFLS | Normal failure stress (Pa) |
| PA | Polyamide |
| PARAM | Exponent in the damage model XMU |
| SFLS | Shear failure stress (Pa) |
| SHPB | Split Hopkinson pressure bar |
| TGA | Thermogravimetric analysis |
| Cross-sectional area (m2) | |
| Wave velocity (m/s) | |
| Young’s modulus (Pa) | |
| Force (N) | |
| Kinetic energy (J) | |
| Length of specimen (m) | |
| Loading duration (s) | |
| Deformed volume (m3) | |
| Impedance (Ns/m) | |
| Mass (kg) | |
| Time (s) | |
| Particle displacement (m) | |
| Particle velocity (m/s) | |
| Strain | |
| Density (kg/m3) | |
| Stress (Pa) |
References
- Stewart, R. Thermoplastic composites—Recyclable and fast to process. Reinf. Plast. 2011, 55, 22–28. [Google Scholar] [CrossRef]
- European Parliament. Directive 2000/53/EC of the European Parliament and the Council of 18 September 2000 on End-Of Life Vehicles 2000; European Parliament: Brussels, Belgium, 2000. [Google Scholar]
- Machado, J.J.M.; Gamarra, P.M.R.; Marques, E.A.S.; da Silva, L.F.M. Improvement in impact strength of composite joints for the automotive industry. Compos. Part B Eng. 2018, 138, 243–255. [Google Scholar] [CrossRef]
- Ezéckiel Amouzou, A.S.; Sicot, O.; Chettah, A.; Aivazzadeh, S. Experimental characterization of composite laminates under low-velocity multi-impact loading. J. Compos. Mater. 2019, 53, 2391–2405. [Google Scholar] [CrossRef]
- Zhou, Y.; Sun, Y.; Huang, T. Bird-Strike Resistance of Composite Laminates with Different Materials. Materials 2020, 13, 129. [Google Scholar] [CrossRef] [Green Version]
- Di Caprio, F.; Cristillo, D.; Saputo, S.; Guida, M.; Riccio, A. Crashworthiness of wing leading edges under bird impact event. Compos. Struct. 2019, 216, 39–52. [Google Scholar] [CrossRef]
- Fojtl, L.; Rusnáková, S.; Žaludek, M.; Čapka, A.; Rusnák, V. Characterization of Carbon Composites Properties for Application in Sport Industry. Adv. Mater. Res. 2015, 1120–1121, 515–518. [Google Scholar] [CrossRef]
- Böhm, R.; Hufnagl, E.; Kupfer, R.; Engler, T.; Hausding, J.; Cherif, C.; Hufenbach, W. Thermoplastic composites reinforced with textile grids: Development of a manufacturing chain and experimental characterisation. Appl. Compos. Mater. 2013, 20, 1077–1096. [Google Scholar] [CrossRef]
- Ustarroz, J.; Taketa, I.; Lomov, S.V.; Verpoest, I. Carbon/PP composites and carbon/self-reinforced PP composites. In Proceedings of the ICCM-17—17th International Conference on Composite Materials, Edinburgh, UK, 27–31 July 2009. [Google Scholar]
- Lee, K.Y.; Kwon, S.M. Interlaminar fracture toughness for composite materials. Eng. Fract. Mech. 1993, 45, 881–887. [Google Scholar]
- Hamer, S.; Leibovich, H.; Green, A.; Intrater, R.; Avrahami, R.; Zussman, E.; Siegmann, A.; Sherman, D. Mode I Interlaminar Fracture Toughness of Nylon 66 Nanofibrilmat Interleaved Carbon/Epoxy Laminates Shay. Polym. Polym. Compos. 2011, 16, 101–113. [Google Scholar] [CrossRef]
- Davies, P.; Kausch, H.H.; Williams, J.G.; Kinloch, A.J.; Charalambides, M.N.; Pavan, A.; Moore, D.R.; Prediger, R.; Robinson, I.; Burgoyne, N.; et al. Round-robin interlaminar fracture testing of carbon-fibre-reinforced epoxy and PEEK composites. Compos. Sci. Technol. 1992, 43, 129–136. [Google Scholar] [CrossRef]
- Radlmaier, V.; Obermeier, G.; Ehard, S.; Kollmannsberger, A.; Koerber, H.; Ladstaetter, E. Interlaminar fracture toughness of carbon fiber reinforced thermoplastic in-situ joints. AIP Conf. Proc. 2016, 1779, 090003. [Google Scholar] [CrossRef] [Green Version]
- Chen, W.; Song, B. Split Hopksinson (Kolsky) Bar—Design, Testing and Applications; Springer: New York, NY, USA, 2011; ISBN 978-1-4419-7981-0. [Google Scholar]
- Justusson, B.; Waas, A.; Pankow, M. Dynamic Characterization of Textile Composites Part I: Uniaxial Tension. J. Dyn. Behav. Mater. 2018, 4, 258–267. [Google Scholar] [CrossRef]
- Armenàkas, A.E.; Sciammarella, C.A. Response of glass-fiber-reinforced epoxy specimens to high rates of tensile loading—Investigation is aimed at establishing experimentally the mechanical properties, the ultimate load, the average strain corresponding to the ultimate load and the mode of failure of glass-fiber-reinforced epoxy plates subjected to high rates of tensile loading in the direction of the fibers. Exp. Mech. 1973, 13, 433–440. [Google Scholar] [CrossRef]
- Staab, G.H.; Gilat, A. High Strain Rate Response of Angle-Ply Glass/Epoxy Laminates. J. Compos. Mater. 1995, 29, 1308–1320. [Google Scholar] [CrossRef]
- Yazici, M. Loading rate sensitivity of high strength fibers and fiber/matrix interfaces. J. Reinf. Plast. Compos. 2009, 28, 1869–1880. [Google Scholar] [CrossRef]
- Li, D.S.; Chen, H.R.; Ge, D.Y.; Jiang, N.; Jiang, L. Split Hopkinson pressure bar testing of 3D multi-axial warp knitted carbon/epoxy composites. Compos. Part B Eng. 2015, 79, 692–705. [Google Scholar] [CrossRef]
- Chihi, M.; Tarfaoui, M.; Qureshi, Y.; Benyahia, H.; Bouraoui, C. Graphene nanofillers as a player to improve the dynamic compressive response and failure behavior of carbon/epoxy composite. Nanotechnology 2020, 31, 425709. [Google Scholar] [CrossRef] [PubMed]
- Tobalina-Baldeon, D.; Sanz-Adan, F.; Martinez-Calvo, M.A.; Santamaría-Pena, J. Dynamic tensile stress-compressive stress behavior of thermoplastic matrix composite materials reinforced with continuous fiber for automotive damping and anti-vibration structural elements. Materials 2020, 13, 5. [Google Scholar] [CrossRef] [Green Version]
- Chihi, M.; Tarfaoui, M.; Qureshi, Y.; Bouraoui, C.; Benyahia, H. Effect of carbon nanotubes on the in-plane dynamic behavior of a carbon/epoxy composite under high strain rate compression using SHPB. Smart Mater. Struct. 2020, 29, 085012. [Google Scholar] [CrossRef]
- Tarfaoui, M.; Nachtane, M.; El Moumen, A. Energy dissipation of stitched and unstitched woven composite materials during dynamic compression test. Compos. Part B Eng. 2019, 167, 487–496. [Google Scholar] [CrossRef]
- Nambu, A.; Adachi, S.; Yabu, T.; Ishitsuka, Y.; Hosoi, A.; Kawada, H. Energy absorption mechanism of thermoplastic fiber-reinforced plastics under impact loading using split-hopkinson pressure-bar method. In Key Engineering Materials; Trans Tech Publications Ltd: Bäch SZ, Switzerland, 2020; Volume 858, pp. 47–52. [Google Scholar]
- Nie, Y.; Parab, N.D.; Chu, J.-M.; Sun, T.; Fezzaa, K.; Chen, W.W. Crack propagation from a circular defect in a unidirectional CFRP composite under dynamic tension. In Proceedings of the 32nd Technical Conference of the American Society for Composites, West Lafayette, IN, USA, 23–25 October 2017; Volume 2, pp. 1454–1461. [Google Scholar]
- Ganzenmüller, G.C.; Plappert, D.; Trippel, A.; Hiermaier, S. A Split-Hopkinson Tension Bar study on the dynamic strength of basalt-fibre composites. Compos. Part B Eng. 2019, 171, 310–319. [Google Scholar] [CrossRef]
- Elmahdy, A.; Verleysen, P. Challenges related to testing of composite materials at high strain rates using the split Hopkinson bar technique. EPJ Web Conf. 2018, 183, 02021. [Google Scholar] [CrossRef]
- Daniel, I.M.; LaBedz, R.H.; Liber, T. New method for testing composites at very high strain rates—A method was developed for testing and characterizing unidirectional and angle-ply composite laminates at strain rates in the 100 to 500 s-1 regime. Exp. Mech. 1981, 21, 71–77. [Google Scholar] [CrossRef]
- Daniel, I.M.; Hamilton, W.G.; LaBedz, R.H. Strain Rate Characterization of Unidirectional Graphite/Epoxy Composite. In Proceedings of the ASTM Special Technical Publication; ASTM: West Conshohocken, PA, USA, 1982; pp. 393–413. [Google Scholar]
- Harding, J.; Welsh, L.M. A tensile testing technique for fibre-reinforced composites at impact rates of strain. J. Mater. Sci. 1983, 18, 1810–1826. [Google Scholar] [CrossRef]
- Jacob, G.C.; Starbuck, J.M.; Fellers, J.F.; Simunovic, S.; Boeman, R.G. Strain rate effects on the mechanical properties of polymer composite materials. J. Appl. Polym. Sci. 2004, 94, 296–301. [Google Scholar] [CrossRef]
- Weeks, C.A.; Sun, C.T. Modeling non-linear rate-dependent behavior in fiber-reinforced composites. Compos. Sci. Technol. 1998, 58, 603–611. [Google Scholar] [CrossRef]
- Zhang, X.; Shi, Y.; Li, Z.X. Experimental study on the tensile behavior of unidirectional and plain weave CFRP laminates under different strain rates. Compos. Part B Eng. 2019, 164, 524–536. [Google Scholar] [CrossRef]
- Hou, J.P.; Ruiz, C. Measurement of the properties of woven CFRP T300/914 at different strain rates. Compos. Sci. Technol. 2000, 60, 2829–2834. [Google Scholar] [CrossRef]
- Gilat, A.; Goldberg, R.K.; Roberts, G.D. Experimental study of strain-rate-dependent behavior of carbon/epoxy composite. Compos. Sci. Technol. 2002, 62, 1469–1476. [Google Scholar] [CrossRef]
- Zhang, W.; Hao, P.; Liu, Y.; Shu, X. Determination of the dynamic response of Q345 steel materials by using SHPB. In Proceedings of the Procedia Engineering, Nanjing, China, 24–25 December 2011; Elsevier: Amsterdam, The Netherlands, 2011; Volume 24, pp. 773–777. [Google Scholar]
- Khosravani, M.R.; Wagner, P.; Fröhlich, D.; Weinberg, K. Dynamic fracture investigations of ultra-high performance concrete by spalling tests. Eng. Struct. 2019, 201, 109844. [Google Scholar] [CrossRef]
- Ai, D.; Zhao, Y.; Wang, Q.; Li, C. Crack propagation and dynamic properties of coal under SHPB impact loading: Experimental investigation and numerical simulation. Theor. Appl. Fract. Mech. 2020, 105, 102393. [Google Scholar] [CrossRef]
- Tenreiro, A.F.G.; Silva, C.M.; Lopes, A.M.; Nunes, P.D.P.; Carbas, R.J.C.; da Silva, L.F.M. Design of a new pneumatic impact actuator of a Split Hopkinson Pressure Bar (SHPB) setup for tensile and compression testing of structural adhesives. Mech. Mach. Theory 2021, 159, 104289. [Google Scholar] [CrossRef]
- Nevill, G.E.; Ross, C.A.; Jones, E.R. Dynamic Compressive Strength and Failure of Steel Reinforced Epoxy Composites. J. Compos. Mater. 1971, 5, 362–377. [Google Scholar] [CrossRef]
- Griffiths, L.J.; Martin, D.J. A study of the dynamic behaviour of a carbon-fibre composite using the split Hopkinson pressure bar. J. Phys. D. Appl. Phys. 1974, 7, 2329–2341. [Google Scholar] [CrossRef]
- Wang, W.; Makarov, G.; Shenoi, R.A. An analytical model for assessing strain rate sensitivity of unidirectional composite laminates. Compos. Struct. 2005, 69, 45–54. [Google Scholar] [CrossRef]
- Šebek, F.; Kubík, P.; Brabec, M.; Tippner, J. Modelling of impact behaviour of European beech subjected to split Hopkinson pressure bar test. Compos. Struct. 2020, 245, 112330. [Google Scholar] [CrossRef]
- Werner, B.T.; Daniel, I.M. Characterization and modeling of polymeric matrix under multi-axial static and dynamic loading. Compos. Sci. Technol. 2014, 102, 113–119. [Google Scholar] [CrossRef]
- Mohsin, M.A.A.; Iannucci, L.; Greenhalgh, E.S. Low-velocity Impact Performance of Carbon Fibre Reinforced Thermoplastic Composites for Automotive Applications. In Proceedings of the ICCM21—21st International Conference on Composite Materials, Xi’an, China, 20–25 August 2017. [Google Scholar]
- Mohsin, M.A.A.; Iannucci, L.; Greenhalgh, E.S. Numerical and experimental analysis of high-velocity impact behaviour of carbon fibre reinforced thermoplastic composites. In Proceedings of the ECCM18—18th European Conference on Composite Materials, Athens, Greece, 25–28 June 2018. [Google Scholar]
- Mohsin, M.A.A. Manufacturing, Testing, Modelling and Fractography of Thermoplastic Composites for the Automotive Industry. Ph.D. Thesis, Imperial College London, London, UK, 2019. [Google Scholar]
- Stamoulis, K.; Georgantzinos, S.K.; Giannopoulos, G.I. Damage characteristics in laminated composite structures subjected to low-velocity impact. Int. J. Struct. Integr. 2019, 11, 670–685. [Google Scholar] [CrossRef]
- UK-THERMOCOMP | CIC. Available online: http://the-cic.org.uk/uk-thermocomp (accessed on 5 October 2015).
- Tohgo, K.; Hirako, Y.; Ishii, H.; Sano, K. Mode I interlaminar fracture toughness in carbon fiber reinforced thermoplastic laminate. Nippon Kikai Gakkai Ronbunshu A Hen/Trans. Jpn. Soc. Mech. Eng. Part A 1995, 61, 1273–1279. [Google Scholar]
- McKeen, L.W. Polyamides Nylons. In The Effect of UV Light and Weather on Plastics and Elastomers; Elsevier: Amsterdam, The Netherlands, 2013; pp. 163–191. [Google Scholar]
- TorayCA T700S Technical Data Sheet 2005, 2. Available online: http://www.toraycma.com/files/library/5b66d6b5185353dc.pdf/ (accessed on 5 October 2015).
- Mohsin, M.A.A.; Iannucci, L.; Greenhalgh, E.S. Mode I Interlaminar Fracture Toughness Characterisation of Carbon Fibre Reinforced Thermoplastic Composites. In Proceedings of the American Society for Composites (ASC) 32nd Annual Technical Conference, West Lafayette, IN, USA, 23–25 October 2017; American Society for Composites: West Lafayette, IN, USA, 2017. [Google Scholar]
- Mohsin, M.A.A.; Iannucci, L.; Greenhalgh, E.S. Translaminar Fracture Toughness Characterisation of Carbon Reinforced Thermoplastic Composites. In Proceedings of the ECCM17—17th European Conference on Composite Materials, Munich, Germany, 26–30 June 2016; European Society for Composite Materials: Munich, Germany, 2016. [Google Scholar]
- Mohsin, M.A.A.; Iannucci, L.; Greenhalgh, E.S. Fibre-volume-fraction measurement of carbon fibre reinforced thermoplastic composites using thermogravimetric analysis. Heliyon 2019, 5, e01132. [Google Scholar] [CrossRef] [Green Version]
- British Standards Institution. BS EN ISO 527-4:1997 BS 2782-3: Method 326F:1997 Plastics—Determination of Tensile Properties; BSI: London, UK, 1997. [Google Scholar]
- Ochola, R.O.; Marcus, K.; Nurick, G.N.; Franz, T. Mechanical behaviour of glass and carbon fibre reinforced composites at varying strain rates. Compos. Struct. 2004, 63, 455–467. [Google Scholar] [CrossRef]
- UK-DATACOMP | CIC. Available online: http://the-cic.org.uk/uk-datacomp (accessed on 5 October 2015).
Figure 1.
Dimension of the split Hopkinson pressure bar (SHPB) sample for the dynamic tension test (length = 15 mm; width = 2.5 mm; and thickness = 0.65 mm).
Figure 1.
Dimension of the split Hopkinson pressure bar (SHPB) sample for the dynamic tension test (length = 15 mm; width = 2.5 mm; and thickness = 0.65 mm).

Figure 2.
The tensile SHPB test specimen of T700/PA6.6.

Figure 3.
Image of: (a) the fixture of the aluminum SHPB that accommodates the specimen, (b) the specimen mounted onto the SHPB with a gauge length of 3 mm (prior to the test), and (c) tensile fracture of the specimen.
Figure 3.
Image of: (a) the fixture of the aluminum SHPB that accommodates the specimen, (b) the specimen mounted onto the SHPB with a gauge length of 3 mm (prior to the test), and (c) tensile fracture of the specimen.

Figure 4.
Wave propagation in the positive y-direction, where is the diplacement and is the wave velocity.
Figure 4.
Wave propagation in the positive y-direction, where is the diplacement and is the wave velocity.

Figure 5.
Testing section of the SHPB.

Figure 6.
Determination of reflected pulse, the correct and incorrect method. Reprinted with permission from Springer, Split Hopkinson (Kolsky) Bar by Chen and Song (2011) [14].
Figure 6.
Determination of reflected pulse, the correct and incorrect method. Reprinted with permission from Springer, Split Hopkinson (Kolsky) Bar by Chen and Song (2011) [14].

Figure 7.
Determining the stress equilibrium, the correct and incorrect method. Reprinted with permission from Springer, Split Hopkinson (Kolsky) Bar by Chen and Song (2011) [14].
Figure 7.
Determining the stress equilibrium, the correct and incorrect method. Reprinted with permission from Springer, Split Hopkinson (Kolsky) Bar by Chen and Song (2011) [14].

Figure 8.
Determination of stress-strain curves, the correct and incorrect method. Reprinted with permission from Springer, Split Hopkinson (Kolsky) Bar by Chen and Song (2011) [14].
Figure 8.
Determination of stress-strain curves, the correct and incorrect method. Reprinted with permission from Springer, Split Hopkinson (Kolsky) Bar by Chen and Song (2011) [14].

Figure 9.
Representative raw signals obtained from one of the 2100/s strain rate following the SHPB experiment conducted on T700/PA6.6 specimen.
Figure 9.
Representative raw signals obtained from one of the 2100/s strain rate following the SHPB experiment conducted on T700/PA6.6 specimen.

Figure 10.
Representative plot of the corrected (aligned) raw signals obtained from one of the 2100/s strain rate following the SHPB experiment conducted on T700/PA6.6 specimen.
Figure 10.
Representative plot of the corrected (aligned) raw signals obtained from one of the 2100/s strain rate following the SHPB experiment conducted on T700/PA6.6 specimen.

Figure 11.
Stress–strain plots obtained from the SHPB tensile test of T700/PA6.6 at different strain rates: (a) 700, (b) 1400, and (c) 2100/s.
Figure 11.
Stress–strain plots obtained from the SHPB tensile test of T700/PA6.6 at different strain rates: (a) 700, (b) 1400, and (c) 2100/s.

Figure 12.
Quasi-static tensile strength of T700/PA6.6 versus dynamic tensile strengths (normalized to the quasi-static tensile strength).
Figure 12.
Quasi-static tensile strength of T700/PA6.6 versus dynamic tensile strengths (normalized to the quasi-static tensile strength).

Figure 13.
Finite element (FE) model of the tension SHPB specimen in LS-DYNA®.

Figure 14.
Mesh dependency study indicating that the 0.1 mm is the optimal element size.

Figure 15.
Comparison of stress-strain plots of T700/PA6.6 at different strain rates: (a) 700, (b) 1400, and (c) 2100/s obtained from the experiments and finite element analysis (FEA).
Figure 15.
Comparison of stress-strain plots of T700/PA6.6 at different strain rates: (a) 700, (b) 1400, and (c) 2100/s obtained from the experiments and finite element analysis (FEA).


Table 1.
Mechanical properties of neat PA6.6 and T700 fiber.
| References | PA6.6 | T700 Fiber |
|---|---|---|
| [47,50,51] | [52] | |
| Density (kg/m3) | 1170 | 1800 |
| Tensile strength, ultimate (MPa) | ~70 | 4900 |
| Tensile modulus (GPa) | 2.5 | 230 |
| Elongation at break (%) | 53.9 | 2.1 |
| Mode I fracture toughness, (kJ/m2) | 0.2 | - |
Table 2.
Quasi-static mechanical properties of T700/PA6.6 with a fiber-volume-fraction of 52% [47,53,54].
| Mechanical Properties | Material: T700/PA6.6 |
|---|---|
| Tensile Young’s modulus (GPa) | 65 |
| Compressive Young’s modulus (GPa) | 69 |
| Tensile strength (MPa) | 918 |
| Compressive strength (MPa) | 461 |
| In-plane shear modulus (GPa) | 3.2 |
| In-plane shear stress at 5% (MPa) | 52 |
| Mode I interlaminar fracture toughness, (kJ/m2) [53] | 1.50 |
| Mode II interlaminar fracture toughness, (kJ/m2) [47] | 1.94 |
| Translaminar tensile fracture toughness, (kJ/m2) | 235 |
Table 3.
Properties and specification of the aluminum and steel SHPB.
| Bar Type | Aluminum | Steel |
|---|---|---|
| Gauge factor, | 2.08 | 151 |
| Wave speed of the bar, (m/s) | 5100 | 5050 |
| Tensile strength (MPa) | 500–1500 | 1000–3000 |
Table 4.
Summary of the dynamic tensile properties obtained from the SHPB experiment of the T700/PA6.6.
Table 4.
Summary of the dynamic tensile properties obtained from the SHPB experiment of the T700/PA6.6.
| Test Type | ||||
|---|---|---|---|---|
| Dynamic SHPB | Quasi-Static | |||
| 700/s | 1400/s | 2100/s | ||
| Average strength (MPa) | 950 | 1140 | 1332 | 918 |
| Coefficient of variation, CV (%) | 3.3 | 7.8 | 8.5 | 8.3 |
| Change vs. quasi-static (%) | +3.5 | +24.2 | +45.1 | - |
Table 5.
Parameters used to describe the mechanical properties of the T700/PA6.6 CFRTP composite [47,53] and the contact surface.
| Decoupled in-Plane Mechanical Properties | |
|---|---|
| Longitudinal Young’s modulus, in the fibre direction, (GPa) | 129 |
| Transverse Young’s modulus, (GPa) | 5.0 |
| Shear modulus, (GPa) | 3.2 |
| Longitudinal tensile strength, (MPa) | 2400 |
| Longitudinal compressive strength, (MPa) | 1500 |
| Transverse tensile strength, (MPa) | 156 |
| Transverse compressive strength, (MPa) | 189 |
| Shear strength, (MPa) | 110 |
| In-plane fracture toughness | |
| Translaminar fracture toughness in compression, (kJ/m2) | 350 |
| Translaminar fracture toughness in tension, (kJ/m2) | 470 |
| Transverse fracture toughness in compression, (kJ/m2) | 4.0 |
| Transverse fracture toughness in tension, (kJ/m2) | 4.0 |
| Contact (cohesive) surface properties | |
| Normal failure stress, NFLS (MPa) | 60 |
| Shear failure stress, SFLS (MPa) | 120 |
| Exponent in the damage model XMU, PARAM | 1.8 |
| Mode I interlaminar fracture toughness, (kJ/m2) [53] | 1.50 |
| Mode II interlaminar fracture toughness, (kJ/m2) [47] | 1.94 |
Publisher’s Note: MDPI stays neutral with regard to jurisdictional claims in published maps and institutional affiliations. |
© 2021 by the authors. Licensee MDPI, Basel, Switzerland. This article is an open access article distributed under the terms and conditions of the Creative Commons Attribution (CC BY) license (http://creativecommons.org/licenses/by/4.0/).
Share and Cite
MDPI and ACS Style
Mohsin, M.A.A.; Iannucci, L.; Greenhalgh, E.S. On the Dynamic Tensile Behaviour of Thermoplastic Composite Carbon/Polyamide 6.6 Using Split Hopkinson Pressure Bar. Materials 2021, 14, 1653. https://doi.org/10.3390/ma14071653
AMA Style
Mohsin MAA, Iannucci L, Greenhalgh ES. On the Dynamic Tensile Behaviour of Thermoplastic Composite Carbon/Polyamide 6.6 Using Split Hopkinson Pressure Bar. Materials. 2021; 14(7):1653. https://doi.org/10.3390/ma14071653
Chicago/Turabian StyleMohsin, Muhammad Ameerul Atrash, Lorenzo Iannucci, and Emile S. Greenhalgh. 2021. "On the Dynamic Tensile Behaviour of Thermoplastic Composite Carbon/Polyamide 6.6 Using Split Hopkinson Pressure Bar" Materials 14, no. 7: 1653. https://doi.org/10.3390/ma14071653
Note that from the first issue of 2016, this journal uses article numbers instead of page numbers. See further details here.