Development of Downtime Cost Calculator for Offloading Operations Influenced by Parametric Rolling


1
Department of Civil and Environmental Engineering, Universiti Teknologi PETRONAS (UTP), Perak 32610, Malaysia
2
Department of Civil and Environmental Engineering, Curtin University, Perth, WA 6102, Australia
*
Author to whom correspondence should be addressed.
J. Mar. Sci. Eng. 2020, 8(1), 7; https://doi.org/10.3390/jmse8010007
Submission received: 29 August 2019
/
Revised: 20 October 2019
/
Accepted: 24 October 2019
/
Published: 20 December 2019
(This article belongs to the Section Ocean Engineering)
Abstract
:The stability of FPSO or offloading shuttle tanker may be affected in wave conditions which excite parametric rolling. The offloading operations are thereby ceased and eventually leads to loss in production which affects the revenue of global production, better known as downtime cost. This paper discusses downtime cost analysis of offloading operations due to parametric rolling of shuttle tanker under regular waves in Malaysian waters for three different locations. The downtime due to parametric rolling is investigated for two different water depths for which the probability of occurrence was calculated from the location specific wave scatter diagram. The results of parametric rolling of shuttle tanker along with downtime cost charts are presented. Additionally, a Graphical User Interface (GUI) was developed and its work procedure is demonstrated in this paper. The down-time cost calculator will help the oil operator companies to analyze the economic risks involved for field developments and anticipate the loss in revenue for downtime occurrences. The developed GUI was copyrighted under literary work as intellectual property.
1. Introduction
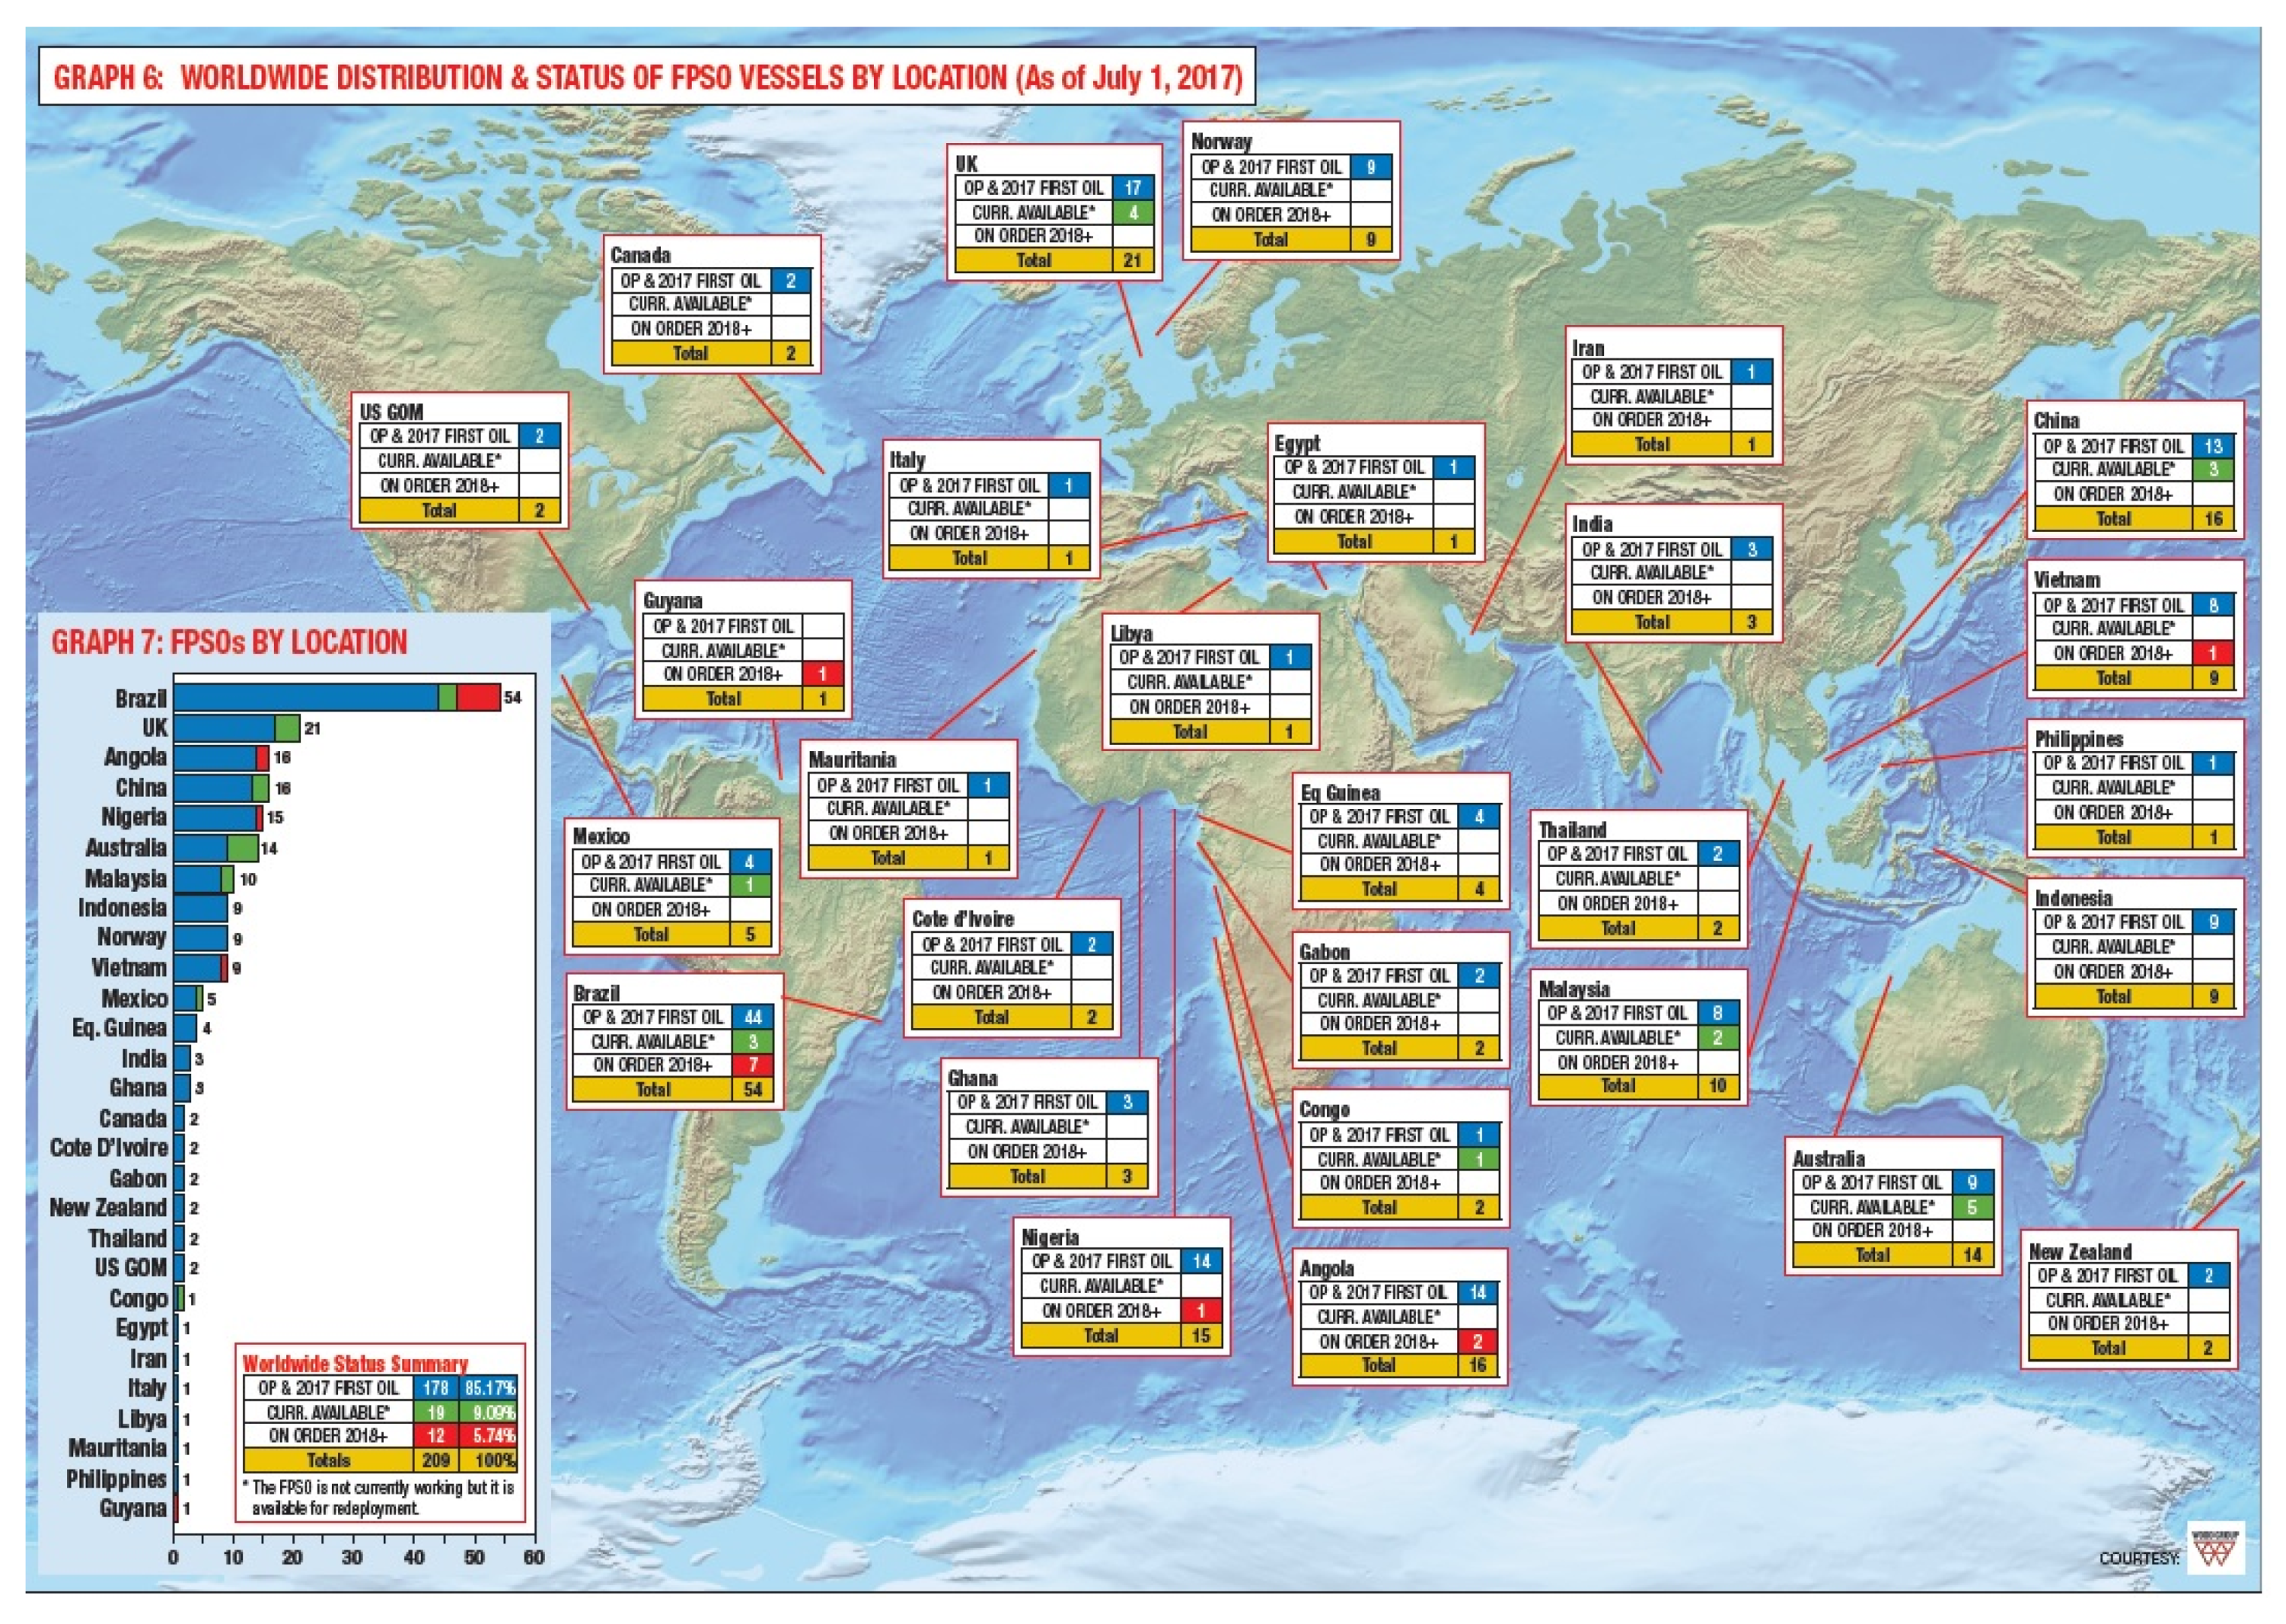
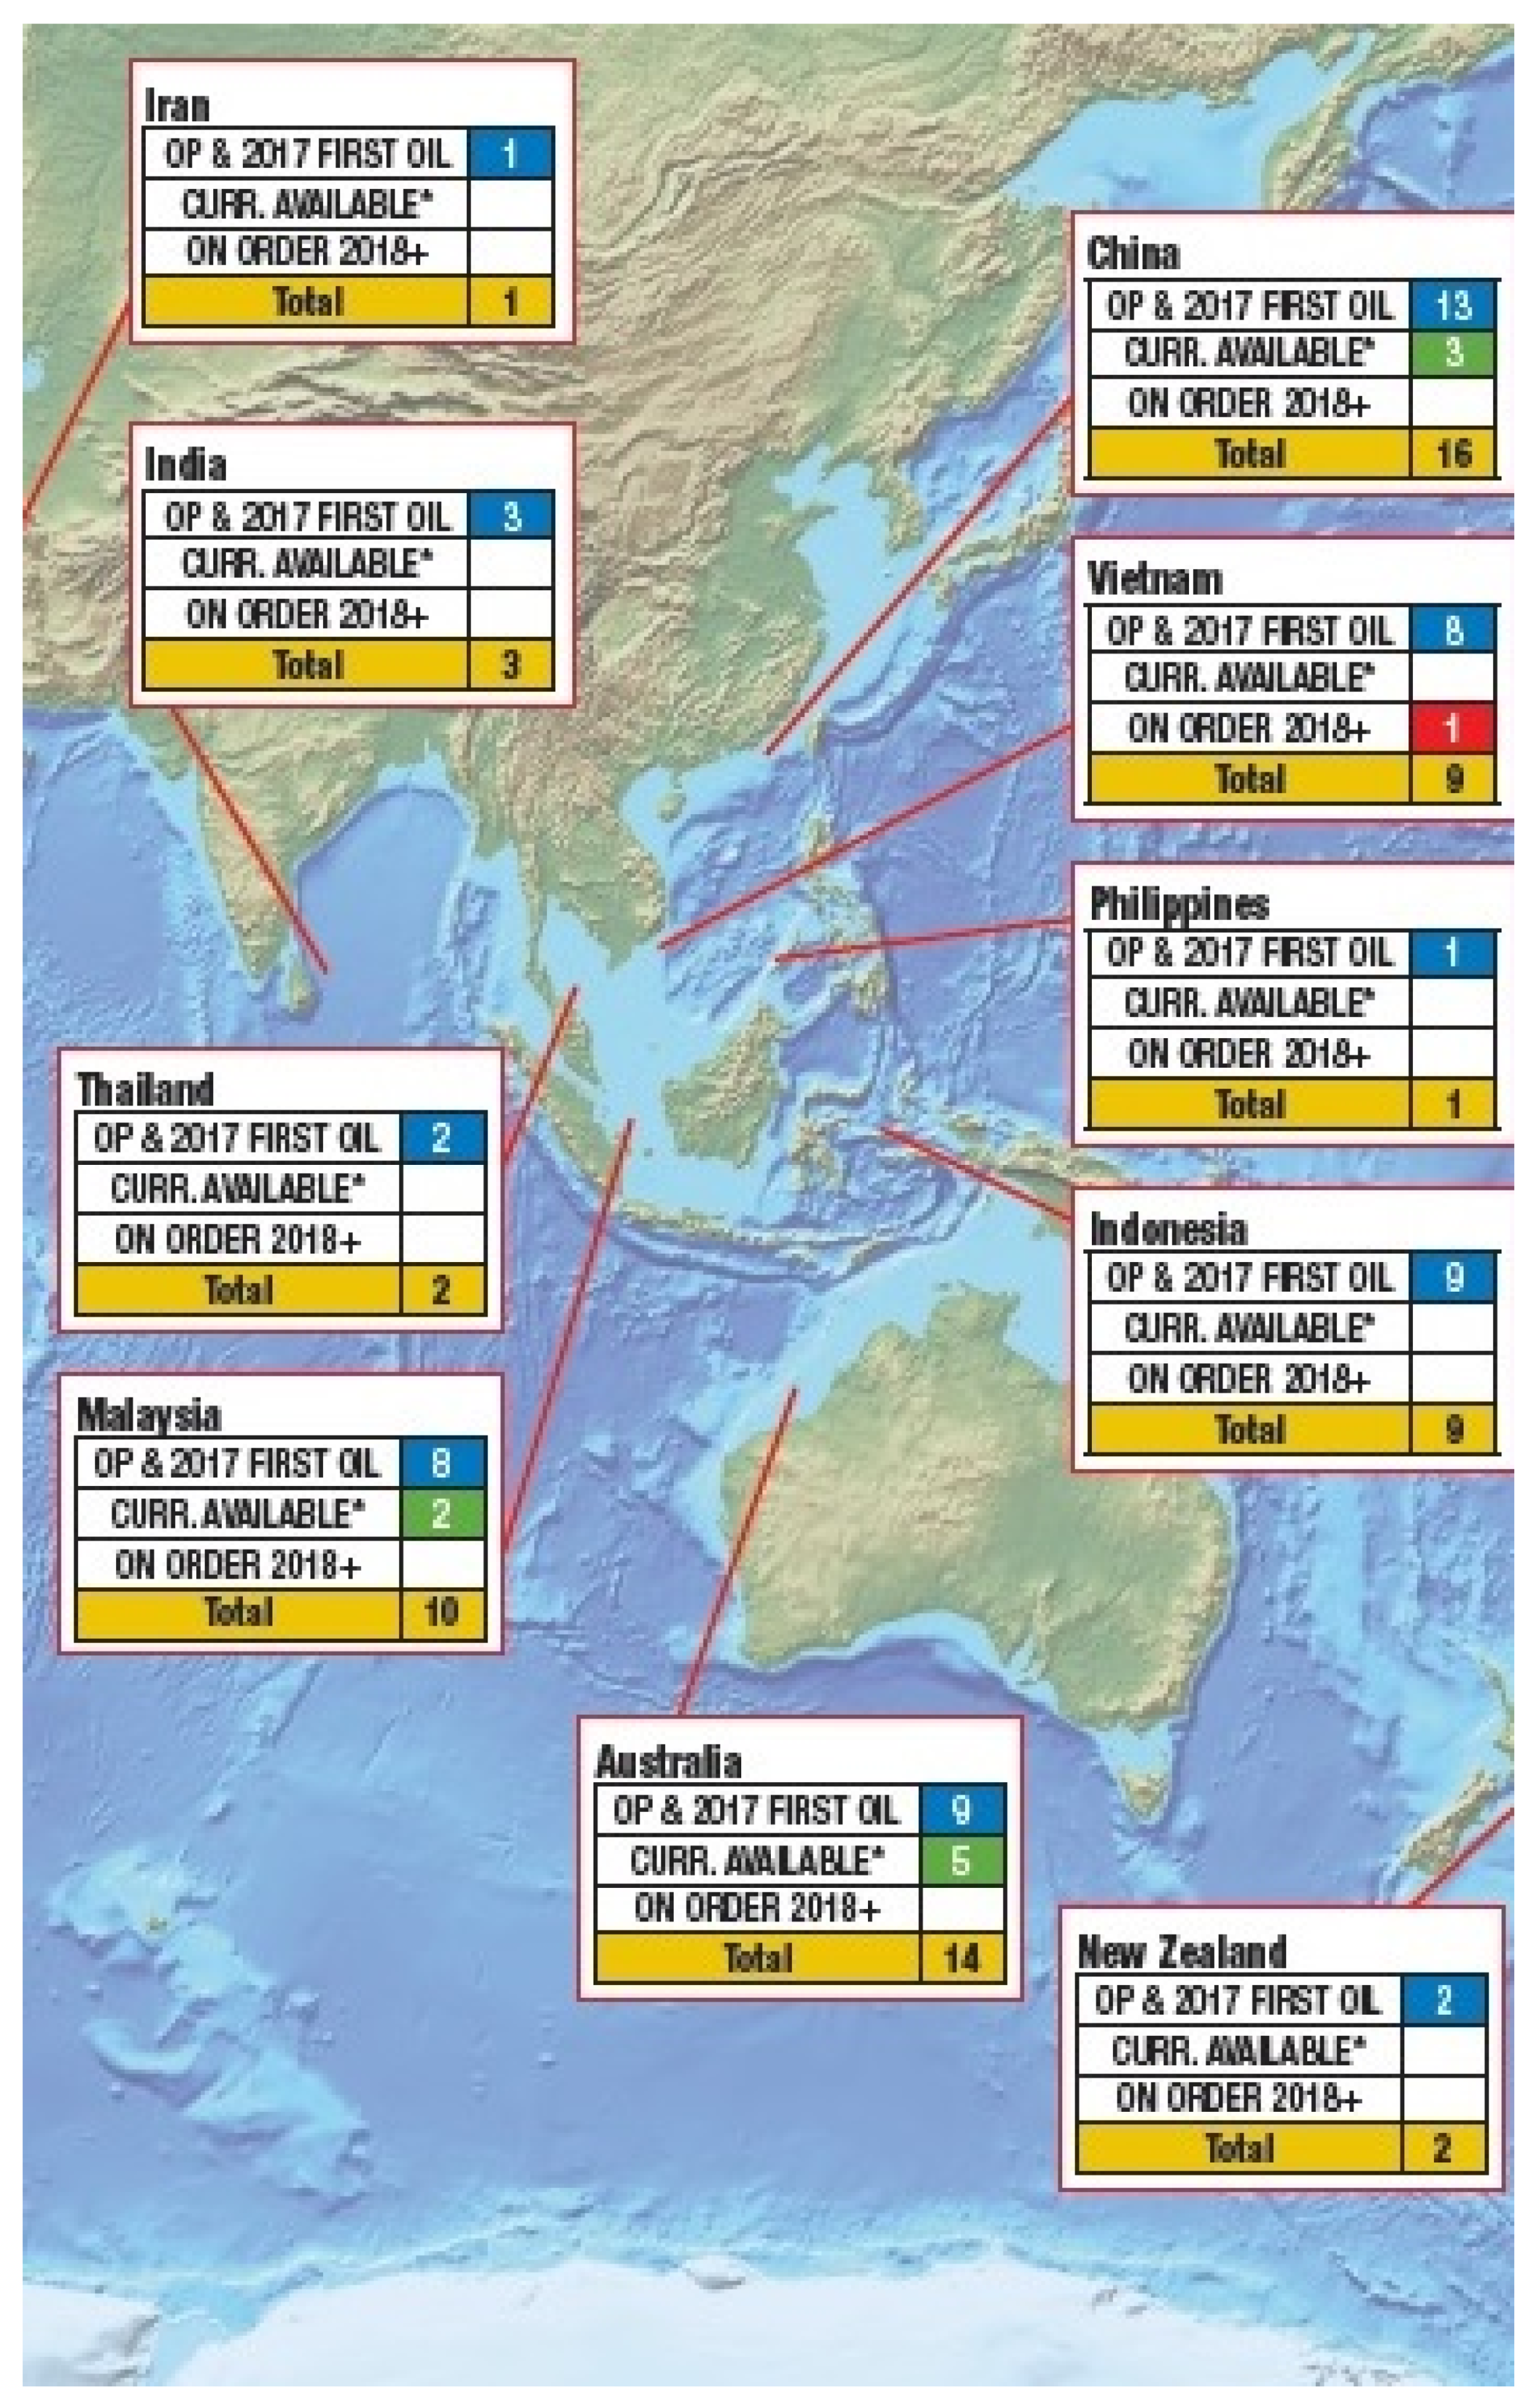
The latest study on floating, production, storage and offloading (FPSO) systems disclosed a total of 178 FPSOs operating around the globe [1]. Currently, 14 FPSOs operate in Australian waters while 51 FPSOs operate in Southeast Asia. There are 8 FPSOs in Malaysia alone. Figure 1 displays the global location allocation of FPSO ships. Figure 2 shows the enlarged view of the global distribution of FPSO in South-east Asia. Compared to tandem offloading, most standard FPSOs are now switching to side-by-side configuration due to factors such as ease of stability and reduced manufacturing costs. The discharge of oil from moored FPSO into an adjoining stationed shuttle tanker is a significant procedure that must be safeguarded. Extreme weather and vessel motion response in side-by-side configuration can affect the offloading procedure. Parametric rolling can also be a potential threat to offloading operations due to sudden building of roll amplitude. The parametric roll is sudden unforced rolling movement of the floating body in the head or following sea-state resulting in dynamic rolling instability. The Malaysian waters being comparatively calmer still may experience certain wave conditions which may excite parametric rolling. This study focused on the wave conditions which restricts offloading operations and leads to downtime in Malaysian waters.
The offloading operation involves transfer oil and, in an event of encountering wave conditions which can trigger parametric rolling, results in downtime of offloading operation. The downtime of offloading operations is related to overall loss in production in terms of cost. This study focuses on calculating the downtime cost of offloading operations due to parametric rolling and developing a Graphical User Interface (GUI) which can account the downtime cost in Malaysian waters. The developed GUI would facilitate to assess the wave conditions that trigger parametric rolling and subsequently produce downtime cost charts with respect to the offloading capacity of shuttle tanker. Additionally, the developed GUI would help operators in evaluating the global economical loss in production due to unpredictable wave conditions susceptible to parametric rolling. Overall, this paper is divided into two major parts. The first part (Section 3 and Section 4) explains the methodology and results of parametric rolling for an offloading shuttle tanker. The second part (Section 5 and Section 6) involves the development and illustration on the work flow of GUI followed by results from the illustration, respectively. In addition to the present section, this research paper is further divided into seven sections. The second section explores the past works done and presents a brief review of the literature. The methodology comprising the mathematical formulation and equations on parametric rolling are discussed in Section 3. Section 3 also presents the wave conditions for investigating parametric rolling, details of shuttle tanker and methodology om downtime cost analysis. The next Section 4 presents the results on parametric rolling and downtime costs. Section 5 and Section 6 discusses on the development, working and illustration of GUI. The last Section 7 concludes the present study and discusses scope of future works.
2. Background
A brief survey on the past works done is presented in this section. The authors in [2] introduced different models of roll damping and studied different forward speed roll decay testing. The numerical simulations were compared with experimental results. For the numerical solution of coupled equations of heave, roll and pitch, the Runge Kutta method was used [3]. The authors through experimental work explained that coupling of yaw and roll motion can induce and promote parametric roll events [4]. The validation of the work was done with numerical simulations. An investigation on roll damping through forced oscillation model test was performed in [5]. The possibility of large roll amplitudes under conditions of parametric roll was compared between a numerical model and experimental results for different roll damping cases. The authors have presented their established one degree of freedom paramteric roll equation of motion in [6], and vessel was simulated inn a random wave group. The influence of wave group height and wave group length was studied on the roll motion. A reliability method was proposed which can efficiently predict parametric roll as an extreme value stochastic process [7]. The efficiency of the proposed method was compared with other numerical reliability scheme. Several numerical algorithms to predict the possibility of parametric roll resonance was designed in [8]. The second order linear oscillatory system was used to model the roll angle of floating vessel. A coupled motion numerical model based on source method to study the diffraction and radiation forces on parametric roll was used in [9]. Furthermore, the effect of these forces on the roll restoring lever arm was studied under different angle of heel and wave amplitude. The past research paper have presented a procedure to calculate the roll response through a time domain numerical model [10]. The time domain numerical model was based on the exact underwater geometry which calculated the righting arm. This method considered the roll angle and surge velocity for statically balancing the vessel. The ship stability parameters, such as the center of buoyancy and sectional area, were calculated at every time step. An attempt to calculate the probability of occurrence of roll motion exceeding a limiting value through reliability method was presented in [11]. The effect of partially standing waves on offloading operations through mathematical modeling was presented in [12]. The results of the reliability method was compared to other numerical simulation. The operational conditions and various sea-states were calculated for parametric roll resonance. Parametric rolling being a threat to the safety of the ships were studied through numerical simulations [13]. The simulations were performed in both regular and irregular waves. The simulations employed two different time domain method which were in good agreement with Mathieu’s equation. The authors discussed on the extreme roll motions which unexpectedly cause many accidents and fiscal losses [14]. Algorithms were designed which detected signals to evaluate the frequency of parametric rolling on vessels. A partly non linear time domain numerical model was used for prediction of parametric roll resonance in regular waves. The non linear incident wave and hydrostatic restoring forces and moment are evaluated considering the instantaneous wetted surface area [15].
The downtime analysis using a hindcast metocean time series was performed in [16]. The limiting metocean criteria for any task was based on significant height or time period or both. The authors in [17] have concluded that incorporating uncertainty and dynamic behavior allows for a better decision on possible operating options. The accuracy of a proposed probabilistic approach was verified with mathematical tests [18]. The approach included detailed study of three components, viz, mechanical, probabilistic and prediction. Ample number of trials and simulations were performed to assess the validity of the proposed approach. The authors have presented an approach to assess the operational risks and re-validating them through Process Hazard Analyses (PHAs) and other techniques in [19]. The authors have further suggested that operational risk assessment is crucial for prevention of loss. The maintenance operations can be improved through effective solutions which convert data into useful sources. These useful sources can help mitigate cost and safety concerns [20]. One research article discussed poor visibility in seabed operations can instil downtime due to delayed schedule of work and thereby production costs were affected [21]. The challenge to reduce the operational downtime and achieve appropriate reliability level was discussed in [22]. The authors have discussed operational downtime of a floating platform in extreme cold regions and further determined the causes responsible for it. An integrated work flow was proposed to counter act the downtime problem due to unplanned shutdown of a subsea production system [23]. The hydrodynamic interaction between vessels and the effect of motion responses on offloading operations were studied in [24]. It is concluded from past works that there is no much work done in down-time cost estimation. A research gap exists to connect motion responses to cost. Also, authors have developed research related to vessel interaction and fluid behavior. However, there is no much literature available to link the vessel behavior and wave interaction to economical performance shuttle tanker. Thus, this paper will focus on one particular study co-relating the parametric rolling to global loss in revenue of oil production.
3. Methodology
3.1. Mathematical Modeling
The regular wave comprises of subsequent crests and trough. When a vessel experiences wave trough, there is submergence of the bow and stern region while the middle region remains comparitively less immersed as shown in Figure 3a. However, this is not the same under wave crests. When the wave crest occurs at mid-vessel region, there is only submergence of the central region while the end regions are not immersed as shown in Figure 3b. Therefore, the avergae water plane area is higher under wave troughs and lesser for wave crests. The greater water plane area causes increase in metacentric height (GM). The increase in GM causes subsequent increase in the righting arm (GZ) and thereby a greater stability is attained in wave trough. On the contrary, the lesser water plane area under wave crests causes lesser GM and decrease in GZ. Hence, stability is reduced under wave crest. The equation of roll motion for the shuttle tanker is modeled as linear ordinary time varying differential equation. The susceptibility to parametric rolling is investigated based on the solution of the ordinary differential equation. The sudden roll motion of the shuttle tanker depends on the stability parameters and time varying metacentric height. A numerical step by step procedure is listed in [25] to consider the vessel geometry to find susceptibility to parametric rolling. The present study does not consider coupling of heave and pitch motions but only the influence of geometry of shuttle tanker in longitudinal waves.
The equations for formulating the Mathieu’s equation are derived from [25]. The length of shuttle tanker is divided into number of sections and the draft at each section is calculated from Equation (1), when wave crest reaches midship .
For every position of wave crest, the transverse moment of inertia is calculated from Equation (2),
The submerged area and displaced volume for every wave crest position is calculated from Equation (3).
The vertical static moment and vertical center of buoyancy is represented from Equation (4).
The change in metacenter for each location of wave crest is calculated from Equation (5).
The change of metacenter with respect to time can induce unstable sudden roll excitation. The time varying metacenter is sinusoidal with time and represented in Equation (6)
Mathieu’s equation, as shown in Equation (7) is an extensive mathematical formulation to investigate the occurrence of parametric roll. and are the stability parameters which are dependent on encountering wave conditions and fractional change in GM.
The stability parameters are calculated from Equation (8).
The solution of the Mathieu’s stability equation displays unstable behavior for certain () pair for which the roll indefinitely increases with time. The main reason for instability is this sudden shift in vessel stability parameters. This sudden fluctuation in parameters of ship stability creates great variation in forces restored. When the frequency of the regular force exciting the roll movement almost matches the system frequency, parametric resonance happens. The American Shipping Bureau (ABS) says that the parametric rolling wave situation is 0.8–2 times the ship’s length. The operational activities in the ocean may be impacted due to the incidence of parametric rolling. If parametric rolling is serious, the offloading activities may also be stopped. This research includes development of graphical user interface which can investigate parametric rolling in regular waves and account for the downtime cost due to it.
3.2. Details of Shuttle Tankers and Wave Conditions
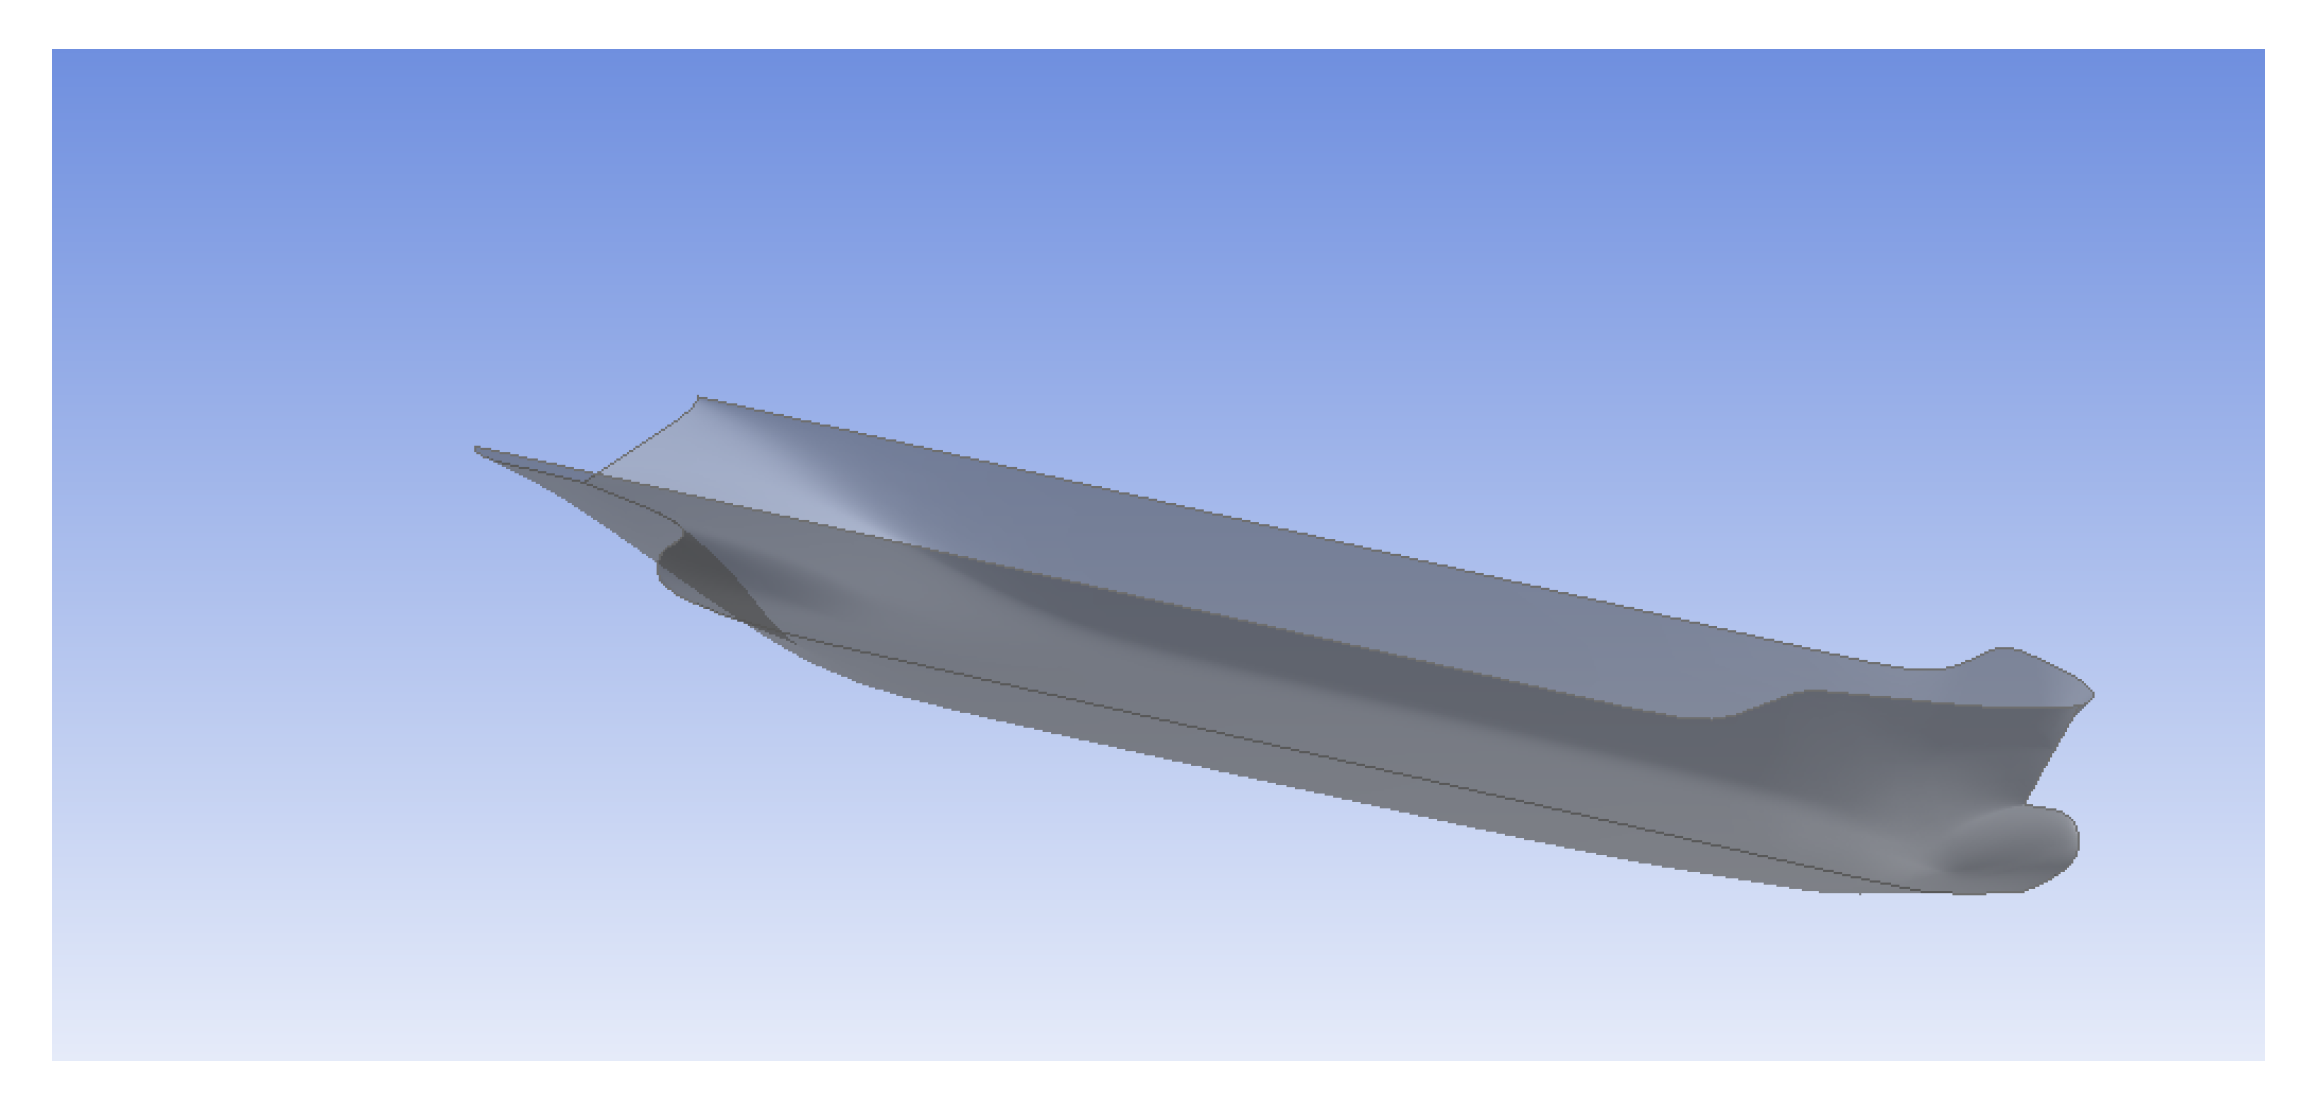
The shuttle tanker used in the present study was geometrically modeled in a 3D CAD software as shown in Figure 4. The geometric details of the shuttle tanker is given in Table 1. The shuttle tanker was investigated for parametric rolling in two different water depth under longitudinal waves. The wave conditions for investigation of parametric rolling included three different wave heights as shown in Table 2. The susceptibility of parametric rolling was also accounted for ABS criteria and roll resonance under the wave conditions shown in Table 2. As per the ABS criteria, the shuttle tanker is susceptible when the ratio of length of the wave to length of the vessel () is between 0.8 to 2. The ABS criteria for the two water depths are studied to investigate parametric rolling. Table 3 and Table 4 displays the 13 different cases and corresponding values of the encountering wave conditions under ABS criteria. The stability analysis of the shuttle tanker was performed in a boundary element-based numerical package ‘ANSYS AQWA’ to find its natural roll frequency in the two different water depths.
3.3. Down-Time Cost Analysis
The downtime cost analysis of offloading operations is based on the occurrence of parametric rolling. In an occurrence of wave condition where in parametric rolling occurs, the offloading operation for the shuttle tanker is marked as non feasible and offloading is cease. This leads to downtime of offloading operation and downtime cost is calculated. The downtime cost is calculated if the operating expenditure (OPEX) for location is known. The downtime days are the period until when the offloading is ceased. Also, the probability of occurrence of critical wave conditions which are responsible for parametric rolling must be calculated. The present study includes three different location of Malaysian subcontinent. The 50 years hind cast metocean data is obtained from Offshore Engineering Center (OEC), UTP, Perak, Malaysia. With the aid of the real time metocean data, the wave scatters are produced specific to the location. The wave scatter would facilitate to provide the probability of occurrence. The downtime cost is calculated from the following equation, Equation (9). The offloading capacity of shuttle tanker is generally less than the total storage capacity of FPSO. Therefore, the present study on downtime cost was limited to four different capacity of shuttle tanker. In this study, the capacity of shuttle tanker was measure in terms of percentage of total storage capacity of FPSO as 70%, 80%, 90% and 100%. In this study, the total storage capacity considered is 318,000 barrels of oil. The variation of downtime cost with respect to the offloading capacity of shuttle tanker is presented.The OPEX is fluctuating with respect to location and dependant on various other parameters which are beyond the scope of present study. However, in the present study OPEX is uniform for all the three locations of interest. The OPEX considered is US$ 35 per barrel of oil. The OPEX in this study is for illustration and does not reflect any particular operator or location in Malaysia.
where, ‘z’ is the downtime cost, ‘a’ is the probability of the occurrence of waves, ‘b’ is the downtime days, ‘c’ is the operating cost per barrel of oil and ‘d’ is the offloading capacity of oil in barrels per day. The considered locations are marked as location ‘A’, ‘B’ and ‘C’, respectively. The wave scatter for location ‘A’ is shown in Table 5.
4. Results and Discussion
4.1. Investigation on Parametric Rolling
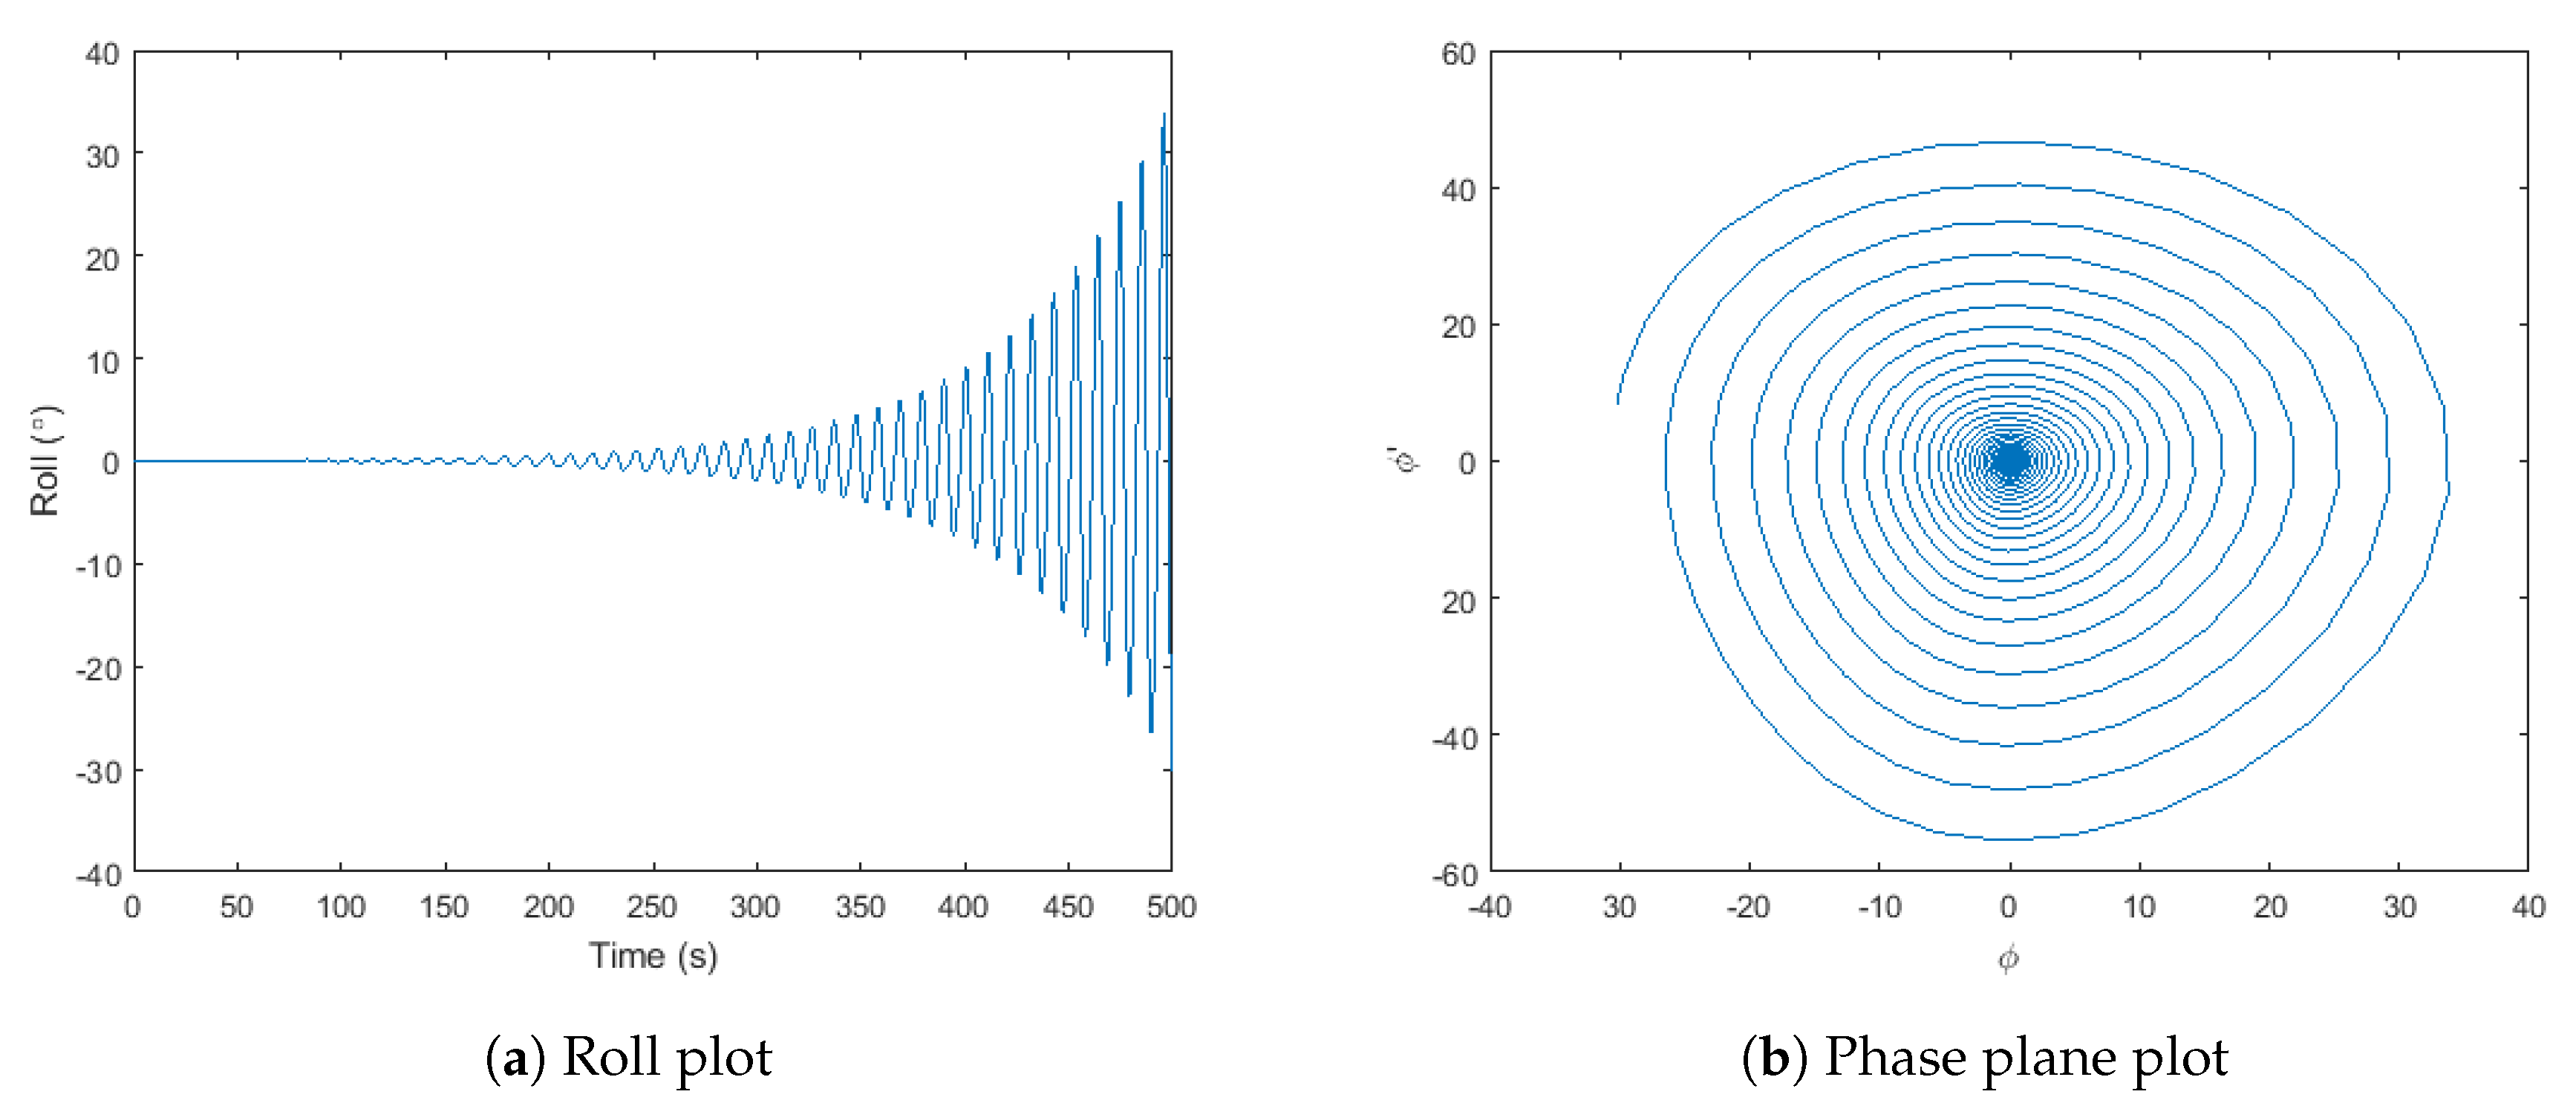
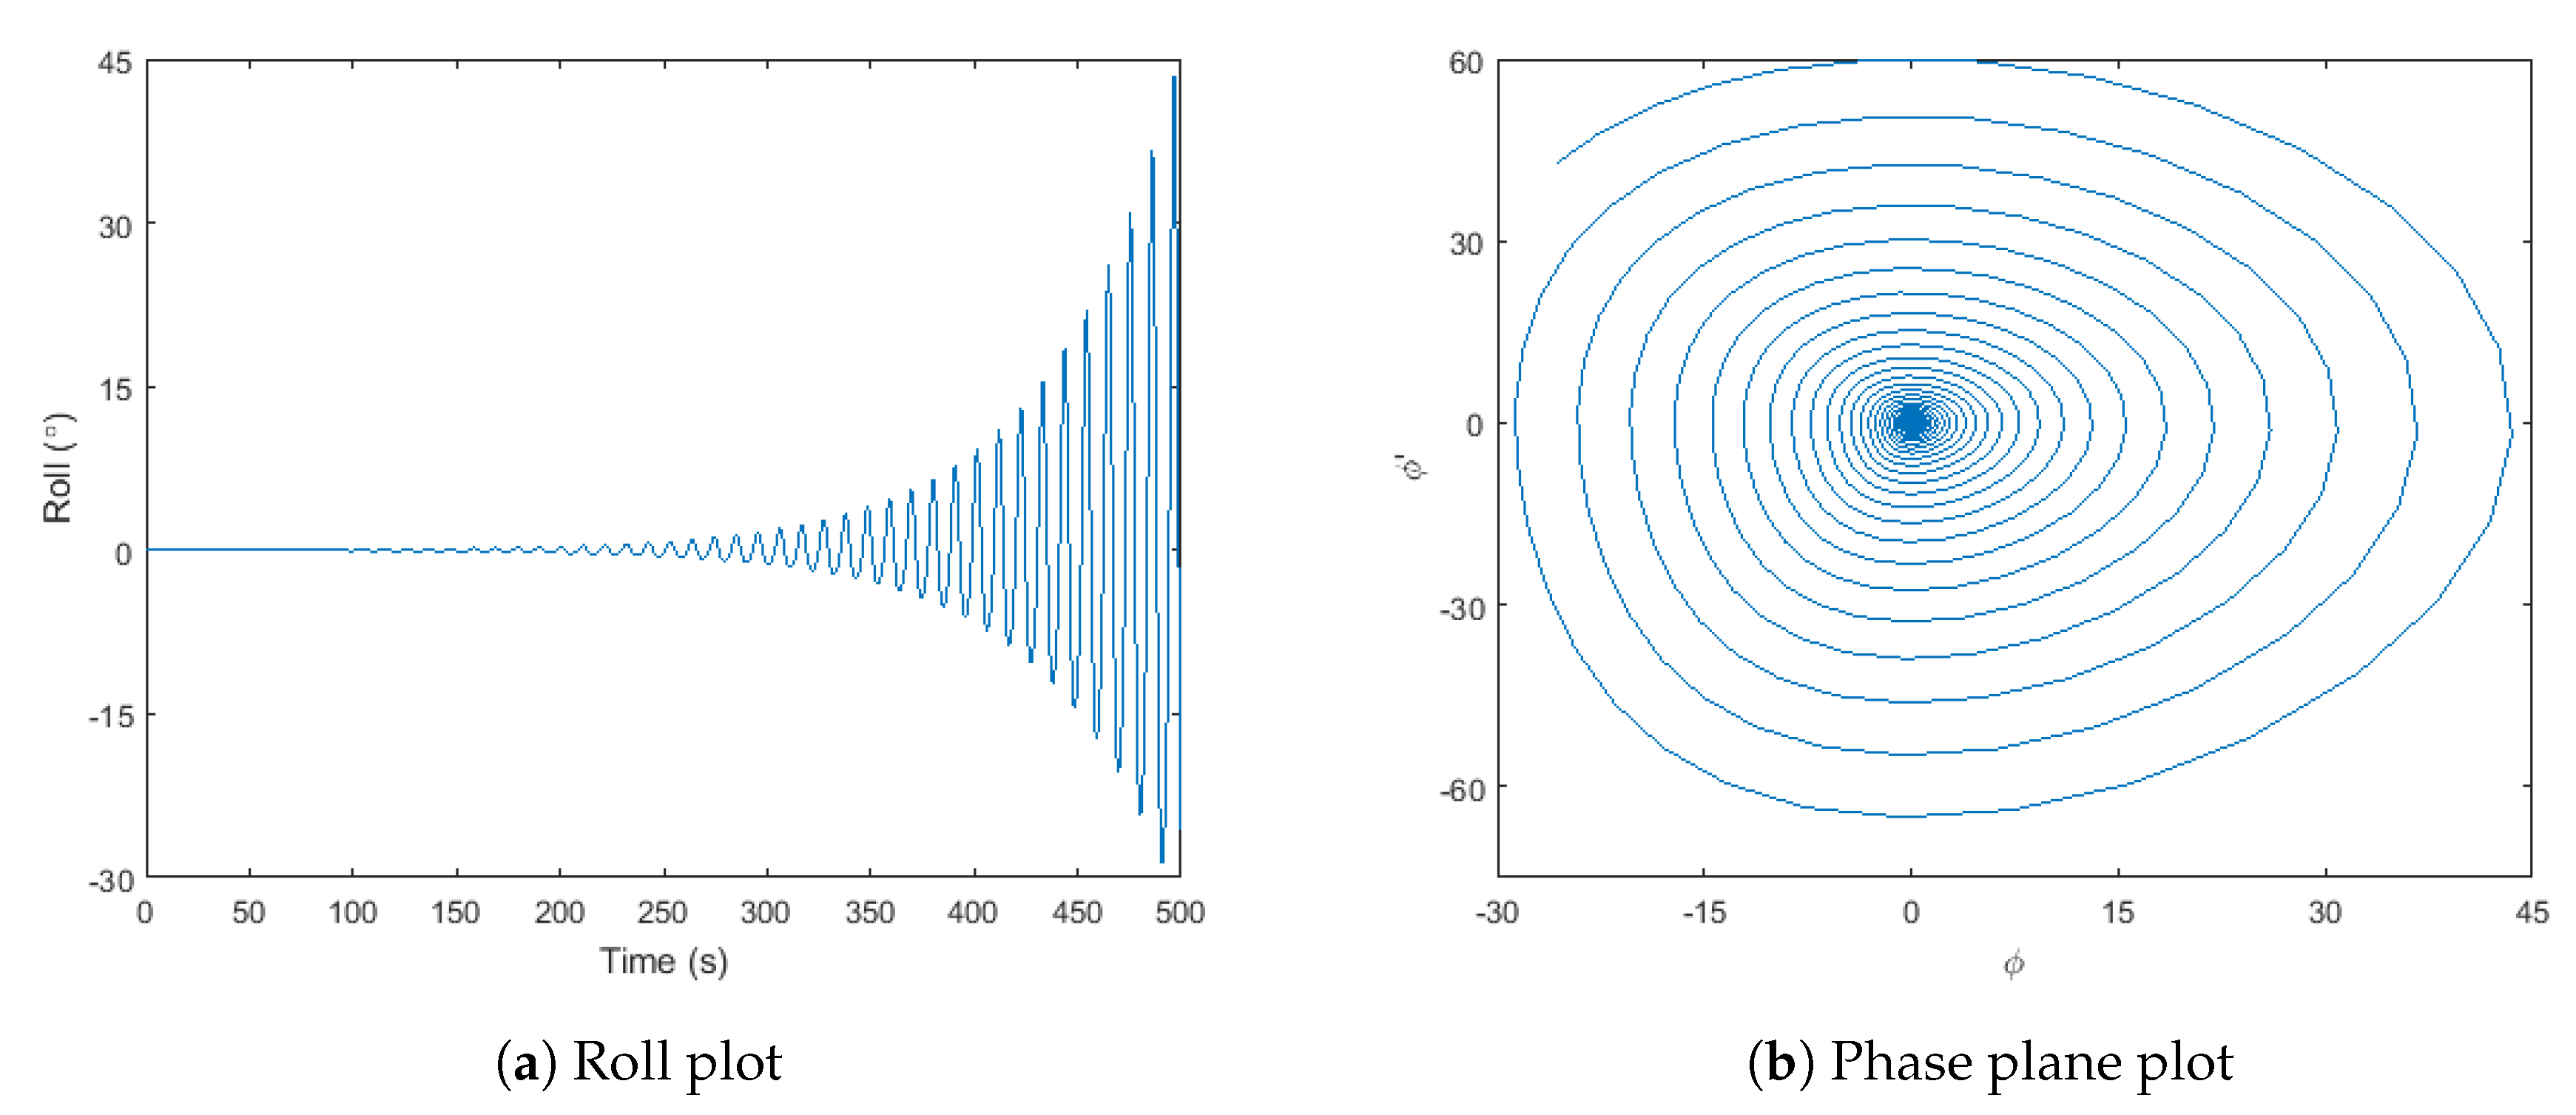
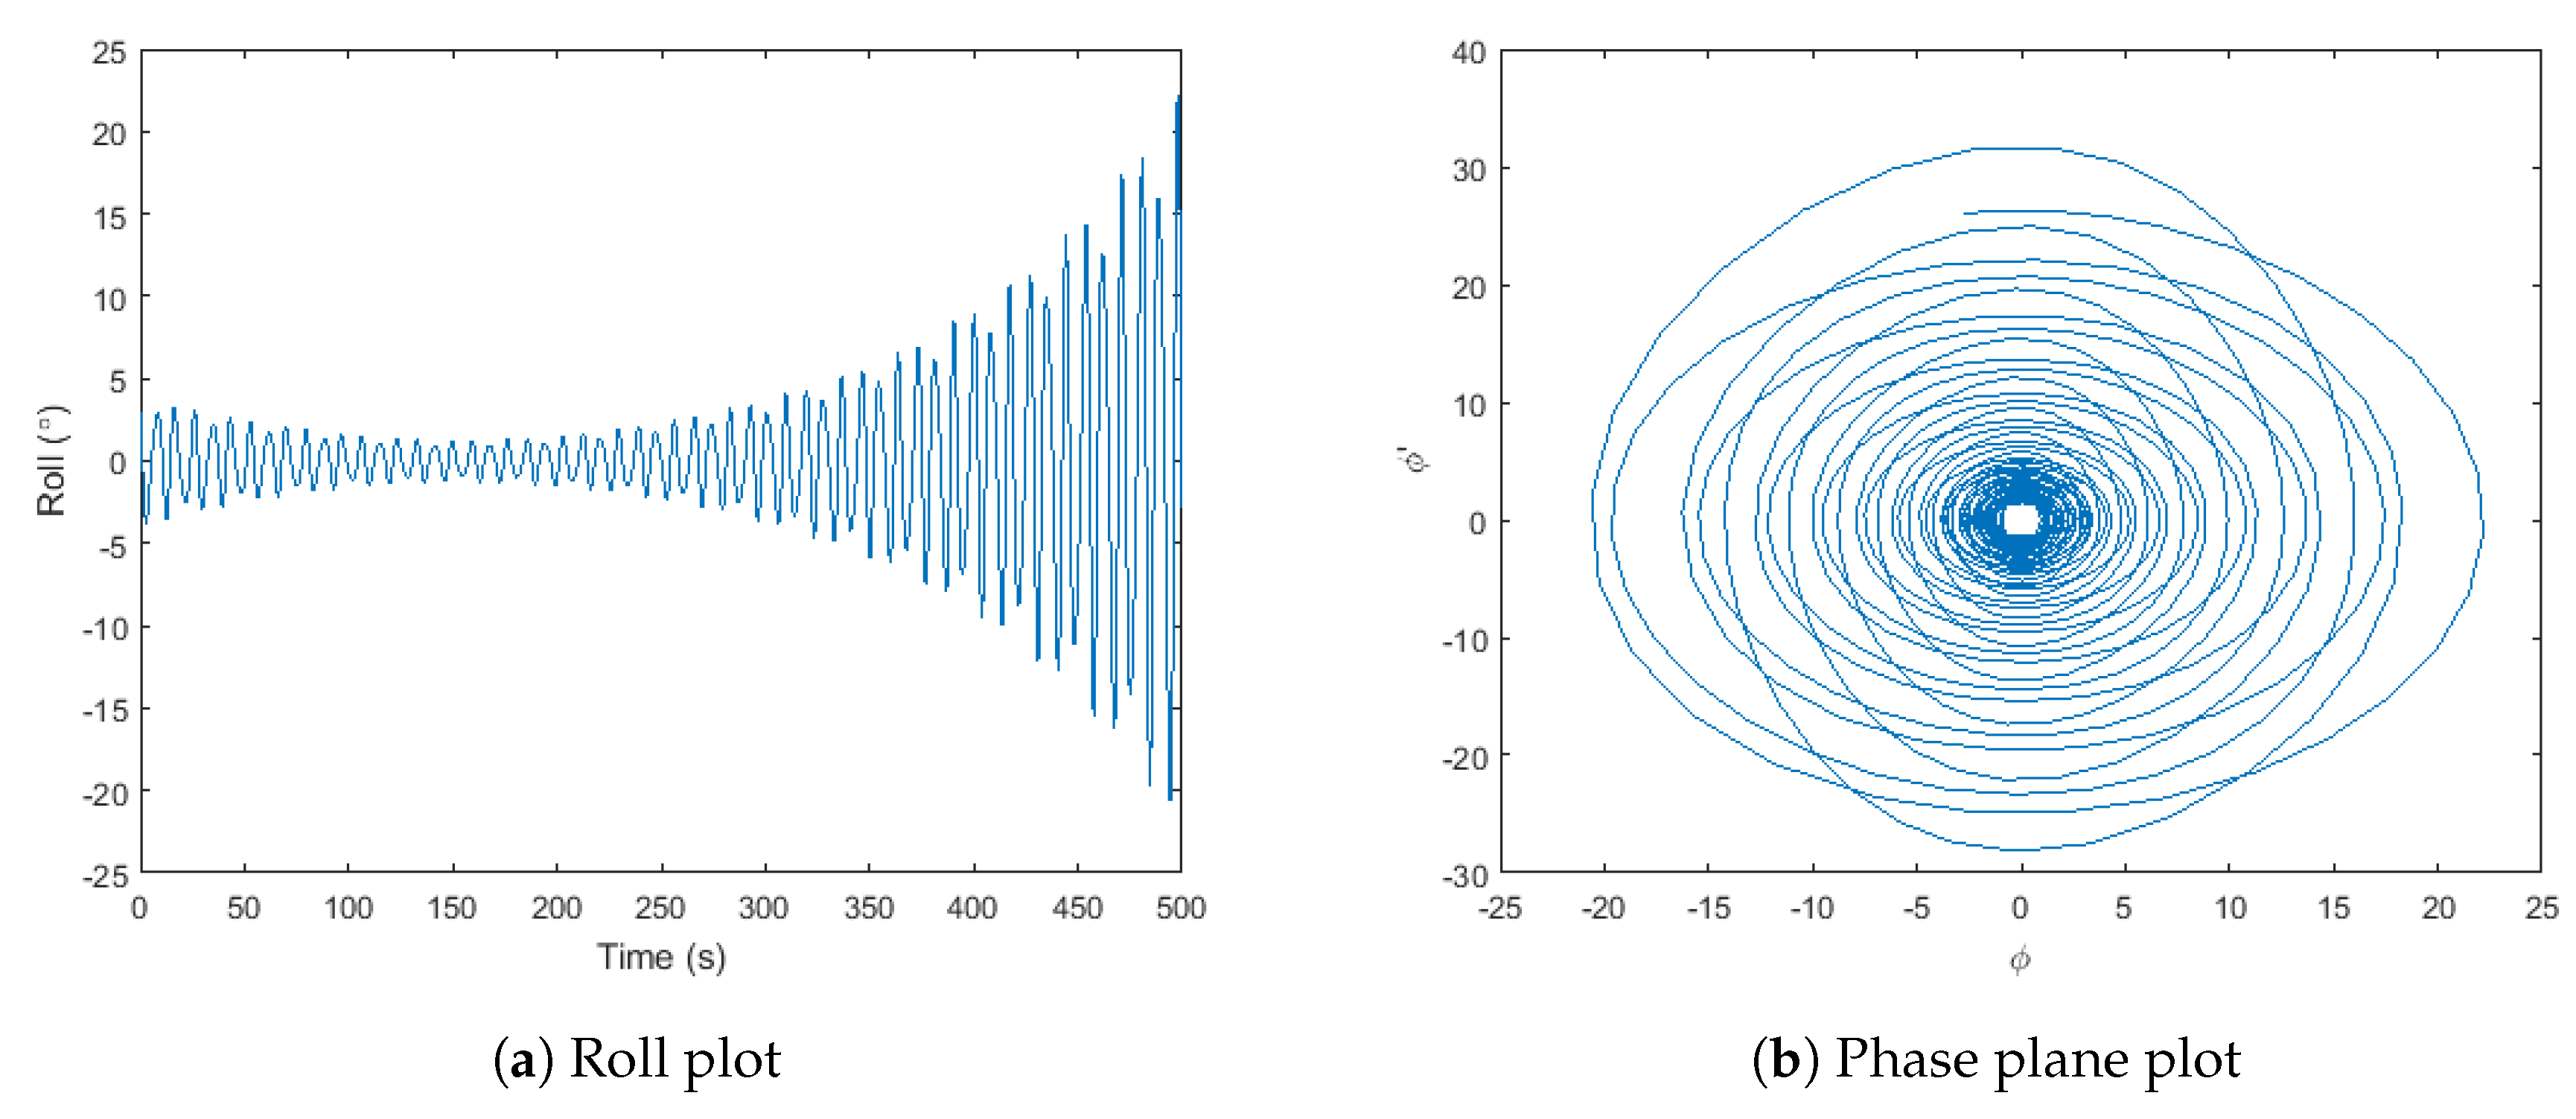
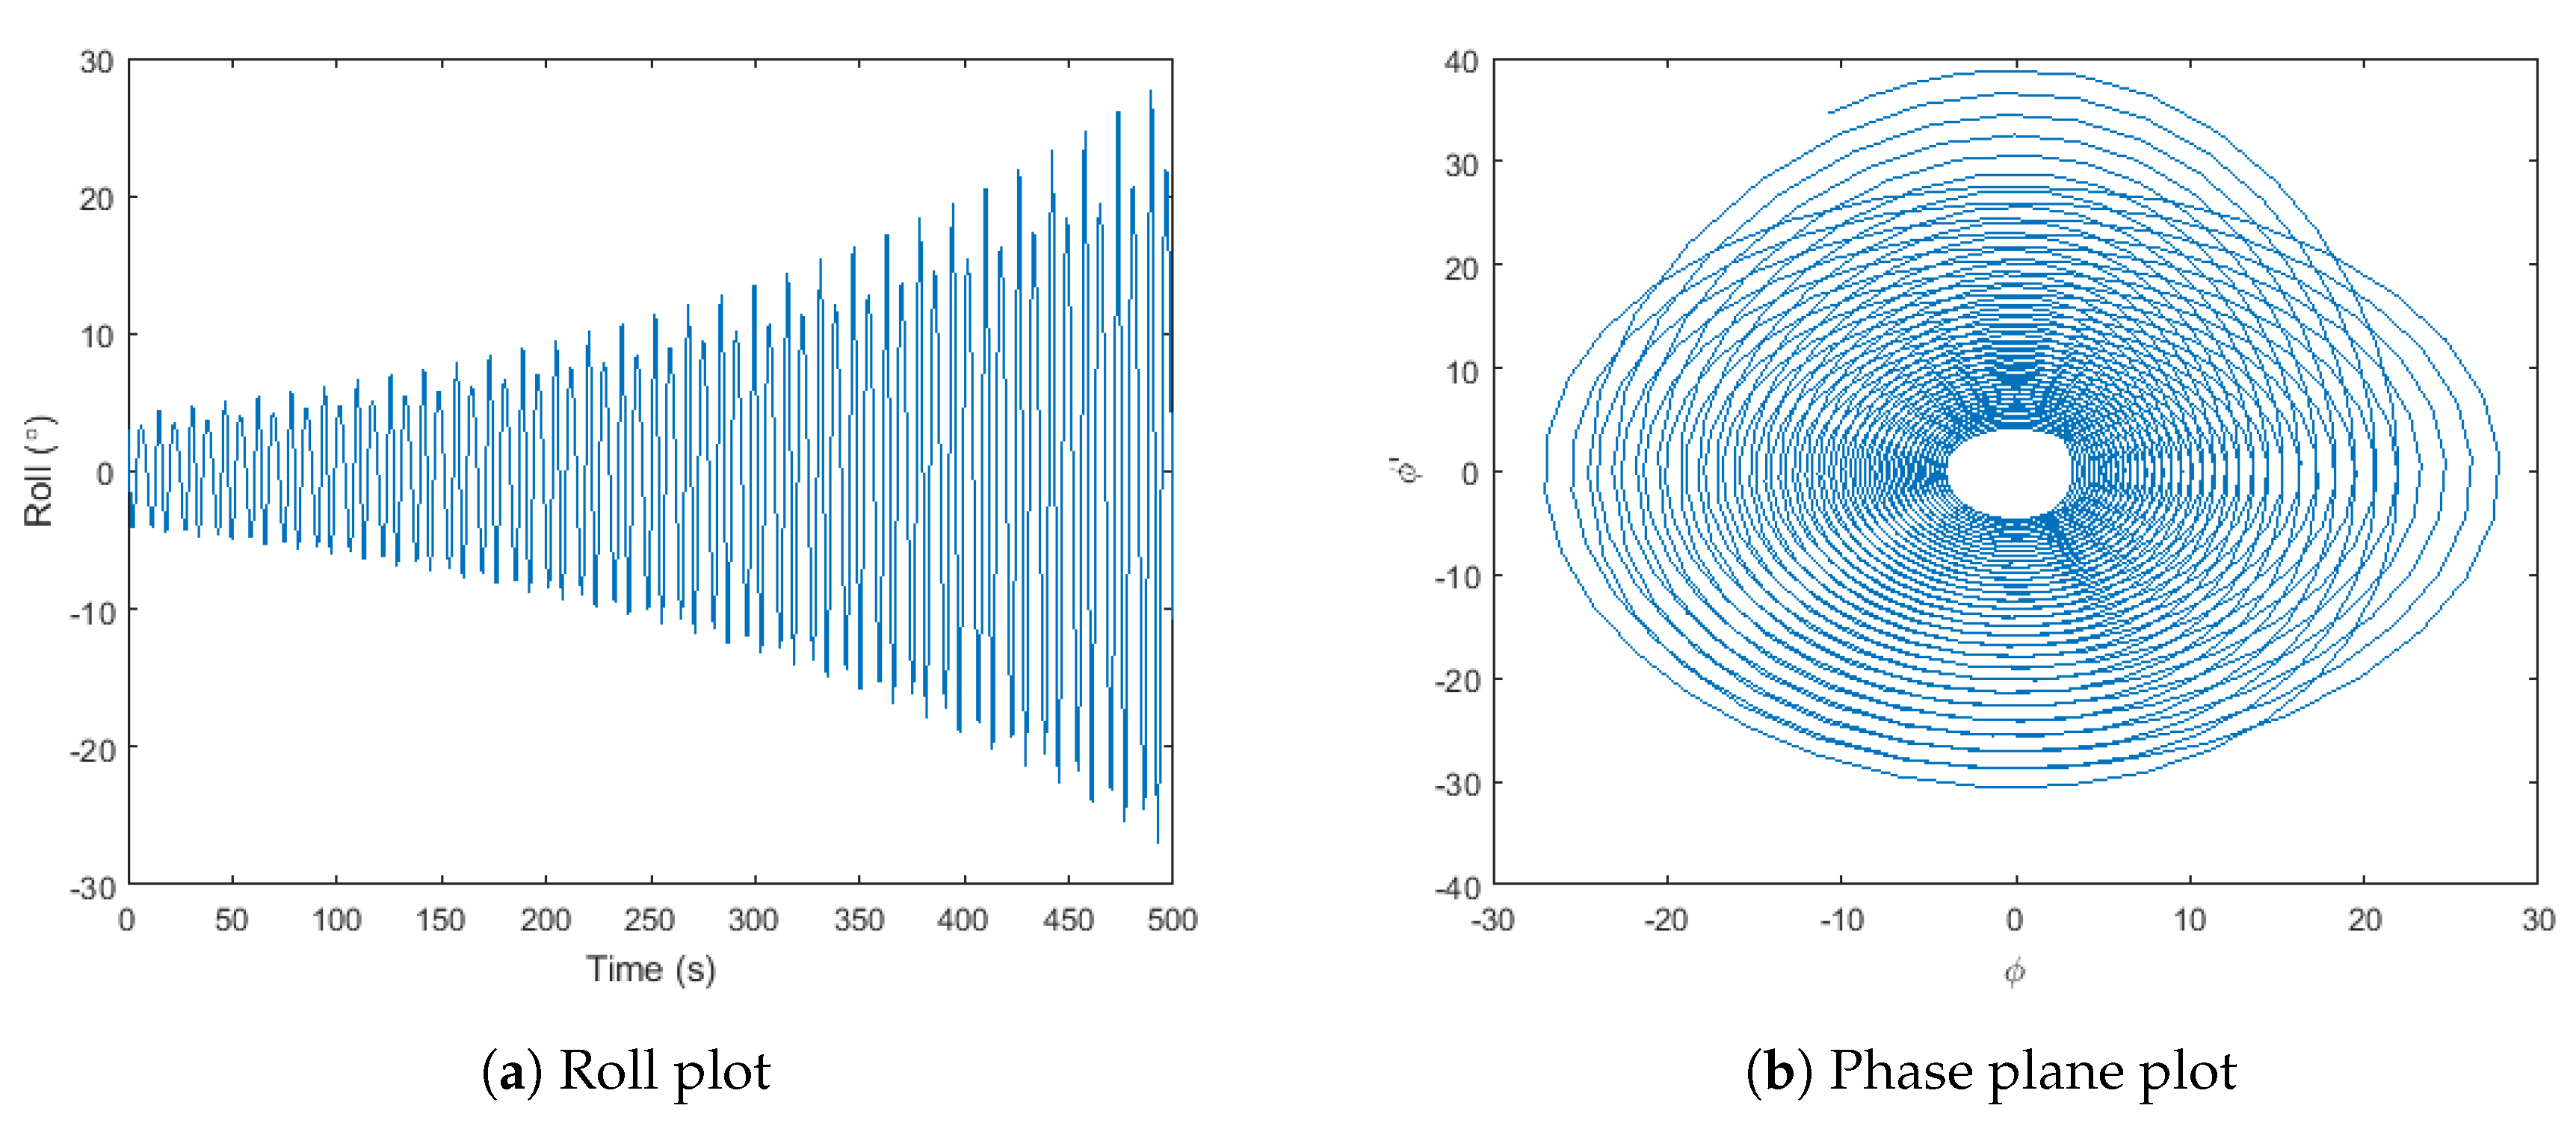
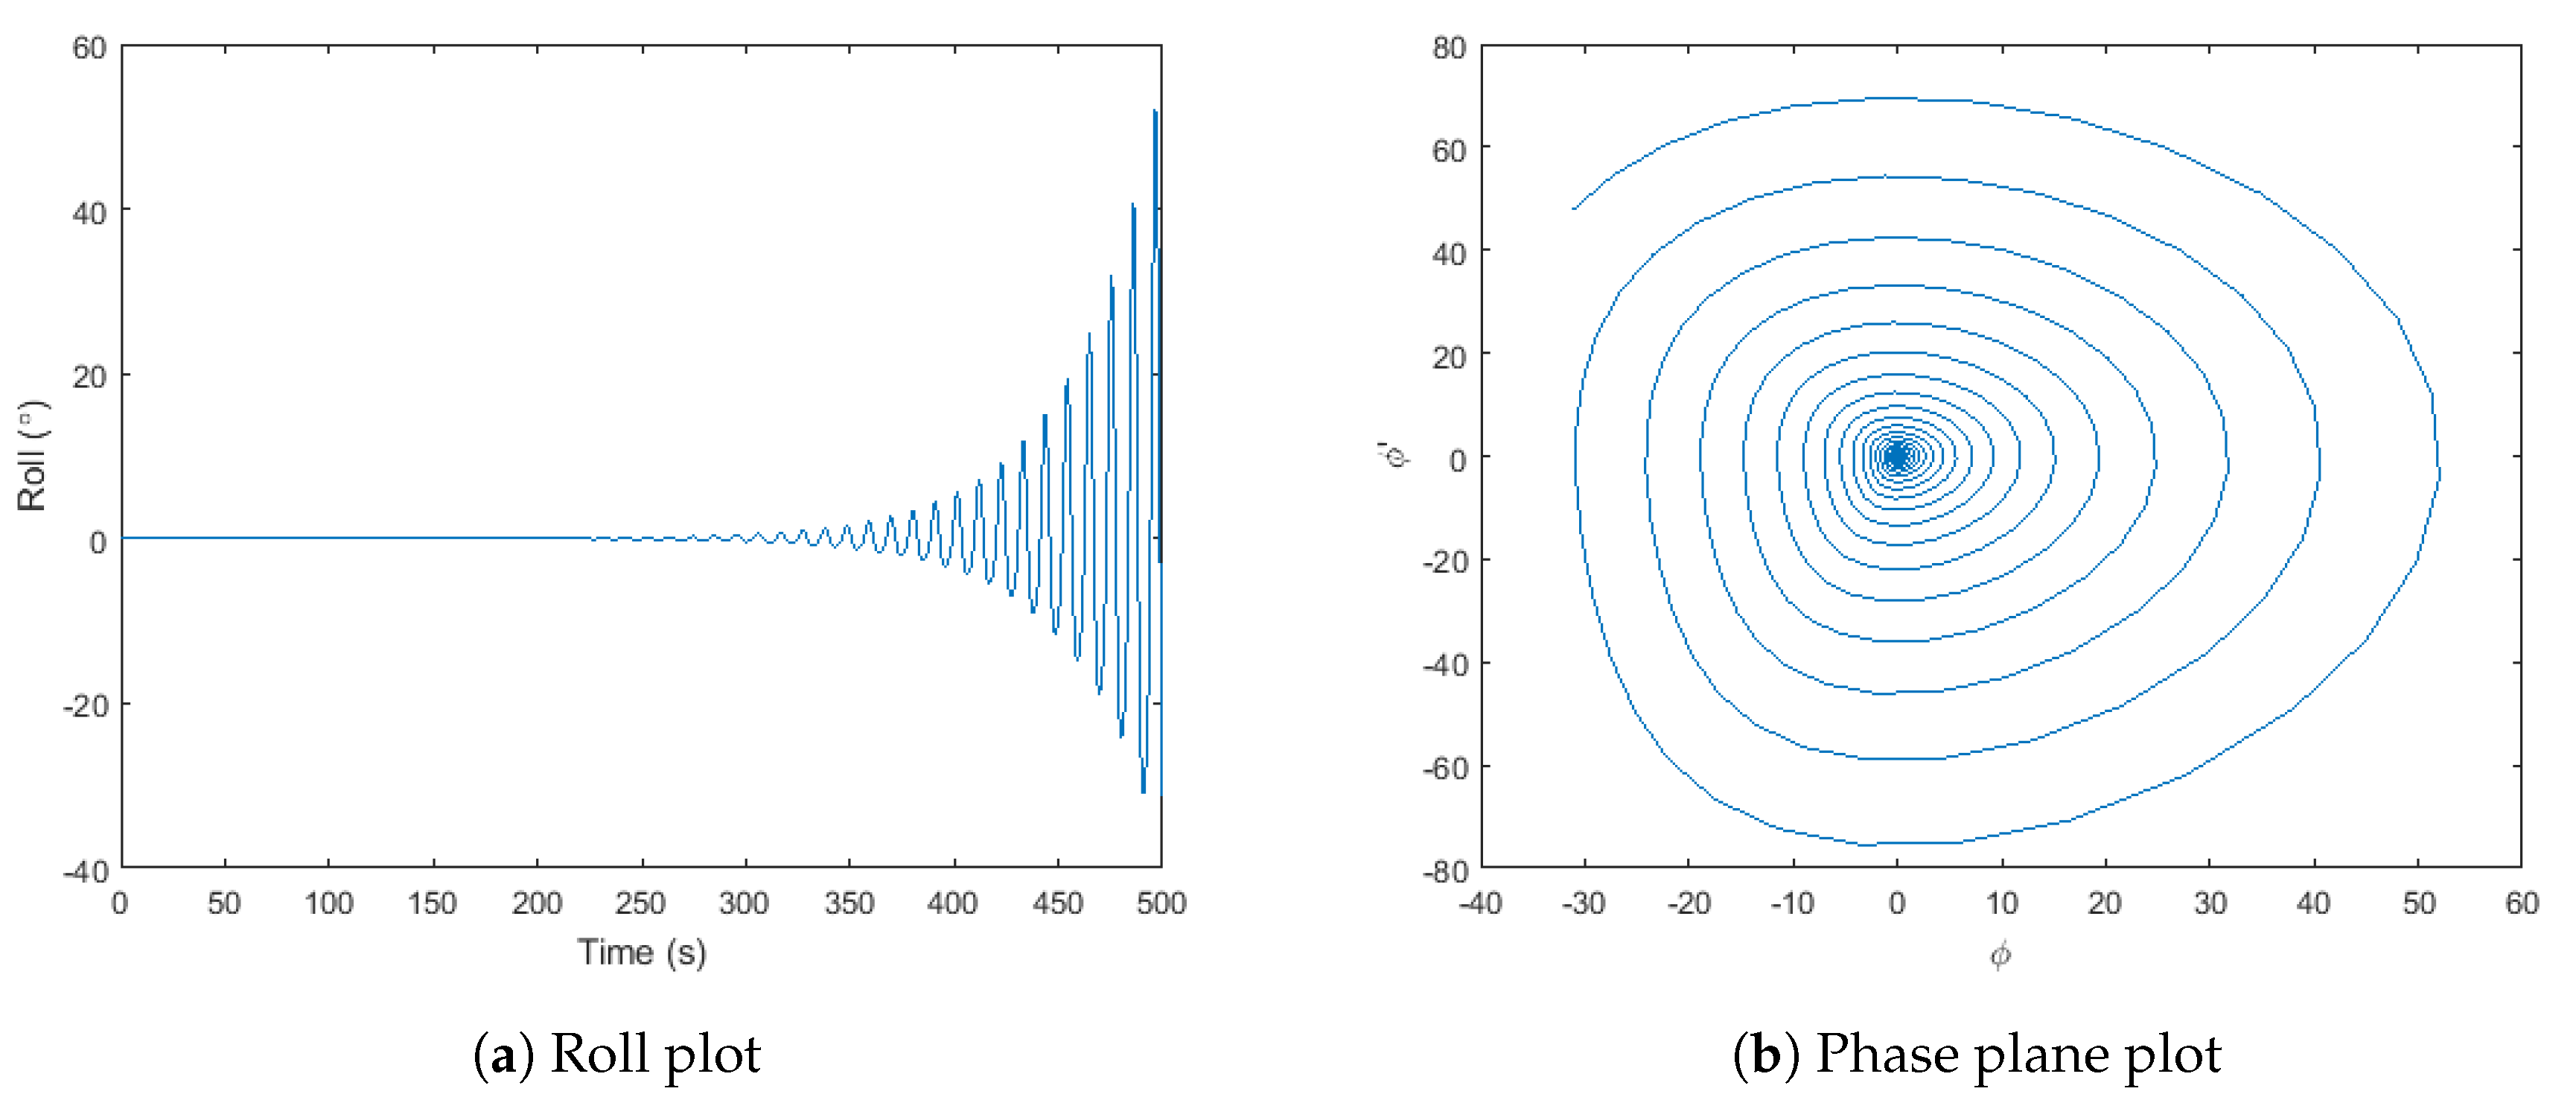
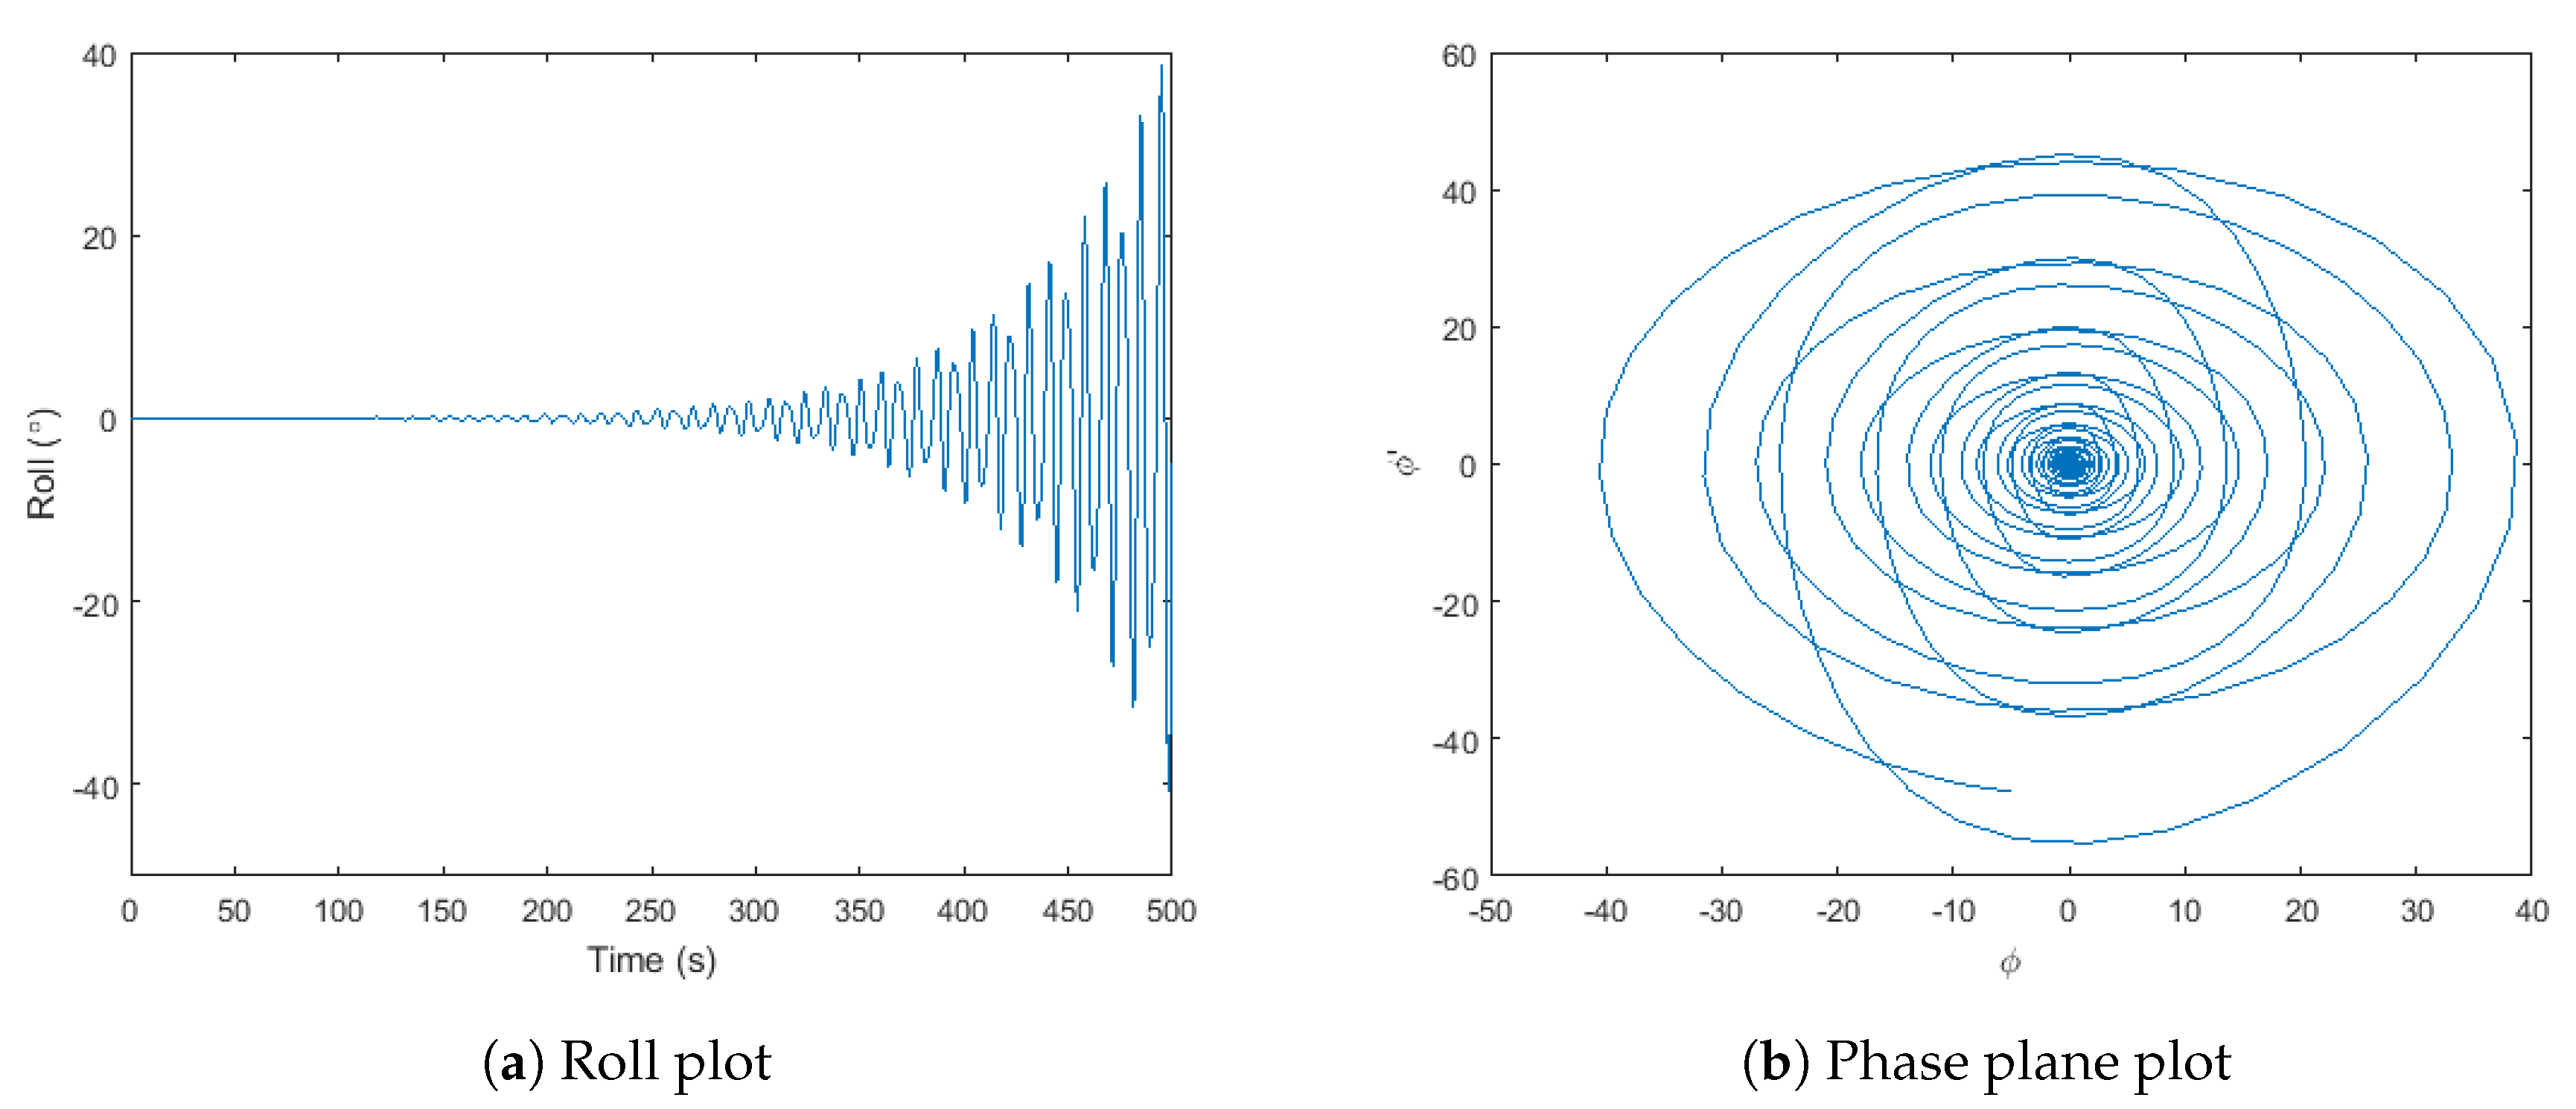
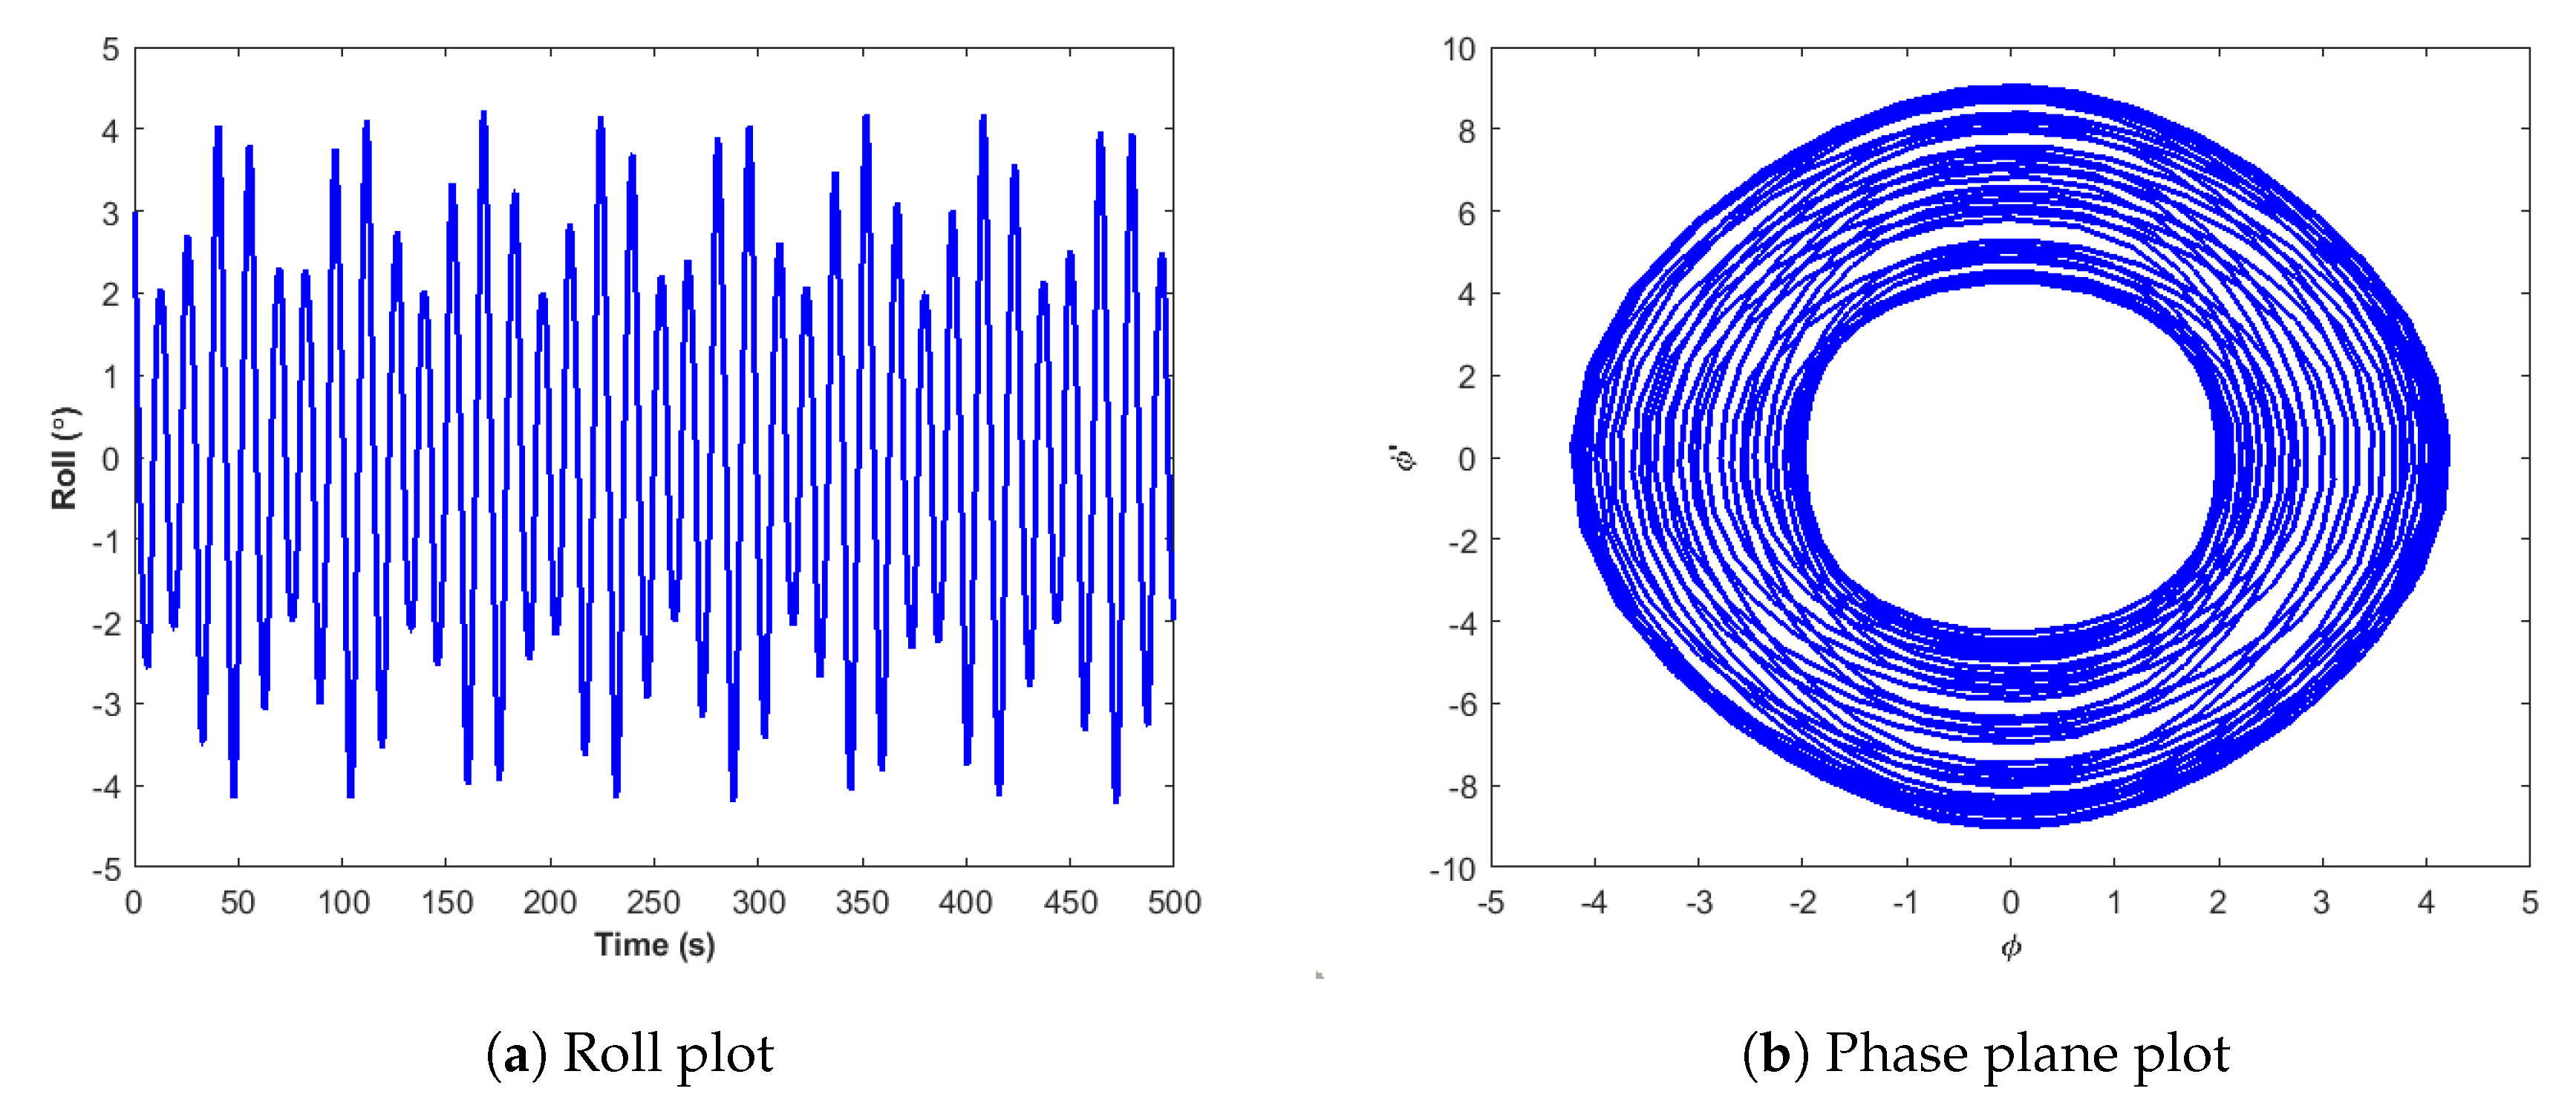
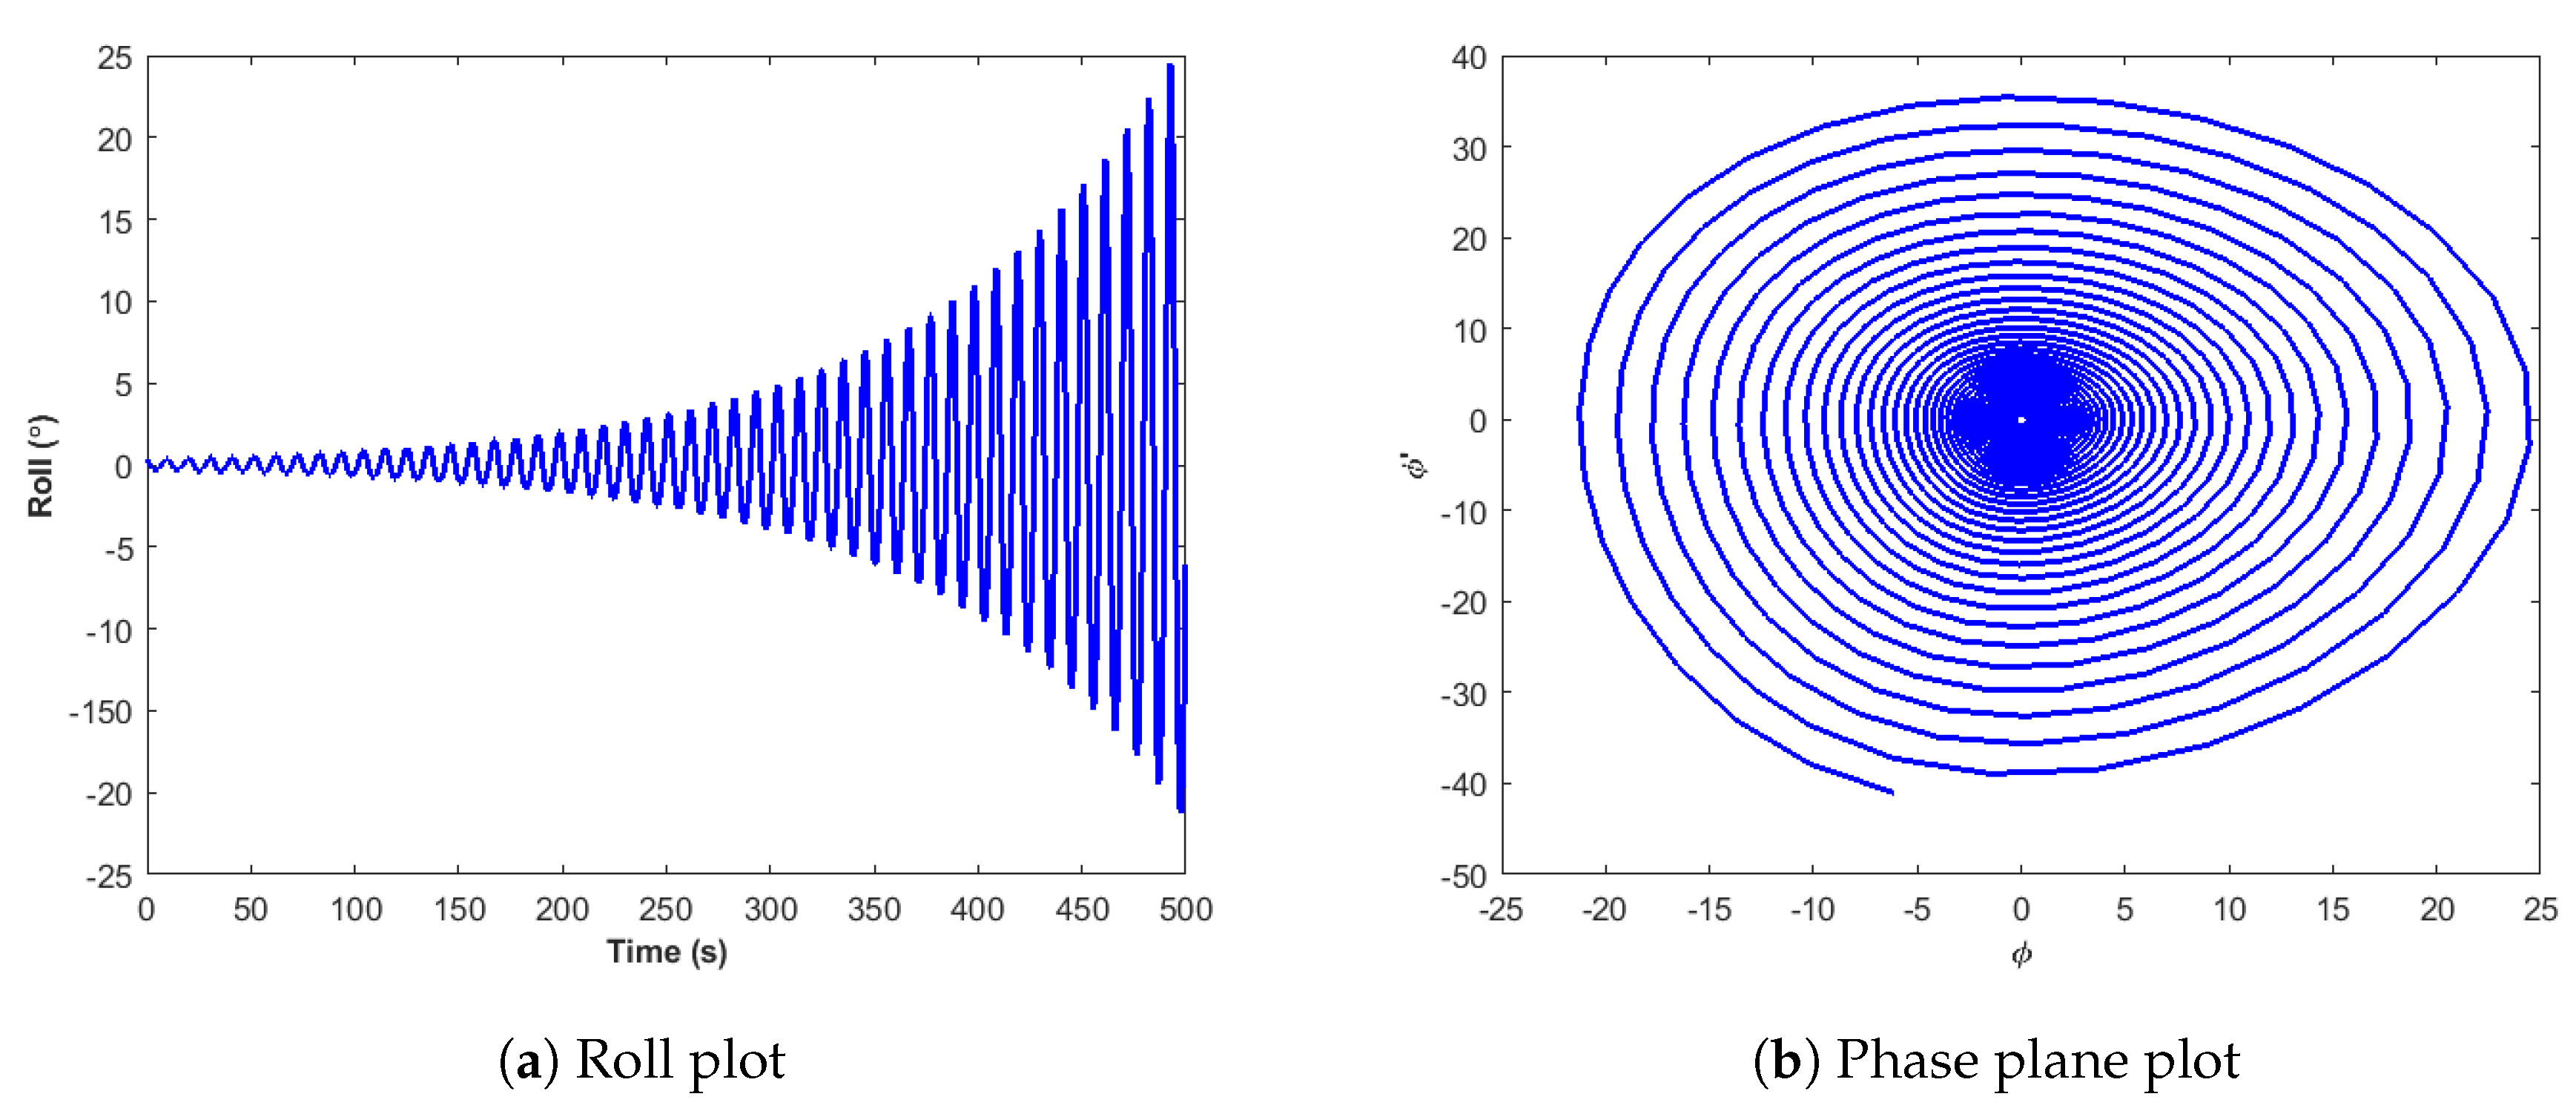
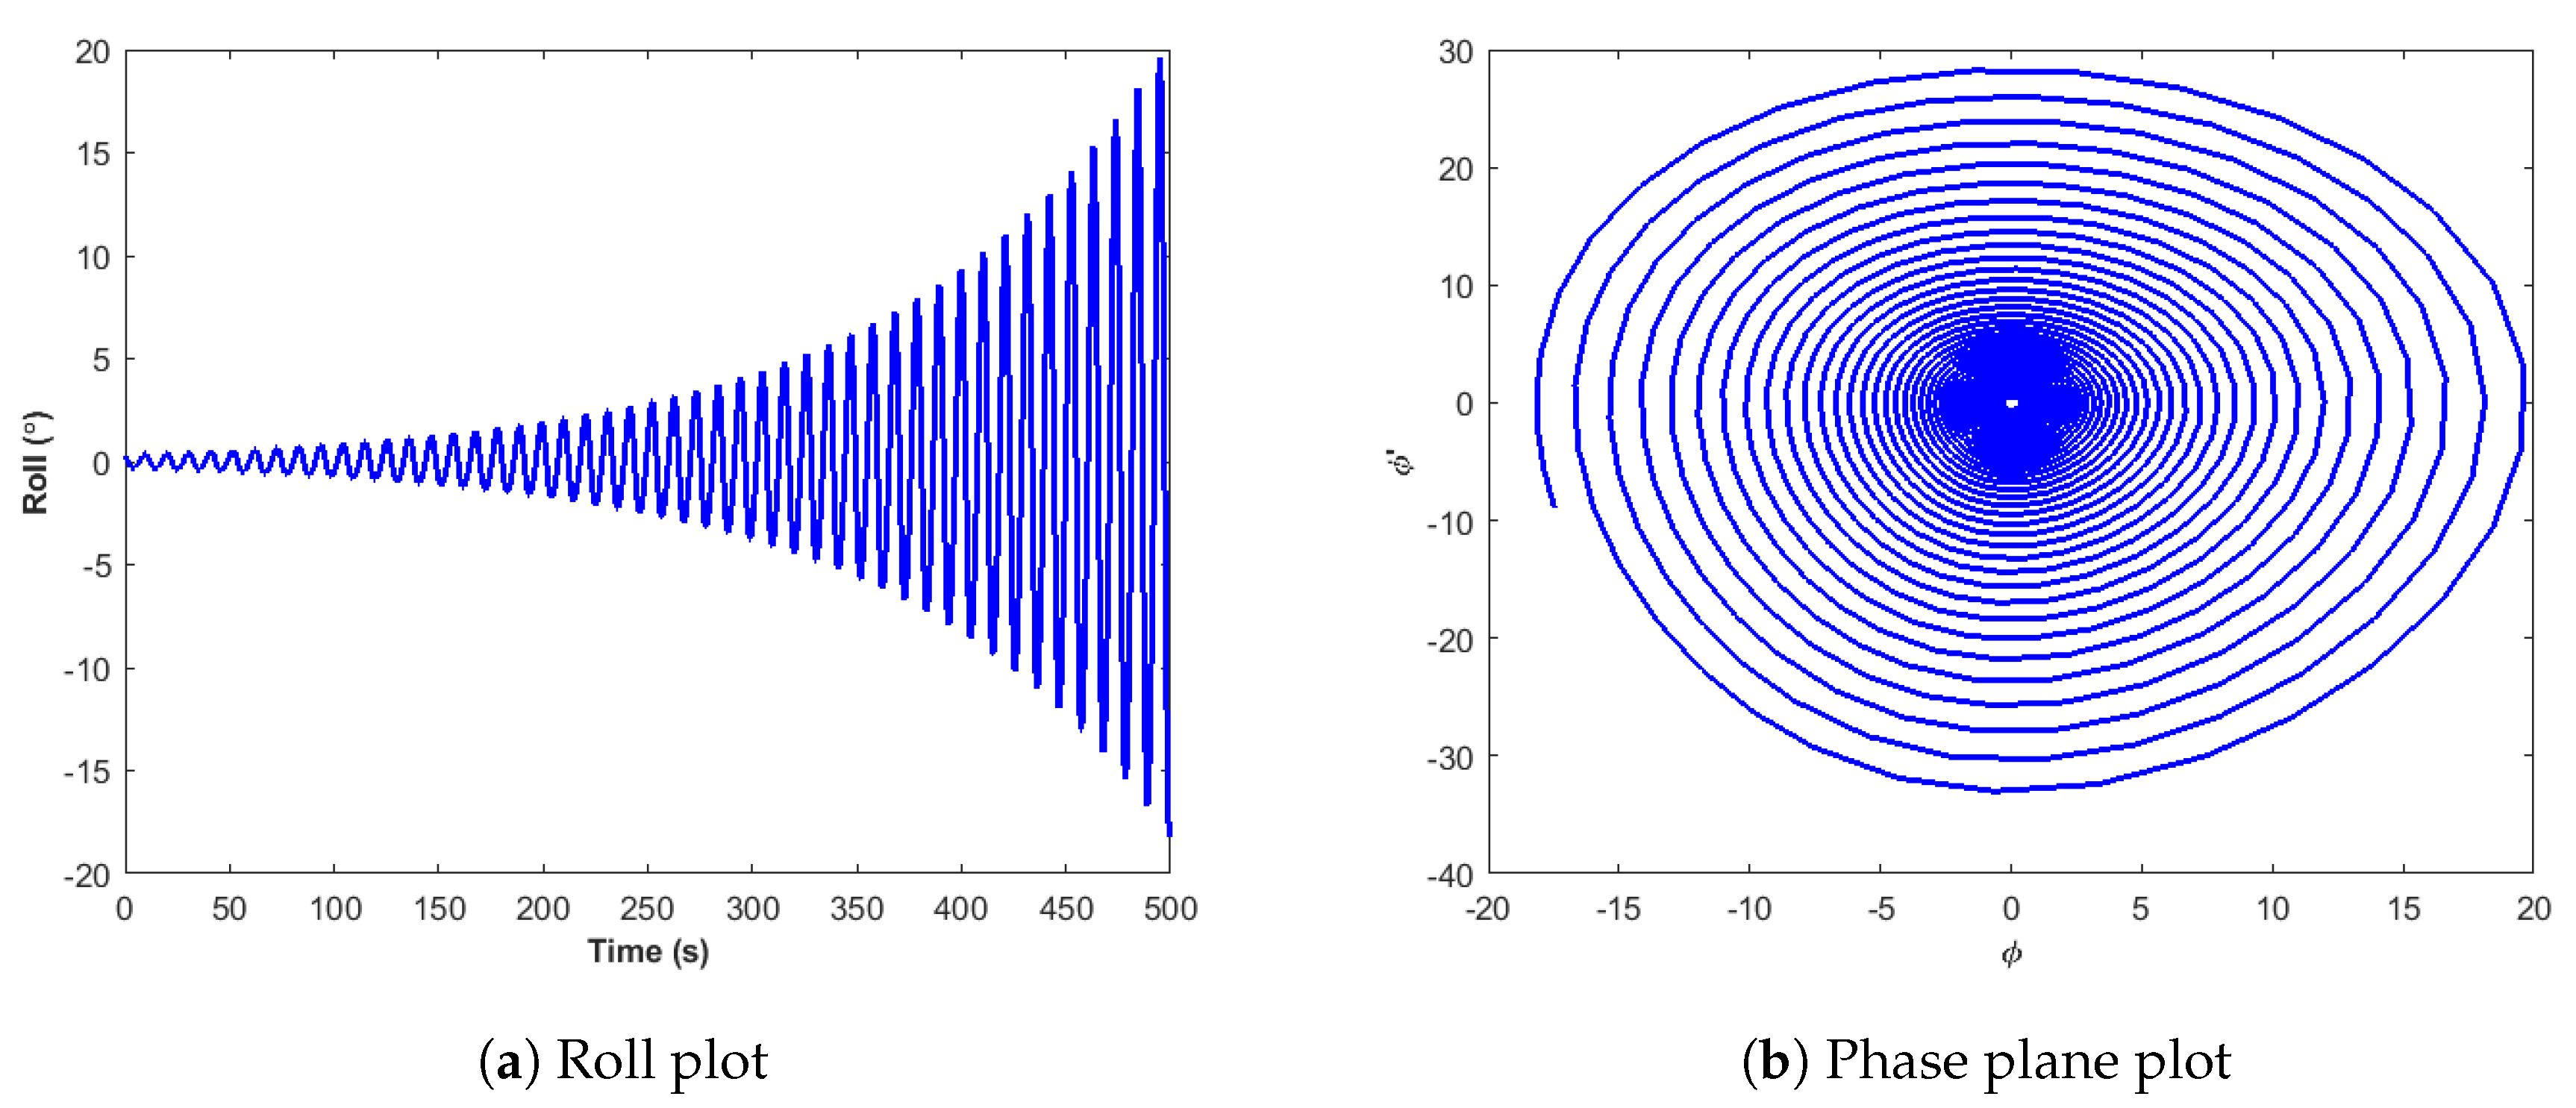
The ABS criteria for both the water depths were investigated for parametric roll. The roll plots are plotted for unstable region. For an region which is influenced by parametric rolling, the roll phase plot is unbounded and regarded as unstable for offloading operations. The unstable roll plots were supplemented with their unbounded phase plane plots.
4.1.1. Water Depth is 50 m
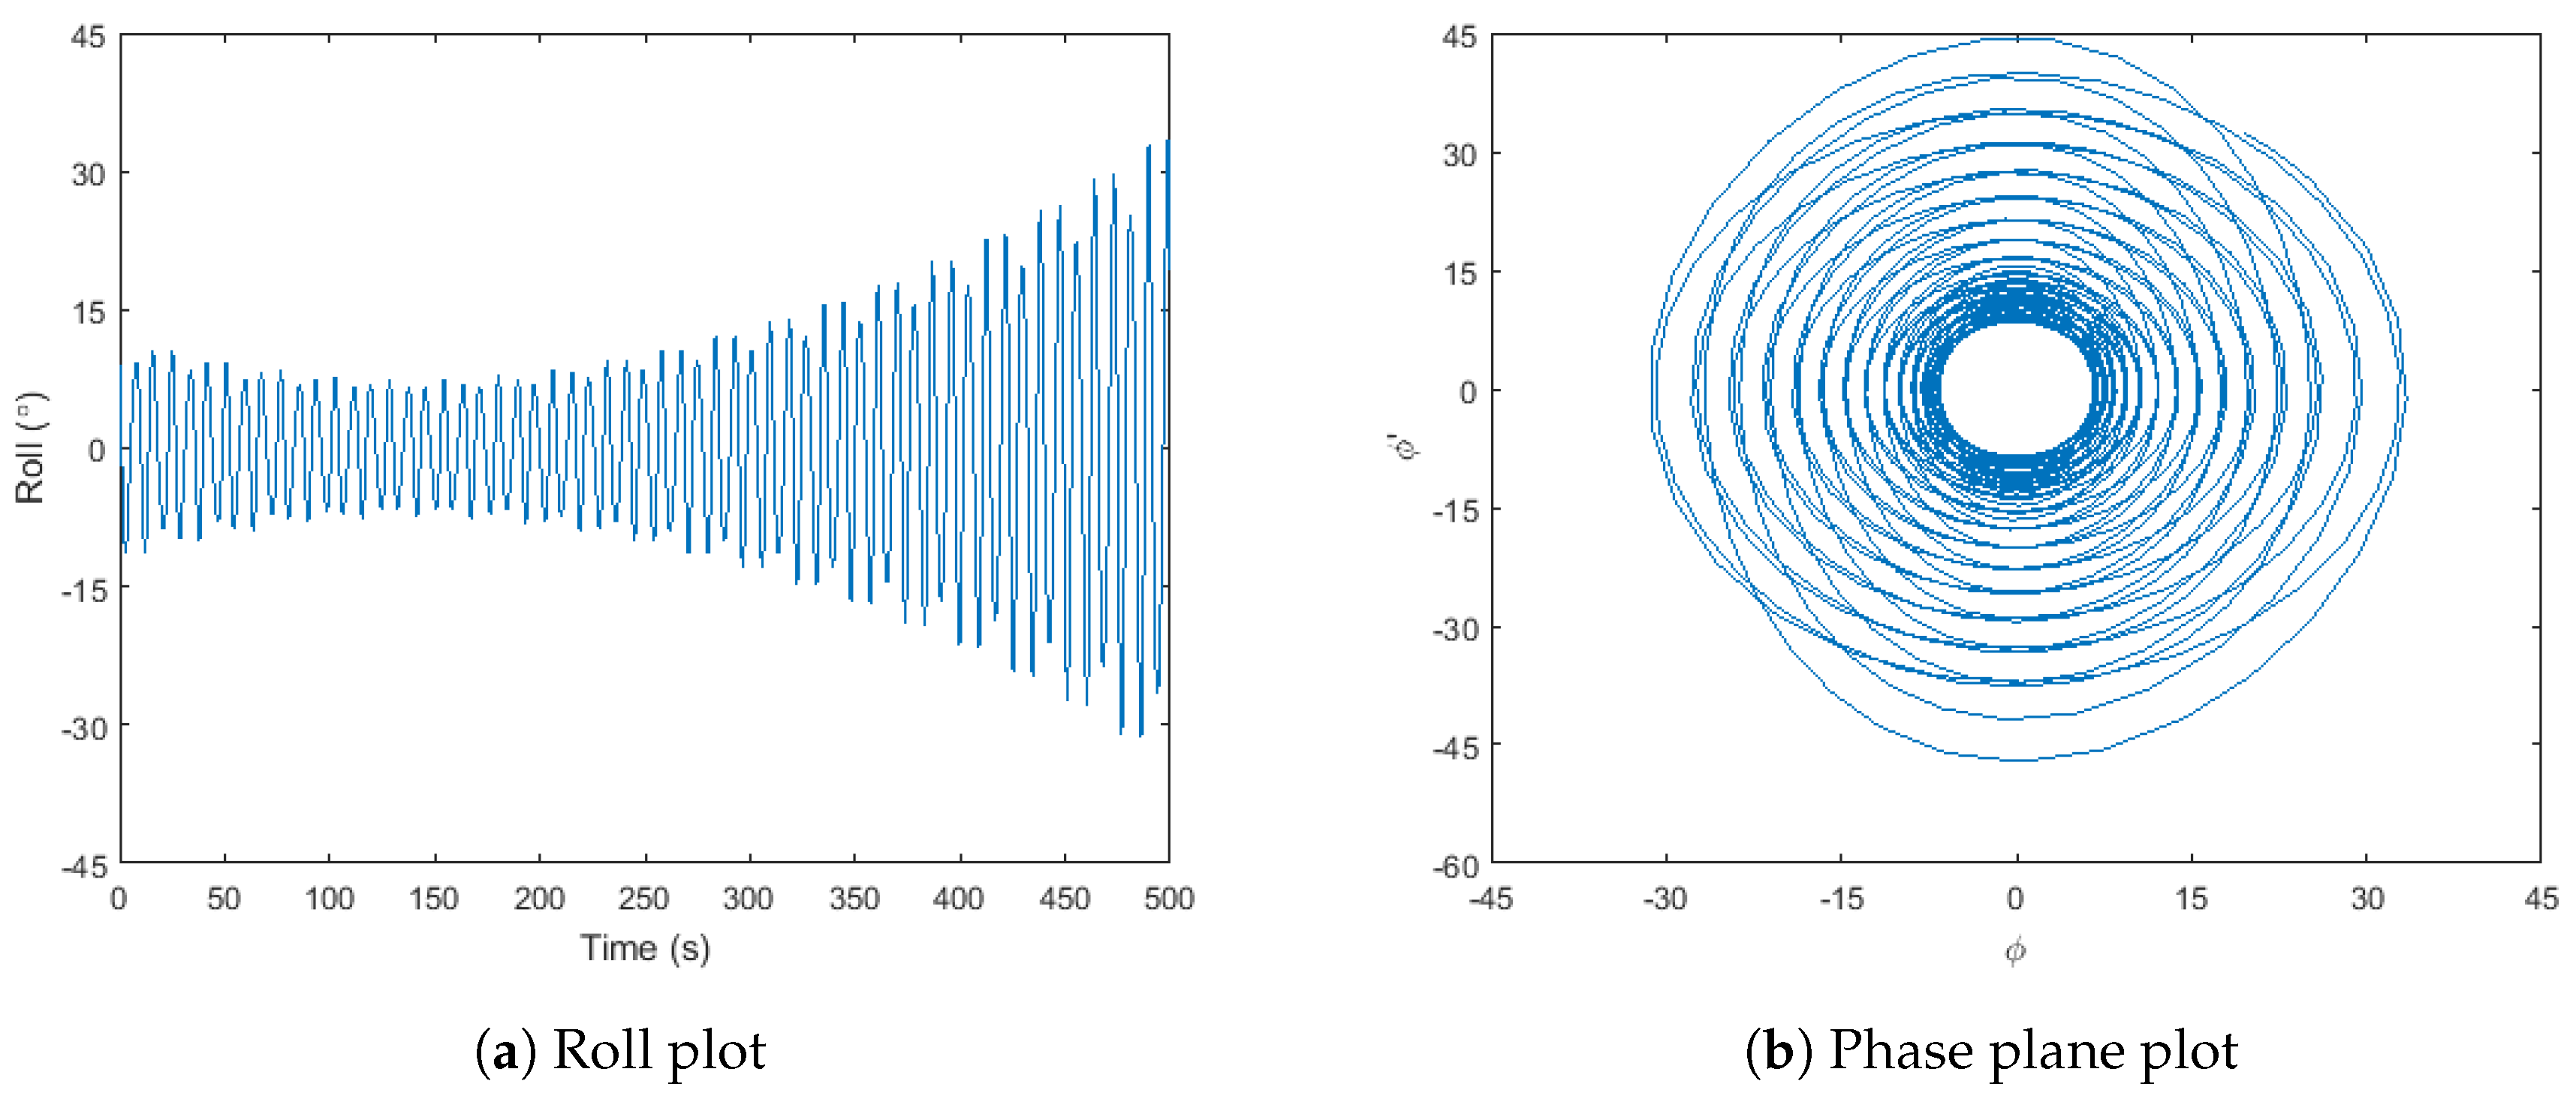
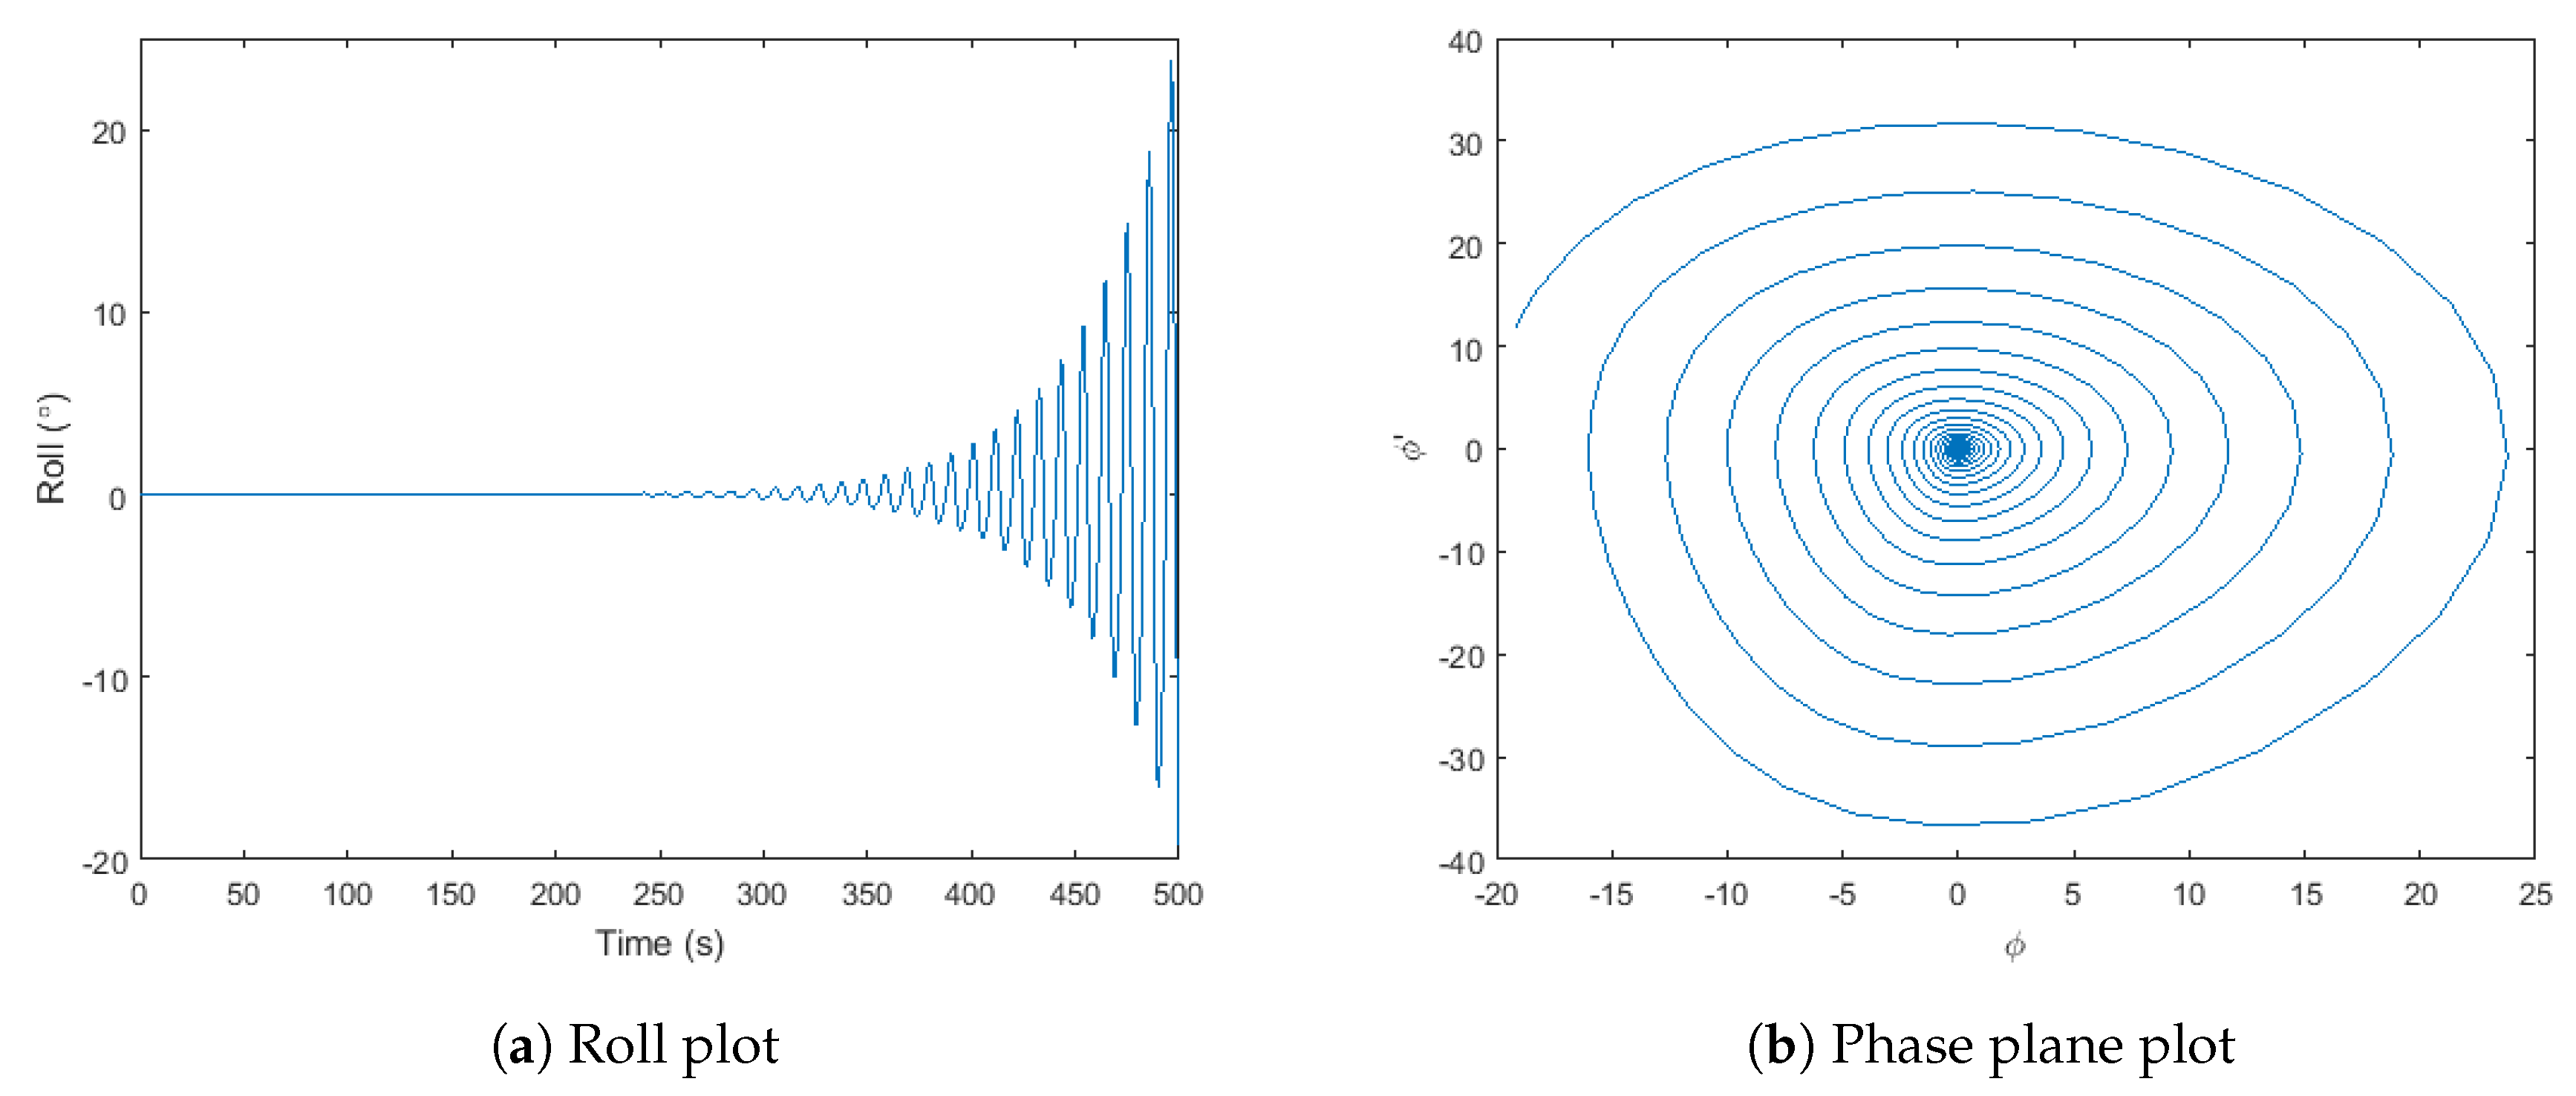
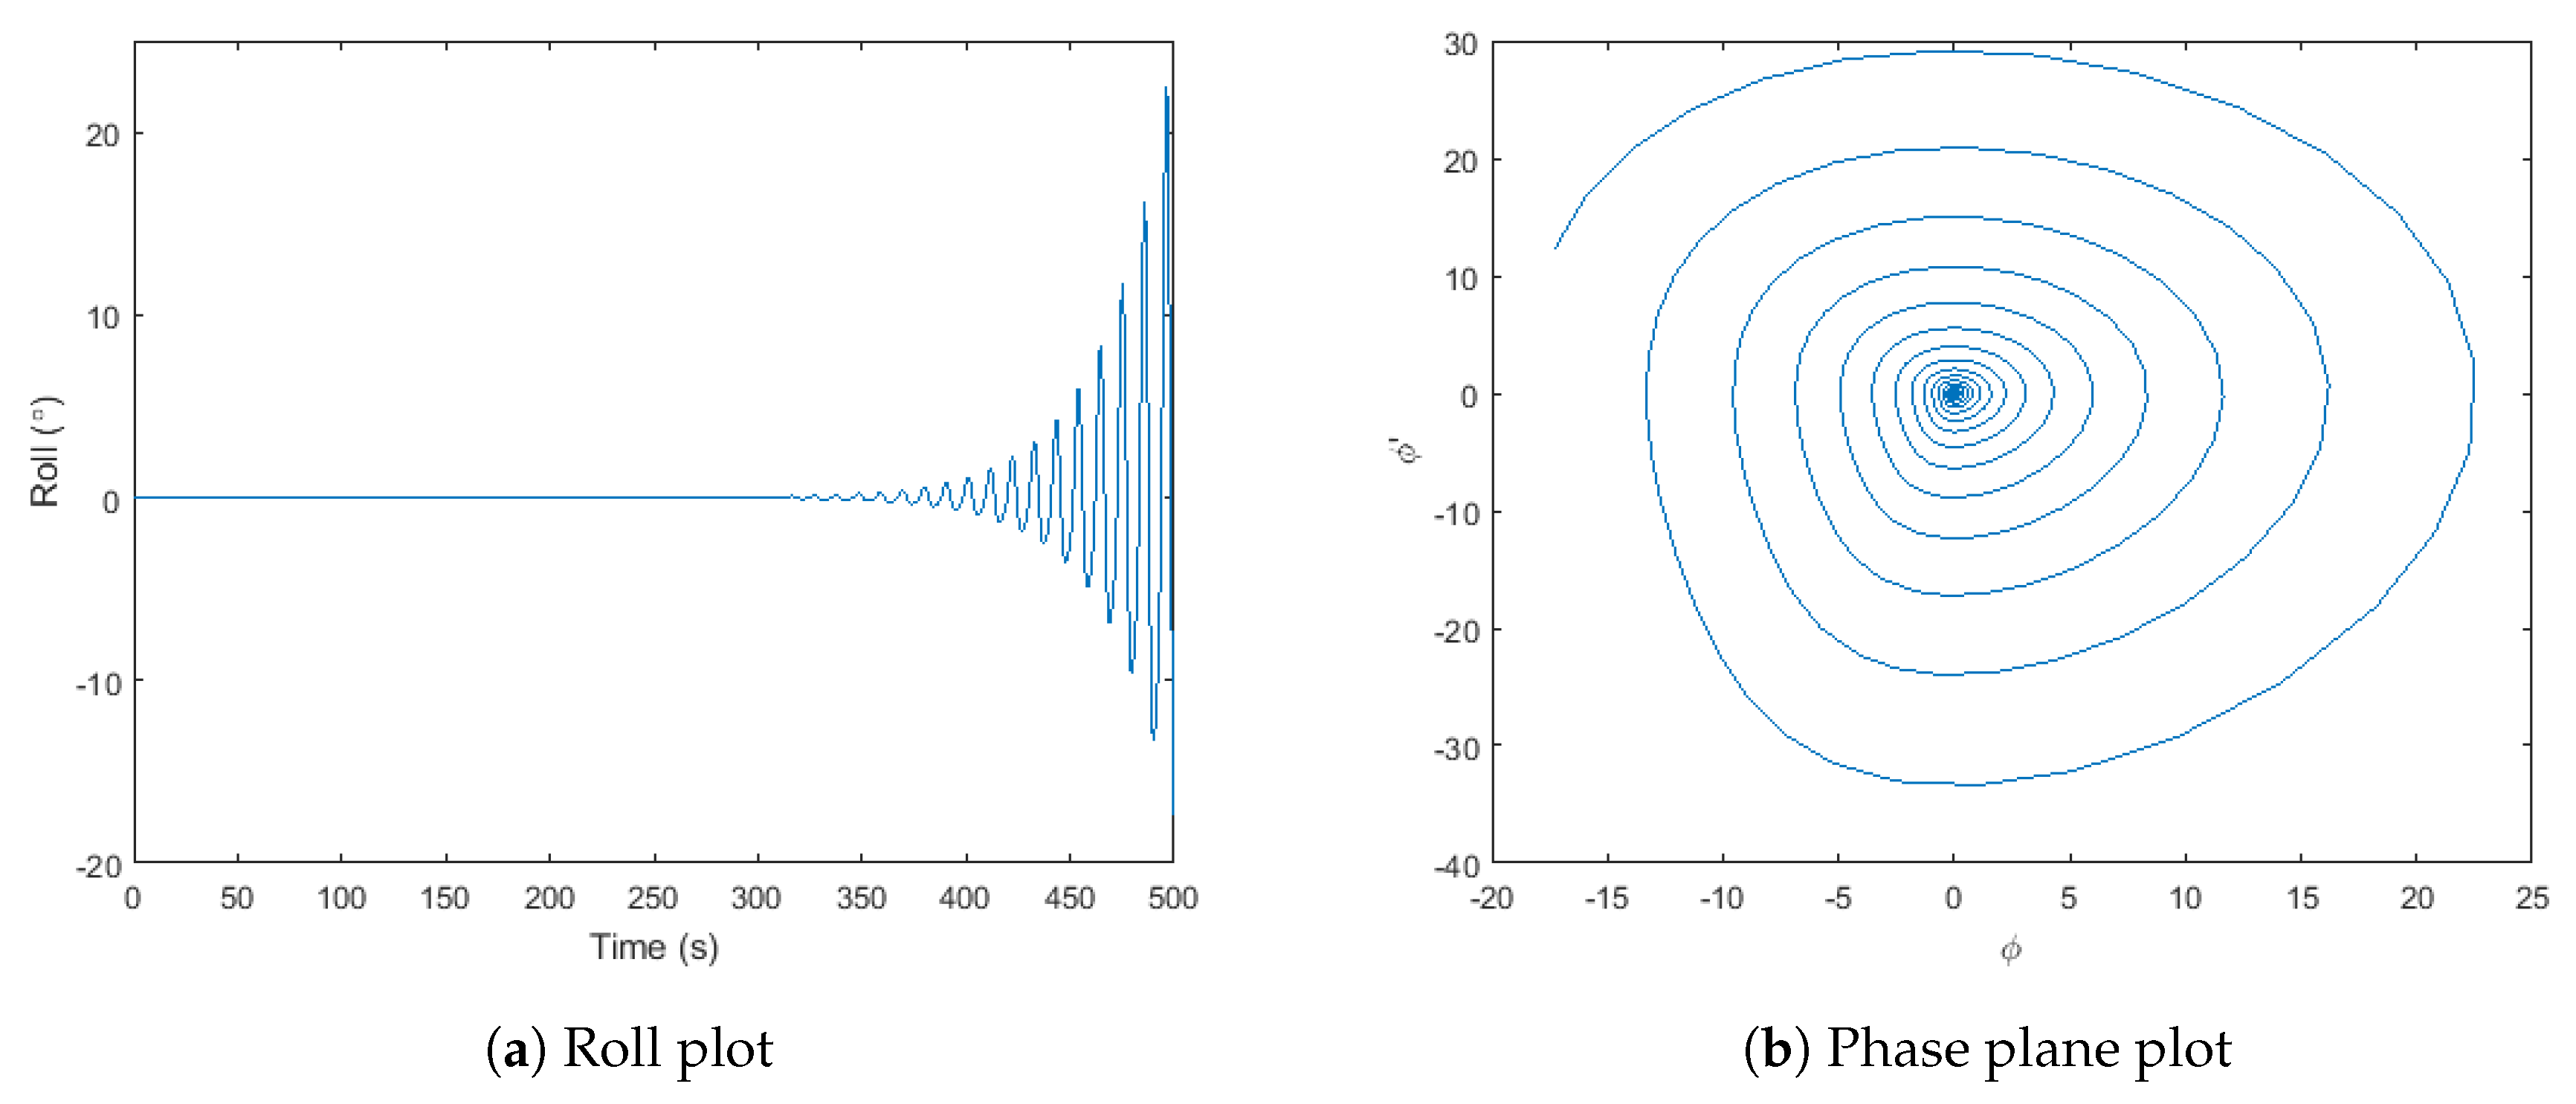
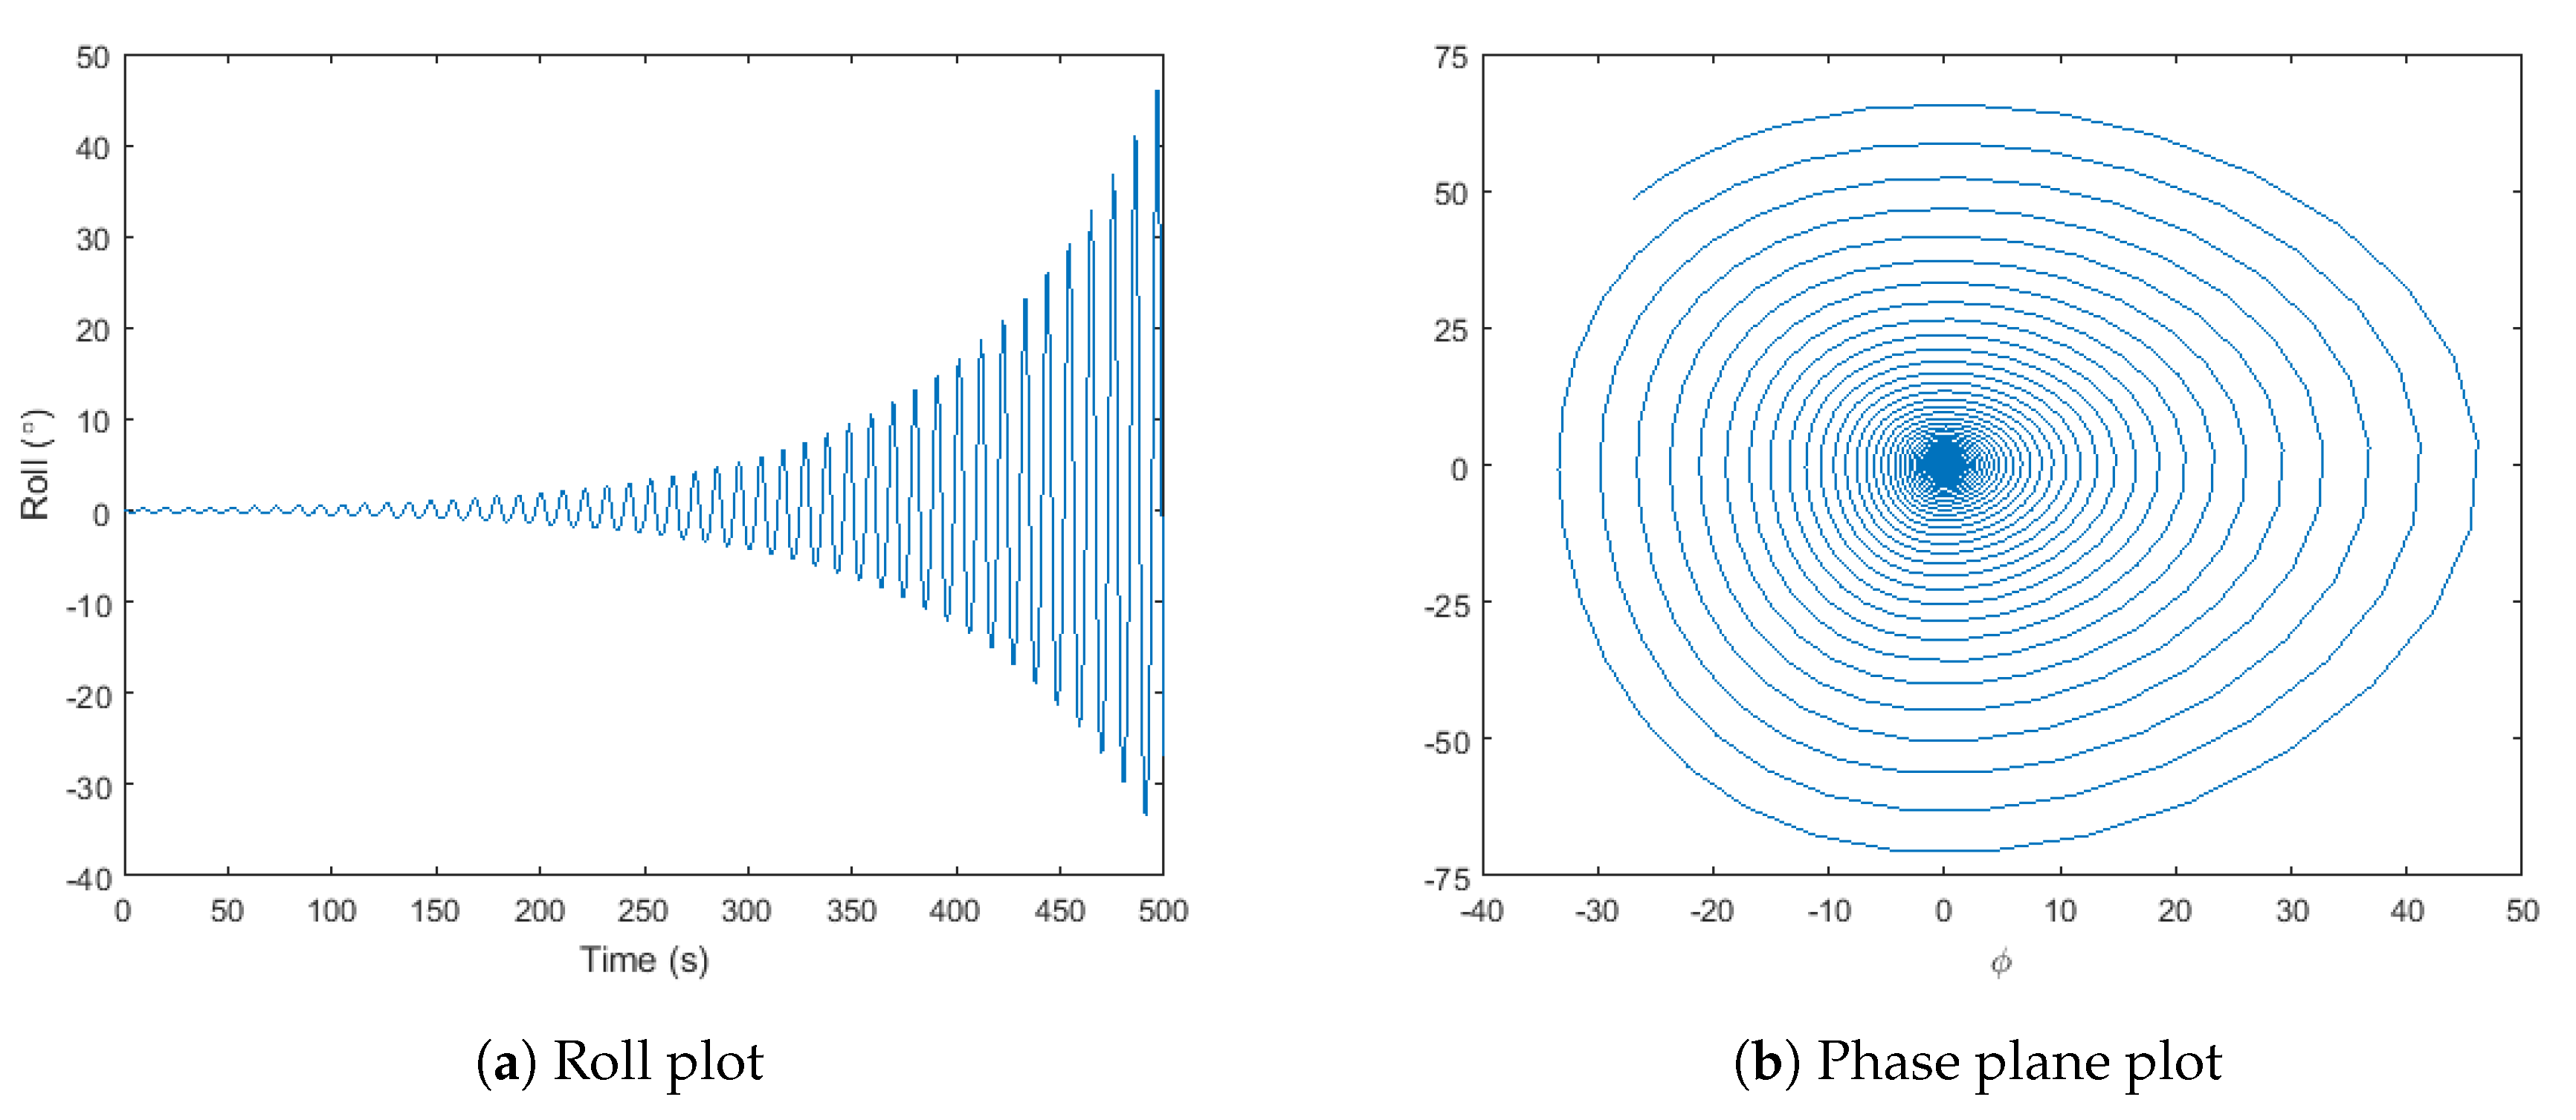
The roll plots and the corresponding phase plane plot for 50 m water depth under the ABS criteria is graphically represented from Figure 5, Figure 6, Figure 7 and Figure 8. It was observed that length ratio of 1.1 is more critical and susceptible for parametric rolling. The time of observation was 500 s and the limiting value for rolling is set to . The wave height of m has two cases of roll excitations. The first roll excitation is observed when length ratio is 1.1 and rolling was observed upto nearly . The second case of roll excitation is when the length ratio is 1.5 and rolling was close to . The phase plane plots for the second case although appears to be bounded but rolling is found to increase indefinitely. Both the cases of roll excitation exceeds the limiting value of rolling and found to be severe for offloading operations. However, for longitudinal waves with wave height H = 3 and 3.5 m each, there was only one case susceptible to parametric roll. The shuttle tanker experienced parametric roll when the length ratio was 1.1. The parametric roll was above for wave height 3 and 3.5 m, respectively.
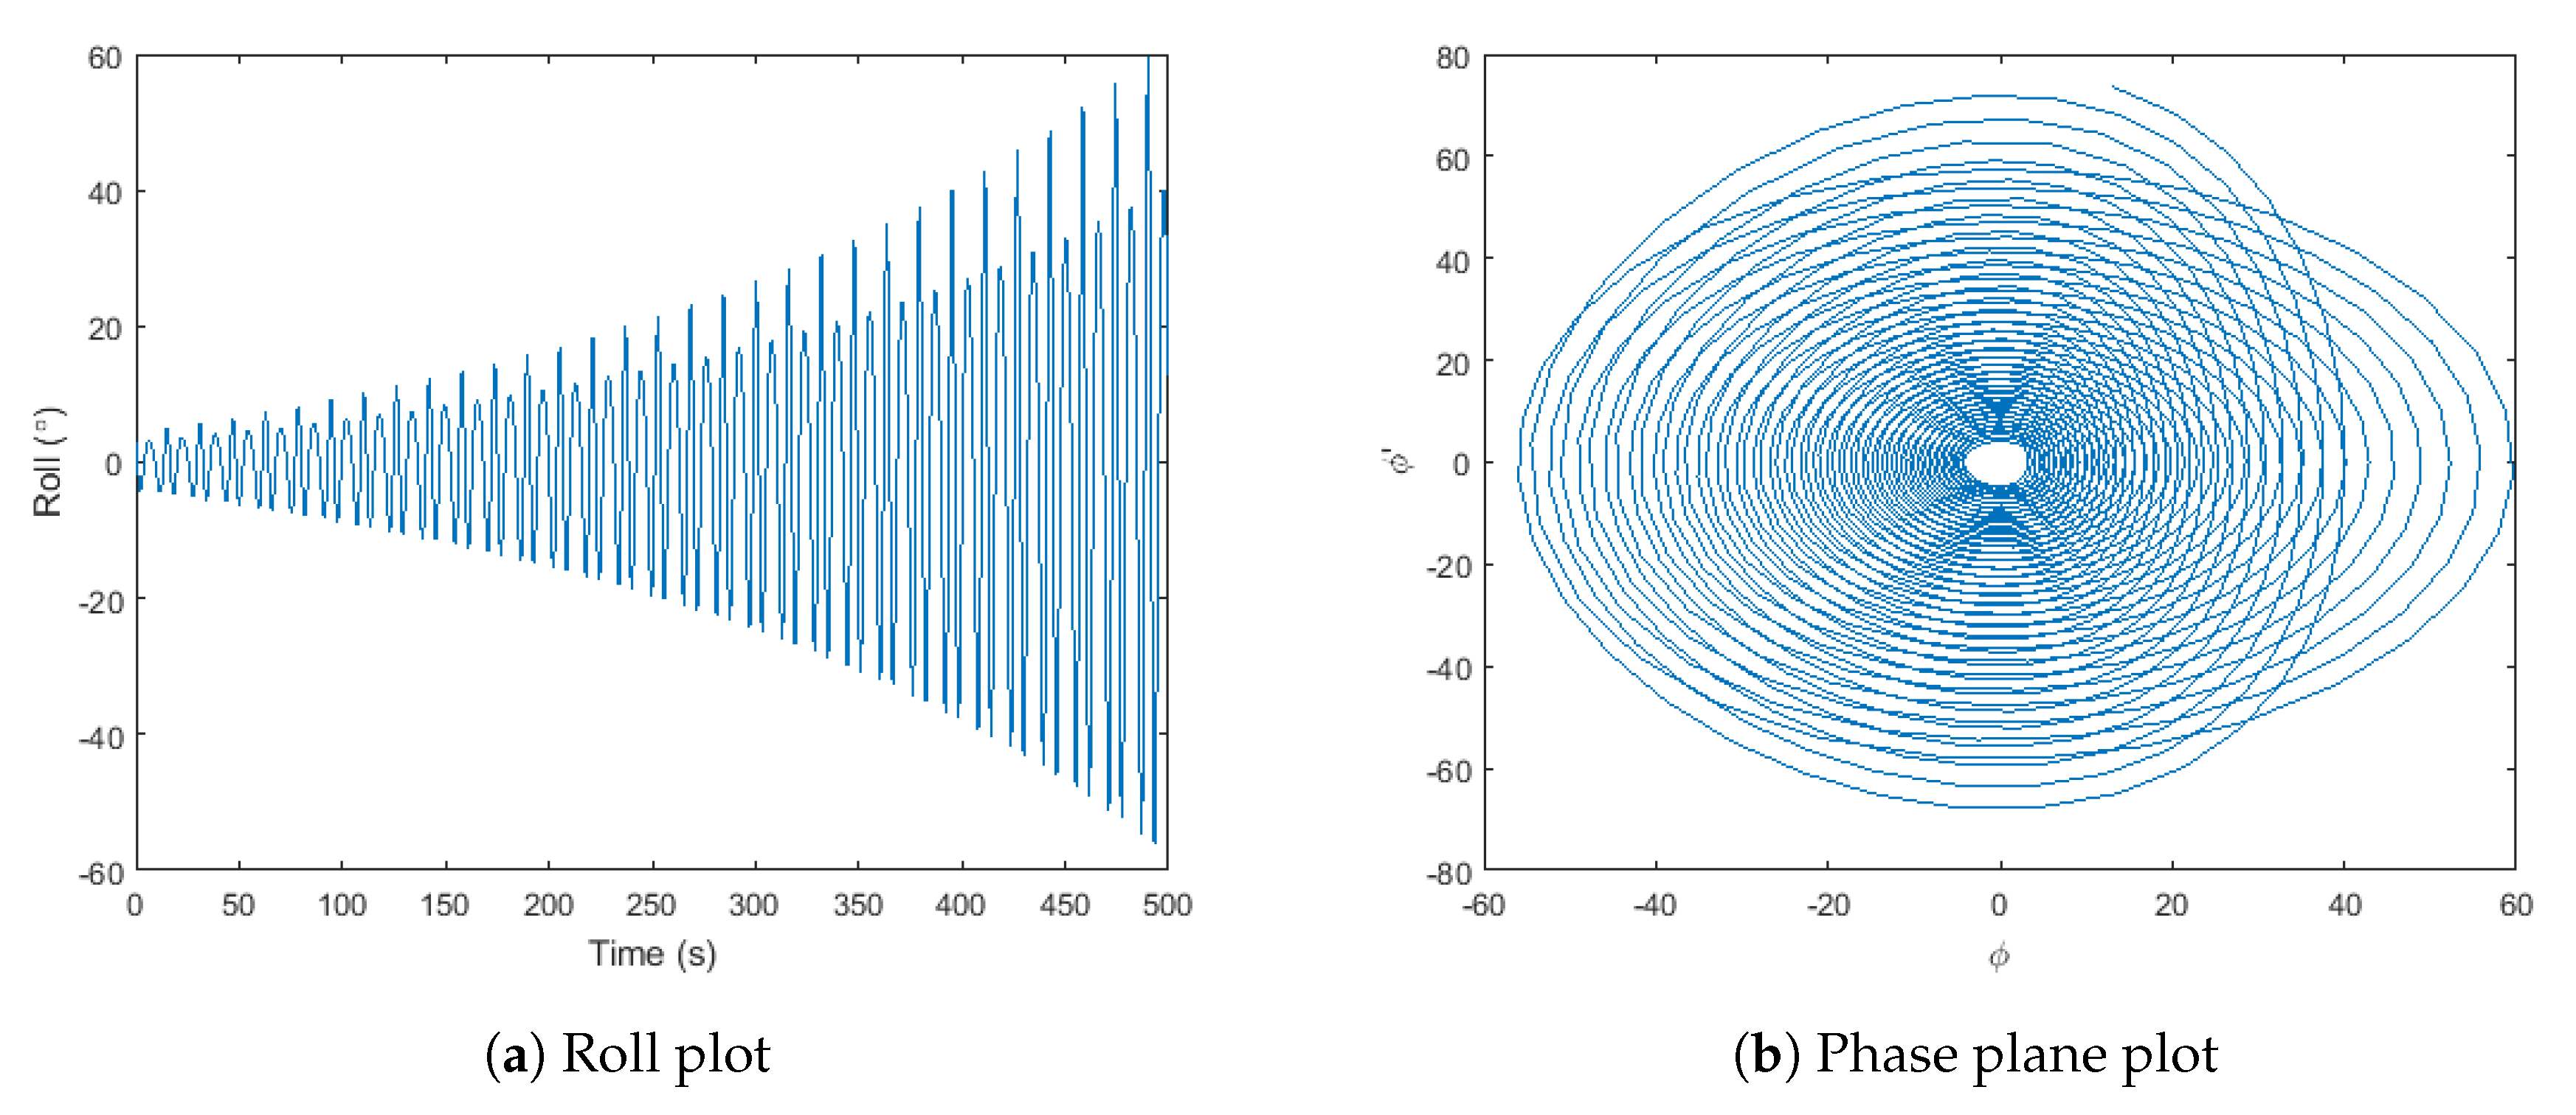
4.1.2. Water Depth is 100 m
The roll plots and phase plane plots for shuttle tanker under water depth 100 m is shown from Figure 9, Figure 10, Figure 11, Figure 12, Figure 13, Figure 14 and Figure 15. It is observed that shuttle tanker experiences parametric roll under all considered wave height. The roll excitation for 2.5 m wave is above . There are 3 cases each for waves of height 3 and 3.5 m, respectively. The length ratio for which shuttle tanker experiences parametric roll is the same for wave heights 3 and 3.5 m. The degree of roll excitation exceeds the limiting value of under all the considered wave heights. For 3 m wave height, the angle of roll is nearly for length ratio 1.1. It exceeds for length ratio 1.6 and 2, respectively. Although for length ratio 1.6, the phase plane plot appears to be bounded but there is indefinite increase in the amount of roll. As for 3.5 m, the amount of roll closely reaches around for length ratio 1.1 and 1.6 while it is almost for length ratio 2.
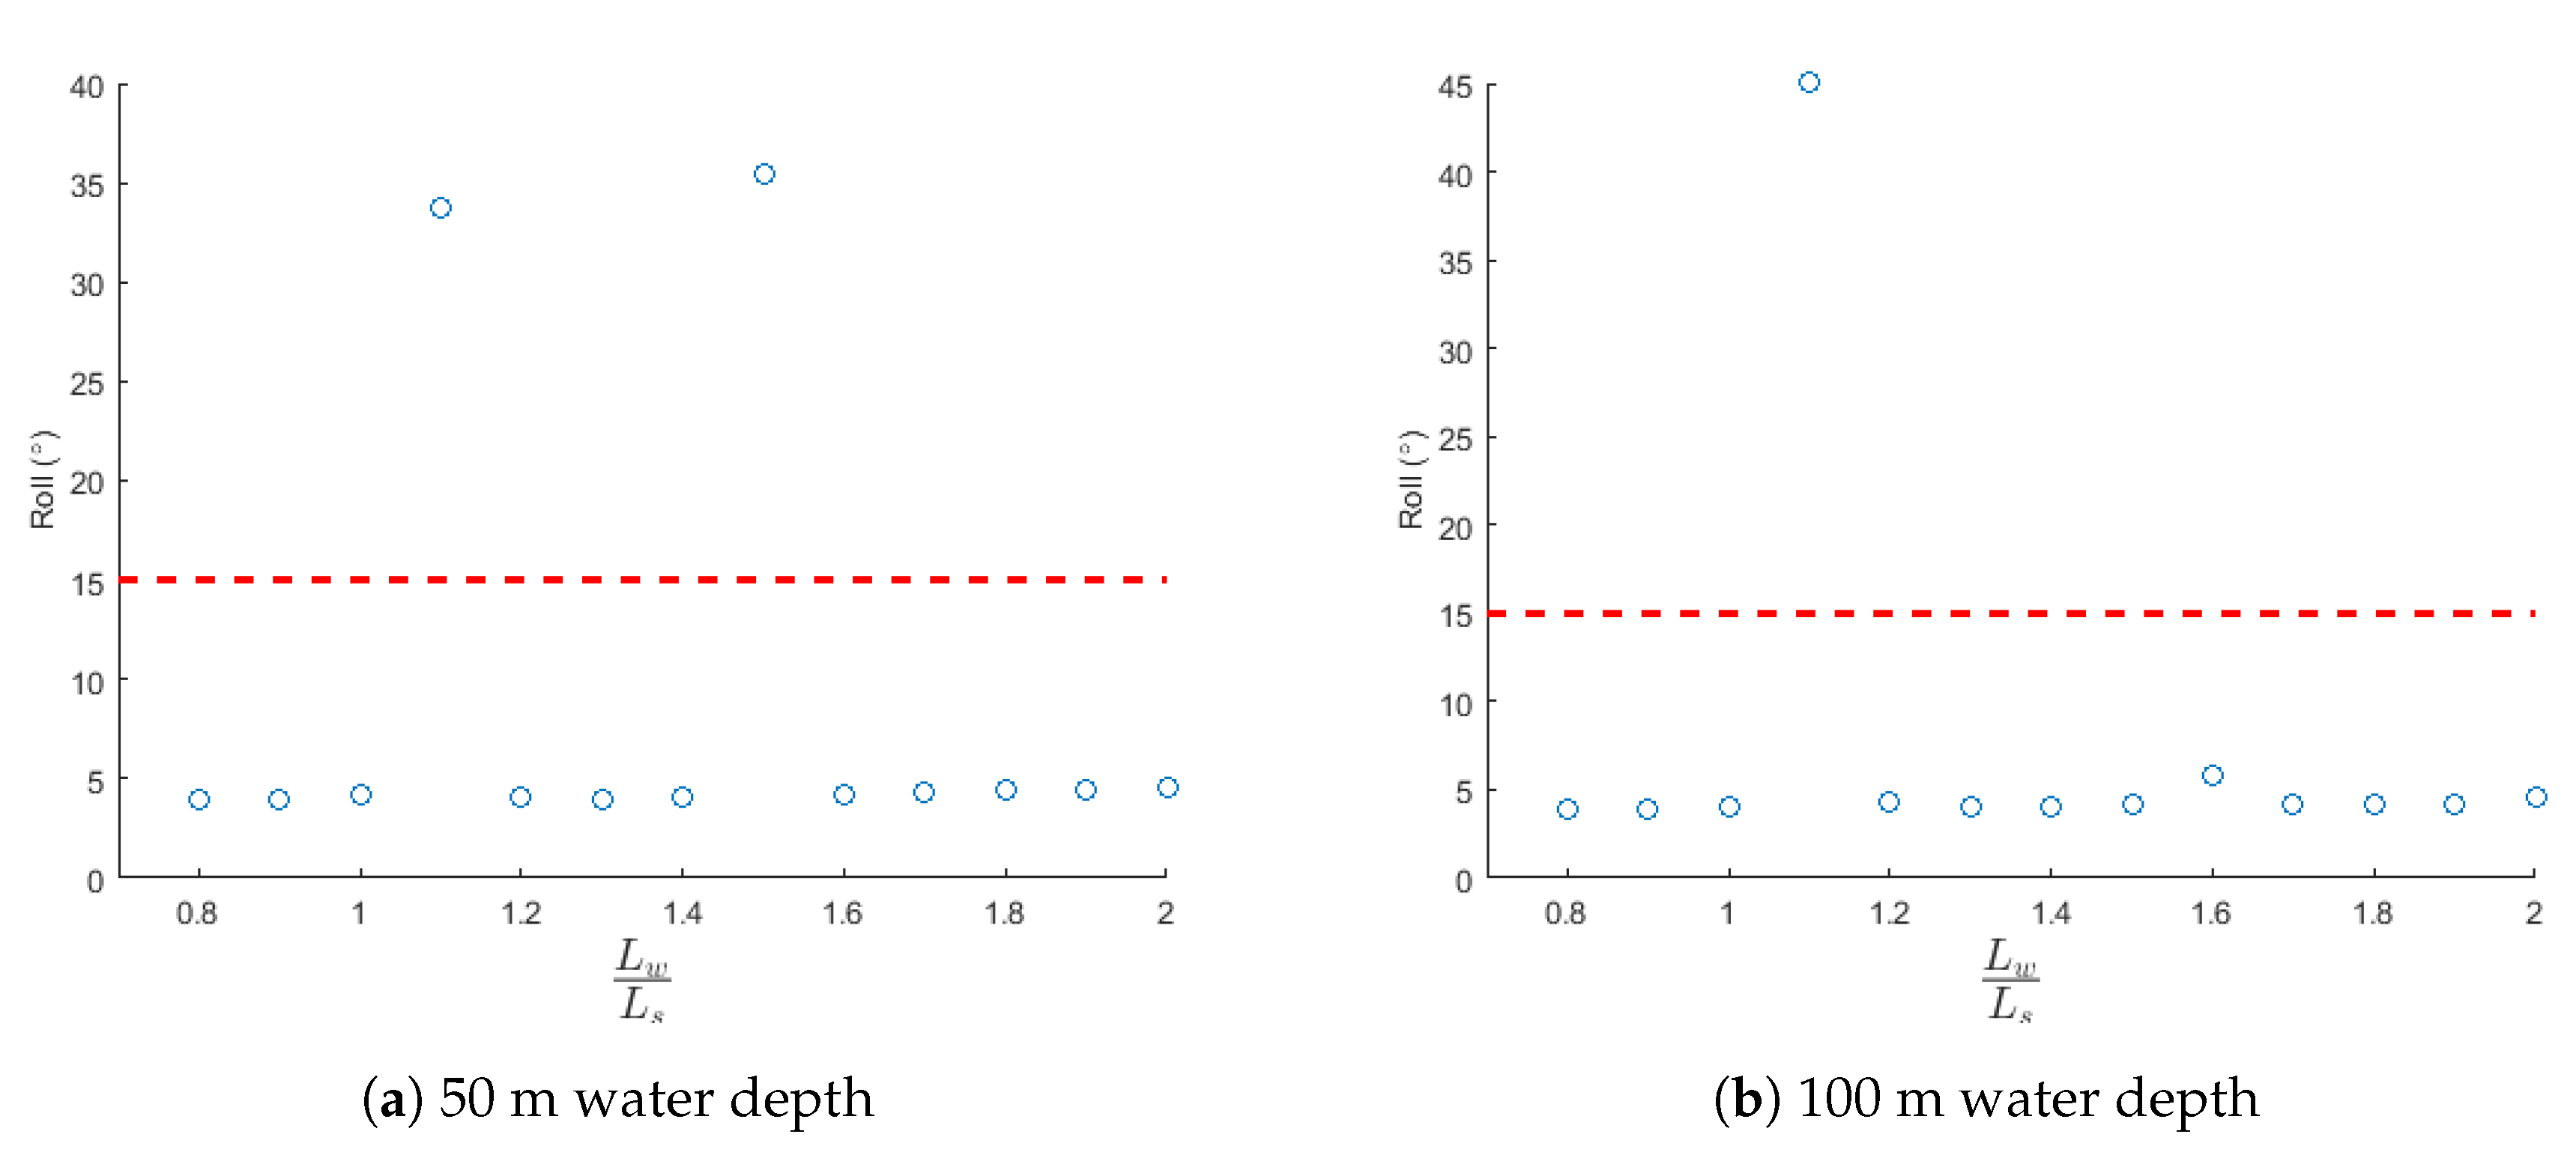
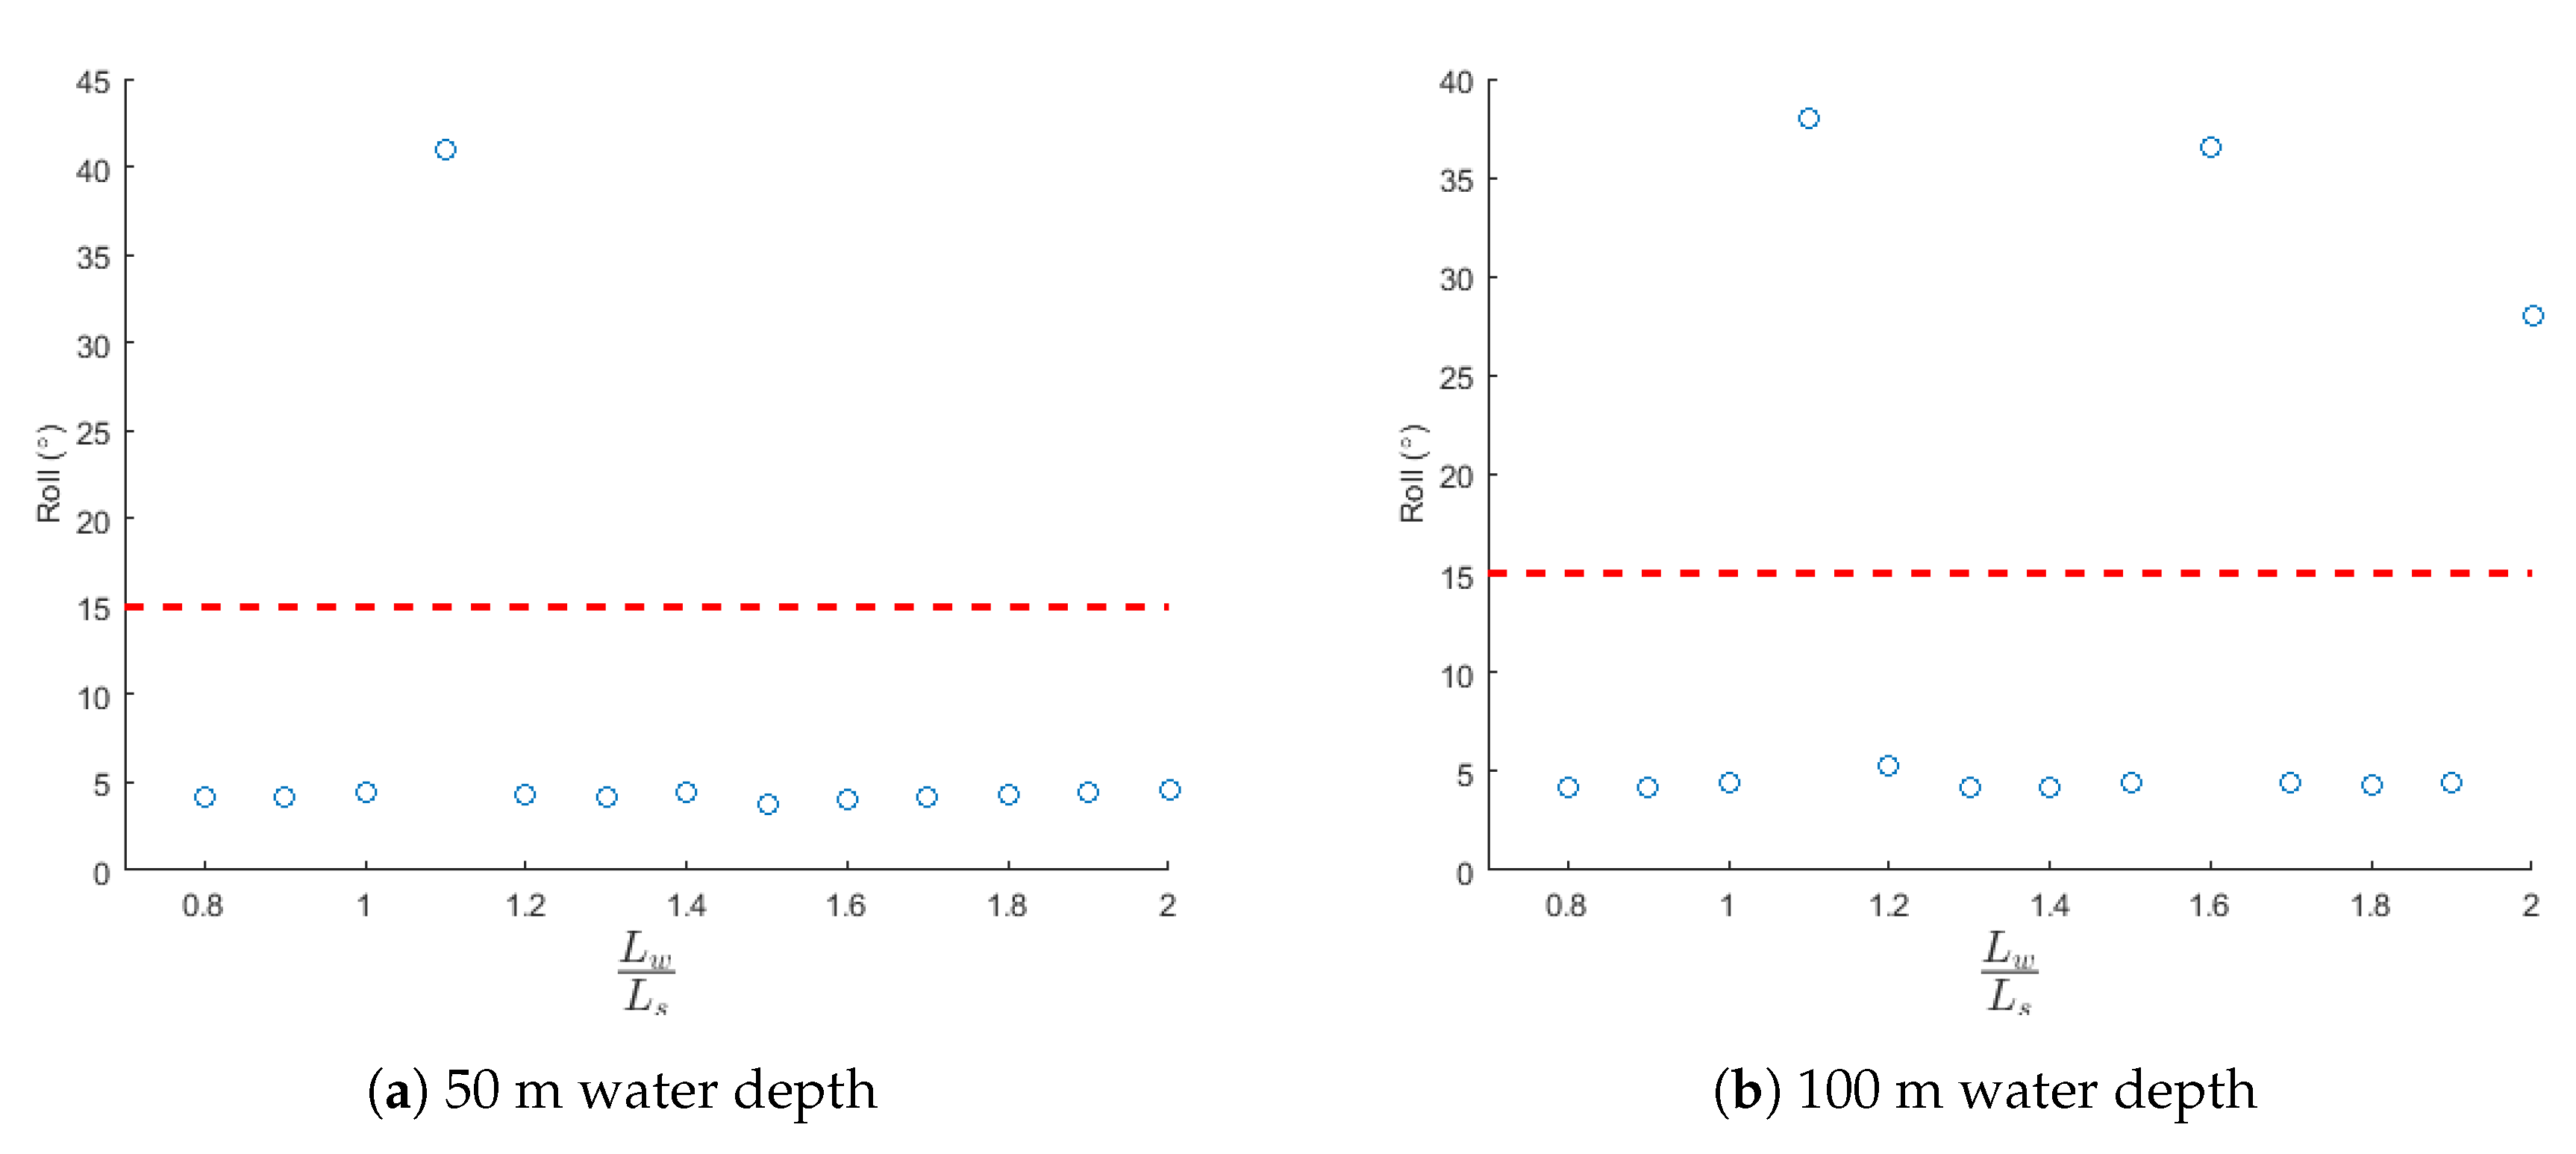
A graphical comparison was made between the angle of roll and length ratio for the shuttle tanker for the considered wave heights. Figure 16, Figure 17 and Figure 18 represents the graphical comparison for wave heights 2.5, 3 and 3.5 m, respectively. The red dotted line represents the limiting criteria of for our present study.
4.2. Downtime Cost Analysis
The shuttle tanker was observed under regular waves and it was found that for certain wave length ratio, there was roll excitation. Therefore, under those wave conditions offloading can not be performed. This would call for downtime of offloading operation. Furthermore, the downtime cost is calcuated due to occurrence of such wave conditions where offloading is ceased and global cost of production is affected. Although the water depths are different for the shuttle tanker but the wave height is the same for investigation of roll excitation. It was observed from Table 3 and Table 4 that there is no much difference between the time periods corresponding to the length ratio. Therefore, the probability of occurrence of wave conditions for which the shuttle tanker is susceptible to parametric rolling is almost the same. Therefore, considering very close marginal difference between the probability of occurrence of susceptible wave conditions for the two water depths, Table 6 represents the probability for both water depths. The OPEX is considered uniform for all the three locations. The downtime days considered for downtime analysis are in range of 1 day, 2 days and 3 days, respectively. It was also observed that higher wave height contributed to a lower probability of occurrence in Malaysian waters. The probability of occurrence for length ratio , and are not displayed as their values are very small and it would not significantly impact the downtime cost. Additionally, certain locations in Table 6 are marked with ‘-’ indicating low probability of occurrence and thereby insignificant for downtime cost. It can also be said that the length ratio 1.1 significantly contributes to downtime cost.
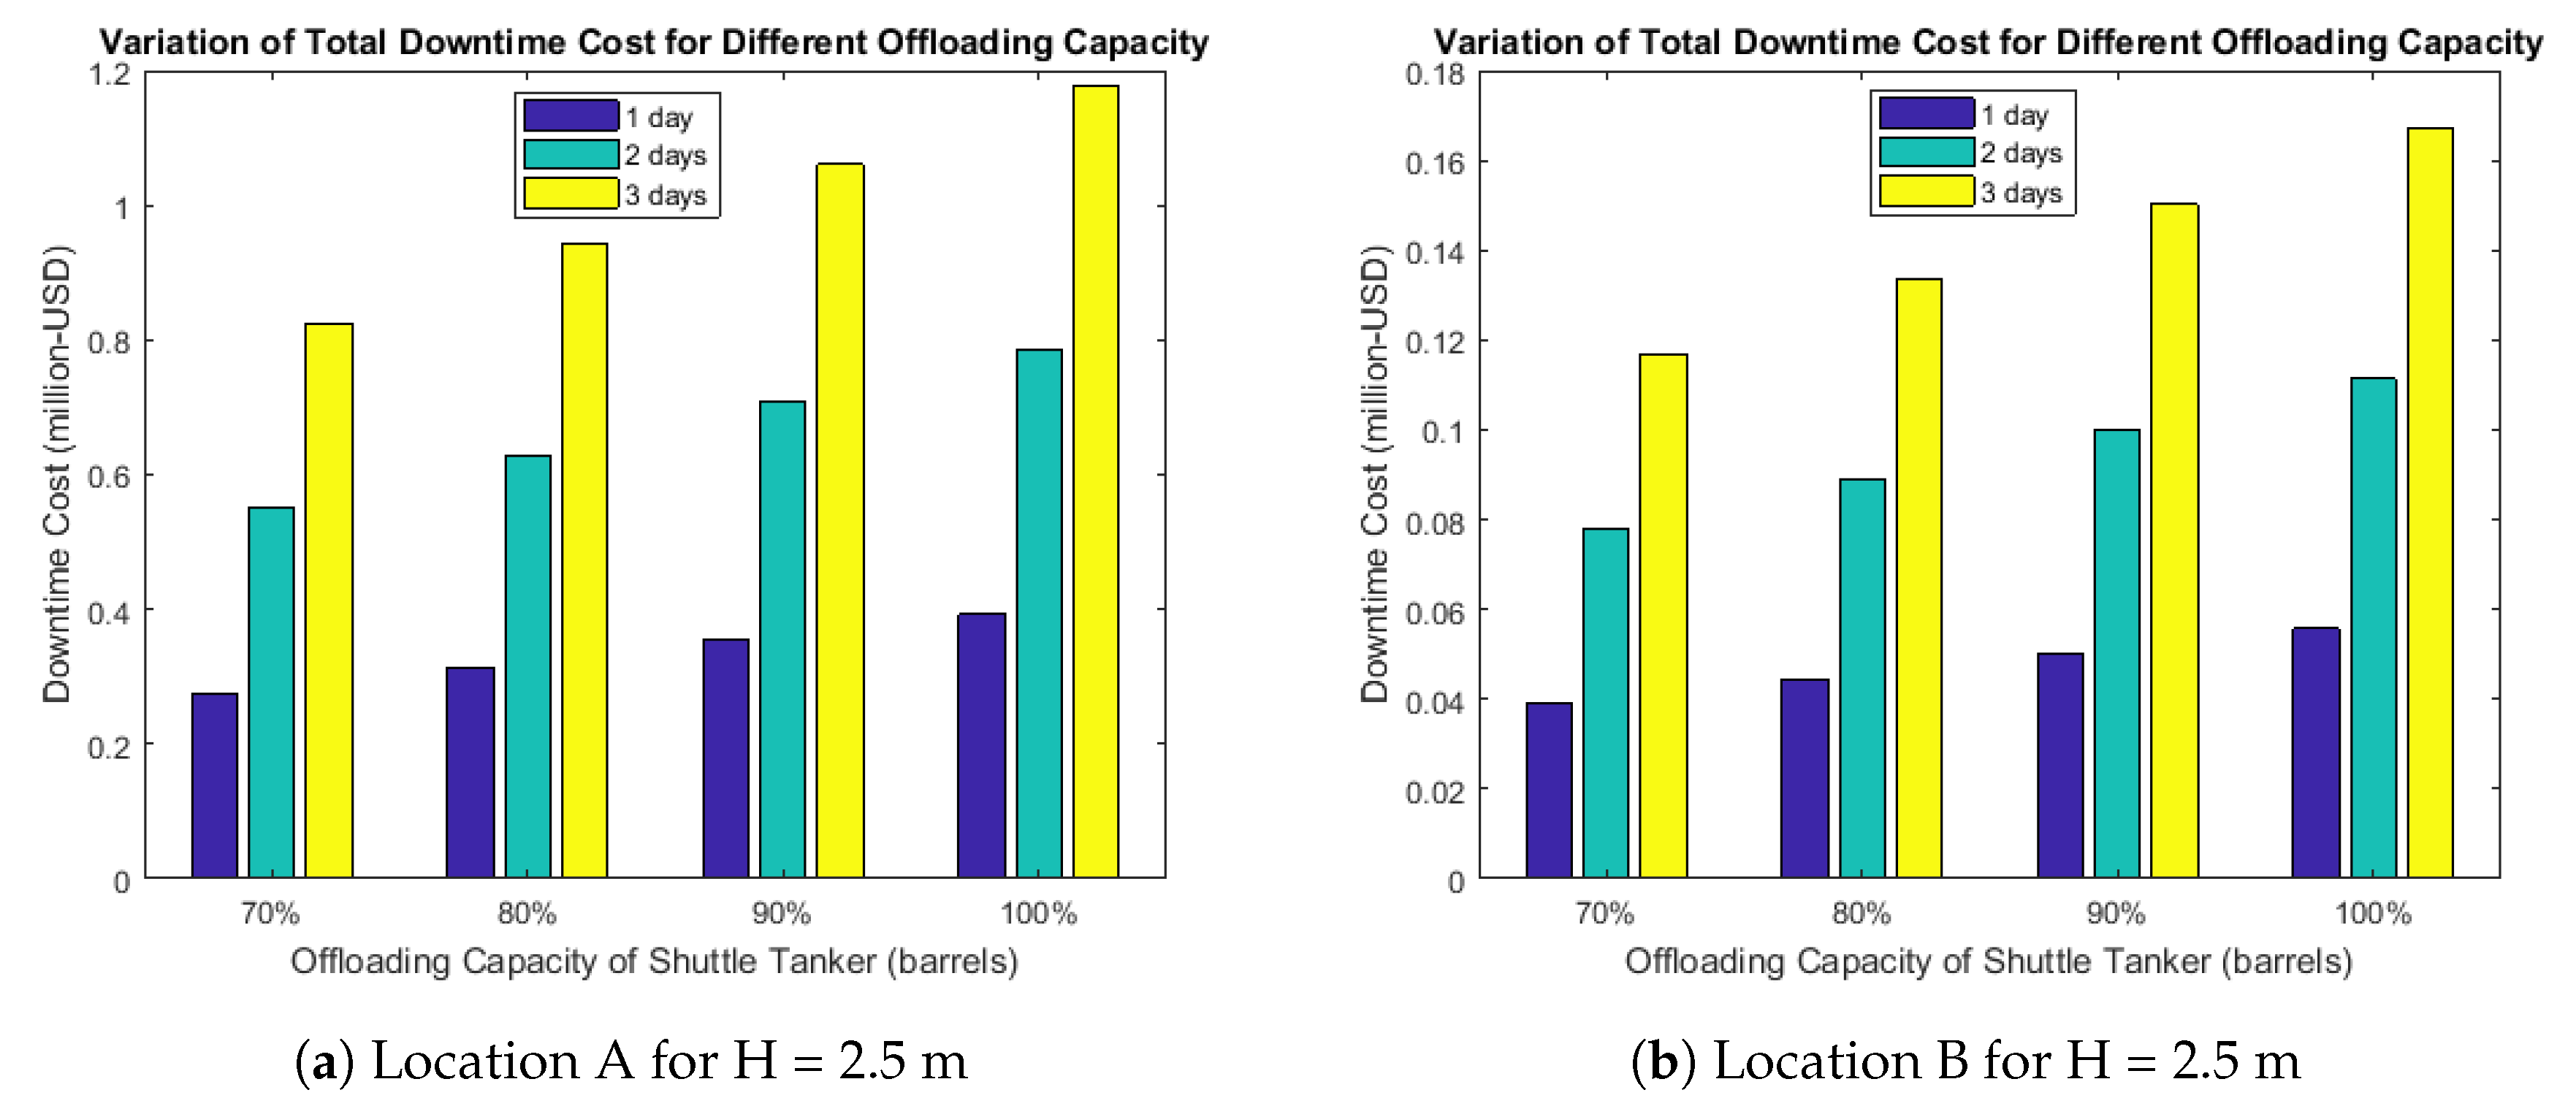
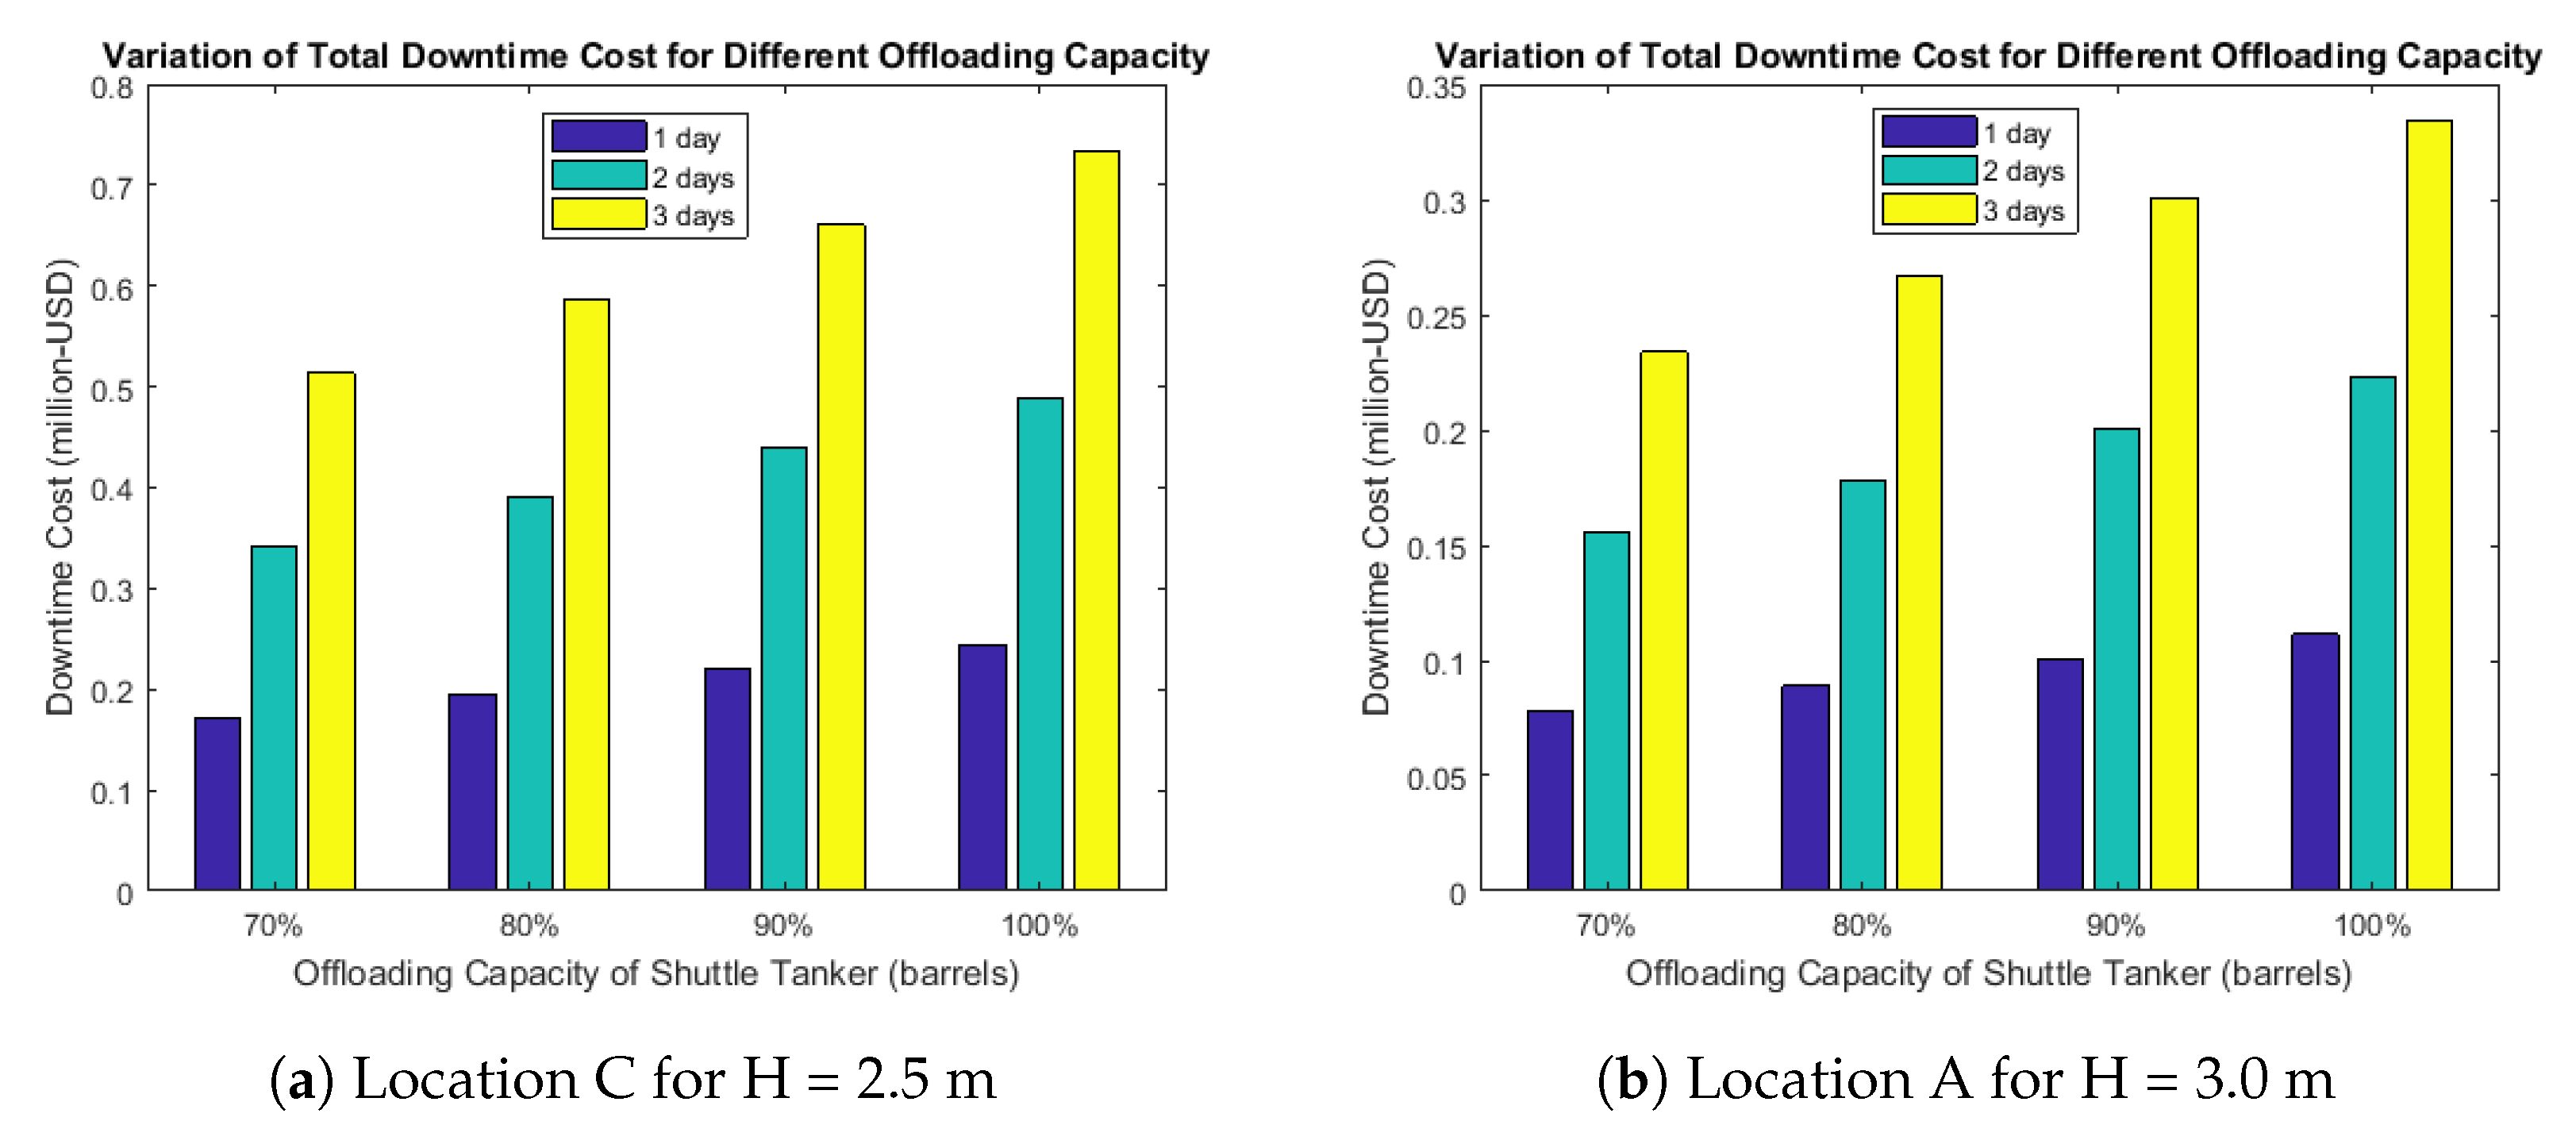
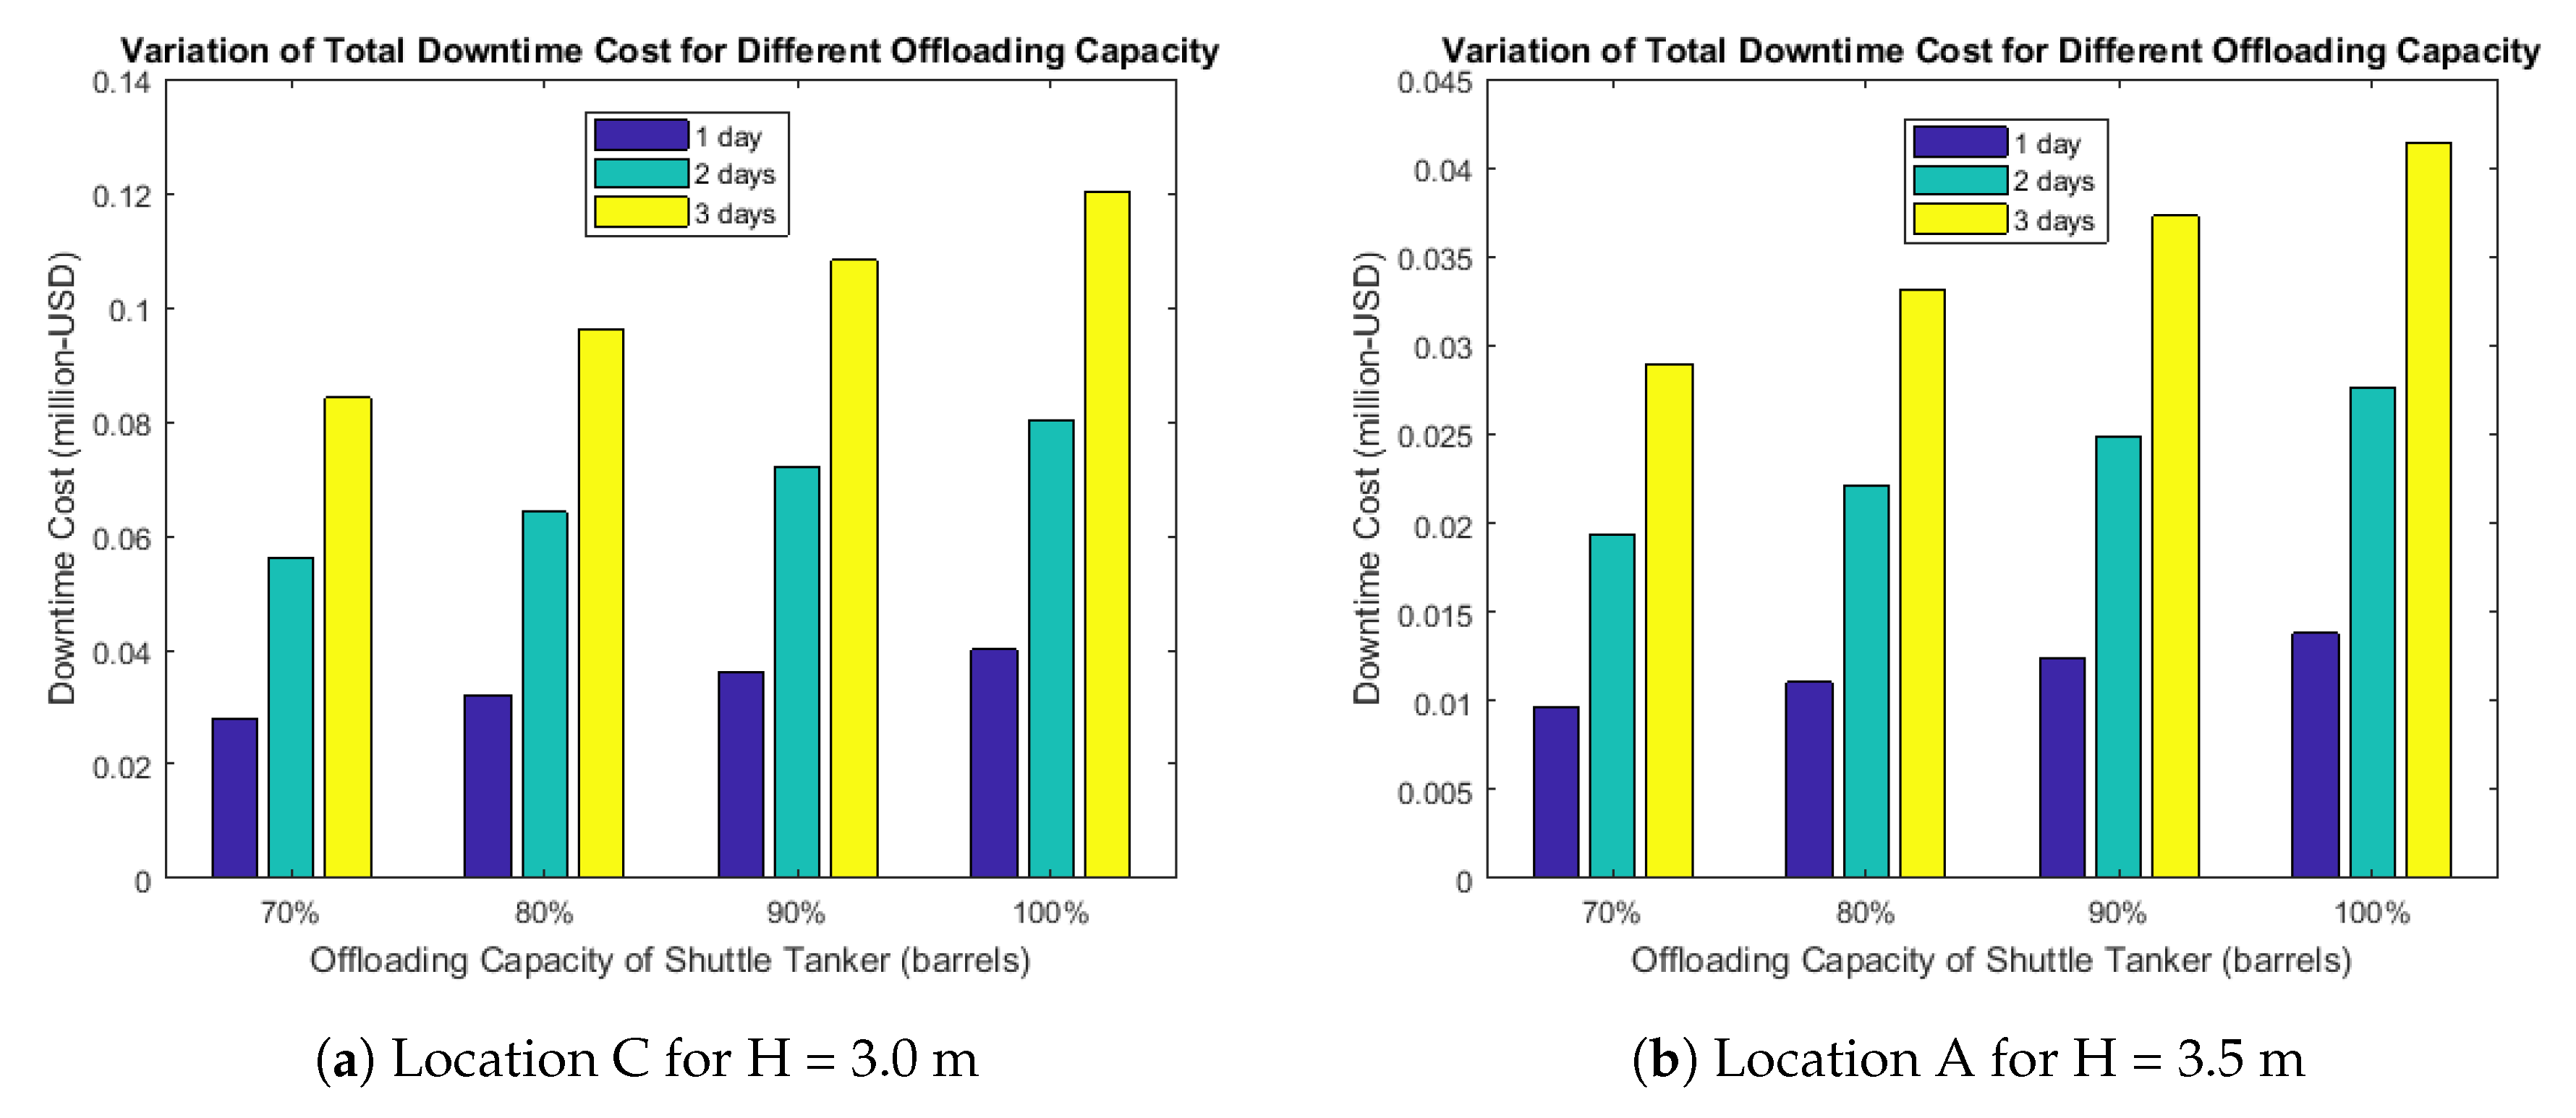
The downtime cost charts for offloading operations due to parametric rolling for downtime particulars as shown in Table 6 are displayed from Figure 19, Figure 20 and Figure 21. It is observed from Figure 19a that maximum downtime cost incurred is around US$ 1.2 million under 100% offloading capacity for three downtime days. The downtime cost for 70% offloading capacity varies from nearly US$ 0.3 million per day to almost US$ 0.8 million per three days. The downtime cost for 80% and 90% offloading capacity is closely between US$ 0.4 million per day to US$ 1 million for 3 days, respectively. Location ‘B’ is least impacted due to its lower probability of occurrence and the downtime cost is as low as nearly US$ 40,000 per day for 70% offloading capacity and as high as US$ 160,000 for three days under 100% offloading capacity. Compared to location ‘B’, location ‘C’ has fairly good amount of downtime cost. The highest downtime cost for 70% offloading capacity is approximately half a million US$ for three days. The 80% and 90% offloading capacities contribute around US$ 0.6 to 0.7 million for three days. The 100% capacity has downtime cost ranging from US$ 0.2 million per day to around US$ 0.75 million for three days. Since the probability of occurrence is lower for increased wave heights of 3 and 3.5 m, their downtime cost is also lower comparatively. The maximum downtime cost impacted under wave height of 3 m for location ‘A’ is close to US$ 0.35 million while location ‘C’ contributes to US$ 0.12 million, respectively per three days under maximum offloading capacity. The downtime cost for wave height 3.5 m is displayed for location ‘A’ only since the probability occurrence for other two locations are almost zero. The downtime cost chart as in Figure 21b implies that the amount of downtime cost is least and there is no much significant impact as what was obtained under wave height of 2 m. The highest downtime cost impacted is US$ 40,000 for location ‘A’ under maximum offloading capacity for three number of downtime days.
5. Development of GUI for Downtime Analysis of Side-by-Side Offloading Operations
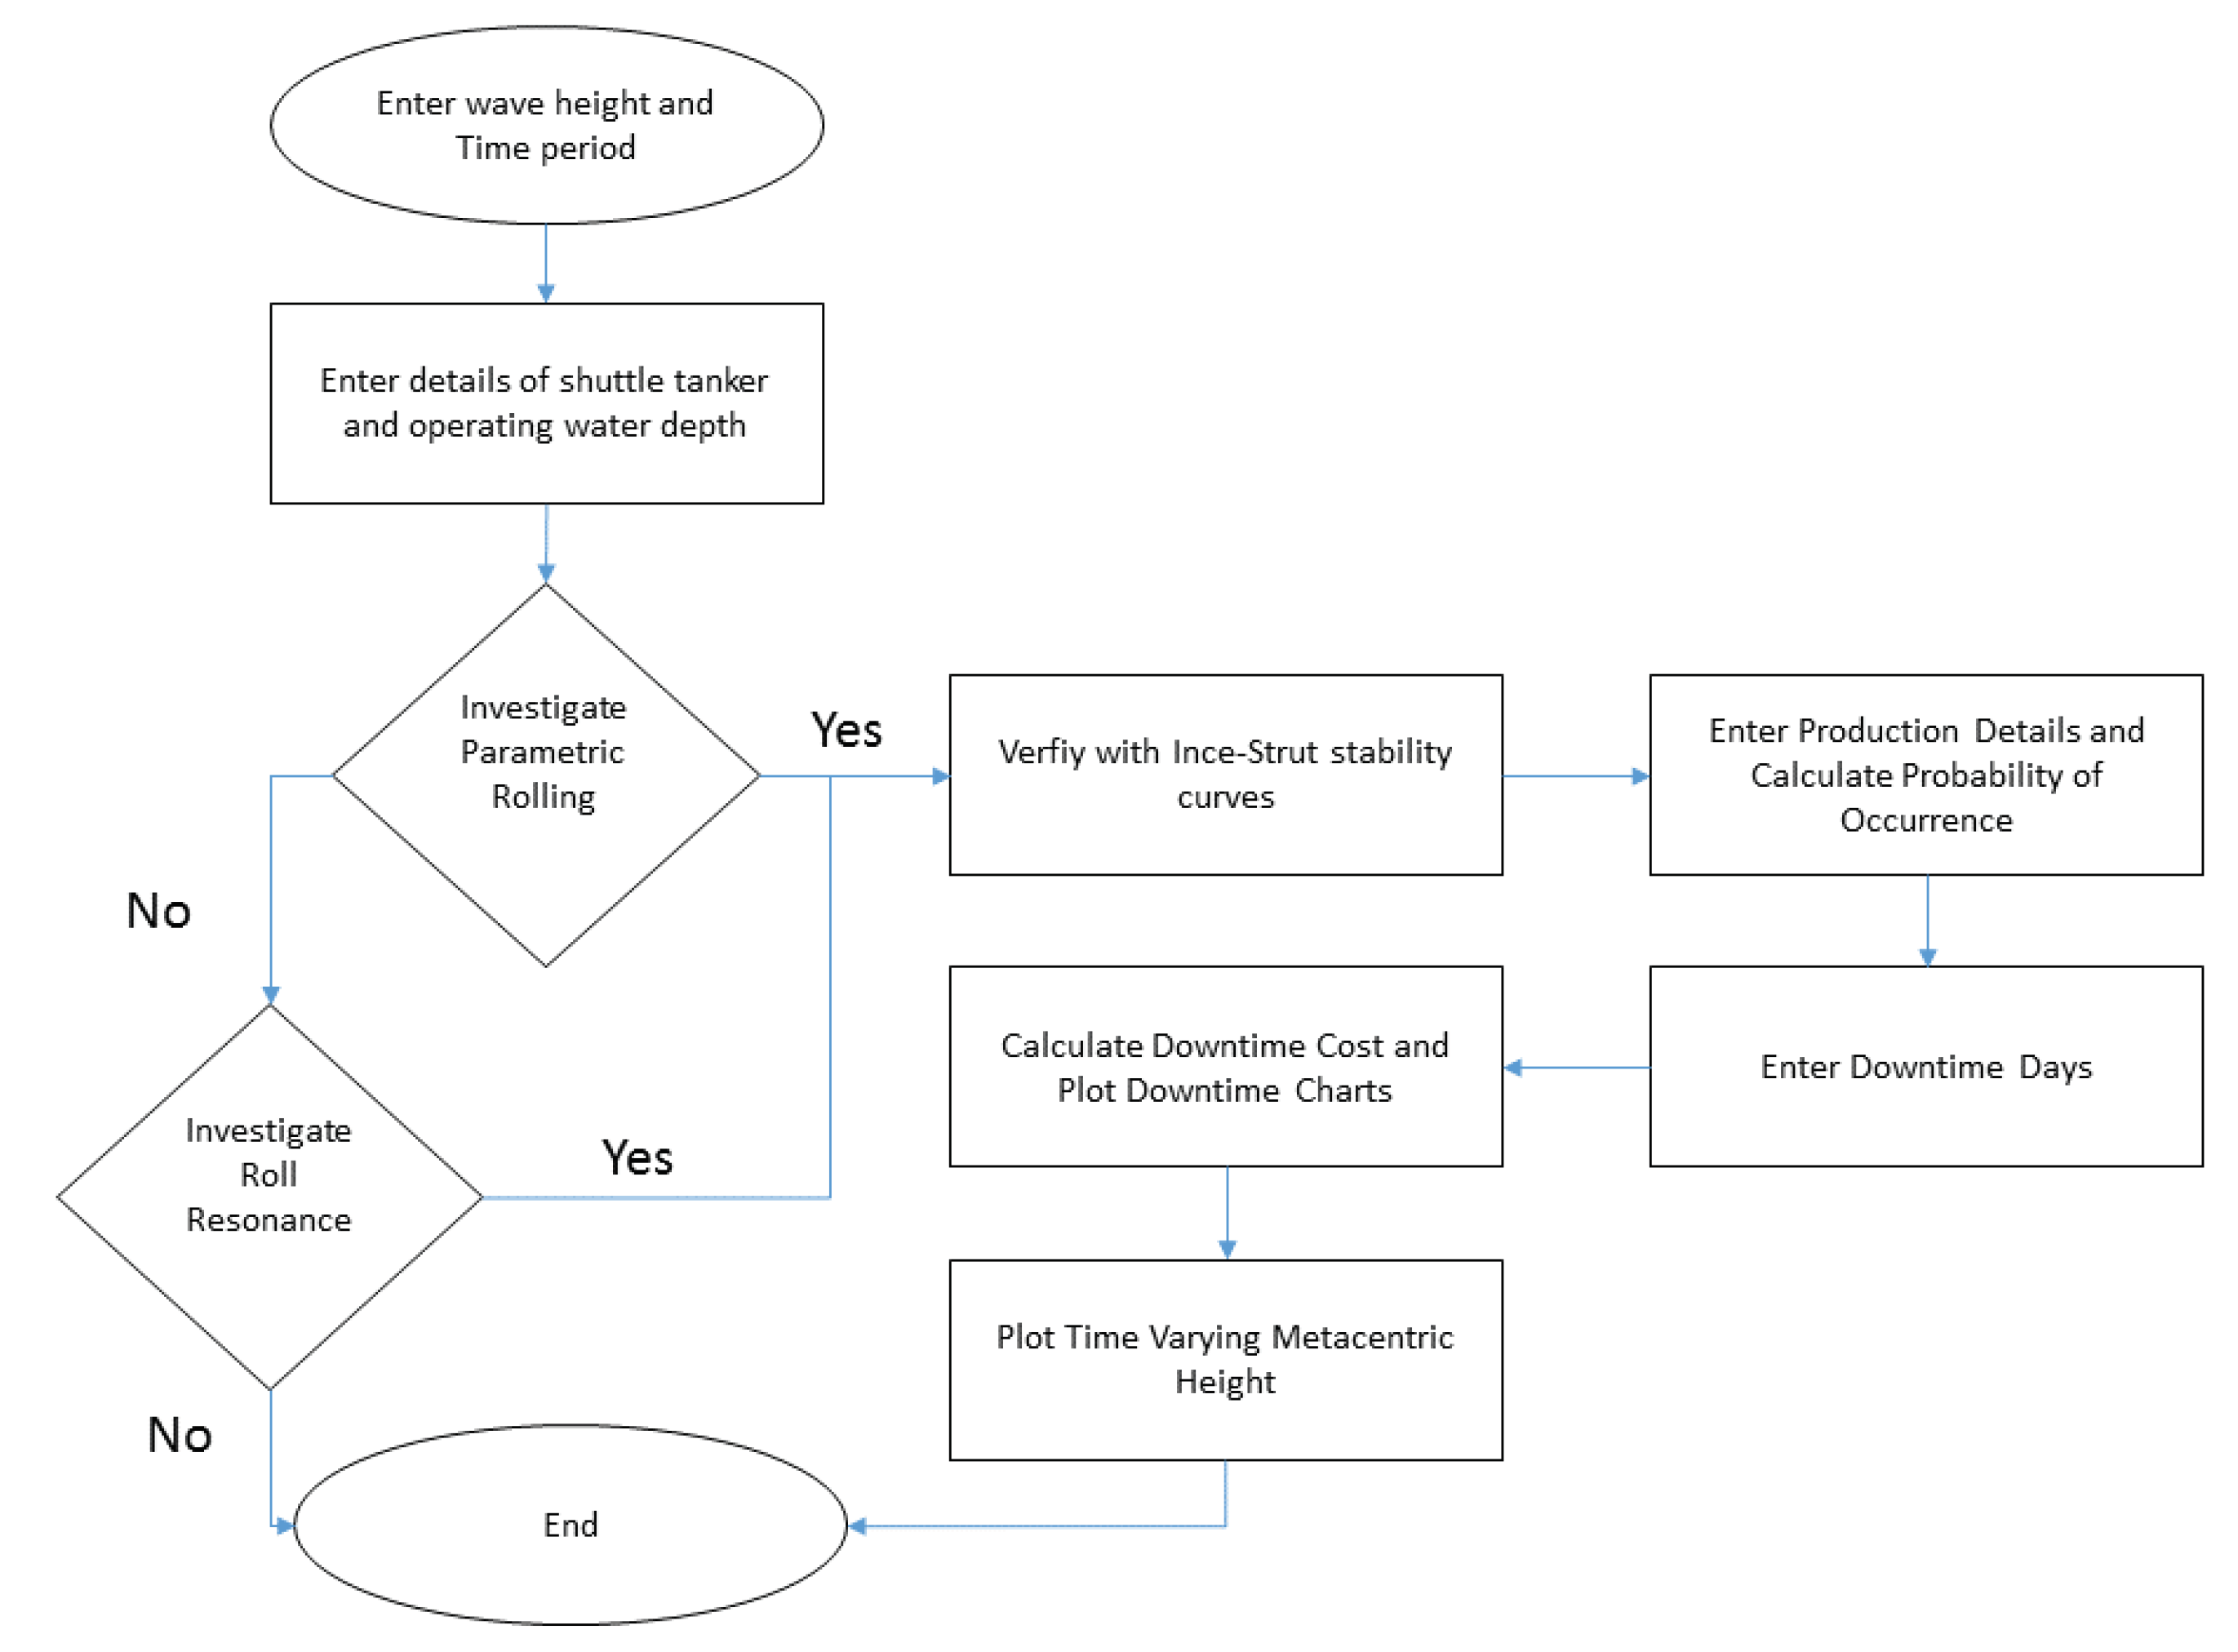
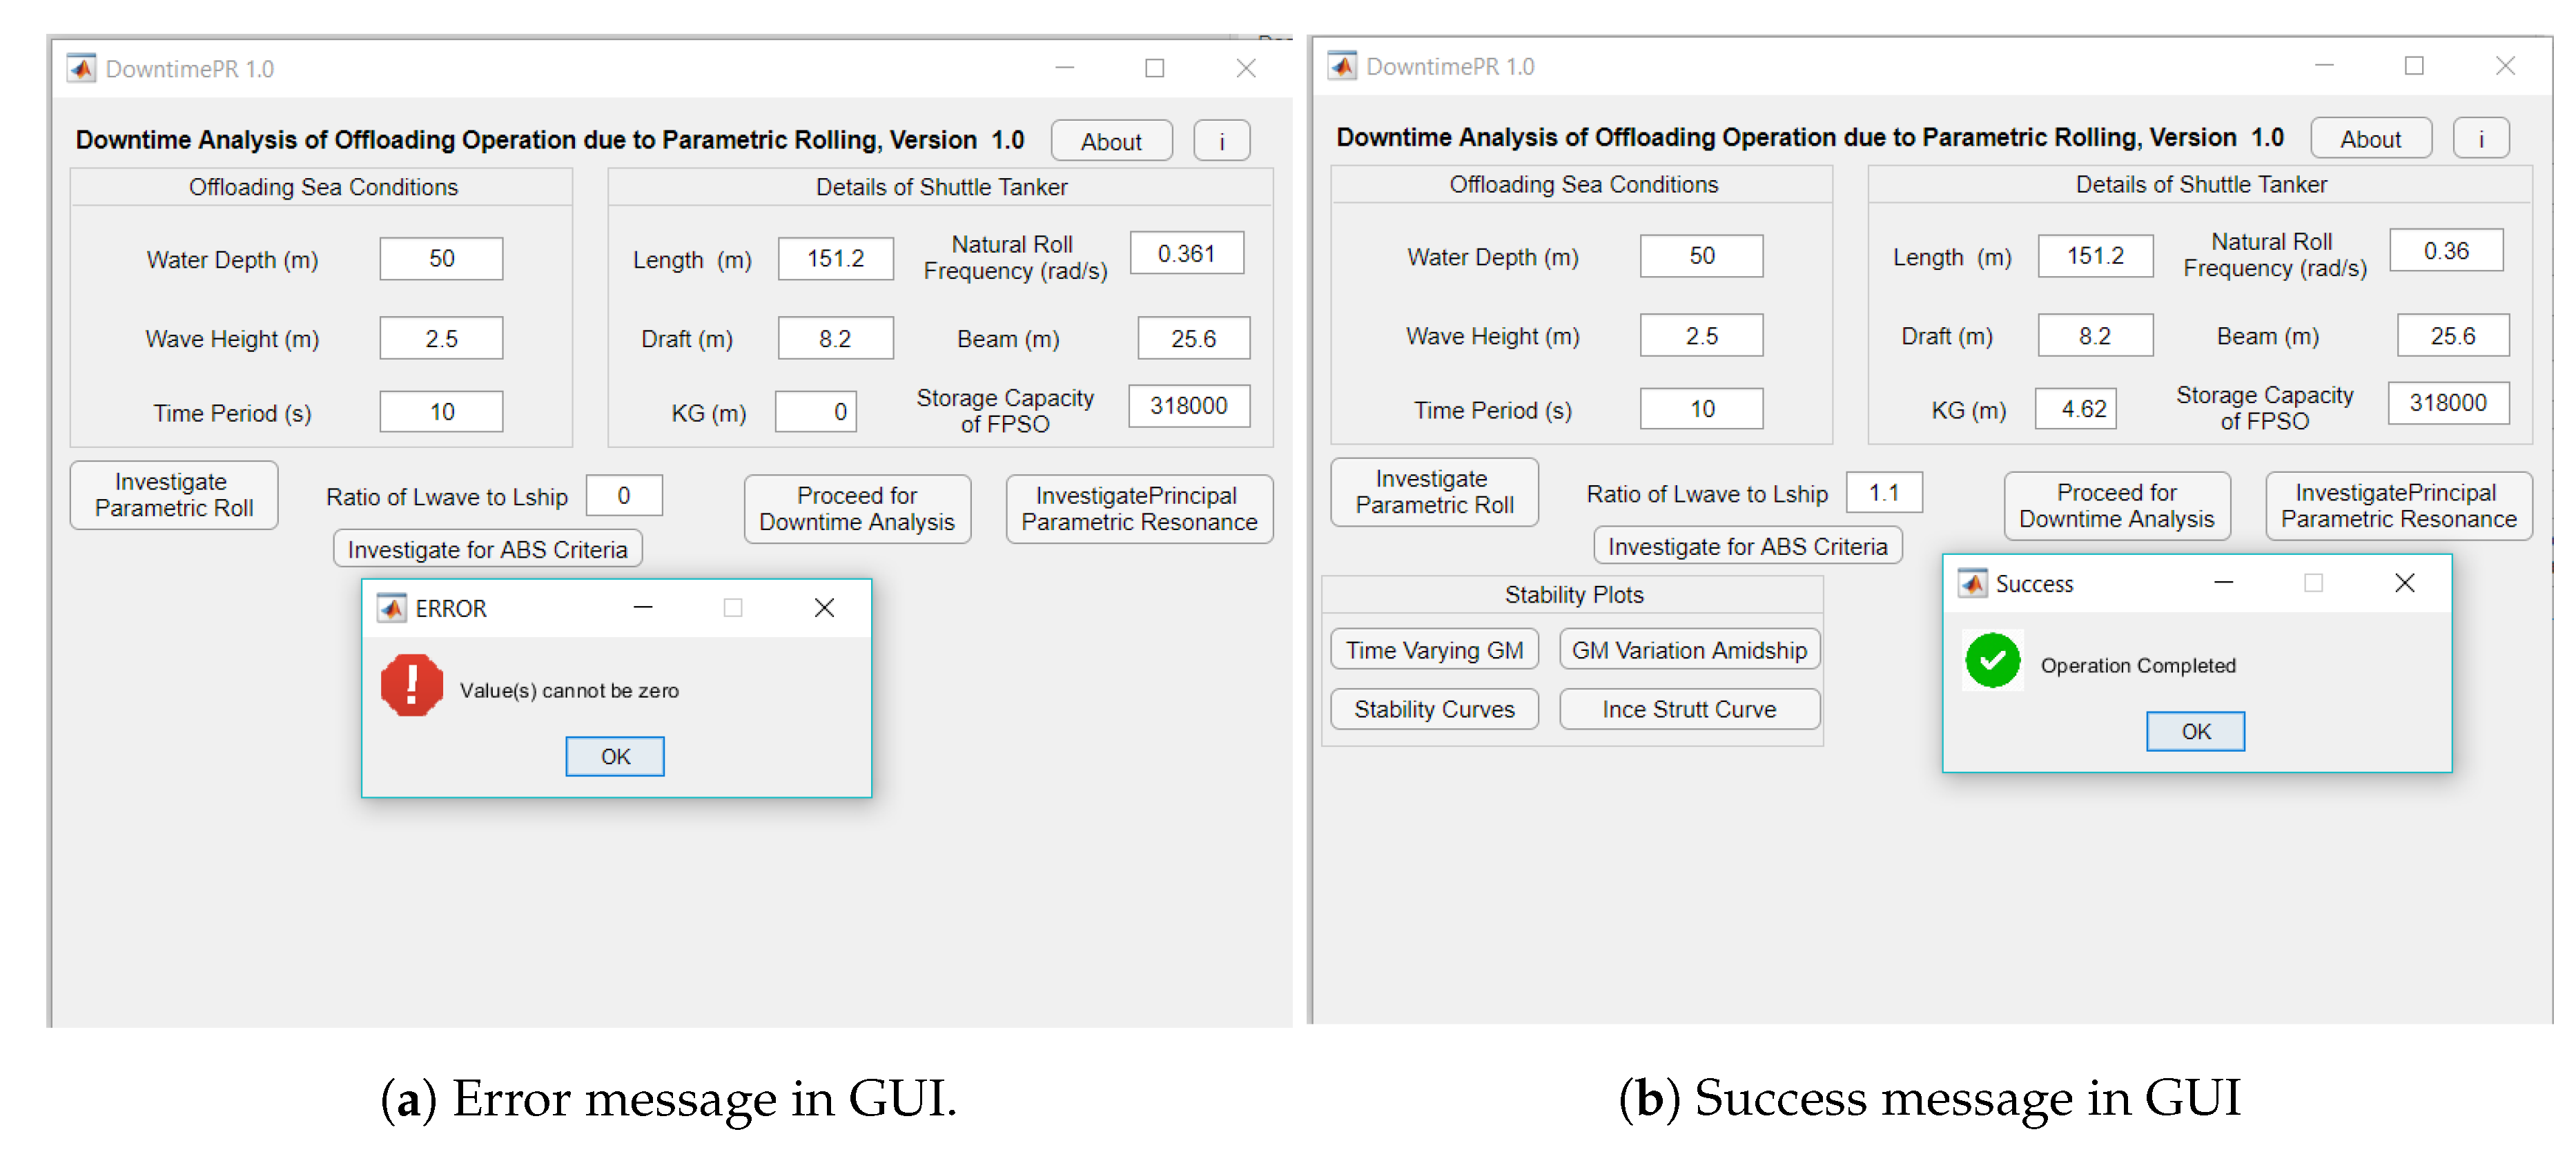
The Graphical User Interface as shown in Figure 22, named “DowntimePR 1.0” was developed as a numerical assessment tool to evaluate the downtime cost of offloading operations due to parametric rolling. The flow chart for the GUI is given in Figure 23. The GUI has two major modules, the first module accepts inputs from the user and the second displays the results and plots. The input module was divided into two panels as “Offloading Sea Conditions” and “Details of Shuttle Tanker”. The “Offloading Sea Conditions” panel requires the user to input the water depth, wave height and encountering time period of wave. The second input panel requires the user to input the geometric and hydrostatic details of the shuttle tanker such as length, draft, beam, natural frequency of roll, vertical center of buoyancy and storage capacity of FPSO. A numerical method which uses the dispersion relation is used to calculate the other wave parameters from the inputs given. The output module is initially hidden when the GUI starts and is only made visible upon input from user. The input to any text field cannot be left empty or zero, else an error will be displayed as shown in Figure 24a.
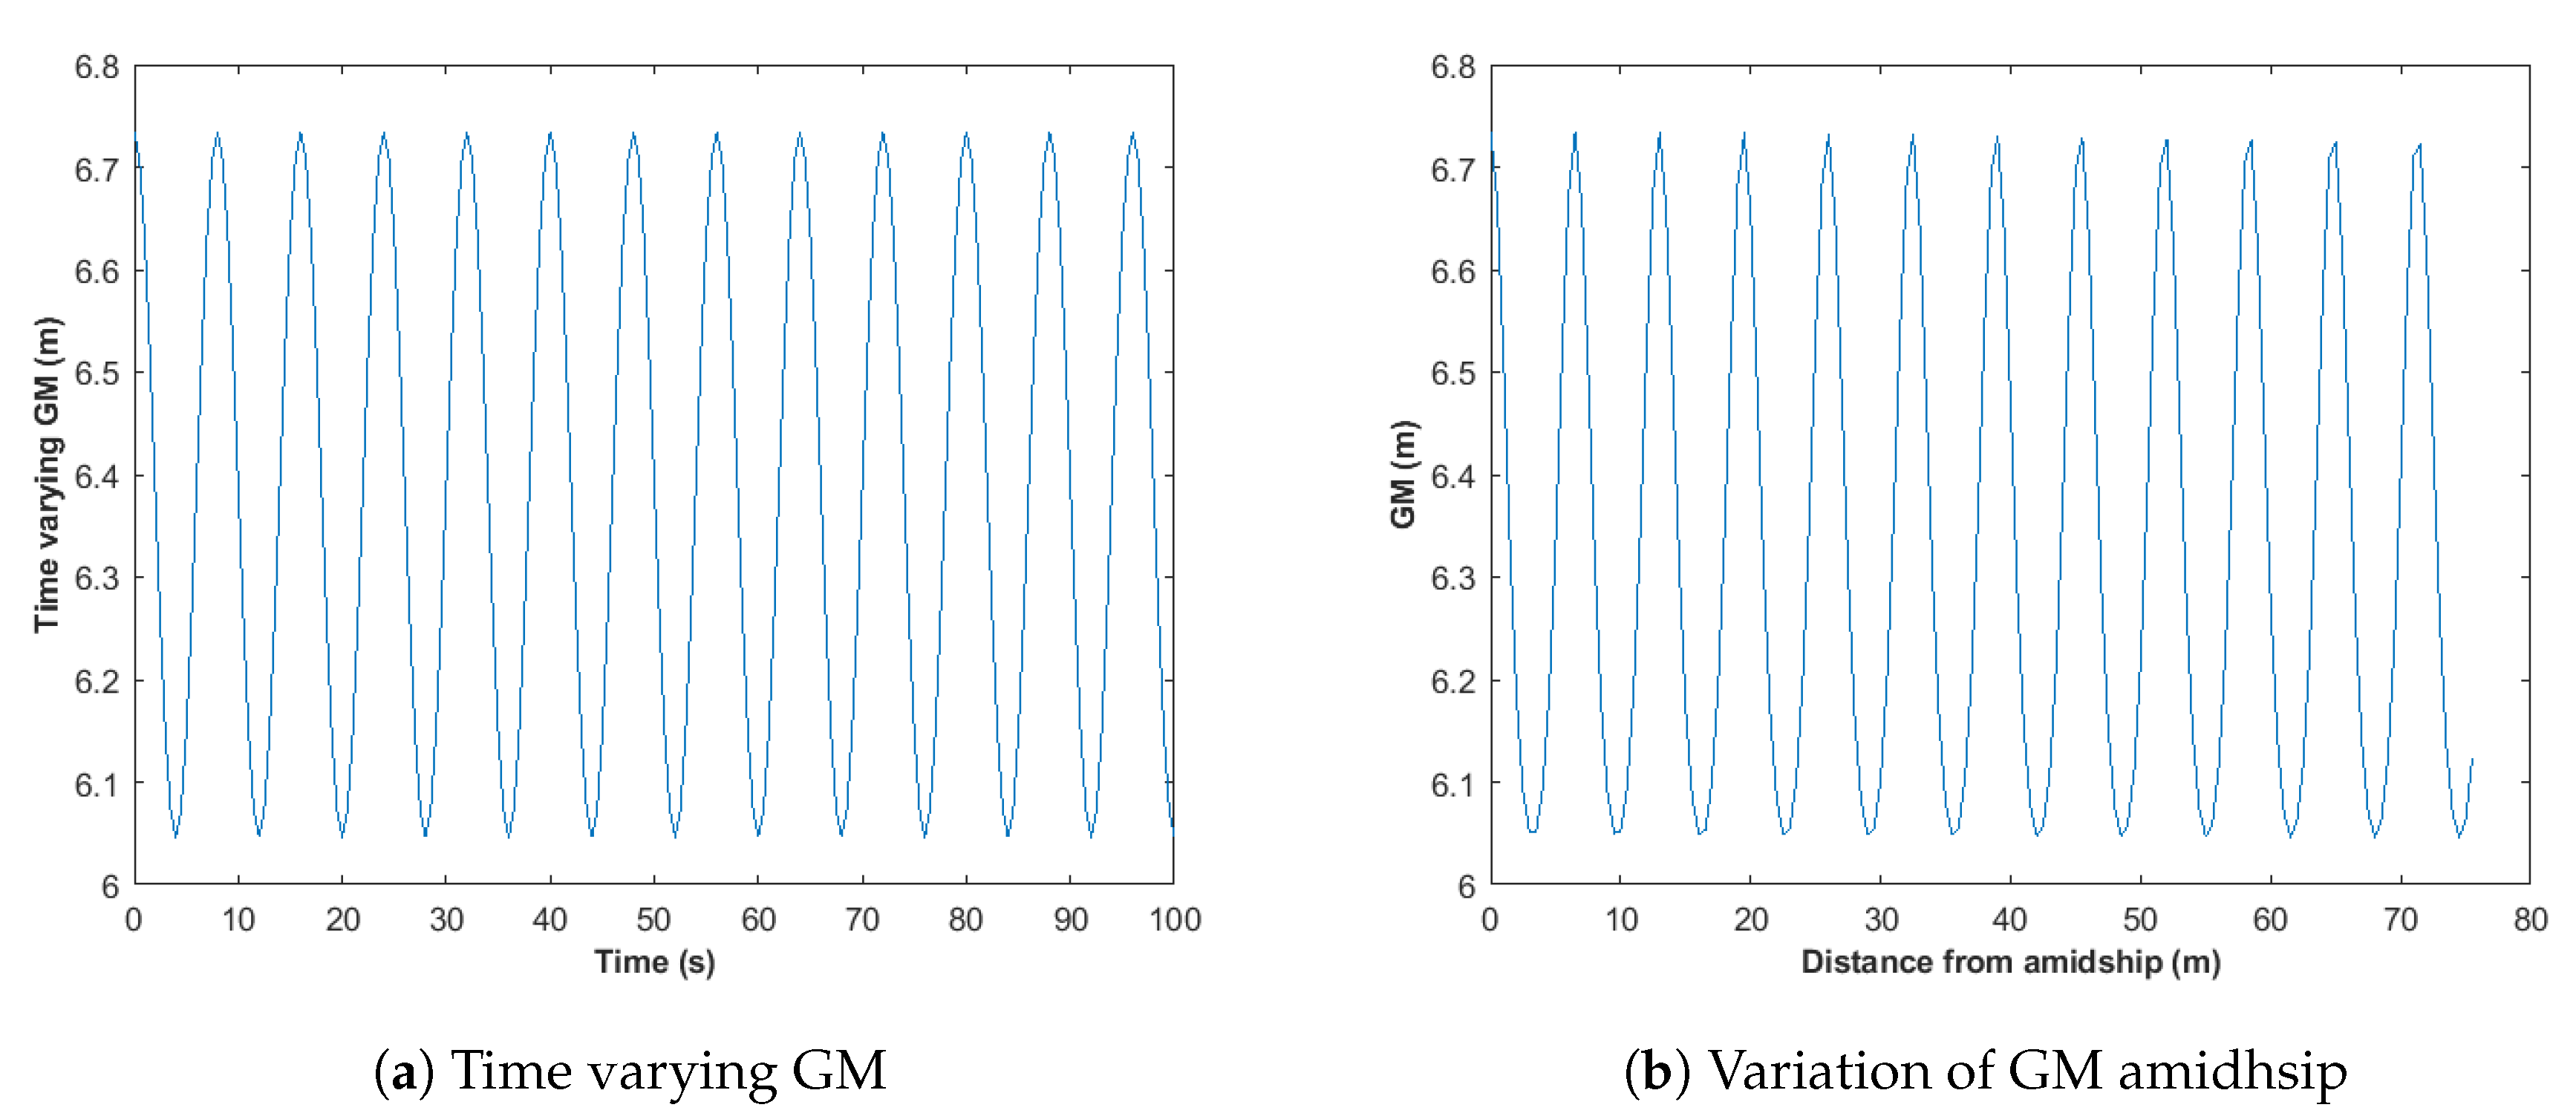
The output module is divided into three panels as “Stability Plots”, “Downtime Cost Analysis” and “Investigate Parametric Roll Resonance”. With the aid of “Investigate Parametric Roll” button, the “Stability Plots” panel is displayed along with the stability parameters pair () for the input wave conditions. Additionally, a success message is displayed if the all input are entered and no zero or empty fields remain as shown in Figure 24b. The “Stability Plots” panels consists of four additional buttons for displaying the time varying stability plots and Ince-Strutt curve. The “Time Varying GM” button in the “Stability Plots” panel allows the user to display the time varying metacentric variation for input sea conditions. The “GM Variation Amidship” button in the “Stability Plots” panel displays the variation of metacenter with respect to the half length of shuttle tanker. The “Stability Curves” button in the “Stability Plots" panel displays the stability curves like variation of vertical center of buoyancy (VCB), metacentric radius and variation of metacentric height (GM) for small angle of heel.
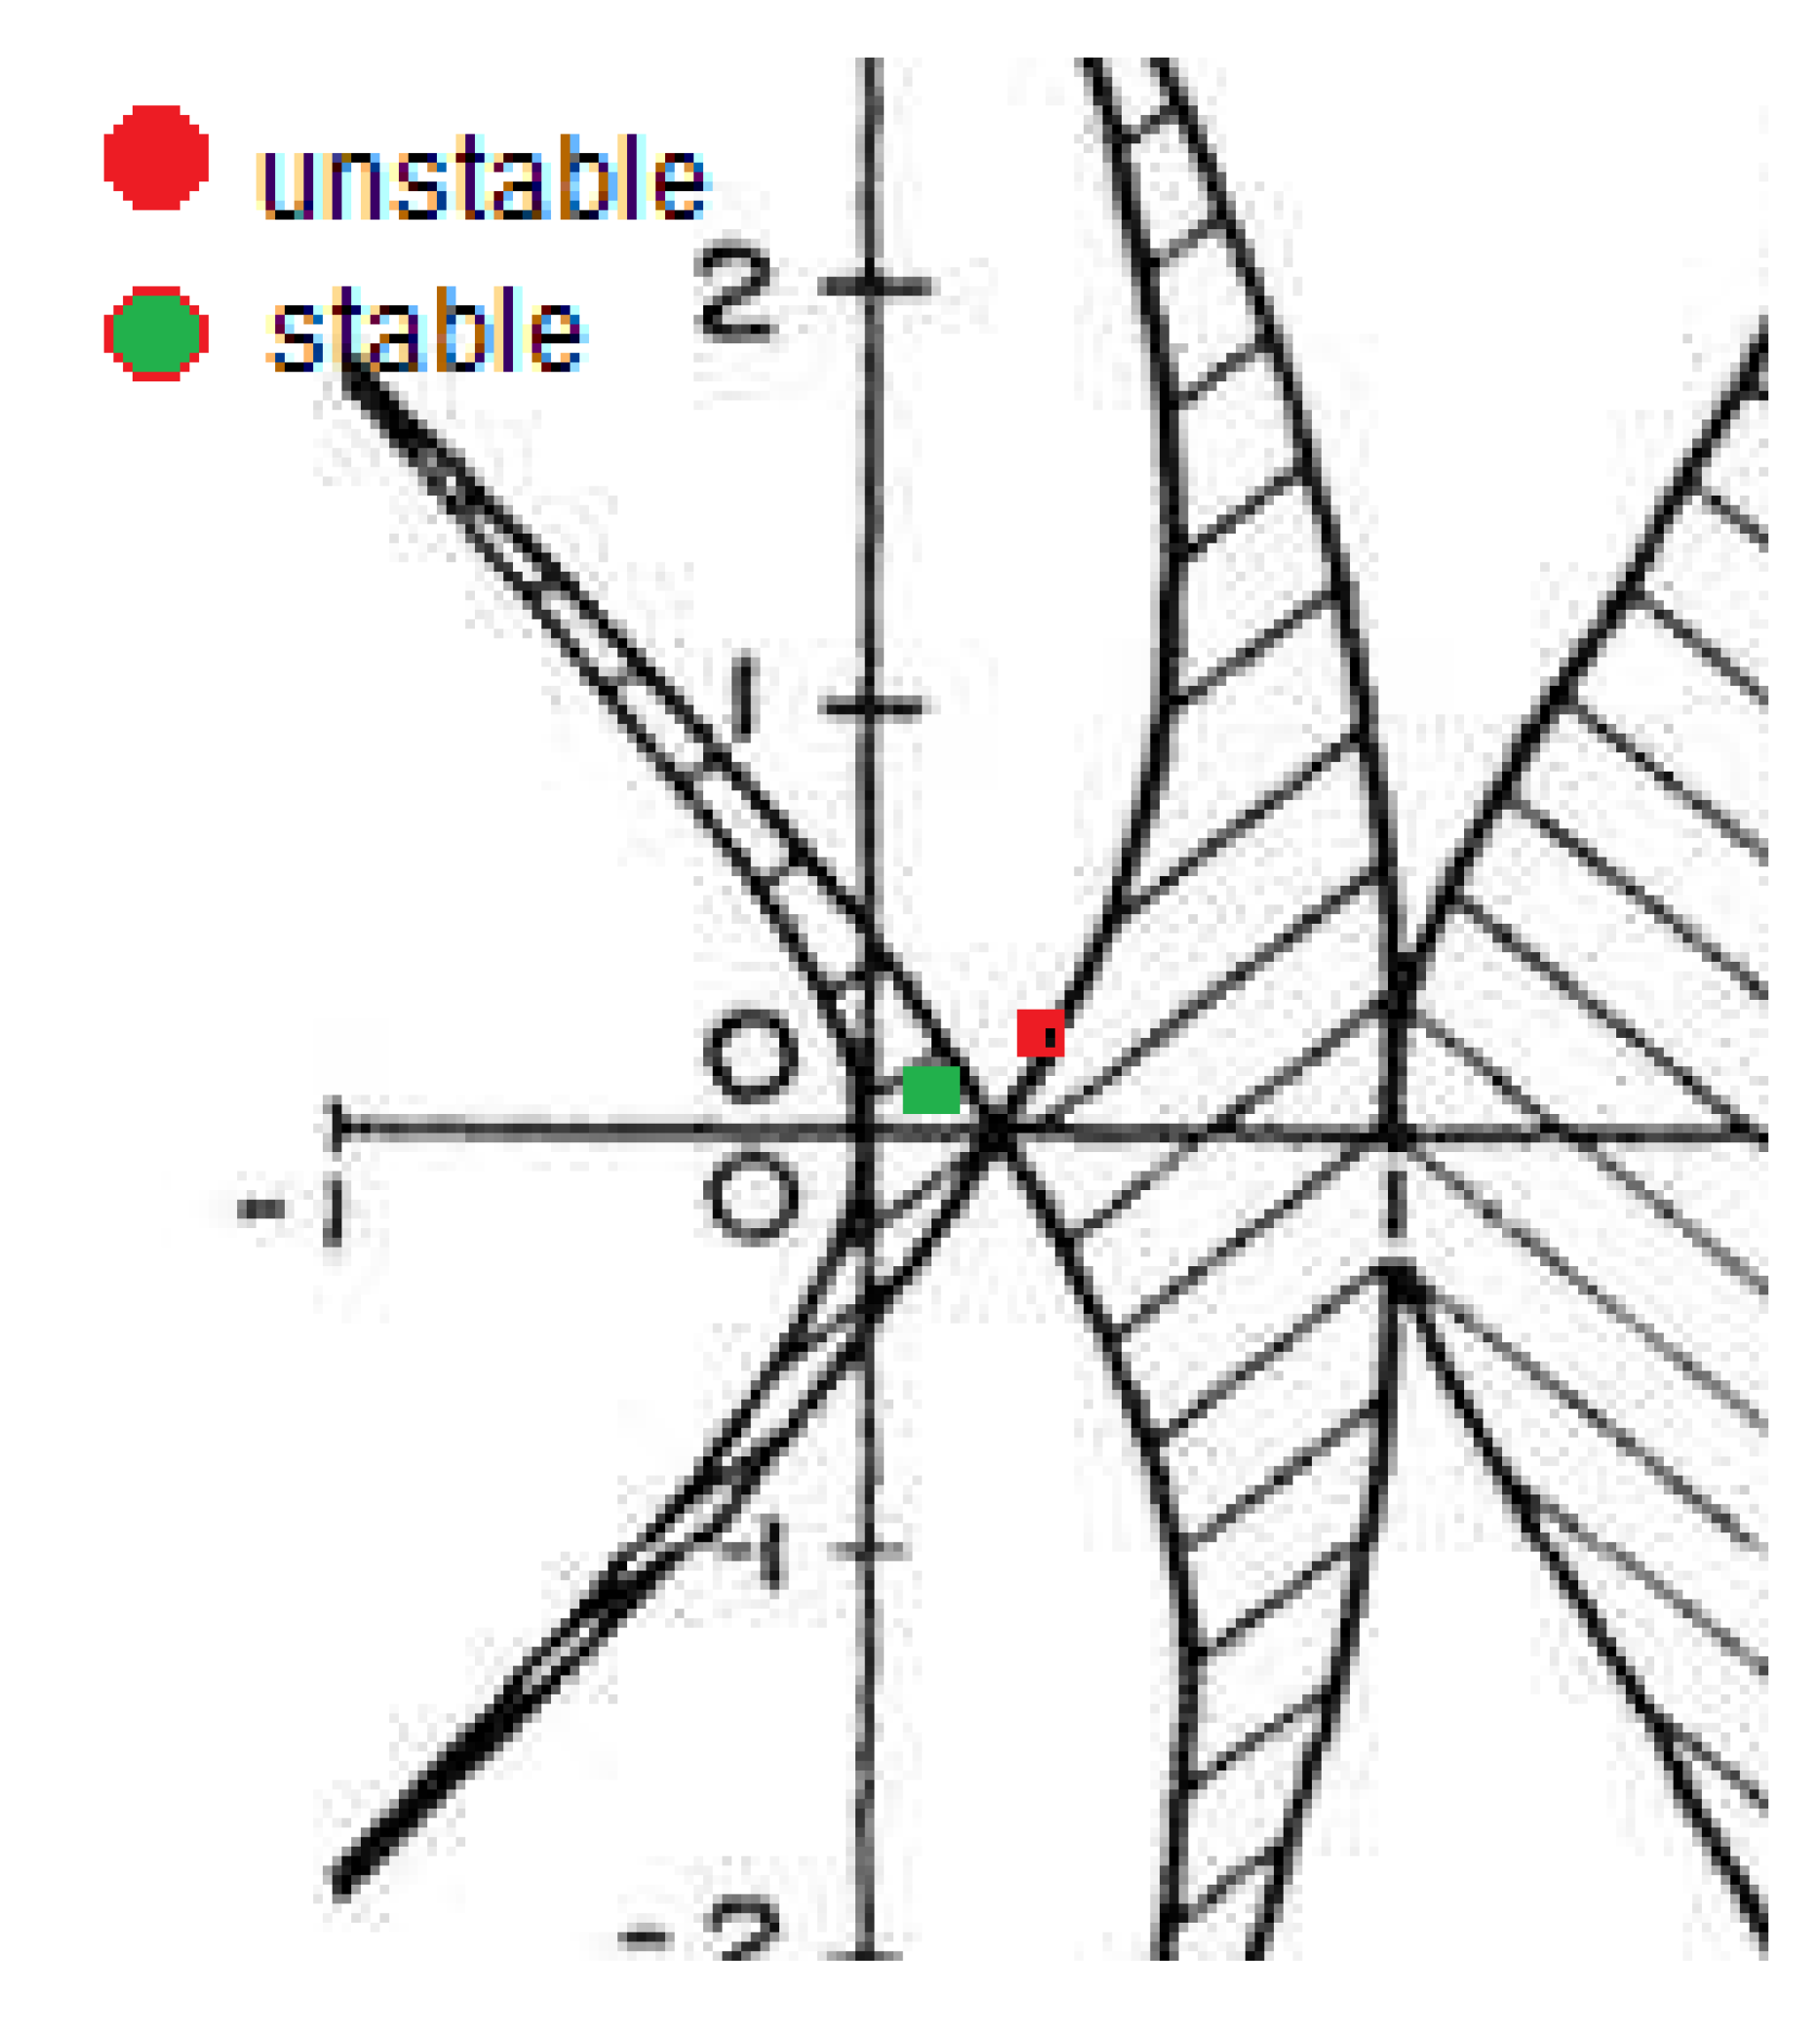
The fourth button “Ince Strutt Curve” in the “Stability Plots” panels displays the original Ince-Strutt stability curve. With the help of this curve, the graphical verification of paramteric roll is possible. The shaded regions in the curve are stable corresponding to the pairs for which parametric motion cannot exist. The unshaded regions refers to region of instability. The “Investigate Principal Paramteric Resonance” button opens another panel of output module. This panel allows the user to manually enter the resonant time period and wave height which is may be susceptible to paramteric rolling. The “Roll Plot” and “Phase Plot” buttons display the roll and phase plane plots for the input resonant conditions. An additional text box is provided for user to enter the length ratio so as to inspect the susceptibility to parametric rolling. The “Investigate for ABS Criteria” button below the length ratio text box investigates for the entered ratio and displays the roll plot and corresponding phase plane plot. Incase if the shuttle tanker is susceptible to parametric rolling either due to input sea conditions or due to the input length ratio, the “Proceed for Downtime Analysis” would facilitate to open “Downtime Cost Analysis” panel.
The “Downtime Cost Analysis” panel requires the user to input the OPEX and downtime days in the “Production Details" sub panel. Additionally, the “Probability Distribution” sub panel would allow the user to select the region of operation and correspondingly display the wave scatter through the “Wave Scatter Diagram” button. The wave scatter diagram allows to calculate the probability of occurrence of unstable wave conditions by entering “Number of Occurrences” and “Total Occurrences” text boxes. Finally, downtime chart can be obtained from the “Downtime Chart” button. This down-time chart is a bar chart which represents the downtime cost incurred for 100% offloading capacity of the shuttle tanker for downtime period of 1, 2 and 3 days. Furthermore, the total downtime cost chart which can be seen by clicking on “Total Downtime Cost Chart” button represents the bar chart for downtime cost for all different percentage offloading capacity of shuttle tanker and all range of downtime days. The “Downtime Cost” displays the downtime cost incurred corresponding to the number of downtime days entered by user through a message window. Last but not least, The “About” button gives the preliminary information on the numerical GUI. Additionally, the “i” button acknowledges the collaborative research units involved in the development of the interface.
Significance and Use of GUI
This GUI would facilitate field operators to estimate the possible downtime cost with regards to parametric rolling. An attempt was made to connect the rolling response of offloading shuttle tanker to cost of production. This GUI is versatile with respect to the OPEX, storage capacity of FPSO and geometric detail of shuttle tanker. The Mathieu’s uncoupled equation of roll and downtime cost equation was used in the source code of the GUI. The roll plots and phase plane plots are presented from the GUI which would help the end user to identify the unstable wave conditions. Furthermore, the GUI also provides the feature to estimate the parametric roll due to roll resonance and ABS criteria. The GUI allows the end user to see the Ince-Strutt stability curve for graphical verification of the stability pair (). The GUI further allows the user to identify the range of frequencies prone to principal parametric resonance. Finally, the GUI presents downtime cost charts which allows the user to estimate the overall loss in the production of oil due to parametric roll.
6. Illustration on Working of GUI
The input values required for numerical illustration of this GUI is displayed in Table 7. The susceptibility of parametric rolling is studied for three cases. The first case is under offloading wave condition of H = 2 m and T = 8 s while it is H = 2 m and T = 10.5 s for second case. The third case is investigation based on ABS criteria and the length ratio was kept as 1.1. The OPEX was considered as US$ 35 and the region of interest was location ‘C’. The downtime cost was calculated if shuttle tanker experienced parametric rolling.
6.1. GUI Illustration: Results on Parametric Rolling and Stability Charts
The results for three cases of offloading wave condition to investigate parametric rolling are shown in Figure 25, Figure 26 and Figure 27. There was no roll excitation observed in the first case. The phase plane plot for the rolling was also bounded. However, roll excitation was observed for the other two cases. For case 2 and 3, there was increase in roll amplitude with respect to time and their corresponding phase plane plot was unbounded. For the illustration of stability plots from the GUI, the presentation are illustrated for case 1 only as shown in Figure 28a,b. However, the stability plot can be obtained for case 2 and case 3 in the same manner. Also, the stability parameters for the three cases of illustration are obtained from the GUI and displayed in Table 8. The stability parameters were plotted on the Ince-Strutt curve as shown in Figure 29. The red mark shows the istability region for case 2 and case 3, respectively. The green mark represents the stability paramters for bounded region of case 1. It is seen and verified that the stability parameters for case 1 lies in the shaded region for which the roll is bounded while for the other two cases it lies in the unshaded region and the roll is unbounded.
6.2. GUI Illustration: Results on Downtime Cost Analysis
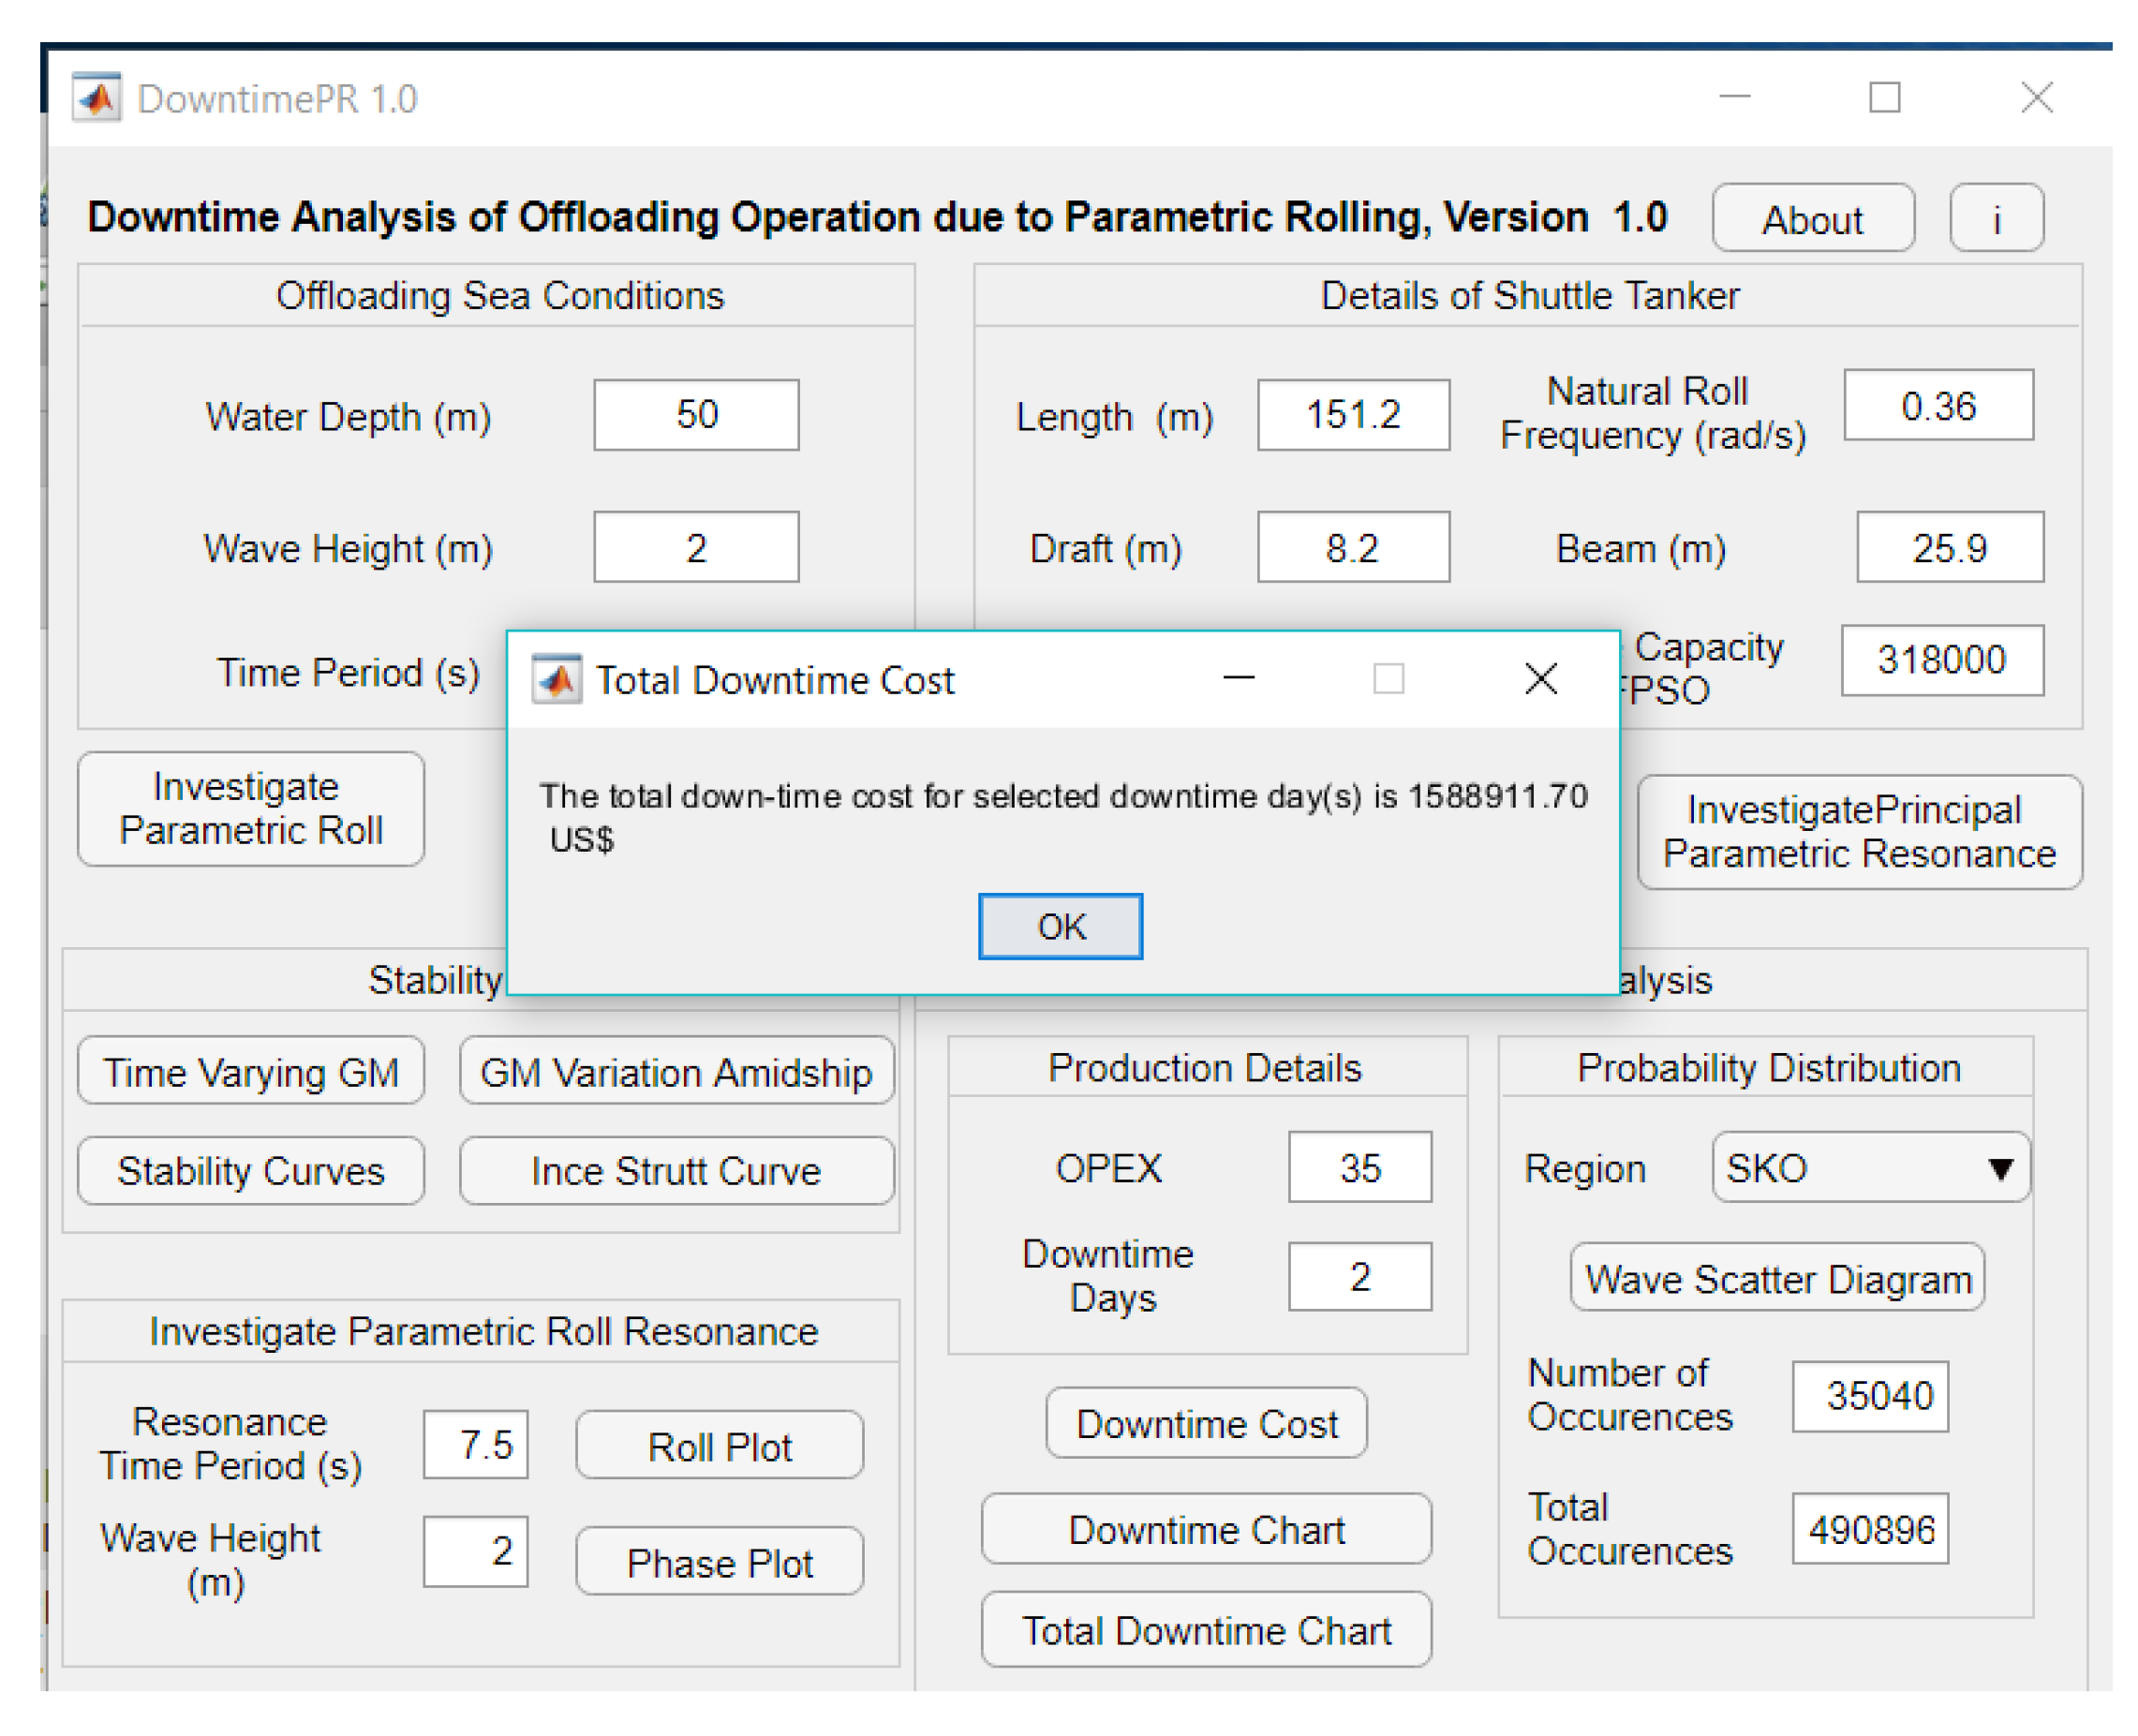
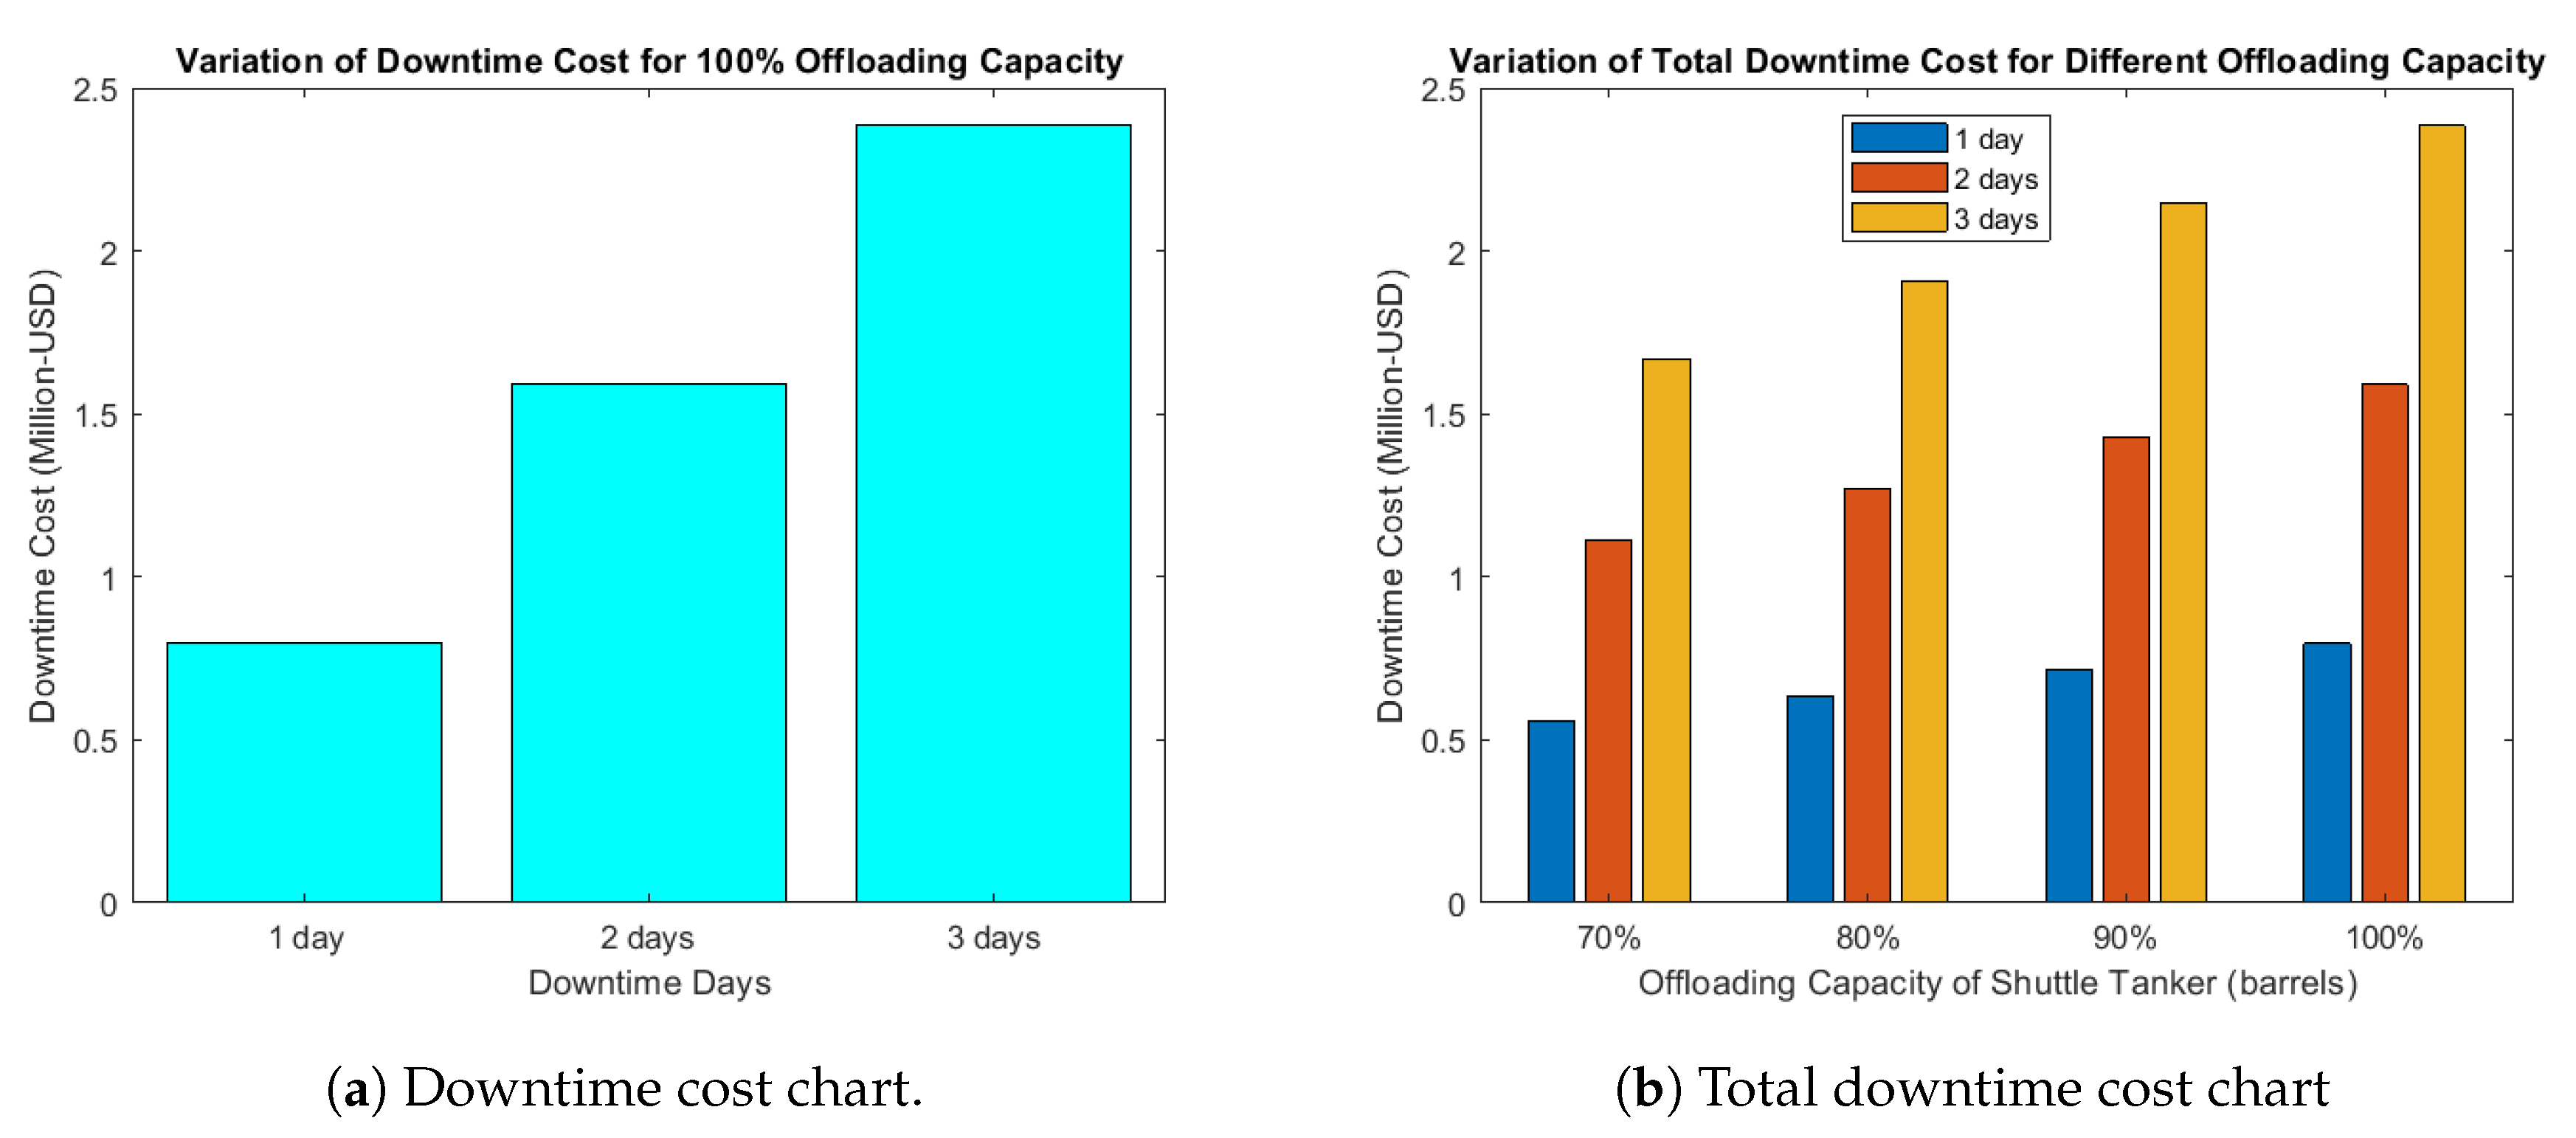
Since the shuttle tanker was found to experience parametric rolling in these two cases, the downtime cost analysis was performed under these conditions. The probability of occurrence for the offloading wave conditions in selected location ‘C’ was determined from the developed GUI. The wave scatter was developed and inbuilt in the GUI, for which the number of occurrences was determined. The encountering wave height is 2 m for both the case of parametric rolling. However, the time period is 10.5 s in case 2 and 10.57 for case 3. The length ratio for case 3 is 1.1 and through dispersion relation, the corresponding time period is found. There is no much difference between the time periods of case 2 and 3. Therefore, the downtime cost analysis remains the same and the downtime cost charts represents both these cases, respectively. The input for downtime cost analysis is shown in Table 9. The GUI also facilitates to provide the downtime cost for input number of downtime days (2 days) through a message window as shown in Figure 30. The GUI displays the downtime cost chart for the 100% offloading capacity of shuttle tanker as shown in Figure 30. A total downtime cost chart is also presented by GUI where in the downtime cost is compared with respect to different percentage range of offloading capacity of shuttle tanker. The total downtime cost chart is shown in Figure 31b. From Figure 31b, the downtime cost ranges between a little above US$ 0.5 million per day to nearly about US$ 1.7 million for three downtime days. The downtime cost shoots up approximately to US$ 2 million for three downtime days under 80% and 90% offloading capacity, respectively. The maximum downtime cost is for the maximum offloading capacity of shuttle tanker and the downtime cost is impacted up to US$ 2.3 million per three days.
7. Conclusions
This paper presented the downtime cost analysis of offloading operations due to parametric rolling of shuttle tanker. The shuttle tanker was investigated under the offloading sea conditions and ABS criteria. The global production cost was severely impacted for H = 2.5 m due to parametric rolling of shuttle tanker in location ‘A’ and ‘C’. There was no significant impact observed for location ‘B’. The interface was developed to link the rolling of shuttle tanker to cost of production of oil. The interface would be useful for field operators to analyze the possible loss in revenue to parametric roll excitation of offloading shuttle tanker. The GUI will be extended for studying the downtime cost analysis of offloading operation of shuttle tanker influenced by parametric rolling under irregular waves in Malaysian waters.
Author Contributions
Conceptualization, M.S.P., M.S.L., Z.M. and A.W.; Investigation, M.S.P.; Methodology, M.S.P. and N.C.Y.; Project administration, M.S.L. and Z.M.; Resources, M.S.L.; Software, M.S.P., M.S.L. and Z.M.; Supervision, M.S.L., Z.M. and A.W.; Visualization, M.S.P. and M.S.L.; Writing—original draft, M.S.P., Z.M. and N.C.Y.; Writing—review & editing, M.S.P., Z.M. and N.C.Y. All authors have read and agreed to the published version of the manuscript.
Funding
This research received no external funding.
Acknowledgments
The authors would like to appreciate the coordination with Z. Razak and M.Q. Ramlan from “GTS/PD&T, PETRONAS - Malaysia” for sharing their industrial experience. The authors would also like to acknowledge the contribution of Ahmed A. Khalifa “ Offshore Engineering Centre (OEC), Universiti Teknologi PETRONAS (UTP)” for sharing his industrial expertise by providing real-time criteria for offloading operations and his technical advice on wave scatter compilation.
Conflicts of Interest
The Graphical User Interface, “DowntimePR 1.0” has been copyrighted under “INSTITUTE OF TECHNOLOGY PETRONAS SDN. BHD.”. The authors declare that there is no conflict of interest regarding publication of this article.
Nomenclature
| draft at each station of shuttle tanker | |
| draft of shuttle tanker | |
| encountering wave length | |
| transverse moment of inertia | |
| beam of shuttle tanker for station x | |
| submerged area | |
| ∇ | displaced volume |
| vertical static moment | |
| mean value of GM | |
| amplitude change in GM | |
| C | fractional change in GM |
| angle of roll | |
| stability parameters | |
| natural roll frequency of shuttle tanker | |
| encountering wave frequency | |
| length of shuttle tanker | |
| length of encountering wave |
Abbreviations
The following abbreviations are used in this manuscript:
| FPSO | Floating Production Storage and Offloading |
| GM | Metacentric height |
| H | Encountering wave height |
| VCB | Vertical center of buoyancy |
| BM | Metacentric radius |
| KG | Vertical center of gravity |
References
- Barton, C.; Hambling, H.; Albaugh, E.; Mahlstedt, B.; Davis, D. Worldwide Survey of Floating Production, Storage and Offloading (FPSO) Units. Offshore Mag. 2017. [Google Scholar]
- e Silva, S.R.; Soares, C.G. Prediction of parametric rolling in waves with a time domain non-linear strip theory model. Ocean Eng. 2013, 72, 453–469. [Google Scholar] [CrossRef]
- Obreja, D.C.; Nabergoj, R.; Crudu, L.I.; Pacuraru-Popoiu, S. Transverse stability of a cargo ship at parametric rolling on longitudinal waves. In ASME 2008 27th International Conference on Offshore Mechanics and Arctic Engineering; American Society of Mechanical Engineers: New York, NY, USA, 2008; pp. 579–587. [Google Scholar]
- Lugni, C.; Greco, M.; Faltinsen, O.M. Influence of yaw-roll coupling on the behavior of a FPSO: An experimental and numerical investigation. Appl. Ocean Res. 2015, 51, 25–37. [Google Scholar] [CrossRef] [Green Version]
- Schumacher, A.; e Silva, S.R.; Soares, C.G. Experimental and numerical study of a containership under parametric rolling conditions in waves. Ocean Eng. 2016, 124, 385–403. [Google Scholar] [CrossRef]
- Wang, L.; Tang, Y.; Zhang, X.; Zhang, J. Studies on parametric roll motion of ship under wave group by numerical simulation. Ocean Eng. 2018, 163, 391–399. [Google Scholar] [CrossRef]
- Jensen, J.J.; Choi, J.H.; Nielsen, U.D. Statistical prediction of parametric roll using FORM. Ocean Eng. 2017, 144, 235–242. [Google Scholar] [CrossRef] [Green Version]
- Holden, C.; Perez, T.; Fossen, T.I. Frequency-motivated observer design for the prediction of parametric roll resonance. IFAC Proc. Vol. 2007, 40, 57–62. [Google Scholar] [CrossRef]
- Bu, S.X.; Gu, M.; Lu, J.; Abdel-Maksoud, M. Effects of radiation and diffraction forces on the prediction of parametric roll. Ocean Eng. 2019, 175, 262–272. [Google Scholar] [CrossRef]
- Vidic-Perunovic, J.; Jensen, J.J. Parametric roll due to hull instantaneous volumetric changes and speed variations. Ocean Eng. 2009, 36, 891–899. [Google Scholar] [CrossRef]
- Vidic-Perunovic, J. Influence of the GZ calculation method on parametric roll prediction. Ocean Eng. 2011, 38, 295–303. [Google Scholar] [CrossRef]
- Patel, M.S.; Liew, M.S.; Zahiraniza, M.; Abdurrasheed, S.A.; Whyte, A. Influence of Partially Standing Waves on Offloading Operations for Shuttle Tanker. Lecture Notes Mech. Eng. 2018, in press. [Google Scholar]
- Park, D.M.; Kim, Y.; Song, K.H. Sensitivity in numerical analysis of parametric roll. Ocean Eng. 2013, 67, 1–12. [Google Scholar] [CrossRef]
- Galeazzi, R.; Blanke, M.; Falkenberg, T.; Poulsen, N.K.; Violaris, N.; Storhaug, G.; Huss, M. Parametric roll resonance monitoring using signal-based detection. Ocean Eng. 2015, 109, 355–371. [Google Scholar] [CrossRef] [Green Version]
- Ahmed, T.; Hudson, D.; Temarel, P. An investigation into parametric roll resonance in regular waves using a partly non-linear numerical model. Ocean Eng. 2010, 37, 1307–1320. [Google Scholar] [CrossRef]
- Ballard, E.; Evans, M. Use of Sequential Downtime Analysis in Planning Offshore Operations. In Proceedings of the Offshore Technology Conference-Asia, Kuala Lumpur, Malaysia, 25–28 March 2014. [Google Scholar]
- Oelker, S.; Ait-Alla, A.; Lewandowski, M.; Löffler, M.; Freitag, M. Simulation-Based Economic Evaluation of the Operational Phase of Offshore Wind Turbines. In Proceedings of the 29th International Ocean and Polar Engineering Conference, Honolulu, HI, USA, 16–21 June 2019; International Society of Offshore and Polar Engineers: Mountain View, CA, USA, 2019. [Google Scholar]
- Han, Y.; Zhen, X.; Huang, Y. Drift-off Safety Limits of Dynamic Positioned FPSO on the NextGen SPS. In Proceedings of the 29th International Ocean and Polar Engineering Conference, Honolulu, HI, USA, 16–21 June 2019; International Society of Offshore and Polar Engineers: Mountain View, CA, USA, 2019. [Google Scholar]
- Laskar, S. A Holistic Approach to Sustainable Operational Risk Assessments in Oil and Gas Industry. In Proceedings of the Offshore Technology Conference, Houston, TX, USA, 1–4 May 2017. [Google Scholar]
- Devold, H.; Graven, T.; Halvorsrød, S. Digitalization of Oil and Gas Facilities Reduce Cost and Improve Maintenance Operations. In Proceedings of the Offshore Technology Conference, Houston, TX, USA, 1–4 May 2017. [Google Scholar]
- Larcombe, P.; Garvey, M. Reduced Downtime in Subsea Operations through Use of Predictions of Underwater Visibility for ROVs-Science and Application. In Proceedings of the Offshore Technology Conference Asia, Offshore Technology Conference, Kuala Lumpur, Malaysia, 20–23 March 2018. [Google Scholar]
- Denney, D. Performance, Operability, and Risk Assessment of the Shtokman Floating Platform in Ice. J. Petroleum Technol. 2012, 64, 80–82. [Google Scholar] [CrossRef]
- Chidiac, C.; Sauvé, R.; Kunz, S. Designing Subsea Production Systems for Efficient Startup to Mitigate Costly Topside Downtime. In Proceedings of the SPE Annual Technical Conference and Exhibition, San Antonio, TX, USA, 9–11 October 2017. [Google Scholar]
- Patel, M.S.; Liew, M.S.; Zahiraniza, M.; Abdurrasheed., A.S.; Whyte, A. Effects of Motion Responses and Drift Forces on Side-by-Side Offloading Operation of FPSO. Lecture Notes Mech. Eng. 2018, in press. [Google Scholar]
- Shin, Y.; Belenky, V.; Paulling, J.; Weems, K.; Lin, W. Criteria for Parametric Roll of Large Containerships in Longitudinal Seas; ABS Technical Papers; American Bureau of Shipping: Houston, TX, USA, 2004; pp. 117–147. [Google Scholar]
Figure 1.
Global distribution of FPSO [1], with the permission from woodplc, 2017.
Figure 1.
Global distribution of FPSO [1], with the permission from woodplc, 2017.

Figure 2.
South-east Asia distribution of FPSO [1], with the permission from woodplc, 2017.
Figure 2.
South-east Asia distribution of FPSO [1], with the permission from woodplc, 2017.

Figure 3.
Vessel in waves.

Figure 4.
Geometric model of shuttle tanker.

Figure 5.
Parametric rolling for H = 2.5 m and .

Figure 6.
Parametric rolling for H = 2.5 m and .

Figure 7.
Parametric rolling for H = 3.0 m and .

Figure 8.
Parametric rolling for H = 3.5 m and .

Figure 9.
Parametric rolling for H = 2.5 m and .

Figure 10.
Parametric rolling for H = 3.0 m and .

Figure 11.
Parametric rolling for H = 3.0 m and .

Figure 12.
Parametric rolling for H = 3.0 m and .

Figure 13.
Parametric rolling for H = 3.5 m and .

Figure 14.
Parametric rolling for H = 3.5 m and .

Figure 15.
Parametric rolling for H = 3.5 m and .

Figure 16.
Wave height = 2.5 m.

Figure 17.
Wave height = 3.0 m.

Figure 18.
Wave height = 3.5 m.

Figure 19.
Downtime cost charts.

Figure 20.
Downtime cost charts.

Figure 21.
Downtime cost charts.

Figure 22.
Developed GUI.

Figure 23.
Flowchart for GUI.

Figure 24.
Demo of GUI.

Figure 25.
Rolling for Case 1.

Figure 26.
Rolling for Case 2.

Figure 27.
Rolling for Case 3.

Figure 28.
Time varying plots obatined from GUI.

Figure 29.
Stability parameters on Ince-Strutt curve.

Figure 30.
GUI illustration for downtime cost window.

Figure 31.
Downtime cost charts obtained from GUI.


Table 1.
Details of shuttle tanker.
| Category | Detail | Shuttle Tanker |
|---|---|---|
| Geometric details | Length | 151.6 m |
| Beam | 25.9 m | |
| Draft | 8.2 m | |
| Total structural mass | 23,466,000 kg | |
| Kxx | 8.806 m | |
| Kyy | 37.9 m | |
| Kzz | 39.416 m |
Table 2.
Wave conditions for investigation of parametric roll.
| Case 1 | |
| Water depth (m) | 50 |
| Wave height (m) | 2.5, 3 & 3.5 |
| Case 2 | |
| Water depth (m) | 100 |
| Wave height (m) | 2.5, 3 & 3.5 |
Table 3.
ABS criteria details for 50 m water depth.
| (m) | (s) | (rad/s) | (rad/s) | |
|---|---|---|---|---|
| 0.8 | 121.28 | 8.86 | 0.336 | 0.708 |
| 0.9 | 136.44 | 9.44 | 0.346 | 0.66 |
| 1 | 151.6 | 10.01 | 0.35 | 0.62 |
| 1.1 | 166.76 | 10.57 | 0.353 | 0.59 |
| 1.2 | 181.92 | 11.14 | 0.356 | 0.56 |
| 1.3 | 197.08 | 11.70 | 0.357 | 0.53 |
| 1.4 | 212.24 | 12.27 | 0.359 | 0.51 |
| 1.5 | 227.4 | 12.85 | 0.36 | 0.48 |
| 1.6 | 242.56 | 13.43 | 0.36 | 0.46 |
| 1.7 | 257.72 | 14.02 | 0.361 | 0.44 |
| 1.8 | 272.88 | 14.61 | 0.361 | 0.42 |
| 1.9 | 288.04 | 15.21 | 0.361 | 0.41 |
| 2 | 303.2 | 15.81 | 0.362 | 0.39 |
Table 4.
ABS criteria details for 100 m water depth.
| (m) | (s) | (rad/s) | (rad/s) | |
|---|---|---|---|---|
| 0.8 | 121.28 | 8.81 | 0.336 | 0.71 |
| 0.9 | 136.44 | 9.35 | 0.336 | 0.67 |
| 1.0 | 151.6 | 9.85 | 0.35 | 0.63 |
| 1.1 | 166.76 | 10.34 | 0.35 | 0.60 |
| 1.2 | 181.92 | 10.80 | 0.36 | 0.58 |
| 1.3 | 197.08 | 11.25 | 0.36 | 0.55 |
| 1.4 | 212.24 | 11.69 | 0.36 | 0.53 |
| 1.5 | 227.4 | 12.11 | 0.36 | 0.52 |
| 1.6 | 242.56 | 12.53 | 0.36 | 0.50 |
| 1.7 | 257.72 | 12.94 | 0.36 | 0.48 |
| 1.8 | 272.88 | 13.35 | 0.36 | 0.47 |
| 1.9 | 288.04 | 13.75 | 0.36 | 0.45 |
| 2 | 303.2 | 14.15 | 0.36 | 0.44 |
Table 5.
Wave scatter for location ‘A’.
| H/T | 0 TO 2 | 2 TO 4 | 4 TO 6 | 6 TO 8 | 8 TO 10 | 10 TO 12 | 12 TO 14 | 14 TO 16 | 16 TO 18 | TOTAL |
|---|---|---|---|---|---|---|---|---|---|---|
| 0–0.5 | 32 | 17,085 | 179156 | 11,116 | 1217 | 393 | 134 | 31 | 14 | 209,178 |
| 0.51–1 | 0 | 969 | 83,187 | 72,896 | 2660 | 803 | 320 | 115 | 7 | 160,957 |
| 1.1–1.5 | 0 | 2 | 2382 | 59,066 | 4236 | 7 | 6 | 2 | 0 | 65,701 |
| 1.51–2 | 0 | 0 | 6 | 19,318 | 17,043 | 9 | 0 | 0 | 0 | 36,376 |
| 2.1–2.5 | 0 | 0 | 0 | 747 | 13,668 | 0 | 0 | 0 | 0 | 14,415 |
| 2.51–3 | 0 | 0 | 0 | 10 | 3621 | 28 | 0 | 0 | 0 | 3659 |
| 3.1–3.5 | 0 | 0 | 0 | 0 | 452 | 130 | 0 | 0 | 0 | 582 |
| 3.51–4 | 0 | 0 | 0 | 0 | 17 | 11 | 0 | 0 | 0 | 28 |
| TOTAL | 32 | 18,056 | 264,731 | 163,153 | 42,914 | 1381 | 460 | 148 | 21 | 490,896 |
Table 6.
Particulars of downtime cost analysis for parametric rolling.
| H = 2.5 m | |||
| Particulars | Location A | Location B | Location C |
| Probability occurrence () | 3.53 % | 0.5 % | 2.2 % |
| OPEX (US$/barrel of oil) | 35 | 35 | 35 |
| Downtime day | 1, 2, 3 | 1, 2, 3 | 1, 2, 3 |
| H = 3.0 m | |||
| Particulars | Location A | Location B | Location C |
| Probability occurrence () | 1.0 % | - | 0.36 % |
| OPEX (US$/barrel of oil) | 35 | 35 | 35 |
| Downtime day | 1, 2, 3 | 1, 2, 3 | 1, 2, 3 |
| H = 3.5 m | |||
| Particulars | Location A | Location B | Location C |
| Probability occurrence () | 0.124 % | - | - |
| OPEX (US$/barrel of oil) | 35 | 35 | 35 |
| Downtime day | 1, 2, 3 | 1, 2, 3 | 1, 2, 3 |
Table 7.
GUI illustration: Input for offloading sea condition and details of shuttle tanker.
| Case 1: offloading sea conditions | |
| Water depth | 50 m |
| Wave height | 2 m |
| Time period | 8 s |
| Case 2: offloading sea conditions | |
| Water depth | 50 m |
| Wave height | 2 m |
| Time period | s |
| Case 3: ABS criteria | |
| Water depth | 50 m |
| Wave height | 2 m |
| 1.1 | |
| Details of shuttle tanker | |
| Length | m |
| Draft | m |
| Beam | m |
| Natural roll frequency | (rad/s) |
| KG | m |
| Storage capacity of FPSO | barrels of oil |
Table 8.
Stability parameters for offloading sea conditions.
| Offloading Sea Conditions | ||
|---|---|---|
| H = 2 m and T = 8 s | 0.212 | 0.073 |
| H = 2 m and T = 10.5 s | 0.369 | 0.126 |
| 0.371 | 0.13 |
Table 9.
GUI illustration: Input for downtime cost analysis.
| Production details | |
| OPEX | US$ 35 |
| Downtime days | 2 days |
| Probability details | |
| Region | Location C |
| Number of occurrences | 35,040 |
| Total occurences | 490,896 |
© 2019 by the authors. Licensee MDPI, Basel, Switzerland. This article is an open access article distributed under the terms and conditions of the Creative Commons Attribution (CC BY) license (http://creativecommons.org/licenses/by/4.0/).
Share and Cite
MDPI and ACS Style
Patel, M.S.; Liew, M.S.; Mustaffa, Z.; Yee, N.C.; Whyte, A. Development of Downtime Cost Calculator for Offloading Operations Influenced by Parametric Rolling. J. Mar. Sci. Eng. 2020, 8, 7. https://doi.org/10.3390/jmse8010007
AMA Style
Patel MS, Liew MS, Mustaffa Z, Yee NC, Whyte A. Development of Downtime Cost Calculator for Offloading Operations Influenced by Parametric Rolling. Journal of Marine Science and Engineering. 2020; 8(1):7. https://doi.org/10.3390/jmse8010007
Chicago/Turabian StylePatel, M. S., M. S. Liew, Zahiraniza Mustaffa, Ng Cheng Yee, and Andrew Whyte. 2020. "Development of Downtime Cost Calculator for Offloading Operations Influenced by Parametric Rolling" Journal of Marine Science and Engineering 8, no. 1: 7. https://doi.org/10.3390/jmse8010007
Note that from the first issue of 2016, this journal uses article numbers instead of page numbers. See further details here.