Relationship between Skin Temperature, Electrical Manifestations of Muscle Fatigue, and Exercise-Induced Delayed Onset Muscle Soreness for Dynamic Contractions: A Preliminary Study

 ,
,  , , , and
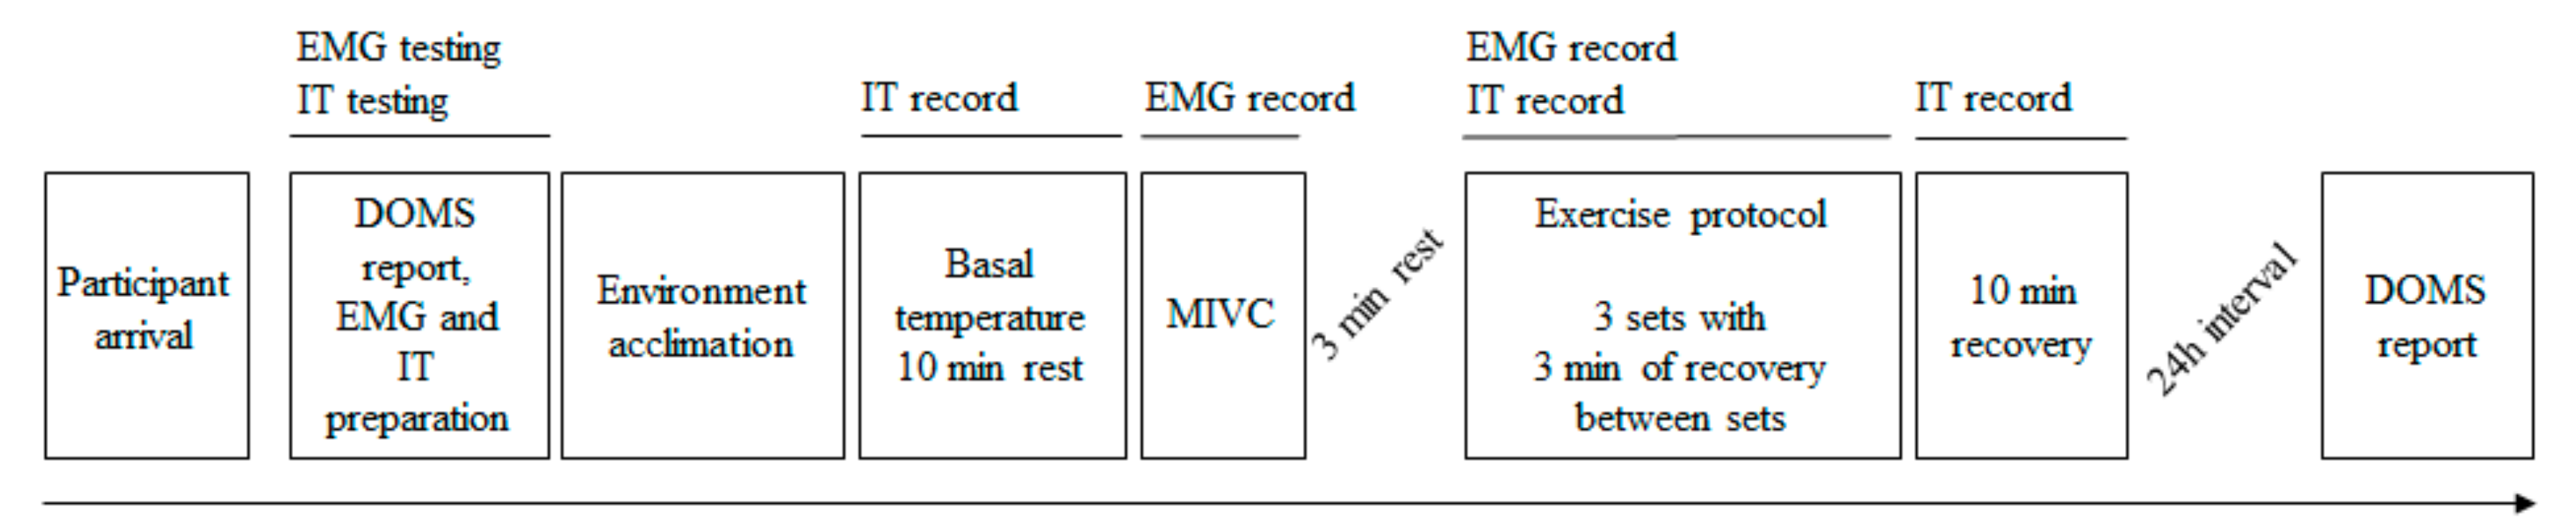
Abstract
:1. Introduction
2. Materials and Methods
2.1. Experimental Design
2.2. Participants
2.3. Procedures
2.4. Data Processing
2.5. Statistical Analysis
3. Results
3.1. DOMS
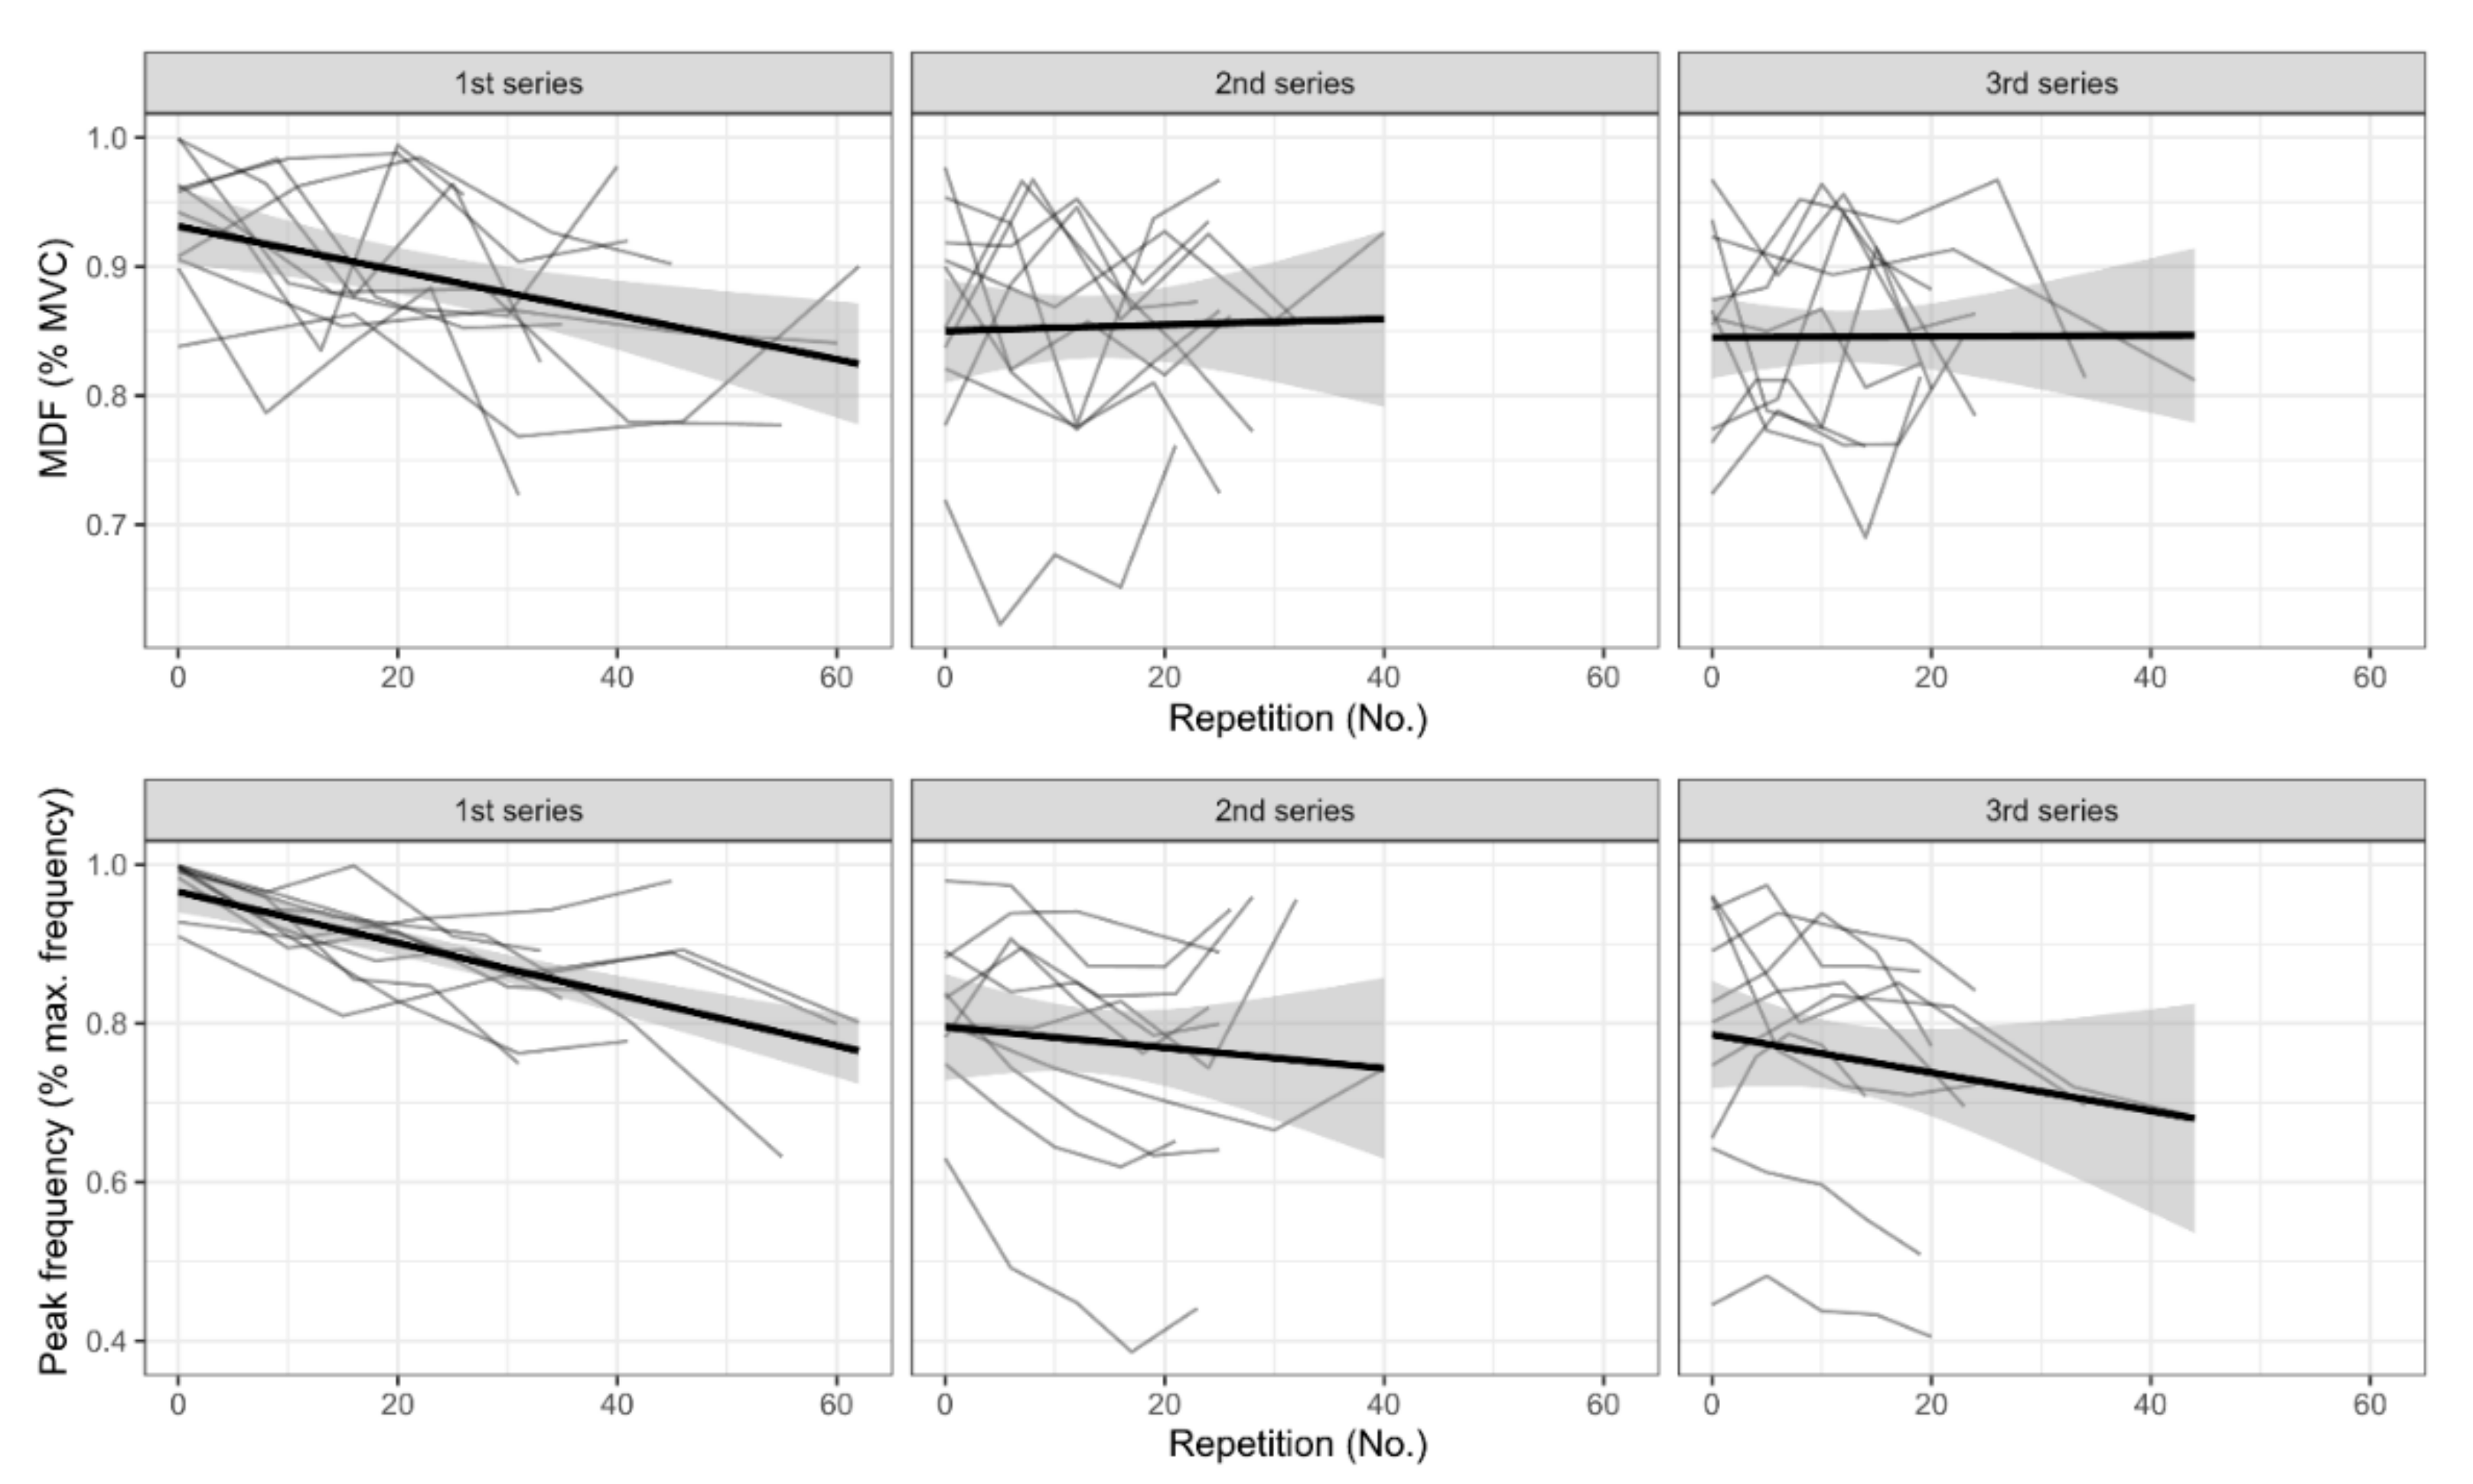
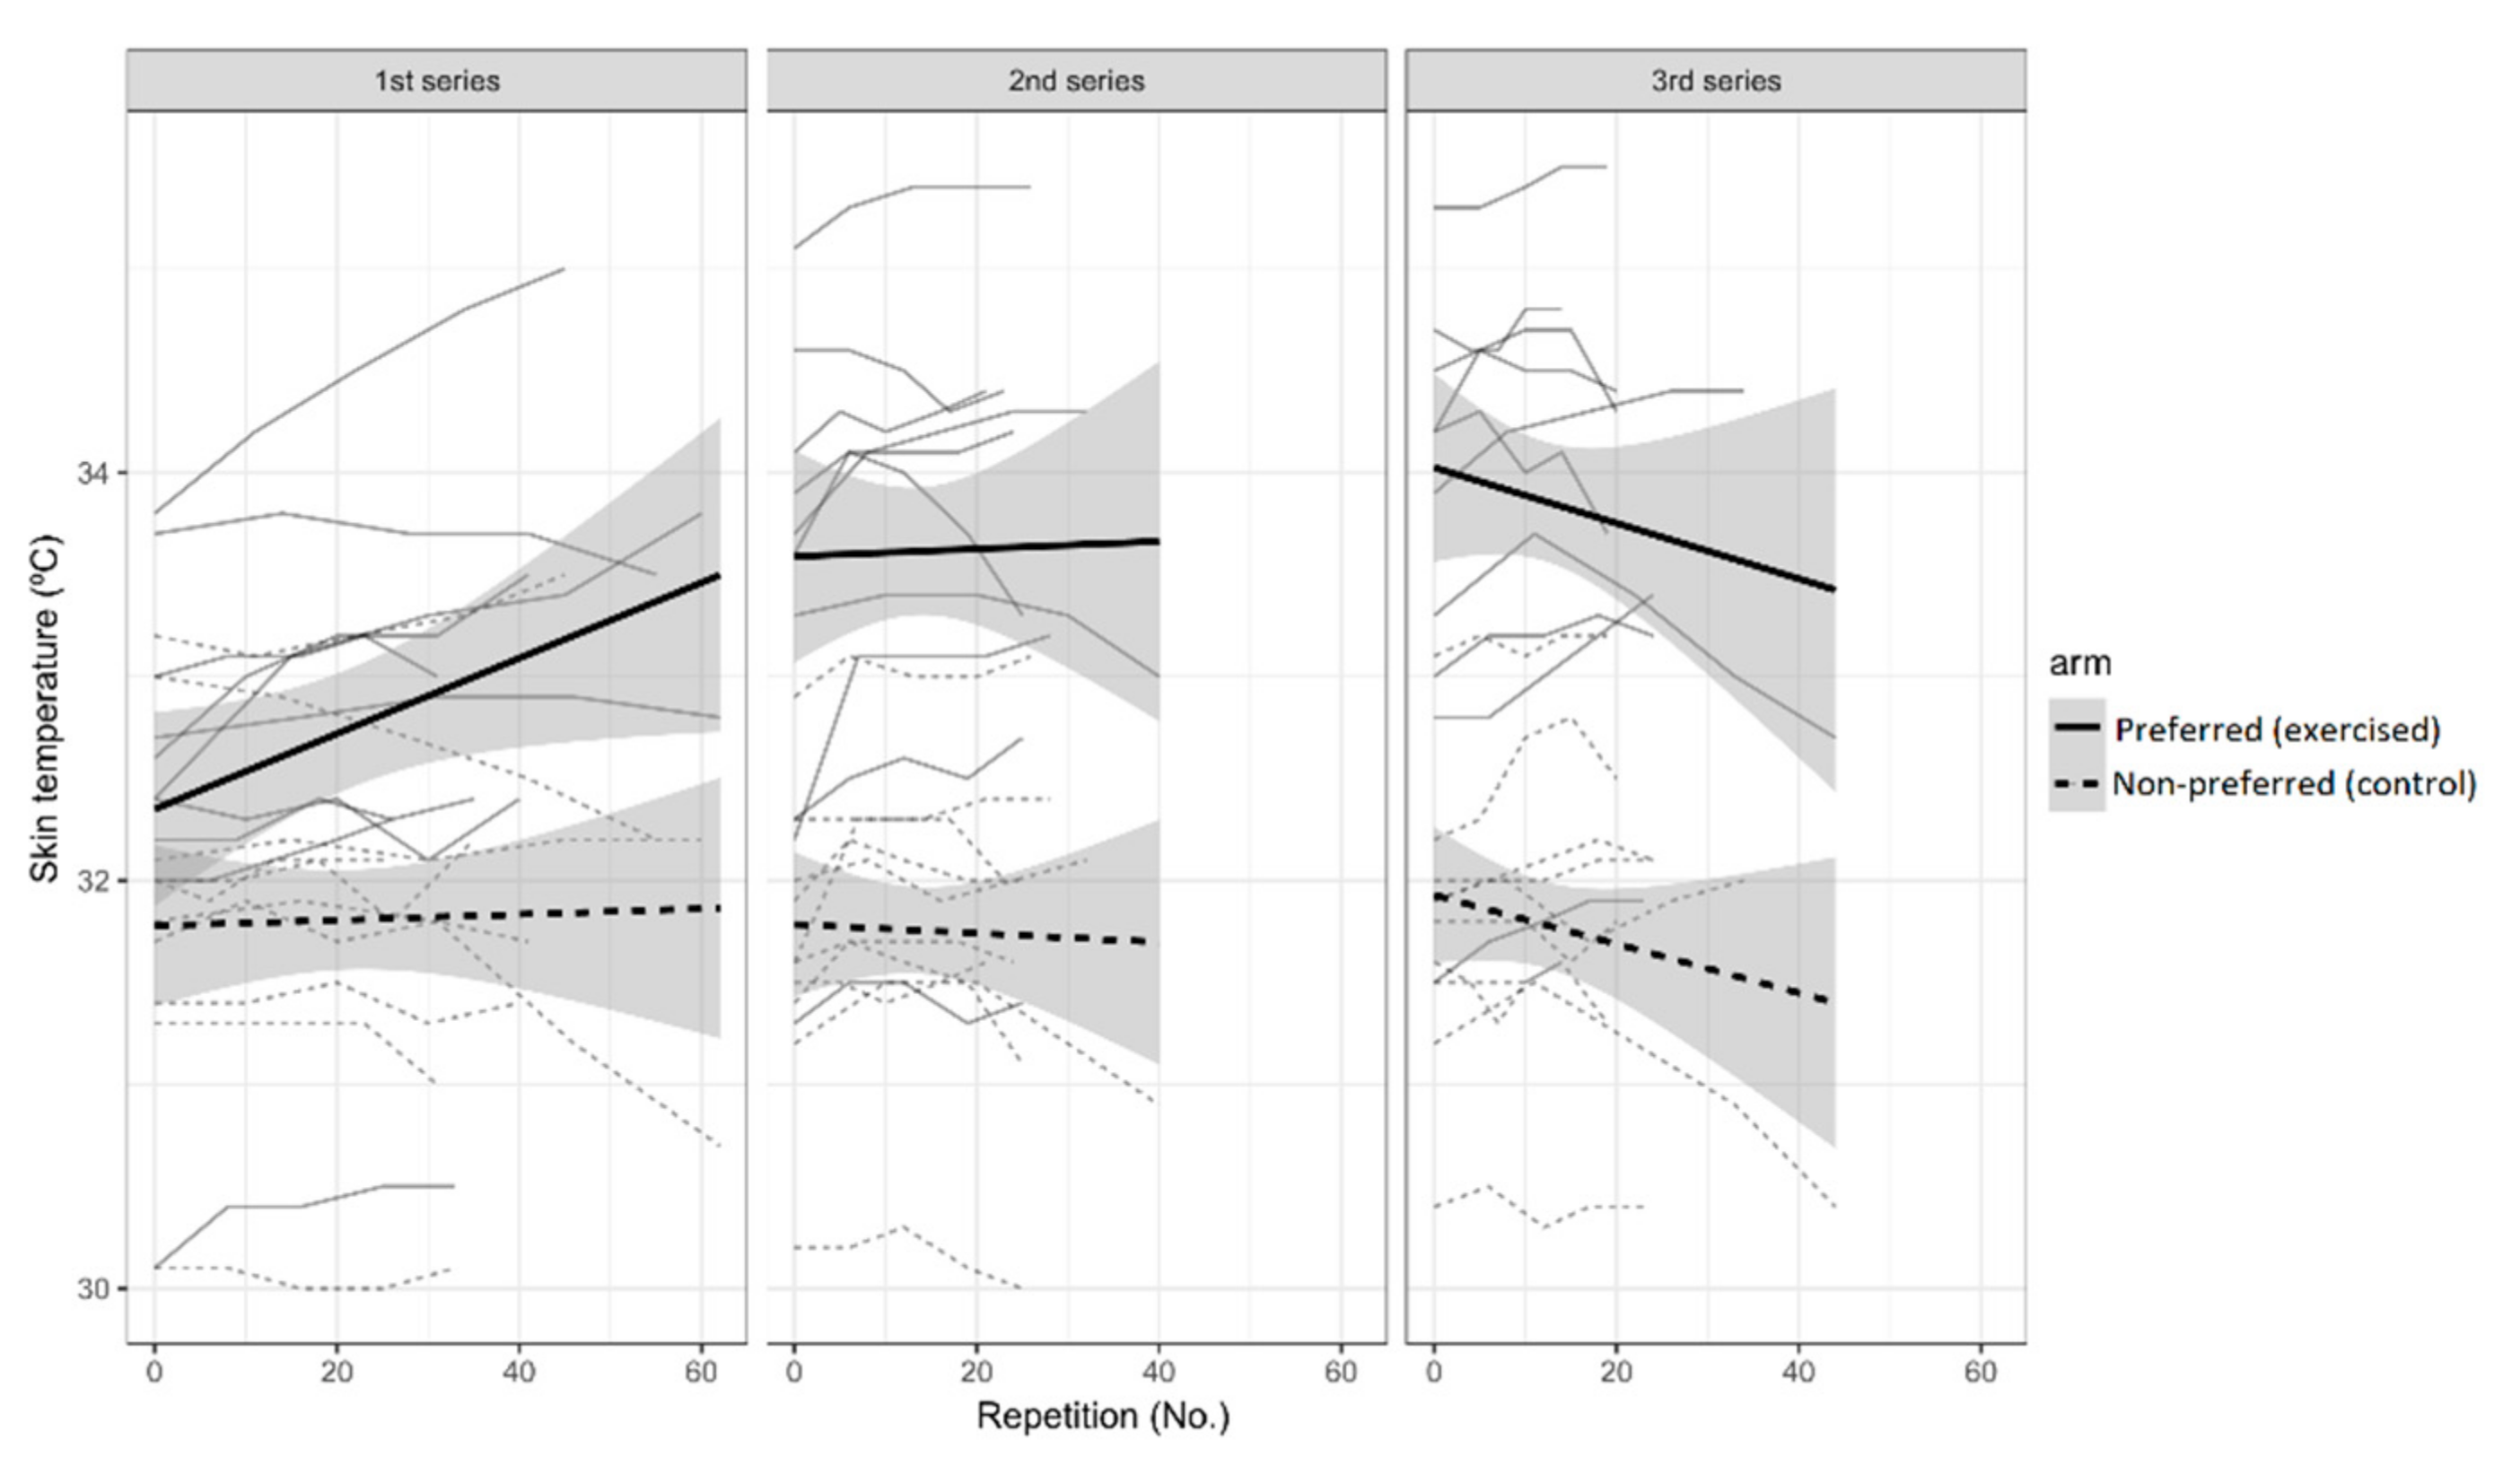
3.2. Neuromuscular Fatigue and Temperature Response to Exercise
4. Discussion
5. Conclusions
Author Contributions
Funding
Acknowledgments
Conflicts of Interest
References
- Armstrong, R.B. Mechanisms of exercise-induced delayed onset muscular soreness: A brief review. Med. Sci. Sports Exerc. 1984, 16, 529–538. [Google Scholar] [CrossRef] [PubMed]
- Wiewelhove, T.; Fernandez-Fernandez, J.; Raeder, C.; Kappenstein, J.; Meyer, T.; Kellmann, M.; Pfeiffer, M.; Ferrauti, A. Acute responses and muscle damage in different high-intensity interval running protocols. J. Sports Med. Phys. Fit. 2016, 56, 606–615. [Google Scholar]
- Hody, S.; Croisier, J.-L.; Bury, T.; Rogister, B.; Leprince, P. Eccentric Muscle Contractions: Risks and Benefits. Front. Physiol. 2019, 10, 536. [Google Scholar] [CrossRef] [PubMed]
- Malm, C. Exercise-induced muscle damage and inflammation: Fact or fiction? Acta Physiol. Scand. 2001, 171, 233–239. [Google Scholar] [CrossRef] [PubMed]
- Pearcey, G.E.; Bradbury-Squires, D.J.; Kawamoto, J.-E.; Drinkwater, E.J.; Behm, D.G.; Button, D.C. Foam rolling for delayed-onset muscle soreness and recovery of dynamic performance measures. J. Athl. Train. 2015, 50, 5–13. [Google Scholar] [CrossRef] [Green Version]
- Barnett, A. Using recovery modalities between training sessions in elite athletes: Does it help? Sports Med. 2006, 36, 781–796. [Google Scholar] [CrossRef]
- Cifrek, M.; Medved, V.; Tonković, S.; Ostojić, S. Surface EMG based muscle fatigue evaluation in biomechanics. Clin. Biomech. 2009, 24, 327–340. [Google Scholar] [CrossRef]
- Hunter, S.K.; Duchateau, J.; Enoka, R.M. Muscle Fatigue and the Mechanisms of Task Failure. Exerc. Sport Sci. Rev. 2004, 32, 44–49. [Google Scholar] [CrossRef]
- Wan, J.; Qin, Z.; Wang, P.; Sun, Y.; Liu, X. Muscle fatigue: General understanding and treatment. Exp. Mol. Med. 2017, 49, e384. [Google Scholar] [CrossRef]
- Rampichini, S.; Vieira, T.M.; Castiglioni, P.; Merati, G. Complexity Analysis of Surface Electromyography for Assessing the Myoelectric Manifestation of Muscle Fatigue: A Review. Entropy 2020, 22, 529. [Google Scholar] [CrossRef]
- Eken, M.M.; Brændvik, S.M.; Bardal, E.M.; Houdijk, H.; Dallmeijer, A.J.; Roeleveld, K. Lower limb muscle fatigue during walking in children with cerebral palsy. Dev. Med. Child. Neurol. 2019, 61, 212–218. [Google Scholar] [CrossRef] [PubMed] [Green Version]
- Morawetz, D.; Blank, C.; Koller, A.; Arvandi, M.; Siebert, U.; Schobersberger, W. Sex-Related Differences After a Single Bout of Maximal Eccentric Exercise in Response to Acute Effects: A Systematic Review and Meta-analysis. J. Strength Cond. Res. 2020, 34, 2697–2707. [Google Scholar] [CrossRef] [PubMed]
- Formenti, D.; Merla, A.; Priego Quesada, J.I. The Use of Infrared Thermography in the Study of Sport and Exercise Physiology. In Application of Infrared Thermography in Sports Science; Priego Quesada, J.I., Ed.; Biological and Medical Physics, Biomedical Engineering; Springer International Publishing: Cham, Switzerland, 2017; pp. 111–136. ISBN 978-3-319-47410-6. [Google Scholar]
- Moreira, D.G.; Costello, J.T.; Brito, C.J.; Adamczyk, J.G.; Ammer, K.; Bach, A.J.E.; Costa, C.M.A.; Eglin, C.; Fernandes, A.A.; Fernández-Cuevas, I.; et al. Thermographic imaging in sports and exercise medicine: A Delphi study and consensus statement on the measurement of human skin temperature. J. Therm. Biol. 2017, 69, 155–162. [Google Scholar] [CrossRef]
- Gómez-Carmona, P.; Fernández-Cuevas, I.; Sillero-Quintana, M.; Arnaiz-Lastras, J.; Navandar, A. Infrared Thermography Protocol on Reducing the Incidence of Soccer Injuries. J. Sport Rehabil. 2020, 1–6. [Google Scholar] [CrossRef] [PubMed]
- Fernández-Cuevas, I.; Lastras, J.A.; Galindo, V.E.; Carmona, P.G. Infrared Thermography for the Detection of Injury in Sports Medicine. In Application of Infrared Thermography in Sports Science; Priego Quesada, J.I., Ed.; Biological and Medical Physics, Biomedical Engineering; Springer International Publishing: Cham, Switzerland, 2017; pp. 81–109. ISBN 978-3-319-47409-0. [Google Scholar]
- Bartuzi, P.; Roman-Liu, D.; Wiśniewski, T. The influence of fatigue on muscle temperature. Int. J. Occup. Saf. Ergon. 2012, 18, 233–243. [Google Scholar] [CrossRef] [Green Version]
- Priego Quesada, J.I.; Carpes, F.P.; Bini, R.R.; Salvador Palmer, R.; Pérez-Soriano, P.; Cibrián Ortiz de Anda, R.M. Relationship between skin temperature and muscle activation during incremental cycle exercise. J. Therm. Biol. 2015, 48, 28–35. [Google Scholar] [CrossRef]
- Cramer, M.N.; Jay, O. Biophysical aspects of human thermoregulation during heat stress. Auton. Neurosci. 2016, 196, 3–13. [Google Scholar] [CrossRef]
- da Silva, W.; Machado, Á.S.; Souza, M.A.; Kunzler, M.R.; Priego-Quesada, J.I.; Carpes, F.P. Can exercise-induced muscle damage be related to changes in skin temperature? Physiol. Meas. 2018, 39, 104007. [Google Scholar] [CrossRef]
- Clarkson, P.M.; Hoffman, E.P.; Zambraski, E.; Gordish-Dressman, H.; Kearns, A.; Hubal, M.; Harmon, B.; Devaney, J.M. ACTN3 and MLCK genotype associations with exertional muscle damage. J. Appl. Physiol. 2005, 99, 564–569. [Google Scholar] [CrossRef]
- Manojlović, V.; Erčulj, F. Using blood lactate concentration to predict muscle damage and jump performance response to maximal stretch-shortening cycle exercise. J. Sports Med. Phys. Fit. 2019, 59, 581–586. [Google Scholar] [CrossRef]
- Priego Quesada, J.I.; Sampaio, L.T.; Bini, R.R.; Rossato, M.; Cavalcanti, V. Multifactorial cycling performance of Cyclists and Non-Cyclists and their effect on skin temperature. J. Anal. Calorim. 2017, 127, 1479–1489. [Google Scholar] [CrossRef]
- Formenti, D.; Ludwig, N.; Gargano, M.; Gondola, M.; Dellerma, N.; Caumo, A.; Alberti, G. Thermal Imaging of Exercise-Associated Skin Temperature Changes in Trained and Untrained Female Subjects. Ann. Biomed. Eng. 2013, 41, 863–871. [Google Scholar] [CrossRef] [PubMed]
- Bryden, M.P. Measuring handedness with questionnaires. Neuropsychologia 1977, 15, 617–624. [Google Scholar] [CrossRef]
- Priego Quesada, J.I.; Kunzler, M.R.; Carpes, F.P. Methodological Aspects of Infrared Thermography in Human Assessment. In Application of Infrared Thermography in Sports Science; Springer International Publishing: Cham, Switzerland, 2017; pp. 49–79. ISBN 978-3-319-47410-6. [Google Scholar]
- Stewart, A.; Marfell-Jones, M.; Olds, T.; de Ridder, H. International Standards for Anthropometric Assessment; ISAK: Lower Hutt, New Zealand, 2011. [Google Scholar]
- Marins, J.C.B.; Formenti, D.; Costa, C.M.A.; de Andrade Fernandes, A.; Sillero-Quintana, M. Circadian and gender differences in skin temperature in militaries by thermography. Infrared Phys. Technol. 2015, 71, 322–328. [Google Scholar] [CrossRef]
- Smolander, J.; Härmä, M.; Lindgvist, A.; Kolari, P.; Laitinen, L.A. Circadian variation in peripheral blood flow in relation to core temperature at rest. Europ. J. Appl. Physiol. 1993, 67, 192–196. [Google Scholar] [CrossRef] [PubMed]
- Potvin, J.R.; Bent, L.R. A validation of techniques using surface EMG signals from dynamic contractions to quantify muscle fatigue during repetitive tasks. J. Electromyogr. Kinesiol. 1997, 7, 131–139. [Google Scholar] [CrossRef]
- American College of Sports Medicine American College of Sports Medicine position stand. Progression models in resistance training for healthy adults. Med. Sci. Sports Exerc. 2009, 41, 687–708. [Google Scholar] [CrossRef]
- Hermens, H.J.; Freriks, B.; Disselhorst-Klug, C.; Rau, G. Development of recommendations for SEMG sensors and sensor placement procedures. J. Electromyogr. Kinesiol. 2000, 10, 361–374. [Google Scholar] [CrossRef]
- Hodder, J.N.; Keir, P.J. Obtaining maximum muscle excitation for normalizing shoulder electromyography in dynamic contractions. J. Electromyogr. Kinesiol. 2013, 23, 1166–1173. [Google Scholar] [CrossRef]
- Alenabi, T.; Whittaker, R.; Kim, S.Y.; Dickerson, C.R. Maximal voluntary isometric contraction tests for normalizing electromyographic data from different regions of supraspinatus and infraspinatus muscles: Identifying reliable combinations. J. Electromyogr. Kinesiol. 2018, 41, 19–26. [Google Scholar] [CrossRef] [Green Version]
- Quittmann, O.J.; Meskemper, J.; Albracht, K.; Abel, T.; Foitschik, T.; Strüder, H.K. Normalising surface EMG of ten upper-extremity muscles in handcycling: Manual resistance vs. sport-specific MVICs. J. Electromyogr. Kinesiol. 2020, 51, 102402. [Google Scholar] [CrossRef] [PubMed]
- Marins, J.C.B.; Moreira, D.G.; Cano, S.P.; Quintana, M.S.; Soares, D.D.; de Andrade Fernandes, A.; da Silva, F.S.; Costa, C.M.A.; dos Santos Amorim, P.R. Time required to stabilize thermographic images at rest. Infrared Phys. Technol. 2014, 65, 30–35. [Google Scholar] [CrossRef] [Green Version]
- Steketee, J. Spectral emissivity of skin and pericardium. Phys. Med. Biol. 1973, 18, 686. [Google Scholar] [CrossRef]
- Borg, G. Psychophysical scaling with applications in physical work and the perception of exertion. Scand. J. Work. Health 1990, 16, 55–58. [Google Scholar] [CrossRef] [PubMed]
- Corder, K.E.; Newsham, K.R.; McDaniel, J.L.; Ezekiel, U.R.; Weiss, E.P. Effects of Short-Term Docosahexaenoic Acid Supplementation on Markers of Inflammation after Eccentric Strength Exercise in Women. J. Sports Sci. Med. 2016, 15, 176–183. [Google Scholar]
- Solnik, S.; Rider, P.; Steinweg, K.; DeVita, P.; Hortobágyi, T. Teager-Kaiser energy operator signal conditioning improves EMG onset detection. Eur. J. Appl. Physiol. 2010, 110, 489–498. [Google Scholar] [CrossRef] [Green Version]
- Hyvärinen, A.; Oja, E. Independent component analysis: Algorithms and applications. Neural Netw. 2000, 13, 411–430. [Google Scholar] [CrossRef] [Green Version]
- Marri, K.; Swaminathan, R. Analysis of concentric and eccentric contractions in biceps brachii muscles using surface electromyography signals and multifractal analysis. Proc. Inst. Mech Eng. H 2016, 230, 829–839. [Google Scholar] [CrossRef]
- Piironen, J.; Vehtari, A. Sparsity information and regularization in the horseshoe and other shrinkage priors. Electron. J. Statist. 2017, 11, 5018–5051. [Google Scholar] [CrossRef]
- Simmons, G.H.; Wong, B.J.; Holowatz, L.A.; Kenney, W.L. Changes in the control of skin blood flow with exercise training: Where do cutaneous vascular adaptations fit in? Exp. Physiol. 2011, 96, 822–828. [Google Scholar] [CrossRef] [Green Version]
- Priego Quesada, J.I.; Martínez, N.; Salvador Palmer, R.; Psikuta, A.; Annaheim, S.; Rossi, R.M.; Corberán, J.M.; Cibrián Ortiz de Anda, R.M.; Pérez-Soriano, P. Effects of the cycling workload on core and local skin temperatures. Exp. Therm. Fluid Sci. 2016, 77, 91–99. [Google Scholar] [CrossRef]
- Hildebrandt, C.; Raschner, C.; Ammer, K. An overview of recent application of medical infrared thermography in sports medicine in Austria. Sensors 2010, 10, 4700–4715. [Google Scholar] [CrossRef] [PubMed] [Green Version]
- O’Hanlon, R.; Wilson, M.; Wage, R.; Smith, G.; Alpendurada, F.D.; Wong, J.; Dahl, A.; Oxborough, D.; Godfrey, R.; Sharma, S.; et al. Troponin release following endurance exercise: Is inflammation the cause? a cardiovascular magnetic resonance study. J. Cardiovasc. Magn. Reason. 2010, 12, 38. [Google Scholar] [CrossRef] [PubMed] [Green Version]
- Kuniszyk-Jóźkowiak, W.; Jaszczuk, J.; Czaplicki, A. Changes in electromyographic signals and skin temperature during standardised effort in volleyball players. Acta Bioeng. Biomech. 2018, 20, 115–122. [Google Scholar] [PubMed]
- Formenti, D.; Ludwig, N.; Trecroci, A.; Gargano, M.; Michielon, G.; Caumo, A.; Alberti, G. Dynamics of thermographic skin temperature response during squat exercise at two different speeds. J. Therm. Biol. 2016, 59, 58–63. [Google Scholar] [CrossRef] [PubMed]
- Bertucci, W.; Arfaoui, A.; Janson, L.; Polidori, G. Relationship between the gross efficiency and muscular skin temperature of lower limb in cycling: A preliminary study. Comput. Methods Biomech. Biomed. Eng. 2013, 16 (Suppl. 1), 114–115. [Google Scholar] [CrossRef]
- Cramer, M.N.; Jay, O. Explained variance in the thermoregulatory responses to exercise: The independent roles of biophysical and fitness/fatness-related factors. J. Appl. Physiol. 2015, 119, 982–989. [Google Scholar] [CrossRef]
- Savastano, D.M.; Gorbach, A.M.; Eden, H.S.; Brady, S.M.; Reynolds, J.C.; Yanovski, J.A. Adiposity and human regional body temperature. Am. J. Clin. Nutr. 2009, 90, 1124–1131. [Google Scholar] [CrossRef]
- Ferreira, J.J.A.; Mendonça, L.C.S.; Nunes, L.A.O.; Andrade Filho, A.C.C.; Rebelatto, J.R.; Salvini, T.F. Exercise-associated thermographic changes in young and elderly subjects. Ann. Biomed. Eng. 2008, 36, 1420–1427. [Google Scholar] [CrossRef]
- Kenney, W.L.; Johnson, J.M. Control of skin blood flow during exercise. Med. Sci. Sports Exerc. 1992, 24, 303–312. [Google Scholar] [CrossRef]
- Cheung, S.S.; Sleivert, G.G. Lowering of skin temperature decreases isokinetic maximal force production independent of core temperature. Eur. J. Appl. Physiol. 2004, 91, 723–728. [Google Scholar] [CrossRef] [PubMed]
- Macaluso, F.; Isaacs, A.W.; Myburgh, K.H. Preferential Type II Muscle Fiber Damage from Plyometric Exercise. J. Athl. Train. 2012, 47, 414–420. [Google Scholar] [CrossRef] [PubMed] [Green Version]
- Henderson, M.J.; Fransen, J.; McGrath, J.J.; Harries, S.K.; Poulos, N.; Coutts, A.J. Individual Factors Affecting Rugby Sevens Match Performance. Int. J. Sports Physiol. Perform. 2019, 1–7. [Google Scholar] [CrossRef] [PubMed]
- Stevens, C.J.; Mauger, A.R.; Hassmèn, P.; Taylor, L. Endurance Performance is Influenced by Perceptions of Pain and Temperature: Theory, Applications and Safety Considerations. Sports Med. 2018, 48, 525–537. [Google Scholar] [CrossRef]
- Formenti, D.; Ludwig, N.; Rossi, A.; Trecroci, A.; Alberti, G.; Gargano, M.; Merla, A.; Ammer, K.; Caumo, A. Is the maximum value in the region of interest a reliable indicator of skin temperature? Infrared Phys. Technol. 2018, 94, 299–304. [Google Scholar] [CrossRef]
- Ludwig, N.; Formenti, D.; Gargano, M.; Alberti, G. Skin temperature evaluation by infrared thermography: Comparison of image analysis methods. Infrared Phys. Technol. 2014, 62, 1–6. [Google Scholar] [CrossRef]


© 2020 by the authors. Licensee MDPI, Basel, Switzerland. This article is an open access article distributed under the terms and conditions of the Creative Commons Attribution (CC BY) license (http://creativecommons.org/licenses/by/4.0/).
Share and Cite
Priego-Quesada, J.I.; De la Fuente, C.; Kunzler, M.R.; Perez-Soriano, P.; Hervás-Marín, D.; Carpes, F.P. Relationship between Skin Temperature, Electrical Manifestations of Muscle Fatigue, and Exercise-Induced Delayed Onset Muscle Soreness for Dynamic Contractions: A Preliminary Study. Int. J. Environ. Res. Public Health 2020, 17, 6817. https://doi.org/10.3390/ijerph17186817
Priego-Quesada JI, De la Fuente C, Kunzler MR, Perez-Soriano P, Hervás-Marín D, Carpes FP. Relationship between Skin Temperature, Electrical Manifestations of Muscle Fatigue, and Exercise-Induced Delayed Onset Muscle Soreness for Dynamic Contractions: A Preliminary Study. International Journal of Environmental Research and Public Health. 2020; 17(18):6817. https://doi.org/10.3390/ijerph17186817
Chicago/Turabian StylePriego-Quesada, Jose I., Carlos De la Fuente, Marcos R. Kunzler, Pedro Perez-Soriano, David Hervás-Marín, and Felipe P. Carpes. 2020. "Relationship between Skin Temperature, Electrical Manifestations of Muscle Fatigue, and Exercise-Induced Delayed Onset Muscle Soreness for Dynamic Contractions: A Preliminary Study" International Journal of Environmental Research and Public Health 17, no. 18: 6817. https://doi.org/10.3390/ijerph17186817