
Socioeconomic Correlates of Anti-Science Attitudes in the US


USC Information Sciences Institute, Marina del Rey, CA 90292, USA
*
Author to whom correspondence should be addressed.
Future Internet 2021, 13(6), 160; https://doi.org/10.3390/fi13060160
Submission received: 24 May 2021
/
Revised: 15 June 2021
/
Accepted: 16 June 2021
/
Published: 19 June 2021
(This article belongs to the Special Issue Digital and Social Media in the Disinformation Age)
Abstract
:Successful responses to societal challenges require sustained behavioral change. However, as responses to the COVID-19 pandemic in the US showed, political partisanship and mistrust of science can reduce public willingness to adopt recommended behaviors such as wearing a mask or receiving a vaccination. To better understand this phenomenon, we explored attitudes toward science using social media posts (tweets) that were linked to counties in the US through their locations. The data allowed us to study how attitudes towards science relate to the socioeconomic characteristics of communities in places from which people tweet. Our analysis revealed three types of communities with distinct behaviors: those in large metro centers, smaller urban places, and rural areas. While partisanship and race are strongly associated with the share of anti-science users across all communities, income was negatively and positively associated with anti-science attitudes in suburban and rural areas, respectively. We observed that emotions in tweets, specifically negative high arousal emotions, are expressed among suburban and rural communities by many anti-science users, but not in communities in large urban places. These trends were not apparent when pooled across all counties. In addition, we found that anti-science attitudes expressed five years earlier were significantly associated with lower COVID-19 vaccination rates. Our analysis demonstrates the feasibility of using spatially resolved social media data to monitor public attitudes on issues of social importance.
1. Introduction
Responding to societal crises requires sustained changes in individual behaviors [1,2,3]. For example, to slow the spread of the COVID-19 pandemic, governments worldwide have enacted a variety of mitigation measures that include physical distancing, a ban on public gatherings, quarantines, and mask mandates. However, public response to these policies was influenced by factors such as political partisanship and attitudes towards science [4,5]. While conservatives were more skeptical of government policies to limit the spread of the virus [6], mistrust of authorities and experts extended beyond partisanship [7,8]. Mistrust of science unites a diverse coalition of “anti-vaxxers”, “natural parenting” and alternative medicine advocates, and others who are suspicious of “big government” and “big pharma” that refuse to follow some of the official health guidelines. Understanding science skepticism will help us better frame policies that encourage the behaviors necessary to respond to the next health or environmental crisis [9].
Anti-science attitudes are typically assessed through surveys, which ask people to report how much they agree with scientific statements about vaccine safety or human activity causing climate change, for example. Using the responses, researchers have examined the role of political ideology [8] and religious views [10]. Researchers have linked attitudes toward science to scientific literacy, showing that scientific knowledge explains anti-science views while controlling for key socioeconomic variables such as religious faith, gender, and income [11,12,13]. More recent research has examined cognitive and emotional factors, such as reasoning ability [14,15], fear [16], and anger [17].
In this paper, we present a framework for measuring anti-science attitudes that are expressed through messages posted on social media. This approach can complement existing methods [18,19,20] by enabling us to study attitudes at the population scale with high spatial and temporal granularity, as well as measure their evolution over time. We illustrate this through the framework of studying the social and cognitive factors of the communities where users live that explain the prevalence of anti-science attitudes.
Researchers have previously used social media data to characterize the political ideology of users. Conover et al. [21] introduced a text-based approach, using sets of political terms to measure partisanship. In contrast, Barbera [22] applied a latent space model to the follower graph, while Badawy et al. [23] used label propagation on the retweet graph to infer the political leanings of social media users. More recently, researchers leveraged a set of curated news and information sources to label the political orientation of users based on the partisanship of the information sources they share [24,25]. Others have operationalized users’ vulnerability to fake news and misinformation based on their attention to low-quality information sources [26,27,28].
We adopted a similar approach to characterize science skepticism, using the number of links to curated pro-science and anti-science information sources users share on social media as a measure of their attention to anti-science content. Specifically, we used a random 10% sample of all messages (tweets) publicly shared on Twitter in October 2016. We further restricted the tweets to those with location metadata and linked them to counties within the US. We trained machine learning classifiers to infer users’ attitudes towards science based on the information sources they shared. In addition, we inferred emotions expressed in tweets and also linked data to political partisanship through county-level outcomes in the 2016 presidential election.
To explain variation in attitudes toward science, we studied their relationship to the socioeconomic characteristics of communities (counties) from which people tweeted. Although the share of social media users expressing anti-science attitudes was correlated with the population of the county, the education and income of its residents, and their political partisanship, these relationships were confounded by the correlations among the variables. To disentangle these effects, we performed robust statistical analysis to identify groups of counties with similar trends. Our analysis revealed three types of communities and how they differ in their skepticism of science: communities in large metropolitan regions, smaller metro (and suburban) areas, and rural regions. Anti-science attitudes were more prevalent in older, more affluent rural communities and younger metro regions. Across all types of communities, a larger share of Trump voters and non-White residents was associated with more anti-science attitudes. Additionally, we see that these attitudes were associated with lower emotional valence and high arousal, but only in small metro and rural areas, suggesting an important role that anger plays in the mistrust of science. We also found that anti-science attitudes partly explained differences in COVID-19 vaccination rates almost five years later. Our study suggests that pre-existing science skepticism may have provided fertile ground for the resistance to COVID-19 mitigation measures to take root in communities across US.
The contributions of this work are as follows:
- We described an approach to estimate anti-science views from the text of messages posted on social media, enabling the tracking of attitudes toward science at scale.
- We studied the geographical variation of anti-science attitudes and found differences across the US.
- We identified the latent structure of data using state-of-the-art machine learning methods to demonstrate the importance of stratifying data on latent groups to measure more robust trends. The structure of data suggests that cultural differences are defined by the urban–rural divide.
- We found that anti-science attitudes are associated with lower COVID-19 vaccination rates in urban communities.
- Our analysis revealed the importance of partisanship, race, and emotions such as anger in explaining anti-science attitudes. However, education is not found to have significant explanatory power and income is only mildly significant.
Given the global adoption and deep penetration of social media, especially in urban areas, this framework enables the population-wide monitoring of the expressions of attitudes at unprecedented spatial and temporal scales with high resolution. The framework can be extended to situations where surveys or interviews are not practical, but where online devices are present, which includes much of the developing world. In addition, this data-driven framework can provide guidance about where the confounders lie when conducting survey-based studies and design models that better reflect the hidden structure of data.
2. Materials and Methods
2.1. Data
We made use of the Twitter Decahose for the month of October 2016 which comprises a random 10% sample of public messages posted on Twitter. This dataset consists of 20,928,675 tweets in English, geotagged with locations around the globe. We leveraged Geopandas (https://github.com/geopandas/geopandas, accessed on 16 June 2021) to identify a subsample of 5,391,638 tweets posted within the US and linked these tweets to US counties. Geopandas provides 11 digit census-tract GEOIDs from which we extracted the first 5 digits to identify the county from which the tweet was generated (https://www.census.gov/programs-surveys/geography/guidance/geo-identifiers.html, accessed on 16 June 2021). We leveraged data from an American Community Survey (https://data.census.gov/cedsci/, accessed on 16 June 2021) for socioeconomic analysis, focusing on the following variables:
- popu_tot: total county population;
- income: average household income;
- hhsize: average household size;
- whites: share of households who identify as White;
- education: share of adult residents with a college degree or above;
- age: median age of county residents;
- pro_trump: share of voters who voted for Trump in the 2016 presidential election.
We also collected voting data from the 2016 presidential elections to study the impact of politically conservative ideologies on socioeconomic factors and overall happiness. More specifically, we used the share of votes received by President Donald Trump in the federal election as a measure of Republican support in each county. These data are publicly available as a courtesy of the MIT Election Lab (https://dataverse.harvard.edu/dataset.xhtml?persistentId=doi:10.7910/DVN/VOQCHQ, accessed on 16 June 2021).
To explore the relationship between anti-science attitudes that existed in 2016 and the COVID-19 pandemic, we used county-level COVID-19 vaccinations data provided by the Centers for Disease Control and Prevention (https://covid.cdc.gov/covid-data-tracker/#vaccinations, accessed on 16 June 2021). Specifically, we collected the fraction of fully vaccinated adults (who received a second dose of a two-dose vaccine or one dose of a single-dose vaccine) in each county as of 6 June 2021.
2.2. Measuring Anti-Science Attitudes
Previous studies [24,25] inferred user attitudes from the ideological polarities of information sources to which they attend. Attention is indicated by links to pay-level domains (PLDs) embedded within the content they share with others on social media. We curated pro-science and anti-science PLDs from Media Bias-Fact Check (mediabiasfactcheck.com/, accessed on 16 June 2021) with PLDs categorized under pro-science constituting the former, while those categorized as conspiracy and questionable sources making up the latter. Table 1 provides examples of sources under this categorization.
We quantified a user’s attitudes toward science as the fraction of links belonging to each category among all anti-science and pro-science PLDs the user shares. Specifically, we extracted PLDs shared by users in the dataset and filtered for relevant PLDs present in the Media Bias-Fact Check list. For each user, we computed two domain scores and :
where and are the pro-science and anti-science domain scores for . represents the set of PLDs shared by . Using this procedure, we obtained domain scores for 87,260 users with in our training dataset.
Text representation techniques discussed in [29,30,31] helped us generate the dense and accurate representations of user content as compared to high-dimensional but sparse representations using TF-IDF weighted content vectors [21]. Sent2Vec (https://github.com/epfml/sent2vec, accessed on 16 June 2021) provided an easy-to-use Python package to employ pre-trained fastText models to generate embeddings for tweets in our dataset. Following the methodology described in [25], we pre-processed tweets by removing hashtags, URLs, mentions, special characters, and stopwords using Tweet-Prepocessor (https://github.com/s/preprocessor, accessed on 16 June 2021). Inferring the polarity of individual tweets can yield noisy results with some tweets that are not consistent with the sufficient and necessary content to decide polarity. Hence, we concatenated all tweets generated by a user to form documents for each user. Using the sent2vec_twitter_unigrams pre-trained model, we then generated 700 dimension vectors to represent these user documents.
We categorized users with as pro-science and ones with as pro-science. Similarly, we grouped users with as anti-science and the rest as ¬anti-science. Using the 87,260 users thus categorized as the ground truth, we trained two logistic regression classifiers— and —to predict whether a user is pro-science or not or anti-science or not, respectively. Table 2 shows that the classifier achieves ideal performance in 5-fold cross validation in both micro and macro average performance. From the trained logistic regression classifiers, and , we obtained normalized scores and , respectively. In order to integrate the information provided by both and , we proposed the anti-science propensity score to quantify anti-science attitudes:
describes the extent of agreement between and and facilitates the consideration of users who generate relevant pro or anti-science content. For instance, users with a highly positive are most likely to be anti-science, whereas ones with highly negative are indicative of pro-science attitudes. More specifically, users with are categorized as anti-science whereas, ones with are classified into the pro-science category. Users with scores in the range of are those that have no clearly polarized attitudes towards science. We filtered out these users, leaving us with 399,701 users out of 1,130,445 in the US with well-defined attitudes towards science.
Upon identifying scores, we assigned users to the counties they tweeted from by using the county identifiers corresponding to their tweets. We then calculated the propensity for a county c to be anti-science, denoted by , as the fraction of anti-science users generating tweets from it:
where and represents the number of anti-science and pro-science users in the county c, respectively. A higher indicates that a higher fraction of the county’s Twitter users are anti-science. Using this method, we were able to compute for 784 counties.
2.3. Measuring Emotions
Sentiment analysis aims to quantify subjective states expressed in text, such as opinions and emotions. Emotional expression can be measured in terms of valence and arousal, with the former quantifying the level of pleasure, or positive sentiment, expressed in text, and the latter, the level of activity induced by the emotions. We used the Warriner, Kuperman, and Brysbaert (WKB) lexicon [32] to measure emotion expressed in text. The WKB lexicon includes scores along these dimensions for almost 14,000 English words. To quantify the valence and arousal expressed in a tweet, we lemmatized its content and applied the lexicon to compute the mean values of the emotional dimensions.
2.4. Identifying the Latent Components
Mixed-effects (or multi-level) models are a class of regression models that account for the non-independence of observations [33]. These models assume that similar observations come from similar individuals belonging to the same class, usually specified by a categorical variable [34]. For continuous variables, the data can be disaggregated by binning variables and splitting data into bins, with each bin becoming a class [35]. Recent work has extended these methods to discover latent groups for disaggregating data that depend on multiple variables. Controlling for these latent groups improves the utility of linear models. Methods like cluster-wise linear regression [36,37,38] split data into groups using unsupervised methods, like k-means, and then fit linear models within each cluster. However, such methods can be slow on large data. Other methods combine Gaussian mixture models and regression to model the latent structure of the data [39,40]. This approach was recently extended to use weighted regression that is less sensitive to outliers. The method, called disaggregation via Gaussian regression (DoGR) [41], jointly partitions the data into K fuzzy clusters in the disaggregation step and models the trends within them in the regression step (https://github.com/ninoch/DoGR, accessed on 16 June 2021). The method describes data as a mixture model with k components, where each component represents a latent class (group). Each datum point has some probability to belong to any component. The method uses expectation maximization (EM) to jointly estimate the parameters of the mixture model, membership parameters for individual data points, and regression coefficients for each component, weighing the contribution of data by their membership parameters. The joint learning of components and their regression coefficients ensures the homoscedasticity and exogeneity assumptions of OLS regression per component and enables discovering latent classes that better explain the structure of data.
3. Results
3.1. Geography of Anti-Science Attitudes
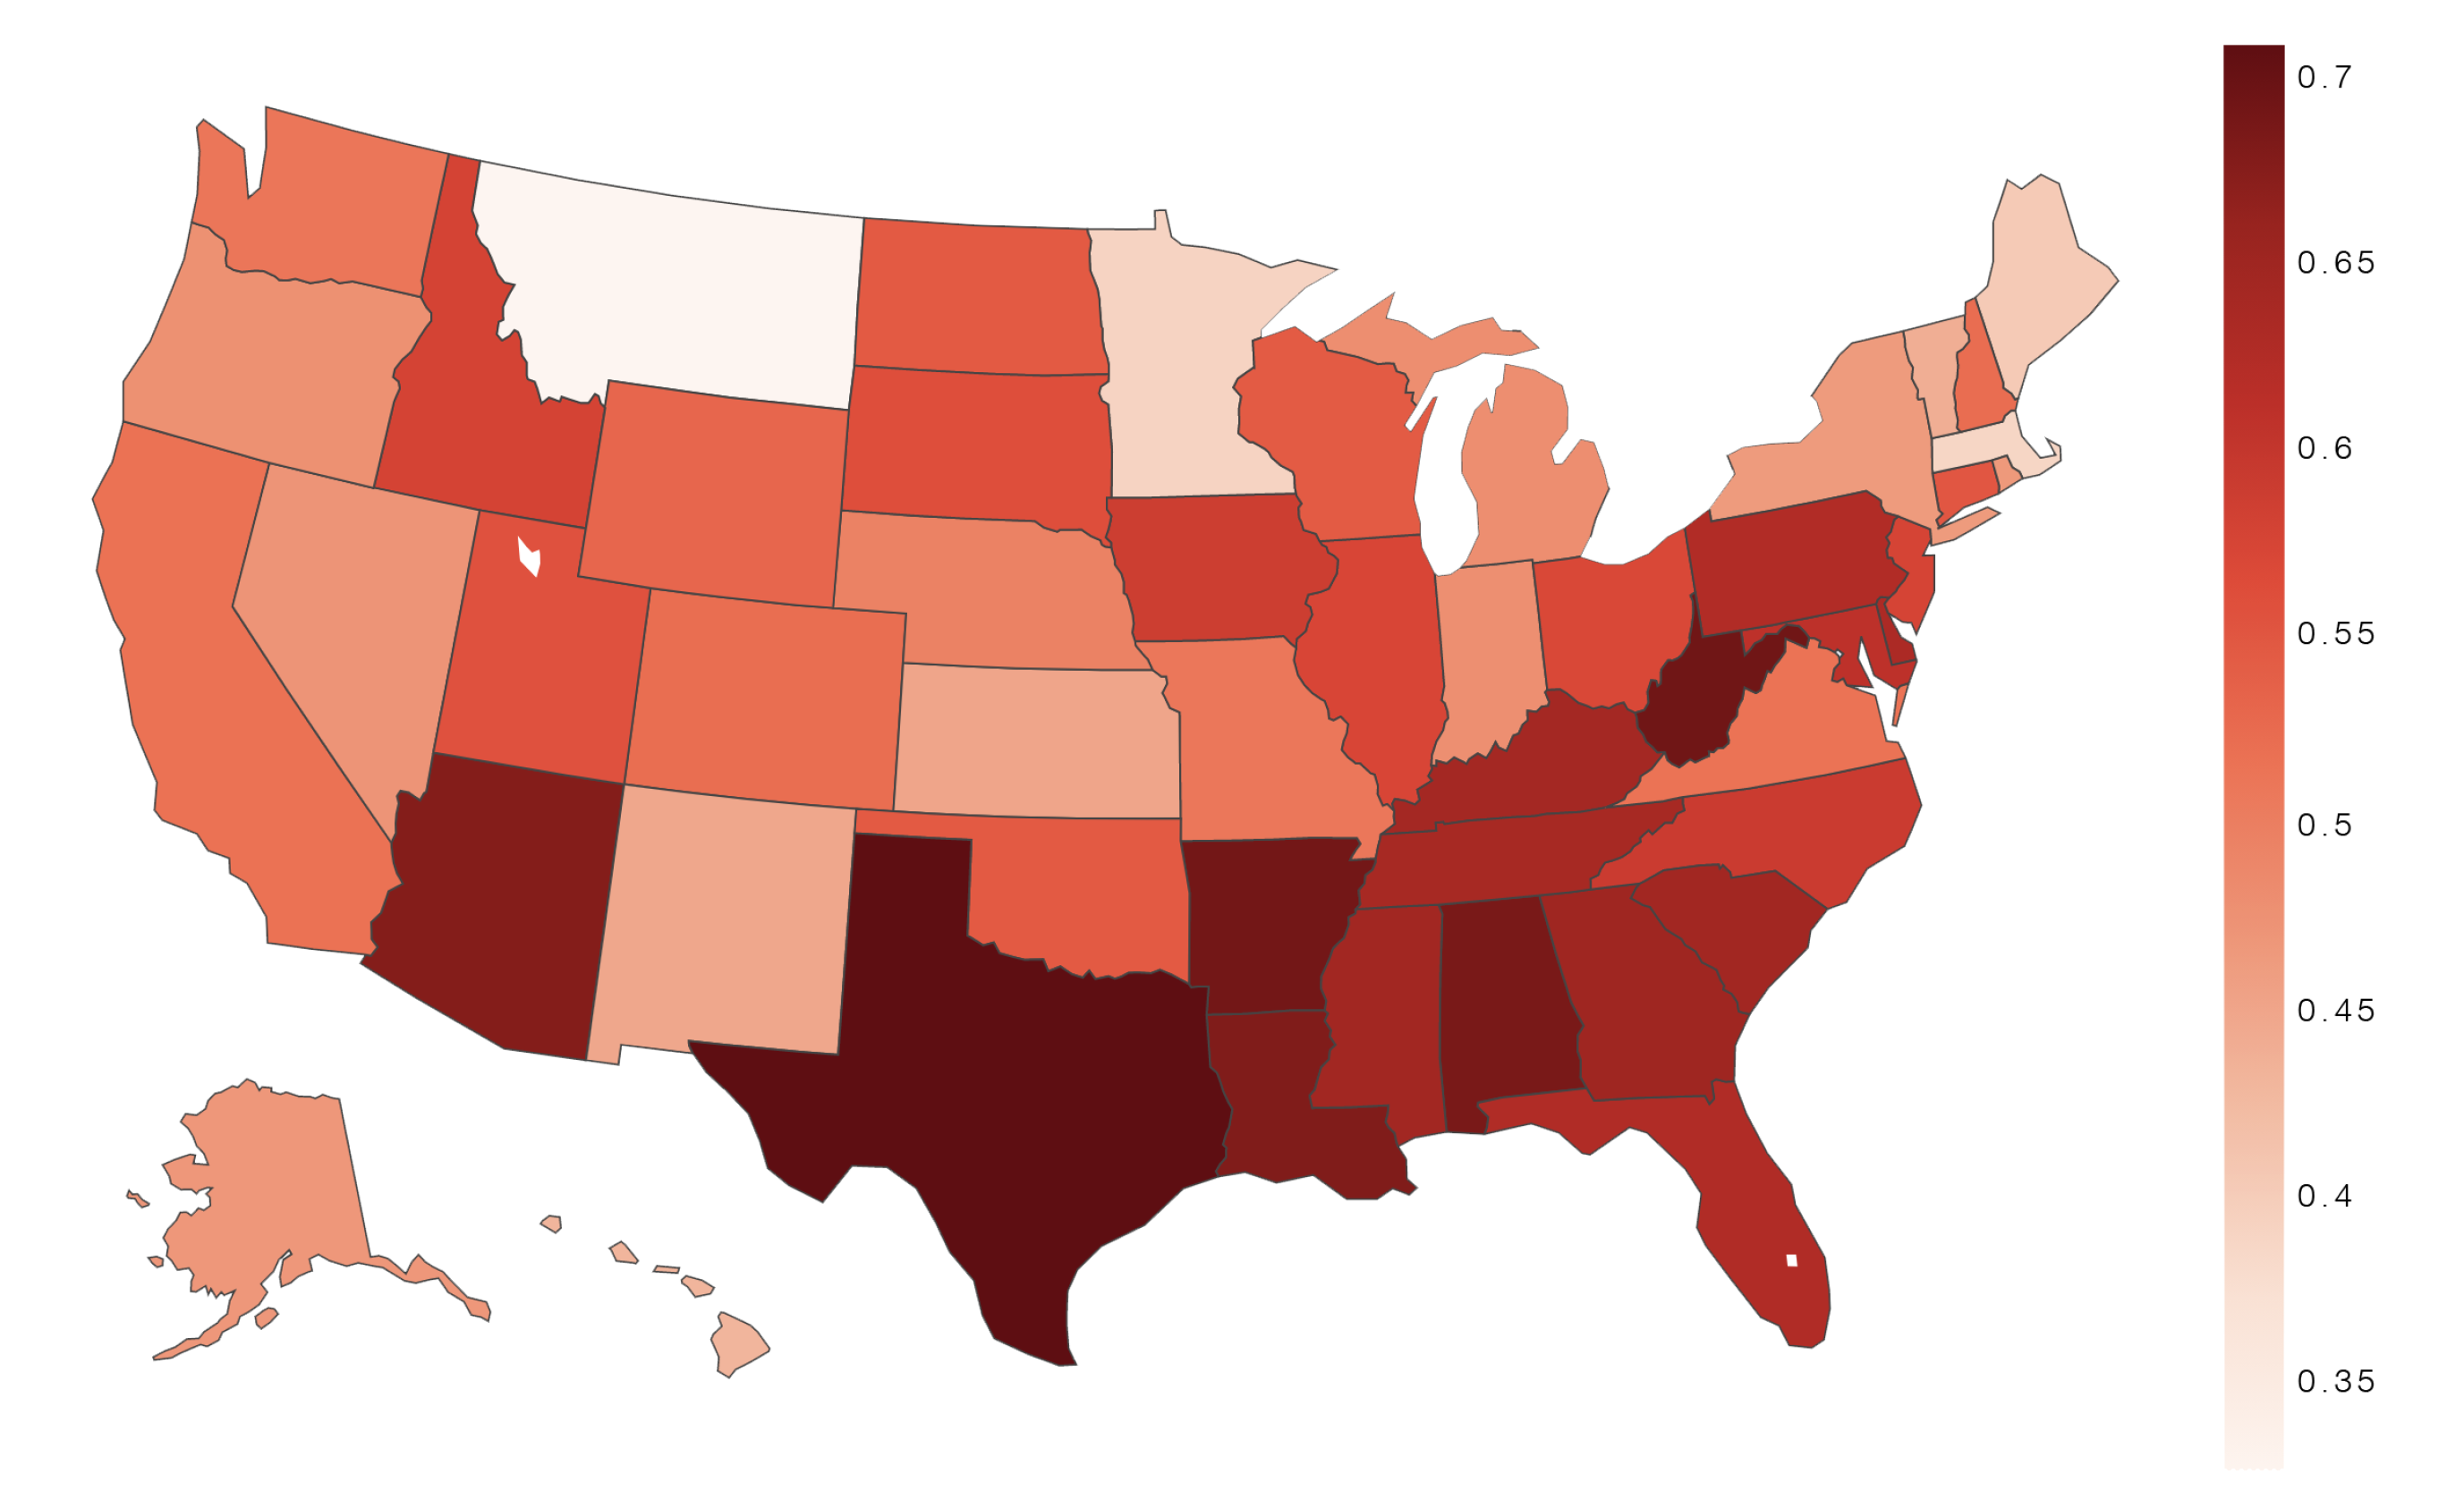
Figure 1 shows the geographic distribution of anti-science attitudes, specifically the share of Twitter users from each state posting links to anti-science domains. The map shows large heterogeneity, with southern states having a larger share of anti-science users compared to northeastern or western states. Texas, Louisiana, West Virginia, Alabama, and Arizona are the states with most anti-science users.
3.2. Correlates of Anti-Science Attitudes
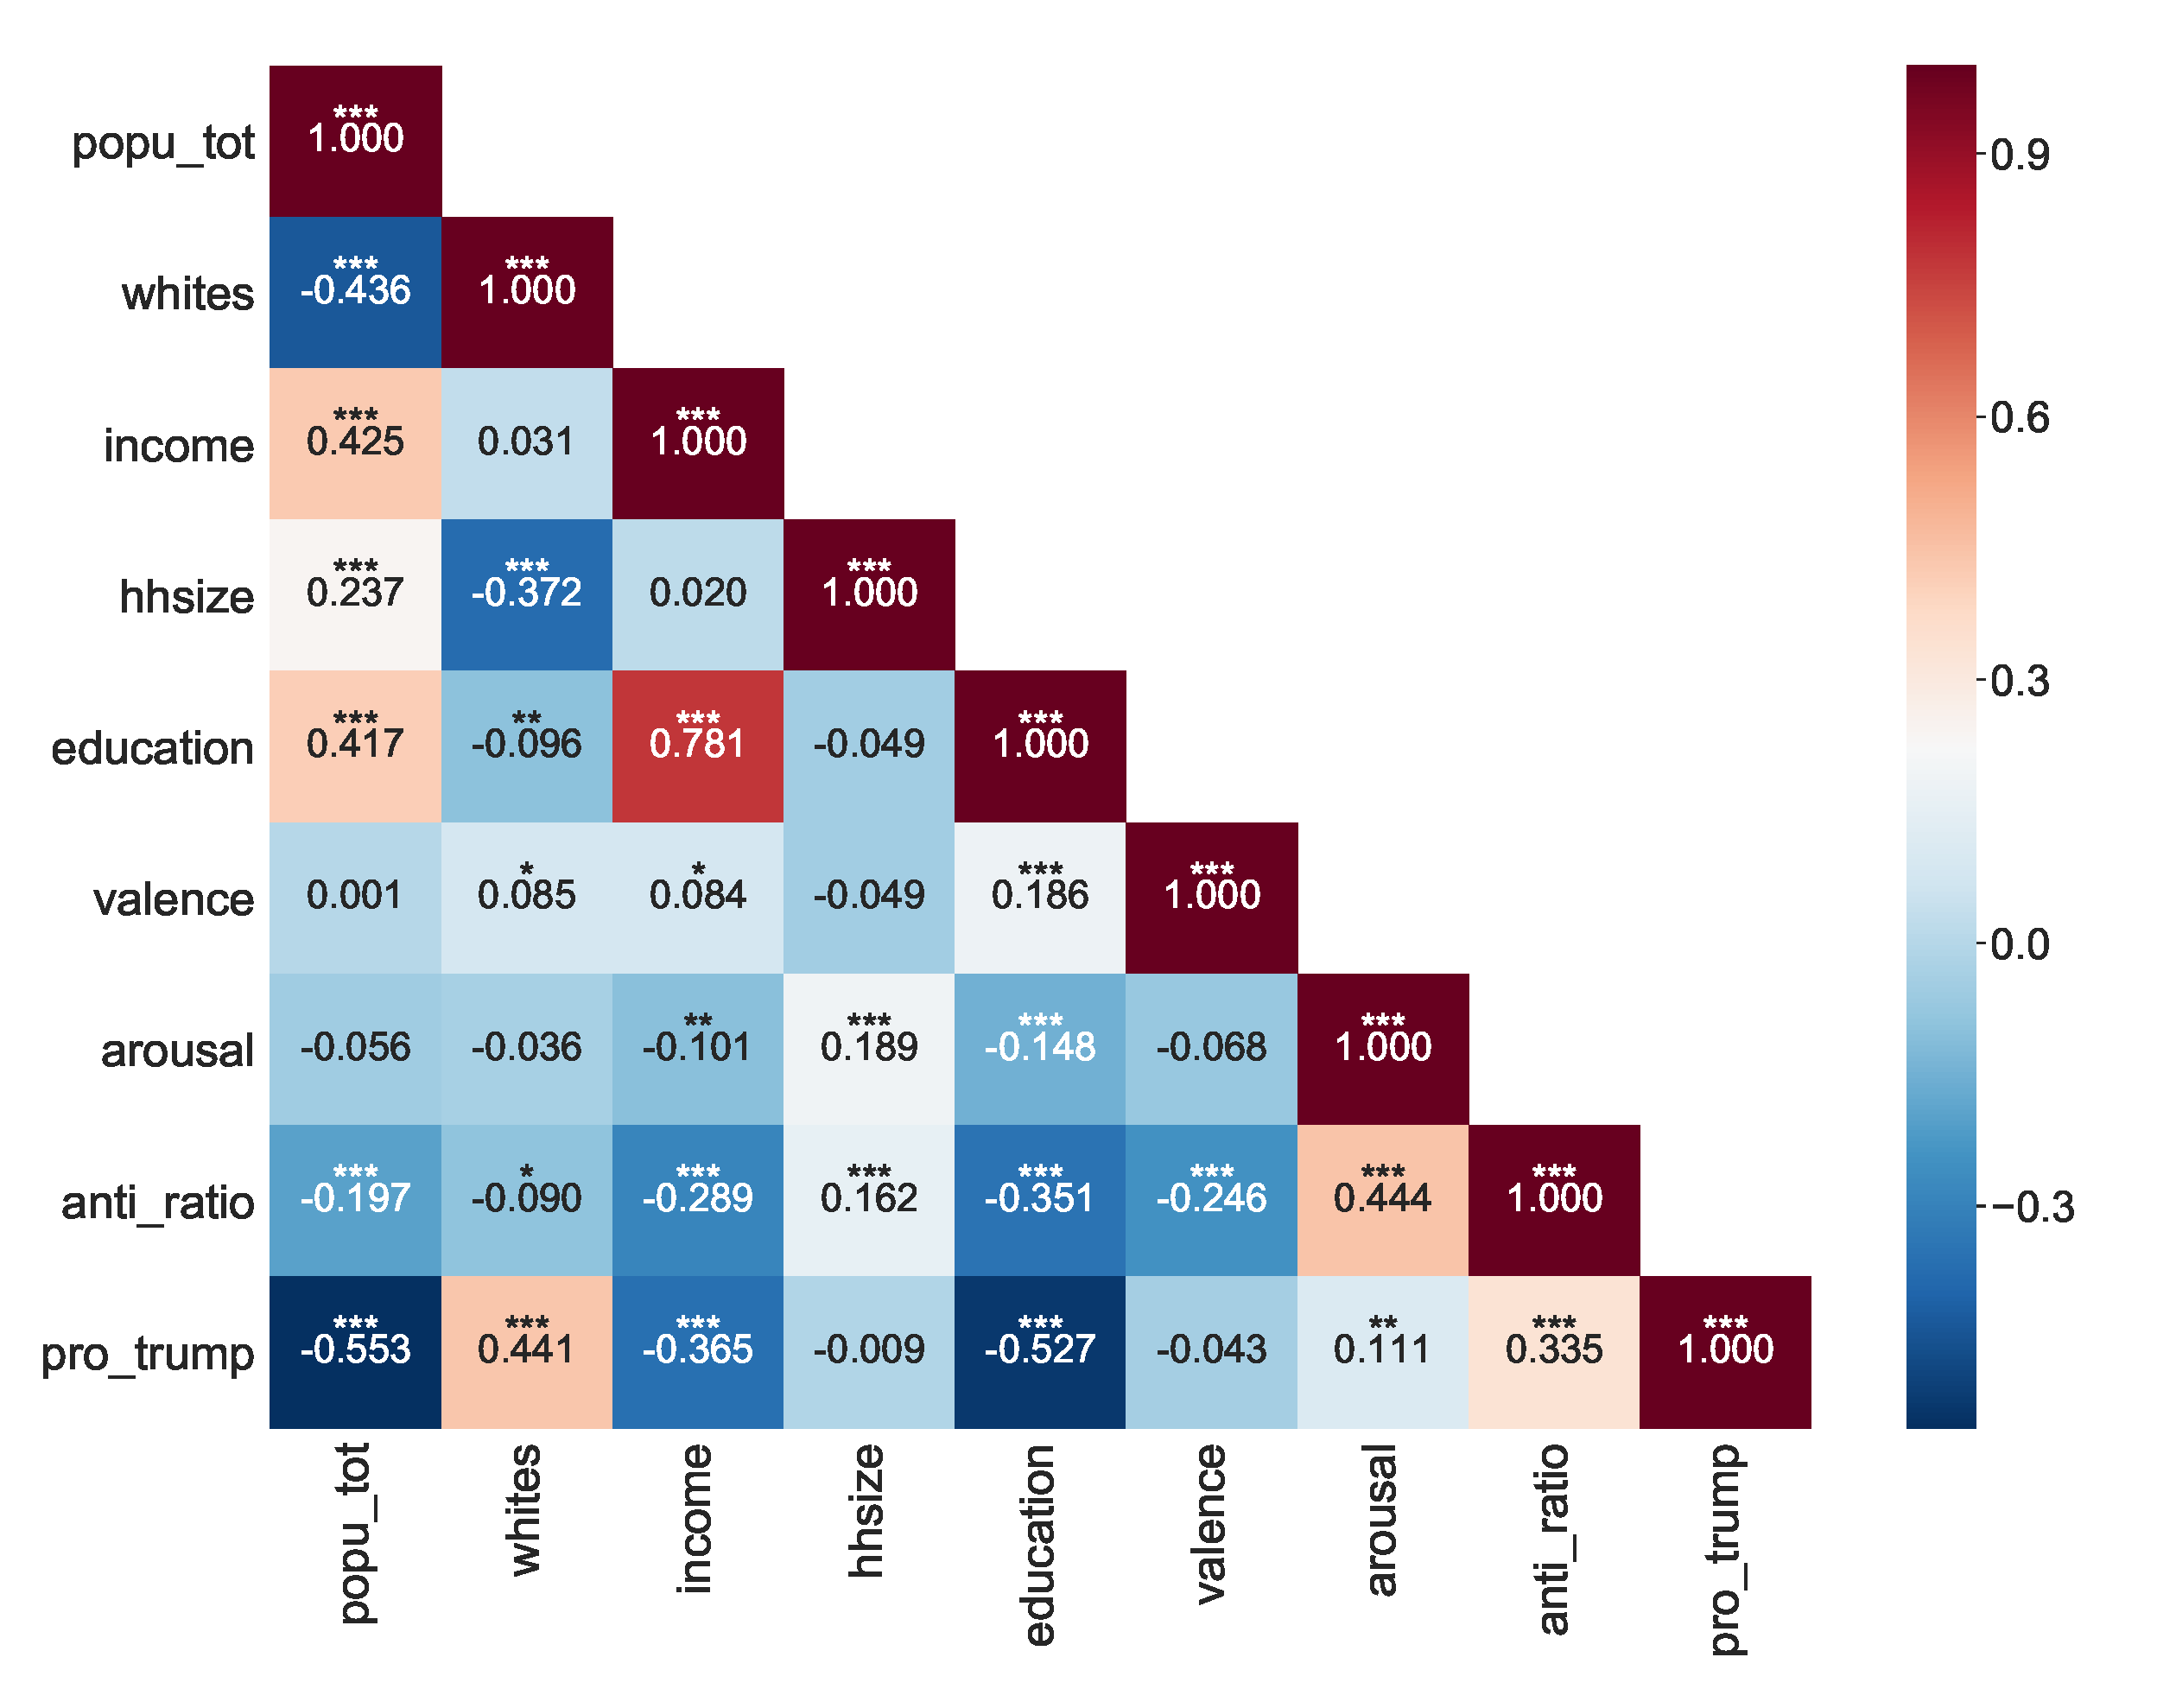
To better understand the geographic variation of anti-science attitudes, we conduct statistical analysisto measure the impact of various socioeconomic and emotional variables on anti-science views of people from different places. Figure 2 shows correlations among these variables, presented as a heatmap. Each variable represents the mean of observations aggregated at a county level. The fraction of Twitter users within a county holding anti-science views is negatively correlated with that county’s mean income (, ) and education level (, ), and it is positively correlated with the share of Trump vote in the 2016 presidential election (, ). The anti-science fraction is also weakly correlated with household size (, ). Together, these results suggest that lower-income and less educated counties with larger families tend to have more prevalent anti-science attitudes.
With respect to the emotional dimension, the fraction of users with anti-science attitudes is negatively correlated with emotional valence (, ) and strongly correlated with emotional arousal (, ). The correlation with valence and arousal suggests that anti-science attitudes co-occur with messages expressing anger. Note that valence and arousal are not themselves significantly correlated, implying that social media posts on their own are not angry. Neither does anger appear to be a function of political ideology: Trump’s vote share is not correlated with valence or arousal. Instead, strong emotional expression appears to be associated with anti-science attitudes.
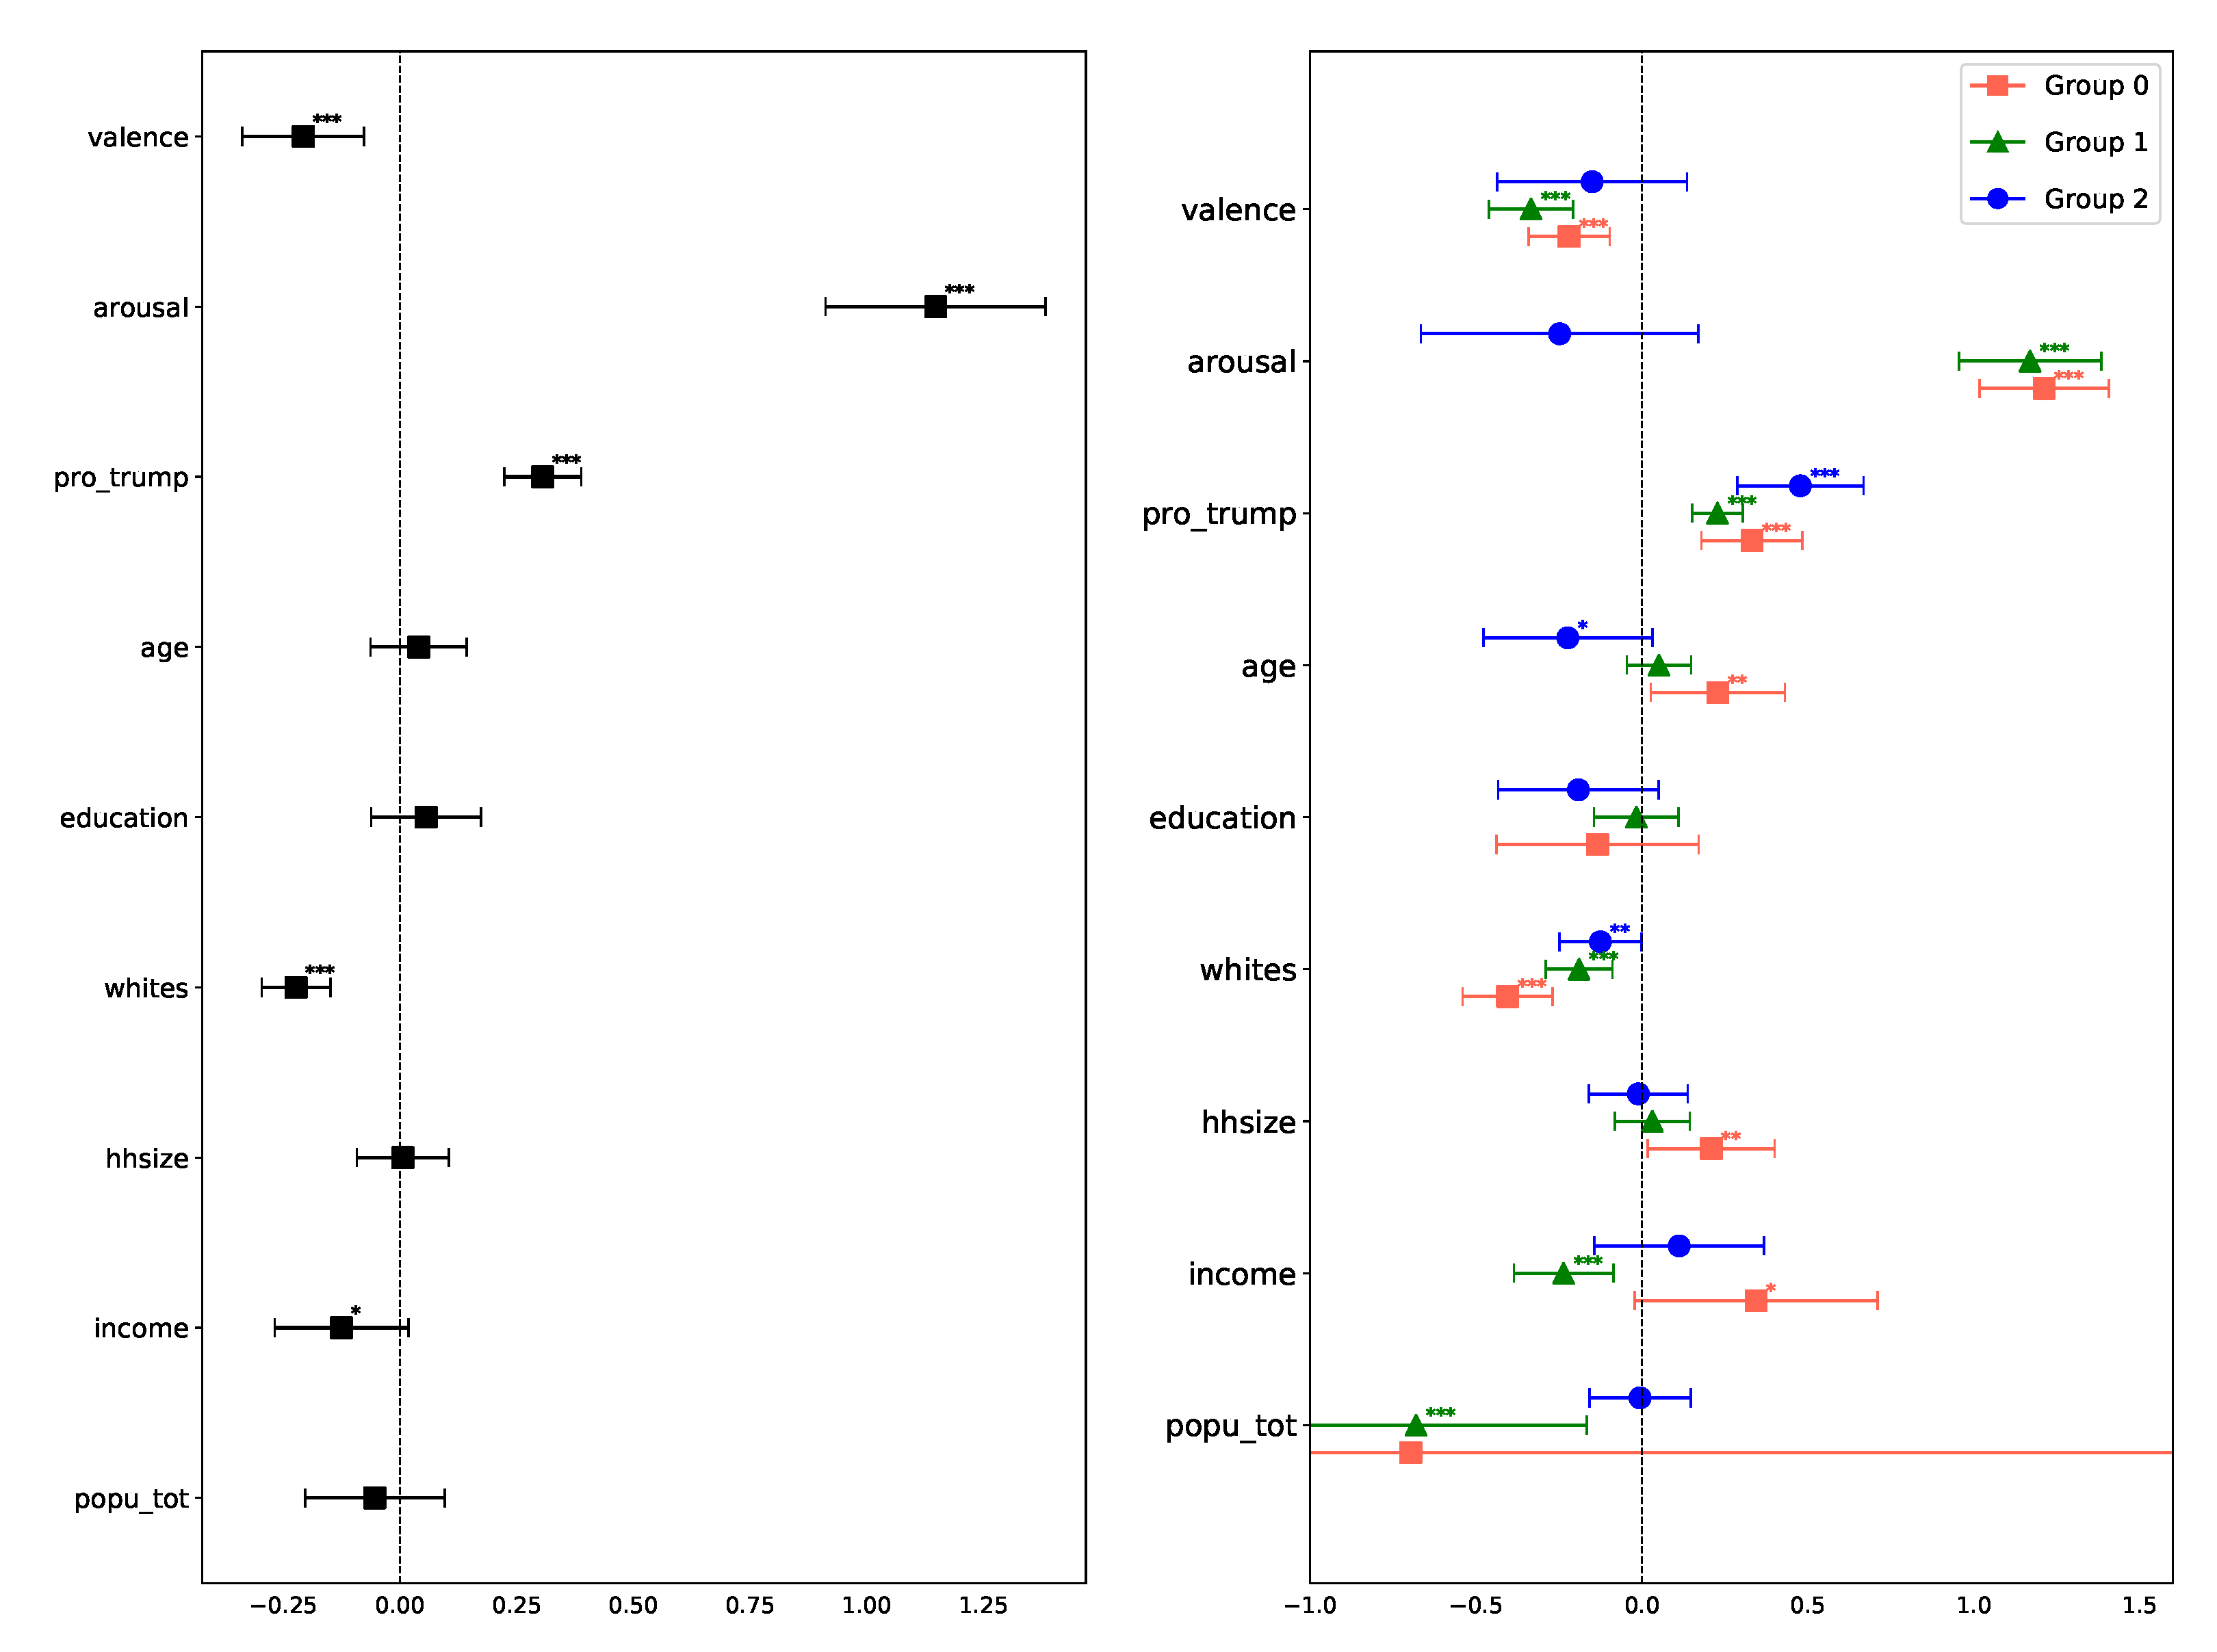
The heatmap also shows that many of the socioeconomic variables are correlated with each other. The interdependence between the variables makes it challenging to quantify the impact of each on anti-science attitudes. As a step towards disentangling these dependencies, we performed multi-variate regression to estimate the extent to which each variable explains the anti-science share in the presence of other variables. For the regression’s linearity assumption, we conduct the Ramsey reset test, and its outcome () indicates the correctness of our model specification. Due to existing heteroskedasticity (in White’s test, , hinting at the inconsistent variance of residuals) in our dataset, we used heteroscedasticity-corrected covariance matrices (HC3) in the regression.
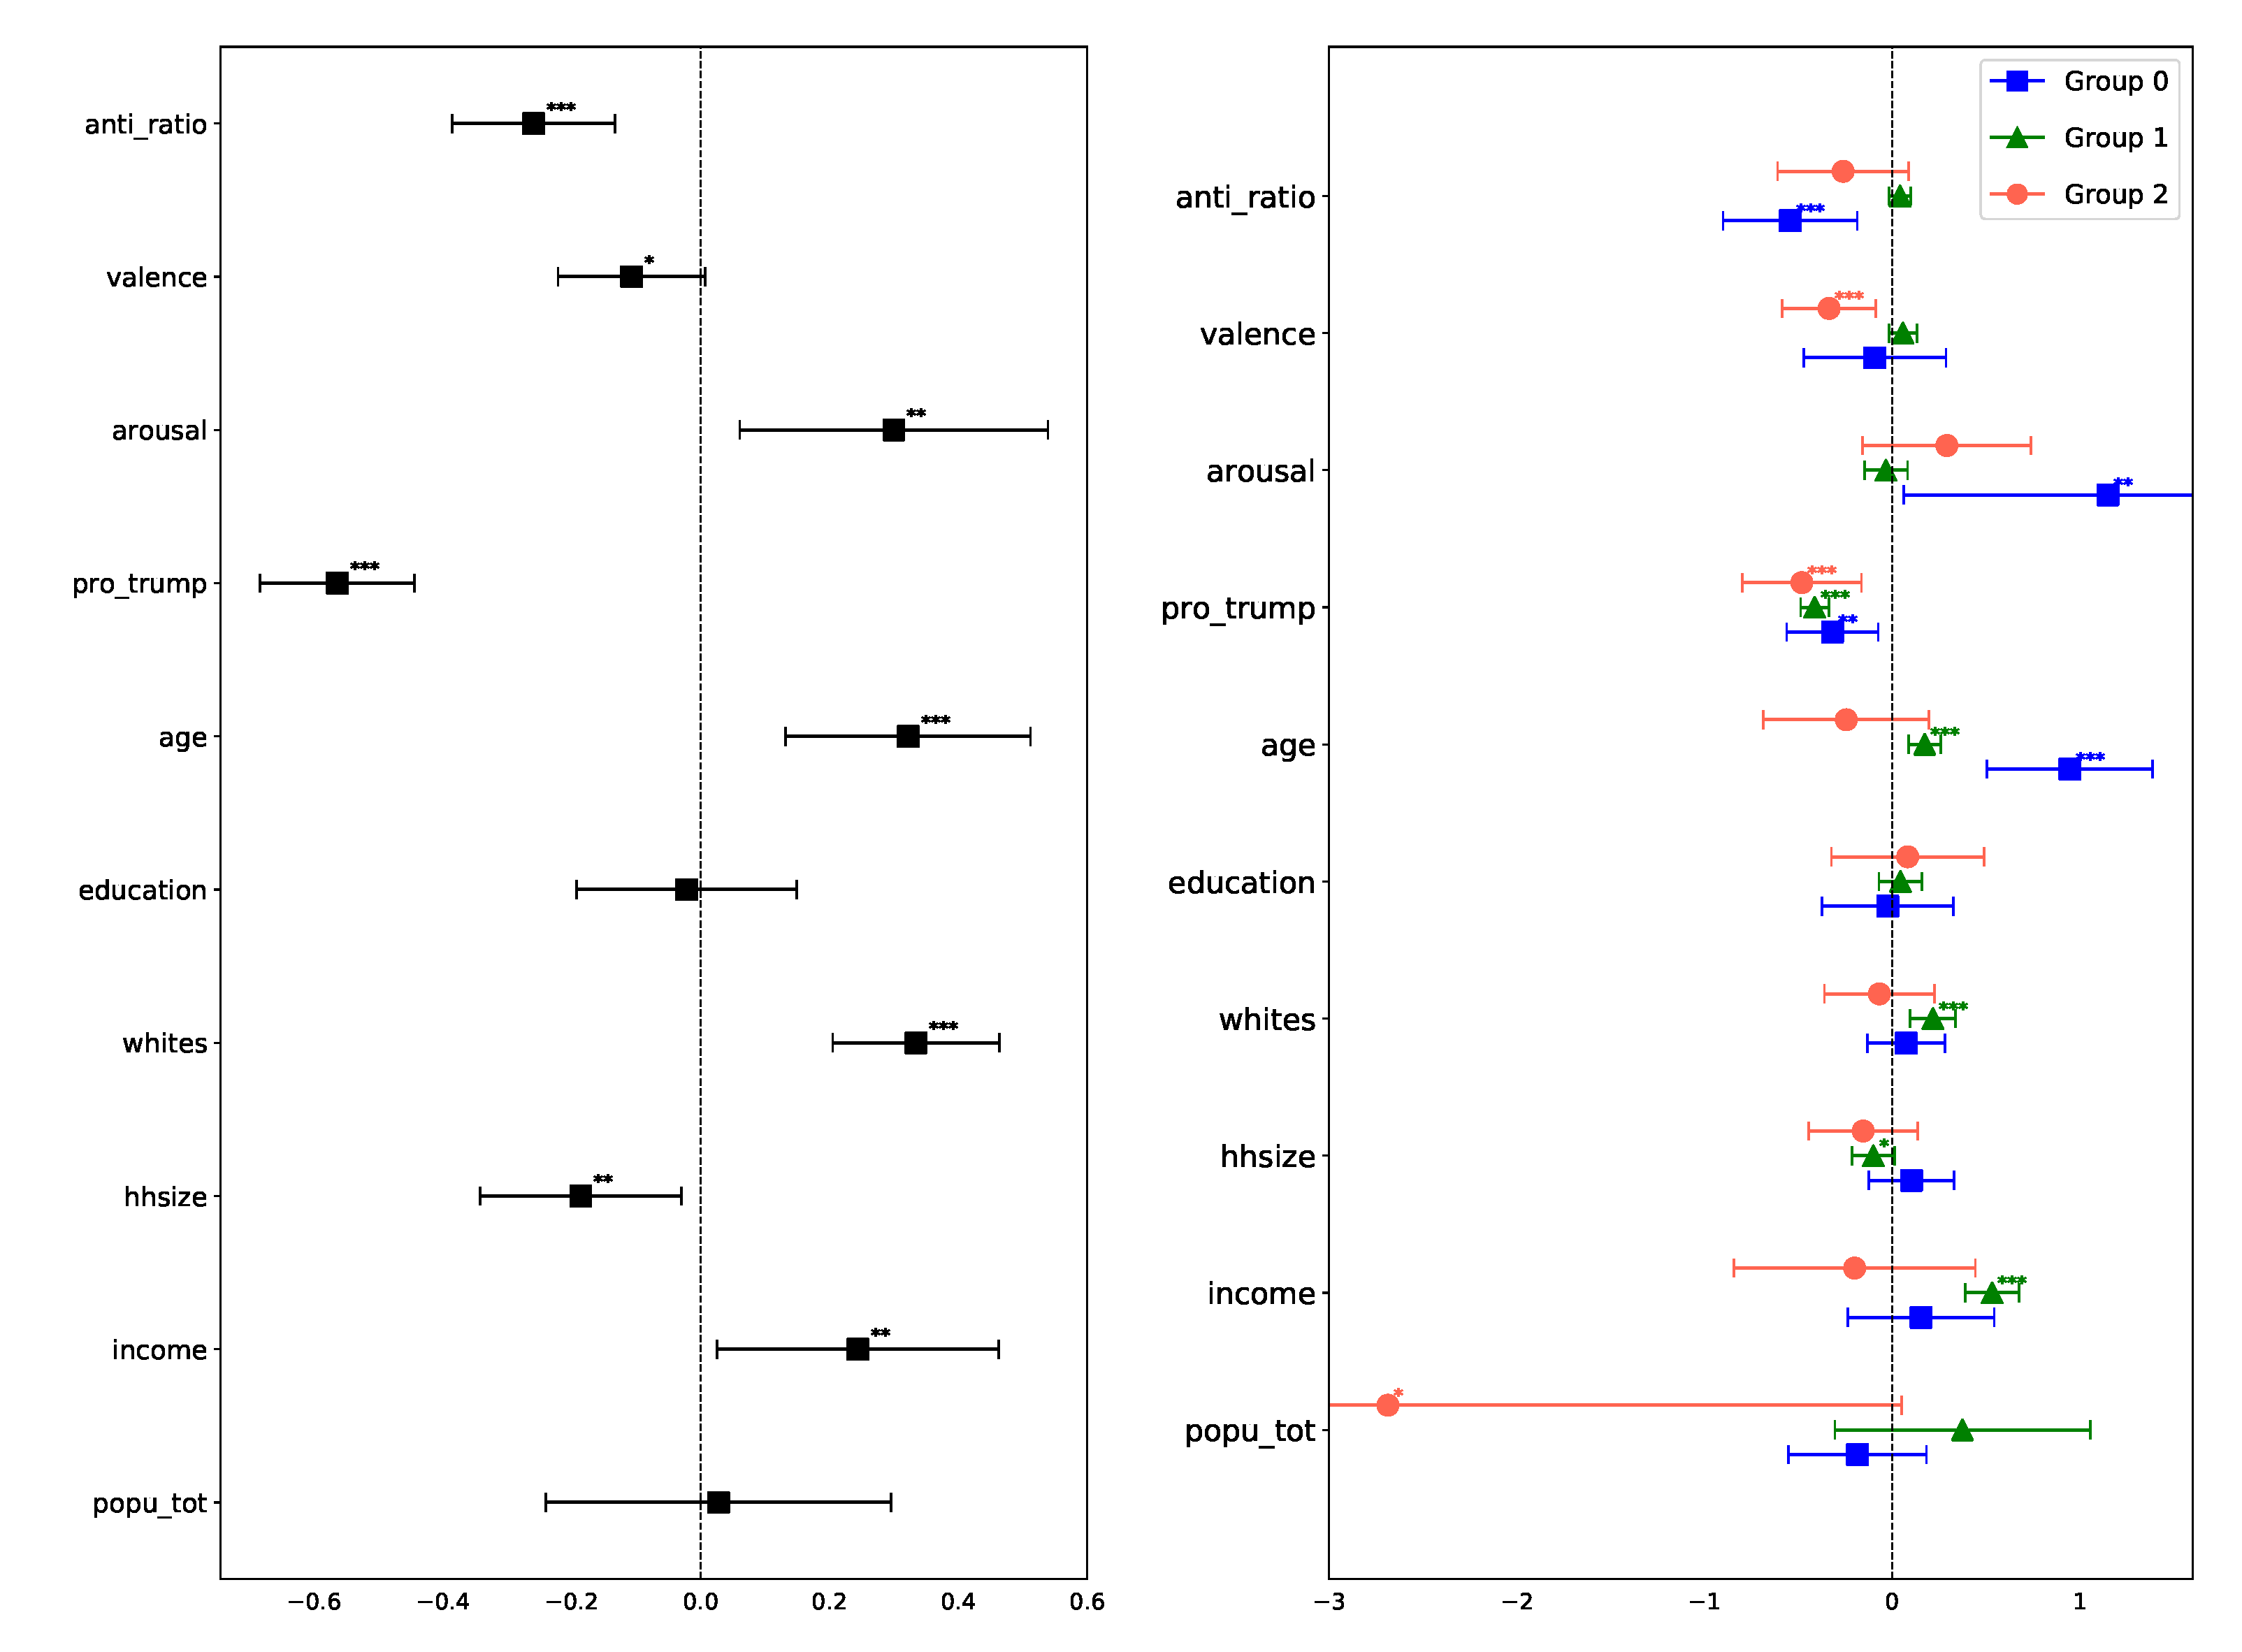
Figure 3 (left) shows regression coefficients and their significance values. Among the socioeconomic variables, only the fraction of White households and average income are determined to be statistically significant, both negatively associated with anti-science attitudes. There is also a significant positive association with the county’s share of Trump voters and a significant association with the emotion expressed in tweets (positively associated with arousal and negatively associated with valence). Together, these results suggest that people holding anti-science attitudes are more likely to come from lower income regions with fewer White residents, a relationship that holds even after controlling for partisanship (through share of Trump voters). It is also worth noting that anti-science users are more likely to post angry messages on social media.
3.3. Latent Structure of Anti-Science Attitudes
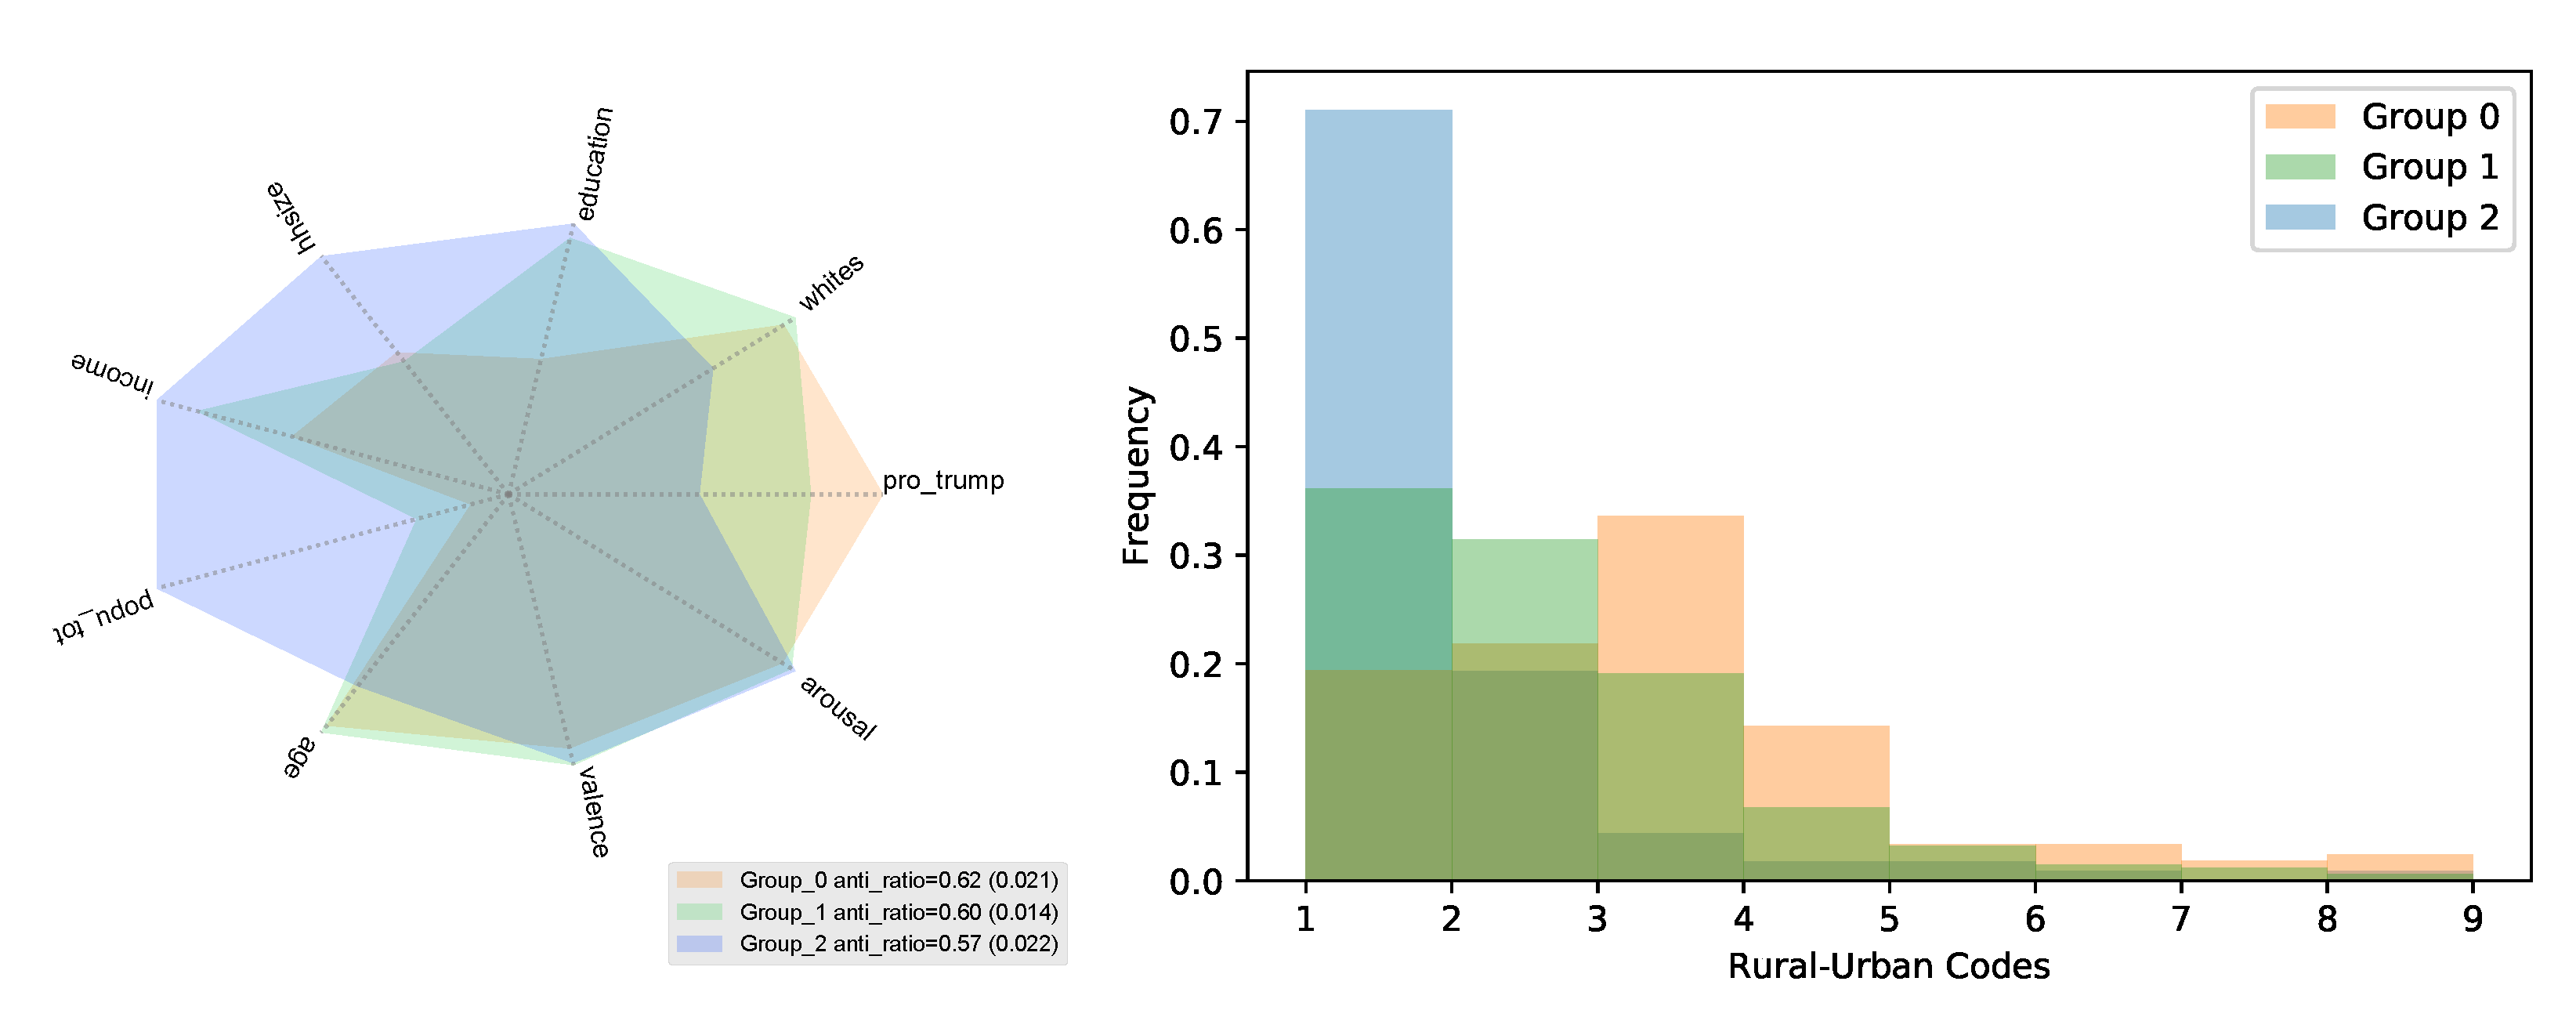
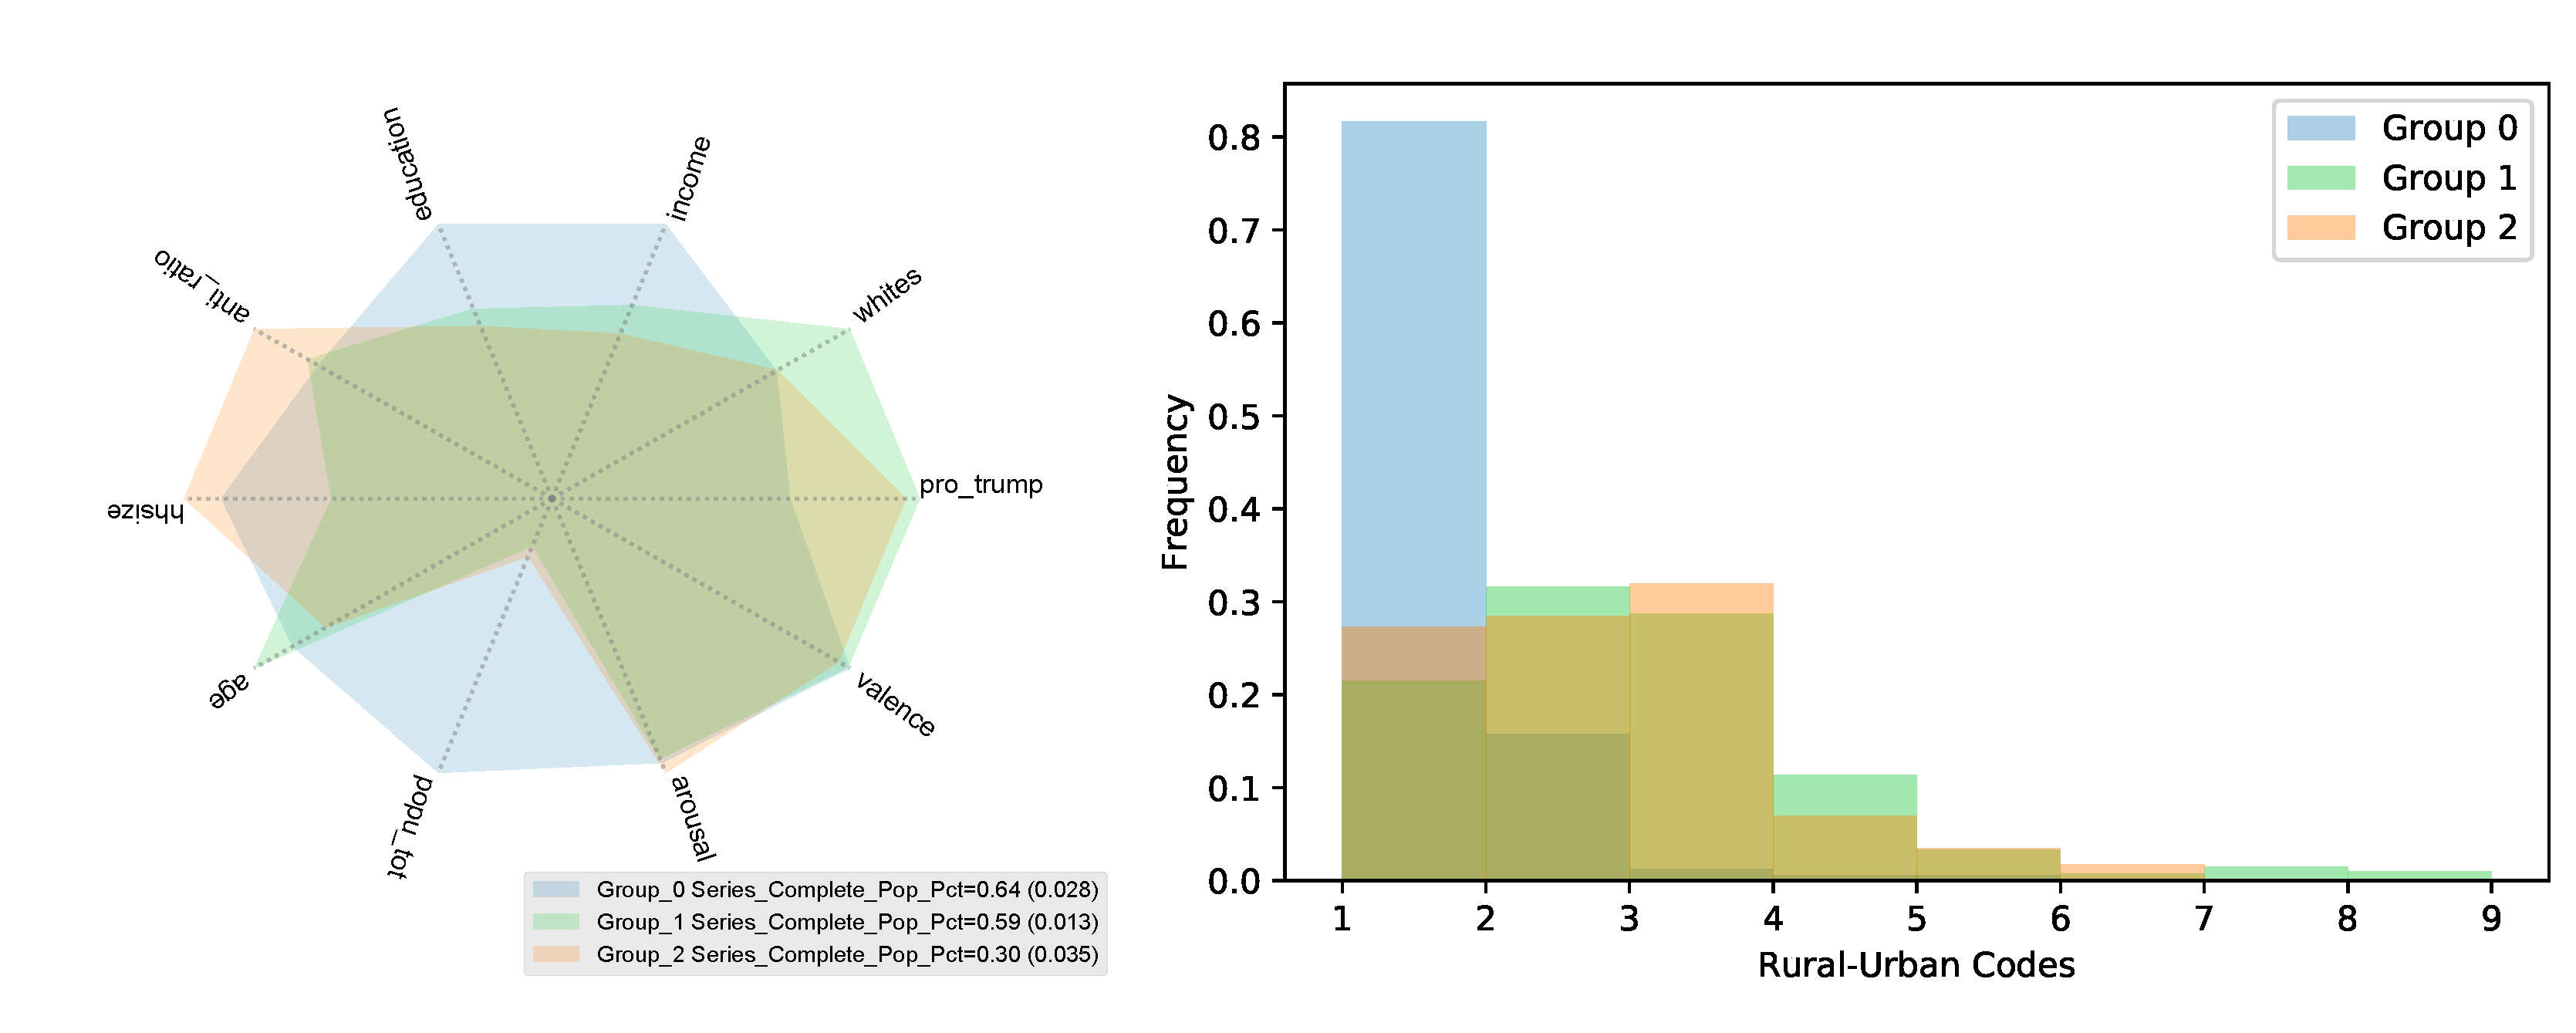
A challenge posed by data coming from diverse groups, each with its own characteristics and behaviors, is that the heterogeneity may obscure the underlying relationships. As a result, a model learned from pooled data may offer few insights into the trends within the underlying groups [42]. To address this challenge, we use DoGR (see Materials and Methods) to discover the latent groups and estimate the regression coefficients within them. DoGR has a tunable parameter K, the number of mixture components. According to Bayes’ information criterion (BIC), the county data are best explained with three components or groups. Figure 4 compares the composition of the three groups based on the mean of the variables over the counties assigned to that group (each county is assigned to the group with the highest membership probability). The first (orange) group is composed of counties with the largest share of Trump voters, smallest population and fewest college-educated residents on average. These counties are also home to the largest share of anti-science users compared to other counties in our data (the average anti-science share is ). The second (green) group has the largest share of White residents, who are also older. The last (blue) group is composed of the largest counties, with more college-educated and affluent residents. They also have the fewest Trump voters. These counties have the smallest share of anti-science users (average share of anti-science users is ).
To obtain a better idea of what these groups represent, we plotted the distribution of the rural–urban continuum codes of counties in each group. The rural–urban continuum codes (https://www.ers.usda.gov/data-products/rural-urban-continuum-codes/documentation/, accessed on 16 June 2021) categorize counties in the US as metropolitan vs. non-metropolitan. The categorization scheme distinguishes the metropolitan counties (codes 1–3) by the population size of their metro area and non-metropolitan counties (codes 4–9) by their degree of urbanization and adjacency to metro areas. Figure 4 shows the distribution of county codes. The blue group is mainly composed of the largest metropolitan counties (code 1) representing the largest urban centers. The green group also contains large metropolitan counties, but also many mid-side metro areas (codes 2–3). In contrast, the orange group corresponds to counties in the smallest metro areas (code 3) and also many counties in non-metro and rural areas (codes 4–9). Although these county codes were not used in the analysis, the DoGR method identifies the rural–urban divide as the factor explaining cultural differences.
Figure 3 (right) shows regression coefficients within the groups. In rural counties (orange group), the fraction of anti-science users is negatively associated with the share of White households and is positively associated with the age of residents, household size, and the share of Trump voters. It is also positively associated with income, though this relationship is less significant. Other associations with socioeconomic variables are not statistically significant. The green group is somewhat different from the blue group in that the income is negatively associated with the fraction of anti-science users in a county; though similar to the orange group, a fraction of anti-science users is negatively associated with White households and positively associated with Trump voter share. The age of residents and their education are not significantly associated with anti-science attitudes. In larger metro areas (blue group), only age, race, and partisanship (Trump voter share) are significantly associated with anti-science attitudes, albeit at a lower significance level.
Table 3 reports goodness-of-fit metrics for the regression in the combined (pooled) and disaggregated (group-wise) data. Groups 0 and 1 are more homogeneous, with the model significantly better explaining their behavior than in the pooled data. Group 2 is more heterogeneous, with a lower R-squared than the pooled data.
3.4. Anti-Science Attitudes in the Age of COVID-19
Response to the COVID-19 pandemic in the US showed how political partisanship [5] and the mistrust of science [7] contributed to the resistance to COVID-19 mitigation measures, such as social distancing, lockdowns, and wearing masks [6]. More recently, the movement against COVID restrictions has found a new cause in resistance to the COVID-19 vaccines. At the time of writing, although many Americans have received a COVID-19 vaccine, a substantial number remain reluctant to receive their shot, endangering the goal of herd immunity. Analysts looking for sources of vaccine hesitancy identified a mistrust of government and the role of political partisanship [43]. Additionally, the mistrust of science and conspiratorial thinking also fuels the anti-vaccine movement [7]. Here, we examine the relationship between anti-science attitudes (in 2016) and vaccination rates across the country (as of 6 June 2021). Despite the long gap in time, in some communities, we found that anti-science attitudes were significantly associated with lower vaccination rates.
Multi-variate regression of the pooled county data (Figure 5 (left)) shows that the share of anti-science users within a county is negatively associated with that county’s vaccination rates, even after controlling for partisanship (Trump voter share in 2016) and other socioeconomic factors. All variables, except for education, are found to be statistically significant: as older, whiter, more affluent counties have higher vaccination rates, those with larger households have lower vaccination rates. Upon further examination, we used DoGR to identify the latent groups that best explain COVID-19 vaccination rates as a dependent variable. The data are best explained by three groups (according to BIC): (Group 0) the bigger, more affluent, and better-educated counties, (Group 1) the whiter, older, more pro-Trump communities, and (Group 2) counties with larger household and bigger share of anti-science users (Figure 6 (left)). This latter group had the lowest average vaccination rate, with only 30% of residents fully vaccinated, compared to 65% and 59% for the first two groups. As shown by the distribution of the county’s rural–urban continuum codes (Figure 6 (right)), the first group represents the largest metro areas, and while the last two components are fairly similar, though Group 1 is more rural. Although the latter two groups are similar according to the rural–urban continuum measure, their population has different behaviors, suggesting additional cultural differences not accounted for in our analysis, for example, the north–south divide.
Regression coefficients within these groups (Figure 5 (right)) tell a more nuanced story. The anti-science share is associated with lower vaccination rates in urban communities (statistically significant relationship for Group 0) and mostly rural communities (Group 2, but not statistically significant). More affluent urban communities are much more likely to be fully vaccinated, but income is not significantly associated with vaccination rates in non-metro areas. Population is a significant factor in explaining vaccination rates only in rural communities. However, larger communities had lower vaccination rates. Goodness-of-fit metrics (Table 3) show adjusted R-squared values for group-wise regression.
4. Discussion
Social data are often highly heterogeneous, i.e., generated by individuals with different behaviors. The divergent trends at the individual level may disappear when data are aggregated, confounding the analysis [42]. To mitigate this effect, we used a recently developed machine learning algorithm to disaggregate the data and perform regression analysis within the discovered groups. To explain the share of social media users within communities expressing anti-science attitudes, the method identified three groups, which roughly map communities within large metropolitan areas, smaller metro and suburban areas, and rural areas. This suggests that the urban–rural divide defines cultural differences in anti-science attitudes in the US. In all three groups, the share of White households is negatively associated with anti-science attitudes, meaning that counties with a larger non-White population also have more people expressing skepticism of science. In the pooled data (Figure 3 (left)), there was little association with age, but in the disaggregated data there are stronger, statistically significant associations between anti-science attitudes and age (Figure 3 (right)). Specifically, rural communities with older population have significantly more anti-science users, but older urban communities have fewer anti-science users. The trends with respect to income also show Simpson’s reversal [42]. In the pooled data, income has a negative association with anti-science attitudes, but in the disaggregated data, there is a positive association with income in rural and urban (though not statistically significant) counties. Household size was not appreciably associated with anti-science attitudes in the pooled data but has a strong relationship in one of the groups: rural counties with larger households express more anti-science attitudes. Finally, Trump’s vote share was associated with more anti-science attitudes across all groups.
One surprise is the relative unimportance of education, which we measured as the share of county residents with college education (or above). Although this variable is negatively correlated the with anti-science share (, ), its coefficients within all three groups, while also negative, are not statistically significant. This suggests that most of the effects of education can be explained by other variables, such as income and partisanship.
We also found that anti-science attitudes were associated with significantly lower COVID-19 vaccination rates in urban communities in 2021, even after controlling for political partisanship, race, income, and education. Our analysis does not imply a causal link; instead, it suggests that pre-existing anti-science attitudes may have allowed COVID-19 misinformation and resistance to mitigation measures to spread, rather than vice versa.
We found emotional factors to be strongly and significantly associated with anti-science attitudes, but only in rural and smaller urban areas. In fact, the effect of psychological factors, especially arousal, was about twice that of partisanship. Together with negative emotional valence, high arousal suggests that anger plays an important role in explaining anti-science attitudes, especially in less densely populated areas. Researchers have begun to explore the psychological antecedents of science skepticism [44], but more work is needed in this area.
Limitations
When performing an analysis of social media data, one must keep in mind that Twitter users are not a representative sample of the population. Moreover, geo-coded tweets posted in a given area may not come from residents, but from users visiting those areas. This will weaken the link from social media expressions to the characteristics of residents of a given area. However, we believe this applies to a negligible number of tweets. Additionally, unvaccinated people in each county may also include a small fraction of people who have not had the chance to receive a vaccine. However, we work under the assumption that this is a negligible number as opposed to the ones who prefer not to receive one.
Flaws in the automatic detection of anti-science attitudes may bias results. We put strict constraints on the classifiers, eliminating users from analysis whose predicted anti-science scores were not extreme enough. This reduced the number of users in the dataset. Additionally, attitudes could have shifted over the years, diminishing the utility of the 2016 data in understanding current anti-science attitudes. To check, we compared the share of anti-science users in the 2016 data explored in this paper to the share of anti-science users measured in the 2020 data using a similar methodology [25]. The correlation at the state level is high at 0.6. This suggests that attitudes are stable over time.
Multi-collinearity could affect regression coefficients. To address this question, we used ridge regression to estimate regression coefficients and found them to be largely unchanged.
5. Conclusions
We used public messages posted on social media in October 2016 to track anti-science attitudes in the US. By linking these messages to specific regions in the US through their geographic coordinates, we were able to estimate the number of people in different places who share anti-science attitudes and measured the association with their socioeconomic characteristics.
To disentangle the effects of different variables, we used machine learning methods to disaggregate the data and estimate regression coefficients separately within each group. This analysis split counties into three culturally meaningful groups: those belonging to large urban centers, smaller urban areas, and rural regions. While political partisanship (specifically, the share of Trump voters) was strongly associated with the county’s share of anti-science users, race and psychological factors were also found to be important. Specifically, places with a larger share of non-White population had more anti-science users, and places outside of large metro centers where users expressed anger (negative valence and high arousal) were associated with more anti-science users. We also found that anti-science attitudes in large metropolitan areas are associated with significantly lower COVID-19 vaccination rates nearly five years later.
Crafting effective policies in response to a crisis requires an understanding of public attitudes and views. While public messages posted on social media have long been seen as a practical sensor of these views, past efforts in this area were hampered by the heterogeneous nature of social data. Our paper describes a framework to tame the data heterogeneity and illustrates that it demonstrate that social media is a practical tool for monitoring anti-science attitudes.
Author Contributions
Conceptualization, K.L. and M.K.; methodology, M.H. and A.R.; formal analysis, M.H.; data collection and curation, M.K., A.R. and M.H.; writing—original draft preparation, K.L. and M.H.; writing—review and editing, A.R., M.H., M.K. and K.L. All authors have read and agreed to the published version of the manuscript.
Funding
This research was funded in part by the Air Force Office of Scientific Research (grant number FA9550-20-1-0224).
Institutional Review Board Statement
The study was conducted according to the guidelines of the Declaration of Helsinki, and approved by the Institutional Review Board of University of Southern California.
Data Availability Statement
The data used in this study are available at https://drive.google.com/file/d/1OKsdhOG76TEo0xW2AMI2NDLS66IBzkEi/view (accessed on 16 June 2021). The data include county-level socioeconomic variables, 2016 Trump vote share (Trump), and aggregated measures extracted from 2016 social media data capturing emotions (valence, arousal) and the share of anti-science users (anti-ratio). Data and code for measuring anti-science attitudes are available at https://github.com/ashwinshreyas96/Multidimensional-Ideological-Polarization (accessed on 16 June 2021).
Acknowledgments
Authors are grateful to Nazanin Alipourfard for providing help with running the DoGR software.
Conflicts of Interest
The authors declare no conflict of interest. The funders had no role in the design of the study; in the collection, analyses, or interpretation of data; in the writing of the manuscript, or in the decision to publish the results.
References
- Betsch, C. How behavioural science data helps mitigate the COVID-19 crisis. Nat. Hum. Behav. 2020, 4, 438. [Google Scholar] [CrossRef] [Green Version]
- Van Bavel, J.J.; Baicker, K.; Boggio, P.S.; Capraro, V.; Cichocka, A.; Cikara, M.; Crockett, M.J.; Crum, A.J.; Douglas, K.M.; Druckman, J.N.; et al. Using social and behavioural science to support COVID-19 pandemic response. Nat. Hum. Behav. 2020, 4, 460–471. [Google Scholar] [CrossRef]
- Lunn, P.D.; Belton, C.A.; Lavin, C.; McGowan, F.P.; Timmons, S.; Robertson, D.A. Using Behavioral Science to help fight the Coronavirus. J. Behav. Public Adm. 2020, 3, 1–15. [Google Scholar] [CrossRef] [Green Version]
- Gollwitzer, A.; Martel, C.; Brady, W.J.; Pärnamets, P.; Freedman, I.G.; Knowles, E.D.; Van Bavel, J.J. Partisan differences in physical distancing are linked to health outcomes during the COVID-19 pandemic. Nat. Hum. Behav. 2020, 4, 1186–1197. [Google Scholar] [CrossRef]
- Funk, C.; Tyson, A. Partisan Differences over the Pandemic Response Are Growing. Available online: https://blogs.scientificamerican.com/observations/partisan-differences-over-the-pandemic-response-are-growing/ (accessed on 16 June 2021).
- Shear, M.D.; Mervosh, S. Trump Encourages Protest Against Governors Who Have Imposed Virus Restrictions. The New York Times. 29 April 2020. Available online: https://www.nytimes.com/2020/04/17/us/politics/trump-coronavirus-governors.html (accessed on 12 May 2021).
- Rutjens, B.T.; van der Linden, S.; van der Lee, R. Science skepticism in times of COVID-19. Group Process. Intergroup Relat. 2021, 24, 276–283. [Google Scholar] [CrossRef]
- Rutjens, B.T.; Heine, S.J.; Sutton, R.M.; van Harreveld, F. Attitudes towards science. In Advances in Experimental Social Psychology; Academic Press: Cambridge, MA, USA, 2018; Volume 57, pp. 125–165. [Google Scholar]
- van der Linden, S. Countering science denial. Nat. Hum. Behav. 2019, 3, 889–890. [Google Scholar] [CrossRef]
- Rutjens, B.T.; Preston, J.L. Science and religion: A rocky relationship shaped by shared psychological functions. Sci. Relig. Spirit. Existent. 2020, 373–385. [Google Scholar] [CrossRef] [Green Version]
- Bak, H.J. Education and public attitudes toward science: Implications for the “deficit model” of education and support for science and technology. Soc. Sci. Q. 2001, 82, 779–795. [Google Scholar] [CrossRef]
- Miller, J.D. Public understanding of, and attitudes toward, scientific research: What we know and what we need to know. Public Underst. Sci. 2004, 13, 273–294. [Google Scholar] [CrossRef] [Green Version]
- Sturgis, P.; Allum, N. Science in society: Re-evaluating the deficit model of public attitudes. Public Underst. Sci. 2004, 13, 55–74. [Google Scholar] [CrossRef] [Green Version]
- Pennycook, G.; McPhetres, J.; Bago, B.; Rand, D.G. Predictors of attitudes and misperceptions about COVID-19 in Canada, the UK, and the USA. PsyArXiv 2020, 10. [Google Scholar] [CrossRef]
- McPhetres, J.; Pennycook, G. Science Beliefs, Political Ideology, and Cognitive Sophistication. Available online: https://osf.io/ad9v7/download (accessed on 16 June 2021).
- Hornsey, M.J.; Fielding, K.S. Attitude roots and Jiu Jitsu persuasion: Understanding and overcoming the motivated rejection of science. Am. Psychol. 2017, 72, 459. [Google Scholar] [CrossRef] [PubMed]
- Prot, S. Science Denial as Intergroup Conflict: Using Social Identity Theory, Intergroup Emotions Theory and Intergroup Threat Theory to Explain Angry Denial of Science. Available online: https://lib.dr.iastate.edu/cgi/viewcontent.cgi?article=5930&context=etd (accessed on 16 June 2021).
- Ostrom, T.M. The relationship between the affective, behavioral, and cognitive components of attitude. J. Exp. Soc. Psychol. 1969, 5, 12–30. [Google Scholar] [CrossRef]
- Breckler, S.J. Empirical validation of affect, behavior, and cognition as distinct components of attitude. J. Personal. Soc. Psychol. 1984, 47, 1191. [Google Scholar] [CrossRef]
- Forgas, J.P.; Cooper, J.; Crano, W.D. The Psychology of Attitudes and Attitude Change; Psychology Press: London, UK, 2011; Volume 12. [Google Scholar]
- Conover, M.; Ratkiewicz, J.; Francisco, M.; Gonçalves, B.; Menczer, F.; Flammini, A. Political polarization on twitter. In Proceedings of the International AAAI Conference on Web and Social Media, Barcelona, Spain, 17–21 July 2011; Volume 5. [Google Scholar]
- Barberá, P. Birds of the same feather tweet together: Bayesian ideal point estimation using Twitter data. Political Anal. 2015, 23, 76–91. [Google Scholar] [CrossRef] [Green Version]
- Badawy, A.; Ferrara, E.; Lerman, K. Analyzing the digital traces of political manipulation: The 2016 russian interference twitter campaign. In Proceedings of the 2018 IEEE/ACM International Conference on Advances in Social Networks Analysis and Mining (ASONAM), Barcelona, Spain, 28–31 August 2018; pp. 258–265. [Google Scholar]
- Cinelli, M.; De Francisci Morales, G.; Galeazzi, A.; Quattrociocchi, W.; Starnini, M. The echo chamber effect on social media. Proc. Natl. Acad. Sci. USA 2021, 118, e2023301118. [Google Scholar] [CrossRef]
- Rao, A.; Morstatter, F.; Hu, M.; Chen, E.; Burghardt, K.; Ferrara, E.; Lerman, K. Political Partisanship and Antiscience Attitudes in Online Discussions About COVID-19: Twitter Content Analysis. J. Med. Internet Res. 2021, 23, e26692. [Google Scholar] [CrossRef]
- Lazer, D.M.; Baum, M.A.; Benkler, Y.; Berinsky, A.J.; Greenhill, K.M.; Menczer, F.; Metzger, M.J.; Nyhan, B.; Pennycook, G.; Rothschild, D.; et al. The science of fake news. Science 2018, 359, 1094–1096. [Google Scholar] [CrossRef]
- Grinberg, N.; Joseph, K.; Friedland, L.; Swire-Thompson, B.; Lazer, D. Fake news on Twitter during the 2016 US presidential election. Science 2019, 363, 374–378. [Google Scholar] [CrossRef]
- Nikolov, D.; Flammini, A.; Menczer, F. Right and Left, Partisanship Predicts (Asymmetric) Vulnerability to Misinformation. Available online: https://misinforeview.hks.harvard.edu/wp-content/uploads/2021/02/nikolov_partisanship_vulnerability_misinformation_20210215.pdf (accessed on 16 June 2021).
- Mikolov, T.; Chen, K.; Corrado, G.; Dean, J. Efficient Estimation of Word Representations in Vector Space. arXiv 2013, arXiv:1301.3781. [Google Scholar]
- Joulin, A.; Grave, E.; Bojanowski, P.; Mikolov, T. Bag of Tricks for Efficient Text Classification. arXiv 2016, arXiv:1607.01759. [Google Scholar]
- Pagliardini, M.; Gupta, P.; Jaggi, M. Unsupervised Learning of Sentence Embeddings Using Compositional n-Gram Features. In Proceedings of the 2018 Conference of the North American Chapter of the Association for Computational Linguistics: Human Language Technologies, Volume 1 (Long Papers); Association for Computational Linguistics: New Orleans, LA, USA, 2018; pp. 528–540. [Google Scholar] [CrossRef]
- Warriner, A.B.; Kuperman, V.; Brysbaert, M. Norms of valence, arousal, and dominance for 13,915 English lemmas. Behav. Res. Methods 2013, 45, 1191–1207. [Google Scholar] [CrossRef] [PubMed] [Green Version]
- McLean, R.A.; Sanders, W.L.; Stroup, W.W. A unified approach to mixed linear models. Am. Stat. 1991, 45, 54–64. [Google Scholar]
- Winter, B. A very basic tutorial for performing linear mixed effects analyses. arXiv 2013, arXiv:1308.5499. [Google Scholar]
- Alipourfard, N.; Fennell, P.G.; Lerman, K. Can you Trust the Trend? Discovering Simpson’s Paradoxes in Social Data. In Proceedings of the Eleventh ACM International Conference on Web Search and Data Mining, Marina Del Rey, CA, USA, 5–9 February 2018; pp. 19–27. [Google Scholar]
- Späth, H. Algorithm 39 clusterwise linear regression. Computing 1979, 22, 367–373. [Google Scholar] [CrossRef]
- da Silva, R.A.; de Carvalho, F.d.A. On Combining Clusterwise Linear Regression and K-Means with Automatic Weighting of the Explanatory Variables. In Proceedings of the International Conference on Artificial Neural Networks, Alghero, Italy, 11–14 September 2017; Springer: Cham, Switzerland, 2017; pp. 402–410. [Google Scholar]
- da Silva, R.A.; de Carvalho, F.d.A. On Combining Fuzzy C-Regression Models and Fuzzy C-Means with Automated Weighting of the Explanatory Variables. In Proceedings of the 2018 IEEE International Conference on Fuzzy Systems (FUZZ-IEEE), Rio de Janeiro, Brazil, 8–13 July 2018; pp. 1–8. [Google Scholar]
- Sung, H.G. Gaussian Mixture Regression and Classification. Ph.D. Thesis, Rice University, Houston, TX, USA, 2004. [Google Scholar]
- Ghahramani, Z.; Jordan, M.I. Supervised Learning from Incomplete Data via an EM Approach. Available online: https://papers.nips.cc/paper/1993/file/f2201f5191c4e92cc5af043eebfd0946-Paper.pdf (accessed on 16 June 2021).
- Alipourfard, N.; Burghardt, K.; Lerman, K. Handbook of Computational Social Science. Volume 2 Data Science, Statistical Modeling, and Machine Learning Methods, Chapter Disaggregation via Gaussian Regression for Robust Analysis of Heterogeneous Data; Taylor & Francis: Abingdon, UK, 2021. [Google Scholar]
- Lerman, K. Computational social scientist beware: Simpson’s paradox in behavioral data. J. Comput. Soc. Sci. 2018, 1, 49–58. [Google Scholar] [CrossRef] [Green Version]
- Ivory, D.; Leatherby, L.; Gebeloff, R. In counties that voted for Trump, fewer people are getting vaccinated. The New York Times. 17 April 2021. Available online: https://www.nytimes.com/2021/04/17/world/in-counties-that-voted-for-trump-fewer-people-are-getting-vaccinated.html (accessed on 22 April 2021).
- Hornsey, M.J.; Harris, E.A.; Fielding, K.S. The psychological roots of anti-vaccination attitudes: A 24-nation investigation. Health Psychol. 2018, 37, 307. [Google Scholar] [CrossRef]
Figure 1.
Anti-science ratio per state. The anti-science ratio measures the share of anti-science users among all Twitter users from a county who are posting anti-science or pro-science content. States aggregate statistics of their constituent counties.
Figure 1.
Anti-science ratio per state. The anti-science ratio measures the share of anti-science users among all Twitter users from a county who are posting anti-science or pro-science content. States aggregate statistics of their constituent counties.

Figure 2.
Correlations between socioeconomic variables, political ideology, sentiment, and anti-science attitudes. The last two variables were measured from social media messages. All variables represent averages aggregated per county. Statistically significant correlations are marked by asterisks (***: <0.1%, **: <1%, *: <5%).

Figure 3.
Regression coefficients for the fraction of anti-science users within a county for (left) pooled and (right) disaggregated data. The groups in the disaggregated data were automatically discovered using the DoGR method. Significance levels of the coefficients are as follows: 1% (***), 5% (**), 10% (*).

Figure 4.
Descriptive statistics of the components (groups) discovered in the anti-science data. (left) Average value of each explanatory variable across counties assigned to that group. (right) Distribution of the urban–rural continuum codes for the counties assigned to each discovered group.
Figure 4.
Descriptive statistics of the components (groups) discovered in the anti-science data. (left) Average value of each explanatory variable across counties assigned to that group. (right) Distribution of the urban–rural continuum codes for the counties assigned to each discovered group.

Figure 5.
Regression analysis of county COVID-19 vaccination rates. Regression coefficients in the pooled (left) and disaggregated (right) data. Significance levels of the coefficients are as follows: 1% (***), 5% (**), 10% (*).
Figure 5.
Regression analysis of county COVID-19 vaccination rates. Regression coefficients in the pooled (left) and disaggregated (right) data. Significance levels of the coefficients are as follows: 1% (***), 5% (**), 10% (*).

Figure 6.
Descriptive statistics of component (groups) discovered in the COVID-19 vaccination data. The left plot shows the average value of each explanatory variable across counties assigned to that group. The right plot shows the distribution of the rural–urban continuum code of the counties in each group.


Table 1.
Curated information and news domains (PLDs) with their polarization. Examples of the pro-science and anti-sciences domains are shown in the table.
Table 1.
Curated information and news domains (PLDs) with their polarization. Examples of the pro-science and anti-sciences domains are shown in the table.
| Polarization | PLDs |
|---|---|
| Pro-Science () | cdc.gov, who.int, thelancet.com, mayoclinic.org, nature.com, newscientist.com … (100 + PLDs) |
| Anti-Science () | 911truth.org, althealth-works.com, naturalcures.com, shoebat.com, prison-planet.com … (100 + PLDs) |
Table 2.
Cross-validation results of pro-science and anti-science classifiers. Results are averaged five-fold.
Table 2.
Cross-validation results of pro-science and anti-science classifiers. Results are averaged five-fold.
| Classifier | Precision | Recall | Micro-F1 | Macro-F1 |
|---|---|---|---|---|
| Pro-Science | 0.90 | 0.89 | 0.89 | 0.89 |
| Anti-Science | 0.89 | 0.90 | 0.89 | 0.90 |
Table 3.
Goodness-of-fit measures for regression in pooled data containing all counties and for the subgroups of counties discovered by DoGR.
Table 3.
Goodness-of-fit measures for regression in pooled data containing all counties and for the subgroups of counties discovered by DoGR.
| DogR Result | # of Counties | Adjusted | ||
|---|---|---|---|---|
| Anti-science share | Pooled | 784 | 0.424 | 0.418 |
| Group 0 | 330 | 0.488 | 0.473 | |
| Group 1 | 340 | 0.591 | 0.580 | |
| Group 2 | 114 | 0.357 | 0.302 | |
| Vaccination share | Pooled | 716 | 0.444 | 0.436 |
| Group 0 | 158 | 0.533 | 0.501 | |
| Group 1 | 386 | 0.686 | 0.678 | |
| Group 2 | 172 | 0.311 | 0.268 | |
Publisher’s Note: MDPI stays neutral with regard to jurisdictional claims in published maps and institutional affiliations. |
© 2021 by the authors. Licensee MDPI, Basel, Switzerland. This article is an open access article distributed under the terms and conditions of the Creative Commons Attribution (CC BY) license (https://creativecommons.org/licenses/by/4.0/).
Share and Cite
MDPI and ACS Style
Hu, M.; Rao, A.; Kejriwal, M.; Lerman, K. Socioeconomic Correlates of Anti-Science Attitudes in the US. Future Internet 2021, 13, 160. https://doi.org/10.3390/fi13060160
AMA Style
Hu M, Rao A, Kejriwal M, Lerman K. Socioeconomic Correlates of Anti-Science Attitudes in the US. Future Internet. 2021; 13(6):160. https://doi.org/10.3390/fi13060160
Chicago/Turabian StyleHu, Minda, Ashwin Rao, Mayank Kejriwal, and Kristina Lerman. 2021. "Socioeconomic Correlates of Anti-Science Attitudes in the US" Future Internet 13, no. 6: 160. https://doi.org/10.3390/fi13060160
Note that from the first issue of 2016, this journal uses article numbers instead of page numbers. See further details here.