Drought and Moisture Availability and Recent Western Spruce Budworm Outbreaks in the Western United States


1
Environmental Science Program, University of Idaho, Moscow, ID 83844, USA
2
Department of Geography, University of Idaho, Moscow, ID 83844, USA
*
Author to whom correspondence should be addressed.
Forests 2019, 10(4), 354; https://doi.org/10.3390/f10040354
Submission received: 27 February 2019
/
Revised: 9 April 2019
/
Accepted: 19 April 2019
/
Published: 24 April 2019
(This article belongs to the Special Issue Long-Term Impacts of Climate Change on Forest Health)
Abstract
:Western spruce budworm (WSBW) is a common defoliating insect that has caused extensive damage and mortality to a number of tree species across the western United States (US). Past studies have linked outbreaks of WSBW to increased moisture stress of host trees in the Northwest and decreased moisture stress in the Southwest. Our study analyzed seasonal drought stress metrics with WSBW outbreaks within Douglas-fir (Pseudotsuga menziesii (Mirb.) Franco) forests in the western US during 1997–2015. Superposed epoch analysis and defoliation area growth rates (representing insect population growth rates) were assessed to quantify the drought conditions associated with the initiation and continuation of outbreaks, respectively. We found that multiple years of drought occurred prior to and during outbreak initiation in the Northwest, and that outbreak initiation in the Southwest was associated with only weak drought or neutral conditions. During the outbreak continuation stage, there was a weak positive correlation between May moisture availability and defoliation area growth rates in the Southwest (R2 = 0.12), but no clear relationship was identified in the Northwest. Increased frequency of summer droughts such as these expected from climate change may increase WSBW outbreaks and promote tree dieoff. Improved understanding of the role of different influences of drought and moisture availability across landscapes will lead to improved predictions and management of future outbreaks of WSBW.
1. Introduction
1.1. Ecology of Western Spruce Budworm
Western spruce budworm (Choristoneura freemani Razowski, WSBW) is a common and destructive defoliating insect of western North America. It feeds on many spruce and fir species, including widespread species such as Douglas-fir (Pseudotsuga menziesii (Mirb.) Franco) and subalpine fir (Abies lasiocarpa (Hooker) Nuttall). Defoliation slows the growth of the host tree, and prolonged feeding may cause top-kill or mortality and damage to developing cones and flowers, which influences the reproduction of trees and inhibits recovery of attacked trees [1]. Vast areas of western North America have experienced severe outbreaks of WSBW, leading to substantial tree mortality. Major epidemics with multiple years of defoliation occurred in the Cascade Range, the Blue Mountains, the Bitterroot range, and the Rocky Mountains [2], and the annual damage area in the United States (US) exceeded 1 million ha throughout the 1980s and in recent years [3]. Host tree species of WSBW can be found in most states of the western US, and WSBW distribution overlaps with most of its hosts’ ranges.
WSBW usually completes one life cycle per year. Adults emerge from pupae and lay eggs in late July or early August. Larvae hatch from eggs in about ten days and find overwintering sites without feeding. In late April and May of the next year, larvae emerge from hibernacula and begin feeding on foliage, staminate flowers, and developing cones of its host species [1]. While feeding, larvae leave webs that entangle and cover developing foliage [1]. These webs can reduce photosynthesis, and needles can turn red if defoliation persists [1]. The red color or bare top of a tree is used as an indicator of WSBW presence during aerial surveys that document tree damage [1]. WSBW thrive in stands with multiple canopy layers: at high populations, or due to physical disturbances, larvae may fall from upper canopy layers, and if they land on host species, they can continue to feed and cause more damage [4].
1.2. Climate and WSBW Relationships
Moisture-caused stress of host trees is thought to be important for influencing a WSBW outbreak [9]. A hump-shaped relationship between moisture stress of host trees and WSBW larvae survival rate has been suggested, in which intermediate moisture stress is most beneficial for outbreaks [4,10]. Compared to an unstressed host, a stressed host has altered foliage qualities such as increased nitrogen and carbohydrates content [4,11,12,13]. Moisture-stressed plants have higher nutritional value because they break down nitrogen, a limiting factor of the larvae, to soluble forms, and larvae that feed on these plants are more successful because of this better supply of nitrogen [11,12]. Experiments suggest that the peak of larvae feeding activity also matches the carbohydrate level of the stressed host, implying that moisture-stressed hosts encourage feeding by larvae [11]. Laboratory experiments also reveal that compared with larvae feeding on non-moisture-stressed plants, larvae feeding on moisture-stressed plants grow faster and have a greater survival rate [13]. However, the increased drought stress may also increase defensive compounds in the foliage, and its influence on defoliators is not well established [9].
Severe and prolonged moisture deficit, however, may be detrimental to WSBW [4,11]. When the host trees are under moisture stress, they produce less foliage [14]. In addition, host trees grow tougher foliage under moisture stress [15], and harder buds are more difficult for larvae to excavate. Extremely stressed trees also have a very high nitrogen level, which reduced the survival rate of feeding WSBW larvae [16]. In drier regions, where host species are constantly stressed, alleviating the moisture stress may facilitate WSBW outbreaks [6,7]. In this condition, WSBW larvae may have better and more abundant food resource, facilitating an increase of budworm populations.
Moisture availability has been linked to WSBW outbreaks in observational studies that used satellite remote sensing and aerial surveys [17,18,19] as well as dendrochronological reconstructions [5,7,20]. Spatially explicit methods that used aerial surveys [17,18] or satellite imagery [19] have been used to analyze WSBW defoliations in southern British Columbia and the western US. Such methods have advantages of broader spatial extent but are often more limited in temporal extent. Dendrochronological data were used to analyze outbreaks over multiple centuries in multiple regions of North America, from British Columbia [5,20,21] to New Mexico [5,7]. Such studies are valuable for assessing climate influences over longer time periods but are often limited to a few locations (see Flower (2016) for comparisons across western North America).
These empirical studies reveal that outbreaks in the northern regions of the northwestern US and southwestern Canada are associated with drought before initiation, whereas outbreaks in the southwestern US are associated with decreased moisture stress before initiation. This major difference is associated with the mean climate in these locations: in southwestern forests (New Mexico), climate conditions are more arid, and thus trees are typically under moisture stress, whereas more mesic conditions typify climate for forests in the northern portion of the region where trees are not typically under moisture stress. Similar to some hypothesized nonlinear responses of herbivorous insects to stressed plants, insects might be more successful at an intermediate stress level, and less successful in low- or high-stress conditions, and the alleviated moisture stress of the Southwest created more favorable condition for the WSBW [7,22].
Long-term analyses using dendrochronology suggest that after outbreaks begin, average moisture stress levels promote the continuation of outbreaks and prolonged drought reduces outbreak length [5,20]. Intermittent moisture stress allows budworm larvae to benefit from drought-induced host chemical change while not significantly impacting growth [5,20].
In this study, we compared drought patterns immediately preceding and during multiple outbreaks of WSBW across a wide area of the western US from 1997 to 2015. We used aerial survey data, which allowed for better identification of initiation year than dendrochronological data used in past studies and provided coverage across a broad geographical extent. We employed two drought metrics, the Palmer Drought Severity Index (PDSI) and climatic water deficit (CWD), to evaluate the relative value of these metrics to WSBW outbreaks. We explored differences between drought influences on outbreaks in the Northwest versus the Southwest to assess possible variability in influences in regions with different climates. We considered both outbreak initiation (through the use of superposed epoch analyses) as well as outbreak continuation (though the analyses of defoliation area growth rates that represent insect population growth rates). Given future climate change and effects on droughts [23], additional studies that test and refine relationships to insect outbreaks will increase scientific understanding and inform forest management.
2. Materials and Methods
2.1. Study Regions
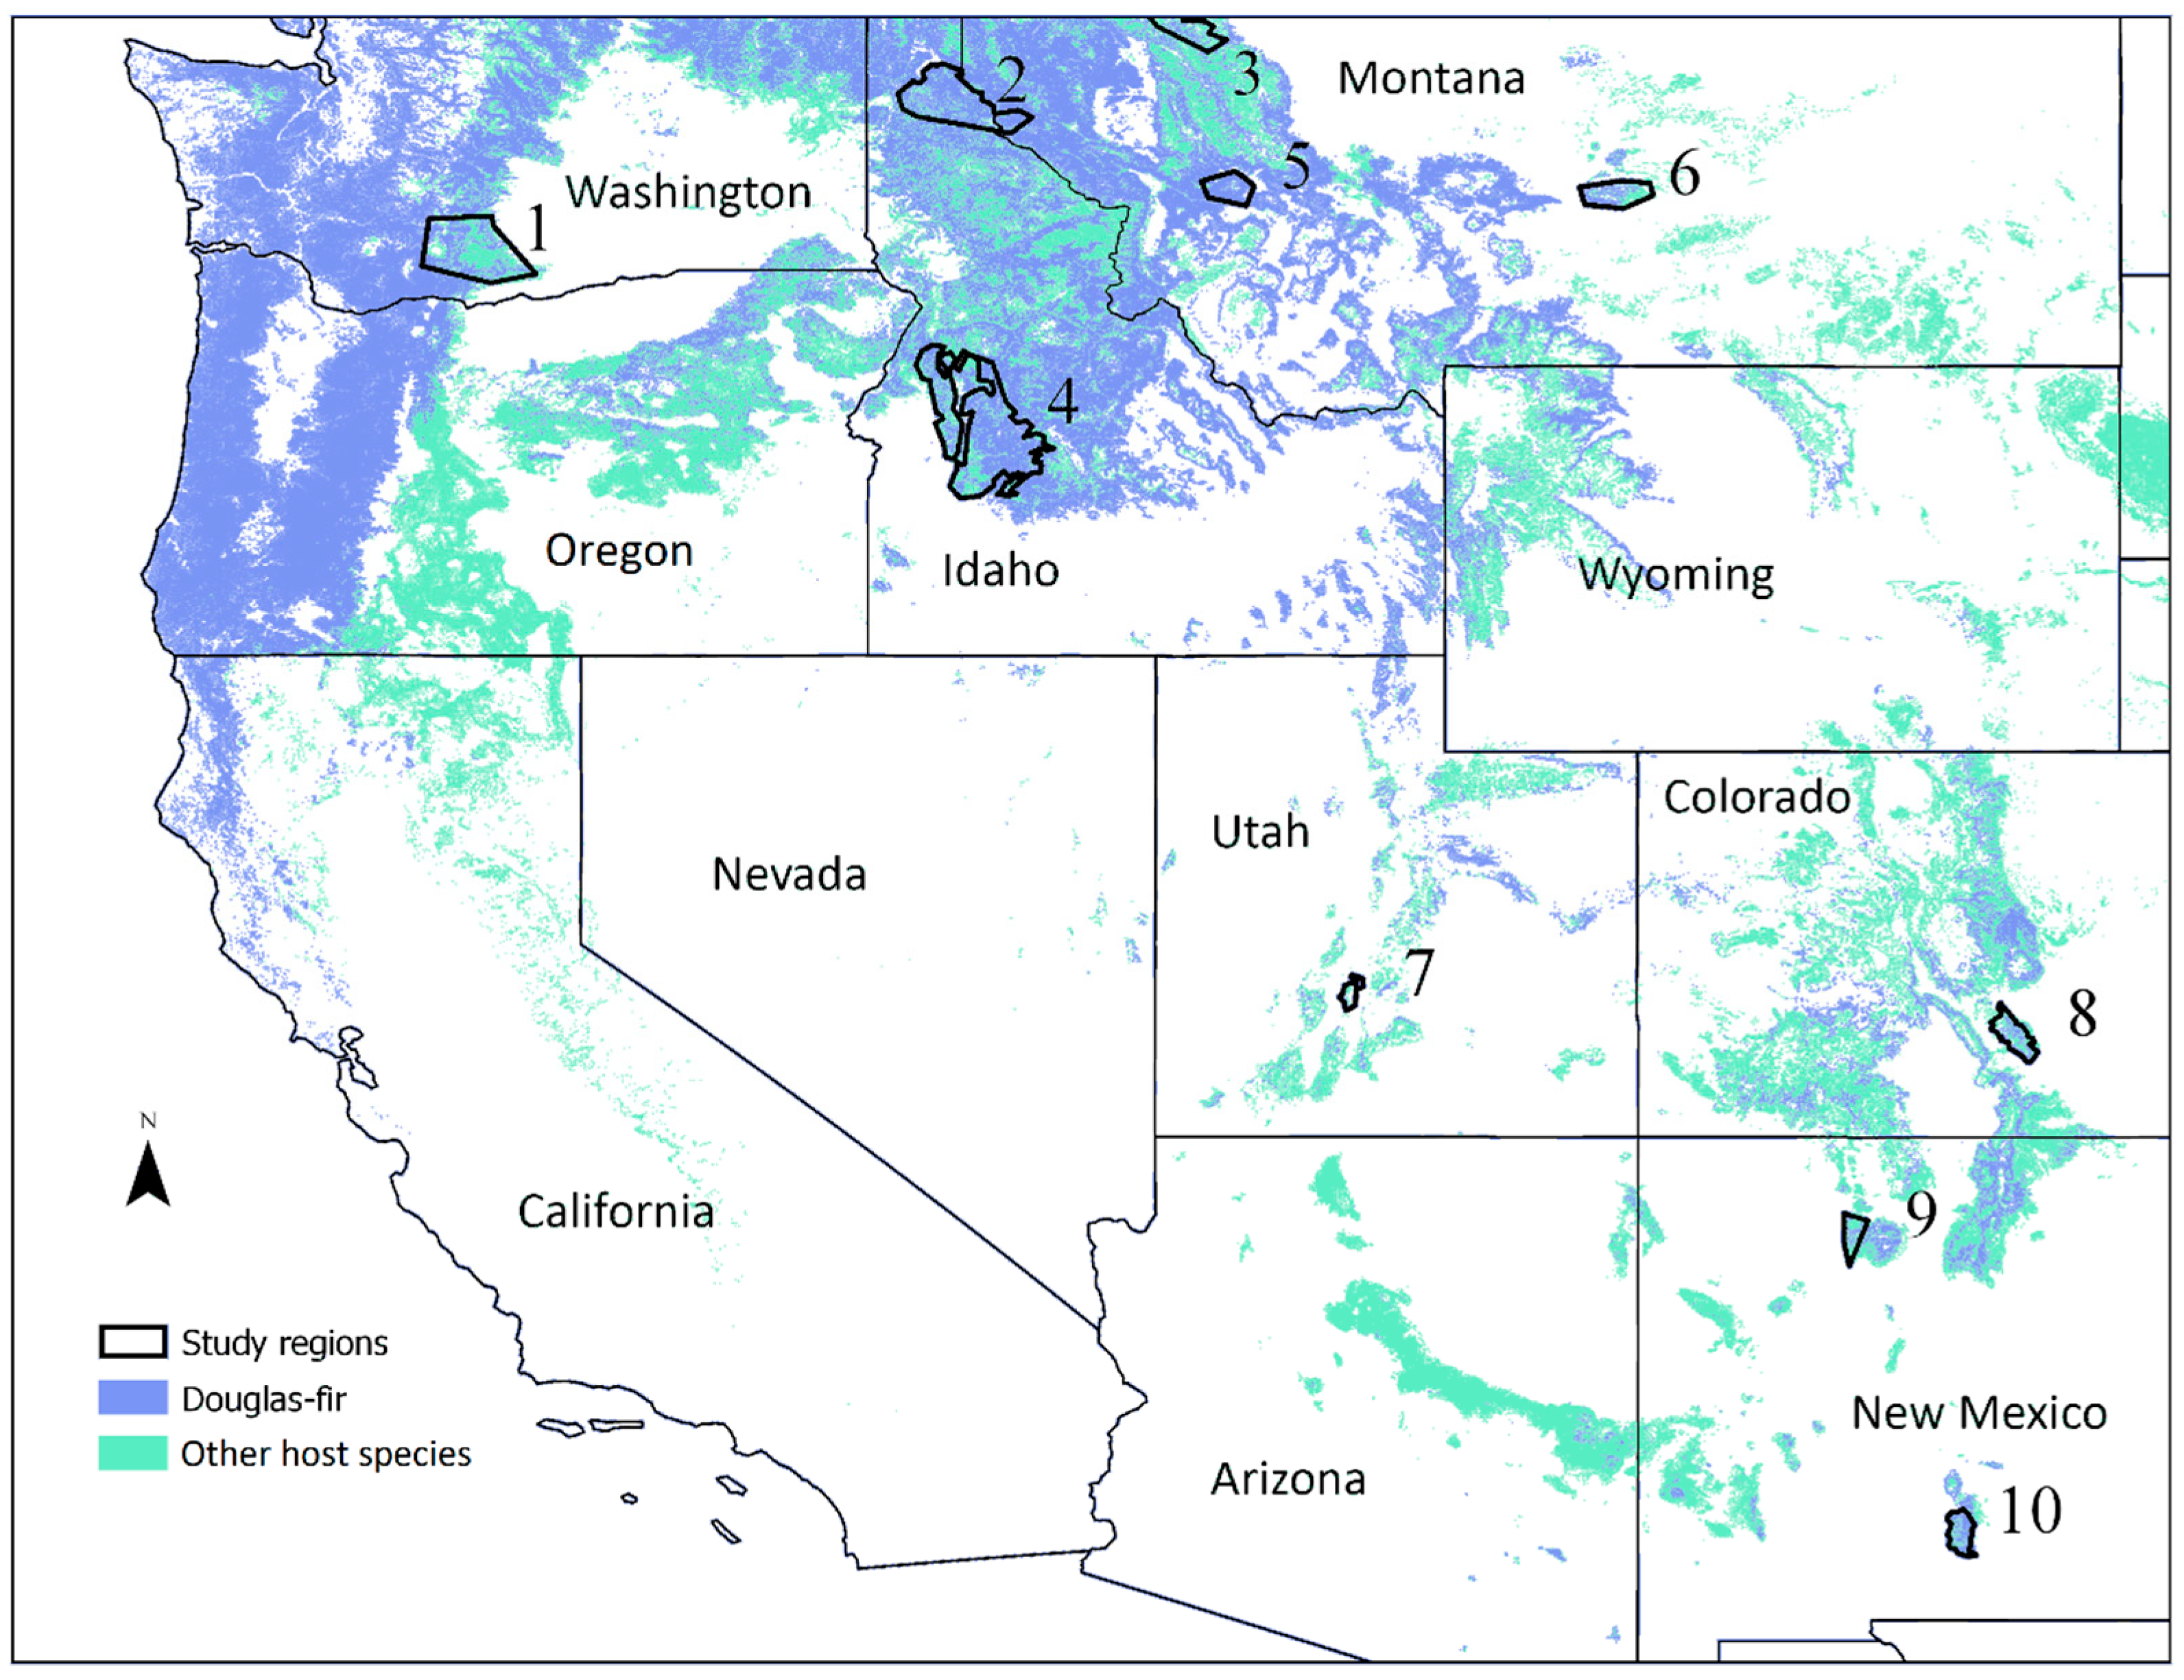
We selected ten study regions affected by WSBW in the western US within the range of an important host species, Douglas-fir (Figure 1). These regions had large WSBW outbreaks for multiple years with typically complete survey coverage (see Section 2.2). We also ensured that region boundaries were defined to encompass the entire (local) area of an outbreak and that the outbreak dynamics within these regions were not influenced by insect dispersal from neighboring areas. Regions were selected to be representative of the wide geographic range of the host species range in the western US. Locations with outbreaks that initiated after the year when westwide ADS data became available (1997) were favored during selection to allow for determination of the initiation year of an outbreak.
2.2. Data Sources
Defoliation caused by WSBW was identified from aerial detection surveys (ADS) conducted by the USDA Forest Service, which are annual surveys of forested areas of the US. We only included polygons with Douglas-fir defoliation to isolate climate impacts in these forest type and minimize any confounding effect of the presence of other host tree species. ADS data from 1997 to 2015 were acquired from the Insect & Disease Detection Survey Data Explorer (https://foresthealth.fs.usda.gov/portal/Flex/IDS). Except for Region 3, all regions were completely surveyed (flown) every year. Region 3 was surveyed after 2003 (which was before the beginning of an outbreak), and in 2013 and 2015 had less than 50% coverage (most of the forested areas were flown). Polygons were categorized by severity, which has values of 0 (no defoliation), 1 (low severity; 0–50% of a polygon was defoliated), or 2 (high severity; >50% defoliated); severity was used to adjust the defoliation area (see Section 2.3). We only used polygons with the pattern attribute labeled “continuous”, indicating that the polygon does not contain gaps of trees that are not damaged. Because most of the defoliation polygons within the selected regions were labeled “continuous”, the area of the defoliated polygon is likely an accurate representation of the defoliated area. More details about data attributes are in Table S1 (Supplementary Materials).
We considered multiple gridded climate data sets for use in this study. We used the TerraClimate data set [24] because monthly PDSI and CWD are included in this data set and it has demonstrated skill at capturing hydroclimatic variables across the region. PDSI and CWD were considered here because they include both temperature and moisture and so result in a better representation of host tree stress than temperature or precipitation alone. TerraClimate was developed using high-spatial-resolution climatological normals of temperature and precipitation from the WorldClim data set [25,26], together with temporally varying data sets (Climate Research Unit data (CRU Ts4.0) [27] and Japanese 55-year Reanalysis (JRA-55) [28]). CRU and JRA-55 data were spatially downscaled with WorldClim data. TerraClimate data are available at relatively high spatial resolution (4 km) and from 1958 to 2017. Reference evapotranspiration (ETo) was calculated with the Penman–Montieth approach [24]. A one-dimensional modified Thornthwaite-Mather climatic water balance model was used to compute actual evapotranspiration (AET) and soil moisture, which were used in the calculations of PDSI and CWD [24,29]. CWD is defined as the difference between ETo and AET. Drier conditions are indicated by more negative PSDI and more positive CWD. More details about PSDI and CWD methods can be found in Abatzoglou et al. [24].
Monthly mean (1997–2015) temperature and precipitation were taken from finer spatial resolution data sets (800 m). Temperature was from Topography Weather (TopoWX) [30], and precipitation was from the Parameter-elevation Relationships on Independent Slopes Model version LT81 (PRISM) data set [31]. Both data sets were developed by spatially interpolating station observations [30,31]. We analyzed the commonly used water year climate (October of one year through September of the next year) because the hydrologic regime of the western US is governed by winter snow that melts in spring and early summer.
2.3. Data Processing and Analysis
The area of defoliation from ADS data was used to represent defoliation damage and budworm populations. We calculated an index of damage that considers both defoliation area and severity. The adjusted total defoliation area (ADA) of region r in year y, ADA(r,y), was calculated as:
where DAlow(plow, y) is the defoliation area of a low-severity polygon and DAhigh(phigh, y) is the defoliation area of a high-severity polygon; Nphigh is the number of high-severity polygons in region r, and Nplow is the number of low-severity polygons in that region. The coefficients (0.25, 0.75) were selected based on the defoliation percentage range of high and low severity used by ADS.
Outbreak initiation year and continuation years were defined using these defoliation time series. Specifically, we defined the defoliation initiation year as the first year from 1997 to 2015 when the adjusted defoliation area exceeded 80 hectares, so we can remove short-term minor outbreaks and focus on major outbreaks within the region. Continuation years were defined as those when the adjusted defoliation areas of the previous year and current year both exceeded 80 hectares.
Climate information in locations of any defoliation of each study region was averaged to produce one annual time series. Water year and seasonal time series of CWD, and PDSI were created for each area to assess seasonal influences on the relationship between drought metrics and WSBW outbreaks. To improve comparisons across regions, temporal anomalies of CWD were standardized to have a standard deviation of 1 using the 1960–2015 period as a baseline. PDSI was not adjusted since it is an index defined relative to local conditions [24,29], although it does not have a standard deviation of 1.
Superposed epoch analysis (SEA) has been used for analyzing climate and defoliation time series [5,20]. For this study, SEA was used to assess the relationship between outbreak initiation and moisture stress of the host trees. Instead of considering individual disturbance events of a long time series, outbreaks of different regions were used. SEA shifts each region’s climate time series, so that outbreak initiation years are aligned, and then computes the mean climate time series across the regions. Time series from individual regions used in the SEA were inspected to ensure that the mean was not strongly influenced by highly anomalous regions. Confidence intervals defining the range of average climate conditions were produced by bootstrapping the climate data of each region from 1960 to 2015 using 1000 samples, randomly permuting outbreak years for each sample. We computed 90% and 95% confidence intervals. Actual climate values that exceed these intervals indicate years that are statistically significantly different from average conditions. Data from the Northwest (NW, five regions: Regions 2–6), and Southwest (SW, three regions: Regions 7, 8, and 10) were analyzed separately to ascertain any difference. Regions 1 and 9 were not included in the SEA because their initiation years occurred before the beginning of the available ADS data.
To study the relationship between defoliation area and moisture during the continuation stage, growth rates of defoliation area were calculated and analyzed with different climate metrics. Like many organisms, it is changes in insect populations, not the insect populations themselves, that respond to climate or other influences [32]. That is, climate can be related to population changes, not to population sizes. Population dynamics are often represented by an exponential function, which leads to growth rates being represented by the current year population relative to the population in the previous year [32]. We used the adjusted defoliation area as an indicator of the WSBW population. The annual growth rate was calculated with the formula:
where R(y) is the growth rate in year y, ADA(y) is the adjusted defoliation area, and ADA(y − 1) is the adjusted defoliation area in the previous year.
Plots of R versus anomalies of moisture stress illustrate growth rate responses to conditions wetter or drier than normal. We computed linear regressions and associated R2 values to evaluate the strength of these relationships. We considered relationships using drought metrics during different times of the year, including spring (March–May, and individual months), summer (June–August), and the water year (October of one year through September of the next year).
3. Results
3.1. Characteristics of the Study Regions
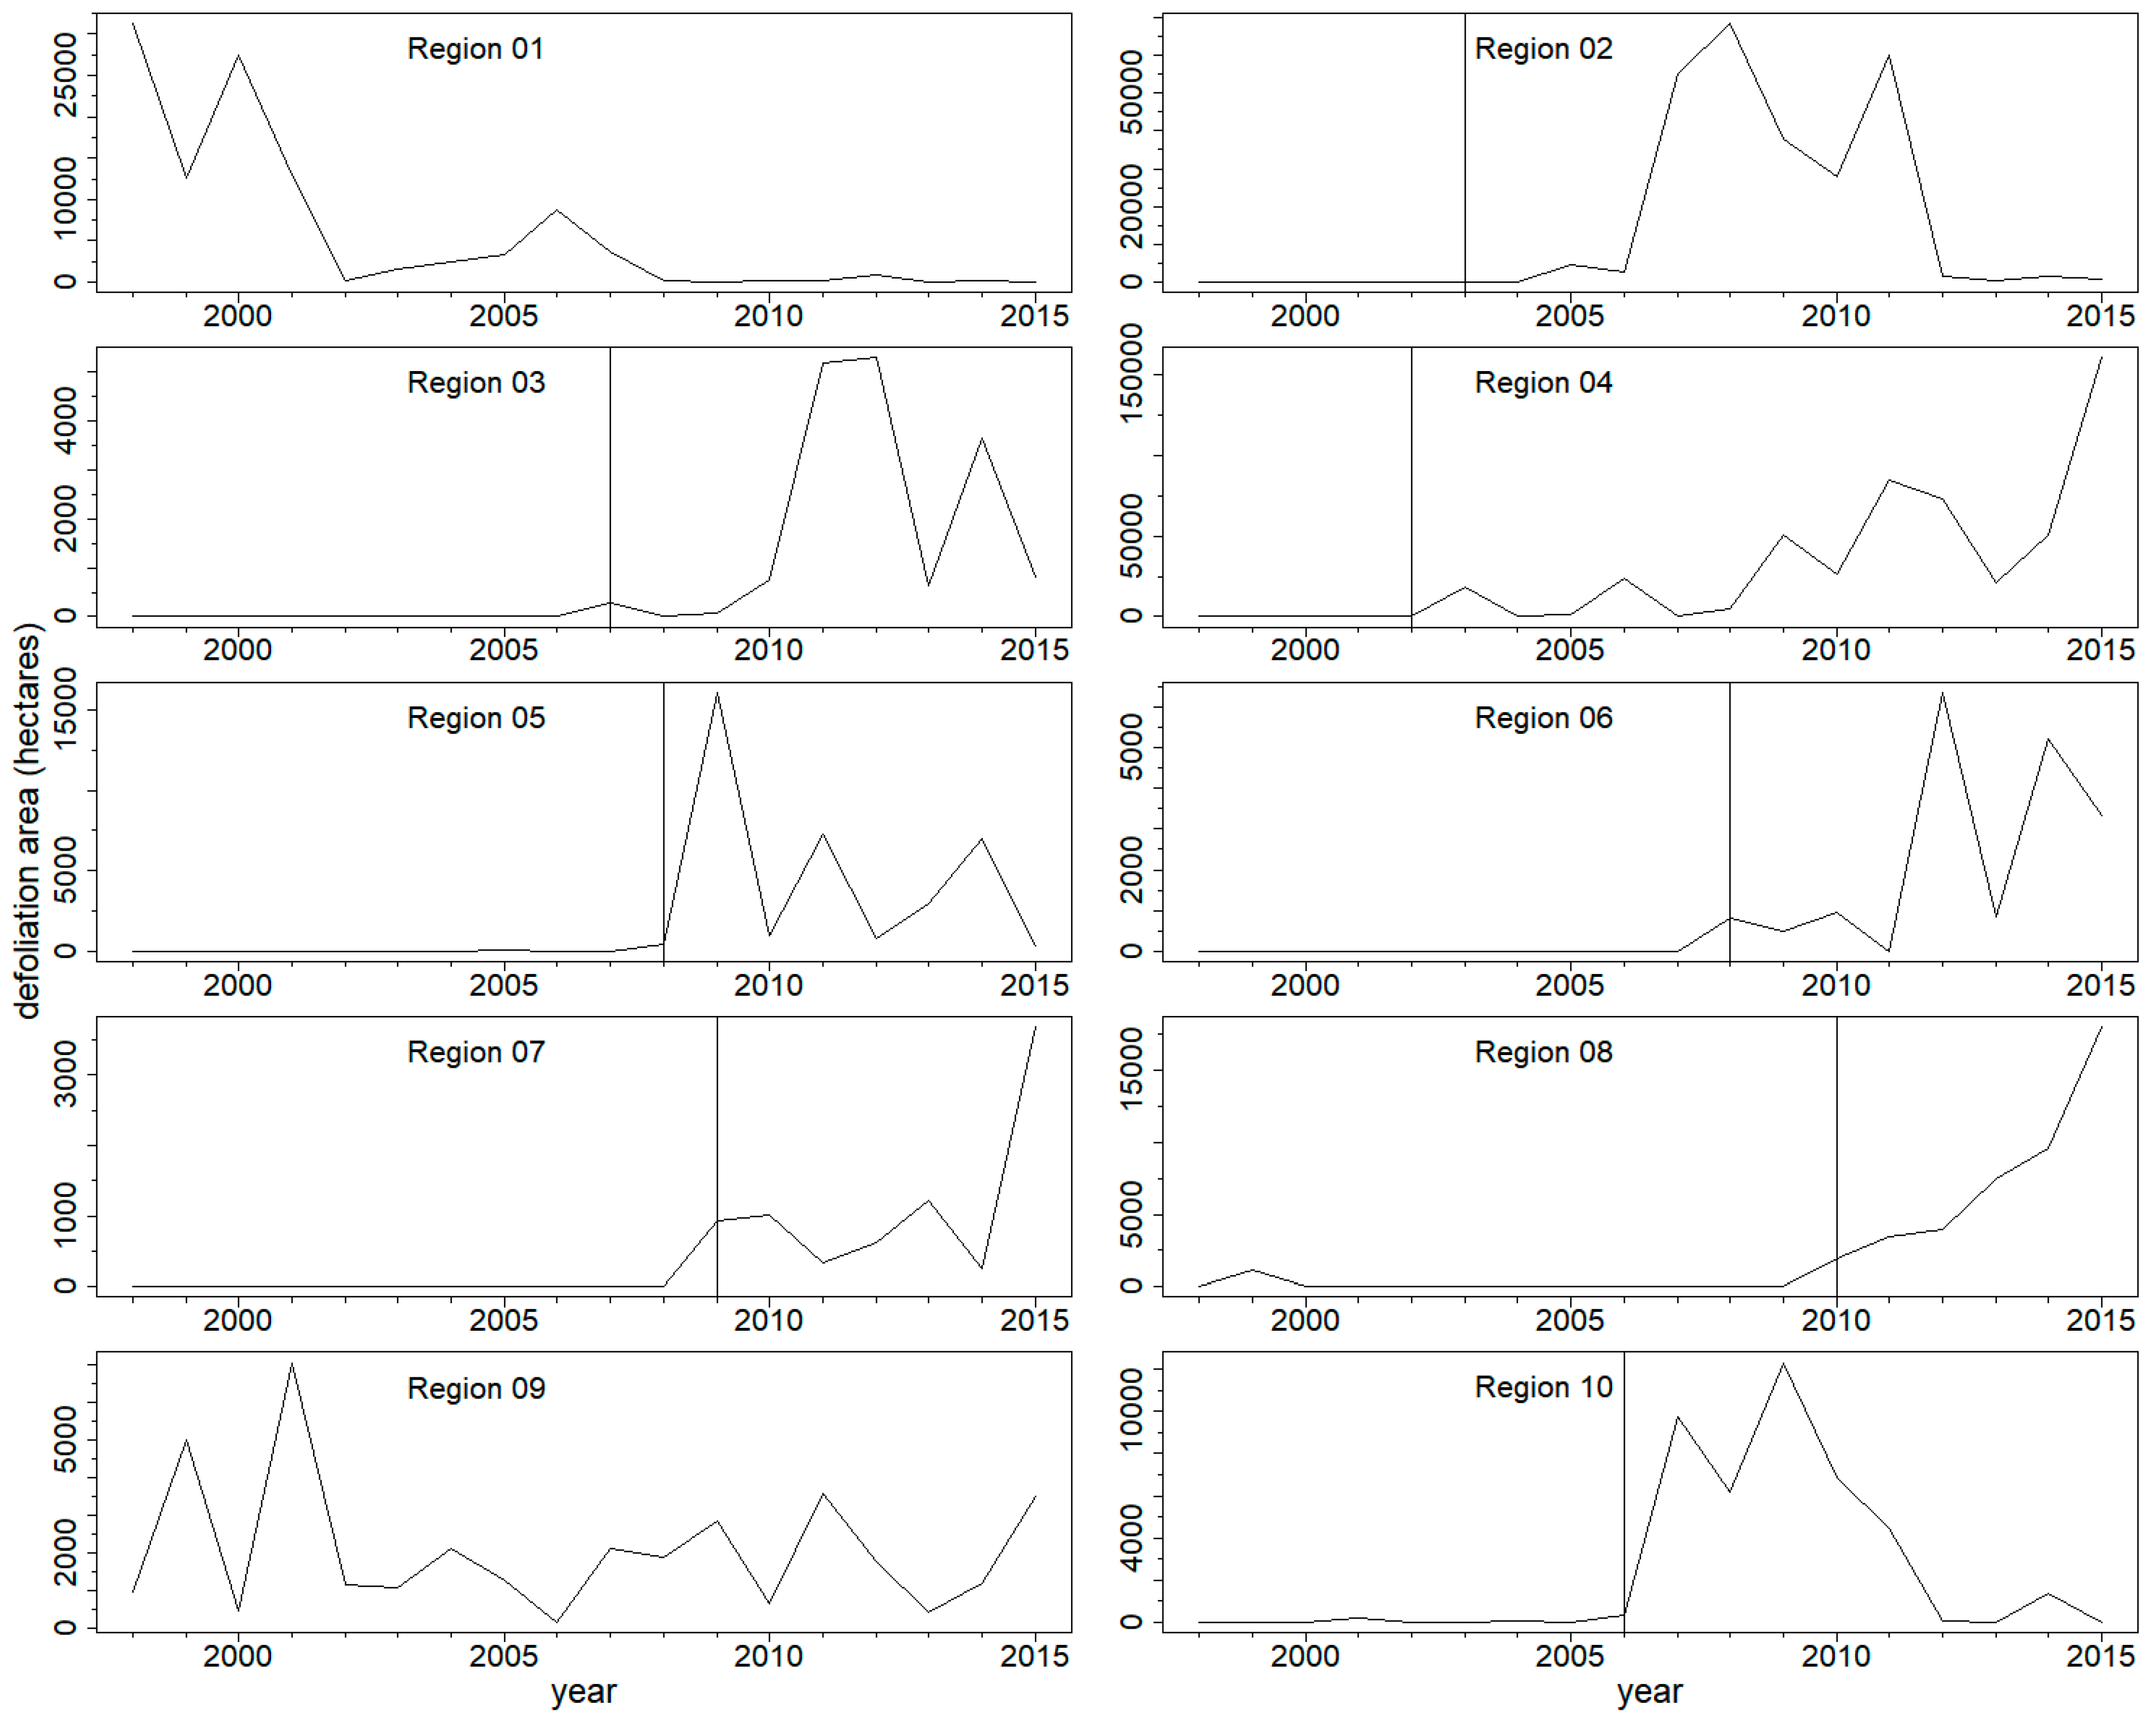
Adjusted defoliation areas in the selected regions indicated outbreaks of WSBW at different times for different regions throughout the study period (Figure 2). Outbreaks were in progress at the beginning of the survey period (Regions 1 and 9), began and ended within the period (Region 2), or began and continued through the end of the survey period. Outbreak length was 6–7 years or longer in each region, with some regions having substantial defoliation for almost a decade.
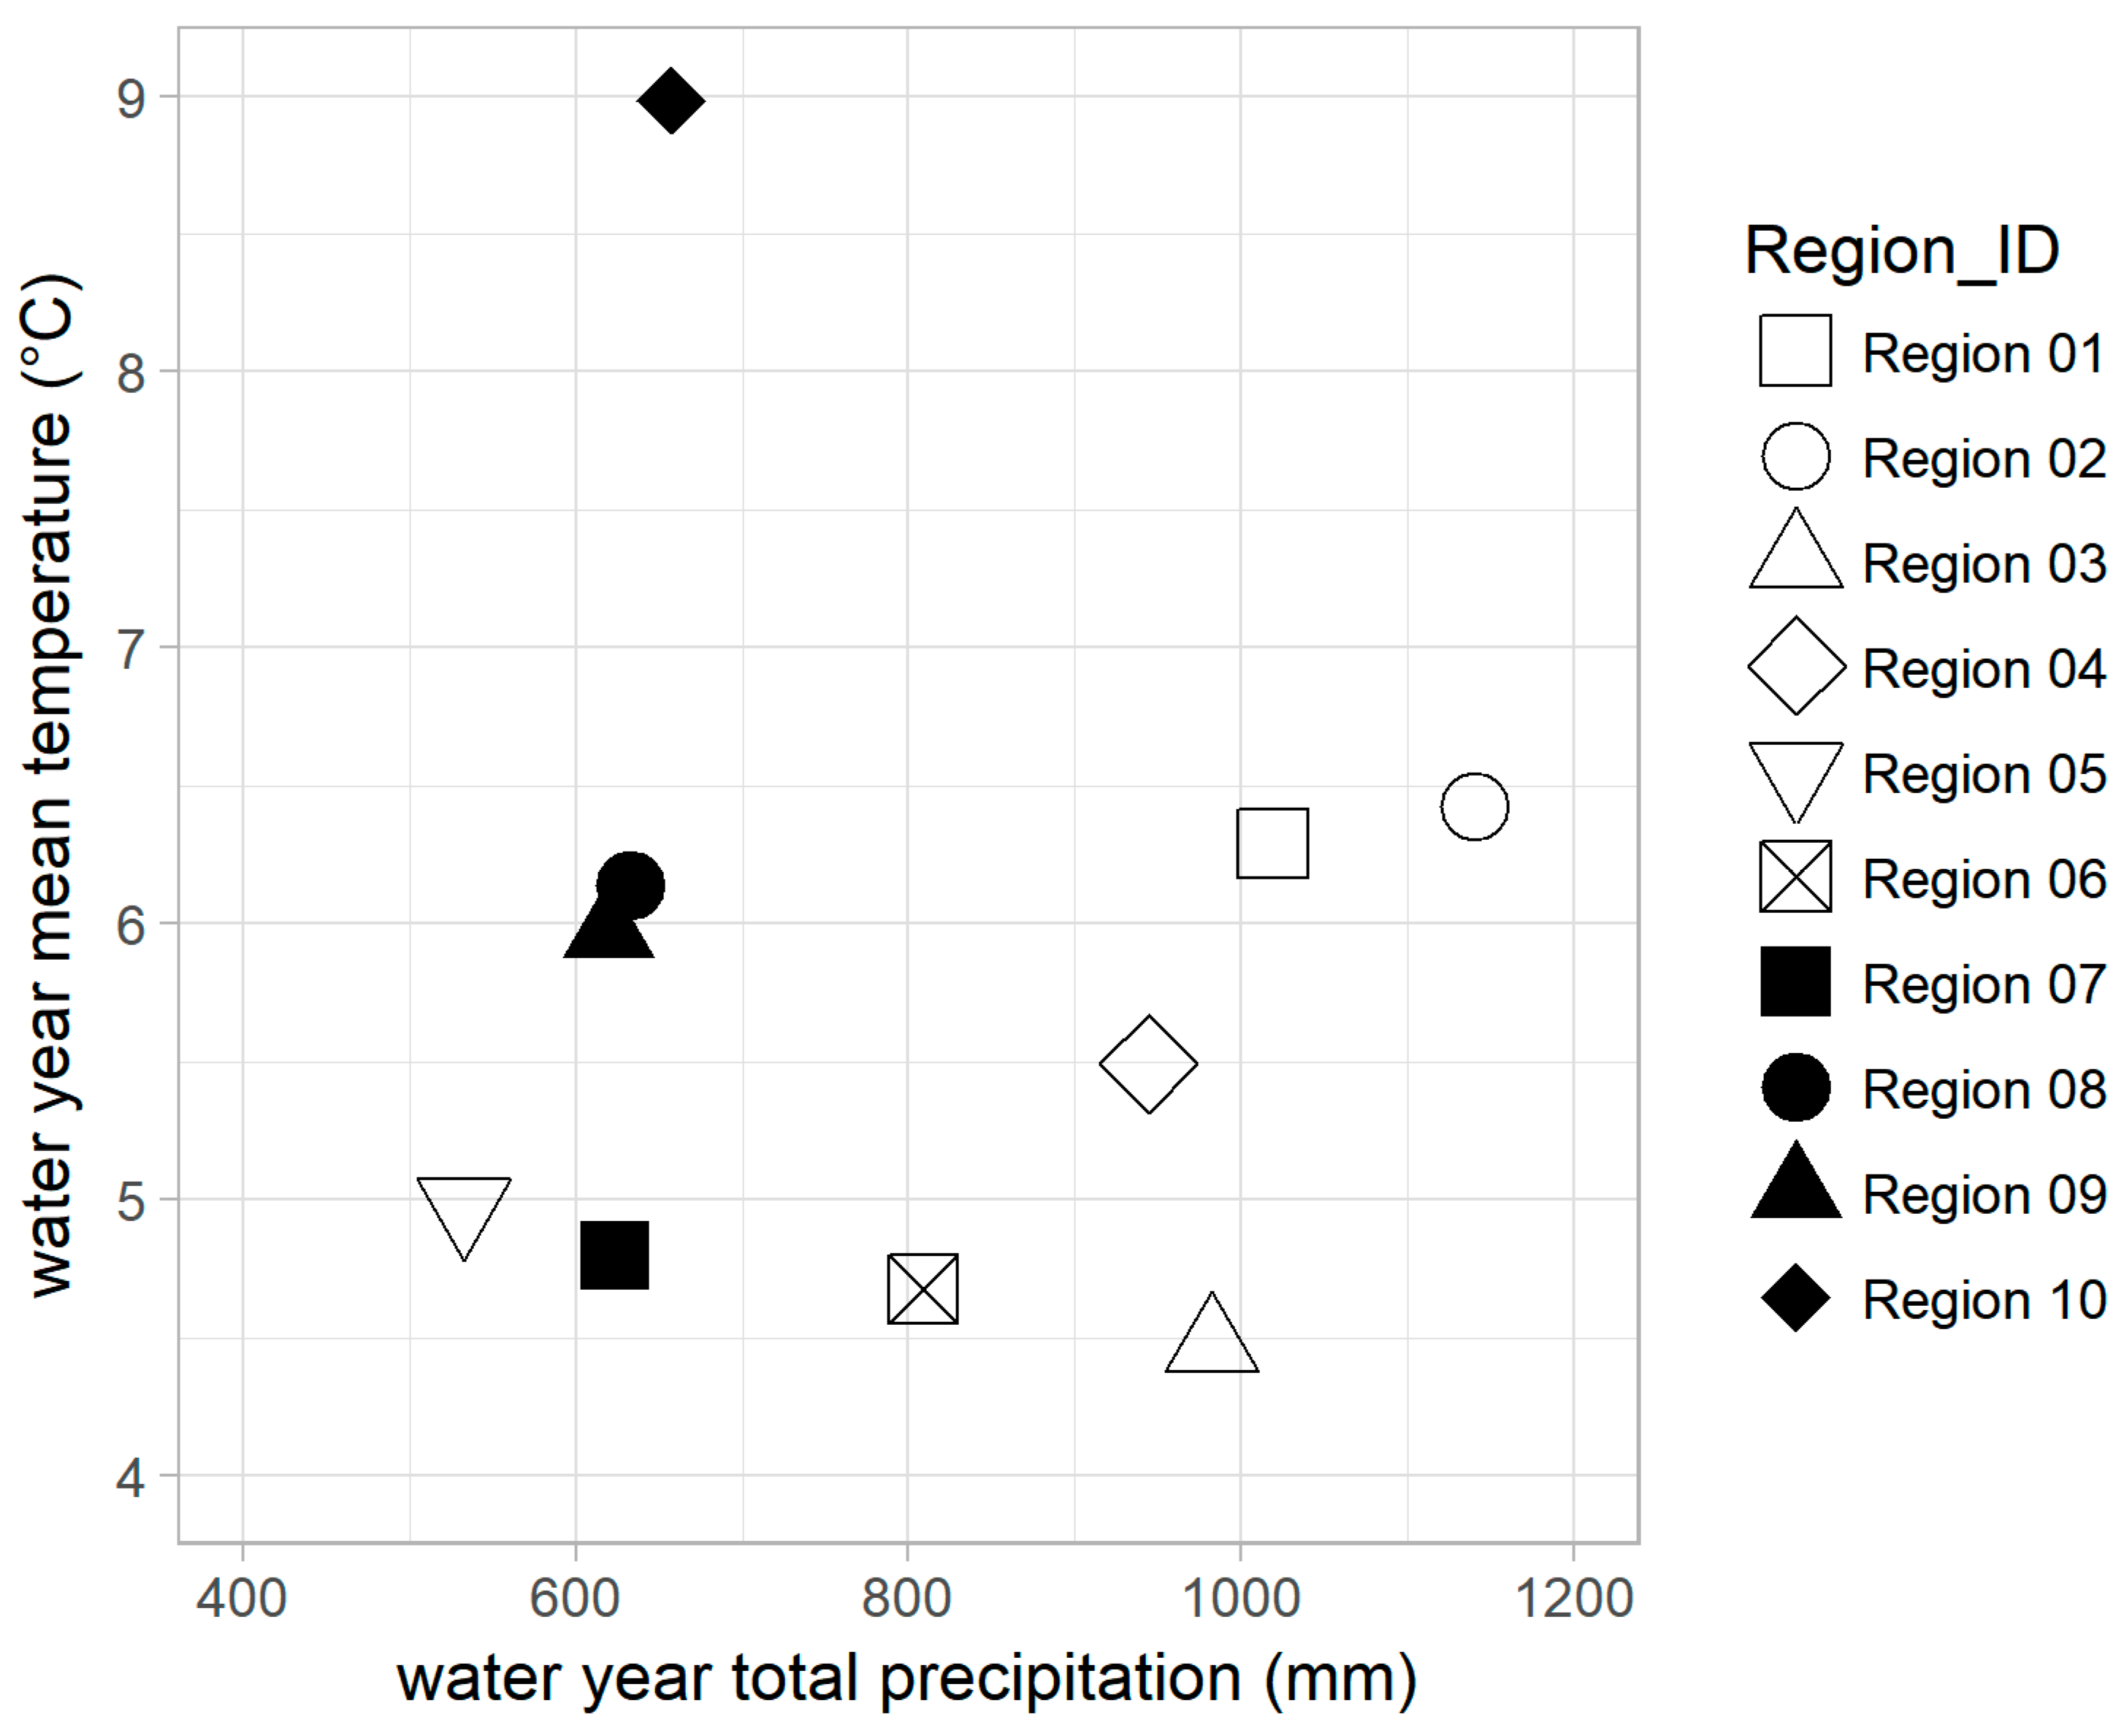
Generally, regions in the Northwest received more precipitation (434–1588 mm per year) than the Southwest (319–930 mm per year) (Figure 3). Region 5 (533 mm per year), was an exception: it is in the Northwest and also the driest region. Mean annual temperatures ranged from 3.3 °C to 8.2 °C in the Northwest, and 4.0 °C to 9.9 °C in the Southwest. Region 10 was the warmest region (9.0 °C), due in part to its southernmost location.
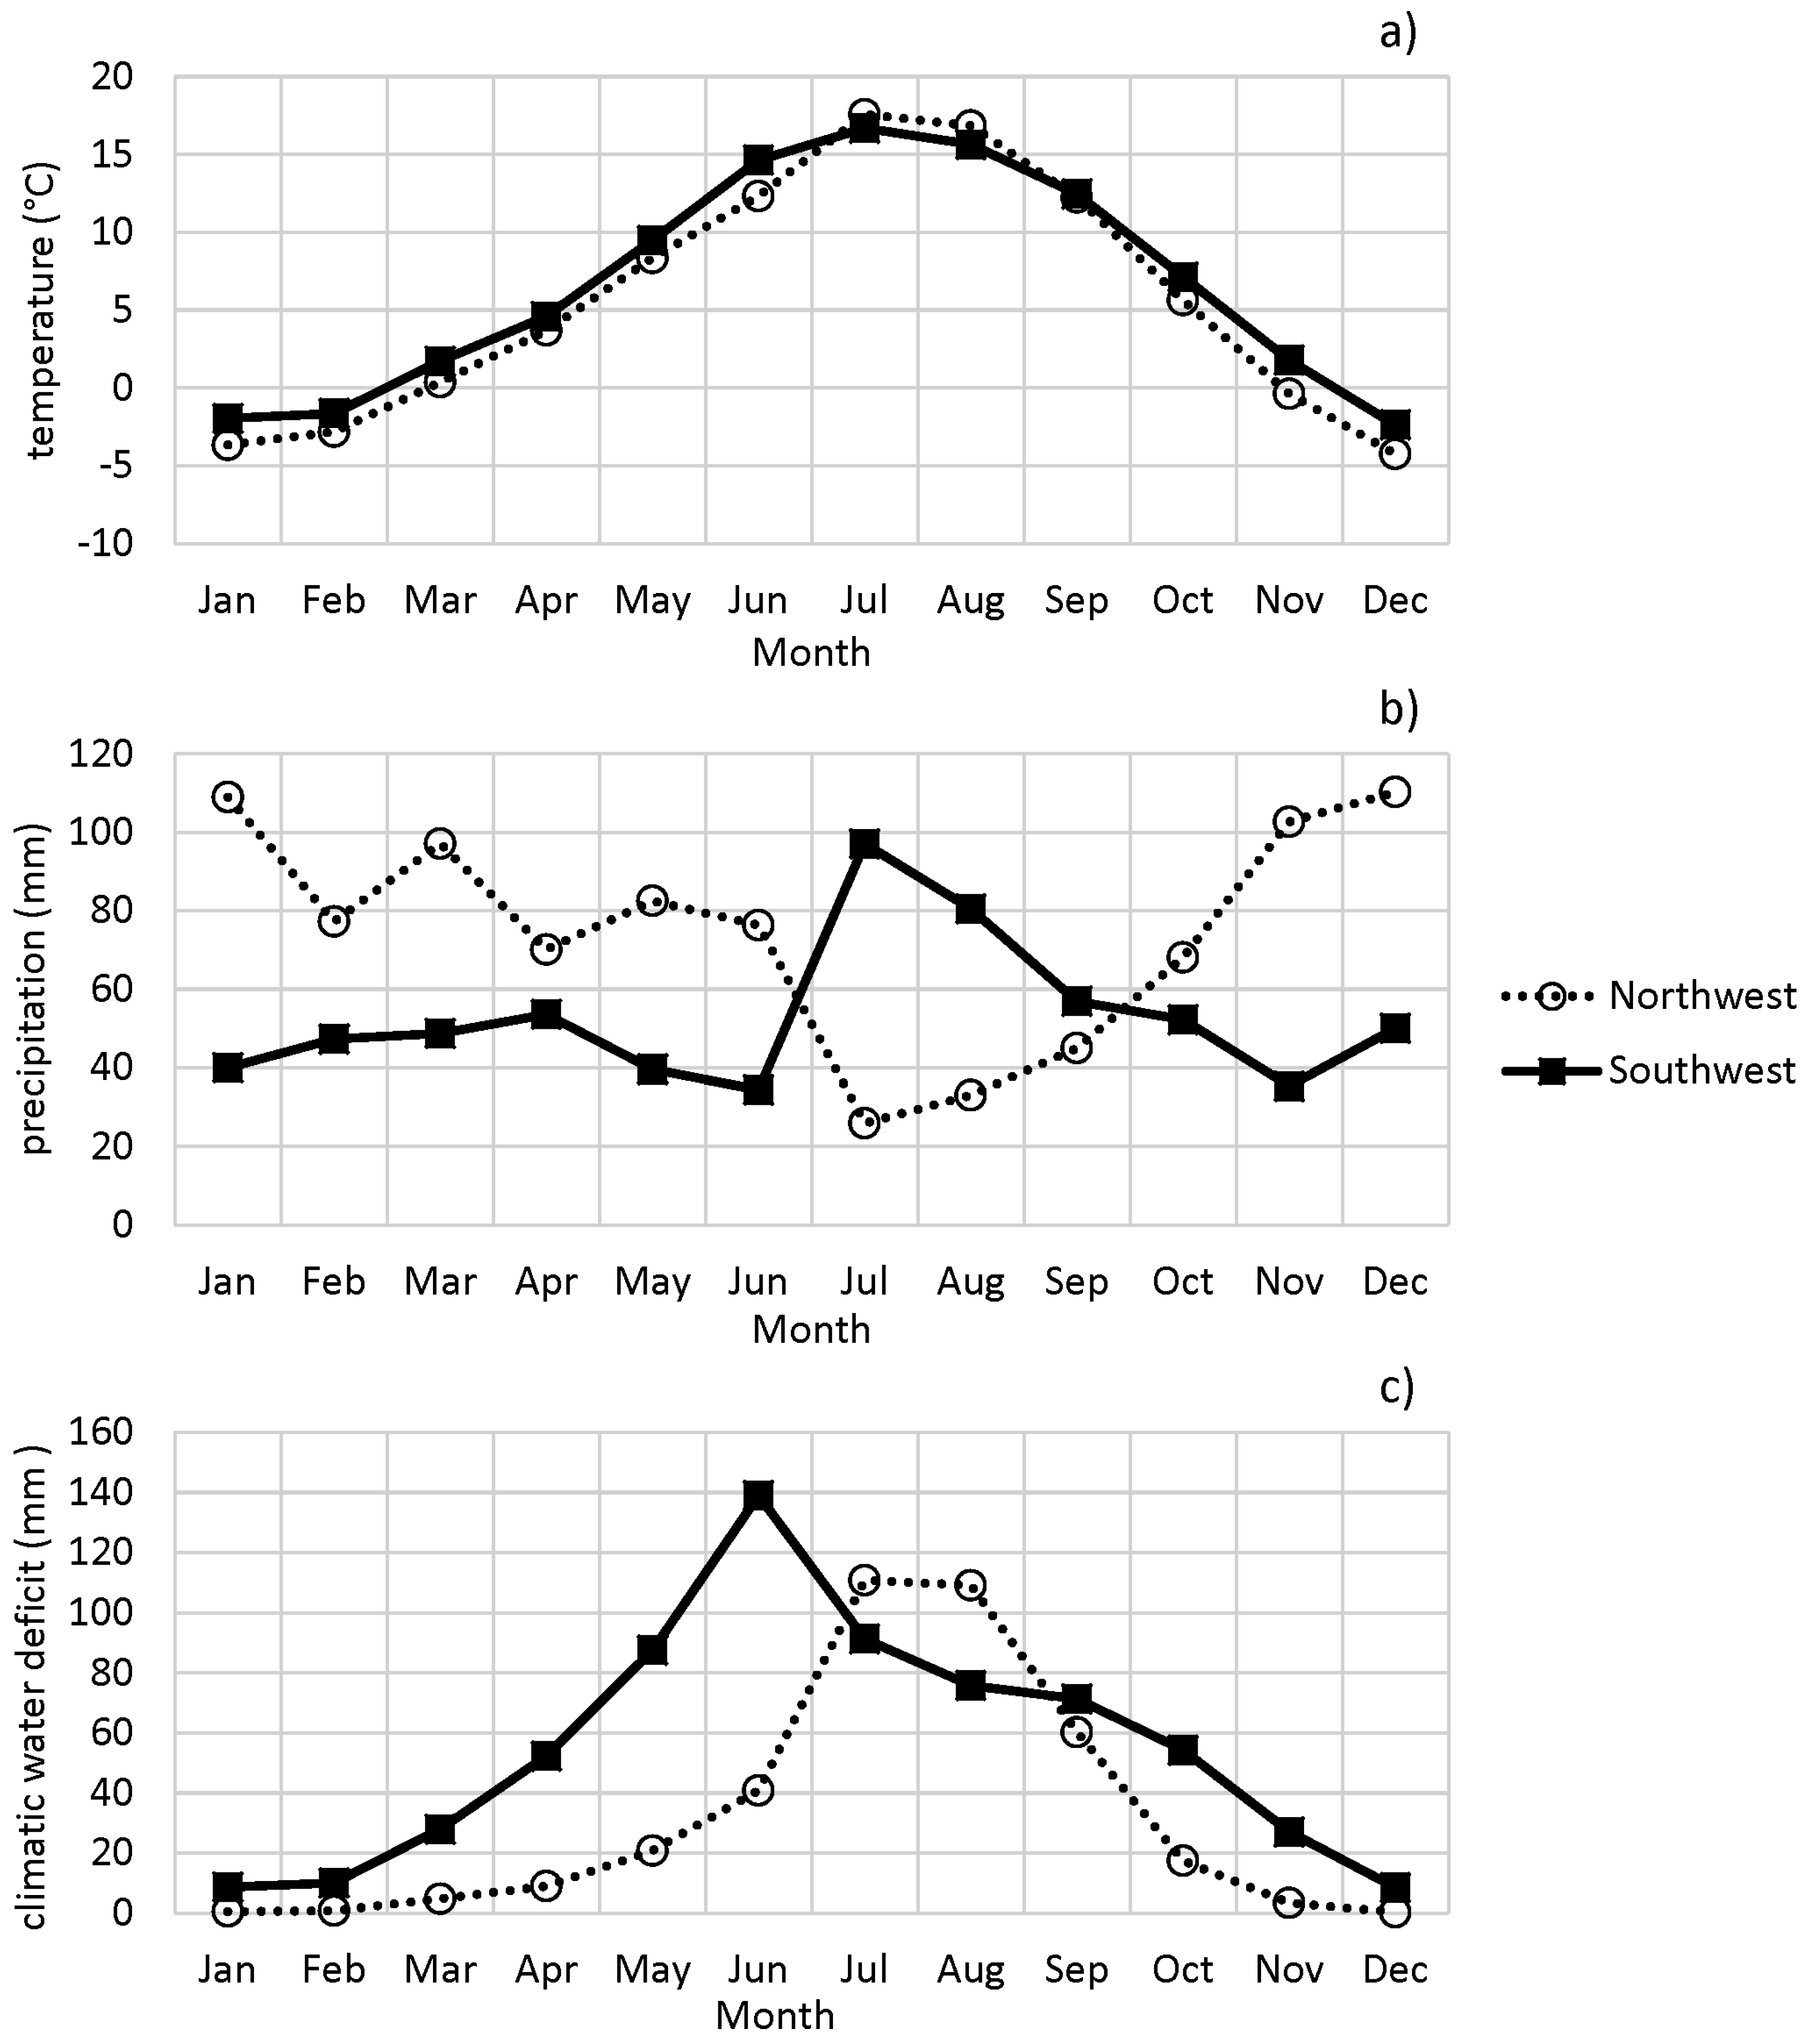
Monthly temperatures in the Southwest were slightly higher than in the Northwest throughout the year, except in July and August (Figure 4, and Figure S1, Supplementary Materials). A key difference between regions in the Northwest and Southwest is the annual cycle of precipitation. The Northwest had substantially higher precipitation than the Southwest from January to June and from October to December. The Southwest receives precipitation from the North American monsoon from July through September when the Northwest is typically dry. Monthly CWD patterns reflected these patterns of temperature and precipitation. In regions in the Northwest, CWD was elevated primarily from June to September, with peaks in July and August. In contrast, Southwest CWD was higher throughout most of the year, most notably during late spring and early summer before monsoonal moisture. The water year total CWDs were 359 mm averaged for sites in the Northwest and 638 mm averaged for sites in the Southwest, indicating the more arid conditions of the Southwest.
3.2. Outbreak Initiation, Climate, and Superposed Epoch Analysis
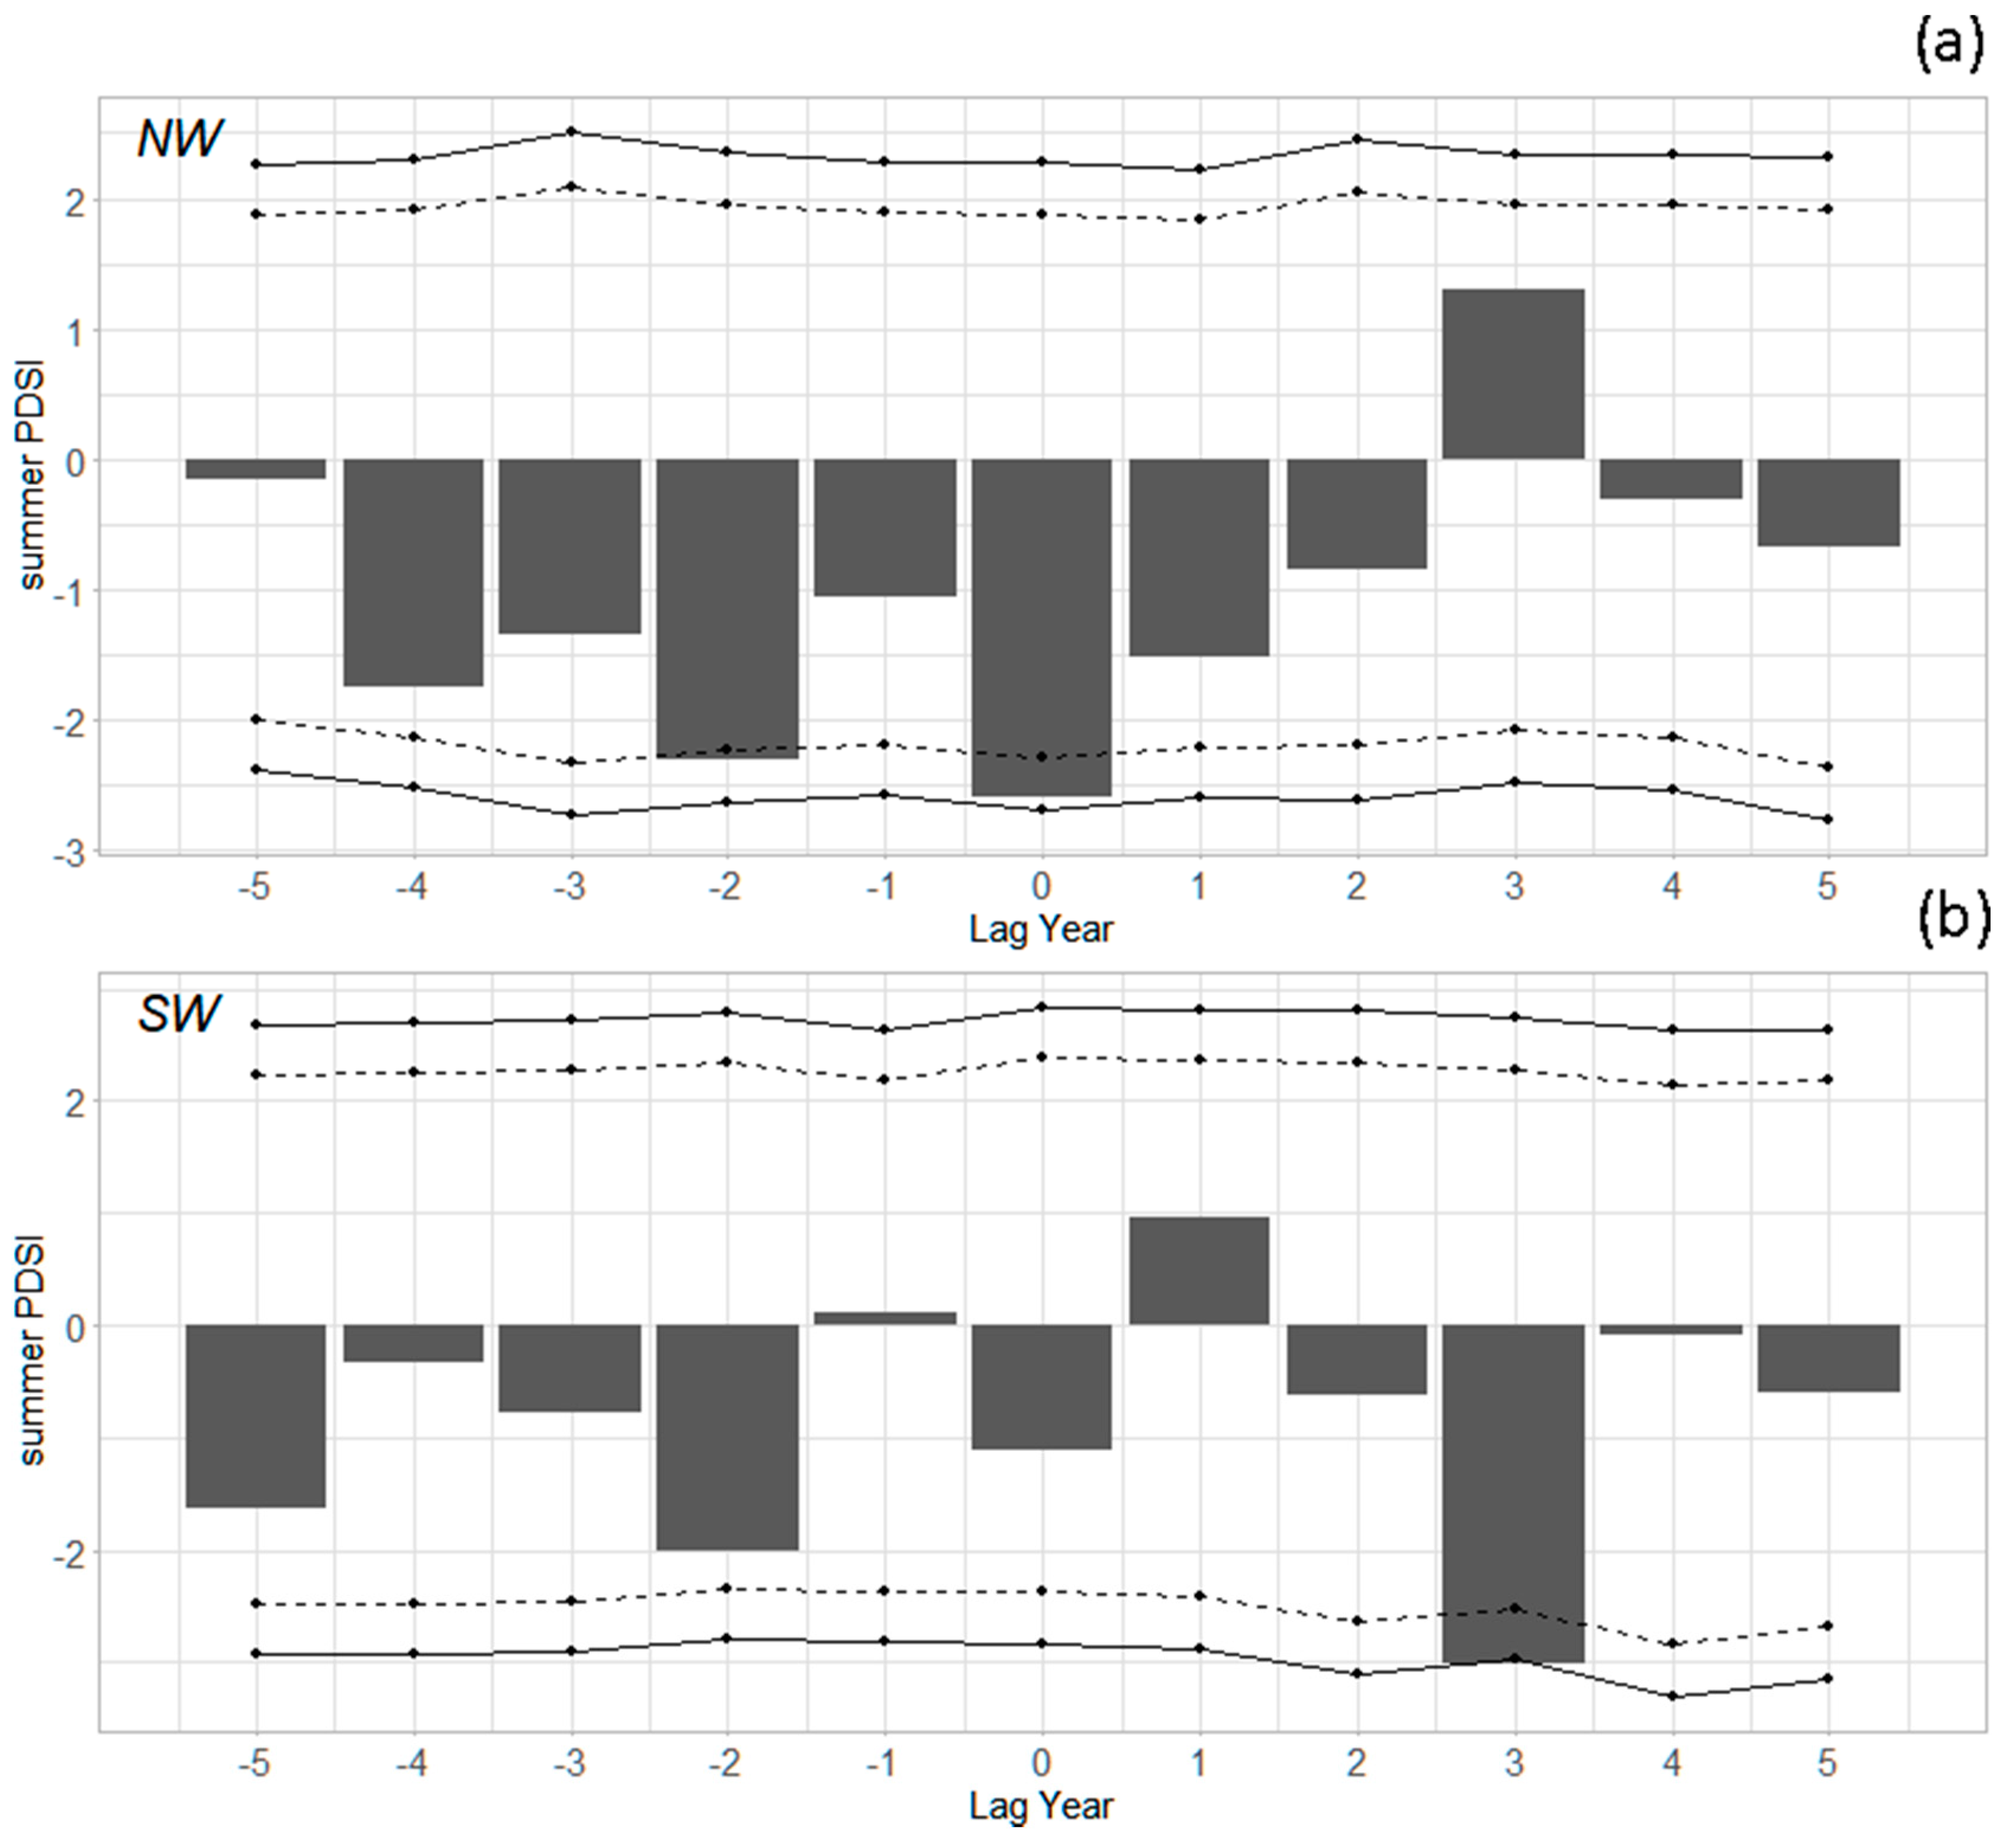
To assess the role of drought and moisture during outbreak initiation, we compared superposed epoch analyses using different moisture indices. Summer (June–August) PDSI in the Northwest (five regions; we could not define an initiation year for Region 1) was very low in the year of outbreak initiation (Figure 5a; statistically significantly different from 0 at the 90% confidence level). Summer PDSI was low in each of the four years prior to initiation, particularly two years prior (also significant at the 90% confidence level). For the Southwest (three regions; no initiation year for Region 9), the role of drought was less clear: PDSI was slightly negative in the year of initiation and for a few of the prior years, but not in the year before initiation (Figure 5b). Water year and other seasonal PDSI metrics showed similar results.
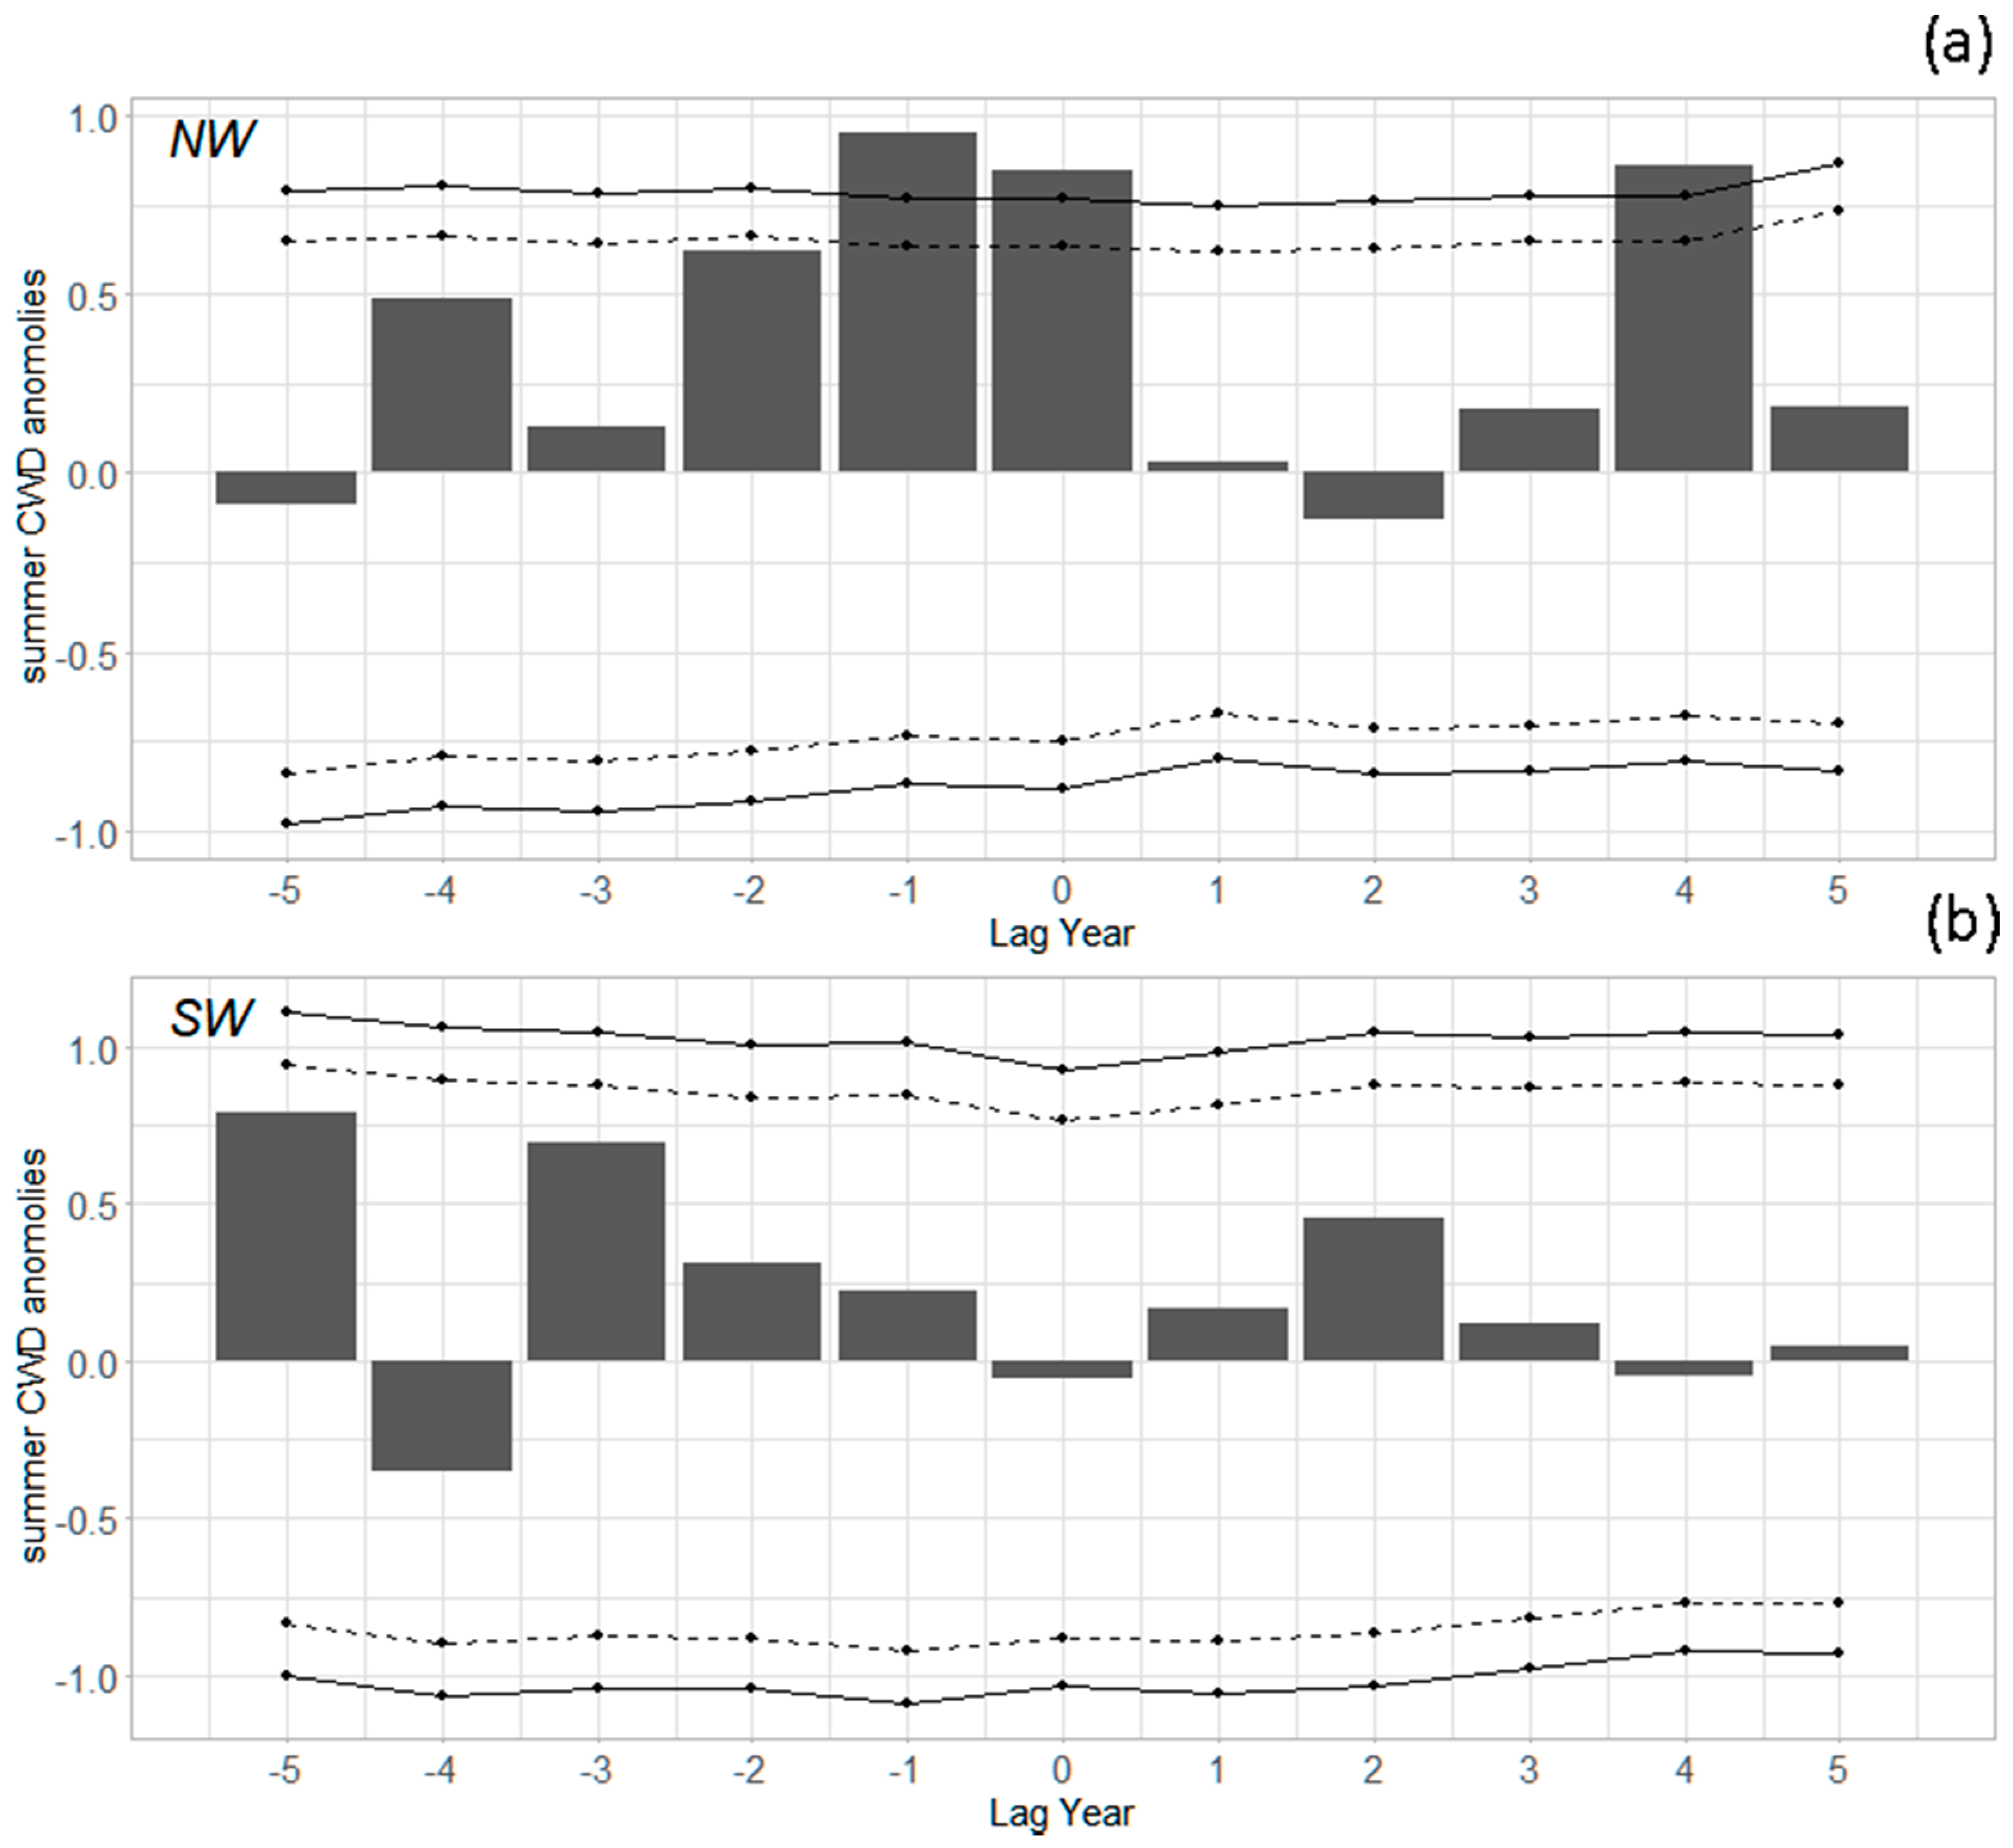
A similar, though somewhat stronger, pattern occurred for CWD (Figure 6). For the Northwest, summer CWD was above the 1960–2015 average in the initiation year and the two years prior, with the year of initiation and year before statistically significantly different from 0 at the 95% confidence level (Figure 6a, and Table S2, Supplementary Materials). In the Southwest, CWD in the year of initiation was slightly negative (wetter) than the average, with slightly drier years in earlier years (Figure 6b). Water year CWD showed a similar trend compared to summer CWD.
3.3. Growth Rates and Climate
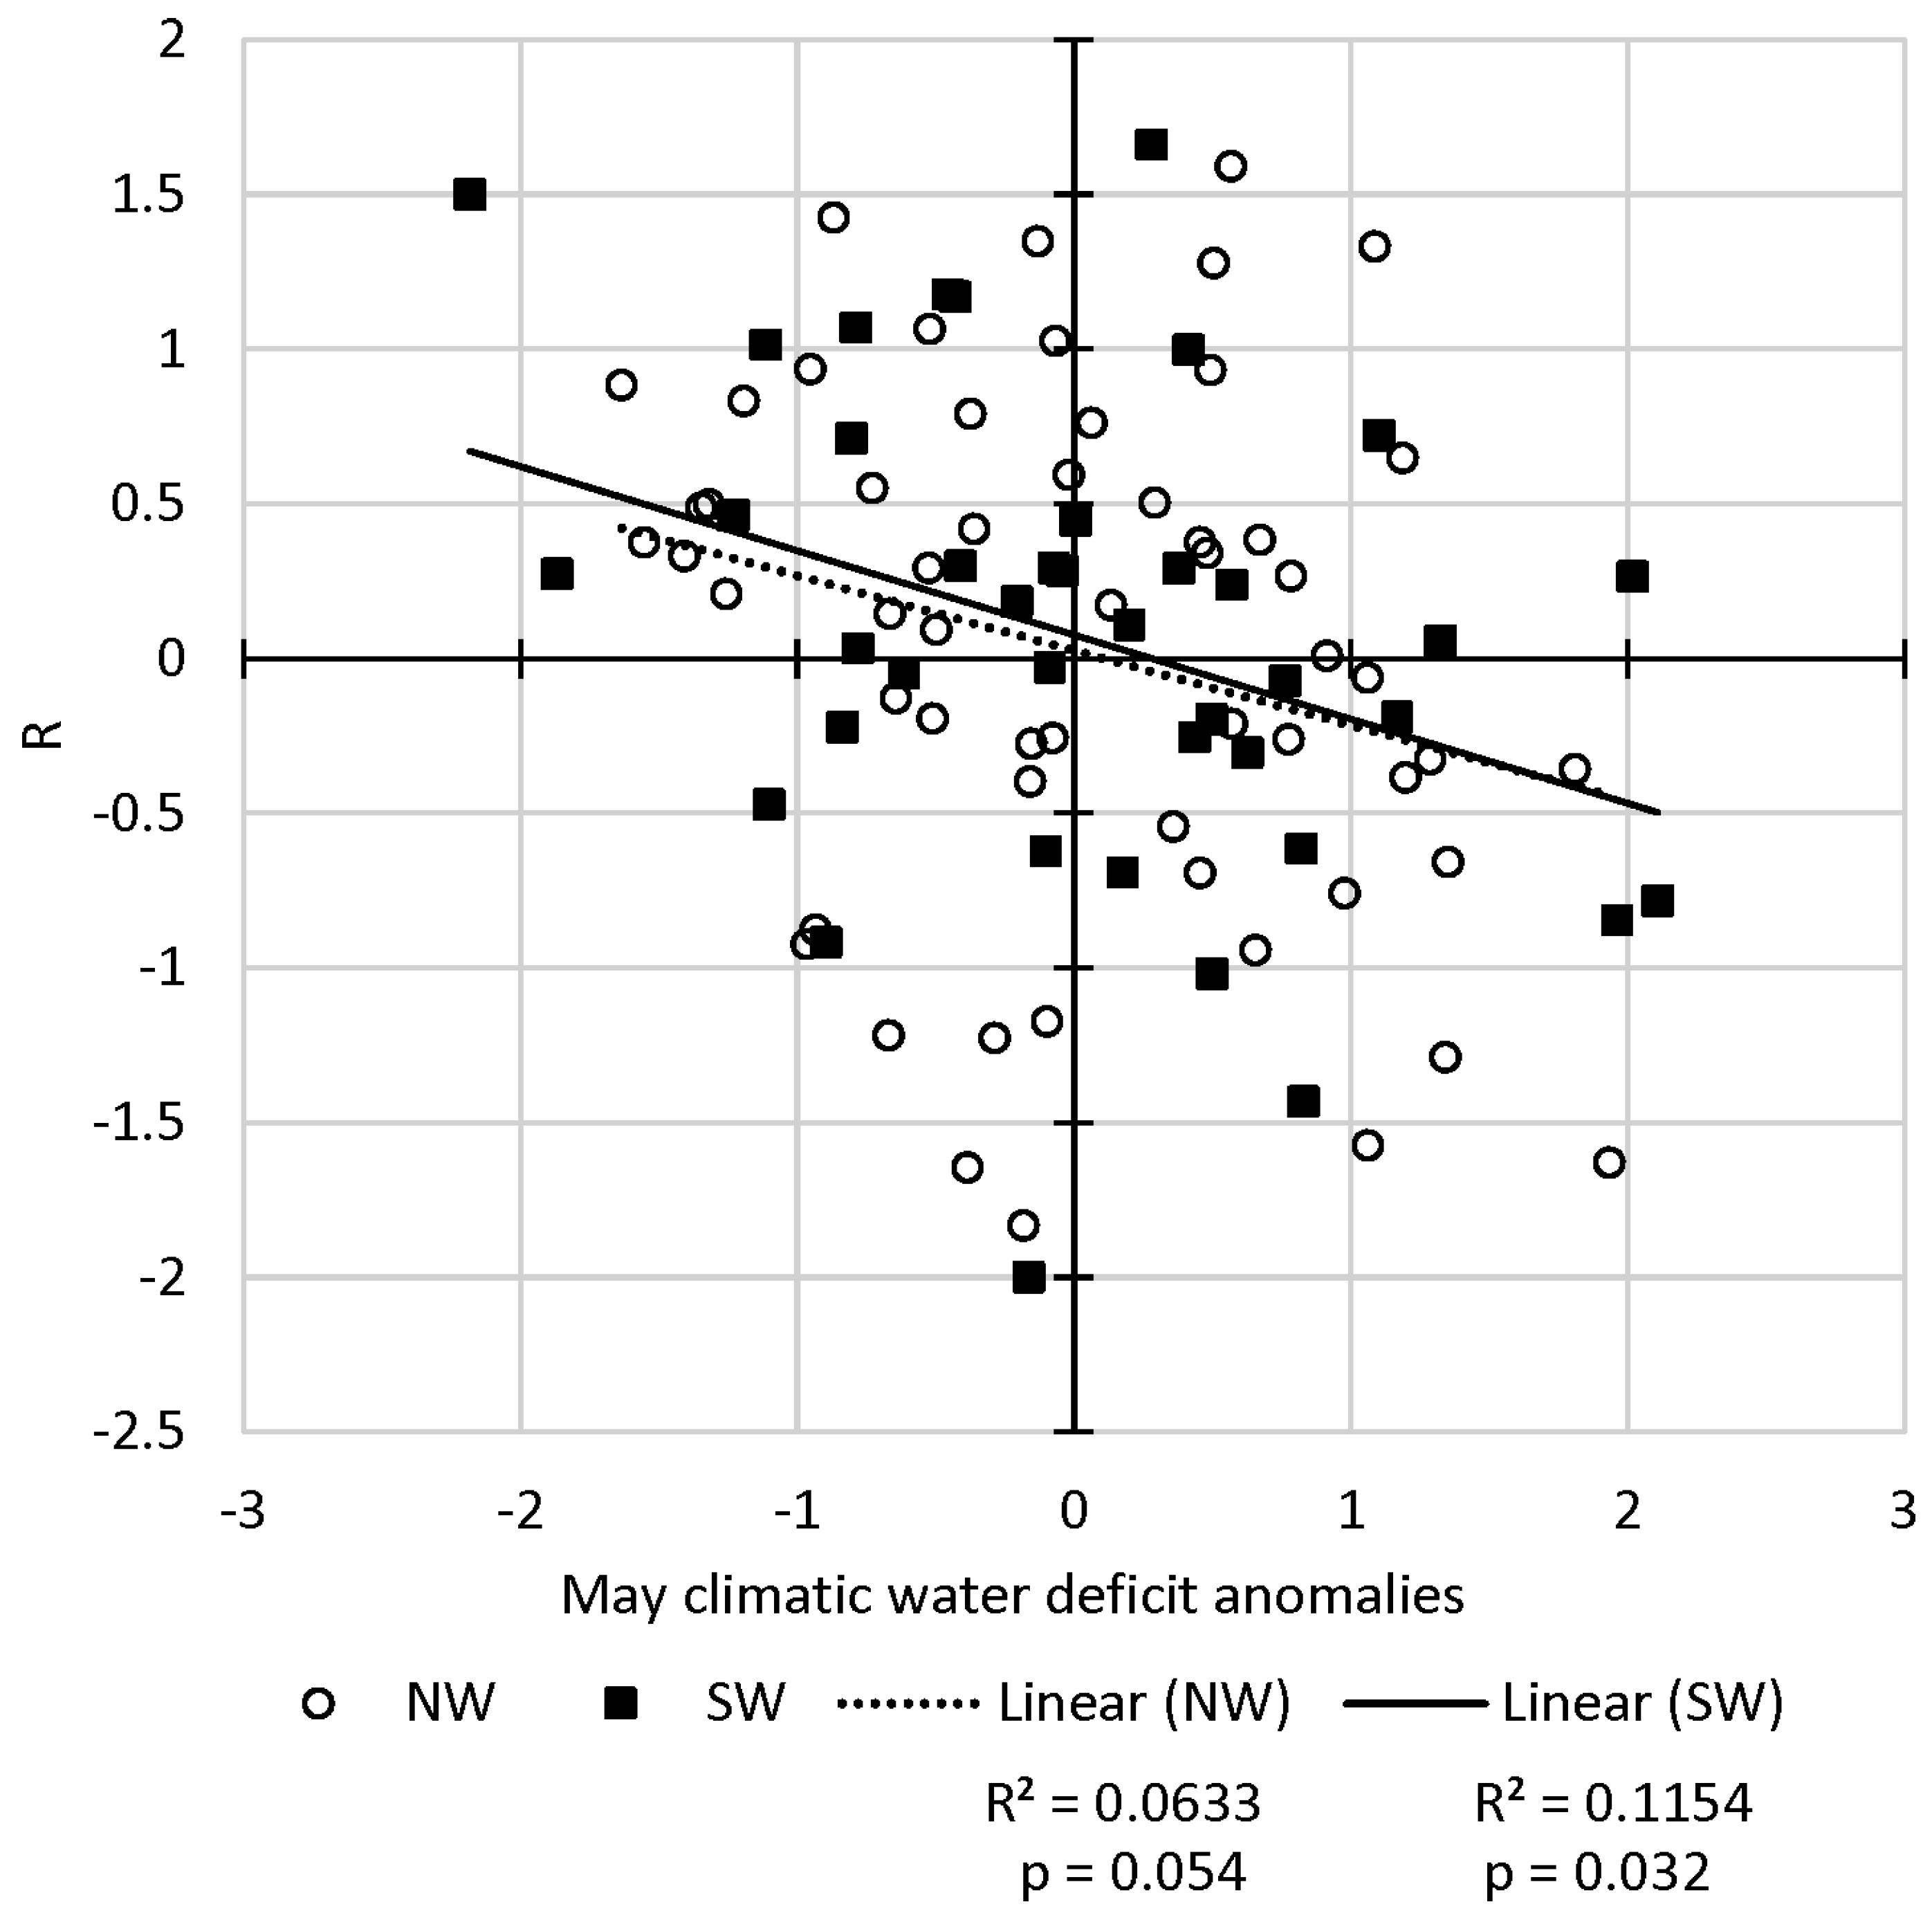
In spring, growth rates showed weak correlations with different May moisture indices, and the correlation with CWD in the Southwest was the strongest among these (R2 = 0.12, p = 0.032) (Figure 7). Weak correlations and positive relationships with moisture were found for the Northwest and when using multiple months during spring (March–May and April–May). Correlations with different summer moisture indices resulted in very low R2 values (Figures S2 and S3, Supplementary Materials), with similarly low R2 when using indices in other seasons and for the water year. These findings are confirmed by inspecting the superposed epoch analyses (Figure 5 and Figure 6) in the years following outbreak initiation.
4. Discussion
The role of drought in initiating outbreaks of WSBM varied from the Northwest to the Southwest. Relatively dry conditions were present for several years and continued into the initiation year for WSBW outbreaks in the Northwest, suggestive of the influence of chronic drought. Unlike the role of drought in initiation, defoliation area growth rates (representing insect population growth rates) did not show any apparent relationship between moisture and outbreak continuation in the Northwest. In contrast, outbreak initiations in the Southwest were not associated with a significant drought signal in the years leading up to or during outbreak initiation. Defoliation area growth rates exhibited only weak relationships to drought or moisture metrics. For the strongest of these relationships, May CWD, drier conditions were associated with decreases of defoliation area, suggesting that the continuation stage of an outbreak may be facilitated by reduced moisture stress.
The influence of drought in the Northwest agrees with multiple previous studies of these insects in the same geographic area, which reported that drier conditions and moisture stress were beneficial for the initiation of outbreaks through the increase of foliage nutritional quality [5,18,20]. The lack of drought signal during the continuation stage may have been caused by other biotic or abiotic factors that influence WSWB populations, which masked any relationship between growth rate and climate. These other factors include conspecific competition, dispersal, and predation, and are very challenging to represent given the scales of interest and available data in this study.
Our findings of the negative role of drought on WSBW outbreaks in the Southwest confirm previous dendrochronological studies conducted in Colorado and New Mexico [6,7]. Reductions in overall foliage amount and foliage palatability occur during drier conditions. Spring conditions in the Southwest are very moisture-stressed, particularly relative to the Northwest (Figure 4). Thus, the additional moisture during the beginning of the growing season in the Southwest may allow trees to allocate more carbon to the aboveground portion and thus provide more food to the newly emerged budworm larvae, increasing their survival rate [33].
Comparisons of climate variables indicate why drought plays a role in WSBW outbreaks in the Northwest, not in the Southwest. Regions in the Southwest are drier in terms of annual precipitation (Figure 3) and, importantly, are different in terms of the seasonal cycle of moisture stress (Figure 4). Winter and spring precipitation are substantially reduced in the Southwest compared with the Northwest, and temperatures are higher through June. Inspection of the seasonal cycle of temperatures suggests that the growing season begins in April or May in both the Southwest and Northwest. CWD is much higher during this period in the Southwest compared with the Northwest, suggesting host trees are more stressed in the Southwest during this critical time for bud growth and larvae feeding. Outbreaks in the Southwest, therefore, were facilitated by relief from drought in the spring and higher foliage quantity and palatability. In contrast, outbreaks in the wetter Northwest, where hosts are less stressed in typical years, may have been facilitated by reduced moisture that increases foliage nutritional quality.
Two different moisture metrics were used in this study to present host stress. Multiple previous studies used PDSI as their primary indicator of moisture stress [5,7,19,20,21]. A disadvantage of PDSI is that it does not distinguish between snow (which may stay for months before melting and delivering moisture to host trees) and rain in water balance accounting. For regions studied here, this issue may be problematic for representing the influences of winter, and spring moisture on host trees stress and outbreaks of WSBW. Summer PDSI may more accurately represent stress conditions during this season since it is less affected by snow than spring and winter PDSIs, although the serially correlated nature of PDSI may entrain biases from winter precipitation type into the summer months. We also considered CWD as another indicator of host tree stress. Unlike PDSI, CWD represents the impact of snow and snowpack melt on soil moisture, which makes it especially useful for regions used in this study. PDSI and CWD analysis showed very similar patterns, but CWD exhibited a slightly stronger drought influence on outbreak initiation. More data, such as local phenological observations, tree conditions, and snow water equivalent, might be used to refine the time period of budworm emergence relative to budburst and improve the representation of moisture influences.
Short-term extreme weather events such as heavy rain or abnormally high fall temperatures may decrease the WSBW population [1,4], although the influence of those events was not captured by the analysis of this study. It is possible that the study period was too short such that these events were not present during the study period, or that the monthly data used here lack the necessary temporal resolution to detect these short-term events.
We selected the climate and insect data sets for use in this study because they were available over broad spatial and temporal scales, although they are imperfect representations of the processes of interest. The gridded climate data set was developed using various weather data, including station observations. Spatial interpolation was used to fill in gaps, and this interpolation, together with the 4-km spatial resolution, leads to some uncertainty in areas with complex topography. The aerial survey data were recorded by different surveyors for different forest regions and different years, and this subjectivity may introduce some error. Another limitation of the ADS data is that although these data are from a wide geographic region, they are available for a relatively short period, especially compared with those in dendrochronological studies. The area covered by surveys also varies every year, which limited regions that can be used for researches of continuous events. Areas that are not covered also reduce the accuracy of estimation of insect populations, due to the missing data in some years. This study used defoliation area change as an indicator of insect population dynamics and adjusted the area to include the influence of different severities of defoliation. Damage area represents insect populations at a coarse level, but may also miss critical time periods such as initiation. Actual measurements of insect populations over larger areas and long periods are unavailable. We analyzed outbreaks in Douglas-fir forests, the major host species of WSBM; future studies could assess drought influences in other host species such as subalpine fir.
5. Conclusions
This study analyzed the relationship between drought and recent outbreaks of WSBM and compared patterns in the Northwest and the Southwest. In contrast to past studies that used dendrochronological methods and PSDI, we compared outbreak information from aerial surveys across the western US to multiple drought metrics. The use of the survey data improved the precision of outbreak initiation years. Similar to past conclusions, we found that drought facilitates the initiation of WSBW outbreaks in the Northwest. In contrast, in the Southwest, which is on average drier, outbreaks were not associated with drought. No clear relationship existed between defoliation area growth rates after an outbreak begins (i.e., during the continuation stage) and moisture metrics in the Northwest, but in the Southwest, increases of defoliation area may have been related to higher spring moisture availability, although correlations were weak. Thus, other factors were more influential during the continuation stage than climate.
Increases in drought frequency are projected in the coming decades associated with future climate change [23]. Projected warming will lead to additional stress on plants through enhanced evapotranspiration, even in the absence of reduced precipitation, such that soil moisture is projected to decline in the western US [23,34]. Future precipitation is expected to increase in some areas of the western US in some seasons (with more uncertainty than warming), but critically, there is an intermodel agreement of reduced spring precipitation in the Southwest [35] and reduced summer precipitation in the Northwest [36]. The findings of this study suggest that we might expect additional severe outbreaks of WSBM in the Northwest in the near future, possibly leading to dieoffs similar to what has occurred in this region in the recent past. Given a warming climate projected in the coming decades, such dieoffs may accelerate succession of coniferous forest types to those better adapted to drier conditions. Such information can help inform management of forest types susceptible to defoliation by these insects.
Supplementary Materials
The following are available online at https://www.mdpi.com/1999-4907/10/4/354/s1, Figure S1. Average monthly climate of the Northwest and Southwest regions from 1997 to 2015, Figure S2. Western spruce budworm defoliation area growth rate R versus summer PDSI, Figure S3. Western spruce budworm defoliation area growth rate R versus summer of climatic water deficit, Table S1: Insect & Disease Detection Survey attributes used in this study, Table S2: Climatic water deficit anomalies of each region.
Author Contributions
Conceptualization, B.X., J.A.H. and J.T.A.; methodology, B.X. and J.A.H.; software, B.X. and J.A.H.; validation, B.X., J.A.H. and J.T.A.; resources, B.X., J.A.H. and J.T.A.; writing of original draft preparation, B.X.; writing of review and editing, B.X., J.A.H. and J.T.A.; funding acquisition, J.A.H.
Funding
This research was supported by the Glacier National Park Conservancy.
Conflicts of Interest
The authors declare no conflicts of interest.
References
- Fellin, D.G.; Dewey, J.E. Western Spruce Budworm; Forest Service: Washington, DC, USA, 1982.
- Williams, D.W.; Birdsey, R.A. Historical Patterns of Spruce Budworm Defoliation and Bark Beetle Outbreaks in North American Conifer Forests: An Atlas and Description of Digital Maps; General Technical Report NE-308; Forest Service: Newtown Square, PA, USA, 2003; p. 33. [CrossRef]
- Hicke, J.A.; Allen, C.D.; Desai, A.R.; Dietze, M.C.; Hall, R.J.; Hogg, E.H.T.; Kashian, D.M.; Moore, D.; Raffa, K.F.; Sturrock, R.N.; et al. Effects of biotic disturbances on forest carbon cycling in the United States and Canada. Glob. Chang. Biol. 2012, 18, 7–34. [Google Scholar] [CrossRef]
- Campbell, R.W. Population Dynamics of the Major North American Needle-Eating Budworms; Research Paper PNW-RP-463; Forest Service: Portland, OR, USA, 1993; p. 242. [CrossRef]
- Flower, A. Three Centuries of synchronous forest defoliator outbreaks in western North America. PLoS ONE 2016, 11, e0164737. [Google Scholar] [CrossRef]
- Ryerson, D.E.; Swetnam, T.W.; Lynch, A.M. A tree-ring reconstruction of western spruce budworm outbreaks in the San Juan Mountains, Colorado, USA. Can. J. For. Res. 2003, 33, 1010–1028. [Google Scholar] [CrossRef]
- Swetnam, T.W.; Lynch, A.M. Multicentury, Regional-Scale Patterns of Western Spruce Budworm Outbreaks. Ecol. Monogr. 1993, 63, 399–424. [Google Scholar] [CrossRef]
- Swetnam, T.W.; Lynch, A.M. A tree-ring reconstruction of western spruce budworm history in the southern Rocky Mountains. For. Sci. 1989, 35, 962–986. [Google Scholar]
- Kolb, T.E.; Fettig, C.J.; Ayres, M.P.; Bentz, B.J.; Hicke, J.A.; Mathiasen, R.; Stewart, J.E.; Weed, A.S. Observed and anticipated impacts of drought on forest insects and diseases in the United States. For. Ecol. Manag. 2016, 380, 321–334. [Google Scholar] [CrossRef]
- Huberty, A.F.; Denno, R.F. Plant water stress and its consequences for herbivorous insects: A new synthesis. Ecology 2004, 85, 1383–1398. [Google Scholar] [CrossRef]
- Mattson, W.J.; Haack, R.A. The role of drought in outbreaks of plant-eating insects. Bioscience 1987, 37, 110–118. [Google Scholar] [CrossRef]
- White, T.T. The abundance of invertebrate herbivores in relation to the availability of nitrogen in stressed food plants. Oecologia 1984, 63, 90–105. [Google Scholar] [CrossRef]
- Parks, C.G. The Influence of Induced Host Moisture Stress on the Growth and Development of Western Spruce Budworm and Armillaria Ostoyae on Grand Fir Seedlings. Ph.D. Thesis, Oregon State University, Corvallis, OR, USA, April 1993. [Google Scholar]
- Gower, S.T.; Vogt, K.A.; Grier, C.C. Carbon dynamics of Rocky Mountain Douglas-fir: influence of water and nutrient availability. Ecol. Monogr. 1992, 62, 43–65. [Google Scholar] [CrossRef]
- McMillin, J.D.; Wagner, M.R. Season and intensity of water stress effects on needle toughness of ponderosa pine. Can. J. For. Res. 1996, 26, 1166–1173. [Google Scholar] [CrossRef]
- Brewer, J.W.; Capinera, J.L.; Deshon, R.E.; Walmsley, M.L. Influence of Foliar Nitrogen Levels on Survival, Development, and Reproduction of Western Spruce Budworm, Choristoneura Occidentals (Lepidoptera: Tortricidae). Can. Entomol. 1985, 117, 23–32. [Google Scholar] [CrossRef]
- Hard, J.S.; Tunnock, S.; Eder, R.G. Western Spruce Budworm Defoliation Trend Relative to Weather in the Northern Region, 1969–1979. Available online: https://ir.library.oregonstate.edu/concern/defaults/1v53jz24t (accessed on 5 September 2017).
- Thomson, A.; Shepherd, R.; Harris, J.; Silversides, R. Relating weather to outbreaks of western spruce budworm, Choristoneura occidentalis (Lepidoptera: Tortricidae), in British Columbia. Can. Entomol. 1984, 116, 375–381. [Google Scholar] [CrossRef]
- Senf, C.; Wulder, M.A.; Campbell, E.M.; Hostert, P. Using Landsat to assess the relationship between spatiotemporal patterns of western spruce budworm outbreaks and regional-scale weather variability. Can. J. Remote Sens. 2016, 42, 706–718. [Google Scholar] [CrossRef]
- Flower, A.; Gavin, D.; Heyerdahl, E.; Parsons, R.; Cohn, G. Drought-triggered western spruce budworm outbreaks in the interior Pacific Northwest: A multi-century dendrochronological record. For. Ecol. Manag. 2014, 324, 16–27. [Google Scholar] [CrossRef]
- Thomson, A.J.; Benton, R. A 90-year sea warming trend explains outbreak patterns of western spruce budworm on Vancouver Island. For. Chron. 2007, 83, 867–869. [Google Scholar] [CrossRef] [Green Version]
- Mopper, S.; Whitham, T.G. The plant stress paradox: effects on pinyon sawfly sex ratios and fecundity. Ecology 1992, 73, 515–525. [Google Scholar] [CrossRef]
- Wuebbles, D.; Fahey, D.; Hibbard, K.; Dokken, B.; Stewart, B.; Maycock, T. Climate Science Special Report: Fourth National Climate Assessment, Volume I. Available online: https://repository.library.noaa.gov/view/noaa/19486/noaa_19486_DS1.pdf (accessed on 8 January 2018).
- Abatzoglou, J.T.; Dobrowski, S.Z.; Parks, S.A.; Hegewisch, K.C. TerraClimate, a high-resolution global dataset of monthly climate and climatic water balance from 1958–2015. Sci. Data 2018, 5, 170191. [Google Scholar] [CrossRef] [PubMed]
- Fick, S.E.; Hijmans, R.J. WorldClim 2: new 1-km spatial resolution climate surfaces for global land areas. Int. J. Climatol. 2017, 37, 4302–4315. [Google Scholar] [CrossRef]
- Hijmans, R.J.; Cameron, S.E.; Parra, J.L.; Jones, P.G.; Jarvis, A. Very high resolution interpolated climate surfaces for global land areas. Int. J. Climatol. 2005, 25, 1965–1978. [Google Scholar] [CrossRef] [Green Version]
- Harris, I.; Jones, P.D.; Osborn, T.J.; Lister, D.H. Updated high-resolution grids of monthly climatic observations–the CRU TS3. 10 Dataset. Int. J. Climatol. 2014, 34, 623–642. [Google Scholar] [CrossRef]
- Kobayashi, S.; Ota, Y.; Harada, Y.; Ebita, A.; Moriya, M.; Onoda, H.; Onogi, K.; Kamahori, H.; Kobayashi, C.; Endo, H.; et al. The JRA-55 reanalysis: General specifications and basic characteristics. J. Meteorol. Soc. Jpn. Ser. II 2015, 93, 5–48. [Google Scholar] [CrossRef]
- Palmer, C.W. Meteorological drought. In US Weather Bureau Research Paper; US Department of Commerce: Washington, DC, USA, 1965. [Google Scholar]
- Oyler, J.W.; Ballantyne, A.; Jencso, K.; Sweet, M.; Running, S.W. Creating a topoclimatic daily air temperature dataset for the conterminous United States using homogenized station data and remotely sensed land skin temperature. Int. J. Climatol. 2015, 35, 2258–2279. [Google Scholar] [CrossRef]
- Daly, C.; Halbleib, M.; Smith, J.I.; Gibson, W.P.; Doggett, M.K.; Taylor, G.H.; Curtis, J.; Pasteris, P.P. Physiographically sensitive mapping of climatological temperature and precipitation across the conterminous United States. Int. J. Climatol. 2008, 28, 2031–2064. [Google Scholar] [CrossRef] [Green Version]
- Turchin, P. Complex Population Dynamics: A Theoretical/Empirical Synthesis; Princeton University Press: Princeton, NJ, USA, 2003; Volume 35. [Google Scholar]
- Nealis, V.G.; Régnière, J. Risk of dispersal in western spruce budworm. Agric. For. Entomol. 2009, 11, 213–223. [Google Scholar] [CrossRef]
- Gergel, D.R.; Nijssen, B.; Abatzoglou, J.T.; Lettenmaier, D.P.; Stumbaugh, M.R. Effects of climate change on snowpack and fire potential in the western USA. Clim. Chang. 2017, 141, 287–299. [Google Scholar] [CrossRef]
- Seager, R.; Ting, M.; Li, C.; Naik, N.; Cook, B.; Nakamura, J.; Liu, H. Projections of declining surface-water availability for the southwestern United States. Nat. Clim. Chang. 2013, 3, 482. [Google Scholar] [CrossRef]
- Rupp, D.E.; Abatzoglou, J.T.; Mote, P.W. Projections of 21st century climate of the Columbia River Basin. Clim. Dyn. 2017, 49, 1783–1799. [Google Scholar] [CrossRef]
Figure 1.
Ranges of host tree species of western spruce budworm (light blue for Douglas-fir and light green for other host species) and regions analyzed in this study (polygons and numbers).
Figure 1.
Ranges of host tree species of western spruce budworm (light blue for Douglas-fir and light green for other host species) and regions analyzed in this study (polygons and numbers).

Figure 2.
Adjusted defoliation area (ha) time series of regions used in the study. Vertical black lines indicate the initiation year used in the superposed epoch analysis. Because an outbreak was already ongoing in the first year of defoliation data (1997), Regions 1 (Washington) and 9 (Northern New Mexico) do not have initiation years.

Figure 3.
Average water year total precipitation versus average water year temperature of each study region. Hollow symbols are for regions in the Northwest, and solid symbols are for regions in the Southwest. Averages were computed for the period 1997–2015.
Figure 3.
Average water year total precipitation versus average water year temperature of each study region. Hollow symbols are for regions in the Northwest, and solid symbols are for regions in the Southwest. Averages were computed for the period 1997–2015.

Figure 4.
Average monthly climate of the Northwest and Southwest regions from 1997 to 2015: (a) temperature, (b) precipitation, and (c) climatic water deficit. Circles and dotted lines represent average climate metrics of Northwest regions, and squares and solid lines represent average climate metrics of Southwest regions.

Figure 5.
Superposed epoch analysis of summer Palmer Drought Severity Index (PDSI). (a) Mean of regions in the Northwest (N = 5); (b) mean of regions in the Southwest (N = 3). Dotted lines indicate 90% confidence intervals, and solid lines indicate 95% confidence intervals. Values outside these intervals are years when the climate was statistically significantly different from average conditions. For example, “Lag 0” is the year of outbreak initiation, and “Lag −1” is the year before initiation.

Figure 6.
Superposed epoch analysis of summer standardized anomalies of climatic water deficit (CWD). (a) Mean of regions in the Northwest (N = 5); (b) mean of regions in the Southwest (N = 3). Dotted lines indicate 90% confidence intervals, and solid lines indicate 95% confidence intervals. Values outside these intervals are years when the climate was statistically significantly different from average conditions. For example, “Lag 0” is the year of outbreak initiation, and “Lag −1” is the year before initiation.

Figure 7.
Western spruce budworm defoliation area growth rate R versus standardized anomalies of May climatic water deficit (Northwest (NW): p = 0.054; Southwest (SW): p = 0.032). Solid squares indicate data from years and regions in the Southwest, and hollow circles indicate data from years and regions in the Northwest. The solid line is the trend line of data from the Southwest regions, and the dotted line is the trend line of data from the Northwest regions.

© 2019 by the authors. Licensee MDPI, Basel, Switzerland. This article is an open access article distributed under the terms and conditions of the Creative Commons Attribution (CC BY) license (http://creativecommons.org/licenses/by/4.0/).
Share and Cite
MDPI and ACS Style
Xu, B.; Hicke, J.A.; Abatzoglou, J.T. Drought and Moisture Availability and Recent Western Spruce Budworm Outbreaks in the Western United States. Forests 2019, 10, 354. https://doi.org/10.3390/f10040354
AMA Style
Xu B, Hicke JA, Abatzoglou JT. Drought and Moisture Availability and Recent Western Spruce Budworm Outbreaks in the Western United States. Forests. 2019; 10(4):354. https://doi.org/10.3390/f10040354
Chicago/Turabian StyleXu, Bingbing, Jeffrey A. Hicke, and John T. Abatzoglou. 2019. "Drought and Moisture Availability and Recent Western Spruce Budworm Outbreaks in the Western United States" Forests 10, no. 4: 354. https://doi.org/10.3390/f10040354
Note that from the first issue of 2016, this journal uses article numbers instead of page numbers. See further details here.