Article

Heterologous Expression of the DREB Transcription Factor AhDREB in Populus tomentosa Carrière Confers Tolerance to Salt without Growth Reduction under Greenhouse Conditions

1
Beijing Advanced Innovation Center for Tree Breeding by Molecular Design, College of Biological Sciences and Technology, National Engineering Laboratory for Tree Breeding, Beijing Forestry University, Beijing 100083, China
2
Chinese Academy of Forestry, Beijing 100091, China
3
Cangzhou Municipal Forestry Seeding and Cutting Management Center, Cangzhou 061001, China
4
Shandong Academy of Forestry, Jinan 250014, China
5
Institute of Genetics and Developmental Biology, Chinese Academy of Sciences, Beijing 100101, China
*
Author to whom correspondence should be addressed.
Forests 2019, 10(3), 214; https://doi.org/10.3390/f10030214
Submission received: 28 January 2019 / Revised: 17 February 2019 / Accepted: 22 February 2019 / Published: 27 February 2019
(This article belongs to the Section Forest Ecophysiology and Biology)

Abstract

:
The DREB transcription factors regulate multiple stress response genes, and are therefore useful for molecular plant breeding. AhDREB, a stress-inducible gene, was isolated from Atriplex hortensis L. and introduced into Populus tomentosa Carrière under the control of the CaMV35S promoter. Under salt stress, the chlorophyll content and net photosynthetic rate were higher in transgenic lines than in the wild type (WT). Moreover, the rate of electrolyte penetration (REC) was lower in the transgenic lines. Additional analyses revealed that the AhDREB transgenic plants generally displayed lower malondialdehyde (MDA) activity but higher superoxide dismutase (SOD) and peroxidase (POD) activities and proline content than the WT under salt stress. RNA sequencing indicated that AhDREB could enhance tolerance to salt by activating various downstream genes in the transgenic plants. Furthermore, no growth inhibition was detected in transgenic plants expressing AhDREB driven by the constitutive CaMV35S promoter. The transcriptome showed 165 and 52 differentially expressed genes in transgenic plants under stress and non-stress conditions, respectively, among which no significant metabolic pathway was enriched and no unintended effects have yet been identified. Together, these results suggest that AhDREB may be a good candidate gene for increasing salt tolerance in transgenic poplar breeding.

1. Introduction

Populus tomentosa Carr. (P. tomentosa) is native to China, where it is mainly distributed in 10 provinces in the northern part of the country. P. tomentosa exhibits many desirable characteristics, such as broad adaptability, a short rotation time, and rapid growth, which make it an important pulp material and afforestation tree species [1]. Given that P. tomentosa does not grow well on saline soils, which cover a large area of China, the application and distribution of P. tomentosa are seriously restricted [2]. High salinity can cause membrane disorganization, decreased photosynthetic activity, metabolic toxicity, generation of reactive oxygen species (ROS), altered nutrient acquisition, and inactivation of enzymes, thereby affecting cell viability and resulting in defective plant growth and even death, which negatively affect the production of crops and woodlands [3,4,5].
Plants respond and adapt to salt stresses through numerous biochemical reactions and physiological processes that are controlled by many genes. A number of genes and their products have been reported that respond to salt at the transcriptional and translational levels. These proteins can be classified into two groups. One group includes proteins that directly protect against stresses, such as late embryogenesis abundant (LEA) proteins, peroxidase (POD), molecular chaperones, and sodium-hydrogen antiporter (NHX) protein [6,7,8,9,10,11]. Genes in the other group regulate signal transduction and gene expression during the stress response, including various transcription factors (TFs), protein kinases and other signaling molecules [12]. TFs play a central role in activating the expression of defensive genes and inducing expression of downstream stress-related genes to combat abiotic stresses. One type of TF, DREB proteins of the ERF subfamily, can improve salt stress tolerance in plants. These proteins function through interaction with a dehydration-responsive cis-element found in the core A/GCCGAC sequence of the promoter region of several genes that are induced in response to salt and other abiotic stresses [13]. Due to their ability to regulate a large number of downstream stress-responsive genes, these genes have the potential for improving stress tolerance in transgenic plant breeding [14,15,16]. Improving the salinity tolerance of the plants through overexpression of DREBs has been accomplished in Arabidopsis, tobacco, rice, wheat, potato, soybean and many other plants. Increasing evidence has shown that DREB proteins play crucial roles in regulating salt stress responses in plants [17,18,19,20,21,22,23,24].
In a previous study, our lab successfully transferred an AhDREB gene cloned from Atriplex hortensis into a hybrid of P. tomentosa through Agrobacterium-mediated transformation. The overexpressed AhDREB gene significantly improved the survival rate of P. tomentosa in salty soil. However, the mechanism by which AhDREB improved the salt tolerance of P. tomentosa remains unclear. In addition, tolerance to abiotic stresses is complicated due to the large number of genes and pathways that may be involved [25,26,27]. Furthermore, the interaction between plants and the environment is an intricate, continuous process that is difficult to characterize, adding to the complexity involved in manipulating abiotic stress tolerance traits. The complexity of these traits may also increase the likelihood of unintended effects arising from overexpressing a TF in transgenic plants [28]. In transgenic systems, two types of unintended effects are known: position effects attributed to the insertion of a foreign gene at a particular locus in the genome and resulting interference, and pleiotropic effects that are independent of the site of transgene insertion and represent the synthesis of phenotypic effects caused by expression of the transgene [29]. Position effects will vary with the site of insertion and can be easily eliminated by selecting transgenic lines with minor or no position effects. However, aside from the intended traits of pleiotropic effects, other pleiotropic effects may occur through unexpected interactions of the genes with plant processes, and therefore constitute unintended effects. These effects are more difficult to eliminate and are more likely to negatively influence the growth of the receptor plant [30]. For this reason, unintended effects must be studied when a foreign gene is used in transgenic breeding.
In this study, our main objective is to demonstrate that ectopic expression of AhDREB leads to improved salt tolerance in poplar. Such improvement was associated with maintenance of photosynthesis, the antioxidant defense system and osmotic adjustment. RNA sequencing (RNA-seq) analysis indicated that this may be caused by activation of downstream genes involved in cell protection against the adverse effects of salt. Furthermore, there were no negative effects on plant growth when AhDREB was driven by the strong constitutive CaMV35S promoter, and MapMan analysis of differentially expressed genes between transgenic and non-transgenic poplars showed no significant enrichment of metabolic pathways.

2. Materials and Methods

2.1. Plant Material and Salt Treatments

A vector with a T-DNA region containing the nptII gene, which confers resistance to the antibiotic kanamycin, as a selection gene and the AhDREB1 gene was driven by the CaMV35S constitutive promoter and transformed into hybrid Populus ((Populus tomentosa × Populus bolleana L.) × P. tomentosa) using Agrobacterium tumefaciens Smith & Townsend in 2003. We selected two transgenic lines, T46 and T12, for our study. The non-transgenic poplar 401, which is also the recipient plant of AhDREB1, was selected as a control.
Salt treatment experiments were conducted with the two transgenic lines T46 and T12 and the non-transgenic line 401 in a greenhouse with a temperature regime of 25 °C day/18 °C night, a 14-h light/10 h-dark photocycle, relative humidity of 70% day/80% night, and at a photon flux density of approximately 300–400 μmol m−2 s−1 at Beijing Forestry University in July 2015. In vitro rooted plants were acclimatized in the greenhouse for 2 weeks and then transplanted into plastic pots (15.0 cm in diameter and 13.0 cm tall) containing 2 kg soil (vermiculite, sand and pearl stone mixed at a ratio of 1:1:1) for several weeks. All pots were placed on plastic plates, saturated with water, and left to drain every 2 days. All plants had water withheld for 3 days before salt treatment.
Salt treatments were initiated when seedlings were approximately 15–20 cm in height in late August 2015. Randomly selected plants with similar heights, numbers of leaves, and leaf areas were subjected to treatments. To determine the appropriate sodium chloride (NaCl) concentration, five NaCl concentrations, i.e., 0 (control), 0.2, 0.4, 0.6, and 0.8% (relative to the dry weight of potting soil), were applied to the soils. To achieve these levels of soil salinity, NaCl was dissolved in 500 mL distilled water at rates of 0, 4, 8, 12 and 18 g and added to the pots to reach water saturation. Then, a plastic pad was laid under each pot to avoid salt drainage during the process. The plants were watered every 2 days to maintain soil moisture at the maximum soil moisture capacity throughout salt treatment. The soil salinity was tested using an EM-38 conductivity meter (Geonics Ltd., Mississauga, ON, Canada) on days 2 and 60 after salt treatment. The soil salinity values are shown in Supplementary Table S1. Three individual plants from each line were used in the experiments, each of which was repeated three times.

2.2. Determination of the Increment of Growth Parameters

Before and 60 days after salt treatment, plant length and base diameter were determined. The height of plants was measured using a ruler, and base diameters was determined using a caliper. The increments of plant height and base diameter were calculated using the following formula:
Plant   height   increment = plant   height   after   15   days   of   salt   treatment plant   height   after   0   days   of   salt   treatment
Base   diameter   increment = base   diameter   after   15     days   of   salt   treatment base   diameters   after   0   days   of   salt   treatment

2.3. Determination of Electrolyte Leakage and Malondialdehyde (MDA) Concentration

Electrolyte leakage of non-transgenic and transgenic plants was determined on day 60 according to the method of Wang et al. [15]. In short, leaves were thoroughly rinsed with deionized water, and then 5-g round sections were cut from the leaves of each sample and placed into a clean beaker with 30 mL of deionized water under vacuum for 15 min. The electrical conductivity was measured and denoted r1. The leaves were then heated at 90 °C for 20 min and cooled at room temperature (about 25 °C). Electrical conductivity was measured again, and this value was labeled r2. The formula for calculation of electrolyte leakage was (r1/r2) 100%.
The MDA concentration was measured on day 60 according to the method of Quan et al. (2004) [31] using a thiobarbituric acid (TBA) colorimetric assay, in which 0.5 g of fresh tissue was homogenized in 2 mL 10% trichloroacetic acid (TCA, w/v). The MDA concentration was defined as
C = 6.45 × ( OD 532 OD 600 ) 0.56 × OD 450

2.4. Measurement of Leaf Gas Exchange

Leaf gas exchange parameters, including net assimilation rate (Pn, μmol m−2 s−1), stomatal conductance (Gs, mol m−2 s−1), transpiration rate (Tr, mmol m−2 s−1), and intercellular CO2 concentration (Ci, μmol mol−1), were measured on the fourth fully expanded top leaves of three plants (bout the 4th to 6th leaves below the apex, and we have re-written this part) per treatment on day 60 using an internal light source with a photosynthetically active radiation (PAR) value of 1000 μmol m−2 s−1. During measurement, the ambient air CO2 concentration was approximately 400 μmol mol−1 and the temperature was approximately 25 °C. All measurements were performed in triplicate.

2.5. Measurement of Proline, SOD, POD and Chl Content

The proline and antioxidant enzyme activities were detected on day 60. The second or third fully expanded top leaves were collected and frozen in liquid nitrogen, then stored at −80°C.
Proline was extracted and quantitated using the method of Bates et al. (1973) [32]. Briefly, 0.25 g samples were homogenized with 2 mL 3% sulfosalicylic acid and the homogenate was centrifuged at 4000 rpm for 20 min. The supernatant was treated with acetic acid and acid ninhydrin and boiled for 1 h, and the absorbance at 520 nm was then measured. Proline (Sigma-Aldrich) was used to generate a standard curve.
Fresh leaf samples were obtained and frozen instantly in liquid N and subsequently stored at −80 °C. Frozen leaf samples of 0.5 g were ground to fine powder in liquid N using a mortar and then homogenized with 3 mL of 50 mM phosphate buffer solution (pH 7.8) containing 1 mM EDTA–Na2+ and 1% polyvinylpyrrolidone (PVP). The homogenate was centrifuged at 10,000 rpm for 15 min, and the supernatant was then centrifuged at 10,000 rpm for an additional 5 min. The supernatant was collected as a crude enzyme extract for enzyme measurements and stored at 4 °C. All steps were carried out at 4 °C. Enzyme activities were assayed using a spectrophotometer.
The total SOD activity was assayed according to Becana et al. (1986) [33] based on inhibition of the photochemical reduction of nitroblue tetrazolium (NBT). The reaction was initiated by the addition of 100 μL of crude enzyme extract. The entire system was positioned 30 cm below a light source (six 15-W fluorescent tubes) for 30 min. The reaction was stopped by turning off the light. The complete reaction mixture without enzyme extract was incubated under the same light used for the experimental samples to provide a light blank, and the complete reaction mixture including 100 μL of enzyme extract was incubated in the dark to provide a dark blank. The reduction in the amount of NBT was determined by monitoring the change in absorbance at 560 nm. The readings obtained from the light blank were used to determine units of enzymatic activity. One unit (U) of SOD enzyme activity was defined as the amount of enzyme that produced 50% inhibition of NBT reduction under the assay conditions, expressed as U SOD activity mg−1 protein.
The POD activity of enzyme extracts was assayed by monitoring changes in absorbance at 470 nm in mixtures containing 0.02 M Na2HPO4, 0.08 M NaH2PO4, 20 mM guaiacol, 4 mM H2O2, and enzyme extract (10 mL), pH 6, in a total volume of 3 mL (Civello 1995) [34].
To measure Chl variation, non-transgenic and transgenic plants were evaluated on the day of the salt treatment and 60 days later using the portable chlorophyll meter SPAD-502 Plus (Konica Minolta Holdings, Inc. Chiyoda-ku, Tokyo, Japan). The second healthy and fully expanded leaves from the top were measured 10 times on each leaf and the Chl contents were calculated as the average value. All measurements were performed in triplicate. Chl variation was calculated with the following formula:
Chl   variation = Chl   content   on   day   0 Chl   content   on   day   60

2.6. Cdna Library Preparation and Illumina Transcriptomic Sequencing

To further investigate the role of AhDREB in the mechanism of salt resistance in transgenic P. tomentosa, the non-transgenic line 401 and transgenic lines T-46 and T-12 treated with 0% and 0.6% NaCl were subjected to transcriptomic analysis following salt treatment and the sequencing data has submitted to NCBI database (accession number: PRJNA522057). Total RNA from the mixed sample (three individual plants) was isolated using the RNA EasySpin Isolation System (Aidlab Biotech, Beijing, China) according to the manufacturer’s protocol. Following treatment with RNase-free DNase I (New England BioLabs) for 30 min at 37 °C to remove residual DNA, sequencing was performed by Shanghai Biotechnology Co. Ltd., where a cDNA library was constructed and subjected to Illumina HiSeq2500 sequencing, as described by Sun et al. [35].

2.7. Analysis of Illumina Transcriptomic Sequencing Results

The RNA-seq reads were mapped onto the genome of Populus trichocarpa (JGI v3.0, https://phytozome.jgi.doe.gov/pz/#!info?alias=Org_Ptrichocarpa) using TopHat (v.2.0.9, allowing two mismatches per read as the default).

2.8. Differential Expression Analysis and Function Enrichment

Gene expression levels were estimated as reads per kilobase of exon region in a given gene per million mapped reads (RPKM) [36]. Two parameters were used to identify differentially expressed transcripts (DETs) between the transgenic and non-transgenic samples: a fold change of not less than 2 (an absolute value of log2Ratio (T-46 (or T-12)/401) ≥ 1) and a false discovery rate (FDR) adjustment with a significance level of 0.05. Gene Ontology (GO) and pathway enrichment analyses were then performed with a cutoff P value of 0.05 compared to the whole transcriptome as background. To study the mechanism through which AhDREB improved salt tolerance, we screened differentially expressed genes between T-46 and 401, as well as T-12 and 401, under 0.6% NaCl salt treatment. To investigate potential unintended pleiotropic effects in AhDREB transgenic poplar, we screened differentially expressed genes between T-46 and 401, as well as T-12 and 401 under 0% NaCl salt treatment. In addition, to minimizing transgene position effects, only genes that were significantly affected in both T-46 and T-12 were treated as differentially expressed.
The MapMan-based functional categorization of all differentially expressed genes was performed by comparing their protein sequence to that of Arabidopsis TAIR10 (http://www.arabidopsis.org/) using the standalone version of NCBI BLASTP (2.2.31+) with the default settings. MapMan categorization was transferred from TAIR10. To evaluate whether up-regulated genes in transgenic plants associated with salt resistance were directly regulated by AhDREB, 2000-bp sequences upstream of the 5′ UTR region (regarded as the promoter region) were downloaded (JGI v3.0, https://phytozome.jgi.doe.gov/pz/#!info?alias=Org_Ptrichocarpa) and the presence of the cis-regulatory element CCGAC was detected [37].

3. Results

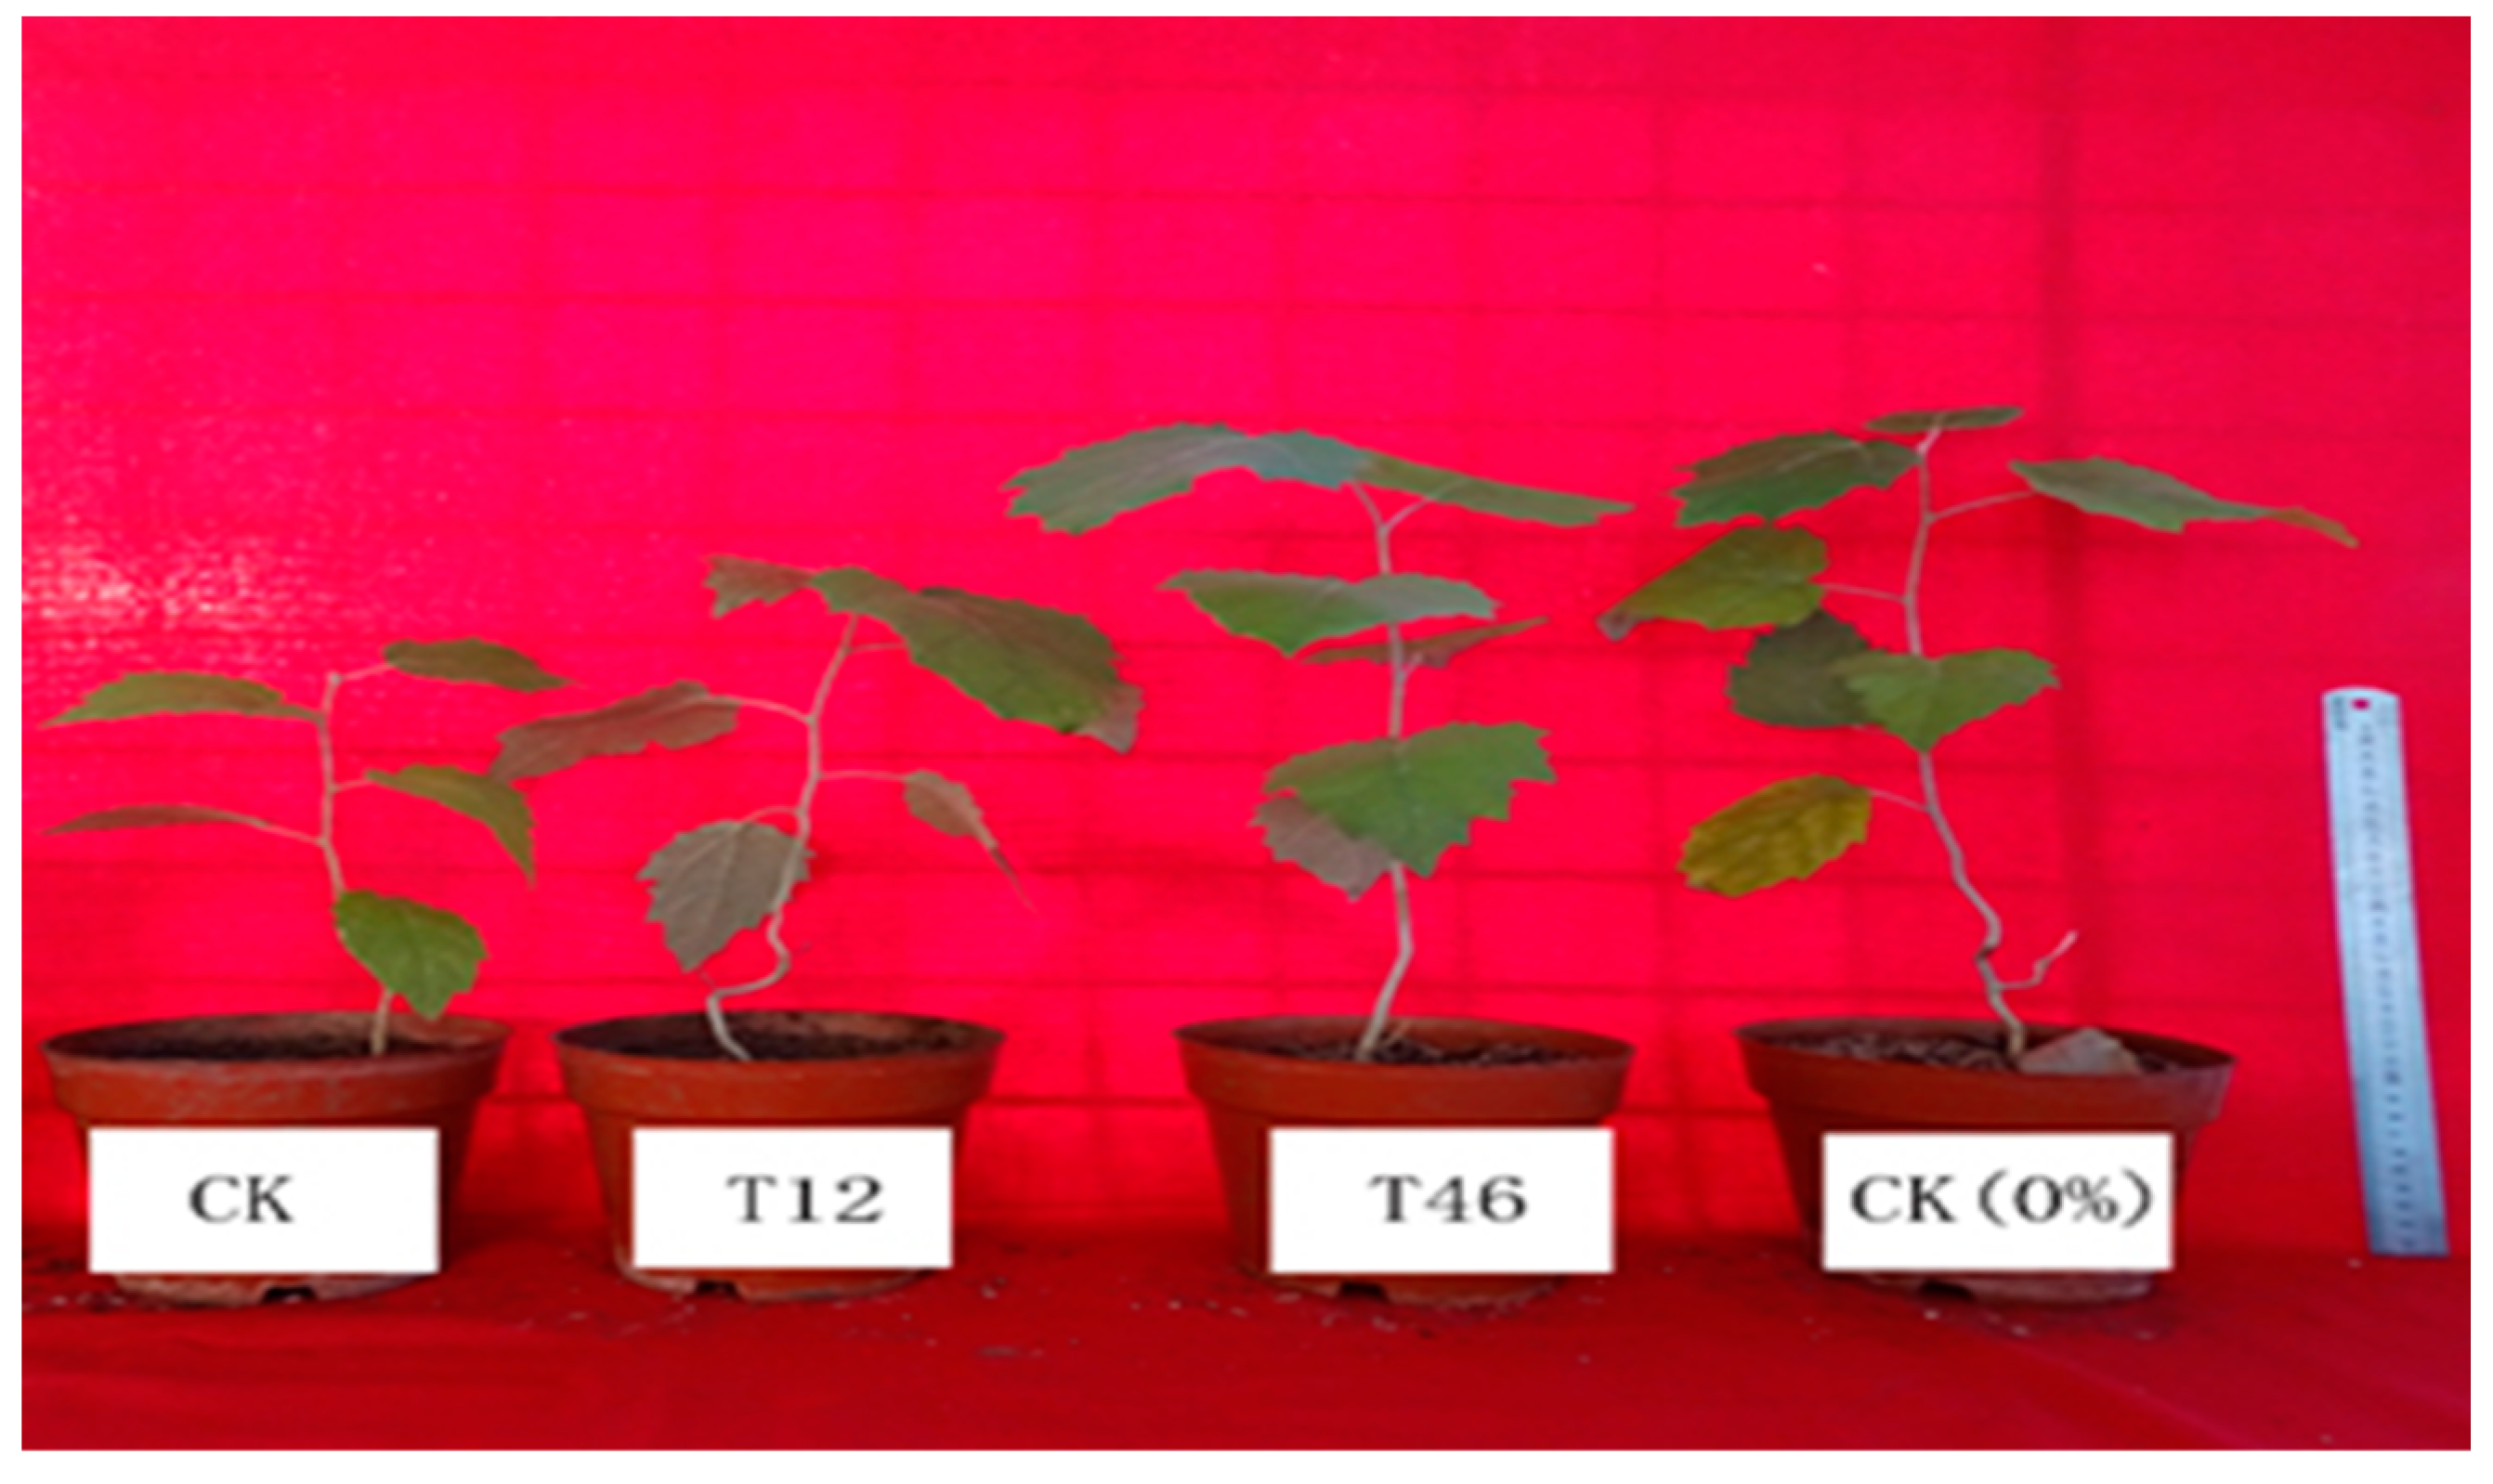
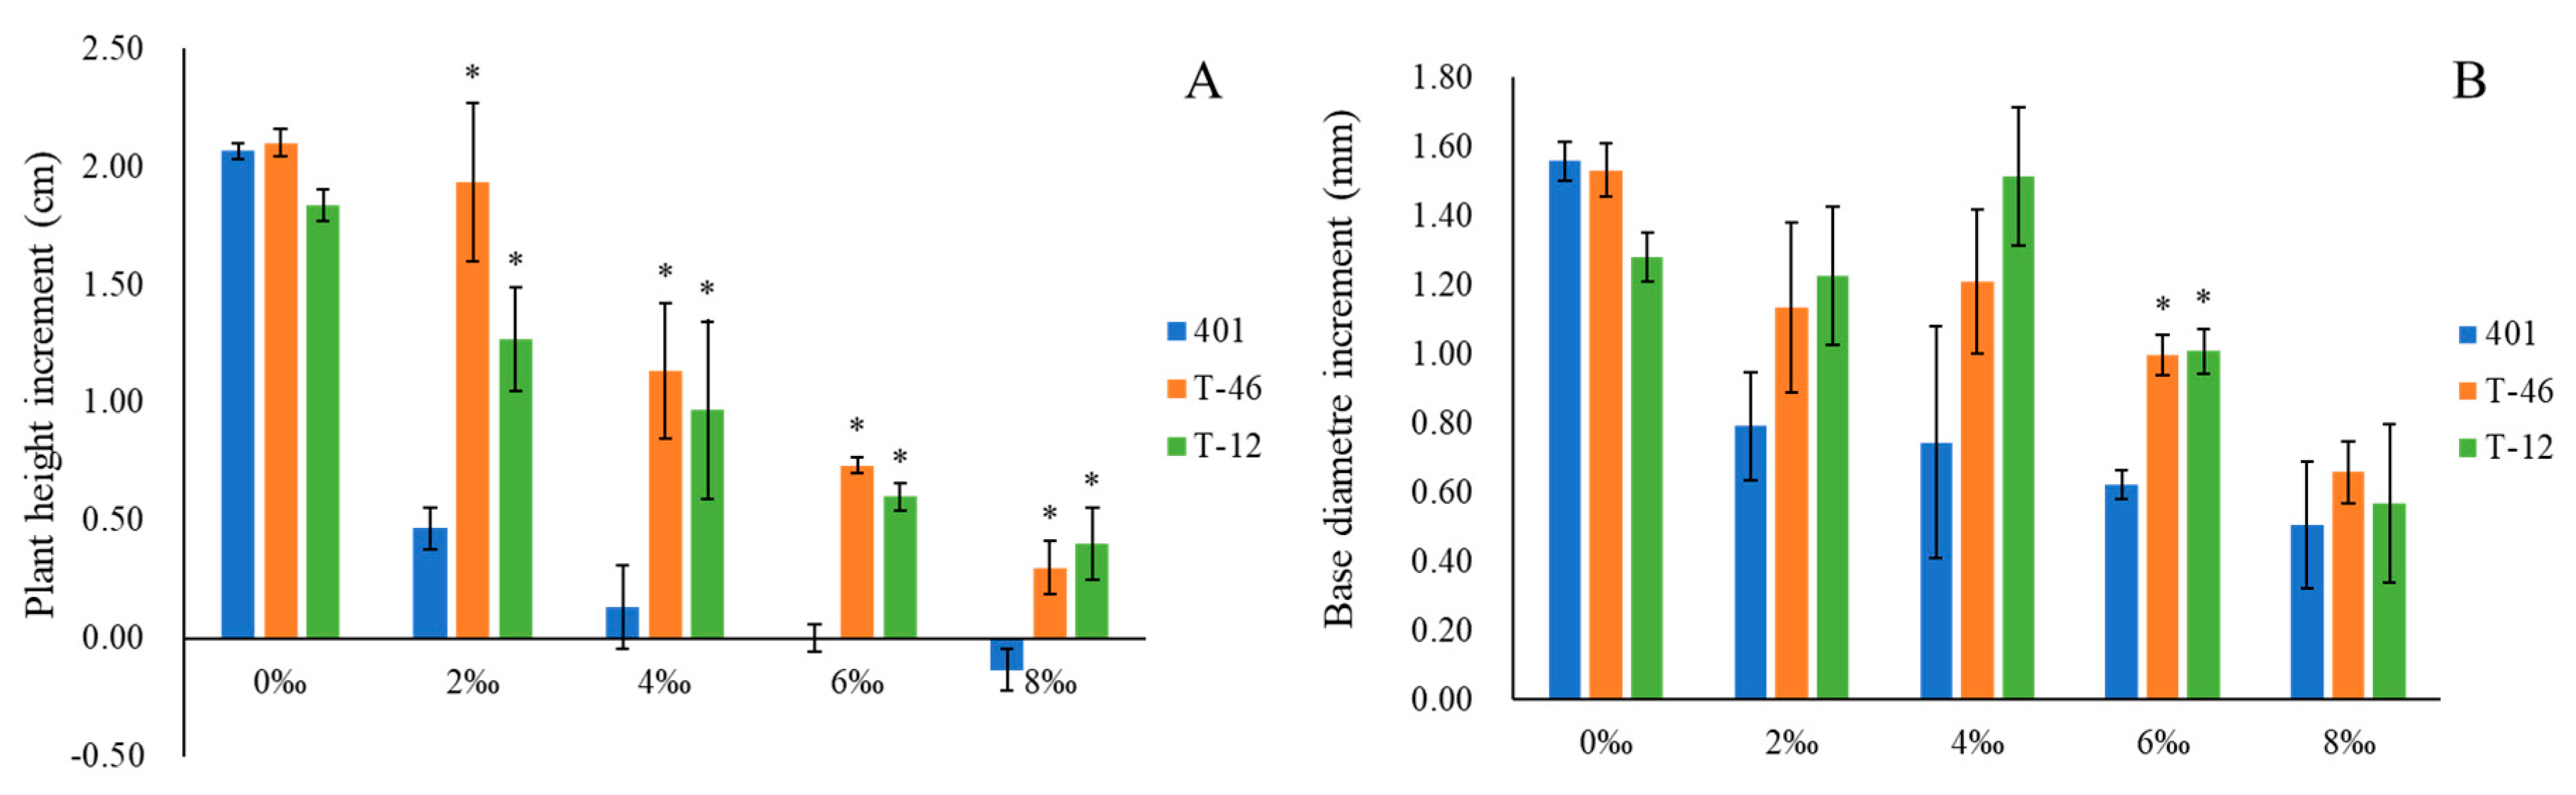
3.1. Growth under Increasing Levels of Soil Salinity

Saline conditions had negative effects on plant growth, leading to its reduction. The plant height increments of transgenic and non-transgenic lines showed no significant difference (Figure 1), but as the salt concentration increased, the plant height increment of transgenic lines was significantly higher than that of non-transgenic lines. For treatments of under 8‰, reduction in the growth of non-transgenic plants was observed. The base diameter increments were not significantly different between transgenic and non-transgenic lines, except in the 6‰ treatment (Figure 2).

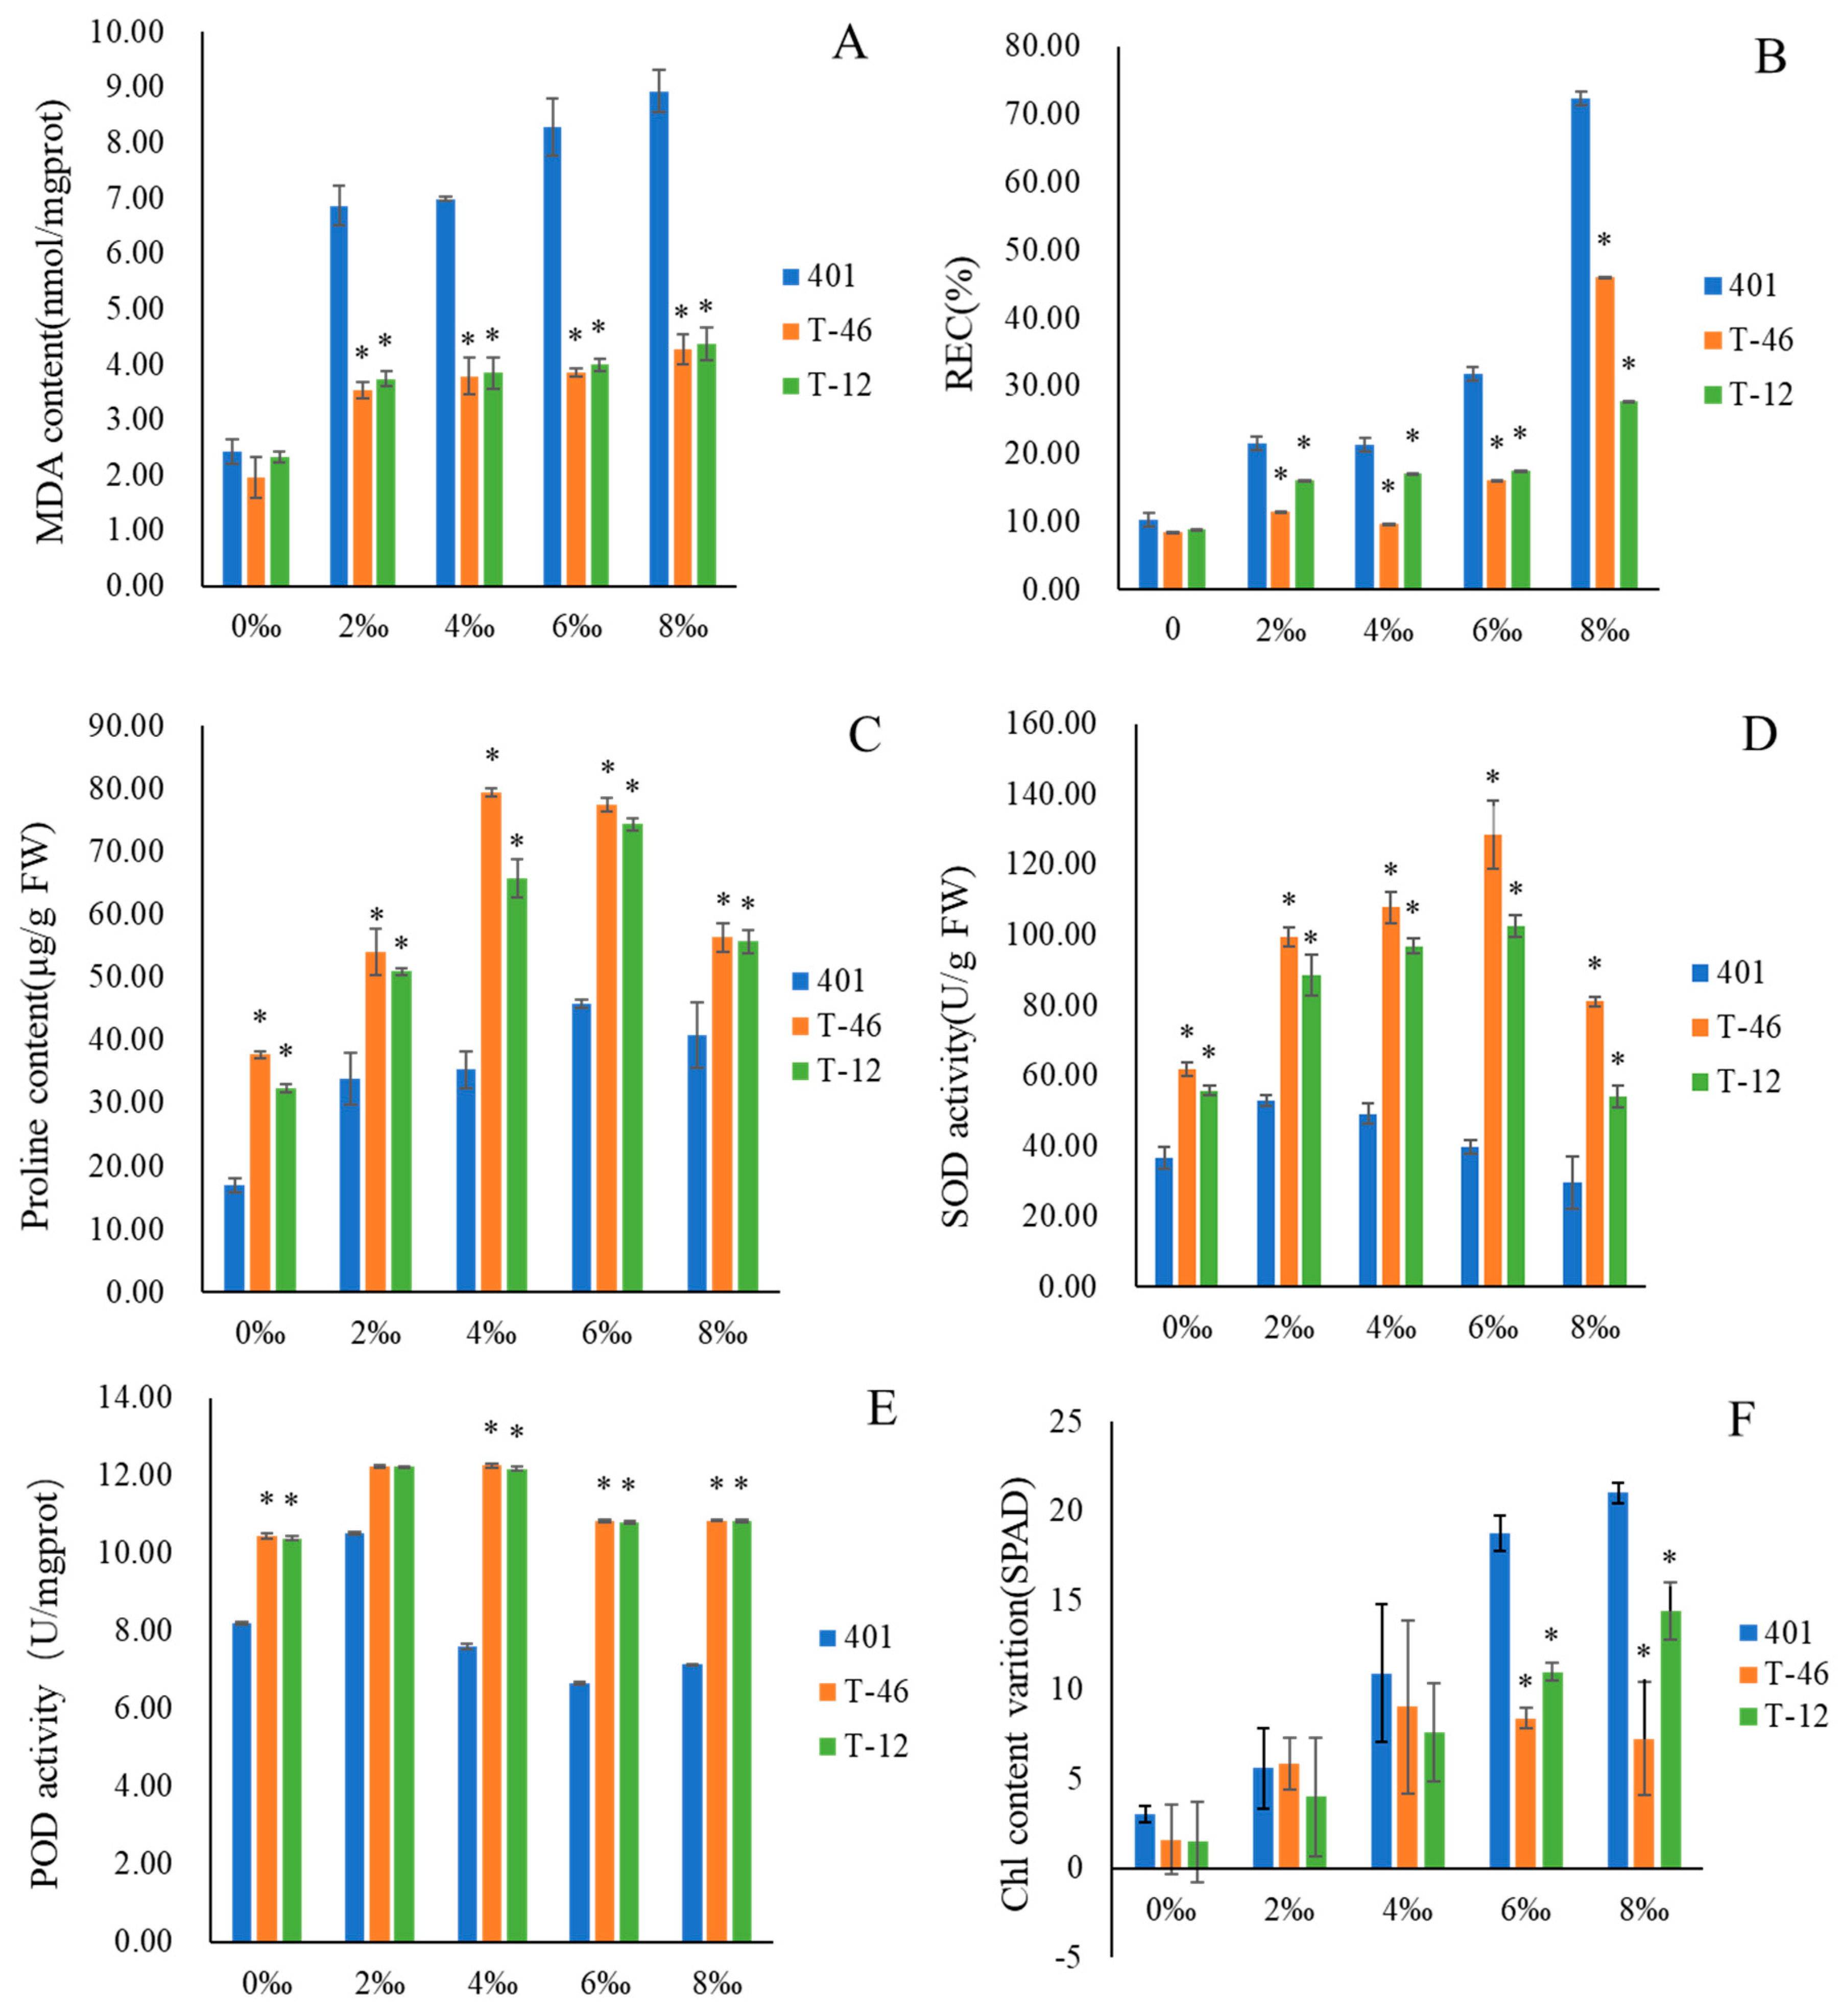
3.2. Effect of Ahdreb Expression on Rate of Electrolyte Penetration (REC) and MDA Contents

The REC and MDA contents were determined after 60 days of salt treatment. Compared to non-transgenic line 401, the two transgenic lines showed significantly lower REC and MDA contents, especially with high salt treatment (8‰); the REC and MDA contents of the non-transgenic line were 72.31% and 8.37 nmol/mg (FW), about 2.6-fold and 2.0-fold higher than that of T-12, respectively (Figure 3A,B).

3.3. Effect of Ahdreb Expression on Chl Content Variation, SOD and POD Activities And Proline Content

The variations in proline content of transgenic lines and non-transgenic lines were similar to those of SOD. Pro contents increased with the salt concentration, reaching their peak at 0.6‰, and then decreased when treated with 0.8‰ NaCl solution. The transgenic lines had significantly higher Pro contents than the non-transgenic line (Figure 3C).
Salt stress responses were further analyzed by monitoring the activities of superoxide dismutase (SOD) and POD, which scavenge harmful ROS that accumulate during stress. The overall variation in the activities of the two antioxidant enzymes following 60 days of salt stress was similar between the two transgenic lines, while the SOD activity of the transgenic lines was significantly higher than that of the non-transgenic line under all salt treatments (Figure 3D). The POD activity of transgenic lines was significantly higher than that of non-transgenic lines under the 0‰, 2‰, 4‰ and 8‰ NaCl treatments (Figure 3E).
Chl content was detected after 0 and 60 days of salt stress. The Chl content decreased with increasing NaCl concentration in soil, and varied significantly more widely in non-transgenic plants compared to transgenic lines, especially at higher salt levels (6 and 8‰). Transgenic lines were only significantly higher than the non-transgenic line for the 6‰ salt treatment (Figure 3F).

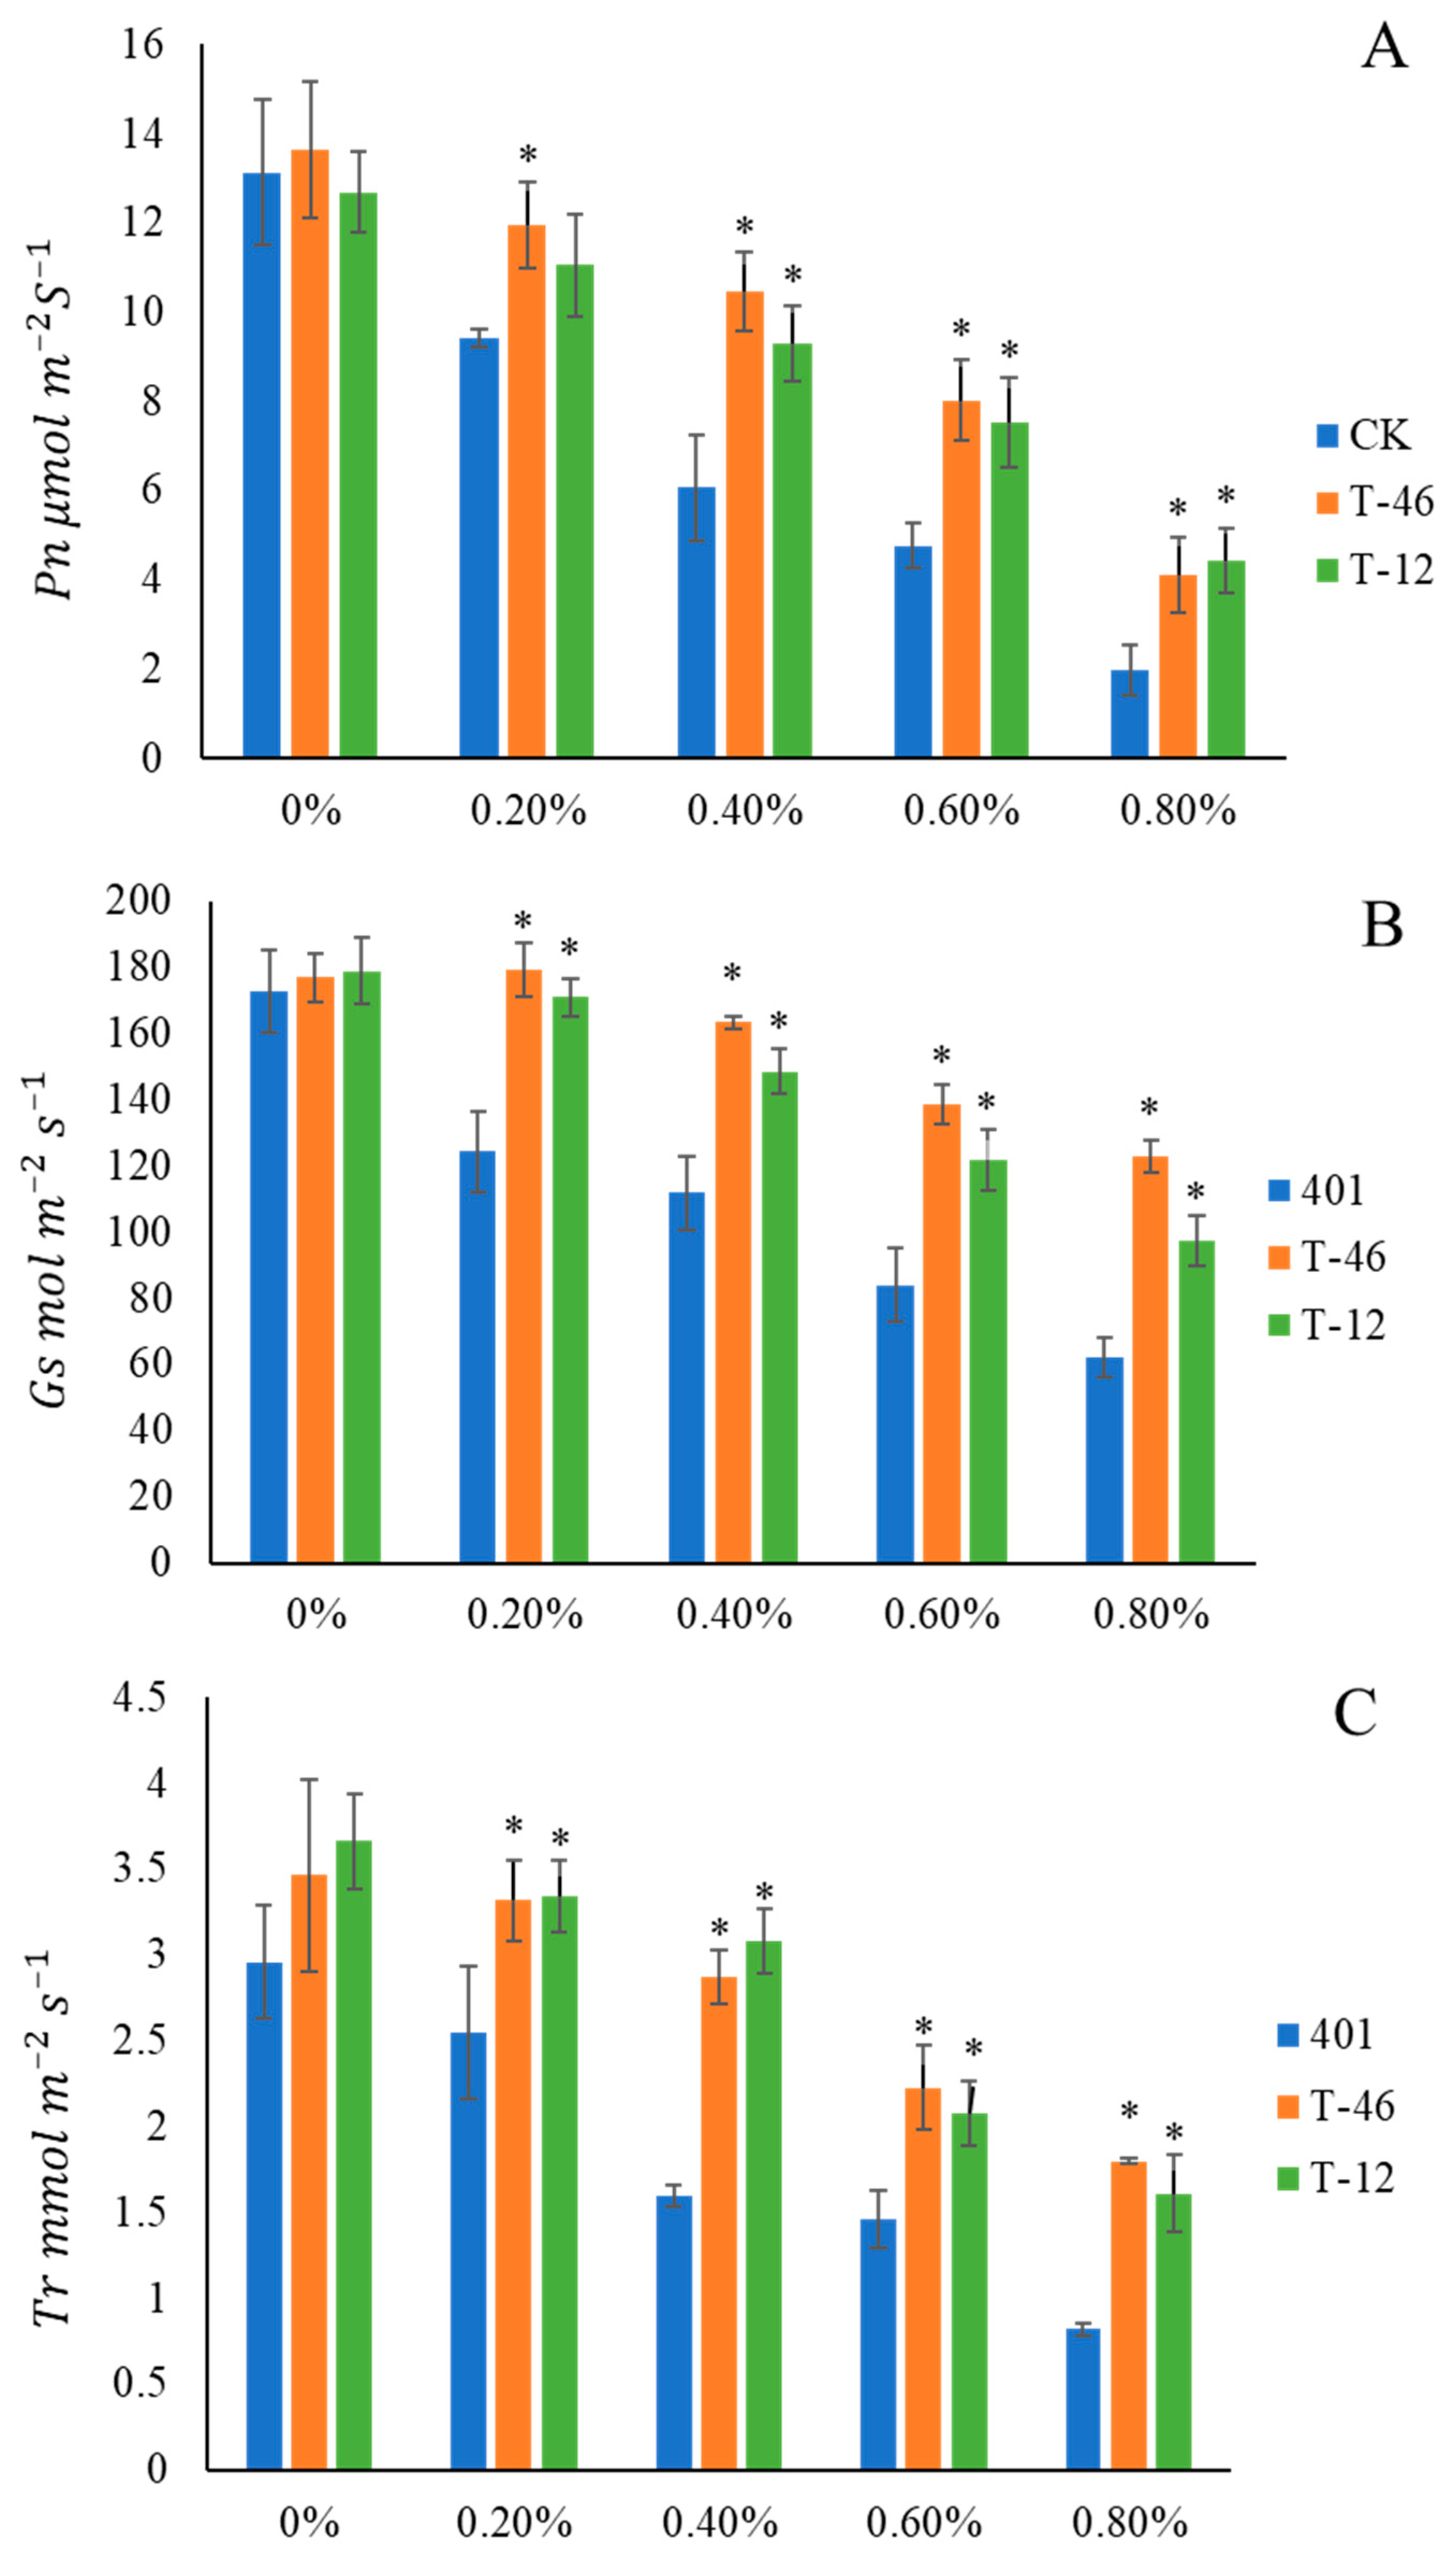
3.4. Photosynthetic Capacity of Transgenic Plants Under Salt Stress Conditions

To test photosynthetic capacity, we measured net photosynthesis (Pn), Tr and Gs of non-transgenic and transgenic plants. Under non-stress conditions, plants of different lines showed little variability. However, when subjected to salt, non-transgenic line 401 exhibited a significant decrease in Pn, Gs and Tr, while transgenic lines T46 and T12 were less affected (Figure 4).

3.5. Transcriptomic Analysis of Ahdreb-Overexpressing Populus Tomentosa Under Salt Stress

To further investigate the molecular mechanisms involved in the observed enhancement of salt tolerance in AhDREB-overexpressing lines, global expression profiling was conducted to compare transgenic lines T-46 and T-12 and non-transgenic line 401 (wild types; WT) plants following 0.6% NaCl treatment. Mixed RNA samples from three separate 120-day-old plants (after 60 days of salt treatment) were used for high-throughput sequencing and in total, 47,800,427 (401, 0%), 46,925,138 (401, 0.6%), 43,434,145 (T46, 0%), 50,561,810 (T46, 0.6%), 45,666,581 (T12, 0%) and 64,667,540 (T12, 0.6%) raw reads were identified, with 20,628,629 (401, 0%), 20,668,223 (401, 0.6%), 18,713,319 (T46, 0%), 21,591,536 (T46, 0.6%), 19,276,874 (T12, 0%) and 28,171,096 (T12, 0.6%) unique reads mapped (Supplemental Table S2).
To identify genes that may play important roles in improving salt tolerance, we focused on 231 differentially expressed genes (165 up-regulated and 66 down-regulated) in the two transgenic lines following salt treatment. Genes that were only differentially expressed in either T46 or T12 were excluded as effects caused by foreign gene insert position. A total of 46 genes related to growth, wood, and reproduction genes were identified, including 22 growth-related genes (6 down-regulated, 16 up-regulated), 12 reproduction-related genes (8 up-regulated, 4 down-regulated), and 12 genes correlated with mortality (10 up-regulated, 2 down-regulated) (Supplemental Table S3).
Among the 165 up-regulated genes, we found a total of 51 genes that may be associated with stress resistance, including 10 TFs (3 WRKY, 1 NAC, 3 MYB and 3 BHLH) and 41 functional genes (Table 1). The cis-regulatory element CCGAC was found in 36 of the 51 genes. MapMan functional categorization showed that most differentially expressed genes participated in the metabolic pathways of “ascorbic acid metabolism”, “glutathione metabolism” and “flavonoid metabolism”, but we did not find that differentially expressed genes were significantly enriched in a specific metabolic pathway (Figure 5).

3.6. Effect of Ahdreb Overexpression on the Transcriptome in the Absence of Salt

Transcriptomic analysis of T-46 and T-12 was performed to identify unintended effects resulting from overexpression of the TF AhDREB in the absence of stress. The two independent plant lines containing the AhDREB transgene were compared to the non-transgenic plant line. The common differentially expressed genes in the two transgenic lines are listed in Table 2. We found 22 total up-regulated and 30 total down-regulated differentially expressed genes. These genes may be influenced by overexpression of the AhDREB gene. In this study, we mainly focus on genes that may influence the growth and wood properties of host plants. Among the 52 differentially expressed genes, 6 were for uncharacterized proteins, 2 were TFs and 44 were functional genes. No metabolic pathway was significantly enriched according to MapMan functional categorization, and we did not find differentially expressed genes significantly enriched in a specific metabolic pathway in MapMan functional categorization (Figure 6).

4. Discussion

Salt stress decreases tree growth and productivity by reducing photosynthetic efficiency, as well as through ion toxicity and osmotic stress. Considering the ongoing expansion of salty land, salt-tolerant plants are in high demand, especially in China, where the total area of salty land available is 3.67 × 10⁷ hm2 [5]. Tolerance to salt is complex, with variable effects occurring at both the molecular and physiological levels during different stages of plant development. Salt adaptation mechanisms are normally controlled by multiple genes, and as TFs regulate the expression of several genes related to salt stress defense responses, they have great potential in genetic engineering of trees. Significant evidence has shown that DREB/CBF proteins play crucial roles in regulating plant responses to salt and other abiotic stresses [12]. Overexpression of DREB TFs from Vigna radiata and soybean confers salinity tolerance to Arabidopsis thaliana. In the present study, we studied the role of AhDREB in salt tolerance in Populus.
Photosynthesis is one of the most important and fundamental physiological processes during plant growth, but it can be seriously impacted during salt stress. Salt stress may damage the electron transport system and decrease CO2 availability by limiting Gs or altering photosynthetic metabolism [38]. In addition, the accumulation of photosynthetic pigments such as chlorophyll, which captures solar radiation to drive the photosynthetic mechanism, is a potential biochemical indicator of salt tolerance [39]. In our study, salt stress decreased chlorophyll content in both transgenic and non-transgenic lines, and the chlorophyll decrement in the non-transgenic line was significantly greater than those in the transgenic lines under 0.6% and 0.8% NaCl treatments, which may be partly responsible for the higher Pn of transgenic lines under salt stress. Aside from Pn, transgenic lines also exhibited higher Gs and Tr, which may be associated with the capacity for salt tolerance.
MDA levels and electrolyte leakage are well-known indicators of plant cell impairment under salt and other abiotic stresses [40]. In our study, transgenic lines exhibited significantly lower levels of MDA and electrolyte leakage, indicating that these transgenic lines have greater salt tolerance compared to the non-transgenic line.
ROS such as superoxide radicals, hydrogen peroxide and singlet oxygen, which are highly toxic and can damage proteins, lipids, carbohydrates and DNA, may be generated in plants under salt stress [41,42]. To counter the toxicity of ROS, plants produce ROS scavengers. Non-enzymatic antioxidants include ascorbic acid and reduced glutathione, and enzymatic antioxidants include SOD and POD, which can accumulate rapidly under drought conditions to minimize oxidative damage [42,43,44,45]. In addition, in high-salt environments, plants can also maintain their water content and osmotic potential by accumulating compatible organic solutes, such as proline [46,47]. Proline is an important osmotic protectant that has been suggested to protect enzymes and membranes, scavenge ROS, and supply energy and N for utilization under salt stress [48]. In the present study, the transgenic T-46 and T-12 lines showed higher SOD and POD activities and greater proline content under salt stress, indicating that AhDREB transformation enhanced salt tolerance through stimulation of the antioxidant defense system and proline production in Populus.
Genes containing DRE elements in their promoters are activated by overexpression of DREB TFs, resulting in improved stress tolerance in transgenic plants [25]. Although few studies have investigated the target genes of AhDREB, some research has shown that overexpression of AtDREB1A in transgenic Arabidopsis enhances the expression of target stress-response genes and activates multiple stress response mechanisms [49,50,51]. Yao et al. [16] also showed that ectopic expression of AtDREB1A in transgenic Salvia miltiorrhiza activated stress-response genes such as kin1 and kin2, and protective proteins like proline-rich protein 4 also increased under stress. Stress-response genes including GmDREB6, GmP5CS and GmERF7 were up-regulated in 35S: OsDREB transgenic rice [52]. In our study, to elucidate the interactions of AhDREB1 with other genes that enhance salt tolerance in Populus, we identified genes that were differentially expressed between the non-transgenic line 401 and transgenic lines T-46 and T-12 under salt stress. We found that some stress-related genes were up-regulated in T-46, such as mitogen-activated protein kinase 3 (MAPK3), which plays an important role in mediating stress responses in eukaryotic organisms. Mao et al. showed that MPK3 and MPK6 phosphorylate the TF WRKY33, which was also up-regulated in our study, thereby triggering the synthesis of camalexin, a major antimicrobial phytoalexin in Arabidopsis. Pitzschkea et al. found that MPK3 could phosphorylate AZI1, a lipid transfer protein (LTP)-related hybrid proline-rich protein (HyPRP), to form a protein complex in plants that alleviated salt stress. We also found a number of ROS-responsive genes (including peroxidase superfamily protein, glutathione peroxidase, heat shock transcription factor, and calmodulin-binding protein) were up-regulated in transgenic poplars suffering from salt stress, indicating that AhDREB expression may modulate activity in ROS-scavenging pathways.
Moreover, we discovered that a multitude of photosynthesis-related genes were up-regulated in T-46 plants in response to salt, suggesting that AhDREB maintained photosynthetic capacity through regulation of these genes. Previous research has also shown that overexpression of DREB in host plants promoted the expression of photosynthetic genes under abiotic stress conditions. Numerous signal transduction genes, such as G-protein alpha subunit 1, RAB GTPase homolog A5A and CYCLIN D3, as well as various TFs, such as DREB, zinc finger, WRKY, bZIP TF and MYB, were also up-regulated [53]. These genes are involved in mechanisms of plant defense against abiotic stresses.
AhDREB may drive a complex signaling network that enhances salt tolerance. Although overexpression of DREB TF could improve salt stress, poor growth phenotypes in DREB transgenic plants compared to non-transgenic controls under normal growing conditions have been observed in many studies. For example, overexpression of MsDREB6.2 in apple resulted in severe growth retardation under normal growing conditions [23]. Similarly, transgenic wheat and barley constitutively overexpressing TaDREB2 or TaDREB3 showed slower growth, delayed flowering and lower grain yields than non-transgenic controls [54], and overexpression of a peach DREB resulted in lower growth and phenological changes in transgenic apple plants [55]. Growth inhibition and phenotypic aberrations may be due to the destruction of normal gibberellin, auxin or cytokinin metabolism by foreign genes [23,56]. On the other hand, Wei et al. overexpressed Arabidopsis DREB1A and DREB1B in transgenic Salvia miltiorrhiza, which increased tolerance to drought stress without stunting growth. Similarly, Chen et al. [57] overexpressed PeDREB2 in transgenic tobacco, which increased salt resistance and did not cause growth retardation, indicating that not all DREB genes lead to growth retardation when overexpressed. Selecting a DREB that can increase tolerance without stunting growth is a potential strategy for transgenic salt-resistant poplar breeding.
In our study, growth retardation was not observed in AhDREB transgenic poplar under non-stress conditions, despite several genes being differentially expressed in transgenic poplar according to the transcriptome results. These results indicated that the transcriptomic changes observed in AhDREB transgenic poplar may not influence the growth of the receptor plant. This result was similar to that of Jiang et al. [28]. In their study, they identified only 7 and 28 differentially expressed genes under salt stress and non-stress conditions, respectively, in a GmDREB transgenic wheat that showed no significant growth retardation. In contrast, in a study of ABF3 transgenic Arabidopsis, Abdeen et al. [30] found three transgenic lines with only seven, one and eight differentially expressed genes under non-stress conditions, all of which showed markedly decreased growth. These studies indicate that RNA sequencing may not reliably predict the characteristics of transgenic plants. Chan et al. [58] suggested that the extent of global transcriptomic differences between transgenic and non-transgenic plants may not predict the phenotypic differences upon which the environment and selection act to influence fitness and fecundity, but the categorical changes may be used to provide guidance for risk assessment.
In our study, several genes associated with plant or cell growth, such as growth-regulating factor 7, wall-associated kinase 2 and photosystem II reaction center protein, were down-regulated in transgenic plants. Growth-regulating factors are plant-specific TFs that participate in regulation of plant growth and development. Kim et al. found that growth-regulating factor 7 functions as a repressor of multiple osmotic stress-responsive genes, preventing growth inhibition under normal conditions in Arabidopsis. Wall-associated kinases are proteins that bind to pectin molecules of the cell wall, spanning the plasma membrane. Mutation of wall-associated kinase 2 in Arabidopsis led to dependence on sugars and salts for seedling growth. These results suggest that AhDREB may influence the growth of receptor plants by regulating some growth-associated genes, despite significant growth reduction not being observed in AhDREB transgenic lines. In addition, cellulose synthase-related genes, such as cellulose synthase family protein and cellulose synthase-like D5, as well as laccase, which is related to lignin synthase, were up-regulated in transgenic poplars, indicating that the cellulose and lignin contents of the wood of transgenic poplars may be affected. Aside from reduced vegetative growth, overexpression of DREB may also influence the flowering time or fruit size in receptor plants. For example, Suo et al. [59] overexpressed the AtDREB1A gene in soybean, which up-regulated the expression of a GmVRN1-like gene in the vernalization pathway, causing delayed flowering. In our study, the results showed that 16 genes associated with pollen development were down-regulated, including S-locus lectin protein kinase family protein, ELF4-like 4 and B-box type zinc finger family protein, indicating that AhDREB overexpression in poplar may influence its reproductive development. The transcriptomic results indicated that overexpression of AhDREB in poplar may influence the cellulose and lignin contents, as well as reproductive growth.

5. Conclusions

In conclusion, we showed that heterologous expression of AhDREB in poplar could improve salt resistance without stunting growth. The observed enhanced salt tolerance may be related to mediation of the expression of genes related to stress resistance. However, development of DREB-transformed transgenic plants with tolerance to salt stress remains in the greenhouse experimental phase, and thus there is little information on the performance of DREB plants under field conditions. In addition, further study is needed into whether AhDREB influences important characteristics such as wood properties. Future studies may provide insight into stress tolerance mechanisms under both greenhouse and field conditions, and could identify other molecular traits and unintended effects associated with AhDREB.

Supplementary Materials

The following are available online at https://www.mdpi.com/1999-4907/10/3/214/s1. Table S1: The average electrical conductivity of substrate; Table S2: Transcriptome comparison statistics; Table S3: The functional analysis of differential expressed genes in transgenic poplar under salty stress.

Author Contributions

Y.L. designed the experiments, Q.G. wrote the paper, Q.G., N.L., Y.S., W.L. and Z.L. performed the experiments and analyzed the data, H.Z., Q.J., Q.Y., S.C. and W.Z. participated in the and help to complete the experiments.

Acknowledgments

The authors appreciate the financial support from the Science and Technology Development Center of the State Forestry Administration Project (JC-2017-02), the National Science and Technology Major Project of the Ministry of Science and Technology of China (2018ZX08020002-003-002), the Fundamental Research Funds for the Central Universities(2016BLPX13) and the National High Technology Research and Development Program of China (2013AA102703).

Conflicts of Interest

The authors declare no conflict of interest.

References

  1. Zhu, Z.T.; Zhang, Z.Y. The status and advances of genetic improvement of Populus tomentosa Carr. J. Beijing For. Univ. 1997, 6, 1–7. [Google Scholar]
  2. Li, J.G.; Pu, L.J.; Han, M.J.; Zhu, M.; Zhang, R.S.; Xiang, Y.Z. Soil salinization research in China: Advances and prospects. J. Geogr. Sci. 2014, 24, 943–960. [Google Scholar] [CrossRef]
  3. Choudhury, F.K.; Rivero, R.M.; Blumwald, E.; Mittler, R. Reactive oxygen species, abiotic stress and stress combination. Plant J. 2017, 90, 856–867. [Google Scholar] [CrossRef] [PubMed]
  4. Hossain, M.A.; Li, Z.G.; Hoque, T.S.; Burritt, D.J.; Fujita, M.; Munné-Bosch, S. Heat or cold priming-induced cross-tolerance to abiotic stresses in plants: key regulators and possible mechanisms. Protoplasma 2017, 1–14. [Google Scholar] [CrossRef] [PubMed]
  5. Ding, M.Q.; Hou, P.C.; Shen, X.; Wang, M.J.; Deng, S.R.; Sun, J.; Xiao, F.; Wang, R.G.; Zhou, X.Y.; Lu, C.F.; et al. Salt-induced expression of genes related to Na+/K+ and ROS homeostasis in leaves of salt-resistant and salt-sensitive poplar species. Plant Mol. Biol. 2010, 73, 251–269. [Google Scholar] [CrossRef] [PubMed]
  6. Hmida-Sayari, A.; Gargouri-Bouzid, R.; Bidani, A.; Jaoua, L.; Savoure, A.; Jaoua, S. Overexpression of delta (1)-pyrroline-5-carboxylate synthetase increases proline production and confers salt tolerance in transgenic potato plants. Plant Sci. 2005, 169, 746–752. [Google Scholar] [CrossRef]
  7. Wang, S.Y.; Chen, Q.J.; Wang, W.L.; Wang, X.C.; Lu, M.Z. Salt tolerance conferred by over-expression of OsNHX1 gene in Poplar 84K. Chin. Sci. Bull. 2005, 50, 225–229. [Google Scholar] [CrossRef]
  8. Shih, M.D.; Hoekstra, F.A.; Hsing, Y.I.C. Late embryogenesis abundant proteins. Adv. Bot. Res. 2008, 48, 211–255. [Google Scholar] [CrossRef]
  9. Kumar, V.; Shriram, V.; Kishor, P.B.K.; Narendra, J.L.; Shitole, M.G. Enhanced proline accumulation and salt stress tolerance of transgenic indica rice by over-expressing P5CSF129A gene. Plant Biotechnol. Rep. 2010, 4, 37–48. [Google Scholar] [CrossRef]
  10. Lan, T.; Gao, J.; Zeng, Q.Y. Genome-wide analysis of the LEA (late embryogenesis abundant) protein gene family in Populus trichocarpa. Tree Genet. Genomes 2013, 9, 253–264. [Google Scholar] [CrossRef]
  11. Magwanga, R.O.; Lu, P.; Kirungu, J.N.; Lu, H.J.; Wang, X.X.; Cai, X.Y.; Zhou, Z.L.; Zhang, Z.M.; Salih, H.; Wang, K.B.; et al. Characterization of the late embryogenesis abundant (LEA) proteins family and their role in drought stress tolerance in upland cotton. BMC Genet. 2018, 19, 6. [Google Scholar] [CrossRef] [PubMed]
  12. Hirayama, T.; Shinozaki, K. Research on plant abiotic stress responses in the post-genome era: Past, present and future. Plant J. 2010, 61, 1041–1052. [Google Scholar] [CrossRef] [PubMed]
  13. Jain, D.; Chattopadhyay, D. Role of DREB-like proteins in improving stress tolerance of transgenic crops. In Plant Acclimation to Environmental Stress; Springer: New York, NY, USA, 2013; pp. 147–161. [Google Scholar] [CrossRef]
  14. Hu, L.; Lu, H.; Liu, Q.; Chen, X.M.; Jiang, X.N. Overexpression of mtlD gene in transgenic Populus tomentosa improves salt tolerance through accumulation of mannitol. Tree Physiol. 2005, 25, 1273–1281. [Google Scholar] [CrossRef] [PubMed]
  15. Wang, Y.C.; Qu, G.Z.; Li, H.Y.; Wu, Y.J.; Wang, C.; Liu, G.F.; Yang, C.P. Enhanced salt tolerance of transgenic poplar plants expressing a manganese superoxide dismutase from Tamarix androssowii. Mol. Biol. Rep. 2010, 37, 1119–1124. [Google Scholar] [CrossRef] [PubMed]
  16. Yao, W.; Wang, S.; Zhou, B.; Zhou, B.R.; Jiang, T.B. Transgenic poplar overexpressing the endogenous transcription factor ERF76 gene improves salinity tolerance. Tree Physiol. 2016, 36, 896–908. [Google Scholar] [CrossRef] [PubMed]
  17. Sakuma, Y.; Liu, Q.; Dubouzet, J.G.; Abe, H.; Shinozaki, K.; Yamaguchi-Shinozaki, K. DNA-binding specificity of the ERF/AP2 domain of Arabidopsis DREBs, transcription factors involved in dehydration-and cold-inducible gene expression. Biochem. Biophys. Res. Commun. 2002, 290, 998–1009. [Google Scholar] [CrossRef] [PubMed]
  18. Dubouzet, J.G.; Sakuma, Y.; Ito, Y.; Kasuga, M.; Dubouzet, E.G.; Miura, S.; Seki, M.; Shinozaki, K.; Yamaguchi-Shinozaki, K. OsDREB genes in rice, Oryza sativa L., encode transcription activators that function in drought-, high-salt-and cold-responsive gene expression. Plant J. 2003, 33, 751–763. [Google Scholar] [CrossRef] [PubMed]
  19. Li, X.P.; Tian, A.G.; Luo, G.Z.; Gong, Z.Z.; Zhang, J.S.; Chen, S.Y. Soybean DRE-binding transcription factors that are responsive to abiotic stresses. Theor. Appl. Genet. 2005, 110, 1355–1362. [Google Scholar] [CrossRef] [PubMed]
  20. Liu, S.X.; Wang, X.L.; Wang, H.W.; Xin, H.B.; Yang, X.H.; Yan, J.B.; Li, J.S.; Tran, L.P.; Shinozaki, K.; Yamaguchi-Shinozaki, K.; et al. Genome-wide analysis of ZmDREB genes and their association with natural variation in drought tolerance at seedling stage of Zea mays L. PloS Genet. 2013, 9, e1003790. [Google Scholar] [CrossRef] [PubMed]
  21. Artlip, T.S.; Wisniewski, M.E.; Bassett, C.L.; Norelli, J.L. CBF gene expression in peach leaf and bark tissues is gated by a circadian clock. Tree Physiol. 2013, 33, 866–877. [Google Scholar] [CrossRef] [PubMed]
  22. Wu, H.L.; Lv, H.; Li, L.; Mu, S.H.; Li, X.P.; Gao, J. Genome-wide analysis of the AP2/ERF transcription factors family and the expression patterns of DREB genes in Moso Bamboo (Phyllostachys edulis). PLoS ONE 2015, 10, e0126657. [Google Scholar] [CrossRef] [PubMed]
  23. Liao, X.; Guo, X.; Wang, Q.; Wang, Y.T.; Zhao, D.; Yao, L.P.; Wang, S.; Liu, G.J.; Li, T.H. Overexpression of MsDREB6.2 results in cytokinin-deficient developmental phenotypes and enhances drought tolerance in transgenic apple plants. Plant J. 2017, 89, 510–526. [Google Scholar] [CrossRef] [PubMed]
  24. Atia, A.; Barhoumi, Z.; Debez, A.; Hkiri, S.; Abdelly, C.; Smaoui, A.; Chaffei, C.; Gouia, H. Plant Hormones: Potent Targets for Engineering Salinity Tolerance in Plants. In Salinity Responses and Tolerance in Plants; Springer: New York, NY, USA, 2018; Volume 1, pp. 159–184. [Google Scholar] [CrossRef]
  25. Agarwal, P.K.; Agarwal, P.; Reddy, M.K.; Sopory, S.K. Role of DREB transcription factors in abiotic and biotic stress tolerance in plants. Plant Cell Rep. 2006, 25, 1263–1274. [Google Scholar] [CrossRef] [PubMed]
  26. Nakashima, K.; Ito, Y.; Yamaguchi-Shinozaki, K. Transcriptional regulatory networks in response to abiotic stresses in Arabidopsis and grasses. Plant Physiol. 2018, 149, 88–95. [Google Scholar] [CrossRef] [PubMed]
  27. Jacob, P.; Hirt, H.; Bendahmane, A. The heat-shock protein/chaperone network and multiple stress resistance. Plant Biotechnol. J. 2017, 15, 405–414. [Google Scholar] [CrossRef] [PubMed]
  28. Jiang, Q.Y.; Niu, F.J.; Sun, X.J.; Hu, Z.; Li, X.H.; Ma, Y.Z.; Zhang, H. RNA-seq analysis of unintended effects in transgenic wheat overexpressing the transcription factor GmDREB1. Crop J. 2017, 5, 207–218. [Google Scholar] [CrossRef]
  29. Miki, B.; Abdeen, A.; Manabe, Y.; MacDonald, P. Selectable marker genes and unintended changes to the plant transcriptome. Plant Biotechnol. J. 2009, 7, 211–218. [Google Scholar] [CrossRef] [PubMed]
  30. Abdeen, A.; Schnell, J.; Miki, B. Transcriptome analysis reveals absence of unintended effects in drought-tolerant transgenic plants overexpressing the transcription factor ABF3. BMC Genom. 2010, 11, 69. [Google Scholar] [CrossRef] [PubMed]
  31. Quan, R.D.; Shang, M.; Zhang, H.; Zhao, Y.X.; Zhang, J.R. Improved chilling tolerance by transformation with betA gene for the enhancement of glycinebetaine synthesis in maize. Plant Sci. 2004, 166, 141–149. [Google Scholar] [CrossRef]
  32. Bates, L.S.; Waldren, R.P.; Teare, I.D. Rapid determination of free proline for water-stress studies. Plant Soil 1973, 39, 205–207. [Google Scholar] [CrossRef]
  33. Becana, M.; Aparicio-Tejo, P.; Irigoyen, J.J.; Sanchez-Diaz, M. Some enzymes of hydrogen peroxide metabolism in leaves and root nodules of Medicago sativa. Plant Physiol. 1986, 82, 1169–1171. [Google Scholar] [CrossRef] [PubMed]
  34. Civello, P.M.; Martinez, G.A.; Chaves, A.R.; Anon, M.C. Peroxidase from strawberry fruit (Fragaria ananassa Duch.): partial purification and determination of some properties. J. Agric. Food Chem. 1995, 43. [Google Scholar] [CrossRef]
  35. Sun, H.P.; Li, F.; Xu, Z.J.; Sun, M.L.; Cong, H.Q.; Qiao, F.; Zhong, X.H. De novo leaf and root transcriptome analysis to identify putative genes involved in triterpenoid saponins biosynthesis in Hedera helix L. PLoS ONE 2017, 12, e0182243. [Google Scholar] [CrossRef] [PubMed]
  36. Mortazavi, A.; Williams, B.A.; McCue, K.; Schaeffer, L.; Wold, B. Mapping and quantifying mammalian transcriptomes by RNA-Seq. Nat. Methods 2008, 5, 621–628. [Google Scholar] [CrossRef] [PubMed]
  37. Du, Q.; Wang, L.; Yang, X.; Gong, C.; Zhang, D. Populus endo-β-1,4-glucanases gene family: genomic organization, phylogenetic analysis, expression profiles and association mapping. Planta 2015, 241, 1417–1434. [Google Scholar] [CrossRef] [PubMed]
  38. Moud, A.M.; Maghsoudi, K. Salt stress effects on respiration and growth of germinated seeds of different wheat (Triticum aestivum L.) cultivars. World J. Agric. Sci. 2008, 4, 351–358. [Google Scholar]
  39. Moradi, F.; Ismail, A.M. Responses of photosynthesis, chlorophyll fluorescence and ROS-scavenging systems to salt stress during seedling and reproductive stages in rice. Ann. Bot. 2007, 99, 1161–1173. [Google Scholar] [CrossRef] [PubMed]
  40. Shan, C.; Liu, H.; Zhao, L.; Wang, X. Effects of exogenous hydrogen sulfide on the redox states of ascorbate and glutathione in maize leaves under salt stress. Biol. Plantarum 2014, 58, 169–173. [Google Scholar] [CrossRef]
  41. Ramanjulu, S.; Bartels, D. Drought-and desiccation-induced modulation of gene expression in plants. Plant Cell Environ. 2002, 25, 141–151. [Google Scholar] [CrossRef] [PubMed]
  42. Bao, A.K.; Du, B.Q.; Touil, L.; Kang, P.; Wang, Q.L.; Wang, S.M. Co-expression of tonoplast Cation/H+ antiporter and H+-pyrophosphatase from xerophyte Zygophyllum xanthoxylum improves alfalfa plant growth under salinity, drought and field conditions. Plant Biotechnol. J. 2016, 14, 964–975. [Google Scholar] [CrossRef] [PubMed]
  43. Farooq, M.; Hussain, M.; Wahid, A.; Siddique, K.H.M. Drought stress in plants: An overview. In Plant Responses to Drought Stress; Springer: New York, NY, USA, 2012; pp. 1–33. [Google Scholar] [CrossRef]
  44. Diaz-Vivancos, P.; Barba-Espín, G.; Hernández, J.A. Elucidating hormonal/ROS networks during seed germination: insights and perspectives. Plant Cell Rep. 2013, 32, 1491–1502. [Google Scholar] [CrossRef] [PubMed]
  45. Shi, H.B.; Luo, J.; Yao, D.W.; Zhu, J.J.; Xu, H.F.; Shi, H.P.; Loor, J.J. Peroxisome proliferator-activated receptor-γ stimulates the synthesis of monounsaturated fatty acids in dairy goat mammary epithelial cells via the control of stearoyl-coenzyme A desaturase. J. Dairy Sci. 2013, 96, 7844–7853. [Google Scholar] [CrossRef] [PubMed]
  46. Hajiboland, R. Reactive oxygen species and photosynthesis. In Oxidative Damage to Plants; Elsevier: Amsterdam, Netherlands, 2014; pp. 1–63. [Google Scholar] [CrossRef]
  47. Bompy, F.; Lequeue, G.; Imbert, D.; Dulormne, M. Increasing fluctuations of soil salinity affect seedling growth performances and physiology in three Neotropical mangrove species. Plant Soil 2014, 380, 399–413. [Google Scholar] [CrossRef]
  48. Szabados, L.; Savoure, A. Proline: a multifunctional amino acid. Trends Plant Sci. 2010, 15, 89–97. [Google Scholar] [CrossRef] [PubMed]
  49. Kasuga, M.; Liu, Q.; Miura, S.; Yamaguchi-Shinozaki, K.; Shinozaki, K. Improving plant drought, salt, and freezing tolerance by gene transfer of a single stress-inducible transcription factor. Nat. Biotechnol. 1999, 17, 287. [Google Scholar] [CrossRef] [PubMed]
  50. Maruyama, K.; Sakuma, Y.; Kasuga, M.; Ito, Y.; Seki, M.; Goda, H.; Shimada, Y.; Yoshida, S.; Shinozaki, K.; Yamaguchi-Shinozaki, K. Identification of cold-inducible downstream genes of the Arabidopsis DREB1A/CBF3 transcriptional factor using two microarray systems. Plant J. 2004, 38, 982–993. [Google Scholar] [CrossRef] [PubMed]
  51. Zhao, M.G.; Tian, Q.Y.; Zhang, W.H. Nitric oxide synthase-dependent nitric oxide production is associated with salt tolerance in Arabidopsis. Plant Physiol. 2007, 144, 206–217. [Google Scholar] [CrossRef] [PubMed]
  52. Zhang, X.X.; Tang, Y.J.; Ma, Q.B.; Yang, C.Y.; Mu, Y.H.; Suo, H.C.; Luo, L.H.; Nian, H. OsDREB2A, a rice transcription factor, significantly affects salt tolerance in transgenic soybean. PLoS ONE 2013, 8, e83011. [Google Scholar] [CrossRef] [PubMed]
  53. Shinozaki, K.; Yamaguchi-Shinozaki, K. Gene expression and signal transduction in water-stress response. Plant Physiol. 1997, 115, 327. [Google Scholar] [CrossRef] [PubMed]
  54. Mondini, L.; Nachit, M.M.; Pagnotta, M.A. Allelic variants in durum wheat (Triticum turgidum L. Szabados var. durum) DREB genes conferring tolerance to abiotic stresses. Mol. Genet. Genom. 2015, 290, 531–544. [Google Scholar] [CrossRef] [PubMed]
  55. Artlip, T.S.; Wisniewski, M.E.; Norelli, J.L. Field evaluation of apple overexpressing a peach CBF gene confirms its effect on cold hardiness, dormancy, and growth. Environ. Exp. Bot. 2014, 106, 79–86. [Google Scholar] [CrossRef]
  56. Li, J.; Sima, W.; Ouyang, B.; Wang, T.; Ziaf, K.; Luo, Z.; Liu, L.; Li, H.; Chen, M.; Huang, Y.; et al. Tomato SlDREB gene restricts leaf expansion and internode elongation by downregulating key genes for gibberellin biosynthesis. J. Exp. Bot. 2012, 63, 6407–6420. [Google Scholar] [CrossRef] [PubMed]
  57. Chen, J.H.; Xia, X.L.; Yin, W.L. Expression profiling and functional characterization of a DREB2-type gene from Populus euphratica. Biochem. Biophys. Res. Commun. 2009, 378, 483–487. [Google Scholar] [CrossRef] [PubMed]
  58. Chan, Z.; Bigelow, P.J.; Loescher, W.; Grumet, R. Comparison of salt stress resistance genes in transgenic Arabidopsis thaliana indicates that extent of transcriptomic change may not predict secondary phenotypic or fitness effects. Plant Biotechnol. J. 2012, 10, 284–300. [Google Scholar] [CrossRef] [PubMed]
  59. Suo, H.; Ma, Q.; Ye, K.; Yang, C.; Tang, Y.; Hao, J.; Zhang, Z.Y.J.; Nian, H. Overexpression of AtDREB1A causes a severe dwarf phenotype by decreasing endogenous gibberellin levels in soybean [Glycine max (L.) Merr.]. PLoS ONE 2012, 7, e45568. [Google Scholar] [CrossRef] [PubMed]
Figure 1. Growth after sodium chloride (NaCl) treatment. CK: non-transgenic poplar treated with 0.6% NaCl after 15 days, T-12: transgenic line T-12 treated with 0.6% NaCl after 15 days; T-46: transgenic line T-46 treated with 0.6% NaCl after 15 days, CK (0%): non-transgenic poplar treated with 0% NaCl after 15 days.
Forests 10 00214 g001
Figure 2. The stem height (A) and base diameter (B) increases of poplar after NaCl treatment. “*” denotes a significant difference (p < 0.05, α = 0.05) between treatments. Error bars represent the standard deviation.
Forests 10 00214 g002
Figure 3. The variations in physiological and biochemical properties after NaCl treatment: Malondialdehyde (MDA) content (A), relative electrolyte leakage (B), proline content (C), SOD activity (D), POD activity (E), chlorophyll content (F). “*” denotes a significant difference (p < 0.05, α = 0.05) between treatments. Error bars represent the standard deviation.
Forests 10 00214 g003
Figure 4. Variations in photosynthesis parameters after NaCl treatment, net photosynthesis rate, Pn (A); stomatal conductance, Gs (B); transpiration rate, Tr (C); “*” denotes a significant difference (p < 0.05, α = 0.05) between treatments. Error bars represent the standard deviation.
Forests 10 00214 g004
Figure 5. Differentially expressed gene function enrichment analysis after NaCl treatment.
Forests 10 00214 g005
Figure 6. Differentially expressed gene function enrichment analysis under non-stress conditions.
Forests 10 00214 g006
Table 1. Genes associated with stress resistance among up-regulated genes in transgenic poplar.
Gene IDFunction DescriptionTair IDlog2FCp-Value
Genes have cri-regulatory element “CCGAC” in promotor regions
Potri.002G186600WRKY transcription factorAT4G01720.1Inf2.42 × 10−4
Potri.003G182200WRKY transcription factorAT1G80840.11.991.25 × 10−3
Potri.004G002800Phosphotyrosine protein phosphatases superfamily proteinAT1G05000.1Inf1.27 × 10−3
Potri.011G021100Phosphotyrosine protein phosphatases superfamily proteinAT4G03960.11.221.54 × 10−3
Potri.013G083600Peroxidase superfamily proteinAT5G05340.16.233.52 × 10−45
Potri.005G135300Peroxidase superfamily proteinAT1G49570.1Inf1.87 × 10−4
Potri.001G107800osmotin 34AT4G11650.13.811.89 × 10−9
Potri.018G003800NAC transcription factorAT2G24430.24.278.08 × 10−5
Potri.005G164900myb transcription factorAT1G34670.14.044.48 × 10−4
Potri.008G073700laccase 5AT2G40370.14.951.75 × 10−7
Potri.006G049200heat shock transcription factor B3AT2G41690.14.631.55 × 10−13
Potri.002G015100glutathione S-transferase F11AT3G03190.11.382.08 × 10−5
Potri.001G105200glutathione peroxidase 6AT4G11600.11.072.23 × 10−3
Potri.007G126600glutathione peroxidase 2AT2G31570.11.743.18 × 10−3
Potri.005G020900Drought-responsive family proteinAT3G05700.11.174.86 × 10−5
Potri.003G134700Disease resistance-responsive family proteinAT1G64160.12.005.31 × 10−14
Potri.T047500disease resistance proteinAT5G17680.13.861.41 × 10−45
Potri.013G037300Disease resistance protein familyAT5G36930.11.163.64 × 10−3
Potri.006G044600dehydration-induced protein (ERD15)AT2G41430.51.401.86 × 10−3
Potri.007G072100cytochrome P450, family 86, subfamily B, polypeptide 1AT5G23190.1Inf4.64 × 10−3
Potri.004G106600cytochrome P450, family 82, subfamily G, polypeptide 1AT3G25180.13.181.68 × 10−24
Potri.001G334700cytochrome P450, family 82, subfamily C, polypeptide 4AT4G31940.11.276.94 × 10−4
Potri.003G146800cytochrome P450, family 78, subfamily A, polypeptide 6AT2G46660.11.501.31 × 10−4
Potri.014G072300cytochrome P450, family 704, subfamily A, polypeptide 2AT2G45510.11.071.41 × 10−4
Potri.001G167800Cytochrome P450 superfamily proteinAT5G07990.12.302.47 × 10−5
Potri.014G019200cytochrome B5 isoform DAT5G48810.14.412.60 × 10−5
Potri.017G054300cytochrome B5 isoform BAT2G32720.12.361.71 × 10−6
Potri.004G149100cold-regulated 413-plasma membrane 2AT3G50830.12.077.77 × 10−7
Potri.009G116400cold, circadian rhythm, and RNA binding 1AT4G39260.31.952.25 × 10−9
Potri.019G089000basic helix-loop-helix (bHLH) DNA-binding superfamily proteinAT1G68810.12.599.22 × 10−10
Potri.009G081400basic helix-loop-helix (bHLH) DNA-binding superfamily proteinAT4G37850.1Inf8.35 × 10−6
Potri.009G092900Auxin-responsive GH3 family proteinAT2G14960.15.122.01 × 10−8
Potri.012G0063002-oxoglutarate (2OG) and Fe(II)-dependent oxygenase superfamily proteinAT5G24530.12.192.62 × 10−13
Potri.005G1827002-oxoglutarate (2OG) and Fe(II)-dependent oxygenase superfamily proteinAT1G77330.15.573.93 × 10−10
Genes have no cri-regulatory element “CCGAC” in promotor regions
Potri.019G123500WRKY DNA-binding protein 26AT2G30490.11.355.01 × 10−4
Potri.005G179200thylakoidal ascorbate peroxidaseAT1G77490.11.924.0 × 10−4
Potri.012G002500pyruvate kinase family proteinAT3G49160.13.7632.50 × 10−4
Potri.007G021300S-adenosyl-L-methionine-dependent methyltransferases superfamily proteinAT3G11480.14.366.45 × 10−48
Potri.006G222200S-adenosyl-L-methionine-dependent methyltransferases superfamily proteinAT5G19530.11.788.77 × 10−8
Potri.001G404600Peroxisomal membrane 22 kDa family proteinAT4G21380.11.475.56 × 10−8
Potri.008G106400Peroxidase superfamily proteinAT2G39470.13.171.12 × 10−23
Potri.005G195700Peroxidase superfamily proteinAT3G11430.13.645.63 × 10−31
Potri.006G221800myb transcription factor 4AT4G00430.11.071.40 × 10−3
Potri.002G173900myb transcription factor 3AT2G43460.13.602.47 × 10−24
Potri.005G234500salt tolerance homolog2AT1G75540.12.083.02 × 10−9
Potri.009G037300highly ABA-induced PP2C gene 2AT2G37170.14.049.20 × 10−9
Potri.004G235400cytochrome P450, family 707, subfamily A, polypeptide 1AT4G18550.13.073.43 × 10−7
Potri.003G066400Cytochrome P450 superfamily proteinAT1G61720.13.014.89 × 10−21
Potri.001G167900Cytochrome P450 superfamily proteinAT2G33510.12.262.81 × 10−10
Potri.005G113400basic helix-loop-helix (bHLH) DNA-binding superfamily proteinAT1G06550.12.761.43 × 10−5
Potri.009G1076002-oxoglutarate (2OG) and Fe(II)-dependent oxygenase superfamily proteinAT5G13930.11.951.06 × 10−8
Table 2. Differentially expressed genes in transgenic poplar under non-salt treatment.
Gene IDFunction descriptionTair IDlog2FCp-Value
Potri.005G064300ABC-2 type transporter family proteinAT2G13610.11.600.00020675
Potri.014G081000acetyl Co-enzyme a carboxylase carboxyltransferase alpha subunitAT2G38040.21.835.05 × 10−10
Potri.005G229700ADPGLC-PPase large subunitAT1G27680.1−1.386.79 × 10−9
Potri.001G173700alpha/beta-Hydrolases superfamily proteinAT3G15650.2−2.806.58 × 10−8
Potri.004G188100arogenate dehydratase 6AT1G08250.1−1.781.45 × 10−16
Potri.002G057700ATP-dependent caseinolytic (Clp) protease/crotonase family proteinAT1G06550.1−1.021.36 × 10−6
Potri.019G089000basic helix-loop-helix (bHLH) DNA-binding superfamily proteinAT1G68810.13.532.90 × 10−12
Potri.003G167500BCL-2-associated athanogene 5AT1G12060.1−1.678.68 × 10−5
Potri.007G055100BTB and TAZ domain protein 4AT5G67480.2−1.534.51 × 10−10
Potri.008G103900Ca2+-binding protein 1AT5G49480.1−1.382.76 × 10−5
Potri.013G112500calcium-dependent protein kinase 2AT1G35670.11.884.92 × 10−10
Potri.008G160200CBL-interacting protein kinase 4AT4G14580.1−1.290.00029303
Potri.001G066400CCR-likeAT3G26740.12.561.20 × 10−22
Potri.010G113400Chaperone DnaJ-domain superfamily proteinAT1G71000.1−1.491.49 × 10−9
Potri.010G084300CVP2 like 1AT2G32010.2−2.154.23 × 10−13
Potri.001G351400cyclophilin 38AT3G01480.11.135.07 × 10−5
Potri.005G229500dihydroflavonol 4-reductaseAT5G42800.1−1.382.02 × 10−10
Potri.005G113700flavanone 3-hydroxylaseAT3G51240.1−1.101.53 × 10−6
Potri.012G106500Glycosyl hydrolase family 38 proteinAT5G13980.21.063.09 × 10−5
Potri.016G138600Glycosyl hydrolase superfamily proteinAT5G01930.11.420.00014768
Potri.008G151700Haloacid dehalogenase-like hydrolase (HAD) superfamily proteinAT2G32150.1−1.241.56 × 10−7
Potri.004G073600heat shock protein 90.1AT5G52640.1−1.182.27 × 10−7
Potri.008G165200HR-like lesion-inducing protein-relatedAT4G14420.1−1.336.27 × 10−7
Potri.009G070800Lateral root primordium (LRP) protein-relatedAT5G12330.41.270.00040463
Potri.012G088100Leucine-rich receptor-like protein kinase family proteinAT5G56040.22.700.00026452
Potri.001G113100leucoanthocyanidin dioxygenaseAT4G22880.2−1.491.07 × 10−12
Potri.019G067500Major facilitator superfamily proteinAT1G59740.12.810.00010361
Potri.002G173900myb domain protein 3AT3G13540.1−1.192.27 × 10−7
Potri.006G178700NAD(P)-binding Rossmann-fold superfamily proteinAT2G23910.1−1.113.45 × 10−5
Potri.008G116500NAD(P)-binding Rossmann-fold superfamily proteinAT1G75290.1−1.401.31 × 10−10
Potri.002G234000NAD(P)-linked oxidoreductase superfamily proteinAT1G60690.12.087.28 × 10−5
Potri.019G093400nine-cis-epoxycarotenoid dioxygenase 4AT4G19170.11.441.14 × 10−10
Potri.008G186500Octicosapeptide/Phox/Bem1p family proteinAT3G26510.41.278.82 × 10−8
Potri.001G404600Peroxisomal membrane 22 kDa (Mpv17/PMP22) family proteinAT1G52870.22.276.27 × 10−19
Potri.016G091100PHE ammonia lyase 1AT2G37040.1−1.606.90 × 10−15
Potri.008G186600phosphate transporter 2;1AT3G26570.22.177.95 × 10−8
Potri.011G142300photosystem II subunit RAT1G79040.11.706.07 × 10−10
Potri.006G011200Protein of unknown function (DUF594)AT5G45460.12.686.81 × 10−10
Potri.010G210000PsbP-like protein 2AT2G39470.12.011.41 × 10−12
Potri.001G001600Pyruvate kinase family proteinAT5G56350.1−1.151.15 × 10−18
Potri.001G098300respiratory burst oxidase protein FAT1G64060.1−1.195.42 × 10−5
Potri.001G055300Rubber elongation factor protein (REF)AT1G67360.2−1.073.27 × 10−19
Potri.017G134900transmembrane kinase 1AT1G66150.13.777.90 × 10−11
Potri.002G195800TRICHOME BIREFRINGENCE-LIKE 6AT3G62390.1−1.813.95 × 10−6
Potri.006G095000tubulin beta 8AT5G23860.2−1.862.57 × 10−10
Potri.013G118700UDP-glucosyl transferase 78D2AT5G17050.1−1.731.81 × 10−10
Potri.014G039000Uncharacterised protein family (UPF0114)AT4G19390.1−2.551.71 × 10−1
Potri.005G064300ABC-2 type transporter family proteinAT2G13610.11.604.13 × 10−11

