1. Introduction
With the growth of the world’s population, more energy has been consumed in the past few decades than ever before. Fossil fuel, as the current, dominant primary energy source (servicing 85% of the global demand), produces a large amount of greenhouse gases [
1]. To reduce greenhouse gas emissions, renewable and sustainable energy sources have attracted great interest. To utilize solar energy, a range of energy conversion techniques have been proposed, such as the conversion of solar light and heat to electricity by photovoltaic [
2,
3] and thermoelectric [
4] devices, respectively. Among them, the simplest method is direct solar-to-thermal energy conversion. A solar thermal conversion system generally consists of two essential components, i.e., solar collectors that convert solar irradiation into thermal energy and thermal energy storage (TES) materials that store and later release the converted thermal energy for various useful purposes. It is desirable for the solar collector to be a black color for absorbing light across a wide wavelength range. Excellent heat transfer from the solar collector to the TES material is also necessary to prevent the overheating of the collector. To this end, in existing solar thermal conversion systems, the passages that carry the TES are usually embedded into the solar absorber plate (
Scheme 1a) to ensure good thermal conduct between the absorber plate and the TES.
Organic phase change materials (PCMs), which store and release thermal energy in the form of latent heat during the solid/liquid phase change, are often used as TES materials in solar thermal systems [
5] due to their low cost, good thermal and chemical stability, relatively high storage density, and small temperature variations during phase change. However, organic PCMs suffer from intrinsic low thermal conductivity, which limits their rate of thermal energy uptake and release. High-thermal-conductivity fillers, such as graphene [
6,
7,
8,
9,
10,
11], carbon nanotubes (CNTs) [
12,
13,
14,
15], and carbon fibers [
16], have been dispersed into organic PCMs to enhance thermal conductivity.
In addition to low thermal conductivity, the leakage of PCMs due to their un-stabilized form after melting also hinders their practical applications. Microencapsulation by polymer shells [
17,
18,
19] has been used to contain liquid PCMs, but the polymer shells typically reduce the overall thermal conductivity of PCMs and deteriorate under UV irradiation. Recently, researchers have discovered that physical absorption of PCMs in porous carbonaceous matrices, such as graphene foam [
6], graphene aerogel [
9], carbon nanotube sponges [
20], etc., has the dual effects of reducing leakage and enhancing thermal conductivity. However, these matrix materials require complicated and multiple-step synthesis methods, which greatly limits their practical applications.
In this study, to overcome the limitation of existing carbonaceous matrices, a simple and abundant matrix material from carbonized wood will be utilized for the first time to develop a novel PCM composite. Specifically, the proposed PCM composite consists of carbonized wood (CW) monolithic infiltrated with organic PCM and sealed with graphite coating, which closely mimics the solar collector design in existing solar thermal systems (
Scheme 1b). The model organic PCM used in this study is n-octadecane, because its phase change temperature of 28 °C is close to the most comfortable indoor temperature, which gives the proposed composite good potential for building energy applications. Thermal property characterization of the as-synthesized n-octadecane/CW composite shows that compared with pristine n-octadecane the composite demonstrates a 143% increase of thermal conductivity with no significant reduction in latent heat (209 kJ·kg
−1 compared with pure n-octadecane at 233 kJ·kg
−1). The composite also efficiently absorbs solar light and converts it into thermal energy with an apparent 97% solar-to-thermal conversion efficiency. No leakage of PCM was observed when the temperature of the composite was significantly above the melting point of the PCM. The abundancy and facile synthesis of the CW, the appropriate phase change temperature of the PCM, the high thermal conductivity, and the excellent solar thermal conversion efficiency make the proposed n-octadecane/CW composite promising for building heating applications.
3. Results and Discussion
The natural basswood was first carbonized in a furnace filled with argon (Ar) to form CW, and the CW served as matrix for both physisorption of PCM and thermal conductivity enhancement. PCM was infiltrated into the CW to form a carbonized wood–PCM composite (CW–PCM). Graphite was coated on the surface of CW–PCM to form an encapsulated composite (EN-CW–PCM). The CW showed weight loss and anisotropic shrinkage (
Figure S1) compared with the starting material of natural wood, which is ascribed to the removal of hydrogen- and oxygen-containing groups in the wood. Previous studies on wood carbonization suggested that the splitting off of the cellulose structure occurs between 150 and 240 °C and aromatization forming graphitic layers happens above 400 °C [
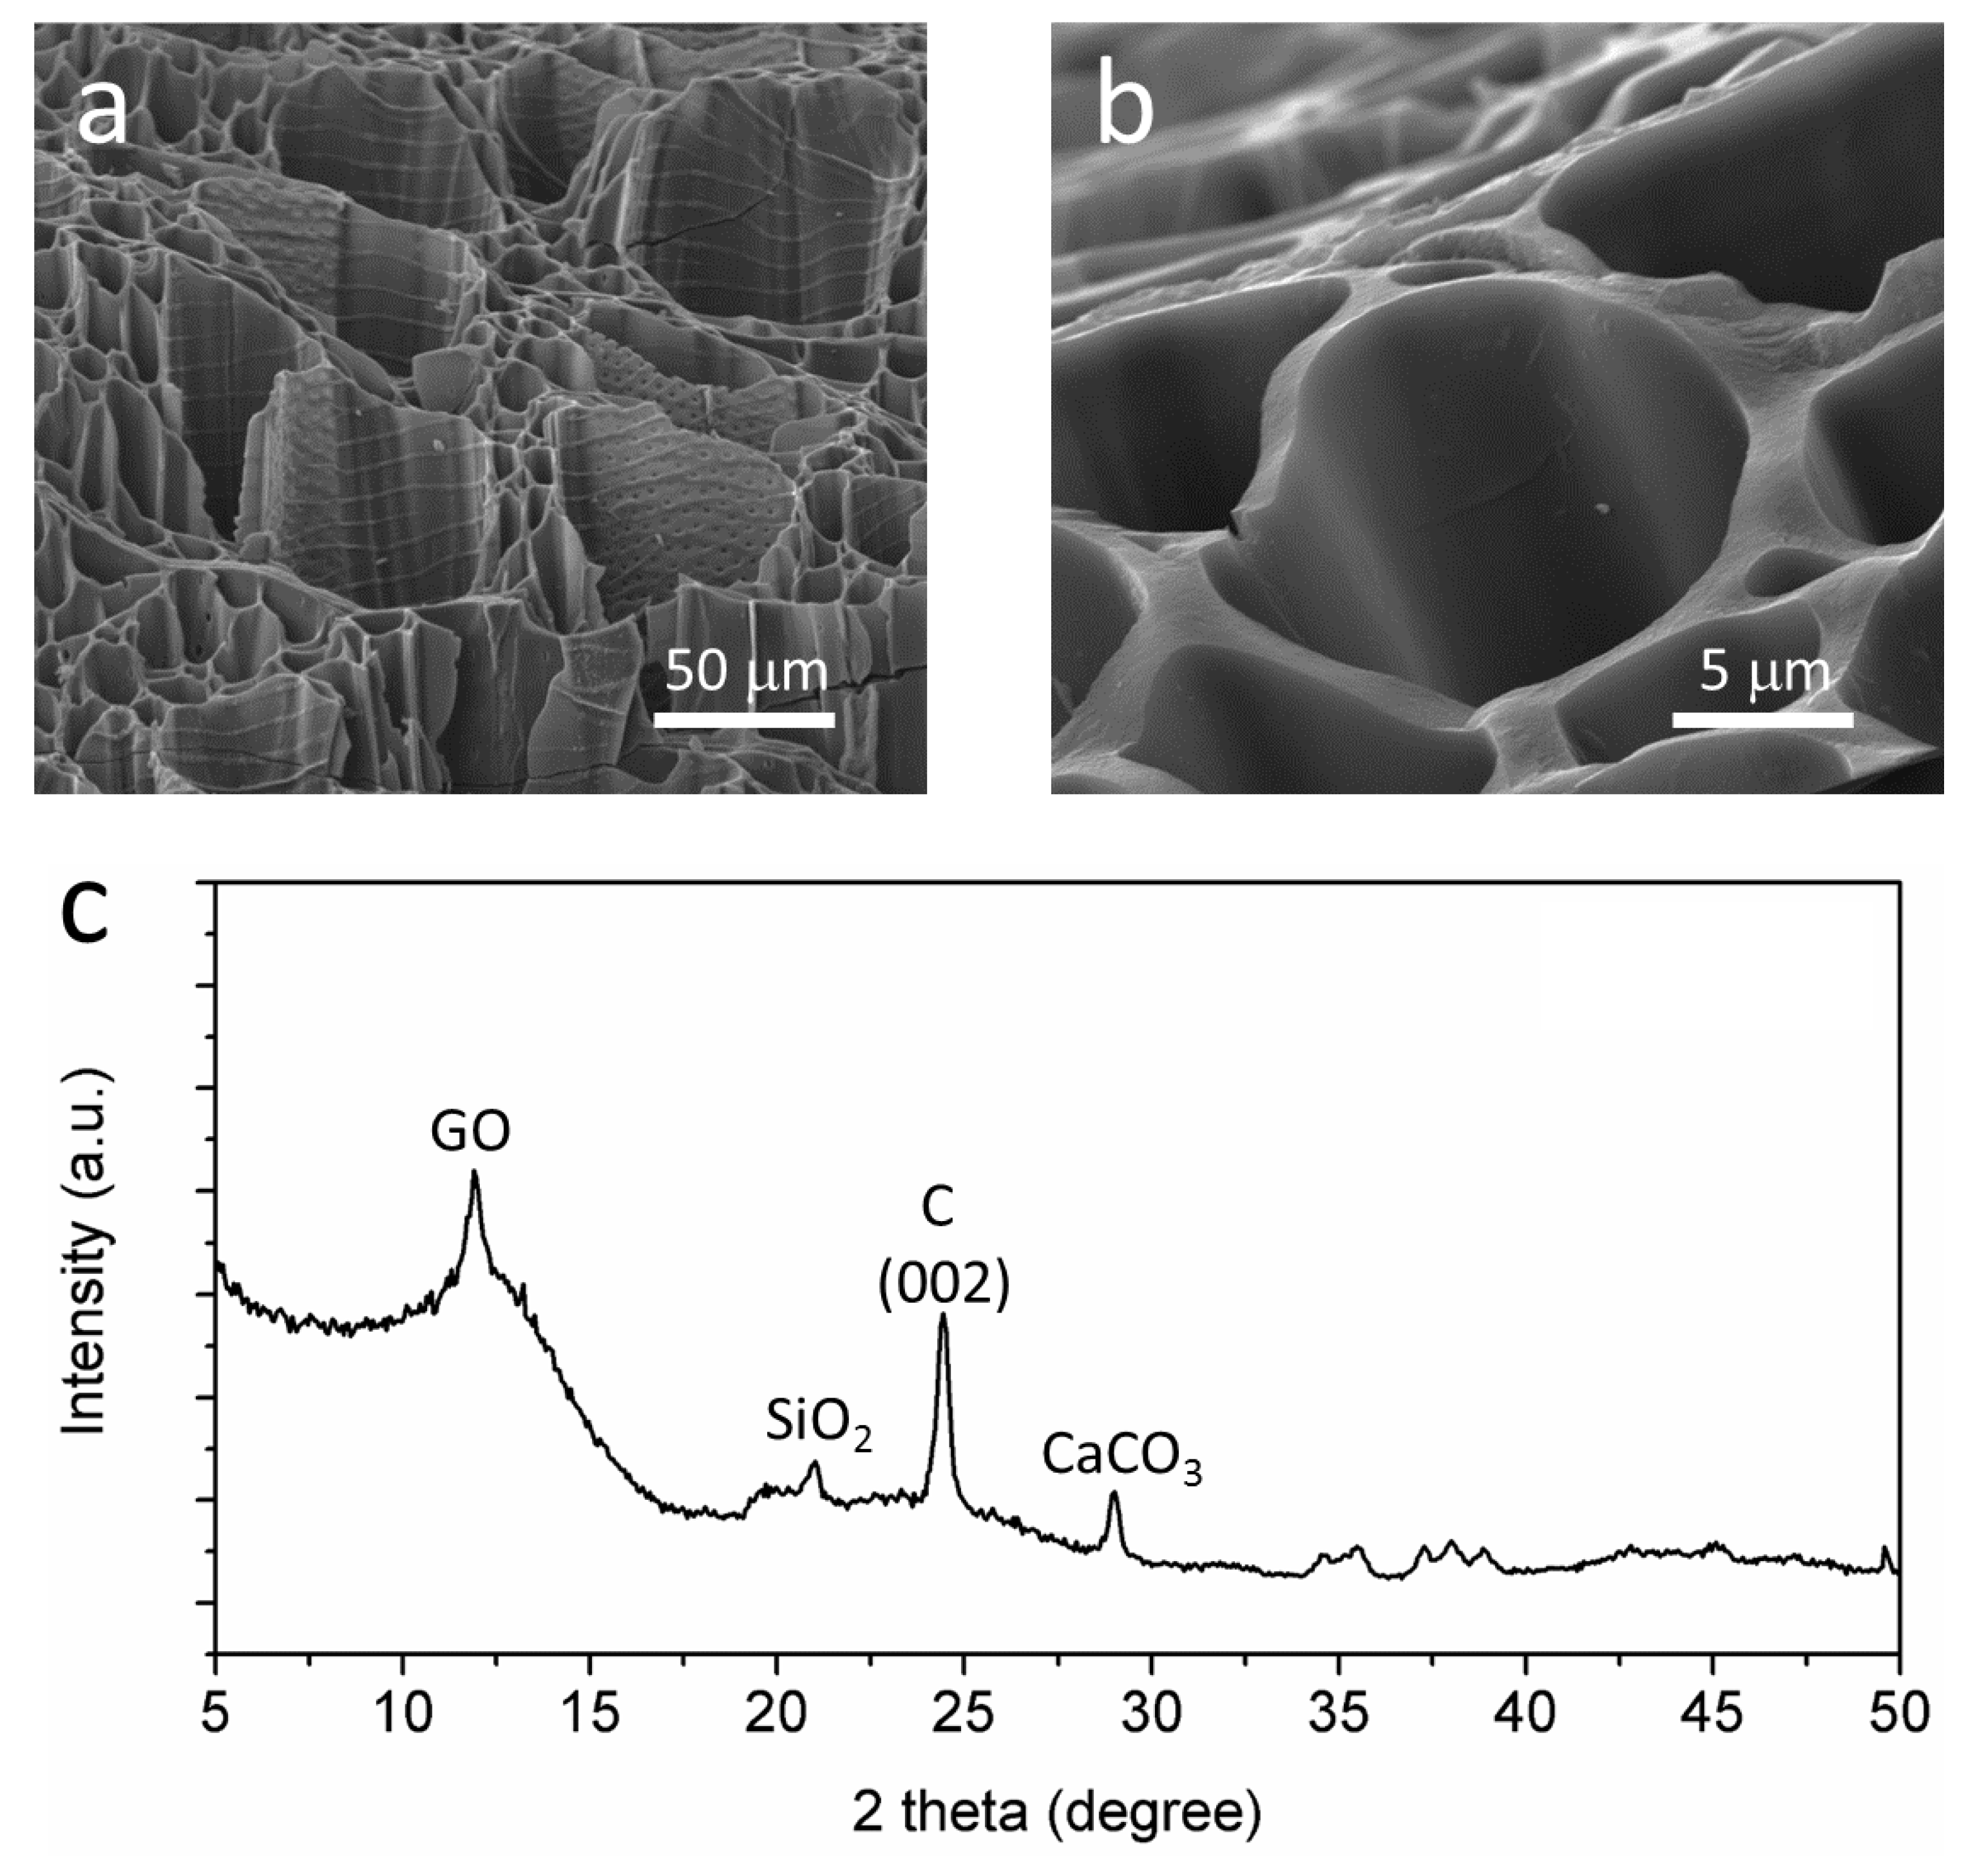
21]. Because the carbonization temperature used in this study reached 1000 °C, both the aforementioned processes were expected to occur. The CW maintained the porous and continuous structure of natural wood as shown in the SEM images (
Figure 1a,b). There are numerous parallel channels in the CW, with channel size varying from 5 to 100 μm. The XRD pattern (
Figure 1c) indicated that the main components of the CW were (002) graphitic carbon and graphite oxide (GO) with some impurities, such as calcite (CaCO
3) and silica (SiO
2), from earth. The CW was not pure graphitic carbon, as reported before, with a much higher carbonization temperature, typically 1800 °C.
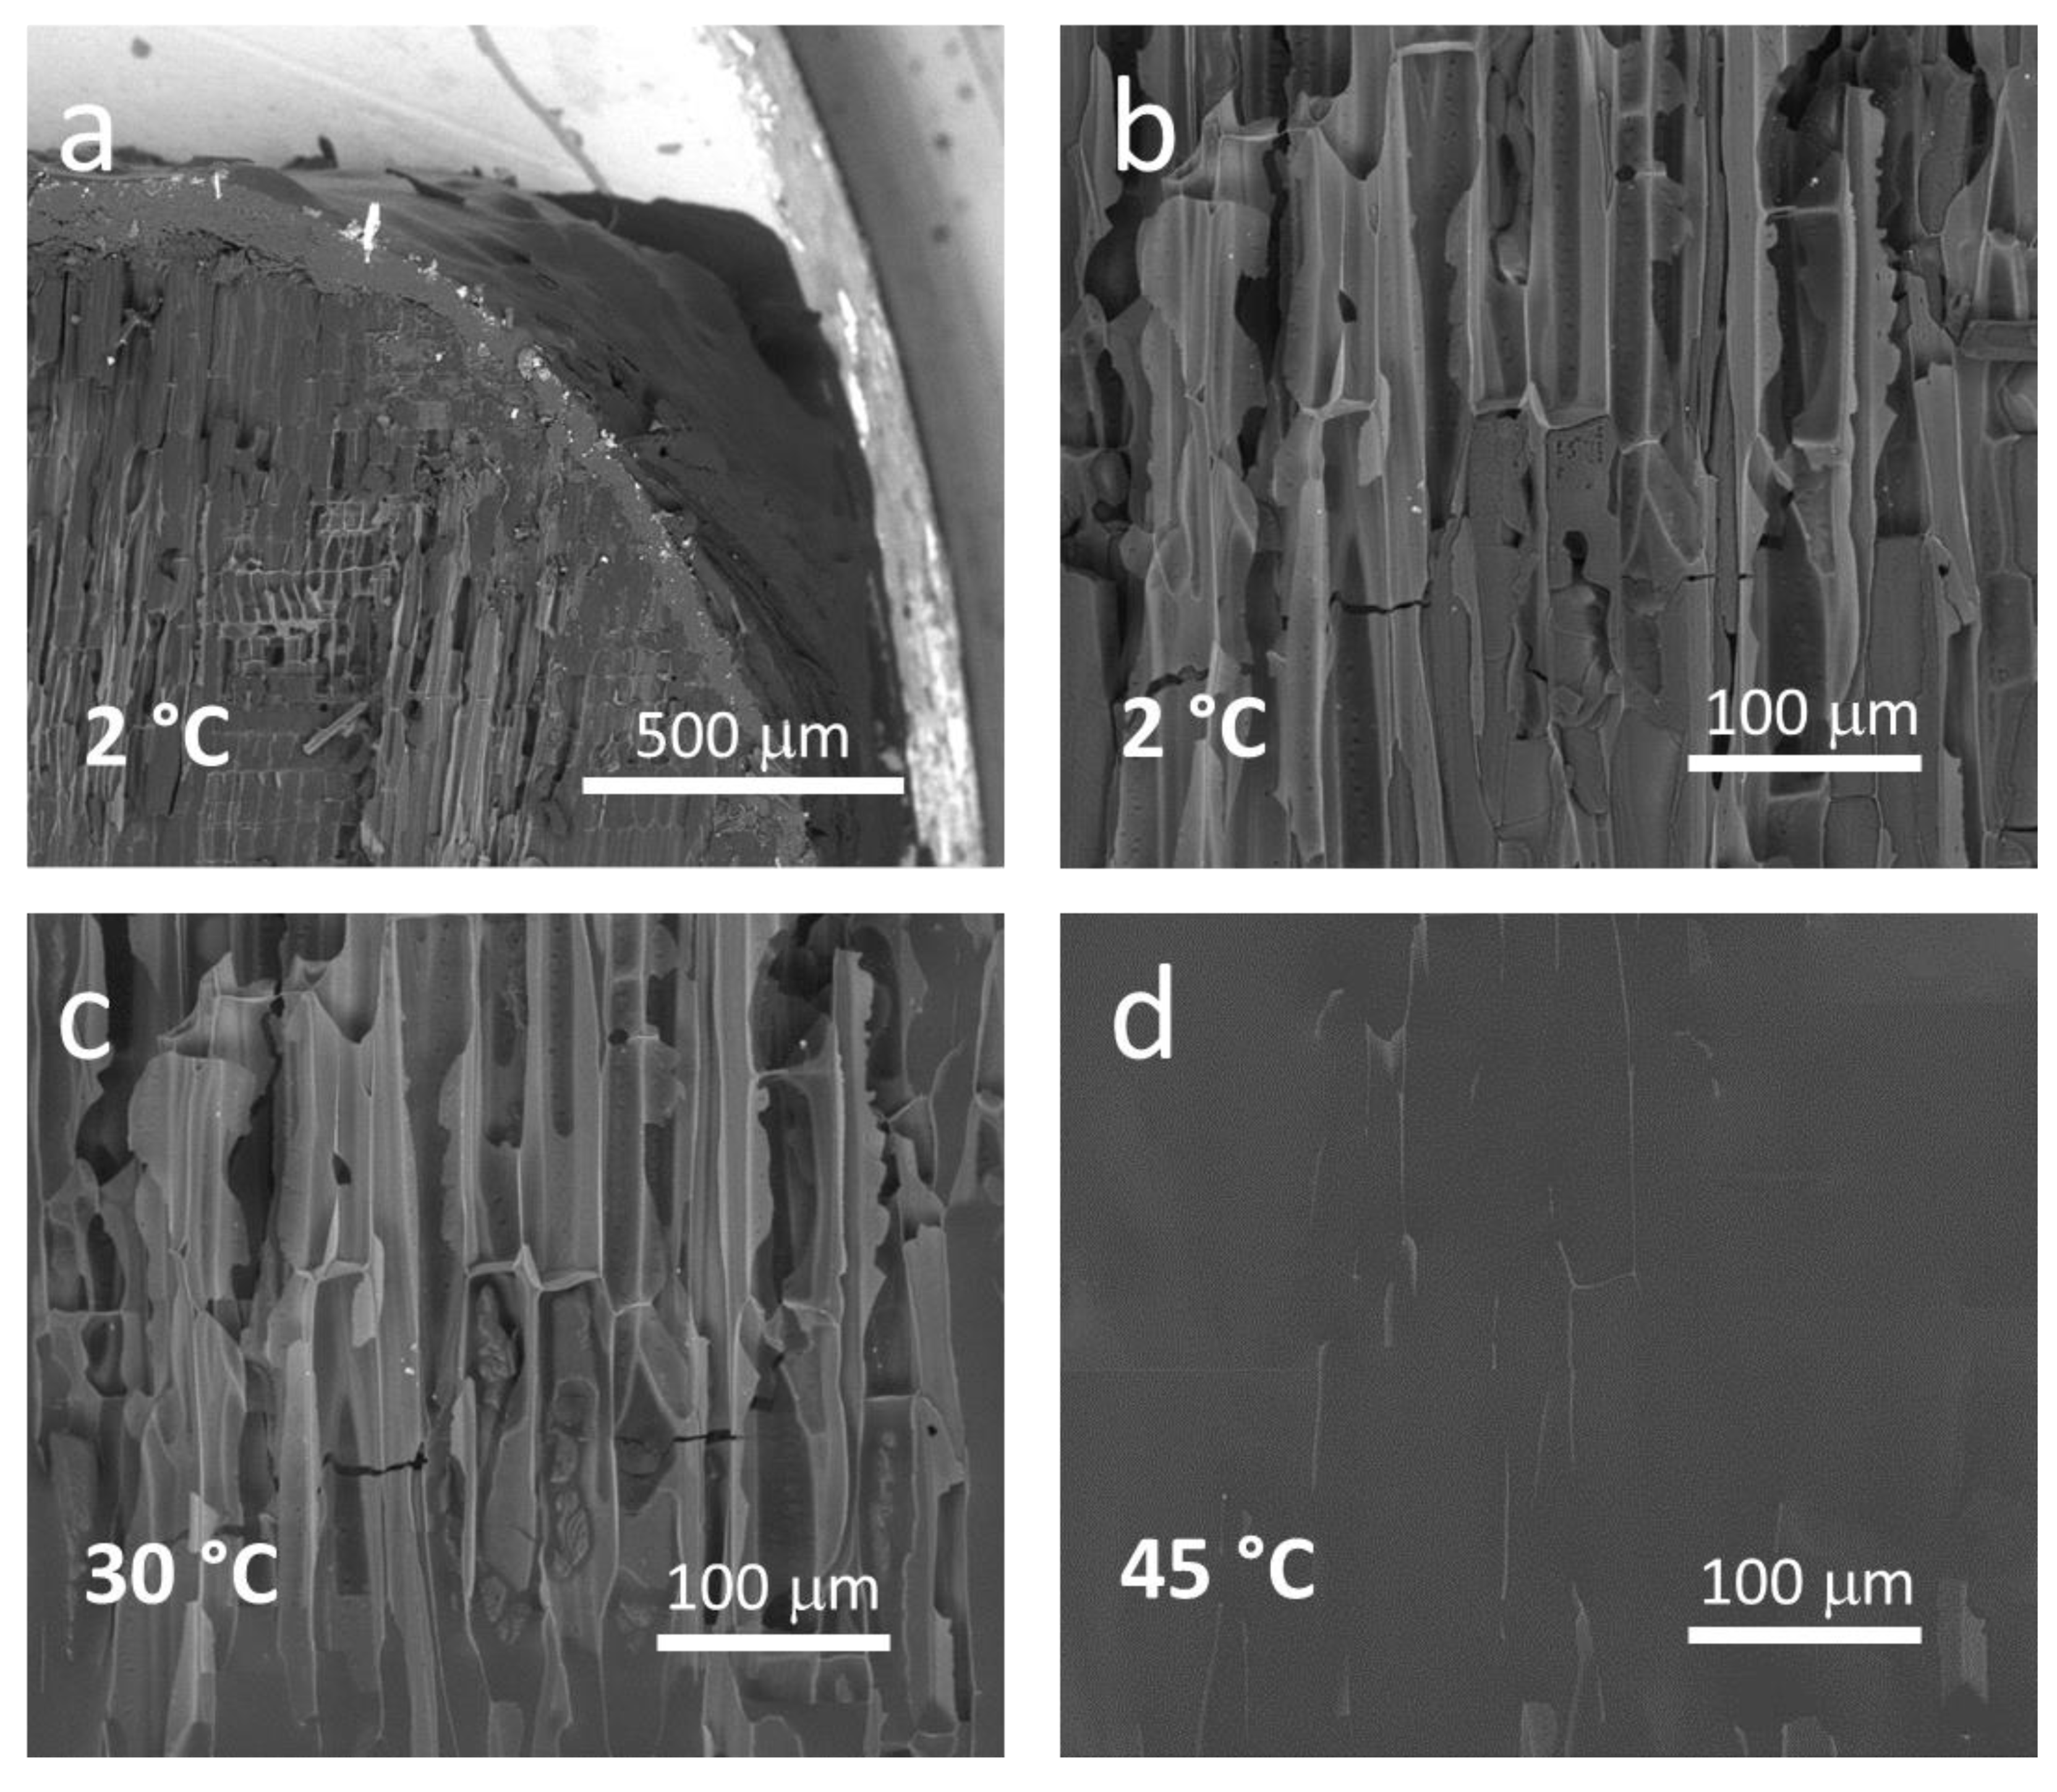
Figure 2a shows the cross-section of the EN-CW–PCM along the direction of the parallel channels. The exterior graphite layer can be seen to continuously and uniformly wrap the CW–PCM composite and have a thickness of about 50–60 μm. The continuous structure of the CW shown in
Figure 2a was expected to provide continuous thermal transport path for the PCM. This continuous path is important for good thermal transport, because continuous networks have showed greater improvement of thermal conductivity of phase change materials compared with dispersed nanofillers. The dispersed nanofillers typically show a 15%–80% increase of thermal conductivity, whereas the continuous network can have up to a 463% increase [
9,
10,
13,
16,
20]. The continuous carbon structure of the CW did not collapse during the vacuum impregnation process, which is important to achieve significant thermal transport enhancement. The backscattered SEM images in
Figure 2b–d show the PCM and CW morphology measured when the sample stage temperature was kept at 2 °C, 30 °C, and 45 °C, respectively. Because the PCM has a lighter average atomic weight of 5.68 u than that of the carbon (12 u), the structures with darker colors in the backscattered SEM images are PCM, and those with lighter colors are the carbon matrix. At low temperatures (
Figure 2b), it can be clearly seen that the wax was infiltrated into the carbon channels with good contact with the channel walls. While heating up the sample to 30 °C (
Figure 2c), the PCM wax partially melted and started filling up the channel. At 45 °C, the PCM completely melted, and the top surface of the sample was almost completely immersed by the liquid-phase PCM.
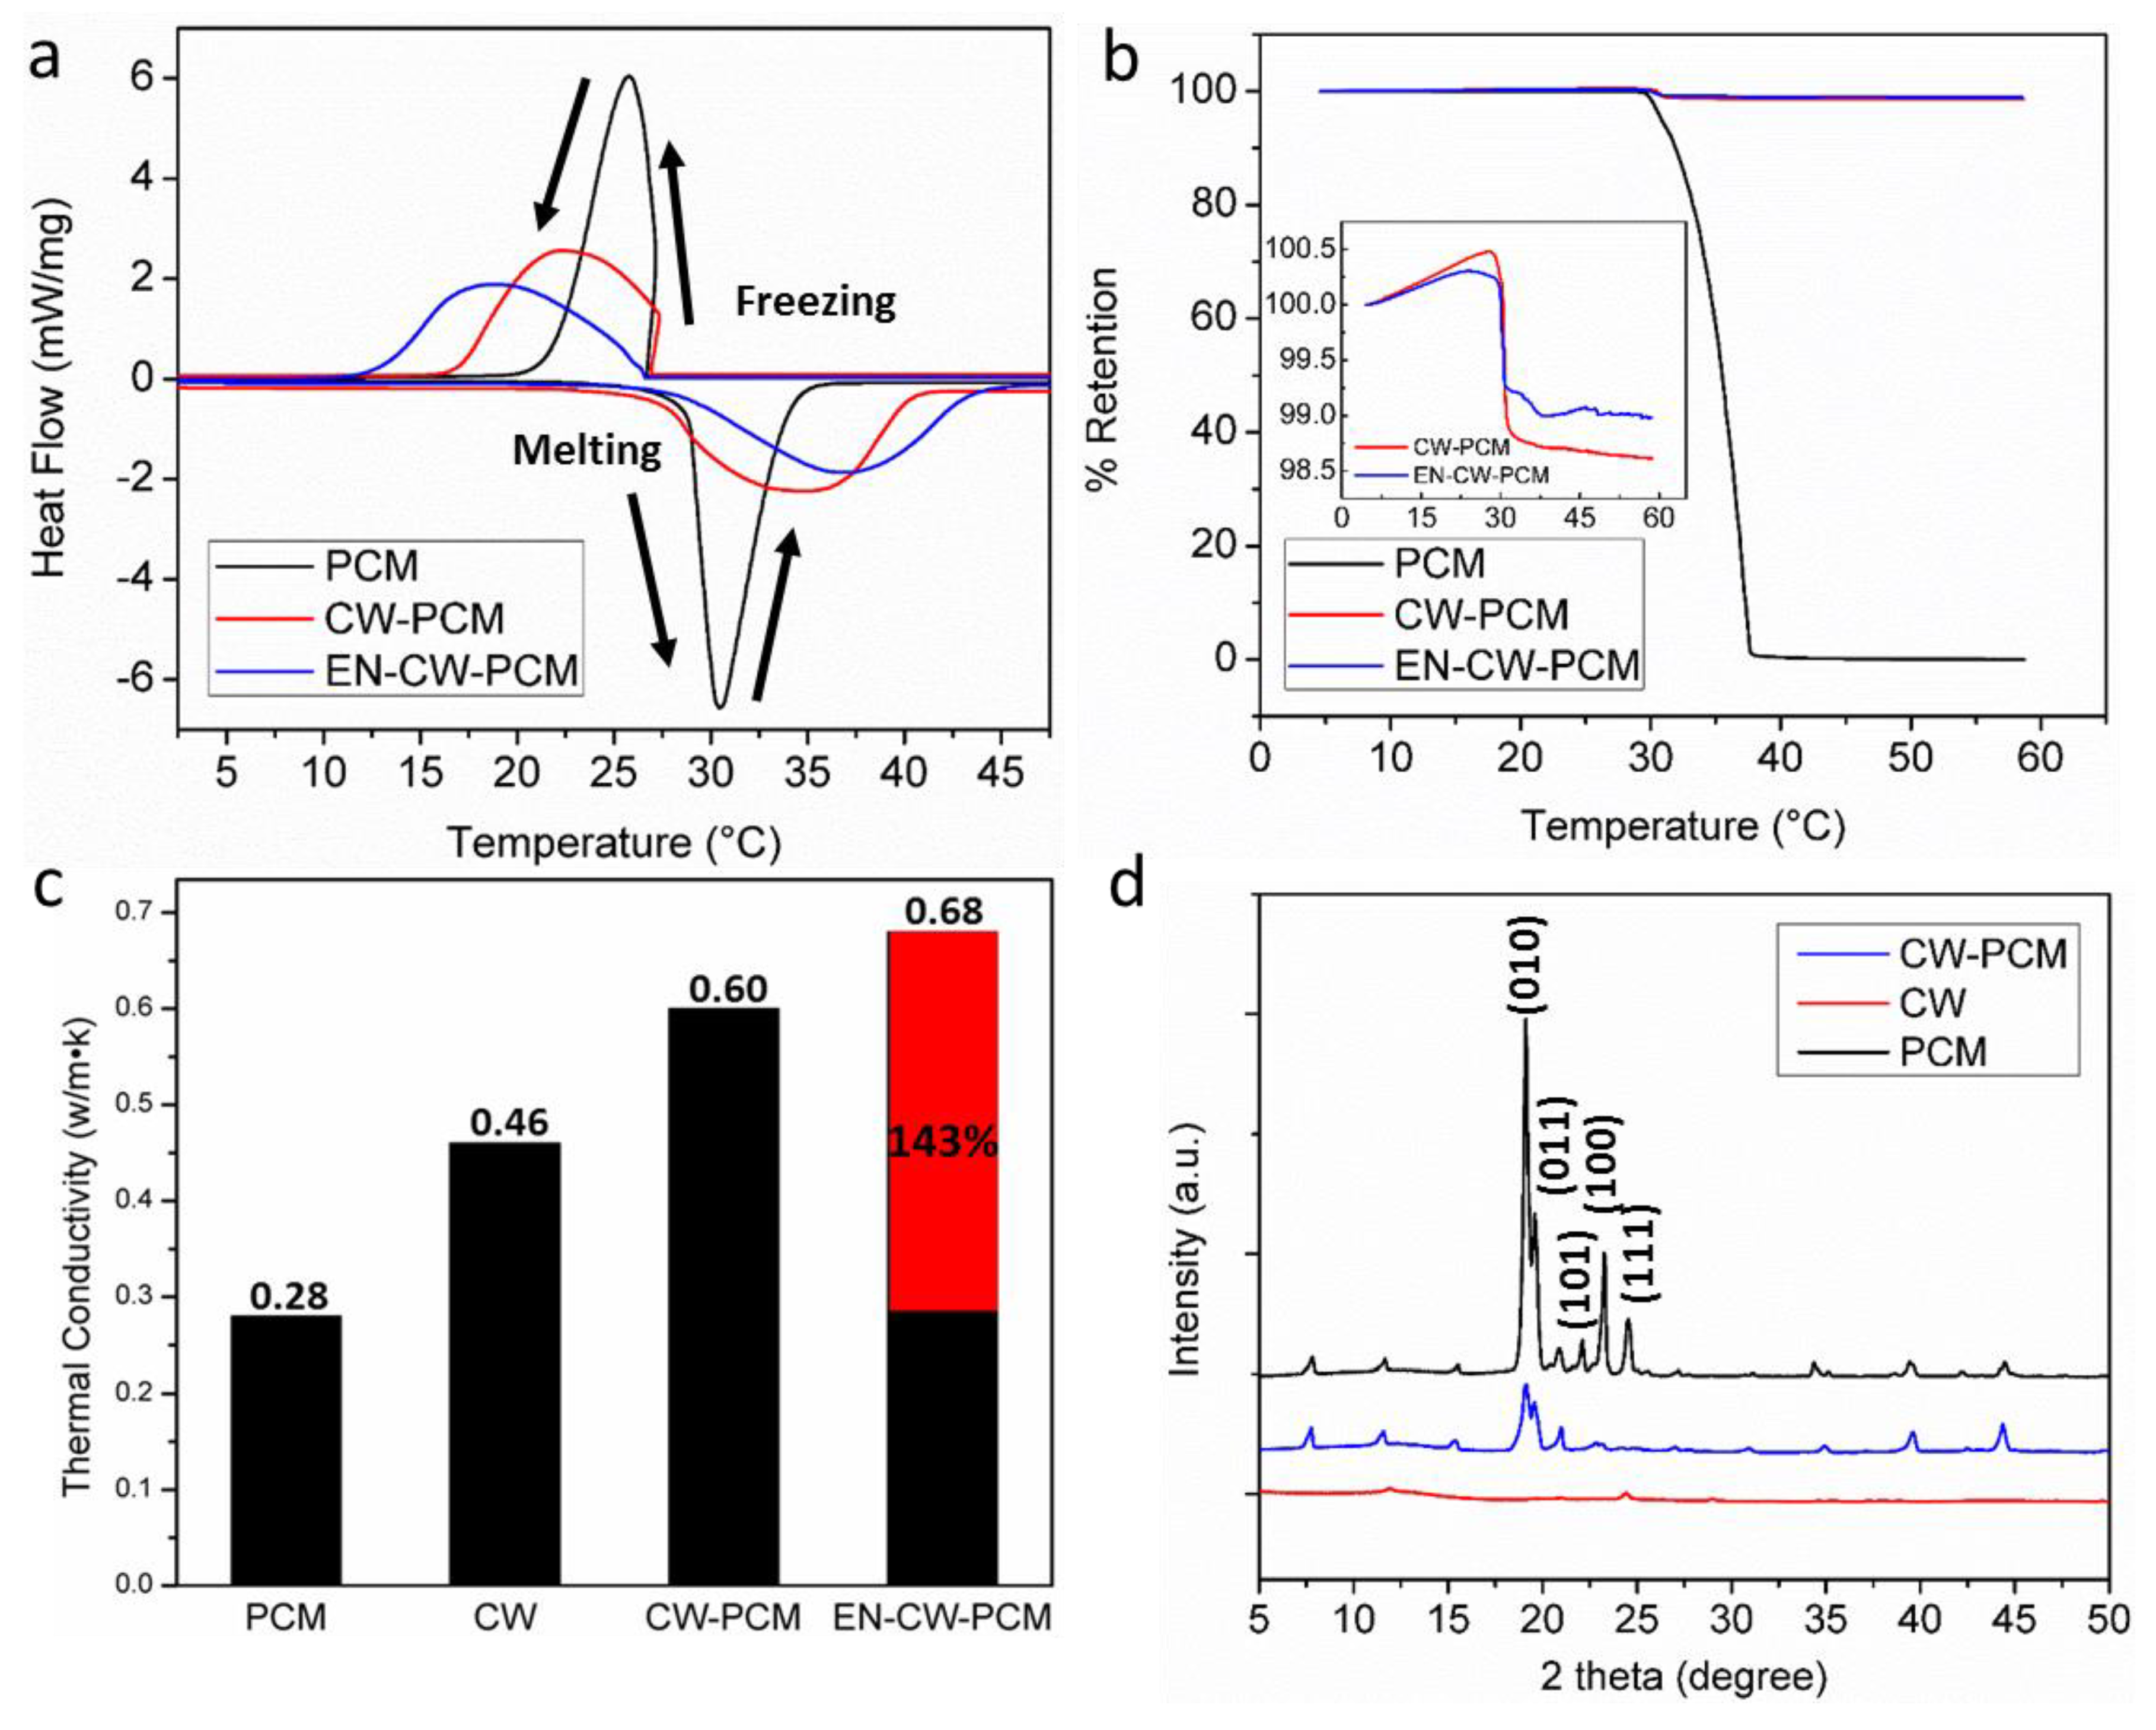
Phase change behavior of PCMs and their composites were characterized by DSC as shown in
Figure 3a. The downward peak represents the endothermal process of PCM, and the upward peaks represent the exothermal process. Compared with PCM, the endothermic peaks of CW–PCM and EN-CW–PCM increased by 4.3 °C and 6.3 °C during melting, and the exothermic peaks decreased by 3.5 °C and 7 °C, respectively, during freezing. This could be attributed to the influence of the CW framework on the phase change of the embedded PCMs by interfering with their structural change and therefore increasing and decreasing their melting and freezing peak temperatures, respectively [
10,
20]. It is worth noting that during the freezing process, a reverse bump can be seen at around 28 °C for PCM and CW–PCM. This could be explained by the solidification of PCM first occurring along the wall of the DSC sample pan at the beginning of freezing, which reduced the heat transfer between the sample and the temperature sensor (at the bottom of the sample pan). Thus, the temperature sensor may have reacted as though the sample’s temperature had dropped to a low value due to the insulating frozen “shell”, but, later, when the heat was transferred from the liquid “core” to the “shell”, the reading of the temperature sensor then reverted to a higher value. On the other hand, during melting, the heat transfer from the solid “core” to the liquid “shell” was faster, so no such reverse jump in the reading of sample temperature occurred. However, for the EN-CW–PCM, because there was no leaking of PCM to block the thermal path, no reverse behavior was observed. The latent heat of each sample was found by calculating the peak area under the melting and freezing curves obtained from the DSC tests. The latent heat for pure PCM, CW–PCM, and EN-CW–PCM are compared in
Table 1. Compared with pure PCM, the decreases of latent heat for the CW–PCM and the EN-CW–PCM samples can be explained by the introduction of materials with no phase change between 0 and 50 °C (namely, the CW and graphite coating) into the PCM. The extra weight of those materials lowered the overall latent heat of the samples. Thermal mechanical analysis (TMA) was used to characterize the thermal mechanical stability of the samples.
Figure 3b shows the normalized sample height change while increasing the sample temperature from 5 to 60 °C, with a constant 0.1 N force applied at the top of the sample. PCM was completely melted, and no shape was retained. However, no significant deformation was found on the samples with the CW matrix. The inset plot shows an enlarged view of the TMA results for CW–PCM and EN-CW–PCM (the blue and red curve, respectively), where only a 1.5% height change for CW–PCM and only a 1% change for EN-CW–PCM can be observed. EN-CW–PCM showed the best shape stability among all the samples. The linear thermal expansion in the solid state and the sharp decrease in height after the PCM melting temperature are also clearly shown. High thermal conductivity is also important for PCMs to be used as energy storage materials. All the thermal conductivities were collected between 24 and 26 °C by DLI (see
Supplementary Materials) and plotted in
Figure 3c. Pure PCM in the solid state has a thermal conductivity of around 0.25–0.31 W·m
−1·K
−1, similar to what has been reported by other groups [
10,
16]. The measured thermal conductivity for the CW matrix was 0.46 W m
−1·K
−1, and this was due to the porous structure of the CW and the large amount of air inside the structure. For the CW–PCM composite, the thermal conductivity increased to 0.60 W m
−1·K
−1 after the porous structure of the CW was filled with PCM, which has much higher thermal conductivity than air (0.024 W m
−1 K
−1). The graphite increases the thermal conductivity of the composite to 0.68 W m
−1 K
−1, which was a 143% increase compared with that of pure PCM. To investigate the chemical stability of the composites, XRD was conducted on all the samples as shown in
Figure 3d. Highly crystalline PCM showed sharp peaks in typically reported positions [
22]. No new peaks or shifts of peak positions were observed on the CW–PCM composite, indicating that the introduction of the CW scaffold did not alter the structure of PCM.
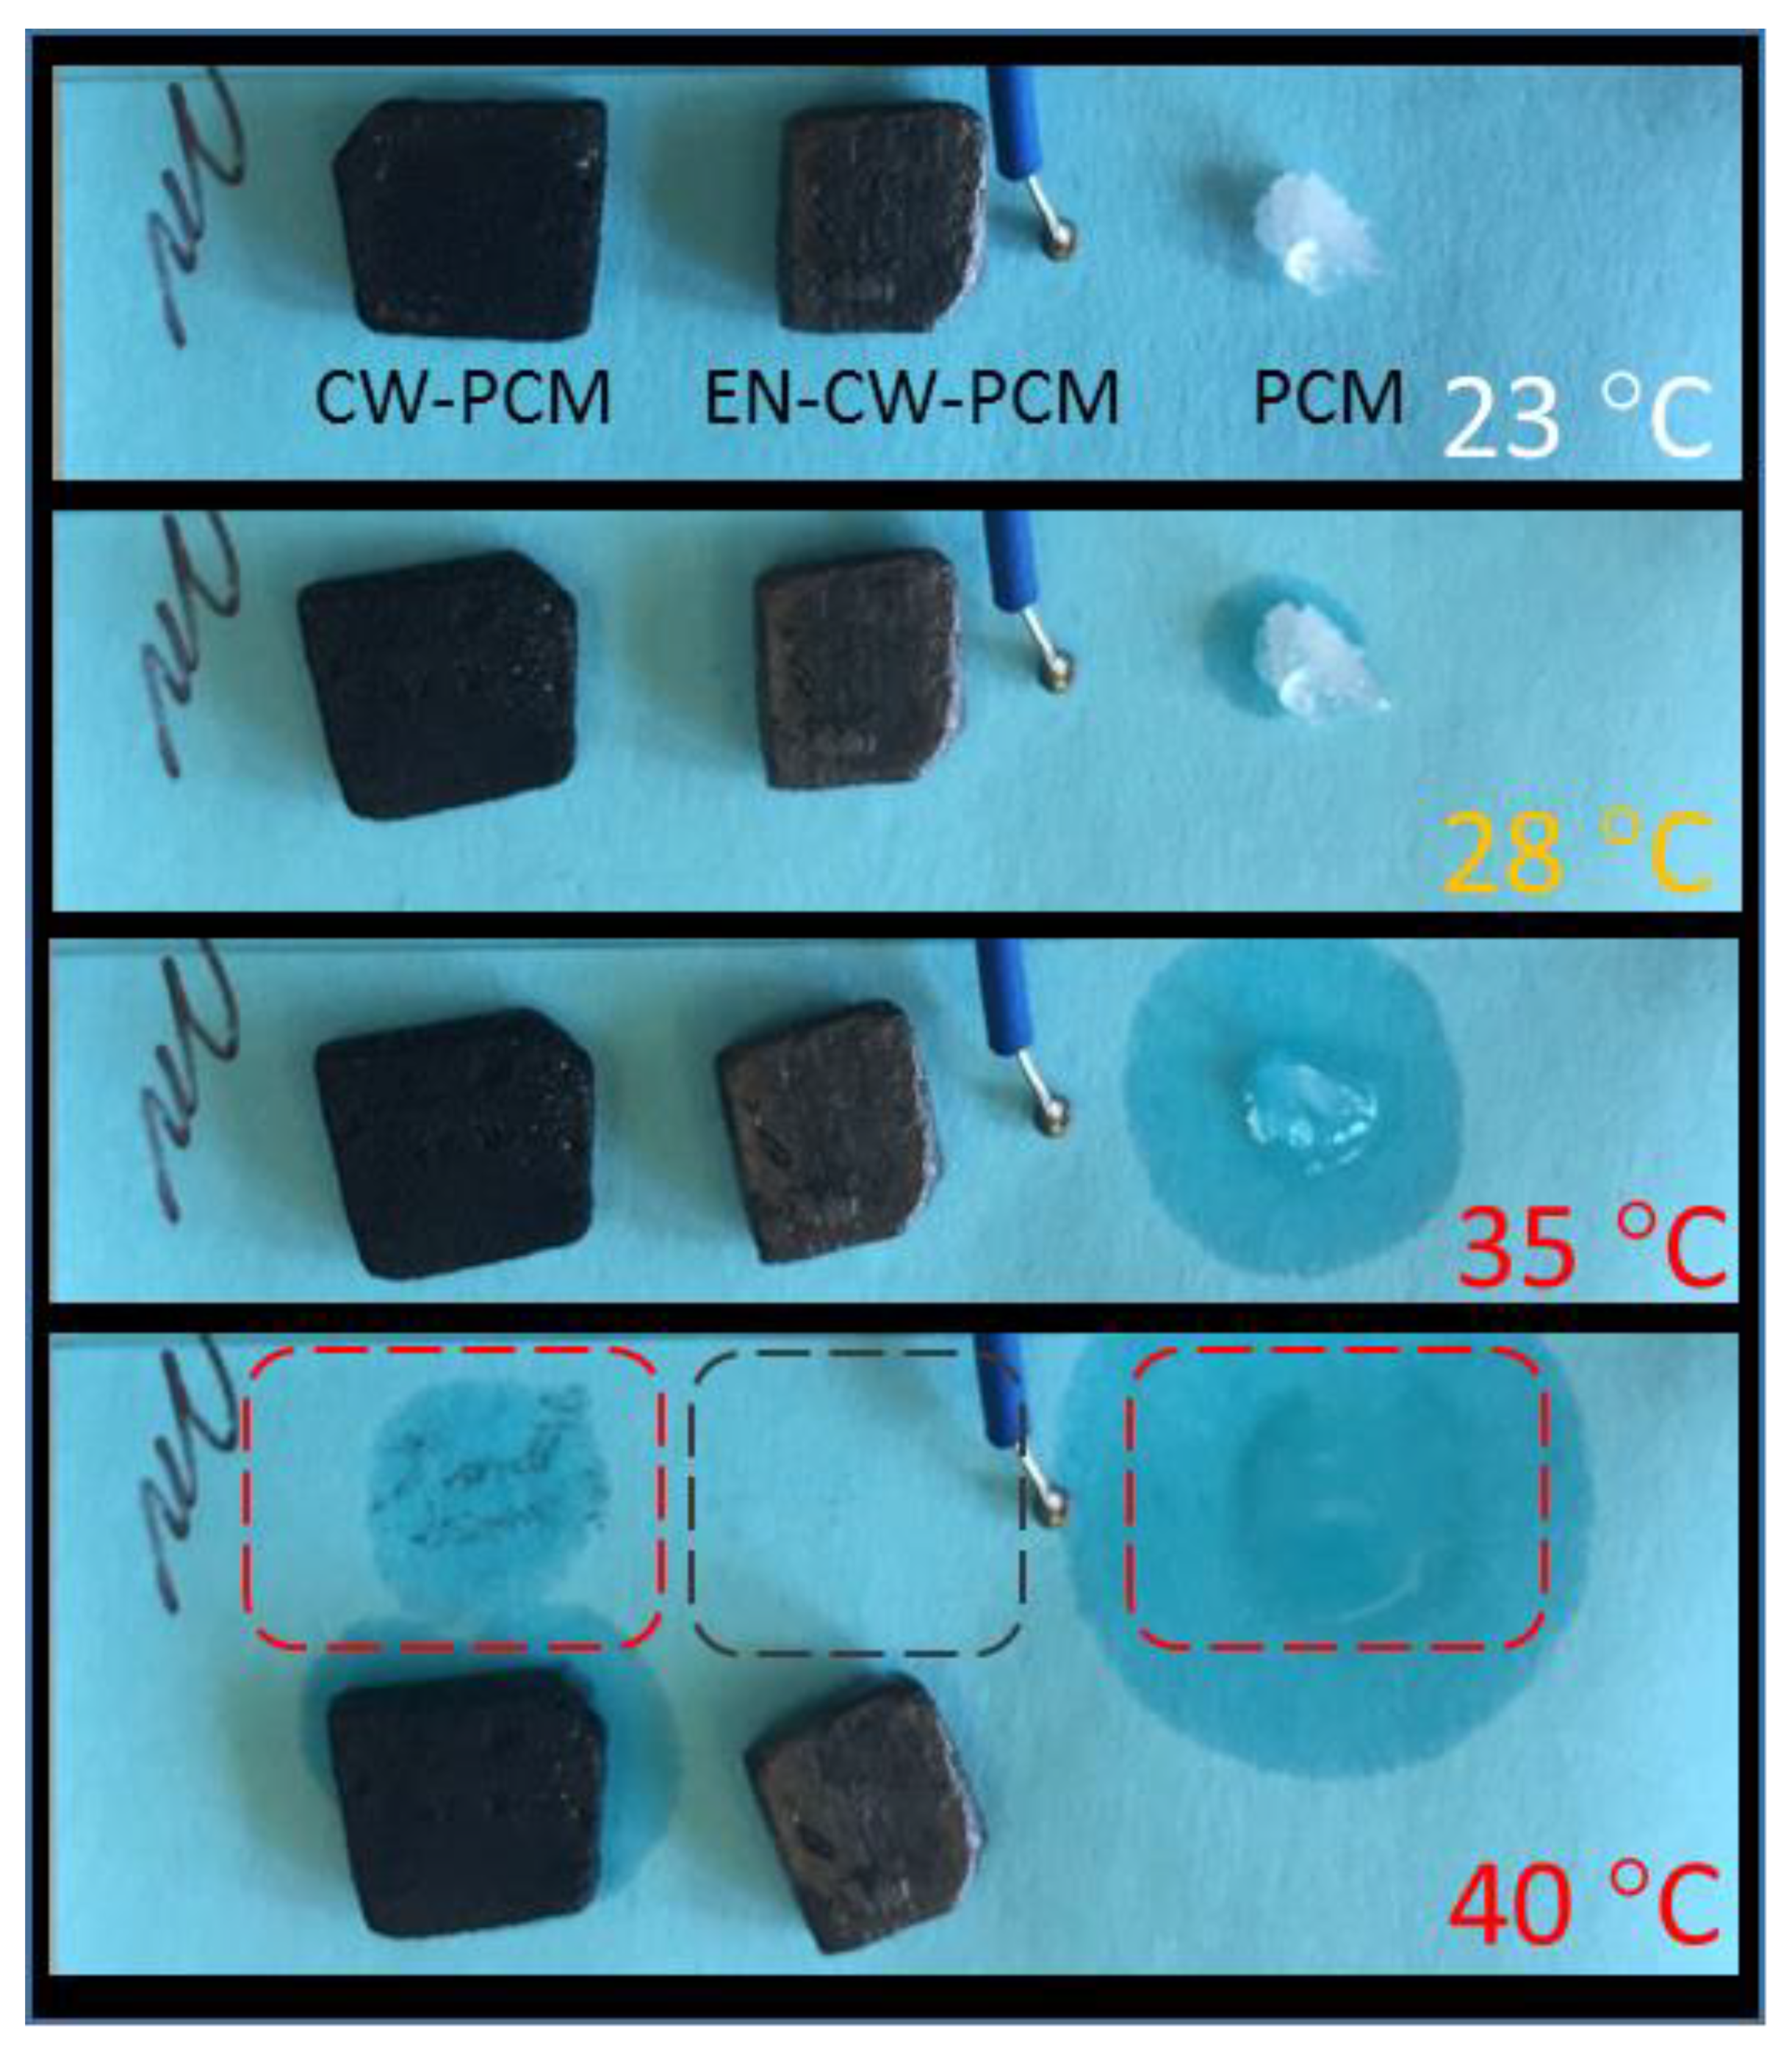
To utilize practical applications of PCM, leakage of PCM in the liquid state is a critical problem that must be addressed. Micro-encapsulation is the most commonly used method, but the plastic shell typically used has low thermal conductivity, which hinders the heat transfer between the heat source and the sample. A graphite coating was introduced to address this issue. To investigate the performance of this graphite coating, a leakage test was carried out by putting samples on a piece of memo sticker on a hot plate with a thermocouple placed on top to measure the surface temperature (
Figure 4). The optical images were captured at 23 °C, 28 °C, 35 °C, and 40 °C. All the samples were initially in the solid phase at the ambient temperature of 23 °C. PCM started melting at 28 °C and completely melted when the surface temperature increased to 40 °C. The PCM inside the CW–PCM composite also melted and leaked out. No leakage was found in the EN-CW-PCM sample, which demonstrated excellent encapsulation of PCM by the graphite coating. The combined leakage test and the thermal conductivity measurement results show that the graphite coating not only prevented the leaking of liquid PCM at elevated temperature, but also further increased the thermal conductivity of the PCM composite.
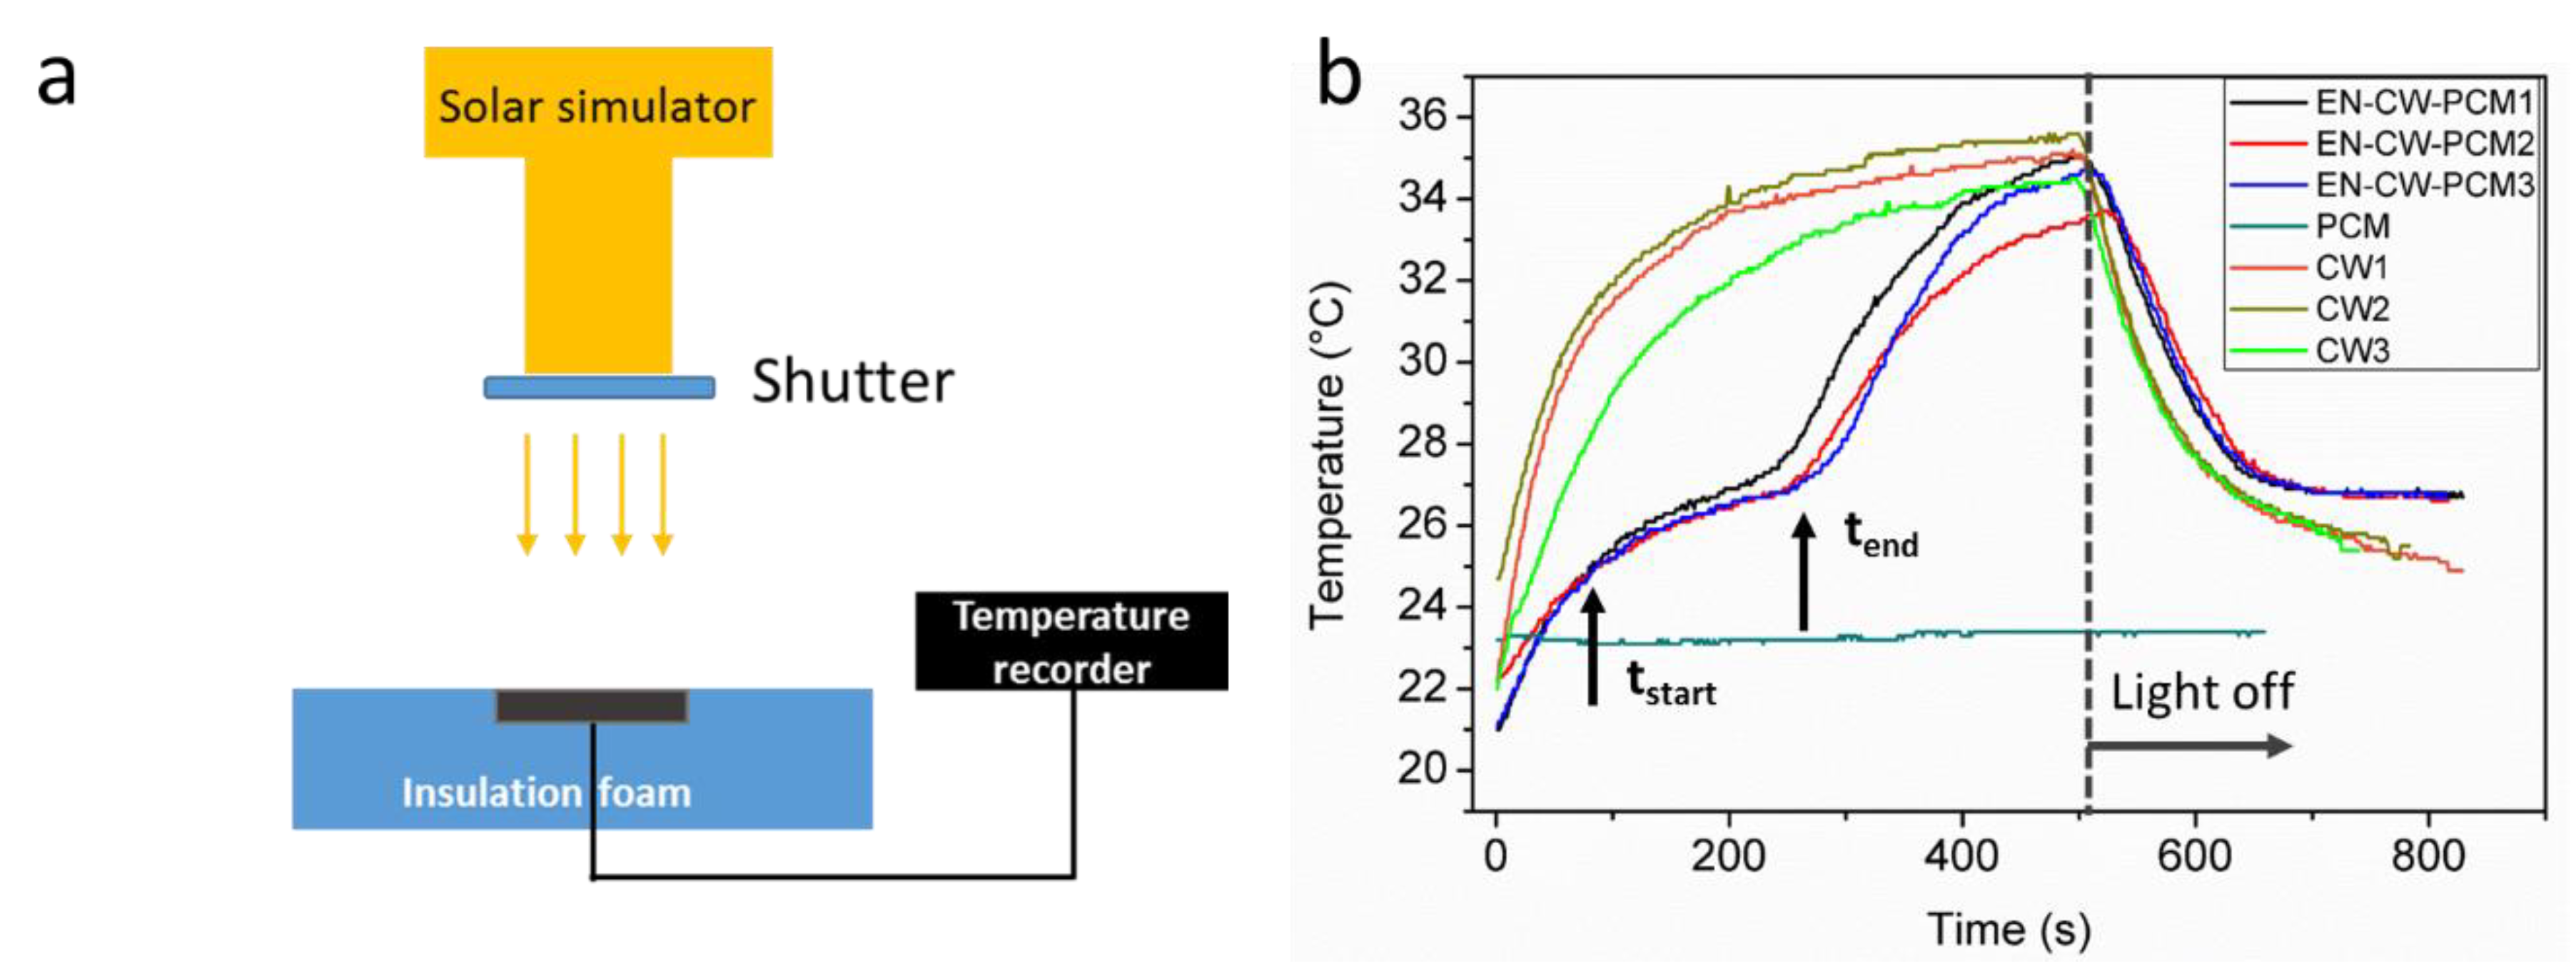
A solar-to-thermal conversion using EN-CW–PCM was demonstrated by a setup built in-house as shown in
Figure 5a. Briefly, the samples were embedded inside an insulation foam with only the top sample surface exposed to the simulated sunlight. Light from a solar simulator was shined on the sample top surface for 500 s and blocked by a shutter afterwards. The temperature at the bottom of the sample was recorded by a thermocouple and plotted in
Figure 5b. A slowdown of the temperature increase can be seen at around 100 s, which indicated the starting of phase change (the energy absorbed by the sample was stored as latent heat rather than sensible heat, which hindered the temperature increase). The slope of the curve increased at around 245 s, indicating the end of the phase change. The solar to thermal conversion efficiency (
η) was calculated by the following:
where
m is the mass of sample, Δ
H is the latent heat of sample measured from DSC,
P.D. is the power density of the solar simulator (1000 W·m
−2),
A is the top surface area of the sample, and
te/
tb are the end/start time of the phase change. The measurement was repeated three times on the EN-CW–PCM samples (plotted as EN-CW–PCM1, EN-CW–PCM2, and EN-CW–PCM3) and the CW samples (namely CW1, CW2, and CW3). The calculated
η was 0 for PCM, because the PCM with clear color did not absorb enough heat to reach the phase change temperature, and thus, no thermal storage could be observed. The CW samples were heated up quickly with no shutdown point during the heating process, which indicated no heat storage as latent heat. The summary of the solar-to-thermal conversion efficiency is listed in
Table 2. The CW–PCM composite showed an impressive 95.14 ± 2.06% solar-to-thermal conversion efficiency thanks to the excellent absorption of solar irradiation by the CW matrix. The EN-CW–PCM showed similar performance with 94.99 ± 2.18% solar-to-thermal conversion efficiency.

 ,
, 


